a composite method to identify desertification hotspots
TRANSCRIPT

Received: 3 July 2017 Revised: 14 February 2019 Accepted: 18 February 2019
DOI: 10.1002/ldr.3290
R E S E A R CH AR T I C L E
A composite method to identify desertification ‘hotspots’ and‘brightspots’
Rimjhim Bhatnagar Singh | Ajai
Space Applications Centre, ISRO, Ahmedabad
380015, India
Correspondence
Rimjhim B. Singh, Space Applications Centre,
ISRO, Ahmedabad, India.
Email: [email protected]
Land Degrad Dev. 2019;1–15.
Abstract
Desertification has become one of the greatest environmental concerns of our planet.
Implementation of the action plans for arresting land degradation and for employing
rehabilitation measures over a large spatial scale is not feasible due to the amount of
time, effort, and cost involved. However, if the ‘hotspots’ the ‘brightspots’, and the
‘potential areas’ are identified, the task would be relatively easy. In this paper, a
method is proposed to identify the pieces of degraded land with varying severity
levels (in terms of ‘hotspots’, ‘brightspots’, and ‘potential areas’), using Bowen ratio,
land surface temperature (LST), Ra, and Normalized Difference Vegetation Index
(NDVI). Although the zone falls in the semiarid class, the microclimate analysis
of the study area revealed high aridity. The combined analysis of LST, Ra, and
NDVI helped in identifying the areas susceptible to land degradation (particularly,
salinization and water erosion). Analysis of the vegetation type and condition showed
their variable roles towards the protection of soil from erosion, drought, and fire.
Using these analyses together with the ecosystemic approach of Bowen ratio,
‘hotspots’, ‘brightspots’, and ‘potential areas’ were identified at the pixel level. For
validation, Desertification Status Map was employed. The investigations revealed that
around 49% of the study area falls under the category of ‘hotspots’ (with an error
estimate of 13%) and another 49% as ‘brightspots’. The findings revealed that instead
of targeting the entire area for implementation of the mitigation measures with the
same efforts, it would be better to focus on the specific pieces of land (‘hotspots’)
to optimally utilize the available resources.
KEYWORDS
‘brightspots’, ‘hotspots’, Bowen ratio, desertification, land degradation, land use
1 | INTRODUCTION
Dryland ecosystems are very much vulnerable to climate change (Jat,
Crauford, Sahrawat, & Wani, 2012) and hence to desertification
(Beltagy&Madkour, 2012). Desertification has become one of themost
serious environmental problems that the world is facing today. Land
degradation and desertification have affected almost 2.6 billion people
in more than a hundred countries and has influenced over 33% of the
Earth's land surface (www.unccd.int). In India, approximately one‐third
wileyonlinelibrary.com/jou
of its total geographical area is undergoing the process of land degrada-
tion (Ajai, Arya, Dhinwa, Pathan, & Ganesh, 2009). India accounts for
2.4% of the world's geographical area and 0.5% of the world's grazing
land, yet it supports 16.7% of the world's population and 18% of the
world's cattle population, respectively (Ajai et al., 2009). Thus, there is
a tremendous pressure on the country's natural resources and on its
environment. Such a huge pressure on land often leads to inappropriate
and unsustainable land use practices, degradation of soil, loss of vegeta-
tion and water covers, and loss in biological diversity (Bunning,
© 2019 John Wiley & Sons, Ltd.rnal/ldr 1

2 SINGH AND AJAI
Mcdonagh, & Rioux, 2011). Mapping, monitoring, assessment, and early
warning of desertification are the basic requirements towards the for-
mulation of strategies for preventing, arresting, and combating deserti-
fication. A number of methodologies are available for these purposes at
global, national, and local scales. Zdruli, Cherlet, and Zucca (2016),
Zucca et al. (2012), Sommer et al. (2011), Middleton and Thomas
(1997), and Dregne (1986) have reviewed methodologies used for
desertification mapping, monitoring, and assessment at global and
regional scales. The well‐known global approaches include the Global
Assessment of Human‐Induced Soil Degradation (United Nations Envi-
ronment Programme, 1992), Land Degradation Assessment in Drylands
(Nachtergaele & Licona‐Manzur, 2008), Global Assessment of Land
Degradation and Improvement (Bai, Olsson, & Schaepman, 2008),
United States Natural Resource Conservation Service, Major Land
Resource Stress and Condition (Fairbridge, Beinroth, Eswaran, & Reich,
2008), Millennium Ecosystem Assessment (MA., 2005), Land Degrada-
tion Assessment andMappingMethod, developed by the French Scien-
tific Committee on Desertification (Brabant, 2010) and World Atlas of
Desertification (Cherlet et al., 2018;Middleton&Thomas, 1997). Prince
(2016) has carried out a comparative study of the available global level
inventories of desertification, such as Global Assessment of Human‐
Induced Soil Degradation, World Atlas of Desertification, United States
Natural Resource Conservation Service, and Land Degradation Assess-
ment in Drylands. The regional approaches include Sahara and Sahel
Observatory's Long Term Ecological Monitoring Observatories Net-
work (ROSELT/OSS) in the circum‐Saharan zone, UNCCD‐Asian The-
matic Programme Network (TPN‐1) on Desertification Monitoring and
Assessment, Assessment of Human‐Induced Soil Degradation (ASSOD)
for South and Southeast Asia, Land Degradation Index (2d RUE; Del
Barrio, Puigdefabregas, Sanjuan, Stellmes, & Ruiz, 2010), and ESA‐
MediterraneanDesertification and Land use (MEDALUS) forMediterra-
nean environments (Kosmas, Ferrara, Briasouli, & Imeson, 1999). At the
regional level, Xu, Kang, Qiu, Zhuang, and Pan (2009) quantitatively
assessed desertification using Landsat data. Enne, Zucca, and Zanolla
(2003) have described the in‐depth analysis of the methodologies to
evaluate the desertification phenomenon. Few of the national initia-
tives include Australian Collaborative Rangelands Information System
for Australia and Indian desertification and land degradation mapping
(Ajai et al., 2009, 2007). The Indian initiative has been towards mapping
of the desertification status of the country at 1:500,000 scale based on
a three‐level classification system. Zucca, Lubino, Previtali, and Enne
(2005) have demonstrated a method to fight desertification in Morocco
and Tunisia. Zucca, Francesca, and Franco (2011) showed the role of
fodder shrub plantations in mitigating desertification in Morocco.
The methods available and used for mapping and monitoring of
desertification and land degradation at global, regional, and national
scales can be broadly classified into two categories: (a) indicator‐based
methods and (b) mapping of desertification processes/types directly
through field survey or using satellite images (Christian, Dhinwa, &
Ajai, 2018). The indicators used in desertification mapping and moni-
toring include vegetation cover, vegetation biomass, net primary pro-
duction, land use/land cover, rain‐use efficiency, vegetation species
composition, soil organic carbon stock, and ecosystem services. Many
of these indicators can be derived from satellite images. However, the
indicator‐based methods are often unable to identify the processes or
types of land degradation, and hence, such an inventory may not be
useful in making action plans for combating desertification. This is
because the combating strategies are different for different land
degradation processes (Christian et al., 2018). The second method
provides spatial information on the types of land degradation processes
(Christian et al., 2018).
Implementation of action plans towards arresting the degradation of
land and taking rehabilitation measures, over large areas, is not feasible
because of the huge amount of time, effort, and cost involved. How-
ever, if the ‘hotspots’ (areas where swift rehabilitation actions are
required as land degradation is severe or the land is extremely
vulnerable to desertification; Bunning et al., 2011), the ‘brightspots’
(areas without significant land degradation or the areas that were
formerly degraded/vulnerable but have been rehabilitated because of
the effective implementation of the combating measures), and the
‘potential areas’ (areas that bear the potential of getting degraded
under significant changes) of desertification are identified, the task
becomes relatively easy as these can be used to prioritize the areas
to be taken up for the implementation of combating measures.
Therefore, it is important to identify the ‘hotspots’ and ‘brightspots’
for preventing further degradation of the land by taking appropriate
mitigation/combating measures.
From the environmental perspective, a clear analysis of vegetation
and climate profiles of an area are the key factors for understanding,
identification, and monitoring of the desertification ‘hotspots’ and
‘brightspots’ whereas knowledge of existing land use practices is
important for assessing the implication of socio‐economic conditions.
Generally, fractional vegetation cover, biomass, and leaf area are
proportional to precipitation and available soil moisture (Beatley,
1974). A primary driver of desertification is the loss in the vegetative
cover that leads to lower precipitation (Charney, Quirk, Chow, &
Kornfield, 1977). Thus, a systematic study of any region begins with
a detailed analysis of vegetation, climate, and land use pattern in order
to find out the drivers of desertification ‘hotspots’ and ‘brightspots’.
There are several families of attributes that can be related to the
degree of land condition or degradation. One such approach is based
on energy ratio or Bowen ratio (Garcíaa et al., 2008). The approach
of energy ratio bears the assumption that Bowen ratio (sensible
heat flux/latent heat flux) is expected to increase along the land
degradation gradient because land with poor and thin soil affects
vegetation density, and this would lead to large sensible heat flux over
latent heat flux (Warner, 2004). One more fundamental physical
entity that plays a paramount role in the distribution, composition,
and productivity of ecosystems through photosynthesis and the
water cycle is solar radiation (Piedallu & Gégout, 2007). It is one of
the primary variables influencing evapotranspiration and thus soil
moisture in semiarid regions (Monteith & Unsworth, 2014). Together
with Normalized Difference Vegetation Index (NDVI), it can serve as
an effective indicator of desertification.
In view of the above, the approach based on Bowen ratio has been
used to identify the desertification ‘hotspots’ and ‘brightspots’. Analysis

SINGH AND AJAI 3
of vegetation type and climate helped in the understanding of the
driving forces behind the ecosystem's maturity. Additionally, solar
radiation is studied along with the NDVI and Land Surface
Temperature (LST) profiles. The collective analysis is used to identify
desertification‐prone areas.
2 | MATERIALS AND METHODS
2.1 | Study area
Bellary District from the State of Karnataka, India, was selected as the
study area (Figure 1). Climatically, the study area falls in the semiarid
zone. It spreads around two hills of granite origin (Singh & Ajai,
2008) while covering 8,463 km2 of surface area. The major land cover,
in the study area, comprises agriculture and forests with the consider-
able portion under wastelands. Bellary District has seven subdivisions,
namely, Hadagalli, Hospet, Bellary, Sandrur, Kudligi, Sirguppa, and
Hagaribomanahalli. Raichur and Koppal Districts form its northern
boundary, Gadag and Haveri the western boundary, Davangere and
Chitradurg the south, and Andhra Pradesh the east. Tungabhadra
and Hagari are the major rivers of this district (Singh & Ajai, 2008).
The district receives an average annual rainfall of 545 mm, mostly
between May and September. The mean daily temperature varies
within 23°C and 42°C over the year (Singh & Ajai, 2008). The major
rock groups in the district are Dharwars, peninsular gneisses, and gran-
ites whereas the major soil types are red and black. According to
agro‐climatic zonation of the Country, the region falls in the southern
plateau and hills region (Khanna, 1989). Although, the study was con-
ducted at the pixel level over the entire study area, for validation, a
FIGURE 1 Study area—Bellary District, Karnataka State, India. Also showbe viewed at wileyonlinelibrary.com]
total of 77 study points were selected through random sampling
(Figure 1).
2.2 | Materials
2.2.1 | Satellite data
Moderate Resolution Imaging Spectroradiometer (MODIS), on‐board
Terra satellite, has 36 bands with bands 1–19 and band 26 in the
visible and near‐infrared range. The remaining bands are in the thermal
range from 3 to 15 μm. It uses 12 bits for quantization in all bands.
MOD11 product for LST and emissivity (8‐day composite, 1‐km
resolution, and sinusoidal grid) and MOD13 product for NDVI
(16‐day composite, 1‐km resolution, and sinusoidal grid) for the time
span 2005–2014 were used in this study.
2.2.2 | Ancillary data
The land use map at 1:50,000 scale for the year 2006 was used in this
study. It was obtained from the Natural Resources Data Base (NRDB).
This map was used to understand the land use pattern of the study
area and to analyse the vegetation silhouette with respect to their
potentials in causing or aggravating land degradation. Air temperatures
for various sites were obtained from the agro‐climatological archive of
NASA's Global Model and Assimilation Office (GMAO) whereas
precipitation was obtained from Global Precipitation Climate Project
(GPCP–1DD) satellite‐gauge product, which is a global 0.5° × 0.5°
daily accumulation based upon the combination of observations from
multiple platforms. The in‐between spatial data were generated
through interpolation. Desertification status map (DSM), prepared by
n are the 77 points for which validation is tabulated [Colour figure can

4 SINGH AND AJAI
the Indian Space Research Organization (ISRO) was used for the
validation purpose (Ajai et al., 2009, 2007).
2.3 | Method
The main steps involved in the identification of desertification
‘hotspots’ and ‘brightspots’ are given below:
1. Microclimate profile analysis
2. Vegetation characteristics analysis
3. Analysis of LST, extraterrestrial solar radiation (Ra), and NDVI for
three cropping seasons (winter, summer, and monsoon). In India,
there are three cropping seasons, Kharif (monsoon season), Rabi
(winter season), and Zaid (summer season).
4. Bowen ratio analysis for the three seasons (winter, summer, and
monsoon)
5. Collective inferences for the identification of desertification
‘hotspots’, ‘brightspots’, and ‘potential areas’ based on the
above‐mentioned steps.
The output images generated through the above‐mentioned steps of
data analysis, were categorized into three levels of desertification:
low (count 100), moderate (count 150), and high (count 200) where
100 signifies ‘potential area’, 150 signifies ‘brightspot’, and 200 sig-
nifies ‘hotspot’. The count system was employed for quantification
purpose. The final output was computed by integrating all the inputs
(climate, vegetation, land use, and Bowen ratio) through geometric
mean (Kosmas et al., 1999). The geometric mean was employed so
as to ensure that the quantitative range of the parameter(s), upon inte-
gration, remains the same. Finally, the output was validated using the
available DSM of the study area. The count system was developed
based on the field observations, expert knowledge, and the inferences
derived from DSM of the study area. From DSM, a number of points
pertaining to ‘not affected area’, low, moderate, and severe degrada-
tion were selected. All the intermediate parameters, as well as the
values for the final composite output layer, were recorded for these
locations. Considering the values obtained for the locations pertaining
to low, moderate, and severe degradation (on DSM map and in the
TABLE 1 Table for vegetation characteristics analysis
S. No. % Plant coverVegetation as perfire risk
Vegetation as per dresistance
1 >40 Horticulture, fallow land,
agricultural crops, and
plantation
Forests, grasslands,
scrubland
2 10–40 Scrubland, grassland,
deciduous, evergreen
forests, and forest
plantation
Degraded forests, c
area, and horticul
3 <10 Coniferous forest, pine
forest, mixed forests,
and scrub forest
Shifting cultivation,
land, and unprodu
land
field) and the expert knowledge, the above‐mentioned scores were
defined.
2.3.1 | Microclimate profile analysis
Vegetation adapts to the temperature and precipitation conditions of
any region. In other words, it may be said that knowing the type of
vegetation, one can predict the climatic conditions of a particular
region. In this context, one of the prominent climatic factors is aridity
that is crucial to the initiation and progress of desertification. Quanti-
fication of aridity is done through an index called aridity index. Numer-
ous aridity indices have been proposed in the literature. In fact, Stadler
(1998) gave a review on various aridity indices. The simplest aridity
index is based solely on precipitation. UNESCO's aridity index is
defined using precipitation and evapotranspiration (UNESCO, 1979).
In this study, we have used Bagnouls–Gaussen bioclimatic aridity
index (BGI) (Bagnouls & Gaussen, 1953), which is neither too simple
as was used by Climate Change (2007) nor computationally complex
like that of UNESCO's index. It is defined by Equation (1).
BGI ¼ Σ 2Ti − Pið Þ:k; (1)
where Ti = mean air temperature in degree Celsius for the ith month,
Pi = total precipitation in the month i in mm, k = proportion of months
during which 2Ti − Pi > 0. BGI range interpretation is adapted from
Kosmas et al. (1999). Consequently, three classes were formed:
BGI < 75 (low), between 75 and 100 (moderate), and > 100 (high).
2.3.2 | Vegetation characteristics analysis
The nature and state of vegetation are important indicators of land
degradation and desertification. For example, vegetative cover plays
an important role in preventing soil erosion and in preserving soil
organic carbon. Lee and Skogerboe (1985) showed that 40% vegeta-
tive cover is a critical limit beyond which erosion accelerates at high
slopes. Forest fire is another important cause of desertification
because it not only leads to loss of vegetation but also changes the
physio‐chemical properties of the soil. It may result in the loss of soil
rought Vegetation as per erosionprotection
Severity class with respectto land degradation
and Mixed/evergreen forests,
plantation, coniferous
forest, pine forests, and
grasslands
Low
ropped
ture
Deciduous forests,
scrubland, and
horticulture
Moderate
fallow
ctive
Agricultural crops, fallow land,
and unproductive land
High

SINGH AND AJAI 5
nutrients and increase in rain water runoff and erosion, which may
also affect the flora and fauna extensively. Different plants possess
varied fire‐related adaptations (e.g., Brandt & Thornes, 1996). Simi-
larly, different plant species possess unique drought resistance mech-
anisms through leaf shedding at varying thresholds. For example,
cultivated areas with rain‐fed crops, such as cereals, are very sensitive
to erosion because of their shallow rooting depths, in comparison with
forests where rooting depths are very large. Considering equal
weights for all of these vegetation characteristics, Table 1 (adapted
from Kosmas et al., 1999) is used for understanding the vegetation
profile of the study area.
2.3.3 | LST, extraterrestrial solar radiation (Ra), andNDVI study
Earth's energy balance equation comprises of sensible heat flux (H),
ground heat flux (G), and latent heat flux (LE). Together, they are
related to net radiation as follows:
Rn ¼ Gþ Hþ LE; (2)
where Rn = net radiation (incoming flux‐outgoing flux).
The amount of G is negligible as compared with the other two
terms. So Equation (2) may be rewritten as
LEeRn–H: (3)
Now; Rn ¼ Rsol þ σεaTa4� �
− εσT4 þ αRsol
� �; (4)
where σ = Stefan's constant, ε, εa = surface and air emissivity, respec-
tively, T, Ta = LST and temperature of the air, respectively, α = albedo,
and Rsol = solar insolation, a function of daylight hours and extraterres-
trial radiation.
Extraterrestrial radiation is the solar radiation at the top of the
Earth's atmosphere, which can be computed as follows (FAO, 1998):
Ra ¼ 24 × 60=πð Þ 0:082ð Þ:dr ωsð Þ sinφ: sinδþ cosφ: cosδ: sin ws½ �; (5)
where dr = inverse relative Earth–sun distance; ωs = sunset hour angle,
φ = latitude, and δ = solar declination.
dr ¼ 1þ 0:033 cos 2 πJ=365ð Þ; (6)
where J = Julian day.
ωs ¼ arc cos − tan φð Þ tan δð Þ½ �; (7)
δ ¼ 0:409 sin 2 πJ=365ð Þ − 1:39½ �: (8)
When Ra is large, Rsol will be large and, thus, higher will be the rate of
evaporation (Burgess, 2009). In order to minimize moisture loss due to
evapotranspiration in water deficit conditions, plants shed their leaves.
Hence, persistently high Ra can give an indication of the stressed eco-
system condition. The effect may be observed from NDVI images.
NDVI combines reflectance measurements that are sensitive to the
composite effect of foliage chlorophyll concentration, canopy leaf
area, foliage clumping, and canopy architecture. Hence, NDVI is indic-
ative of vegetation vigour. LST may also be used for such studies
because it is required for a variety of climatic, hydrological, ecological,
and biogeochemical studies (Wan & Li, 1997). It may, therefore, serve
as an indicator of the underlying ecosystem's activity, thereby signify-
ing desertification conditions (Sivakumar, 2007).
2.3.4 | Bowen ratio analysis for three seasons (win-ter, summer, and monsoon)
The ratio of sensible heat flux (H) to latent heat flux (LE) in energy
terms is the Bowen ratio (H/LE) (Equation (9)). It is expected to
increase along the land degradation gradient.
β ¼ ϒ Ts − Tað Þ= es − eað Þ; (9)
where β = Bowen ratio, ϒ = psychrometric constant, Ts = LST, Ta = air
temperature, es = saturated vapour pressure at LST, and ea = saturated
vapour pressure at air temperature.
The psychrometric constant can be obtained as follows:
ϒ ¼ 0:665 × 10–3P; (10)
where P = atmospheric pressure (kPa).
es or ea may be computed through the following method:
e ¼ 0:6108 exp 17:27 Tð Þ T þ 237:3ð Þ½ �; (11)
where e is es or ea and T is Ts or Ta.
However, due to the constraints posed by remote sensing data,
Roeder and Hill (2009) suggested sensible heat fraction (H/Rn) as a
land degradation index equivalent but more operational than H/LE.
A further simplification to reduce the intermediate errors is by com-
puting the ratio NDVI/LST. Here, LST and vegetation density may be
taken as surrogates for LE and H, respectively. This approach has been
used for soil moisture assessment (Sandholt, Rasmussen, & Andersen,
2002) and for the identification of vegetation and land use types
(Lambin & Ehrlich, 1996) but could be easily adapted to land degrada-
tion assessment (Garcíaa et al., 2008).
2.3.5 | Collective inference for desertification‘hotspots’, ‘brightspots’, and ‘potential areas’
From each of the previously mentioned methods, the individual results
were categorized into three parts: low (Score 100), moderate (Score
150), and high (Score 200) severity with respect to desertification.
The final output was generated by taking the geometric mean of the
individual results and was again classified into three levels of severity.
The results were validated using the available DSM (Ajai et al., 2007).

6 SINGH AND AJAI
3 | RESULTS AND DISCUSSION
3.1 | Microclimate profile analysis
Although climate does not change drastically in any region, however,
topographic variations impact the microclimate. Average air tempera-
ture and precipitation profiles (Figure 2) were observed for three sea-
sons for the period 2005–2014. Aridity index (BGI) was also computed
and is shown for the 77 study points in Figure 2.
In Figure 2, average air temperature variation is shown for three
seasons for the 77 study points. Barring a few points, all the study
points show a consistent average temperature for the winter months.
On the contrary, large variation is observed for the summer and rainy
months. It is observed that the study area has variations in the air
temperature; however, it does not go beyond the optimum temperature
range for photosynthesis to occur. The optimum temperature range for
photosynthesis is between 20°C and 35°C because photosynthesis
slows down beyond this range due to slowing down of the plant's
physiological activities (e.g., leaves drop off, and water absorption is
reduced at low temperatures). This shows that the present
temperature range favours the growth of natural vegetation. Looking
at the precipitation distribution (Figure 2), it may be observed that the
study region witnessed good rainfall in the months of September and
May. Sufficient rainfall creates a favourable environment for the
growth of natural vegetation. Appropriate rainfall also implies the
prevalence of rain‐fed agriculture in this area. However, looking at
the values of the aridity index, it is clear that the study locations fall
under different aridity conditions. The short‐term temperature and
precipitation profiles appear to be supportive of the growth of native
vegetation/local species. But, according to the aridity profile, which
FIGURE 2 Air temperature, precipitation, and BGI profile for the 77 stud
includes long‐term datasets for temperature and precipitation, the
ecosystem appears to be weak from the point of view of sustenance.
Unsustainable practices of land use might exacerbate desertification.
3.2 | Vegetation profile analysis
Land cover data were analysed with respect to the potential of
various land cover types towards (a) safeguarding land from erosion,
(b) management of forest fire, and (c) resistance to drought. The
resulting maps towards each of these factors are shown in Figure 3.
From the erosion protection map, it is clear that the current land
use exposes the land to increased risk of erosion. With the existing
precipitation profile, the land in the study area has a high risk of water
erosion. The central part of the study area is mainly dominated by
deciduous forests (which shed their leaves during summers); hence,
this part of the study area is susceptible to drought. The same is
observed in the drought resistance map (Figure 3). In the other parts
of the study area, the major land use is agriculture that offers
moderate resistance to drought. Agricultural crops have shallow rooting
depths. The rooting depths influence the vertical distribution of water
within the soil column (Kleidon & Heimann, 1998; Pielke, 2001).
NDVI maps of winter, summer, and monsoon seasons (Figure 3)
show low NDVI values for the summer season, including some very
low NDVI areas. High temperature and depleting water table are the
major causes of low NDVI during the summer. In monsoon season,
high NDVI values dominate. During the monsoon season, vegetation
cover and high soil moisture prevent soil erosion process. However,
as the plant cover is less in summer and winter seasons (study area
is predominantly agricultural land), the area is highly susceptible
to erosion.
y points

FIGURE 3 Figures showing vegetation characteristics of the study area for three seasons—winter (Rabi), summer (Zaid), and rain (Kharif),desertification per se [Colour figure can be viewed at wileyonlinelibrary.com]
SINGH AND AJAI 7
Because a large part of the study area is under agriculture, fire risk
map shows no fire risk zone in most of the areas because agricultural
fields are well guarded against all odds. However, the presence of for-
ests makes the region moderately prone to fires especially because of
the shedding of leaves. It may be summarized that on an average, the
type of vegetation present in the study area offers low protection
towards erosion, moderate resistance to drought, and high protection
against fire.
3.3 | LST, extraterrestrial radiation, and NDVI studyfor three seasons
One year LST profile for the entire country is shown in Figure 4.
Considerable data gaps are observed in the months of May through
September. March through May (~315–325 K) experienced high tem-
peratures and good amount of rainfall. This indicates good vegetation
growth. For the winter season, LST varies between 300 and 310 K
whereas air temperature hardly reaches above 299 K. This indicates
the higher contribution of sensible heat flux [H = ρCp (Tc − Ta)/Ra,
where, ρ = air density, Cp = specific heat of air at constant pressure,
Tc = canopy temperature or LST, Ta = air temperature, and Ra = aerody-
namic resistance] in maintaining the energy balance equation. Apart
from the data gaps observed in the monsoon season, the LST values
are found to fall between 305 and 315 K.
The LST image histograms of the three seasons (Figure 4) show a
unimodal curve for monsoon season, peaking at 310 K with the
highest count, at 315 K for the summer season and at 307 K for the
winter season. One can see that LST is consistently high throughout
the year for a major part of the study area. High temperatures affect
soil moisture and biological activity and contribute to high evapotrans-
piration rates (Tereshchenko, Zolotokrylin, Titkova, Brito‐Castillo, &
Monzon, 2012) that lead to accumulation of salts on the soil surface,
for the areas having inherent subsurface soil salinity. Many areas of
semiarid regions turn saline/alkaline due to high evapotranspiration
rates along with lack of leaching and percolation to deeper horizons.
Salinity is a major problem of irrigated land.
When NDVI–LST is studied simultaneously for green vegetation
for the three seasons, it is found that majority of the areas have
low NDVI values (~0.3) with high LST (~305–310 K) during the
winter season. Similarly, for the summer season, a majority of the
locations have lower NDVI values (~0.25) with the temperature
range of ~303–313 K. High LST with low NDVI is an alarming
condition as it indicates ‘potential areas’ of desertification. This
situation renders the area into a vulnerable condition where any
event of lack of precipitation combined with the anthropogenic
effect might lead to a decrease in vegetation cover. This condition
might lead to water erosion with the first spell of rain. The land
also becomes vulnerable to wind erosion in the event of storms,
thereby making the vegetation cover still more difficult to revive.
Hence, the study area appears to fall under ‘potential areas’ as regards
land degradation and desertification. Unmanaged anthropogenic
interference can turn these fragile systems into desertification
‘hotspots’. Ra values for one complete year for all the 77 study locations
are shown in Figure 5.
It is observed that Ra does not vary much. This causes the plots to
overlap (Figure 5). However, seasonal variation exists with a wide
range of 29–39 W/m2. For the summer season, Ra remained high at
about 38 W/m2. LST also remained high during the summer season

FIGURE 5 Extraterrestrial radiation profile for the complete year at the 77 study points [Colour figure can be viewed at wileyonlinelibrary.com]
FIGURE 4 Density sliced LST image for the Country for one complete year [Colour figure can be viewed at wileyonlinelibrary.com]
8 SINGH AND AJAI
with a considerable decrease in NDVI. This may be interpreted in the
following way: A large value of Ra represents a large amount of direct
radiation that leads to high evapotranspiration rates. At high tempera-
tures along with deficient water supply, plants retain their moisture
content by shedding their leaves. This causes a decrease in NDVI
value. In such situations, agricultural fields having poor drainage sys-
tem experience increase in soil salinity. This forms a vicious cycle.
Increase in salinity causes a slight reduction in land productivity that
leads to low vegetation cover and may affect plant diversity.
3.4 | Bowen ratio analysis
3.4.1 | From NDVI–LST ratio
Bowen ratio images generated using NDVI and LST are shown in
Figure 6 formonsoon andwinter seasons. Because huge data gapswere
observed for summer months, the data were not processed. The image
was classified based on density slicing method. Because Bowen ratio is
the ratio of sensible heat loss to latent heat flux, it tends to be very high

FIGURE 6 Bowen ratio image for the study area for monsoon (Kharif) and winter (Rabi) seasons [Colour figure can be viewed atwileyonlinelibrary.com]
SINGH AND AJAI 9
in deserts (~10) followed by semiarid regions (~2–6), tropical forests
(~0.4–0.8), and tropical oceans (~0.1) (Nobel, 1974).
For the winter season, moderate Bowen ratio is observed for the
majority of the areas whereas high Bowen ratio is observed only in a
small belt (mainly the agricultural land; Figure 6). This shows that
major heat loss from agricultural fields is through sensible heat flux
and lesser from evaporative loss (latent heat fluxes), which further
suggests poor water condition in these areas. The forest land shows
moderate Bowen ratio values, suggesting high evaporative loss and
FIGURE 7 Seasonal trend of the Bowen ratio
hence indicate better water conditions. The same is verified from
the precipitation profile of the study locations. The belt depicting
high Bowen ratio values shows an increase in the area during the
transition from winter to monsoon, indicating a rapid increase in sen-
sible heat flux over evaporative loss due to thin vegetation cover. It
implies that the area showing high Bowen ratio in winter data is
mainly due to poor and thin soil rather than due to vegetation cover.
In the figure, the red region of winter data shows land degradation
actually present.

TABLE
2Tab
leshowingaco
llectiveinferenc
eofde
sertificationstatus
andvalid
ationusingde
sertificationstatus
map
S.No.
Clim
ateprofile
(based
onthecu
mulativeeffect
ofva
riationin
averag
eairtempe
rature,
prec
ipitation,
andaridity)
Veg
etationprofile
(based
onerosion
protection,
droug
htresistan
ce,firerisk
resistan
ce,a
ndplan
tco
ver)
Bowen
ratio
Colle
ctive
inference
Hotspot/brigh
tspot/potential
area
Validation
1Mode
rate
Mode
rate
Mode
rate
Moderate
Brigh
tspot
Noap
paren
tdeg
radation
2Mode
rate
High
Mode
rate
High
Hotspot
Water
erosion
3Mode
rate
Mode
rate
Mode
rate
tohigh
High
Hotspot
Water
erosion
4Lo
wHigh
Low
tomode
rate
Low
Potential
Noap
paren
tdeg
radation
5Mode
rate
Mode
rate
Mode
rate
Moderate
Brigh
tspot
Veg
etal
deg
radation
6Mode
rate
Mode
rate
Mode
rate
Moderate
Brigh
tspot
Veg
etal
deg
radation
7Mode
rate
High
Mode
rate
High
Hotspot
Water
erosion
8Mode
rate
Low
Mode
rate
Moderate
Brigh
tspot
Water
erosion
9Mode
rate
Mode
rate
Low
tomode
rate
Moderate
Brigh
tspot
Noap
paren
tdeg
radation
10
Mode
rate
Mode
rate
Mode
rate
Moderate
Brigh
tspot
Veg
etal
deg
radation
11
Mode
rate
Mode
rate
Mode
rate
Moderate
Brigh
tspot
Noap
paren
tdeg
radation
12
Mode
rate
Mode
rate
Low
tomode
rate
Moderate
Brigh
tspot
Noap
paren
tdeg
radation
13
Mode
rate
Mode
rate
Low
tomode
rate
Moderate
Brigh
tspot
Water
erosion
14
Low
High
Low
tomode
rate
Moderate
Brigh
tspot
Water
erosion
15
Mode
rate
Mode
rate
Mode
rate
Moderate
Brigh
tspot
Veg
etal
deg
radation
16
Mode
rate
Mode
rate
Mode
rate
tohigh
Moderate
Brigh
tspot
Veg
etal
deg
radation
17
Mode
rate
High
Mode
rate
tohigh
High
Hotspot
Veg
etal
deg
radation
18
Mode
rate
Mode
rate
Low
tomode
rate
Moderate
Brigh
tspot
Veg
etal
deg
radation
19
Mode
rate
Mode
rate
Mode
rate
Moderate
Brigh
tspot
Noap
paren
tdeg
radation
20
Mode
rate
High
Low
tomode
rate
High
Hotspot
Salin
ization
21
Mode
rate
Mode
rate
Mode
rate
tohigh
Moderate
Brigh
tspot
Urban
ization
22
Mode
rate
Mode
rate
Mode
rate
Moderate
Brigh
tspot
Water
erosion
23
Mode
rate
Mode
rate
Low
tomode
rate
Moderate
Brigh
tspot
Noap
paren
tdeg
radation
24
Mode
rate
High
Mode
rate
High
Hotspot
Water
erosion
25
Mode
rate
Mode
rate
Mode
rate
Moderate
Brigh
tspot
Veg
etal
deg
radation
26
Mode
rate
High
Mode
rate
High
Hotspot
Veg
etal
deg
radation
27
Low
High
Mode
rate
Moderate
Brigh
tspot
Noap
paren
tdeg
radation
28
Mode
rate
Mode
rate
Mode
rate
tohigh
Moderate
Brigh
tspot
Urban
ization
29
Mode
rate
Mode
rate
Low
tomode
rate
Moderate
Brigh
tspot
Noap
paren
tdeg
radation
30
Mode
rate
Mode
rate
Mode
rate
Moderate
Brigh
tspot
Water
erosion
(Continues)
10 SINGH AND AJAI

TABLE
2(Continue
d)
S.No.
Clim
ateprofile
(based
onthecu
mulativeeffect
ofva
riationin
averag
eairtempe
rature,
prec
ipitation,
andaridity)
Veg
etationprofile
(based
onerosion
protection,
droug
htresistan
ce,firerisk
resistan
ce,a
ndplan
tco
ver)
Bowen
ratio
Colle
ctive
inference
Hotspot/brigh
t
spot/potential
area
Validation
31
Mode
rate
Mode
rate
Mode
rate
Moderate
Brigh
tspot
Water
erosion
32
Mode
rate
High
Mode
rate
High
Hotspot
Veg
etal
deg
radation
33
Mode
rate
High
Mode
rate
High
Hotspot
Water
erosion
34
Mode
rate
Mode
rate
Mode
rate
Moderate
Brigh
tspot
Water
erosion
35
Mode
rate
High
Mode
rate
High
Hotspot
Veg
etal
deg
radation
36
Mode
rate
High
Low
tomode
rate
High
Hotspot
Noap
paren
tdeg
radation
37
Mode
rate
Mode
rate
Low
tomode
rate
Moderate
Brigh
tspot
Water
erosion
38
Mode
rate
Mode
rate
Mode
rate
Moderate
Brigh
tspot
Veg
etal
deg
radation
39
Mode
rate
Mode
rate
Mode
rate
Moderate
Brigh
tspot
Veg
etal
deg
radation
40
Mode
rate
High
Mode
rate
High
Hotspot
Veg
etal
deg
radation
41
Mode
rate
High
Mode
rate
High
Hotspot
Urban
ization
42
Mode
rate
High
Mode
rate
High
Hotspot
Urban
ization
43
Mode
rate
High
Mode
rate
High
Hotspot
Noap
paren
tdeg
radation
44
Mode
rate
High
Mode
rate
High
Hotspot
Urban
ization
45
Mode
rate
High
Mode
rate
High
Hotspot
Veg
etal
deg
radation
46
Low
High
Mode
rate
Moderate
Brigh
tspot
Water
erosion
47
Mode
rate
Mode
rate
Mode
rate
Moderate
Brigh
tspot
Water
erosion
48
Mode
rate
Mode
rate
Mode
rate
Moderate
Brigh
tspot
Noap
paren
tdeg
radation
49
Mode
rate
High
Low
tomode
rate
High
Hotspot
Water
erosion
50
Mode
rate
High
Low
tomode
rate
High
Hotspot
Winderosion
51
Low
Mode
rate
Low
tomode
rate
Moderate
Brigh
tspot
Water
erosion
52
Mode
rate
High
Mode
rate
tohigh
High
Hotspot
Water
erosion
53
Mode
rate
High
Mode
rate
tohigh
High
Hotspot
Veg
etal
deg
radation
54
Mode
rate
Mode
rate
Mode
rate
tohigh
High
Hotspot
Veg
etal
deg
radation
55
Mode
rate
Mode
rate
Mode
rate
tohigh
High
Hotspot
Urban
ization
56
Mode
rate
High
Low
tomode
rate
Moderate
Brigh
tspot
Veg
etal
deg
radation
57
Mode
rate
Mode
rate
Mode
rate
tohigh
Moderate
Brigh
tspot
Water
erosion
58
Low
Mode
rate
Mode
rate
tohigh
Moderate
Brigh
tspot
Winderosion
59
Mode
rate
Mode
rate
Mode
rate
tohigh
Moderate
Brigh
tspot
Winderosion
60
Mode
rate
High
Mode
rate
tohigh
High
Hotspot
Urban
ization
(Continues)
SINGH AND AJAI 11

TABLE
2(Continue
d)
S.No.
Clim
ateprofile
(based
onthecu
mulativeeffect
ofva
riationin
averag
eairtempe
rature,
prec
ipitation,
andaridity)
Veg
etationprofile
(based
onerosion
protection,
droug
htresistan
ce,firerisk
resistan
ce,a
ndplan
tco
ver)
Bowen
ratio
Colle
ctive
inference
Hotspot/brigh
tspot/potential
area
Validation
61
Mode
rate
Mode
rate
Mode
rate
Moderate
Brigh
tspot
Noap
paren
tdeg
radation
62
Mode
rate
High
Mode
rate
High
Hotspot
Winderosion
63
Mode
rate
High
Mode
rate
tohigh
High
Hotspot
Winderosion
64
Mode
rate
High
Mode
rate
tohigh
High
Hotspot
Winderosion
65
Mode
rate
Mode
rate
Mode
rate
tohigh
High
Hotspot
Water
erosion
66
Mode
rate
Mode
rate
Mode
rate
tohigh
High
Hotspot
Noap
paren
tdeg
radation
67
Mode
rate
Mode
rate
Mode
rate
tohigh
High
Hotspot
Water
erosion
68
Mode
rate
High
Mode
rate
tohigh
High
Hotspot
Urban
ization
69
Mode
rate
High
Mode
rate
tohigh
High
Hotspot
Winderosion
70
Mode
rate
High
Low
tomode
rate
High
Hotspot
Winderosion
71
Mode
rate
Mode
rate
Mode
rate
Moderate
Brigh
tspot
Water
erosion
72
Mode
rate
High
Mode
rate
High
Hotspot
Winderosion
73
Mode
rate
Mode
rate
Mode
rate
Moderate
Brigh
tspot
Winderosion
74
Mode
rate
High
Mode
rate
tohigh
High
Hotspot
Winderosion
75
Mode
rate
High
Mode
rate
High
Hotspot
Water
erosion
76
Mode
rate
High
Mode
rate
High
Hotspot
Water
erosion
77
Mode
rate
High
Mode
rate
High
Hotspot
Noap
paren
tdeg
radation
12 SINGH AND AJAI
SINGH AND AJAI 13
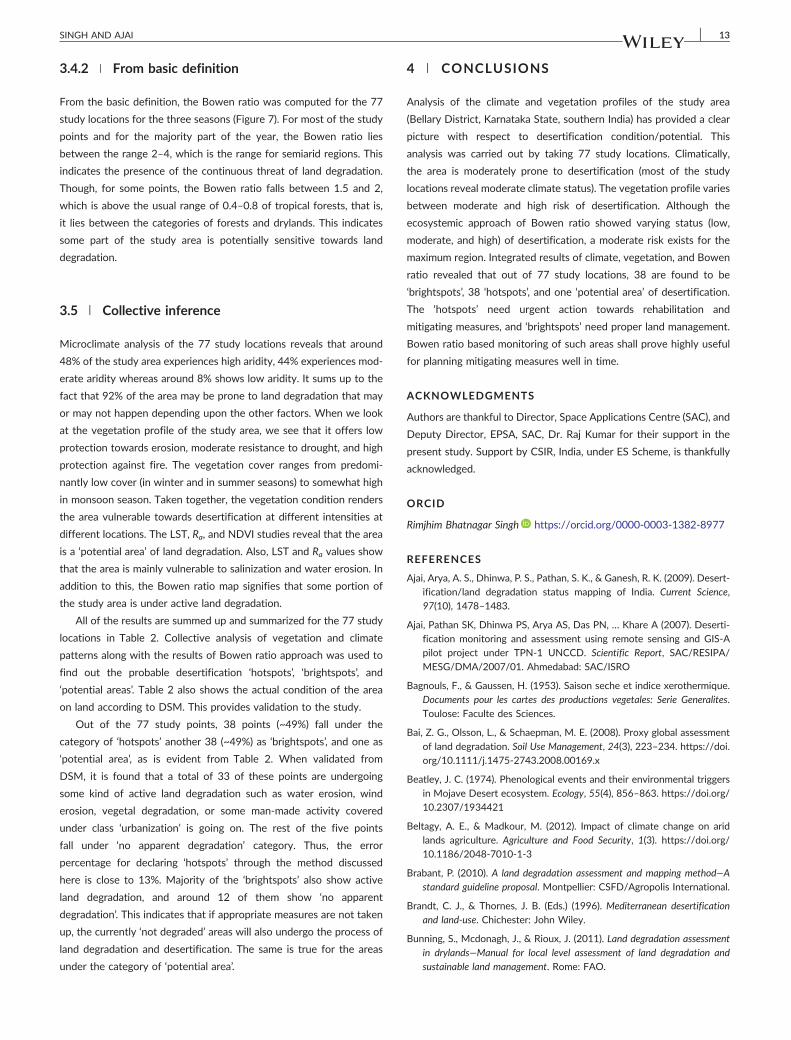
3.4.2 | From basic definition
From the basic definition, the Bowen ratio was computed for the 77
study locations for the three seasons (Figure 7). For most of the study
points and for the majority part of the year, the Bowen ratio lies
between the range 2–4, which is the range for semiarid regions. This
indicates the presence of the continuous threat of land degradation.
Though, for some points, the Bowen ratio falls between 1.5 and 2,
which is above the usual range of 0.4–0.8 of tropical forests, that is,
it lies between the categories of forests and drylands. This indicates
some part of the study area is potentially sensitive towards land
degradation.
3.5 | Collective inference
Microclimate analysis of the 77 study locations reveals that around
48% of the study area experiences high aridity, 44% experiences mod-
erate aridity whereas around 8% shows low aridity. It sums up to the
fact that 92% of the area may be prone to land degradation that may
or may not happen depending upon the other factors. When we look
at the vegetation profile of the study area, we see that it offers low
protection towards erosion, moderate resistance to drought, and high
protection against fire. The vegetation cover ranges from predomi-
nantly low cover (in winter and in summer seasons) to somewhat high
in monsoon season. Taken together, the vegetation condition renders
the area vulnerable towards desertification at different intensities at
different locations. The LST, Ra, and NDVI studies reveal that the area
is a ‘potential area’ of land degradation. Also, LST and Ra values show
that the area is mainly vulnerable to salinization and water erosion. In
addition to this, the Bowen ratio map signifies that some portion of
the study area is under active land degradation.
All of the results are summed up and summarized for the 77 study
locations in Table 2. Collective analysis of vegetation and climate
patterns along with the results of Bowen ratio approach was used to
find out the probable desertification ‘hotspots’, ‘brightspots’, and
‘potential areas’. Table 2 also shows the actual condition of the area
on land according to DSM. This provides validation to the study.
Out of the 77 study points, 38 points (~49%) fall under the
category of ‘hotspots’ another 38 (~49%) as ‘brightspots’, and one as
‘potential area’, as is evident from Table 2. When validated from
DSM, it is found that a total of 33 of these points are undergoing
some kind of active land degradation such as water erosion, wind
erosion, vegetal degradation, or some man‐made activity covered
under class ‘urbanization’ is going on. The rest of the five points
fall under ‘no apparent degradation’ category. Thus, the error
percentage for declaring ‘hotspots’ through the method discussed
here is close to 13%. Majority of the ‘brightspots’ also show active
land degradation, and around 12 of them show ‘no apparent
degradation’. This indicates that if appropriate measures are not taken
up, the currently ‘not degraded’ areas will also undergo the process of
land degradation and desertification. The same is true for the areas
under the category of ‘potential area’.
4 | CONCLUSIONS
Analysis of the climate and vegetation profiles of the study area
(Bellary District, Karnataka State, southern India) has provided a clear
picture with respect to desertification condition/potential. This
analysis was carried out by taking 77 study locations. Climatically,
the area is moderately prone to desertification (most of the study
locations reveal moderate climate status). The vegetation profile varies
between moderate and high risk of desertification. Although the
ecosystemic approach of Bowen ratio showed varying status (low,
moderate, and high) of desertification, a moderate risk exists for the
maximum region. Integrated results of climate, vegetation, and Bowen
ratio revealed that out of 77 study locations, 38 are found to be
‘brightspots’, 38 ‘hotspots’, and one ‘potential area’ of desertification.
The ‘hotspots’ need urgent action towards rehabilitation and
mitigating measures, and ‘brightspots’ need proper land management.
Bowen ratio based monitoring of such areas shall prove highly useful
for planning mitigating measures well in time.
ACKNOWLEDGMENTS
Authors are thankful to Director, Space Applications Centre (SAC), and
Deputy Director, EPSA, SAC, Dr. Raj Kumar for their support in the
present study. Support by CSIR, India, under ES Scheme, is thankfully
acknowledged.
ORCID
Rimjhim Bhatnagar Singh https://orcid.org/0000-0003-1382-8977
REFERENCES
Ajai, Arya, A. S., Dhinwa, P. S., Pathan, S. K., & Ganesh, R. K. (2009). Desert-
ification/land degradation status mapping of India. Current Science,
97(10), 1478–1483.
Ajai, Pathan SK, Dhinwa PS, Arya AS, Das PN, … Khare A (2007). Deserti-
fication monitoring and assessment using remote sensing and GIS‐Apilot project under TPN‐1 UNCCD. Scientific Report, SAC/RESIPA/
MESG/DMA/2007/01. Ahmedabad: SAC/ISRO
Bagnouls, F., & Gaussen, H. (1953). Saison seche et indice xerothermique.
Documents pour les cartes des productions vegetales: Serie Generalites.
Toulose: Faculte des Sciences.
Bai, Z. G., Olsson, L., & Schaepman, M. E. (2008). Proxy global assessment
of land degradation. Soil Use Management, 24(3), 223–234. https://doi.org/10.1111/j.1475‐2743.2008.00169.x
Beatley, J. C. (1974). Phenological events and their environmental triggers
in Mojave Desert ecosystem. Ecology, 55(4), 856–863. https://doi.org/10.2307/1934421
Beltagy, A. E., & Madkour, M. (2012). Impact of climate change on arid
lands agriculture. Agriculture and Food Security, 1(3). https://doi.org/
10.1186/2048‐7010‐1‐3
Brabant, P. (2010). A land degradation assessment and mapping method—Astandard guideline proposal. Montpellier: CSFD/Agropolis International.
Brandt, C. J., & Thornes, J. B. (Eds.) (1996). Mediterranean desertification
and land‐use. Chichester: John Wiley.
Bunning, S., Mcdonagh, J., & Rioux, J. (2011). Land degradation assessment
in drylands—Manual for local level assessment of land degradation and
sustainable land management. Rome: FAO.

14 SINGH AND AJAI
Burgess, P. (2009). Variation in light intensity at different latitudes and sea-
sons, effects of cloud cover, and the amounts of direct and diffused light.
Cambridge: Cambridge University Press.
Climate Change (2007). Mitigation of climate change—Intergovernmental
panel on climate change. Cambridge: Cambridge University Press.
https://doi.org/10.1017/CBO9780511546013
Charney, J. G., Quirk, W. J., Chow, S. H., & Kornfield, J. (1977). A compar-
ative study of the effects of albedo change on drought in semi‐aridregions. Journal of Atmospheric Sciences, 34(9), 1366–1385. https://doi.org/10.1175/1520‐0469(1977)034<1366:ACSOTE>2.0.CO;2
Cherlet, M., Hutchinson, C., Reynolds, J., Hill, J., Sommer, S., & von Maltiz,
G. (Editors). (2018). World atlas of desertification. Luxembourg: Publica-
tion Office of the European Union. https://doi.org/10.2760/06292
Christian, B. A., Dhinwa, P. S., & Ajai. (2018). Long term monitoring and
assessment of desertification processes using medium and high‐resolution satellite data. Applied Geography, 97, 10–24. https://doi.
org/10.1016/j.apgeog.2018.04.010
Del Barrio, G., Puigdefabregas, J., Sanjuan, M. E., Stellmes, M., & Ruiz, A.
(2010). Assessment and monitoring of land condition in Iberian Penin-
sula, 1989‐2000. Remote Sensing of Environment, 114, 1817–1832.https://doi.org/10.1016/j.rse.2010.03.009
Dregne, H. E. (1986). Desertification of arid lands. In Physics of desertifica-
tion. Dordrecht: Springer. https://doi.org/10.1007/978‐94‐009‐4388‐9_2
Enne, G., Zucca, C., & Zanolla, C. (2003). Indicators and information
requirements for combating desertification. In Mediterranean climate—Regional climate studies. Berlin: Springer. https://doi.org/10.1007/
978‐3‐642‐55657‐9_3
Fairbridge, R. W., Beinroth, F. H., Eswaran, H., & Reich, P. F. (2008).
Edaphic constraints on food production. In Encyclopedia of soil science.
Dordrecht: Springer. https://doi.org/10.1007/978‐1‐4020‐3995‐9
Food and Agriculture Organization (1998). Crop evapotranspiration: Guide-
lines for computing crop water requirements. Rome: FAO.
Garcíaa, M., Cecilio, O., Luis, V., Sergio, C., Francisco, D., & Juan, P. (2008).
Remote sensing of environment monitoring land degradation risk using
ASTER data: The non‐evaporative fraction as an indicator of ecosystem
function. Remote Sensing of Environment, 112(9), 3720–3736. https://doi.org/10.1016/j.rse.2008.05.011
Jat, R. A., Crauford, P., Sahrawat, K. L., & Wani, S. P. (2012). Climate change
and resilient dryland systems: Experiences of ICRISAT in Asia and
Africa. Current Science, 102(12), 1650–1659.
Khanna, S. S. (1989). The agro‐climatic approach. In The Hindu survey of
Indian agriculture. Madras: National Press.
Kleidon, A., & Heimann, M. (1998). Optimized rooting depth and its
impacts on the simulated climate of an atmospheric general circulation
model. Geophysical Research Letters, 25, 345–348. https://doi.org/
10.1029/98GL00034
Kosmas, C., Ferrara, A., Briasouli, H., & Imeson, A. (1999). Methodology for
mapping environmentally sensitive areas (ESAs) to desertification. In
The MEDALUS Project Mediterranean Desertification and Land Use—Man-
ual on key indicators of desertification and mapping environmentally
sensitive areas to desertification. EU: Brussels.
Lambin, E. F., & Ehrlich, A. D. (1996). Land‐cover change in sub‐SaharanAfrica (1982‐1991): Application of change indices based on remotely
sensed surface temperature and vegetation indices at a continental
scale. Remote Sensing of Environment, 61, 181–200. https://doi.org/10.1016/S0034‐4257(97)00001‐1
Lee, C. R., & Skogerboe, J. G. (1985). Quantification of erosion control by
vegetation on problem soils. In Soil erosion and conservation. Ankeny:
Soil Conservation Society of America.
MA. (2005). Environmental degradation and human wellbeing: Report of
the millennium ecosystem assessment. Population and Development
Review, 31, 389–398. https://doi.org/10.1111/j.1728‐4457.2005.00073.x
Middleton, N., & Thomas, D. (Eds.) (1997). World atlas of desertification
(2nd ed.). London: Arnold.
Monteith, J. L., & Unsworth, M. H. (2014). Principles of environmental phys-
ics—Plants, animals, and the atmosphere (4th ed.). Warsaw: Academic
Press. https://doi.org/10.1016/C2010‐0‐66393‐0
Nachtergaele, F. O., & Licona‐Manzur, C. (2008). The land degradation
assessment in drylands (LADA) project: Reflections on indicators for
land degradation assessment. In The future of drylands. Dordrecht:
Springer. https://doi.org/10.1007/978‐1‐4020‐6970‐3_33
Nobel, P. S. (1974). Boundary layers of air adjacent to cylinders—Estimation
of effective thickness and measurements. Plant Physiology, 54,
177–181. https://doi.org/10.1104/pp.54.2.177
Piedallu, C., & Gégout, J.‐C. (2007). Multiscale computation of solar radia-
tion for predictive vegetation modelling. Annals of Forest Science, 64,
899–909. https://doi.org/10.1051/forest:2007072
Pielke, R. A. (2001). Influence of the spatial distribution of vegetation and
soils on the prediction of cumulative rainfall. Reviews of Geophysics,
39(2), 151–177. https://doi.org/10.1029/1999RG000072
Prince, S. D. (2016). The end of desertification. Berlin: Springer. https:/doi.
org/10.1007/978‐3‐642‐16014‐1_9
Roeder, A., & Hill, J. (2009). Recent advances in remote sensing and geo‐information processing for land degradation assessment. London: Taylor
& Francis. https://doi.org/10.1201/9780203875445
Sandholt, I., Rasmussen, K., & Andersen, J. (2002). A simple interpretation
of the surface temperature/vegetation index space for assessment of
soil moisture status. Remote Sensing of Environment, 79, 213–224.https://doi.org/10.1016/S0034‐4257(01)00274‐7
Singh, R.B., & Ajai. (2008). Development of model for desertification vul-
nerability. Scientific Report, SAC/RESA/MESG/DMSP‐DVI/2008/01.
Ahmedabad: SAC/ISRO
Sivakumar, M. V. K. (2007). Interactions between climate and desertifica-
tion. Agricultural and Forest Meteorology, 142, 143–155. https://doi.org/10.1016/j.agrformet.2006.03.025
Sommer, S., Zucca, C., Grainger, A., Cherlet, M., Zougmore, R., Sokona, Y.,
… Wang, G. (2011). Application of indicator systems for monitoring
and assessment of desertification from national to global scales. Land
Degradation & Development, 22, 184–197. https://doi.org/10.1002/
ldr.1084
Stadler, S. J. (1998). Aridity indices. In Encyclopedia of hydrology and lakes.
Dordrecht: Springer. https://doi.org/10.1007/1‐4020‐4497‐6_20
Tereshchenko, I., Zolotokrylin, A. N., Titkova, T. B., Brito‐Castillo, L., &Monzon, C. O. (2012). Seasonal variation of surface temperature–modulating factors in the Sonoran Desert in north‐western Mexico.
Journal of Applied Meteorology and Climatology, 51(8), 1519–1530.https://doi.org/10.1175/JAMC‐D‐11‐0160.1
United Nations Environment Programme. (1992). Proceedings of an ad‐hocexpert group meeting to discuss global soil database and appraisal of
GLASOD/SOTER. Nairobi: UNEP.
United Nations Educational, Scientific and Cultural Organization
(UNESCO). (1979). Map of the world distribution of arid regions: Map
at scale 1:25,000,000 with explanatory note. MAB Technical Notes, 7.
Paris: UNESCO.
Wan, Z., & Li, Z. L. (1997). A physics‐based algorithm for retrieving land‐surface emissivity and temperature from EOS/MODIS data. IEEE Trans-
actions on Geoscience and Remote Sensing, 35(4), 980–996. https://doi.org/10.1109/36.602541

SINGH AND AJAI 15
Warner, T. (2004). Desert microclimates. In Desert meteorology. Cambridge:
Cambridge University Press. https://doi.org/10.1017/CBO978051153
5789.012
Xu, D., Kang, X., Qiu, D., Zhuang, D., & Pan, J. (2009). Quantitative assess-
ment of desertification using Landsat data. Sensors, 9(3), 1738–1753.https://doi.org/10.3390/s90301738
Zdruli, P., Cherlet, M., & Zucca, C. (2016). Mapping desertification: Con-
straints and challenges. In Encyclopedia of soil science (3rd ed.).
Florida: CRC Press.
Zucca, C., Della, R., Perutab, R., Salviac, S., Sommerd, S., & Cherlet, M.
(2012). Towards a world desertification atlas—Relating and selecting
indicators and data sets to represent complex issues. Ecological Indica-
tors, 15(1), 157–170. https://doi.org/10.1016/j.ecolind.2011.09.012
Zucca, C., Francesca, J., & Franco, P. (2011). Land restoration by fodder
shrubs in a semi‐arid agro‐pastoral area of Morocco‐Effects on soils.
Fuel and Energy, 87(3), 306–312. https://doi.org/10.1016/j.
catena.2011.06.017
Zucca, C., Lubino, M., Previtali, F., & Enne, G. (2005). The
Euro‐Mediterranean partnership: A participatory demonstration pro-
ject to fight desertification in Morocco and Tunisia. Proceedings of
“Determining an Income‐Product Generating Approach for Soil Con-
servation Management”. Italy: Medcoastland.
How to cite this article: Singh RB, Ajai. A composite method
to identify desertification ‘hotspots’ and ‘brightspots’. Land
Degrad Dev. 2019;1–15. https://doi.org/10.1002/ldr.3290