a compendium of research - pgcollege.kces.in
TRANSCRIPT

A
Compendium of Research
Articles by Prospective
Researchers
2019-20
Under the
Recognized by Govt. of Maharashtra vide G. R. No. NGC 2010/247/10 & Affiliated to K. B. C.
North Maharashtra University, Jalgaon
Accredited ‘B+’ Grade by NAAC with CGPA 2.52 in 1st cycle

Title of the book: A Compendium of Research Articles by Prospective Researchers 2019-20
Name of the Editor: Mr. Sandip N. Patil
Head, Department of Microbiology
Publisher: Dr. Vishvanath S. Zope
Principal
Khandesh College Education Society‟s Post Graduate College of Science,
Technology & Research, Jalgaon, M. J. College Campus Jalgaon.
Printer: Khandesh College Education Society‟s Post Graduate College of Science,
Technology & Research, Jalgaon, M. J. College Campus Jalgaon.
ISBN: 978-81-949083-3-3
Copyright © 2020 Mr. Sandip N. Patil
All rights reserved, including the right of reproduction in whole or in part in any form.
Editorial Board
Principal
Dr. V. S. Zope
Chief Editor Mr. Sandip N. Patil
Dept. of Microbiology
Co-ordinator Mr. Javed Khan
Dept. of Biotechnology
Members
Dr. R. T. Mahajan Director, Research Cell, KCE Society, Jalgaon
Dr. R. M. Patil Mr. D. R. Nhavi Dept. of Organic chemistry Dept. of Mathematics
Dr. Sarang Bari Mr. Akash R. Wagh Dept. of Biotechnology Dept. of Statistics

Khandesh College Education Society’s
Post Graduate College of Science, Technology and Research, Jalgaon M. J. College Campus, Jalgaon, Maharashtra
Awarded ‘B+’ Grade by NAAC with CGPA 2.52 in 1st cycle
Tel. No.: 0257-2236036 Website: pgcollege.kces.in E-mail: [email protected]
Recognized by Govt. of Maharashtra vide G. R. No. NGC 2010/247/10 & Affiliated to K. B. C. North Maharashtra University, Jalgaon
Date: 20th
December 2020
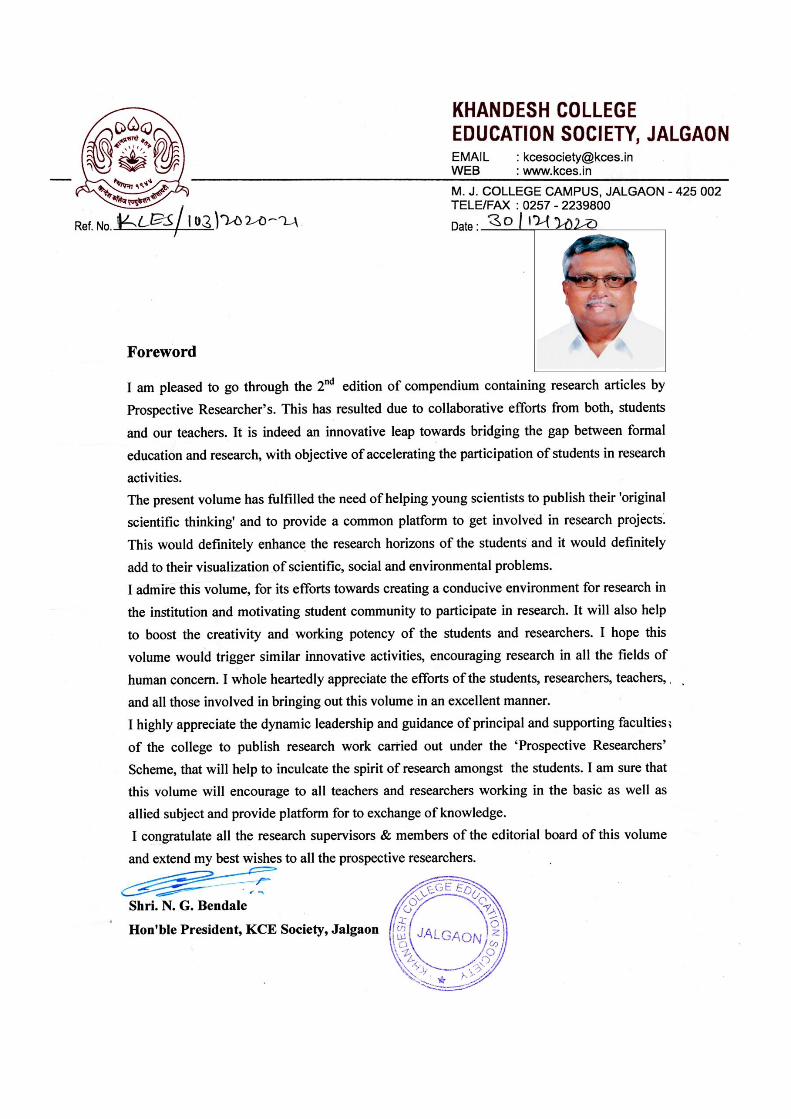
FOREWORD
It indeed matter of great pleasure that KCE society‟s Post Graduate college
of Science, Technology and Research, Jalgaon is publishing the second
volume of ‘A compendium of research articles by Prospective
Researchers’ of the projects undertaking by the students. Under the
initiative of “Prospective Researchers‟ Scheme”, prospective researcher
students have been provided with golden opportunities to undertake multi-disciplinary
projects and thereby they get the exposure not only to the scientific and methodological
research but also the training about writing of research paper. This year, scheme is continued
in which 17 projects (research articles) have been completed by 60 students under the
supervision of 13 expert teachers of every department of the college.
I am confident that the articles of the projects presented in this volume will elevate the spirit
of scientific attitude amongst the students and teachers as well. Launching new initiative is
always easy, but sustaining it for a long period is always difficult. Therefore the efforts taken
by the teachers, students and specially co-ordinator of the scheme & the editor of the volume
for bringing out this volume is appreciable and commendable.
Dr. V. S. Zope
Principal

From the Desk of Editor
I am pleased to present to you the Second edition of A Compendium of
Research Articles by a Prospective Researchers under the activity of
„Prospective Researcher‟s Scheme‟ for the year 2019-20. This volume
presents the seventeen articles from students and teachers of five Science
Departments of college. ‘Prospective Researchers’ Scheme is unique
research activities of the college in which students undertake research
projects under the supervision of teachers.
The outcome of this scheme is reflected in the publication of „A compendium of research
articles of prospective researchers‟ with ISBN number. At the beginning of an academic year,
potential students are identified and small research projects are assigned to them. The
innovation and feasibility of research proposal is scrutinized followed by undertaking of
projects in the stipulated time. The students are provided with research assistance to complete
the research projects within stipulated time period. After completion, projects are evaluated
by external experts and best performers are felicitated with cash prizes. This year seventeen
research projects were completed from five Departments of Organic Chemistry,
Microbiology, Biotechnology, Mathematics and Statistics. The research papers based on their
articles is published in a separate volume as “A Compendium of Research Articles by a
Prospective Researchers Volume II” with ISBN. I thank all the committee members, faculty
wise project guides & students for helping me in this endeavor.
I would like to thank the Principal Dr V. S. Zope and our Hon‟ble President Shri. N. G.
Bendale, KCE Society, Jalgaon, provided help and encouragement to compile the new
edition. This volume is result of continuous efforts of teachers & students of this college.
I am very happy to handover this volume to you all.
Mr. Sandip N. Patil
Chief Editor

INDEX
Sr. No. Title of Research Article Page No.
ORGANIC CHEMISTRY
1 Use of High Pressure Autoclave (HPA) for Chemical Recycling of Poly-
Ethylene Terephthalate (PET) waste
Varma Nisha, Patil Dhiren, Patil Kaushik, Dhumale Ashwini and Zope
Vishvanath S.*
2-7
2 One-pot Multicomponent Synthesis of 2,4,5 triaryl-imidazole Derivatives
by using CMC-CeIV
as reusable Catalyst
Chaudhari Kamlesh, Patil Nilesh, Patil Ganesh, Khatik Nisar and Patil
Ravindra M.*
8-12
3 Efficient One Pot Synthesis of Schiff’s Bases By Using CMC-CuII
Catalyst
Patil Madhuri, Patil Mahesh, Joshi Mansi, Valvi Dilwarsing & Patil Ravindra
M. *
13-17
4 Synthesis of Azo Dyes by Using Grinding Method
Solanke Radhika, Patil Pooja, Mahajan Samrat, Pawar Shweta and Chaudhari
Rupali A.* 18-21
MICROBIOLOGY
5 Studies on Effect of MonoSodium Glutamate (MSG) On Growth of
Microorganisms Patil Jayesh M , Patil Chetan V, Walde Devesh , Patil Pankaj G and Patil
Sandip N*
23-25
6 Larvicidal activity of proteins extracted from Bacillus Subtilis against
vector mosquitoes
Rathod Kanchan A, Sule Lalita S, Suryawanshi Krutika A, Patil Dhanashri R
and Patil Sandip N*
27-30
7 Effect of Environmental Stresses on Food Borne Microbes
Wani Bhagyashri, Mahajan Savita, Dusane Bhuvneshwari Ahire Sunayana and
Patil Sandip N*
31-34
8 Studies on Bioethanol Production Using Orange peel
Dusane Aishwarya R, Sonawane Diksha Y, Patil Rachana S, Neve Vina and
Patil Sandip N* 35-38
9 Studies on Bio-plastic producing Microorganisms
Pawar Vandana B, Patil Dipali D, Patil Tejal S, Chavan Shubhangi S and
Patil Sandip N*
39-42
BIOTECHNOLOGY
10 Polyphenol oxidase potentials of two wild mushroom species
isolated from Microporus xanthopus and Polyporus arcularius
Fuse Ekta 1, Patil Praful
1, Barde Minal
1, Mahajan R.T.
1, Khan Javed *, and
Khan Tanvir 2
44-49
11 Studies on antibacterial and antifungal activity of spices (Cinnamon,
Black pepper and Cumin)
Gonge Shubhangi E., Borse Vaishali M., Bonde Kanchan S., Shaikh Faiz,
MeshramPavan D. a, and Bari Sarang S.*
50-55
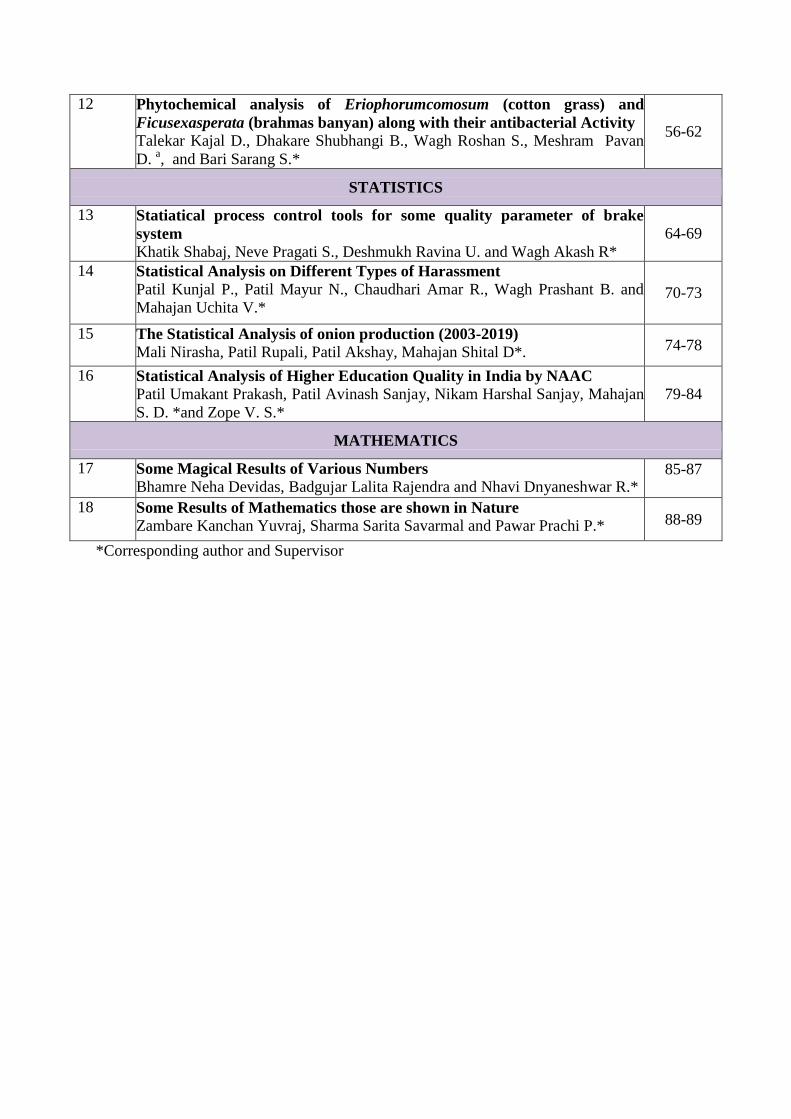
12 Phytochemical analysis of Eriophorumcomosum (cotton grass) and
Ficusexasperata (brahmas banyan) along with their antibacterial Activity Talekar Kajal D., Dhakare Shubhangi B., Wagh Roshan S., Meshram Pavan
D. a, and Bari Sarang S.*
56-62
STATISTICS
13 Statiatical process control tools for some quality parameter of brake
system
Khatik Shabaj, Neve Pragati S., Deshmukh Ravina U. and Wagh Akash R*
64-69
14 Statistical Analysis on Different Types of Harassment
Patil Kunjal P., Patil Mayur N., Chaudhari Amar R., Wagh Prashant B. and
Mahajan Uchita V.* 70-73
15 The Statistical Analysis of onion production (2003-2019)
Mali Nirasha, Patil Rupali, Patil Akshay, Mahajan Shital D*. 74-78
16 Statistical Analysis of Higher Education Quality in India by NAAC
Patil Umakant Prakash, Patil Avinash Sanjay, Nikam Harshal Sanjay, Mahajan
S. D. *and Zope V. S.*
79-84
MATHEMATICS
17 Some Magical Results of Various Numbers
Bhamre Neha Devidas, Badgujar Lalita Rajendra and Nhavi Dnyaneshwar R.* 85-87
18 Some Results of Mathematics those are shown in Nature
Zambare Kanchan Yuvraj, Sharma Sarita Savarmal and Pawar Prachi P.* 88-89
*Corresponding author and Supervisor

A Compendium of Research Articles by Prospective Researchers 2019-20 Volume II | Page 1
CHEMISTRY

A Compendium of Research Articles by Prospective Researchers 2019-20 Volume II | Page 2
Use of High Pressure Autoclave (HPA) for Chemical Recycling of Poly-
Ethylene Terephthalate (PET) waste Varma Nisha, Patil Dhiren, Patil Kaushik, Dhumale Ashwini and Zope Vishvanath S*
Department of Chemistry, KCE‟s Post Graduate College of Science, Technology and Research,
Jalgaon, M.S. India.
Abstract
HPA is used for high-pressure high-temperature chemical reactions like alkylation,
amination, bromination, carboxylation, catalytic reduction, chlorination, dehydrogenation,
esterification, ethoxylation, halogenation, hydrogenation, methylation, nitration, oxidation,
ozonization, polymerization, sulphonation. Chemical recycling of Polyethylene
Terephthalate (PET) waste was studied at different temperatures and autogeniuos pressures
were recorded. Temperature and pressure have been optimised for grater conversion of PET
to TPA. The product obtained is characterised by recording FTIR and melting point.
Key Words: Chemical Recycling, high pressure autoclave, hydrolysis, PET, TPA
*Corresponding author : dr_zope @rediffmail.com
Introduction
Nowadays, polyethylene Terephthalate (PET) is commonly used to manufacture water
bottles being excellent water and moisture barrier properties. PET is commonly used in
making mineral water bottles and soft drinks or carbonated beverage bottles. Huge use of
Polyethylene Terephthalate generates considerable amount of waste. Consequently, gigantic
amount of synthetic waste is generated; bulk of the waste is disposed in landfills or
incinerated. The process of dumping synthetic waste in the land fill is not environmental
friendly solution since polyethylene terephthalate (PET) bottles are not biodegradable. Since,
the cost of the disposal of waste is increasing without a break, owing to the limited capacity
of the landfills is causing soil pollution. As a result, it is of a great interest to chemically
recycle and later reuse the materials. Primary recycling of Polyethylene Terephthalate (PET)
converts the waste into other products of the virgin polymer. Numbers of researchers1-6
have
dedicated their work to find alternative methods for the recycling of polyethylene
Terephthalate (PET), polyurethane (PU) foam, Polyamide (PA). The recovery of the product
of depolymerisation of polyethylene terephthalate can be used for conversion of PET.7-8
We
have studied the depolymerisation of PET by alkaline hydrolysis process using pyridine as a
catalyst using the high pressure autoclave.
Materials: Sodium hydroxide, ethyl alcohol, hydrochloric acid and pyridine were used as
such obtained by BDH chemicals. Waste mineral water bottles were used as a source of
A Compendium of Research Articles by Prospective Researchers 2019-20 Volume II | Page 3
Polyethylene Terephthalate (PET). The bottles were cut into the size of 1 cm³ (one by one
centimeter) into square shape. Amar Equipment Pvt. Ltd manufactured 0.5 L capacity High
Pressure Autoclave was used to study.
Methodology
Experimental: 10 g of Polyethylene Terephthalate (PET) waste, which was cut into the 1
cm³ square shaped pieces, 8 g of Sodium hydroxide and 250 ml of distilled water, were
charged into the reaction vessel of HPA. The reaction mixture was homogeneously mixed by
string at the rate of 1000 RPM. The reaction was carried out at the temperatures 150, 180,
200, 220 °C the autogeniuos pressure was recorded at respective temperatures. The reaction
was carried for the 120 minutes reaction time. After the completion of reaction time, the
vessel was cooled suddenly by circulating cold water in the vessel through inner coil. The
reactor vessel was opened by removing the collar when the vessel got completely cooled,
Chemical recycling of 10 g PET by alkaline hydrolysis was carried out by refluxing the PET
along with water and catalyst for several time intervals. Amount of Sodium Hydroxide was
varied for its optimization as 4, 6, 8 gram. The same reaction was carried out using with and
without catalyst. 4 ml of pyridine as a catalyst and 8 gram optimized amount of sodium
hydroxide were use in the reaction. The reaction was reflux for 120 minutes. The reaction
mixture was cooled down on it‟s own. Once the reaction mixture got cooled, it was collected
in the beaker. The TPA is precipitated as a white solid by adding concentrated hydrochloric
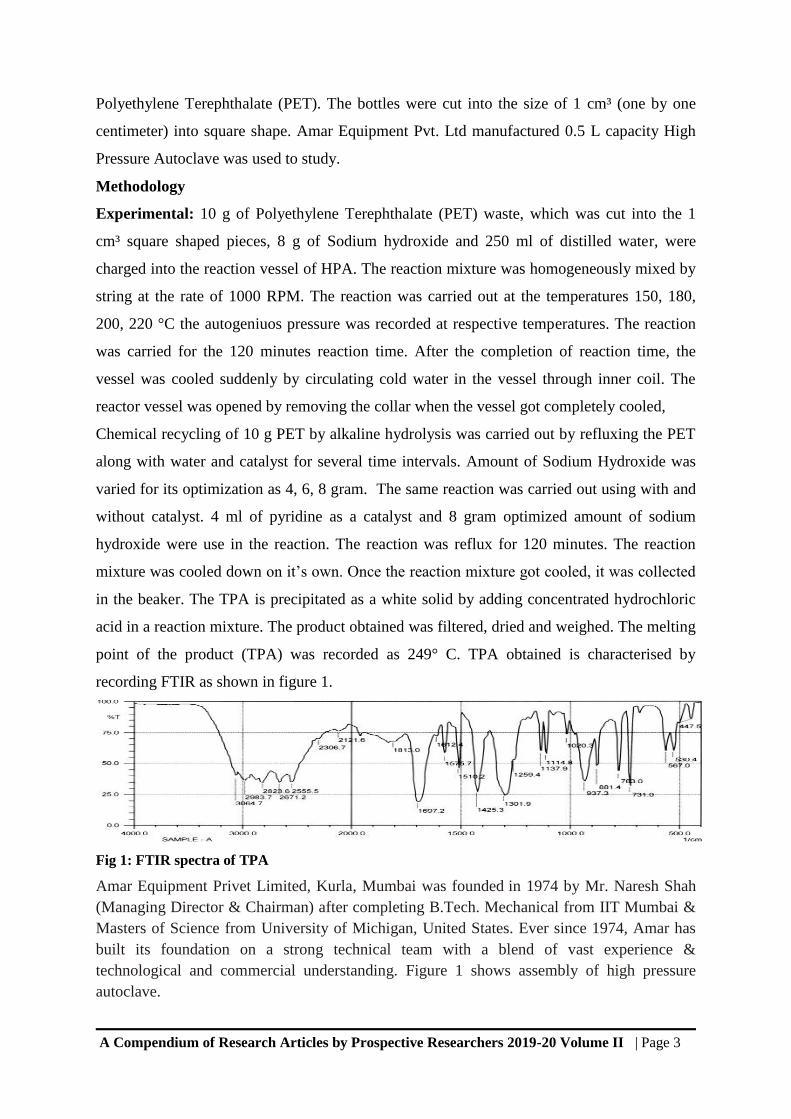
acid in a reaction mixture. The product obtained was filtered, dried and weighed. The melting
point of the product (TPA) was recorded as 249° C. TPA obtained is characterised by
recording FTIR as shown in figure 1.
Fig 1: FTIR spectra of TPA
Amar Equipment Privet Limited, Kurla, Mumbai was founded in 1974 by Mr. Naresh Shah
(Managing Director & Chairman) after completing B.Tech. Mechanical from IIT Mumbai &
Masters of Science from University of Michigan, United States. Ever since 1974, Amar has
built its foundation on a strong technical team with a blend of vast experience &
technological and commercial understanding. Figure 1 shows assembly of high pressure
autoclave.

A Compendium of Research Articles by Prospective Researchers 2019-20 Volume II | Page 4
High Pressure Autoclave:
Fig 1: High Pressure autoclave assembly
Applications:
HPA is used for high-pressure high-temperature chemical reactions like alkylation,
amination, bromination, carboxylation, catalytic reduction, chlorination, dehydrogenation,
esterification, ethoxylation, halogenation, hydrogenation, methylation, nitration, oxidation,
ozonization, polymerization, sulphonation etc. Prominently HPA is use In R&D centers of
pharmaceuticals, dyes, chemical, fertilizers, paints, oils, agrochemical, and petrochemicals
industries. It has been used by the colleges, research institutes, defense organizations. HPA is
used, where high pressure reactions and testing is carried out. Some specific use of HPA is
listed below.
To design new molecules, chemicals & to study the reaction parameters
To manufacture the chemicals in small quantities in batch or continuous mode
For synthesizing hydrogenation, acetylation, epoxidation, Grignard reaction, nitration,
acylation, photochemical reactions, high throughput catalyst screening and quality control
& process improvements
For supercritical CO solvent extraction, reaction, drying and evaporation system Also for
reaction calorimetry to study heat of reaction
For high pressure storage & transfer of gas / liquid / slurries, acid digestion and Gas
hydrate formation.
Salient Features:
HPA is available as Stirred & non-stirred reactors, pressure vessels with the volume ranging
from 5 ml to 500 ml for research laboratories and for industrial and pilot plant it is up to
2000 liter. The vessel is made up of SS-316/316L, Hastelloy B/C, Monel, Inconel, Nickel,
Titanium, Tantalum lined, Zirconium etc. The maximum design pressure is up to 700 &
temperatures upto 650 ºC. It is provided with high torque maintenance free zero leakage
magnetic drive coupling. It is meant foe to design complete pilot plant with automatic

A Compendium of Research Articles by Prospective Researchers 2019-20 Volume II | Page 5
temperature, pressure, RPM, motor torque/ current, liquid and gas. It is also provided with
condenser for distillation or reflux, thermicfluid heating and cooling system etc. It is fully
automated PC controlled high pressure systems and completely flame, explosion proof,
ATEX certified systems suitable
Results and Discussions
i. Reaction mechanism: The reaction mechanism for depolymerization of polyethylene
Terephthalate to Terphthalic acid is represented as given below.
ii. Measurements of Autogeniuos pressure: The pressure exerted by the steam of water in
the closed vessel is referred as autogeniuos pressure. The autogeniuos pressure was recorded
at different temperature when three fourth of the vassal of 500 ml capacity is filled by water.
Figure 2 shows variation of pressure with temperature. It is evident from the figure the trend
is same as theoretical.
Temp 0C 100 130 150 170 200 220
Pressure (psi) 15 52 80 151 230 405
Pressure (bar) 2 3.8 7.0 10.2 16.0 28.0
Table 1: Variation of Temperature versus Pressure
Fig 2: Variation of Temperature versus Pressure
ii. Conversion of PET to TPA using HPA: The variation of percenatge yield for the
conversion of PET into TPA with temperature of autoclave at respective autogenious
pressure is as shown in figure 3. It is evident from the graph that, % yield is 69 at 150OC
and at autogenious pressure 80 psi and then it suddenly increases up to 89% at 180OC.
1552 80
151
230
405
0
100
200
300
400
500
50 100 150 200 250Temp degree C
psi

A Compendium of Research Articles by Prospective Researchers 2019-20 Volume II | Page 6
Thereafter there is no significant increase in % yield. It reaches to maximumm to 95% at
220OC and at Auotgenious pressure 405 psi.
Fig 3: Variation of % yield versus Temperature
iii. Conversion of PET to TPA by using reflux method (with and without catalyst):
Figure 4 indicates same trend of increse of percentage yield with and without catlyst. But
at every temperature incresea in percenatge ield is more when catalyst was used than
without catalyst. The mximum percenatge yield at 220OC was found to be 96.2 and 80 %
with and without catalyst respectively.
Fig 4: Variation of % yield versus Temperature (with and without catalyst)
Conclusions
1. High pressure autoclave is use for study of depolymerisation of plastics waste
2. Calibration curve is set up by measuring autogenious pressure at different
temperature.
3. Maximum percentage yield for obtaining monomer TPA by depolymerization
reaction is 95 % at 220OC using high pressure autoclave.
4. Maximum percentage yield for obtaining monomer TPA by depolymerization
reaction is 96.2 and 80 % with and without catalyst respectivly at 220OC using reflux
method.
5. 8 gram of sodium hydroxide required for depolymerization of 110 gram of PET has
been optimized.
69
8993 95
60
70
80
90
100
100 150 200 250Temp deg C
% yield
65
71.1
79 8074
89.494.7 96.2
60
70
80
90
100
120 140 160 180 200 220 240
% y
ield
Temp Degree C
Effect of catalyst
Without Catalyst
With Catalyst

A Compendium of Research Articles by Prospective Researchers 2019-20 Volume II | Page 7
Reference
1. Chen, J. Y.; Ou, C. F.; Hu, Y. C.; Lin, C. C. J Appl Polym Sci 1991, 42, 1501.
2. Vaidya, U. R.; Nadakarni, V. M. J Appl Polym Sci 1989, 38,1179.
3. Baliga, S.; Wong, T. W. J Appl Polym Sci 1989, 27, 2071.
4. Mandoki, J. W. Depolymerization of Condensation Polymers, US Patent 4,605,762,
1986.
5. Paszun, D.; Spychaj, T. Ind Eng Chem Res 1997, 36, 1373.
6. Reimschuessel, H. K. Ind Eng Chem Prod Res Dev 1980, 19, 117.
7. Mishra, S.; Zope, V. S.; Goje, A. S. Polym Int 2002, 51, 1310.
8. Mishra, S.; Goje, A. S. J Appl Polym Sci 2003, 87, 1569.
*****

A Compendium of Research Articles by Prospective Researchers 2019-20 Volume II | Page 8
One-pot Multicomponent Synthesis of 2,4,5 triaryl-imidazole Derivatives
by using CMC-CeIV
as reusable Catalyst Chaudhari Kamlesh, Patil Nilesh, Patil Ganesh, Khatik Nisar and Patil Ravindra M.*
Department of Chemistry, KCES‟s Post Graduate College of Science Technology &
Research, Jalgaon
Abstract CMC-Ce
IV was prepared by metathesis strategy and characterized by FT-IR techniques. The
ensuring catalyst has been successfully applied in the one-pot four-component reaction of
various aromatic aldehyde and benzill to the synthesis of 2,4,5 triaryl-imidazole derivatives.
The catalyst was recovered and reused for five cycles without considerable loss of activity.
The advantages of the protocol include rapid reactions with good yields and simple workup.
The synthesized compounds were characterized by FT- IR technique.
Keywords: CMC-CuII, Imidazole derivatives, Multi-component reaction, Metathesis
Reaction.
*Corresponding author: [email protected]
Introduction
Imidazole is an important core organic molecule. It is found in many naturally occurring
compounds like vitamin B12, histidine, histamine, pilocarpine alkaloids, and biotin.1-3
It is
also showing good activity as herbicide, plant growth regulator, anti-epileptic, anticonvulsant,
anti-inflammatory, analgesic, anticancer, etc.4-8
Also, imidazoles are found as the main core
molecule in drugs like Omeprazole, Pimobendan, Losarton, Olmesartan, Eprosartan, and
Trifenagrel.9
Owing to their wide range of biological advancement, synthesis of title compounds are still
of intrigue. The available reported method for the synthesis of substituted imidazoles suffers
from drawbacks such as the catalysts used for synthesis are either toxic or expensive and
requires harsh reaction condition. Therefore, a need still exists for further development of an
efficient, reusable, inexpensive and eco-friendly catalyst for the synthesis of substituted
imidazoles. In organic synthesis, the product yield and reaction time are extremely important.
The increase in reaction steps results in a decrease in final product yield and increase in total
reaction time. Multicomponent reactions help to solve this problem. By novel developing
multicomponent reaction strategies, synthesis of the desired product in the one-pot method is
possible thereby increases the product yield and reducing reaction time required for the
reaction.
The interest in metal NPs, attributable to their high surface area, incredible availability, high

A Compendium of Research Articles by Prospective Researchers 2019-20 Volume II | Page 9
biocompatibility and low toxicity. In addition, the high catalytic activity of metallic NPs can
be accounted due to its Lewis acid site.10
Considering these facts, we have decided to
synthesize 2,4,5 triaryl-imidazole derivatives of various substituted benzaldehydes and benzil
efficiently using CMC-CeIV
as a recoverable and reusable catalyst in ethanol as a solvent via.
Multi-component reactions.
Materials and Methods
All reagents used were of laboratory grade. Melting points were determined in open
capillaries. The purity of compound was checked by TLC. IR spectra were recorded on
Shimadzu FT-IR (Affinity Model) using KBr.
Preparation of Cu(II)carboxymethylcellulose (CMC− CeIV
) Catalyst
The Ce(IV) carboxymethylcellulose (CMC− CeIV
) catalyst was prepared by metathesis
reaction of cerric ammonium nitrate and Na-CMC. The yellow solid was precipitated which
was left to equilibrate in a solution for overnight. The resulting yellow solid was separated
from the solution and washed thoroughly with distilled water. The wet CMC− CeIV
was dried
at 600C in the oven till constant weight.
General procedure for synthesis of 2,4,5 triaryl-imidazole derivatives by using
CMC− CeIV
as catalyst:
In 150 ml round bottom flask, a mixture of benzaldehyde (10 mmol), benzil (10 mmol) and
ammonium acetate (10mmol), as ammonia source, and CMC-CeIV
(20mg) were stirred and
refluxed in ethanol for appropriate time (Table 1). The progress of the reaction was
monitored by TLC. After completion of the reaction, the precipitate thus obtained was wash
with ethanol and then purified by recrystallization from ethanol to get corresponding pure
product ((Scheme 1).
Results and Discussions
Optimized Reaction Conditions:
To optimize the reaction condition, we performed the model reaction with different amount
of CMC− CeIV
catalyst loaded as shown in Table 1.
It was found that, the 20 mg catalyst is sufficient to push the reaction forward. To investigate
the role of solvent in model reaction was performed in different solvent like ethanol, water,
50% ethanol or another organic solvent.

A Compendium of Research Articles by Prospective Researchers 2019-20 Volume II | Page 10
Table 1: Optimized amount of catalyst loaded
Entry Catalyst (mg) Time (min) Yield (%)
1 5 80 60
2 10 50 82
3 15 35 90
4 20 15 94
5 25 15 93
It was observed that, when we used pure ethanol as a solvent the yield of product increases up
to 97% and time also reduced about 10 min. Imidazole formation was increases in ethanol,
while the same reaction occurred slowly in water and another organic solvent.
After the study of above optimized reaction conditions were explored for the synthesis of
series of 2,4,5 triaryl-imidazole derivatives from various substituted benzaldehydes and
benzil efficiently using CMC-Ce
IV catalyst as shown in Scheme 1 and the results are
summarized in Table 2.
CHO
+
R
O
O
Benzil
NH4OAc
CMC-CeIV, Ehanol,
refluxN
HN Ph
Ph
R
. .
..
Scheme 1: Synthesis of 2,4,5 triaryl-imidazole derivatives by using CMC− CeIV
as
catalyst
Spectral data of compounds (1-4)
1) Cream White solid, IR (cm-1
): 3340(NH); 1668(C=N), 1587(C N), 1320 (C N), 1510 (C=C
aromatic), 3061(C=C H).
2) Yellow solid, IR (cm-1
): 3319(N H); 1670(C=N), 1583(C N), 1311 (C N), 1520 (C=C
aromatic), 3064(C=C H).
3) Lemon Yellow solid, IR (cm-1
): 3322(NH); 1648(C=N), 1590(C N), 1313 (C N), 1534
(C=C aromatic), 3066(C=C H).
4) Brown solid, IR (cm-1
): 3340(N H); 1668(C=N), 1579(C N), 1315 (C N), 1519 (C=C
aromatic), 3067(C=C H).

A Compendium of Research Articles by Prospective Researchers 2019-20 Volume II | Page 11
Table 2: Synthesis of 2,4,5 triaryl-imidazole derivatives (1-4)
Sr.
No.
Substituted
benzaldehydes
Product Time
(min)
Yield
(%)
Melting
Point (0C)
1. CHO
N
HN Ph
Ph
20 88 210
2. CHO
Cl
N
HN Ph
Ph
Cl
25 92 250
3. CHO
F
N
HN Ph
Ph
F
20 90 252
4. CHO
OCH3
N
HN Ph
Ph
H3CO
15 94 212
Conclusion:
The CMC-CeIV
NPs were prepared by the ion exchange reaction. The inclusion phenomenon
of sodium carboxymethyl cellulose with cerric ammonium nitrate was successfully
characterized by FT-IR techniques. We have developed a simple and efficient protocol for
one-pot synthesis of 2,4,5 triaryl-imidazole derivatives from various substituted
benzaldehydes and benzil efficiently using CMC-Ce
IV as a catalyst. The high catalytic
activity of CMC-CeIV
was accounted due its Lewis acid sites. The advantages of procedure
includes simplicity of operation, good yields, wide substrate scope, no chromatographic
separation technique, an easy recovery of the catalyst and recyclability of catalyst.

A Compendium of Research Articles by Prospective Researchers 2019-20 Volume II | Page 12
References:
1. Kumar V, Kaur K, Gupta GK, Sharma AK; Eur J Med Chem 2013; 69:735–753.
2. Arshadi S, Bekhradnia AR, Ebrahimnejad A; Can J Chem 2011; 89:1403–1409.
3. Azizi S N, Shakeri P, Taghavi M, Ghaemy M Spectrochim Acta Part A; 2014; 122:482–
488.
4. Maier T, Schmierer R, Sachse B U.; Chem. Abstr. 1989; 111, 19494
5. Schmierer R, Mildenberger H,; German Patent 361464, Chem. Abstr. 1988; 108: 37838
6. Mishra R, Ganguly S.; Med Chem Res; 2012; 21(12):3929–3939.
7. Robertson D W, Beedle EE, Lawson R, Leander JD J Med Chem 1987;30(5):939–943.
8. Puratchikodya A, Doble M; Bioorg Med Chem 2007;15:1083–1090.
9. Abrahams S L, Hazen RJ, Phillips AP; J Pharm Exp Therap 1989; 249(2):359–365
10. Padala A.K., Elumalai P., Ahmed Q.N., J.ASC Comb.Sci, 2013,15(12),631-8
*****

A Compendium of Research Articles by Prospective Researchers 2019-20 Volume II | Page 13
Efficient One Pot Synthesis of Schiff’s Bases By Using CMC-CuII Catalyst
Patil Madhuri, Patil Mahesh, Joshi Mansi, Valvi Dilwarsing and Patil Ravindra M. *
Department of Chemistry, KCES‟s Post Graduate College of Science Technology and
Research, Jalgaon.425001
Abstract
CMC-CuII was prepared by metathesis strategy and characterized by FT-IR techniques. The
ensuring catalyst has been successfully applied in the one-pot four-component reaction of
various aromatic aldehyde and substituted aniline to the synthesis of Schiff‟s Bases. The
catalyst was recovered and reused for five cycles without considerable loss of activity. The
advantages of the protocol include rapid reactions with good yields and simple workup. The
synthesized compounds were characterized by FT- IR technique.
Keywords: CMC-CuII; Schiff‟s Bases; Metathesis Reaction; Multi-component reaction.
*Corresponding author: [email protected]
Introduction
Green chemistry techniques continue to grow in importance. The aim of green chemistry
involved the use of raw material obtained from renewable sources, environmentally benign
catalysts and reagents. Also involved the developments of more efficient protocols.1
A Schiff base is a compound with a functional group that contains a carbon-nitrogen double
bond with the nitrogen atom connected to an aryl or alkyl group2.
Many biologically
important Schiff base have been reported which possess antibacterial,3 antifungal,
4
antimicrobial5 and anti-HIV
6 activities. Owing to their wide range of biological advancement,
synthesis of title compounds are still of intrigue.
The interest in metal nano particles ((NPs), attributable to their high surface area, incredible
availability, high biocompatibility and low harmfulness, has developed significantly. In
addition, the high catalytic activity of metallic NPs can be accounted due to its Lewis acid
site.7
The stabilization of NPs on suitable stabilizing agents presents some advantages for
example increases in NPs reactivity, stability, selectivity, reusability, easy separation and
recovery from reaction mixture and decreased agglomeration. Multi-component reactions
(MCRs) are eco-friendly process as they obey green chemistry principles.8
Considering these facts, we have decided to synthesize Schiff bases of various substituted
benzaldehydes and aromatic amines efficiently using CMC-Cu
II as a recoverable and reusable
catalyst in ethanol as a solvent via. Multi-component reactions (Scheme 1).

A Compendium of Research Articles by Prospective Researchers 2019-20 Volume II | Page 14
Materials and Methods
All reagents used were of laboratory grade. Melting points were determined in open
capillaries. The purity of compound was checked by TLC. IR spectra were recorded on
Shimadzu FT-IR (Affinity Model) using KBr.
Preparation of Cu(II)carboxymethylcellulose (CMC− CuII
) Catalyst
The Cu(II) carboxymethylcellulose (CMC− CuII) catalyst was prepared by metathesis
reaction of copper sulphate and Na-CMC. The sky blue solid was precipitated which was left
to equilibrate in a solution for overnight. The resulting sky blue solid was separated from the
solution and washed thoroughly with distilled water. The wet CMC-CuII was dried at 70
0C in
the oven till constant weight.
General procedure for synthesis of Schiff’s base by using CMC-CuII
as catalyst:
In 100 ml beaker, a mixture of substituted benzaldehyde (10 mmol), substituted aniline (10
mmol) and CMC-CuII, (10 mg) was taken in 2 ml ethanol and stirred vigorously at room
temperature for appropriate time (Table 3). The precipitate thus obtained was filtered off and
wash with ethanol and then purified by recrystallization from ethanol to get corresponding
Schiff's base in pure and crystalline form as shown in Scheme 1.
Results and Discussion
Optimized Reaction Conditions:
To optimize the reaction condition, we performed the model reaction with different amount
of CuII-CMC catalyst loaded as shown in Table 1.
Table 1: Optimized amount of catalyst loaded
Entry Catalyst (mg) Time (min) Yield (%)
1 5 5 71
2 10 5 92
3 15 5 84
4 20 17 69
Here we found that, the 10 mg catalyst is sufficient to push the reaction forward.
The yield of product without catalyst is only about 50% and the time required was also more
i.e. about 30 min to complete the reaction.
To investigate the role of solvent in model reaction was performed in different solvent like
ethanol, water, 50% ethanol or another organic solvent as shown in Table 2.
It was observed that, when we used ethanol as a solvent the yield of product increases up to

A Compendium of Research Articles by Prospective Researchers 2019-20 Volume II | Page 15
90% and time also reduced about 10 min. Schiff base formation was increases in ethanol,
while the same reaction occurred slowly in water and another organic solvent.
Table 2: Effect of solvent on synthesis of Schiff’s base
Entry Solvent Catalyst(mg) Time(min) Yield (%)
1. Solvent free 10 30 50
2. Water 10 17 46
3. 30% aq. Ethanol 10 10 69
4. 50% aq. Ethanol 10 5 82
5. Pure Ethanol 10 5 92
6 DMSO 10 30 49
7 Toluene 10 25 52
After the study of above optimized reaction conditions were explored for the synthesis of
series of Schiff‟s base from substituted benzaldehyde and substituted aniline catalyzed by
CMC− CuII as shown in Scheme 1 and the results are summarized in Table 3.
CHO
+
NH2
N
R1
R1
R2
R2Ethanol, RT
CuIICMC
R1= -H, 2-Cl, 4-NO2, 4-Cl, 4-CH3 & R2= -H, 4-CH3, 4-Cl, 2-Cl, 4-OCH3, 4-NO2
. .
. .
Scheme 1: synthesis of Schiff’s base by using CMC-CuII as catalyst
Spectral data of compounds (1-4)
1) Olive green solid, IR (cm-1
): 1678(C=N), 1292(C-N), 1242 (C-O), 1504 (C=C aromatic),
3007(C=C-H), 2941(C-C-H).
2) Lemon Yellow solid, IR (cm-1
): 1693(C=N), 1274(C-N), 1460 (C=C aromatic),
3064(C=C-H), 2924(C-C-H).
3) Lemon Yellow solid, IR (cm-1
): 1622(C=N), 1352(C-N), 1352 (N-O), 1517 (C=C
aromatic), 3080(C=C-H), 2922(C-C-H).
4) Yellow solid, IR (cm-1
): 1691(C=N), 1296(C-N), 1624 (C=C aromatic), 3064(C=C-H),
2870(C-C-H).
A Compendium of Research Articles by Prospective Researchers 2019-20 Volume II | Page 16
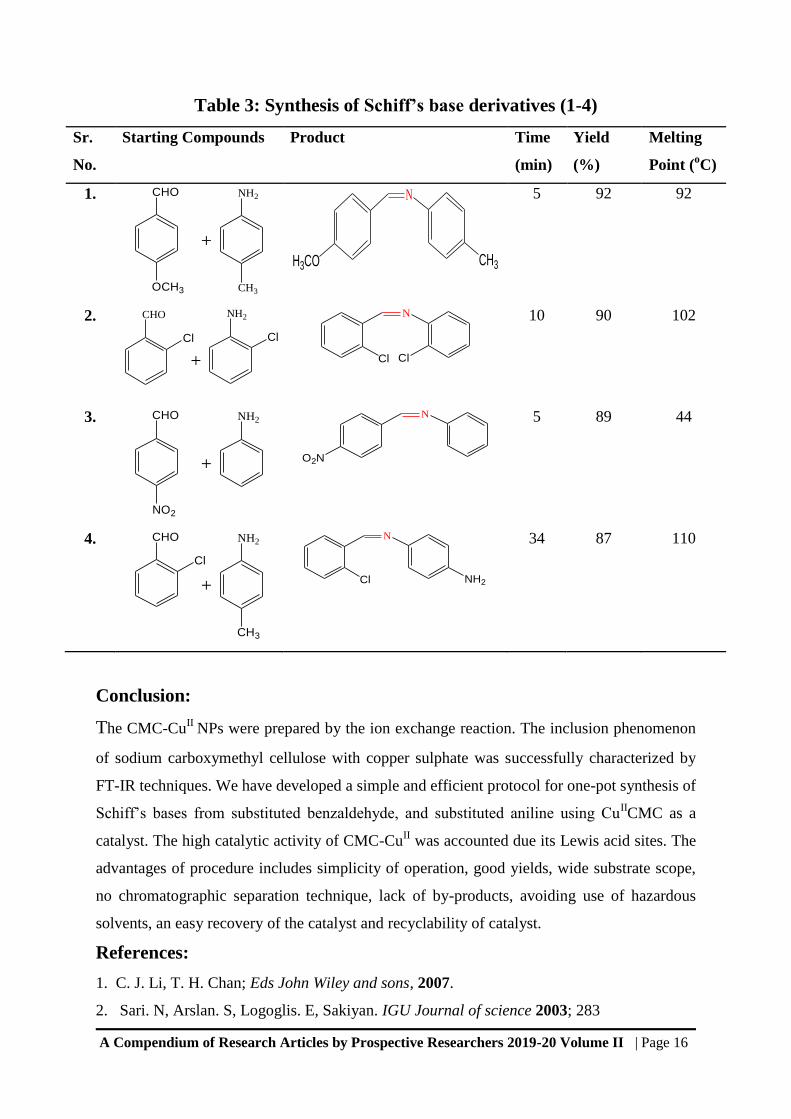
Table 3: Synthesis of Schiff’s base derivatives (1-4)
Sr.
No.
Starting Compounds Product Time
(min)
Yield
(%)
Melting
Point (oC)
1.
+
NH2
CH3
CHO
OCH3
N
H3CO CH3
5 92 92
2. CHO
+
NH2
Cl Cl
N
Cl Cl
10 90 102
3.
+
NH2CHO
NO2
N
O2N
5 89 44
4.
+
NH2CHO
Cl
CH3
N
Cl NH2
34 87 110
Conclusion:
The CMC-CuII
NPs were prepared by the ion exchange reaction. The inclusion phenomenon
of sodium carboxymethyl cellulose with copper sulphate was successfully characterized by
FT-IR techniques. We have developed a simple and efficient protocol for one-pot synthesis of
Schiff‟s bases from substituted benzaldehyde, and substituted aniline using CuIICMC as a
catalyst. The high catalytic activity of CMC-CuII was accounted due its Lewis acid sites. The
advantages of procedure includes simplicity of operation, good yields, wide substrate scope,
no chromatographic separation technique, lack of by-products, avoiding use of hazardous
solvents, an easy recovery of the catalyst and recyclability of catalyst.
References:
1. C. J. Li, T. H. Chan; Eds John Wiley and sons, 2007.
2. Sari. N, Arslan. S, Logoglis. E, Sakiyan. IGU Journal of science 2003; 283

A Compendium of Research Articles by Prospective Researchers 2019-20 Volume II | Page 17
3. Amir. M, Hasan. SM, Wadood .A. Oriental Journal of Chemistry 2002; 18(2): 351-355
4. Calis U, Yarim M, Kokasal M, Ozalp M. Arzneimittel-forschiney 2002: 52(10): 778-781
5. Karia FD, Parsania PH. C. Asian Journal of Chemistry 1999; 11(3): 991-995
6. S. Patil, S. D. Jadhav, U. P.Patil, Arch. Appl. Sci. Res.2012, 4(2), 1074-1078
7. Schiff, H. Justus Liebigs Ann. Chem. 1864, 1311.118
8. A.K.Padala,P.Elumalai, Q.N.Ahmed,J.ASC Comb.Sci,2013,15(12),631-8
*****

A Compendium of Research Articles by Prospective Researchers 2019-20 Volume II | Page 18
Synthesis of Azo Dyes by Using Grinding Method Solanke Radhika, Patil Pooja, Mahajan Samrat, Pawar Shweta and Chaudhari Rupali A.* Department of Chemistry, Post Graduate College of Science Technology and Research,
Jalgaon
Abstract
The efficient and green approach for the synthesis of azo dyes has been developed by diazo
coupling reactions of aromatic amines with β-Naphthol catalyzed by lewis acid by grinding
method at room temperature. This green methodology aims to overcome the limitations and
drawbacks of the previously reported methods. Moreover the attractive advantages of the
process include mild condition with excellent conversions, simple product isolation process
and inexpensive procedure.
Keywords: Azo dyes, Coupling reaction, Lewis acid, Green reaction.
*Corresponding author: [email protected]
Introduction
Green chemistry techniques are an alternative process to help to conserve resources and can
reduce costs. The replacement of conventional solvents with green solvent ethanol which is
harmless to health and is available in large quantities is on interesting basic approach along
this lines.1-3
The diazo coupling reactions involving aromatic diazonium salt can be regarded the most
versatile reaction in organic chemistry.4-6
Synthesis of azo dyes by grinding under solvent
free condition afforded azo dyes in 25-70% yield. In grinding three components mixture
electron doner (coupling agent), sodium nitrate and amines formed colour reaction mixture.7
We have use the AlCl3 an Lewis acid for the synthesis of Azo dyes from aromatic amines,
sodium nitrate and coupling agent at ice cold condition in water as solvent with good to
excellent yield within 5-10 min as shown in scheme 1.
Materials and Methods
All reagents used were of laboratory grade. Melting points were determined in open
capillaries. The purity of compound was checked by TLC. IR spectra were recorded on
Shimadzu FT-IR (Affinity Model) using KBr.
General Procedure for Synthesis of Substituted Azo dyes
Aromatic amine (10 mmol), sodium nitrite (10 mmol) and AlCl3 (20% of 10 mmol) as a
catalyst were taken in a beacker with ice cold condition. This cold mixture was transfer to

A Compendium of Research Articles by Prospective Researchers 2019-20 Volume II | Page 19
mortal and add coupling agent i.e. B-Naphthol (10 mmole) and then grinded for 10 min with
2 drops of water. The reaction was monitored by TLC. The solid product was obtained from
an intermediate melt and then was laid up at room temperature for 5 to 10 min. The mixture
was transferred to cold water and then was filtered off. The crude product was recrystallized
by ethanol as per scheme 1.
NH2
N
N N
OH
R
R
R
N
Aromatic amine
NaNO2Sodium nitrite
AlCl3
Aluminium trichloride
Diazonium salt
B-Naphthol
grind at cold condition
Subsituted Azo dye
Scheme 1: Synthesis of substituted Azo dyes using Grinding Method
Results and Discussions
Optimized Reaction Conditions
The reaction condition for amount of catalyst was optimized by carrying out the model
reaction of 4-Chloroaniline with sodium nitrite, aluminium trichloride, and B-Naphthol, grind
at cold condition with and without catalyst. It was observed that only 60% of the solid
product was obtained for one hour reaction time. When the reaction was performed with
Glycine as a catalyst, increase in the yield was noticed significantly as summarized in Table
1. Use of 20 mol% Glycine was sufficient to precede the reaction forward.
Higher amounts of the catalyst of the catalyst did not improve the results to a greater extent.
So, aluminium trichloride was an efficient catalyst and 20 mol% aluminium trichloride was
chosen as a quantitative catalyst for reaction, the result is summarized in Table 2.
Table 1: Optimized amount of catalyst loaded
Entry Catalyst (mole %) Time
(min.)
Yield
(%)
1 0 40-30 60
2 5 25 80
3 10 20 85
4 15 15 88
5 20 10 93
6 25 10 93

A Compendium of Research Articles by Prospective Researchers 2019-20 Volume II | Page 20
Table 2: Synthesis of substituted azo dyes
Sr.No. Starting
Compound
Coupling
Compound Product
Time
(min.)
Yield
(gm)
Melting
Point(o
C)
1.
10 93 168-170
2.
NH2
CH3
OH
N N CH3
15 89 130-132
3.
NH2
OCH3
OH
N N OCH3
10 92 136-138
4.
NH2
OH
OH
N N OH
10 90 190-194
5.
15 90 132-134
Spectral data of compounds (1-5)
IR Stretching frequency of the compounds 1 to 5
1) IR cm-1: 3434 (Ar-OH), 1618 (C=C), 1496 (N=N), 1142cm
-1(C-O)
2) IR cm-1: 3420 (Ar-OH), 1615 (C=C), 1500 (N=N), 1153 cm
-1 (C-O)
3) IR cm-1
: 3435 (Ar-OH), 1619 (C=C), 1457 (N=N), 1205 cm-1
(C-O)
4) IR cm-1
: 3445 (Ar-OH), 1620(C=C), 1486 (N=N), 1253 cm-1
(C-O)
5) IR cm-1
: 3424 (Ar-OH), 1646 (C=C), 1500 (N=N), 1121 cm-1
(C-O)
Conclusion
We have developed a green and simple method for the synthesis of substituted azo dyes from
aromatic amine, sodium nitrite, and 20 mol% aluminium trichloride. These moieties having
NH2
Cl
OH
OH
N N Cl
OH
OH
OH
CH3
NH2
COOH
OH
N N
OH
COOH
CH3

A Compendium of Research Articles by Prospective Researchers 2019-20 Volume II | Page 21
broad application scope in pharmaceutics. All the products were simply purified by
recrystallization from water and hence the method is free from column chromatographic
purification. Mild reaction conditions, use of green solvent, high atom economy and the lack
of by-products are among the other advantages of this method.
References
1. L.R. Alredha, A.L. Rubaie, and R. Jameel M Hessn E. Journal of chemistry 9(1),
465 – 470(2012).
2. M. kordac and V. Linek. Ind Eng. Chem. Res. (2008), 47,
3. G. A. Hill, Ind. Eng. chem, Res, (2006), 45,5796,
4. E. N. Abrahart, Dyes and and their intermediates, New York(1977), 1-12
5. R.L.M .Allen, Color Chemistry, London (1971), 11-13
6. S. Patai, Chemistry of diazonimu and Diazo group; Part 1,Wiley Blackwell
7. H. Zol linger, Colour chemistry, Synthesis, properties and application of organic
dyes and pigments, 3rd end. Wiley-VCH,Weinheim(2003)
*****

A Compendium of Research Articles by Prospective Researchers 2019-20 Volume II | Page 22
MICROBIOLOGY

A Compendium of Research Articles by Prospective Researchers 2019-20 Volume II | Page 23
Studies on Effect of Mono-Sodium Glutamate (MSG) On Growth of
Microorganisms
Patil Jayesh M , Patil Chetan V, Walde Devesh , Patil Pankaj G and Patil Sandip N*
Department of Microbiology, KCES‟s Post Graduate College of Science, Technology and
Research, Jalgaon
Abstract
Monosodium glutamate (MSG), the sodium salt of the non-essential amino acid-glutamic
acid, commonly known as Ajinomoto, is the most widely used flavour enhancer. Though
there are certain claims regarding the safety in the usage of Monosodium Glutamate in food,
conflicts do exist among the public and the Governing bodies. The present study, focus on the
evaluation of effect of MSG against two species of Gram-negative bacteria. The growth
kinetics of the organism under MSG was studied and was compared with non-monosodium
glutamate growth curves. The Bacterial species shows high degree of tolerance to MSG also
effect of different pH and temperature condition on digestion of MSG was evaluated.
Keywords- Ajinomoto, monosodium glutamate (MSG)
*Corresponding author: [email protected]
Introduction
Food industries employ the addition of certain agents, to preserve the food or enhance the texture,
color or flavor, without deteriorating the food constituents and its quality. Traditionally, ingredients
high in free amino acid are used to improve the palatability. The IUAPC name of compound is
Sodium 2-Aminopentanedioate also known as Ajinomoto or Monosodium glutamate (MSG) is used in
food for sour flavor. (Tushar, 2017) The U.S. Food and Drug Administration (FDA) have declared
MSG to be a “Generally Recognized as Safe” (GRAS) ingredient. Under normal conditions, humans
can metabolize relatively large quantities of glutamate, which is naturally produced in the gut by
exopeptidase enzymes in the course of protein hydrolysis. The use of MSG as a food additive and the
natural level of glutamic acid in foods are not toxicological concerns in humans. A popular belief is
that large doses of MSG can cause headaches and other feelings of discomfort, known as „Chinese
Restaurant Syndrome‟ (CRS), but double-blind tests fail to find evidence of such a reaction. The
European Union classifies it as a food additive permitted in certain foods and subject to quantitative
limits. Although we are still remain oblivious to effect of Ajinomoto (Monosodium glutamate (MSG)
on bacteria. The present study was focused to evaluate the effect of Ajinomoto on isolated organism
from human gut flora to give better understanding of its effect on growth of microbes.
Materials and methods
Collection of sample
The Monosodium glutamate was procured from local market of Jalgaon, Maharashtra, India.

A Compendium of Research Articles by Prospective Researchers 2019-20 Volume II | Page 24
Properties of MSG Monosodium glutamate (MSG, also known as sodium glutamate; IUPAC name-
Sodium 2- aminopentanedioate is the sodium salt of glutamic acid, one of the most abundant naturally
occurring non-essential amino acids (Tushar, 2017)
Isolation of microbes from human gut flora
Stool sample of three month old baby was obtained aseptically and enriched in 100 ml nutrient broth
at 370C for 24 hrs in incubator. To isolate the gut flora the loopful aliquot from enriched broth was
streak on the sterile Nutrient agar plate and incubated the plates at 370C for 24 hrs in incubator.
Characterization of isolates
Isolate were characterized according to the procedures given in Aneja KR. All strains were subjected
to the biochemical test and carbohydrate fermentation (Glucose, mannitol, sucrose)
Effect of Monosodium Glutamate on Growth of Isolated organism -
Four flasks containing 100 ml of nutrient broth and 1% of Monosodium Glutamate were inoculated
with 1ml broth culture of Isolates A, B, C and D respectively. These flask were incubated for 24 hrs at
370C and growth was measured and 600nm.
Tolerance of isolates to different concentrations of Monosodium Glutamate
To find out the tolerance to Monosodium Glutamate concentrations the isolates subjected to different
concentration prepared in Nutrient broth were incubated for 24 hrs at 37 0
C and growth was
measured and 600nm .
Effect of temperature on organisms in presence of Monosodium Glutamate
The isolates were subjected to different temperature such as 37°C, 45 °C, 50°C and incubated for 24
hrs then subjected to spectrophotometer analysis.
Effect of pH on organisms in presence of Monosodium Glutamate
The pH of medium was adjusted 5, 6,7,8 and 9 using 0.1N hydrochloric acid (HCl) and 0.1N Sodium
hydroxide (NaOH) . The medium was incubated at 37°C for24hr then subjected to spectrophotometer
analysis.
Results and Discussions
The present study was aimed to isolate microbes from human gut and to evaluate the effect of various
environmental factors such as pH, temperature and different concentrations of Monosodium
Glutamate on growth kinetics of these microbes.
Two microbial isolates were isolated from human gut sample and identified biochemically as
Escherichia coli Pseudomonas aeruginosa respectively.
Effect of Monosodium Glutamate Concentration on growth of isolates
It was found that Monosodium Glutamate does not inhibit growth of the isolates at any concentration.
Increasing concentration of Monosodium Glutamate lead to a decrease in the number of bacteria
recovered but not restricts the growth completely. Higher growth rate was observed up to 500 mg/L of
concentration and moderate growth was observed at 500-750 mg/L. The growth was completely
restricted at 1000 mg /L of monosodium glutamate concentration.

A Compendium of Research Articles by Prospective Researchers 2019-20 Volume II | Page 25
No significant Effect of Monosodium Glutamate was found on growth kinetics of isolates when
grown in presence and absence of monosodium Glutamate for 48 hrs. Also the growth at different
temperature and pH in presence of monosodium Glutamate affected the growth of isolates.
Table1.0 Effect of Monosodium Glutamate on growth kinetics of isolates
Growth Response
Presence of MSG Absence of MSG
Time
Hours
Escherichia
coli
Pseudomonas
aeruginosa
Escherichia
coli
Pseudomonas
aeruginosa
0 0.05 0.05 0.05 0.05
6 0.19 0.19 0.17 0.35
12 0.24 0.09 0.22 0.15
18 1.27 1.21 1.55 1.31
24 1.55 1.53 1.71 1.69
30 1.72 1.71 1.72 1.72
36 1.76 1.73 1.78 1.81
All value recorded as OD at 600nm
Table 2.0 Growth of Isolates in different pH in presence of MSG
pH Escherichia coli Pseudomonas aeruginosa
5 1.351 1.388
6 0.852 0.815
8 1.313 1.630
9 0.198 0.299
Table 3.0 Optical density (600nm) of Isolatesat different Temperature in presence of MSG
Temperature Escherichia coli Pseudomonas
aeruginosa
RT 1.449 2.005
370C 0.108 0.114
450C 0.424 0.455
500C -- --
Conclusion
Current study focuses on effect of MSG on human gut flora.
The organisms were isolated from human gut in presence of MSG showed accelerated growth as
compared to growth without monosodium glutamate.
Isolates may have taken MSG in metabolic pathway accelerating its growth
The isolates showed the high degree of tolerance to MSG at elevated temperature, pH.

A Compendium of Research Articles by Prospective Researchers 2019-20 Volume II | Page 26
References
1. Commission of the European Communities, L-glutamaic acid and its salts. (Report of the
Scientific Committee for Food: 25th Series. No. EUR 134116, 1991)
2. Curtis RI (2009) Umami and the foods of classical antiquity. The American Journal of
Clinical Nutrition 90: 712S-718S.
3. Halpern BP (2000) Glutamate and the flavor of foods. Journal of Nutrition 130: 910S-4S.
4. Monosodium glutamate: (2003).A Safety Assessment. Food Standards Australia New
Zealand.
5. Monosodium Glutamate:( 2015) Antibacterial Impact Indian Journal of Applied Microbiology
ISSN 2454-289X, ISSN (Print): 2249-8400 Volume 18 Number, pp. 28-33
6. Nakamura Jun, Wachi Masaaki (2008) Mechanism of L-Glutamic Acid Fermentation by
Corynebacterium Glutamicum. Foods Food Ingredients J Jpn. 213(12): 1
7. Tushar Kanti Bera (2017) Effects of monosodium glutamate on human health World Journal
of Pharmaceutical Sciences ISSN (Print): 2321-3310 (5): 139-144
8. Wind Mueller, H.G.; 1980 Spaeth, A. E. Respiratory Fuels and Nitrogen Metabolism in Vivo
in Small Intestine of Fed Rats. Quantitative Importance of Glutamine, Glutamate, and
Aspartate. Journal of Biological Chemistry, 255,107–112
*****

A Compendium of Research Articles by Prospective Researchers 2019-20 Volume II | Page 27
Larvicidal activity of proteins extracted from Bacillus Subtilis against
vector mosquitoes Rathod Kanchan A, Sule Lalita S, Suryawanshi Krutika A, Patil Dhanashri R and
Patil Sandip N*
Department of Microbiology, KCES‟s Post Graduate College of Science, Technology &
Research, Jalgaon
Abstract
Mosquito larvicidal activity was rendered by Bacillus species was found to be effective in
control of the mosquito larvae. The extracellular protens from the isolates were extracted and
tested for its mosquito larvicidal activity against larvae of Aedes mosquito. The proteins were
evaluated for its toxicity and the percentage mortality against the larvae was determined. The
result revealed that 80 % mortality against ades at 200 mg, This study concludes that non
spore formers of common microbial isolates from the natural environment were also able to
kill the mosquito larvae through their proten which are non-toxic to human population.
Keywords Bacillus, Aedes, larvicidal activity etc.
*Corresponding author: [email protected]
Introduction
Mosquitoes transmit disease agents which are responsible for more than 500 million clinical
cases estimated by the World Health Organization. The increase in number of resistant
varieties of mosquitoes, ineffectiveness of chemical insecticides, necessitates the
development of vector control strategies. Thus microbial insecticides can be considered as
alternatives to chemical insecticides. Mosquitoes are the disease causing vectors within
almost all tropical and subtropical countries are responsible for the transmission of
pathogens causing some of the most life threatening and debilitating diseases of man, like
malaria, yellow fever, dengue fever, chikungunya, filariasis, encephalitis, etc. (Chandra et al
2008) There is no specific treatment for these vector borne diseases. There is provocative
interest in research for larvicidal compound from natural sources. (Kishore et al 2006) The
indiscriminate use of neurotoxic insecticides problems to non target organisms and
insecticides resistance. The first insecticidal component of Bacillus Subtilis used in mosquito
control is acting by the production of toxin during sporulation and vegetative stages of
Bacillus subtilis.Control of such diseases is becoming increasingly difficult because of
increasing resistance of mosquitoes to pesticides (Plearnpis, 2001). Control of such diseases
is becoming increasingly difficult because of increasing resistance of mosquitoes to
pesticides .Therefore the need for alternative, more effective and environmental friendly

A Compendium of Research Articles by Prospective Researchers 2019-20 Volume II | Page 28
control against mosquitos become obligatory. In Present study soil samples from garden
were collected and used for screening of bacteria. In this paper attempt has been made to find
out alternative, more effective and environmental friendly control against mosquito's by
using microbial derived larvicidal compound.
Material and Methods
Collection of mosquitos' larvae
Larvae were collected from various breeding habitats such as around households, waste
water, store waters, ponds, ditches, plastic containers .Larvae density was calculated by the
following
Larvae density= Number of Larvae collected
Number of dips
Collected larvae were maintained in plastic jars. Larvae collected from fields were
morphologically identified according to the classification keys provided in photographic
manual of mosquito identification
Soil and water sample collection
Soil and water samples were collected from P. G. College campus, Maharashtra. Total 20
samples comprising soil and water samples were collected.
Screening and Isolation of microorganisms
The soil and water samples were enriched in Nutrient broth & incubated at 370C for 48h after
enrichment period; one loopful broth was inoculated on to Nutrient agar medium and
incubated at respective temperatures. Colonies thus obtained were isolated, identified and
were utilized to study their mosquito larvicidal activity.
Maintenance of culture
Isolate was maintained in triplicates on nutrient agar medium and incubated at 370C for 24
h. Then slants were stored for further investigation.
Larvicidal assay
Isolated bacteria were inoculated in sterile nutrient broth and incubated for 2 weeks. The
enriched broth was centrifuged at 5000 rpm for 20 minutes. The cell free supernatant
obtained was used for testing its toxicity towards mosquito larvae. For Preliminary testing ten
larvae of mosquito vector Aedes were introduced in each of the test solution as well as the
control. For each of the dose three replicates were maintained at a time. All the isolates were
incubated at room temperature up to 48hrs. Percentage mortality of effective isolates was
determined after 24hrs and toxicity assay was carried out for all the bacterial isolates and
water was kept as a control

A Compendium of Research Articles by Prospective Researchers 2019-20 Volume II | Page 29
Extraction of Metabolite from the Bacterial Isolates
The larvicidal compounds were extracted from bacterial isolates by filtering Broth and then
centrifuged at 15000 rpm, for 20 min to obtain cell free supernatant. Equal volume of ethyl
acetate was added to the cell free supernatant and kept under shaker conditions for 1 hour.
Metabolite was extracted as middle layer after allowing the mixture to settle in separating
funnel. The layer of secondary metabolite was collected. Ammonium sulphate precipitation
of extracted metabolite was done. Purification was performed by dialysis method.
Results and Discussion
Five bacterial isolates were isolated and used for larvicidal activity. The effective isolate were
identified based on their morphological and Biochemical characteristics.
Determination of larvicidal activity
For the screening 13 microbial isolates were used .The isolate was considered most toxic
strain ensuring mortality rate was 97% at 12 hrs exposure.
Evaluation of larvicidal Activity of crude extract of Bacillus Subtilis
Table 1. Determination of larvicidal Activity
Sr. No.
Concentration (mg) Mortality
2 Hrs. 4 Hrs. 8 Hrs. 12 Hrs.
1 50 0 0 0 35
2 100 0 0 0 50
3 150 0 0 40 60
4 300 0 0 55 80
5 500 0 0 65 97
It is evident from the Table 1 that the mortality rate is dependent on concentration of protein
more than 50 %mortality is considered as effective concentration. Lowest activity was
recorded at 50 mg which on increasing ten times concentration is reached to maximum.
Conclusions
An efficient larvicidal culture was isolated from soil sample.
The effective isolate was partially characterized.
The microbes were used for their larvicidal activity to control of mosquito larvae.
This study concludes that non spore formers of common microbial isolates from natural
environment were also able to kill mosquito larvae through their metabolites which are non toxic
to human population.

A Compendium of Research Articles by Prospective Researchers 2019-20 Volume II | Page 30
References
1. Chandra G, Bhattacharjee I, Chatterjee SN, et al. 2008. Mosquito control by larvivorous fish.
Indian Journal of Medical Research, 127 PP13-27
2. Kishore D, Ashis KM, 2006. Assessment of mosquito larvicidal potency of cyclic lipopeptides
produced by Bacillus subtilis strains. Acta Tropica, 97(2) 168-173
3. Plearnpis L, Haruyuki A, Sakol P, et al. 2001. Isolation of bacterial strains colonizable in
mosquito larval guts as novel host cells for mosquito control. Journal of Bioscience and
Bioengineering, 92(4) 342-345
*****

A Compendium of Research Articles by Prospective Researchers 2019-20 Volume II | Page 31
Effect of Environmental Stresses on Food Borne Microbes Wani Bhagyashri, Mahajan Savita, Dusane Bhuvneshwari Ahire Sunayana and
Patil Sandip N*
Department of Microbiology, KCES‟s Post Graduate College of Science, Technology &
Research, Jalgaon
Abstract
Some microorganisms can induce adaptive responses to environmental stresses, which can
enhance their tolerance to these stresses and may promote persistence under adverse
conditions. Stress responses of food borne pathogens can have profound effects on their
survival in foods. The exposure to sub lethal stress may produce a spectrum of adaptive
responses for various stresses like chemical and physical like pH, temperature salt and UV
light effect shows microbial tolerance indicate that variation in the magnitude for each
parameter studied. Understanding the mechanisms underlying the microbial responses to
different stresses will improve the effective use of intervention strategies to inhibit the
survival of pathogens in foods.
Keywords: Food borne, Stress, Stress Response,
*Corresponding author: [email protected]
Introduction
Microorganisms play an important role in production, storage and consumption of foods.
They are found in water, air, soil and in foods. Micro-organisms also perform useful
functions in some branches of the food industry. One of the major limitations is
microorganisms cause contamination of food that may cause spoilage. (Hurst,1977)
Similarly, when food is exposed to room temperature and not refrigerated, it may get spoiled,
due to the occurrence of micro-organisms. Foodborne pathogens face a broad spectrum of
stresses in all links of the food chain. (World Health Organization, 2015) During traditional
food processing microbial cells are more likely to be killed than injured or stressed.
Microorganisms can tolerate small changes in environmental parameters through inducing
adaptive responses. Among the known foodborne outbreaks, there is an increasing
involvement of stress-adapted strains, which are difficult to control with traditional
intervention strategies. (Bouwknegt, et al. 2017) Adaptive responses of foodborne pathogens
to stresses are thus of paramount significance in food safety. Stresses to these
microorganisms in foods during processing include physical stresses, such as heat, high
pressure, desiccation, and irradiation, chemical stresses, such as acids, salts, and oxidants,
and biological stresses, such as microbial antagonism.

A Compendium of Research Articles by Prospective Researchers 2019-20 Volume II | Page 32
Methods and Materials
Sample Collection- the Mix fruits pulp, cheese, Bread was purchased from local market.
Isolation and Screening of bacteria enrichment
For the isolation Sterile Nutrient Agar plate are prepared. The sample was serially diluted
(10-10) in sterile saline solution.1ml of appropriate dilution streaked on Nutrient agar plated
and Incubated the plate at 370
C for 24-48hrs.
Fig 1. Sample Collection-Mix Fruit Pulp, Cheese, Bread
Acid Tolerance pH
Acid Tolerance was studied by sterile nutrient agar medium adjusted 1.0 pH 3 to 10. With 0.1
N HCl or 1% NaOH. 0.1 ml culture suspension of each isolate was spread on the respective
Plates. All the plates are incubated at 370C for 24 hrs. Isolates which were growing on agar
were considered to be acid tolerant strains.
Temperature Tolerance The temperature tolerances was determined using sterile nutrient agar medium plates
inoculated with 0.1ml culture suspension of each isolate and were incubated at respective
temperature.
Salt tolerance
Sterile nutrient agar medium adjusted to NaCl concentrations from 0.5to 3.0% 0.1ml culture
suspension of each isolate was spread on the respective plate.
UV Radiation
Sterile nutrient agar plates were exposed to UV light in chamber for varying time interval (30
to 180 sec.) a set for control. Then above plates were incubated 300 C for 24 hrs.
Results and Discussions
Primary screening of isolation Bacteria
From different samples, a total of 3 isolates were obtained. The isolate was identified by
morphological characteristics and gram staining as per procedure given by Aneja. The
colonies were randomly selected and identified as Escherichia coli, Salmonella typhimurium,
Listeria monocytogenes
A Compendium of Research Articles by Prospective Researchers 2019-20 Volume II | Page 33
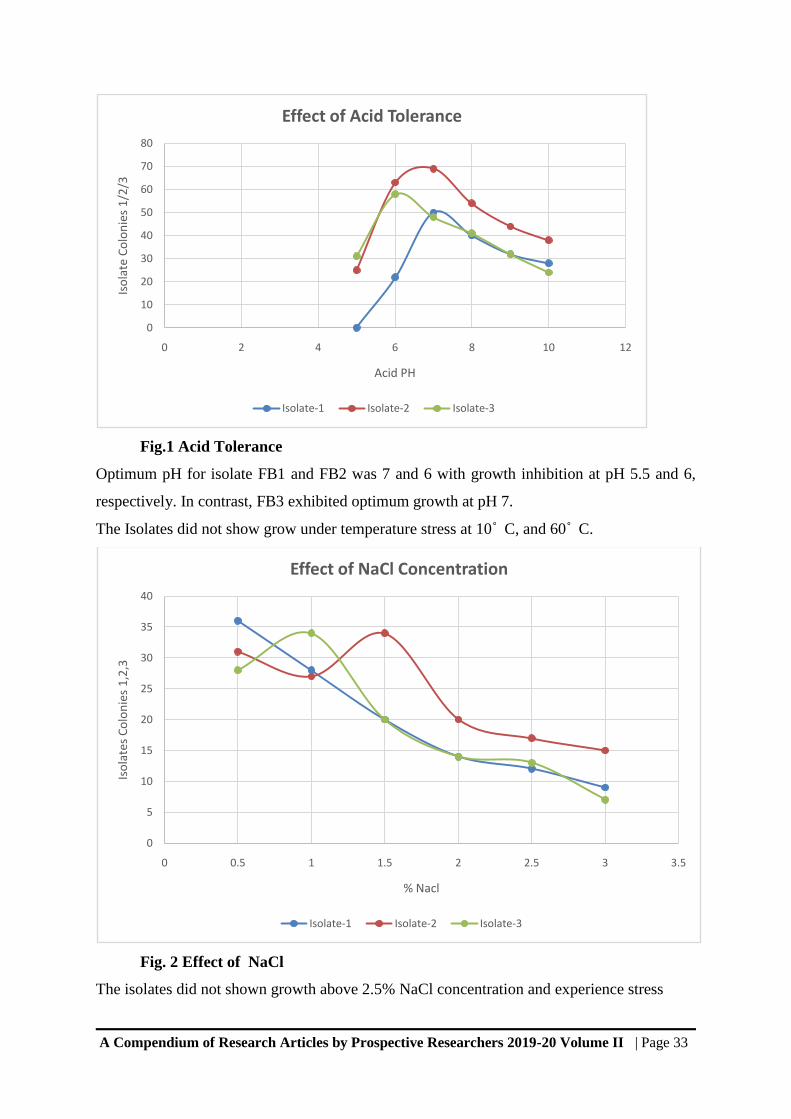
Fig.1 Acid Tolerance
Optimum pH for isolate FB1 and FB2 was 7 and 6 with growth inhibition at pH 5.5 and 6,
respectively. In contrast, FB3 exhibited optimum growth at pH 7.
The Isolates did not show grow under temperature stress at 10˚ C, and 60˚ C.
Fig. 2 Effect of NaCl
The isolates did not shown growth above 2.5% NaCl concentration and experience stress
0
10
20
30
40
50
60
70
80
0 2 4 6 8 10 12
Iso
late
Co
lon
ies
1/2
/3
Acid PH
Effect of Acid Tolerance
Isolate-1 Isolate-2 Isolate-3
0
5
10
15
20
25
30
35
40
0 0.5 1 1.5 2 2.5 3 3.5
Iso
late
s C
olo
nie
s 1
,2,3
% Nacl
Effect of NaCl Concentration
Isolate-1 Isolate-2 Isolate-3

A Compendium of Research Articles by Prospective Researchers 2019-20 Volume II | Page 34
Table .1 Effect of UV Radiation
Time [Sec.]
Number of organisms survive after UV treatment
FB1 FB 2 FB3
30 32 48 36
60 24 43 28
90 22 19 20
20 3 14 13
150 8 9 11
180 1 7 6
Isolate exhibited maximum resistance to UV light with no inhibition till 3 mins of UV
exposure, respectively
Conclusion
Food borne pathogenic bacteria have adapted to face the challenges of changing
environment in the form of the stress.
References
1. Bouwknegt, M (2017) Disease burden of food related pathogen in the Netherlands.
Retrieved from National Institute for public Health and Environment.
2. Humphrey T (2004) salmonella, stress responses and food safety. Nature Rev
Micribiol2:504-509
3. Hurst A (1977) Bacterial injury: a review. Can J Microbial 23:935-944
4. Scharff, R.L. (2010). Health related costs from foodborne illness in the United States.
Produce safety project, Georgetown University, Washington, DC.
5. World Health Organization (2015).WHO estimates of global burden of foodborne
disease: foodborne disease burden epidemiology reference group 2007-2015.
******

A Compendium of Research Articles by Prospective Researchers 2019-20 Volume II | Page 35
Studies on Bioethanol Production Using Orange Peel Dusane Aishwarya R, Sonawane Diksha Y, Patil Rachana S, Neve Vina and Patil Sandip N*
Department of Microbiology, KCES Post Graduate College of Science, Technology &
Research, Jalgaon
Abstract This paper deals with the development of a citrus peel waste biorefinery that employs low
environmental impact technologies for production of ethanol. The present study focuses on
production of second generation bioethanol, which is distinguish from the first generation and
subsequent generations of biofuels by its use of lignocellulosic biomass as raw material.
Orange (Citrus sinensis) peel waste was used as substrate for bio-fuels production. The
fermenting microorganisms obtained through screening of microorganisms to optimize its use
of xylose accumulated in the hydrolysate. The isolation and characterization of stress tolerant,
high potential ethanol producing yeast strains from various fruit peel was done. Yeast from
pineapple, orange, grape, wine have been isolated, characterized on the basis of
morphological and physic-chemical characters. Optimization for various physical and
chemical factors for production of bioethanol by yeast was done. The isolation and
cultivation of yeast in appropriate medium has been carried out using the orange peel as
substrate the results reveals that temperature 40 0
C and pH 4.0 give maximum yield.
Keyword: bioethanol, yeast, orange peel, alcohol etc
*Corresponding author: [email protected]
Introduction
Pollution and fuel crisis are two major problem of developing India. Bioethanol may be used
as alternative of fossil fuel. Bioethanol is free of sulphur and its carbon is of vegetable origin,
it does not contribute the global warming. A biofuel alternative to the fossil fuels used to
power industries would aid in the reduction of greenhouse gases. The production of cellulosic
ethanol made from citrus fruit peels makes a more efficient alternative to gasoline. The
pectin, sugars, seeds, and cellulose of the orange peel is used to create the ethanol fuel. Citrus
fruits are renewable and constantly demanded, making them more accessible than gasoline.
Companies in agriculture production can use citrus peel ethanol as fuel for trunks and
machinery. „Their own products‟ waste can then serve two purposes to businesses, fuel and
food. Companies who produce the citrus fruits should convert the peels into usable ethanol
fuel to power their machinery used in production. Also, the ethanol fuel can be produced for
other companies to use as a substitution to gasoline. Businesses then can sell citrus ethanol

A Compendium of Research Articles by Prospective Researchers 2019-20 Volume II | Page 36
along with the fruits.
Materials and Methods
Isolation of microorganism (Yeast)
Different samples (Grapes, Orange, Wine Bread and Soil) were collected from local market
and surrounding. One gram of each sample was inoculated in 250 ml YEPD broth at 30º C
for 3 days. After 3 days incubation, 100l of suspension was spread on a plate containing
YEPD agar. The plates were incubated at 30º C for 3 days. After incubation, the single
colony formed was picked, and cells were observed under a microscope.
Preparation of Orange peels for ethanol production
Fruit samples of oranges were collected from local market and their peels were extracted.
Orange peels were washed and, cut in small pieces and kept it in the sunlight for few days.
Substrate Pretreatment
The orange peel was subjected to acid pretreatment which involves the use of sulfuric, nitric
or hydrochloric acids to remove hemicelluloses components and expose cellulose for
enzymatic digestion while alkali pretreatment refers to the application of alkaline solutions to
remove lignin and various uronic acid substitutions on hemicelluloses that lower the
accessibility of enzymes to the hemicelluloses and cellulose. The acid hydrolysis is used for
physic-chemical pretreatment for substrate.1N HCL was prepared and the substrate (dried
orange peels) was soaked in it for overnight. After overnight incubation substrate were
separated from HCL and wash with distill water to remove the remaining HCL content. After
washing with water, the substrate were autoclaved at 121º C for 20 minutes. After
autoclaving the Substrate were used for ethanol production.
Preparation of Growth Medium
The growth medium (Inoculum Medium) prepared for ethanol production consists of glucose (20 g/l),
Ammonium sulphate (0.8 g/l), KH2PO4 (0.8 g/l), Magnesium sulphate (4 g/l), Yeast extract (3.2 g/l),
in the production medium Glucose as carbon resource is replaced with orange peels in 250 ml of
conical flask containing 100 ml of distilled water(pH-5.5). The flasks were autoclaved at 121°C for 20
minutes. The cells of Saccharomyces cerevisiae were aseptically cultured in inoculum Medium and
incubated at 30°C for 24hrs.
Ethanol production
Using the above prepared growth medium the isolates were process for ethanol production.
The substrates concentration was chosen from 5 to 50%. After incubation every flask were
centrifuge to remove cell debris and kept for distillation process.
250 ml of production medium was prepare using Ammonium Sulphate (0.8 gm/lit), KH2PO4

A Compendium of Research Articles by Prospective Researchers 2019-20 Volume II | Page 37
(0.8 gm/lit), MagnessiumSulphate (4gm\lit), yeast extract (3.2 gm/lit) and Substrate (orange
peels) as carbonresource in 250 ml distilled water. Media were autoclaved at 121º C for 20
minutes.After autoclaving, media were cooled and inoculated with 5% of isolated test culture.
The flasks were incubated anaerobically for 8 to 10 days. The anaerobic condition was
maintained by using Teflon tape for coating cotton plugged flasks. After incubation of 8 to 10
days the fermented mixture were centrifuge at 5000 rpm for 10 minute. The supernatant were
collected and debrise were discarded. The supernatant were subjected to the distillation at
78.5º C (boiling point of ethanol).Distillate is collected and further checked for qualitative
estimation. Qualitative estimation of ethanol was done by Potassium dichromate method
Results and Discussions
Orange peels are an efficient material for production of ethanol rather than burning it with
other agricultural wastes. Ethanol production from orange peels can satisfy the growing need
of ethanol; present study can be economical and also reduce the agricultural waste.
Primary Product Isolation
The raw ethanol yield was measured by ethanol assay using potassium dichromate method.
Also the odour and colorless appearance was checked and also showed flammable property.
Potassium Dichromate Test
The samples were withdrawn in every 24hrs and the changes in ethanol concentration were
qualitatively estimated and at the end of fermentation at seventh day changes in ethanol
concentration were quantitatively estimated using specific gravity method and it was seen
that, Sacchromyces cerevisiae used orange peels efficiently for ethanol production in
anaerobic condition than in aerobic condition and as substrate orange peels showed highest
ethanol production.
Conclusion
The orange peels are an efficient material for production of ethanol rather than burning it
with other agricultural wastes. Ethanol production from orange peels can satisfy the growing
needs of ethanol. Present study can be economical and also reduce the agricultural waste.
References
1. Gupta, N., Tripathi, S., Balomajumder, C.: Characterization of pressmud: a sugar industry
waste. Fuel 90, 389 (2011)
2. Kumar, A., Negi, Y.S., Choudhary, V., Bhardwaj, N.K.: Characterization of cellulose
nanocrystals produced by acid-hydrolysis from sugarcane bagasse as agro-waste. J. Mater.
Phys. Chem. 2(1), 1–8 (2014)

A Compendium of Research Articles by Prospective Researchers 2019-20 Volume II | Page 38
3. Liao, J.C.; Mi, L.; Pontrelli, S.; Luo, S. Fuelling the future: Microbial engineering for the
production of sustainable biofuels. Nat. Rev. Microbiol. 2016, 14, 288–304
4. Marin, F.R.; Soler-Rivas, C.; Benavente-Garcia, O.; Castillo, J.; Perez-Alvarez, J.A. By-
products from different citrus processes as a source of customized functional fibres. Food
Chem. 2007, 100, 736–741
5. Parameswaran Binod, K.U. Janu, Raveendran Sindhu,Hydrolysis of Lignocellulosic Biomass
for Bioethanol Production. Ashok Pandey Centre for Biofuels, Biotechnology Division,
National Institute for Interdisciplinary Science and Technology, CSIR, Trivandrum - 695 019,
India
6. Umamaheswari, M., Jayakumari, M., Maheswari, K., Subashree, M., Mala, P., Sevanthi, T.,
and Manikandan, T. Bioethanol Production From Cellulosic Materials International Journal of
Current Research Vol. 1, pp. 005-011, January, 2010. ISSN: 0975-833X. PG and Research
Department of Botany, Arignar Anna Government Arts College, Villupuram – 605 602,
Tamilnadu, INDIA
******

A Compendium of Research Articles by Prospective Researchers 2019-20 Volume II | Page 39
Studies on Bio-plastic Producing Microorganisms Pawar Vandana B., Patil Dipali D, Patil Tejal S., Chavan Shubhangi S. and Patil Sandip N*
Department of Microbiology, KCES‟s Post Graduate College of Science, Technology &
Research, Jalgaon
Abstract
Bioplastic is a biodegradable material that come from renewable sources and can be used to
reduce the problem of plastic waste that is suffocating the planet and polluting the
environment. Polyhydroxyalkanoates (PHA) are storage substances produced and stored by
many cells, plants and bacteria only in times when they lack important nutrients. A particular
property of these plastics-related biopolymers is that their composition and hence their
material properties can be regulated by the fermentation process. A PHB producing bacterial
isolate have been isolated from soil samples collected from industrial effluent sewage. Initial
characterization was done on basis of Sudan black dye. Positive test isolates partially
characterized by procedure laid down by Aneja (2013) further test performed as per
procedures. Results show 28 mg PHB produced per 100 ml. The production of PHB also
depends on parameters like pH, carbon source, incubation time and NaCl concentration.
Some organisms are able to combine hydroxy carbonic acids to polyesters due to their
specific chemical structures.
Keywords: PHA, Bioplastic,Biodegradation , Polyhydroxyalkanoates
*Corresponding author: [email protected]
Introduction
The amount of plastic produced using petrochemical materials increases every year and the
exact time needed for its biodegradation is unknown. Therefore, they contribute to
environmental pollution. Biodegradable plastic (i.e. PHB) offers a good alternative to the
conventional plastic but its production cost is much higher than conventional plastic.PHBs
can be produced using microbial isolates and cost effective raw materials like potato waste
which do not find any valuable application. Use of potato waste for PHB production may
significantly reduce the production cost. Over 150 different PHAs are known, and there are
good reasons for such a large variety. Cells produce hydroxy carbonic acids from standard
intermediary products of the energy metabolism and fatty acid synthesis. When key
components in the food supply are lacking, organisms and cells turn to alternative metabolic
pathways and form PHAs. Specific metabolic pathways are chosen on the basis of the carbon
source provided to the cells, which leads to the creation of PHAs with different chemical
structures. This principle is almost ideal for controlling the chemical composition and the
characteristics of PHAs through biotechnological processes. When long-chain carbon sources

A Compendium of Research Articles by Prospective Researchers 2019-20 Volume II | Page 40
such as palm oil are used, microorganisms will produce a larger number of PHAs consisting
of short-chain 3-hydroxybutyrate and long-chain 3-hydroxyhexanoate molecules.
Materials and methods
Collection of samples
The samples were collected from waste water samples including industrial effluent, domestic
sewage and transfer it into sterile container (Mikkili I, Karlapudi AP, Venkateswarulu TC, et
al. (2014).
Enrichment and isolation of sample
The soil samples (1g each) were directly inoculated in LB Medium (100 ml) and incubated at 370 C
temperature for 3 days.
Isolation of Microorganisms
The isolation was done on LB agar plates and then the plates were incubated at room
temperature for 24hrs. The representative isolated bacterial colonies were picked up, purified
and preserved on nutrient agar slants till further use. First selection of isolates in case of PHB
production is depends on its colony appearances. White colored or mucoid colonies can be
assumed as PHB positive. (Mikkili I, Karlapudi AP, Venkateswarulu TC, et al. 2014)
Rapid screening of isolates for PHB positive bacterial isolates
All isolates to be screened for PHB production were taken and these isolates were subjected
qualitatively tested for PHB production following viable colony staining method of screening
using Sudan black B dye (Jaunet al., 1998).
Ethanolic solution of (0.05%) Sudan Black B was spread over the colonies and the plates kept
undisturbed for 30 minutes. They are washed with ethanol (96%) to remove the excess stain
from the colonies. The dark blue coloured colonies were taken as positive for PHA
production. Of all the isolates strongly positive for the viable colony staining and were
selected for further experimentation.
Biochemical Characterization of Isolates
Isolate was characterized according to the experiment discussed in Aneja KR. All strains
were subjected to the biochemical test and carbohydrate fermentation (Glucose, mannitol,
sucrose)
Production and Quantification of crude Bioplastic (PHB)
The strongly Sudan Black B positive isolates were subjected to production of Bioplastic.It
was performed according to Singh and Parmar by sodium hypochlorite-chloroform method;
the five selected isolates were cultured in Minimal Davis Medium at 37 °C for 3 days. After
incubation, 10 ml of culture was centrifuged at 6000-rpm for10 minutes and supernatant was

A Compendium of Research Articles by Prospective Researchers 2019-20 Volume II | Page 41
discarded. The pellet was suspended in 5 ml of 4 % sodium hypochlorite and 5 ml of hot
chloroform and incubated at 37 °C for 1 hour. After incubation, the suspension was
centrifuged at 3000 rpm for 10 minutes. Upper and middle phases were discarded, 5 ml of hot
chloroform was added to the bottom phase, and then 5 ml of ethanol and acetone mixture
(1:1) was added to precipitate the granules. The precipitate was allowed to evaporate for
dryness at 30 °C, and then the weight of PHB was measure (Sathianachiyar and Devaraj
2013).
Optimization of Carbon and Nitrogen Sources for PHB Production
Effect of media ingredients like carbon and nitrogen sources on PHB production was
determined by simply replacing the carbon source with other carbon sources (glucose,
sucrose, mannitol, raffinose, xylose galactose, lactose) and nitrogen source with other
nitrogen sources (peptone, tryptone, ammonium sulphate, ammonium acetate, diammonium
hydrogen phosphate ammonium dihydrogen phosphate, ammonium persulphate and
Ammonium chloride).
Results and Discussion
Isolation of different PHB producing microorganisms
Different soil samples were collected from areas varying in environmental conditions and
subjected to enrichment followed by isolation on nutrient agar plate.
Screening of PHB Producers
The colony which showed whitish colored appearance with round shape was chosen. The
isolates were subjected for visual screening for PHB
production using Sudan black B. They were tested for
PHB production following the viable colony screening
method based on the intensity of staining. The isolates
obtained from industrial soil proved higher PHB
producing organism.
Figure 3: Sudan Black staining of colonies
Characterization of bacterial isolate
Biochemical Characteristics of the isolates
The most efficient PHB producing bacterial isolates was subjected to a set of morphological
and biochemical tests for the purpose of identification. Morphological and biochemical tests
were done by the standard procedures with 24 hrs old culture.

A Compendium of Research Articles by Prospective Researchers 2019-20 Volume II | Page 42
The strongly Sudan Black B positive isolates were subjected to production of Bioplastic. It
was performed according to Singh and Parmar 2011 by sodium hypochlorite-chloroform
method; the five selected isolates were cultured in Minimal Davis Medium at 37 °C for 3
days. The precipitate was allowed to evaporate for dryness at 30 °C, and then the weight of
PHB was measure It was able to produce 289 mg of PHB per 100ml.
Conclusion
The present study was designed for the isolation of effective poly-hydroxybutyrate producing
strains from soil to yield maximum PHB under optimized conditions. The isolates were able
to produce PHB in considerably good quantity compared to other isolated species.
Consequently, the effect of various parameters like carbon source, incubation time, pH and
NaCl concentration on PHB production were seen to be species specific. Similarly, the
production from broth and fermentation methods gave much better results.
References
1. Azios T (2007). A primer on biodegradable plastics.Christian Science
Monitor.Retrieved from Academic.
2. Gill M (2014). Bioplastic: A better alternative to plastics. International J Res Appl
Natural Social Sic, 2(8): 115-120.
3. Kunasundari B and Sudesh K (2011). Isolation and recovery of microbial
polyhydroxyalkanoates. Express Polymer Letters, 5(7): 620–634.
4. Mikkili I, Karlapudi AP, Venkateswarulu TC, et al.(2014). Isolation, screening and
extraction of polyhydroxybutyrate (PHB) producing bacteria from sewage sample.
International J Pharm Tech Res, 6(2): 850-857.
5. Sathianachiyar S and Devaraj A (2013). Biopolymer production by bacterial species
using glycerol, a by-product of biodiesel. International J Scientific Res Publications,
3(8):1-5.
6. Singh P and Parmar N (2011).Isolation and characterization of two novel
polyhydroxybutyrate (PHB)-producing bacteria. Afr J Bioethanol, 10 (24): 4907-4919.
7. Tan GA, Chen C, Li L, et al.(2014). Start a research on biopolymer
polyhydroxyalkanoate (PHA):a review. Polymers, 6: 706-754.
8. Tanamool V, Imai T, Danvirutai P, et al.(2013). Biopolymer generation from sweet
sorghum juice: screening, isolation, identification, and fermentative
polyhydroxyalkanoate production by Bacillus aryabhattai. Turk J Biol, 37: 259-264.
******

A Compendium of Research Articles by Prospective Researchers 2019-20 Volume II | Page 43
BIOTECHNOLOY

A Compendium of Research Articles by Prospective Researchers 2019-20 Volume II | Page 44
Polyphenol oxidase potentials of two wild mushroom species isolated from
Microporus xanthopus and Polyporus arcularius Fuse Ekta
1, Patil Praful
1, Barde Minal
1, Mahajan R.T.
1, Khan Javed *, Khan Tanvir
2
1 Department of Biotechnology, PGCSTR, Jalgaon
2 Department of Botany, H. J. Thim College of Arts and Science, Mehrun, Jalgaon,
Maharashtra, India.
Abstract
Crude enzyme extracts were prepared from Polyporus arcularius and Microporus xanthopus.
The partially purified extract of crude polyphenol oxidase (PPO) extracts from each
mushroom was prepared by three phase portioning. Catechol and pyrogallol were the most
preferred substrate with maximum enzymatic activity. The results reveal that the enzymes
were most active lower substrates concentration that is 5 mM and 10mM of pyrogallol and
catechol for both the mushrooms. In citrus fruits the sweet lime and orange and in vegetables
the black eyes were the potent natural inhibitor for PPO. Also, sodium metabisulphite and
ascorbic acid were strong inhibitors of the enzyme activities for both mushrooms.
Keywords: Microporus xanthopus, Polyporus arcularius, Polyphenol oxidases, TPP. *Corresponding author: [email protected]
Introduction
The polyphenol oxidase (PPO) enzyme involved in this reaction is tyrosinase, which is of
monophenol, O-diphenol: oxygen oxidoreductase; (EC 1. 14. 18. 1) a copper protein widely
distributed in nature (Casanola, 2006). Enzymatic browning in fruits and vegetables is often
an undesirable reaction and responsible for unpleasant sensory qualities (Unal, 2007). When
cell membrane integrity is disrupted, phenolic substrates encounter the enzyme and are
converted to O-quinones (monophenolase activity), followed by the oxidation of diphenols to
O-quinones (diphenolase activity) which are then polymerized to undesirable brown, red, or
black pigments (Chisari, 2007). PPO activity is undesirable in food production processes,
there are many industrial processes in areas such as cosmetics, clinical methods,
pharmaceuticals and textile that require the enzyme activity (Seetharam, 2002).
Mushrooms contain high nutritional value and are of great help to human body health. (
Gurgu, 2017). Microporus xanthopus, also referred to as Polystictus xanthopus. The mature
fruiting bodies have thin, funnel-shaped caps that are concentrically zoned in various shades
of brown and which are supported by a yellow-footed stem. The Polyporus arcularius,
however, is its delicately fringed, finely hairy ("ciliate," in Mycologese) cap margin. The cap
color ranges from vey dark brown to pale tan.

A Compendium of Research Articles by Prospective Researchers 2019-20 Volume II | Page 45
The aim of this work was to isolate, partially purify and characterize the PPO from
mushroom and determine some of its enzymatic properties. The enzyme was characterized at
different substrates (substrate preference), natural and chemical inhibitors. Till date now upto
our knowledge no work has been done on this mushrooms. This is the first kind of report.
Materials and Methods
Collection of Mushrooms
The Microporus xanthopus and Polyporus arcularius were collected in the month of
september from a pine forest of Akkalkuwa, Dist-Nandurbar, Maharashtra with GPS reading
and it was identified by Dr. Tanveer Khan, Taxonomist, Department of Botany, H.J. Thim
College of Arts and Science, Mehrun, Jalgaon and herbarium preserved in laboratory also.
The natural fruit bodies of mushrooms were stored at – 4°C until studied.
Preparation of crude extract
The mushrooms collected during the season and shed dried. After drying washed with tap
water and purified water and crude extract was prepared by using the method described by
( Saki, 2018).
Three phase partitioning
With slight variations, the three phase partitioning was carried out as mentioned in the (Saki
2018).
Polyphenol oxidase enzyme Assay
Polyphenol-oxidase activity was determined by the customized method of Fujita et al. (1995).
One unit of polyphenol-oxidase (U) was defined as the amount of enzyme necessary to cause
an increase of 0.001 OD in the absorption for each minute of reaction time.
Substrate preference Assay
Enzyme activity was measured using seven substrates (catechol, pyrogallol, tyrosine,
quercetin, gallic acid, , phloroglucinol) with two different concentrations ( for catechol,
pyrogallol and tyrosin 50-100 mM) while for gallic acid,quercetin, phloroglucinol and retinal
hydrate: 50 mM) and the enzyme activity was calculated by using above equation.
Selection of substrate concentration for optimum
Maximun amount of enzyme activity was shown in the substrates (Catechol and Pyrogallol)
so for optimum concentration for these substrates at varying concentration for these two
different substrates and the enzyme activity was calculated by using above equation.
Effect of natural inhibitors on PPO of Polyporous arcularis
The natural inhibitory effect of the vegetables Black eyes, Butter beans, Cluster beans and
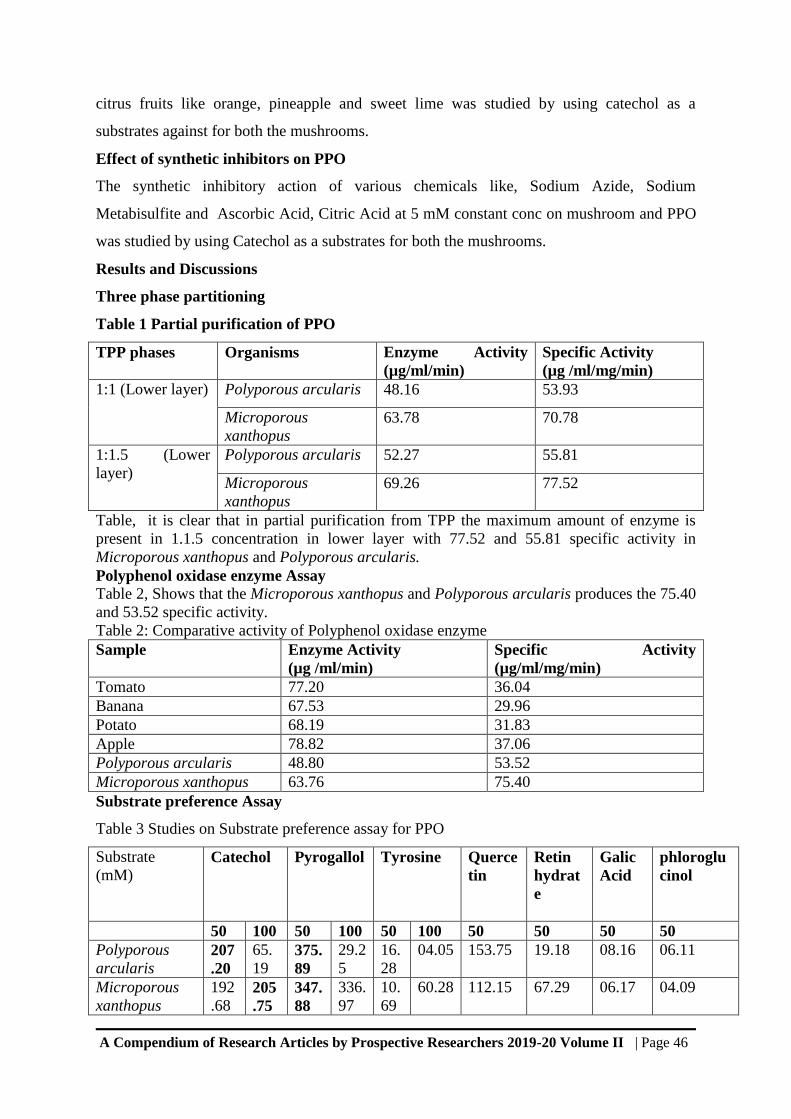
A Compendium of Research Articles by Prospective Researchers 2019-20 Volume II | Page 46
citrus fruits like orange, pineapple and sweet lime was studied by using catechol as a
substrates against for both the mushrooms.
Effect of synthetic inhibitors on PPO
The synthetic inhibitory action of various chemicals like, Sodium Azide, Sodium
Metabisulfite and Ascorbic Acid, Citric Acid at 5 mM constant conc on mushroom and PPO
was studied by using Catechol as a substrates for both the mushrooms.
Results and Discussions
Three phase partitioning
Table 1 Partial purification of PPO
TPP phases Organisms Enzyme Activity
(µg/ml/min)
Specific Activity
(µg /ml/mg/min)
1:1 (Lower layer) Polyporous arcularis 48.16 53.93
Microporous
xanthopus
63.78 70.78
1:1.5 (Lower
layer)
Polyporous arcularis 52.27 55.81
Microporous
xanthopus
69.26 77.52
Table, it is clear that in partial purification from TPP the maximum amount of enzyme is
present in 1.1.5 concentration in lower layer with 77.52 and 55.81 specific activity in
Microporous xanthopus and Polyporous arcularis.
Polyphenol oxidase enzyme Assay
Table 2, Shows that the Microporous xanthopus and Polyporous arcularis produces the 75.40
and 53.52 specific activity.
Table 2: Comparative activity of Polyphenol oxidase enzyme
Sample Enzyme Activity
(µg /ml/min)
Specific Activity
(µg/ml/mg/min)
Tomato 77.20 36.04
Banana 67.53 29.96
Potato 68.19 31.83
Apple 78.82 37.06
Polyporous arcularis 48.80 53.52
Microporous xanthopus 63.76 75.40
Substrate preference Assay
Table 3 Studies on Substrate preference assay for PPO
Substrate
(mM) Catechol Pyrogallol
Tyrosine
Querce
tin
Retin
hydrat
e
Galic
Acid
phloroglu
cinol
50 100 50 100 50 100 50 50 50 50
Polyporous
arcularis 207
.20
65.
19 375.
89
29.2
5
16.
28
04.05 153.75 19.18 08.16 06.11
Microporous
xanthopus
192
.68 205
.75
347.
88
336.
97
10.
69
60.28 112.15 67.29 06.17 04.09

A Compendium of Research Articles by Prospective Researchers 2019-20 Volume II | Page 47
From above observations it is clear that the Catechol and pyrogallol were the most preferred
substrate at a conc of and 100 mM. Polyporous arcularis shows the maximum activity 375
at conc of 50 mM of pyrogallol, while 207 at catechol and lowest activity at 100 mM.
Whereas in Microporous xanthopus maximum activity at 50 mM pyrogallol 347 while 205
activity was seen in 100 mM catechol conc. And the most detested substrate for both the
mushrooms was phloroglucinol, galic acid, and tyrosin, and intermediate substrate was
quercetin and retin hydrate.
Selection of substrate concentration for optimum
Table 4. Determination of optimum substrate concentration for PPO
Mushrooms Enzme activity µg/ml/min
Catechol Pyrogallol
5 mM 15 mM 20 mM 5 mM 15 mM 20 mM
Polyporous
arcularis
65.79 13.66 10.75 27.87 28.66 17.5
Microporous
xanthopus
92.58 8.33 7.25 117.15 36.46 30.25
Table 4 it is clearly seen that as the concentration of substrate increases the enzyme activity
was decreased. Polyporous arcularis shows maximum activity 65 at 5 mM conc of catechol
by comparing both the substrate while Microporous xanthopus shows 117 activity at 5 mM of
pyrogallol in both substrates.
Effect of natural inhibitors on PPO of Polyporous arcularis
Table 5 it is clear that the most potent natural inhibitor was sweet lime, orange, and pineapple
in citrus fruits while in vegetables the most effective inhibitor was black eyes.
Table 5 Effect of natural inhibitors on PPO activity
Inhibitor Enzyme Activity
(µg/ml/min)
Specific Activity
(µg/ml/mg/min)
Black eyes 27.12 12.66
Butter beans 70.75 32.83
Cluster beans 45.49 21.10
Orange 23.73 10.78
Pineapple 23.19 11.18
Sweet lime 4.05 1.8
Control 52.11 24.39
Effect of synthetic inhibitors on PPO
Table 6 Effect of natural inhibitors on PPO activity
Inhibitor Polyporous arcularis Microporous xanthopus
Specific Activity (µg/ml/mg/min)
Sodium Azide 10.78 6.59
Ascorbic acid 3.56 1.38
Sodium metabisulphide 12.28 5.39

A Compendium of Research Articles by Prospective Researchers 2019-20 Volume II | Page 48
Citric acid 18.24 3.89
Control 21.69 8.41
By observing the above results it is concluded that ascorbic acid was the most effective
synthetic inhibitor for both Polyporous arcularis and Microporous xanthopus while citric
acid shows promising inhibitory action against Microporous xanthopus PPO and is less
effective in Polyporous arcularis. Sodium azide has also showed promising results for both
the mushrooms.
Discussion
Phenolics are crucial substrates of PPO; diphenol and triphenol compounds were selected to
measure PPO substrate specificity. PPO showed substrate preference for diphenols, with most
activity detected with catechol, followed by pyrogallol. In contrast, the PPO had low activity
towards monophenols and triphenols such as tyrosin, phloroglucinol, and gallic acid. Similar
results were reported by (Zaini et al., 2013), which showed extreme preference towards
catechol. Our results of inhibitory action of black eyes enzyme activity was 12 which is
having very much similar to the (Gomes et al., 2001) it indicates the PPO value of beans is in
between 10 to 14 U/ml/min. Our results of natural inhibitors with matched with the
(Antoniolli et al. 2012) who studied that pineapple contains ascorbic acid, reviewing the
antioxidant properties of pineapple which controls PPO activity. Cysteine and other
sulfhydryl compounds present in pineapple extract also contribute to PPO inhibition.
Conclusion
Specific activity of Polyporous arcularis and Microporous xanthopus 53.52 and
75.40 respectively.
Out of seven substrate, Pyrogallol and Catechol were the most preferred substrate at
50 and 100 mM conc for Polyporous arcularis and Microporous xanthopus .
At 5 mM conc of catechol Polyporous arcularis shows maximum activity, while
Microporous xanthopus shows maximum activity at 5 mM of pyrogallol.
Sweet lime is the more effective inhibitor against Polyporous arcularis, intermediate
inhibitor was orange in citrus fruits while in vegetables black eyes were most
valuable.
Out of synthetic inhibitors, ascorbic acid was more potent inhibitors for both the
mushrooms.
Further chemical characterization of PPO is warranted along with purified fraction or
secondary metabolites of each plant.

A Compendium of Research Articles by Prospective Researchers 2019-20 Volume II | Page 49
References
1. Antoniolli LR, Benedetti BC, de Souza Filho MSM, Garruti DS, de Borges MF,
(2012), Shelf life of minimally processed pineapples treated with ascorbic and citric
acids. Bragantia Vol. 71(3), 447–453.
2. Casañola-Martín, G.M; Khan, M.T.H; Marrero-Ponce, Y; Ather, A; Sultankhodzhaev,
M.N., Torrens, F., (2006), “New tyrosinase inhibitors selected by atomic linear
indices-based classification models.” Bioorganic & Medicinal Chemistry Letters.,
Vol.16, 324-330.
3. Chisari M, Barbagallo RN, Spagna G, Chem F, (2007), Characterization of
polyphenol oxidase and peroxidase and influence on browning of cold stored
strawberry fruit. J Agric Food Chem, Vol.55, 3469–3476.
4. FUJITA, S. et al., (1995), Purification and properties of polyphenol oxidase from
cabbage (Brassica oleraceae L.). Journal of Agriculture and Food Chemistry, Vol. 43,
1138-1142.
5. GOMES, M. R. A. et al., (2001), Physical chemical properties of polyphenoloxidase
from beans (Phaseolus vulgaris L.). Ciência e Tecnologia de Alimentos, Vol. 21, (1),
69-72.
6. Gurgu, L., Aprodu, I., St, N., Ionit, E., Bahrim, G., Râpeanu, G., (2017),
Characterization, Purifification, and Temperature / Pressure Stability of Polyphenol
Oxidase Extracted from Plums (Prunus domestica), Vol. 56, 177–185
7. Kim, M.K.; Lee, J.S.; Kim, K.Y.; Lee, H.G., (2013), Ascorbyl Palmitate-Loaded
Chitosan Nanoparticles: Characteristic and Polyphenol Oxidase Inhibitory Activity.
Colloids and Surfaces B: Biointerfaces, Vol. 103, 391–394.
8. Lozano, J.E.; Drudis, R.; Ibarz, A. (1994), Enzymatic Browning in Apple Pulps.
Journal of Food Science, Vol. 59, 564–567.
9. Neslihan Saki, Mustafa Akin, Esma H. Alici, Gulnur Arabaci, (2018), Partial
Purification and Characterization of Polyphenol Oxidase from the Wild Edible
Mushroom Lepiota Procera Using Three-Phase Partitioning, International Journal of
Food Engineering., Vol. 20, 170-208.
10. Nunez-Delicado, E.; Serrano-Megias, M.; Perez-Lopez, A.J.; Lopez-Nicolas, J.M.,
(2007), Characterization of Polyphenol Oxidase from Napoleon Grape. Food
Chemistry, Vol. 100, 108–114.
11. Palma-Orozco, G.; Ortiz-Moreno, A.; Dorantes-Alvarez, L.; Sampedro, J.G.; Najera
H., (2011), Purification and Partial Biochemical Characterization of Polyphenol
Oxidase from Mamey (Pouteria sapota). Phytochemistry, , Vol. 72, 82–88.
12. Seetharam G, Saville BA., (2002), L-DOPA production from tyrosinase immobilized
zeolite. Enzyme Microb Technol. Vol. 31, 747–53.
13. Ünal, M.U., (2007), “Properties of polyphenol oxidase from Anamur banana (Musa
cavendishii).” Food Chemistry.,Vol.100, 909-913.
14. Wititsuwannakul, D.; Chareonthiphakorn, N.; Pace, M.; Wititsuwannakul, R., (2002),
Polyphenol Oxidases from Latex of Hevea Brasiliensis: Purification and
Characterization. Phytochemistry, Vol. 61, 115–121.
15. Zaini, N. A., Osman, A., Hamid, A. A., Ebrahimpour, A., & Saari, N., (2013),
Purification and characterization of membrane-bound polyphenoloxidase (mPPO)
from Snake fruit [Salacca zalacca (Gaertn.) Voss]. Food Chemistry, Vol. 136 (2),
407–414.
****

A Compendium of Research Articles by Prospective Researchers 2019-20 Volume II | Page 50
Studies on antibacterial and antifungal activity of spices (Cinnamon, Black
pepper and Cumin) Gonge Shubhangi E., Borse Vaishali M., Bonde Kanchan S., Shaikh Faiz, MeshramPavan D.
a,and Bari Sarang S.*
Department of Biotechnology, Post Graduate College of Science, Technology and Research,
Jalgaon aUniversity Institute of Chemical Technology, KBC NMU, Jalgaon
Abstract
Antimicrobial properties of three spices namely Cinnamon, Black pepper and Cumin were
tested against different microbes including couple of bacteria and a fungus. Agar well
diffusion method was implemented for this purpose in presence of standard antimicrobials.
Microbial growth area over culture media plates, encompassing the antimicrobials provide
data for analysis. Results obtained confirmed the antimicrobial nature of spices with their
characteristic action against specific micro-organism.
Keywords: Antibacterial activity, Antifungal activity, Spices, Agar-well diffusion
*Corresponding author: [email protected]
Introduction
Spices are aromatic and pungent food ingredients, like herbs.They can havesignificant
antioxidative effects. Total equivalent antioxidant capacities andphenolic contents (Folin–
Ciocalteu) of 32 spices was reported till now. Spices can alsohave antimicrobial effects. Out
of 46 spice extracts evaluated, many exhibitedantibacterial activity against food borne
pathogens.Gram-positive bacteria (e.g. Bacillus subtilis) are generally more sensitive than
Gram-negative bacteria (Escherichia coli).
Cinnamon is a popular spicewhich found all over India, belongs to the family Leuraceae.It is
obtained from the inner bark of several tree species from theplant genus Cinnamonum.
Cinnamon is used mainly as an aromatic condiment orflavouring additives in wide variety of
cuisine, sweets, snacks, tea and traditionalfoods. The aroma and flavour of cinnamon is
attributed to its essential oil and cinnamaldehyde, theprincipalcomponent, along withsome
other constituents like eugenol.
Cinnamon consists of a variety of resinous compounds, including
cinnamaldehyde,cinnamate, cinnamic acid, and numerous essential oils including trans-
cinnamaldehyde, cinnamyl acetate, eugenol,L-borneol, caryophyllene oxide, b-
caryophyllene, L-bornyl acetate, E-nerolidol,α -cubebene, α -terpineol etc.Spicy taste and
fragrance aredue to absorption of oxygen by cinnamaldehyde.As cinnamon ages, it darkens

A Compendium of Research Articles by Prospective Researchers 2019-20 Volume II | Page 51
in color, improving the resinous compounds.
Fig. 1. Cinnamomum Verum Fig.2.Cuminum Cymium Fig.3. Piper nigrum
Cinnamon contains large amounts of highly potent antioxidants that neutralise the
harmful free radicals, formed every day in the body. Since cinnamon contains high levels
of flavonoid acting as plant proteins, with powerful antioxidant property, the spice shows
anti-inflammatory effect. In addition, cinnamon shows good resistance against large
number bacteria and certain fungi that renders their applications in the food industry, for
food preservation. Cuminum cyminum, commonly known as Cumin, is a flowering plant
belonging to family Apiaceae. Its native territory belongs to the middle east of India.
Cumin seed are nutritionally rich, providing high amount of fats, proteins, and dietary
fibre. Moreover, vitamin B and E along with several dietary minerals, especially iron, are
also present in considerable amount within cumin seed. The most common traditional
medicinal use of cumin is for indigestion. Similarly, it also helpful for treating diabetes.
Black pepper is native to south India and has been known to Indian cooking, since at least
2000 BC.It is a flowering vine in the family piperaceae, cultivated for its fruit known as a
peppercorn, which is usually dried and used as spice and seasoning. Black pepper
composed of carbohydrates, protein, fibre, moisture and fat as well as minerals, including
potassium, calcium and phosphorous and magnesium. The main volatile flavour
compound in black pepper are terpenes. Amoung medicinal importance‟s, black pepper
helps in losing weight, cleanses intestine and stomach and useful in prevent cancer. It
consists potassium that helps in regulating heart rate and high blood pressure. Moreover,
black pepper is reported to for producing red blood cells treating constipation.

A Compendium of Research Articles by Prospective Researchers 2019-20 Volume II | Page 52
Materials and methods
Pre-treatment
Samples of three spices namely Cinnamon, Black pepper and Cuminwere procured from local
market of Jalgaon (Maharashtra). 10 gm of dry powder of all spices was packed in Soxhlet
apparatus. This was for extraction of respective soluble bioactive molecules from the
rhizome, using methanol as solvent system. Based on polarity of volatile solvent, they were
concentrated on water bath (50o - 70
oc) under reduced pressure. The concentrated extract was
kept in desiccator till used. Standard samples of spices were obtained from HI-MEDIA.
Test Microorganisms
Two different strains were used for testing antibacterial activity includes E. coli (gram-
negative), Bacillus subtilis (gram-positive). For testing antifungal activity, a strain of
Aspergillus nigerwas used (Naz et al. 2010). The bacterial cultures were maintained on
Nutrient Agar (NA), whereas the fungal cultures were maintained onpotato dextrose agar
(PDA) and preserved at 4°C.All cultures were sub-cultured periodically under stationary
condition, on the same medium(Borate et al. 2014).
Antibacterial Assay
Effect of all spices extracts on Gram-bacterial species was assayed by agar well diffusion
method. Antimicrobials present in the extracts(100 mg / 2 ml)are allowed to diffuse out into
the medium to interact with the test organisms, seeded in freshly prepared plates. Resulting
zones of inhibition (diameter in mm) is expected to be uniformly circular,due to confluent
lawn of growth.
Reagents:
1. Muller Hinton Agar Medium (1L): The medium was prepared by dissolving 33.9g of
the commercially available Muller Hinton Agar Medium (Hi-Media) in 1000ml of
distilled water. The dissolved medium was autoclaved at 15 lbs pressure at 121°for 15
minutes. The autoclaved medium was mixed well and poured in molten condition,
into 100mm petriplates (25-30ml/plate).
2. Nutrient broth (1L): Nutrient broth was prepared by dissolving 13 g of commercially
available nutrient broth into 1000ml distilled water, followed by shaking till complete
dissolution.
3. Ciprofloxacin (Standard antibacterial agent)

A Compendium of Research Articles by Prospective Researchers 2019-20 Volume II | Page 53
Protocol:
1. Petri plates containing 20ml Muller Hinton medium were seeded with 24h incubated
culture of (0.1ml) bacterial strains (E. coli and Bacillus subtilis).
2. Wells of approximately 2mm was bored using well-borer and exactly 100μl of all
extracts (each with hexane, methanol, acetoneand water) were added.
3. All plates were incubated at 37°C for 24h., followed by measurement of inhibition
zone.
4. Ciprofloxacin, a standard antibacterial agent at a concentration of 200 µl in a well was
used as the positive control (Praveen et al. 2014).
Antifungal Assay
The fungicidal effect of the spices can be assessed by the agar well plate method using fungus
Aspergillus niger. It involves inhibition of mycelial growth of the fungus, observed as a zone
of clearance near wells.
Reagents
1. Potato Dextrose Agar medium (PDA): The medium was prepared by dissolving 39g
of the commercially available potato dextrose agar in 1000ml of distilled water. The
dissolved medium was autoclaved at 15 lbs pressure at 121° for 15 minutes. The
autoclaved medium was mixed well and poured in molten condition, into 100 mm
petri plates (25-30 ml/plate).
2. Potato Dextrose Broth (PDB): Potato dextrose broth was prepared by dissolving 13 g
of commercially available PDB in 1000ml distilled water and dissolved the medium
completely.
3. Flucanazole (standard antifungal agent)
Protocol:
1. PDA medium was prepared and poured into the petri plates.
2. Wells of about 2 mm diameter were aseptically punched on each agar plate using
sterile borer.
3. Fungal strain culture (0.1 ml) were aseptically inoculated and evenly spread using
sterile glass spreader on the surface of PDA plate.
4. 100 µl of the spices extracts are then inoculated into the wells and plates are incubated
at 37 °C for 24 h.
5. Flucanazole was used as standard.
6. The diameter of zones of inhibition was recorded in mm (Borate etal.2014).

A Compendium of Research Articles by Prospective Researchers 2019-20 Volume II | Page 54
Results and Discussions
Antibacterial Activity
As mentioned in table 1, largest zone of clearance was noticed as 14 mm, in case of Cumin
among all three spices when tested against Gram negative bacteria (E. coli) at least
concentration. On the contrary, largest zone of clearance was observed as 16 mm, in case
Cinnamon when all the three spices were tested against Gram positive bacteria (B. subtilis) at
same concentration. This indicates the superior antibacterial activity of Cumin as well as
Cinnamon against respective specific bacteria. Nevertheless, black pepper also exhibited
tentative antibacterial activity against both types of bacteria.
Table 1. Antimicrobial activity of spices
Spices /
Microbes
Cinnamon Cumin Black pepper
Concentration
(μl)
Zone of
inhibition
(mm)
Concentration
(μl)
Zone of
inhibition
(mm)
Concentration
(μl)
Zone of
inhibition
(mm)
E. coli
0.1 12 0.1 14 0.1 12
0.2 16 0.2 18 0.2 16
0.2 (Std.) 32 0.2 (Std.) 32 0.2 (Std.) 32
Bacillus
subtilis
0.1 16 0.1 12 0.1 12
0.2 15 0.2 17 0.2 14
0.2 (Std.) 36 0.2 (Std.) 28 0.2 (Std.) 34
Aspergillus
niger
0.1 14 0.1 15 0.1 16
0.2 16 0.2 17 0.2 19
0.2 (Std.) 32 0.2 (Std.) 30 0.2 (Std.) 32
Antifungal activity
Table 3.1 tabulated the values of zone of inhibition corresponding to antifungal activity of
three spices carried out using fungus Aspergillus niger. Results shown that maximum zone of
inhibition that is 16 mm at the least concentration of 0.1μl, was obtained for the spice black
pepper. It highlighted the role of this particular spice to be used as fungus-resistant agent. It
should be noted that both other spices too, exhibited same nature up to a large extent.
Conclusion
From the present work, it is concluded that all the three types of spices clearly exhibited
antibacterial as well as antifungal activities. In case of antibacterial activity for Gram positive
bacteria, cumin can be used as most effective spice, whereas that of for Gram negative

A Compendium of Research Articles by Prospective Researchers 2019-20 Volume II | Page 55
bacteria, Cinnamon proved to be comparatively significant, when used at their least
concentration. Similarly, black pepper claimed its usefulness to resist fungi among all spices.
Collectively, all spices confirmed their traditional medicinal importance and also provide
scope for their economic production, in terms of drugs and supplementary products.
References
1. Almajano, M. P., Carbo, R., Jiménez, J. A. L., and Gordon,M. H. (2008). Antioxidant
and antimicrobial activities of tea infusions. FoodChemistry, 108(1), 55–63.
10.1016/j.foodchem.2007.10.040.
2. Al‐Qura'n, S. (2005). Ethnobotanical survey of folk toxic plants in southern partof
Jordan. Toxicon, 46(2), 119–129. 10.1016/j.toxicon.2005.04.010 [PubMed].
3. Asnaashari, E., Asnaashari, M., Ehtiati, A., and Farahmandfar, R. (2015)Comparison
of adaptive neuro‐fuzzy inference system and artificial neuralnetworks (MLP and
RBF) for estimation of oxidation parameters of soybean oiladded with curcumin.
Journal of Food Measurement and Characterization, 9(2), 215–224. 10.1007/s11694-
015-9226-7.
4. Asnaashari, M., Farhoosh, R., and Farahmandfar, R. (2016) Prediction of
oxidationparameters of purified Kilka fish oil including gallic acid and methyl gallate
byadaptive neuro‐fuzzy inference system (ANFIS) and artificial neural
network.Journal of the Science of Food and Agriculture, 96, 4594–4602. 10.1002/
jsfa.7677[PubMed].
*****

A Compendium of Research Articles by Prospective Researchers 2019-20 Volume II | Page 56
Phytochemical analysis of Eriophorum comosum (cotton grass) and Ficus
exasperata (brahmas banyan) along with their antibacterial Activity Talekar Kajal D., Dhakare Shubhangi B., Wagh Roshan S., Meshram Pavan D.
a,and Bari
Sarang S.*
Department of Biotechnology, Post Graduate College of Science, Technology and Research,
Jalgaon aUniversity Institute of Chemical Technology, KBC NMU, Jalgaon
Abstract
Phytochemical properties of couple of plants namely „cotton grass‟ and „brahmas banyan‟
were analyzed, confirming the presence of secondary metabolites in both plants. Similarly,
their antibacterial properties were also tested against a Gram-positive and a Gram-negative
bacterium. Agar well diffusion method was implemented for this purpose in presence of
standard antimicrobials. Microbial growth area over culture media plates, encompassing the
antimicrobials, provide data for analysis. Results obtained confirmed the antibacterial nature
of both plants with their characteristic action against specific bacteria, in particular solvent
systems.
Keywords: Phytochemical analysis, Antibacterial activity, Agar-well diffusion
*Corresponding author: [email protected]
Introduction
The genus Eriophorum commonly known as cotton-grass or cotton-sedge, is characterized by
the presence of smooth silky white or brownish red elongated perianth bristles. There are
about 25 species in the genus and distributed in the cool temperate regions of Himalaya and
south-east Asia. In India, three species namely E. comosum, E. microstachyum and E.
scheuchzeriare recorded so far and most of them are confined in the northern regions. It has
the flowering and fruiting season from November to March. Habitat point of view, it is
naturally growing in the rock crevices at an altitude of over 2000 m from sea level and the
environmental conditions at Nilgiri Plateaus, comparable to that of its original habitats in
Himalayan region. The leaves and roots of this plant are astringent and have been used in the
post treatment of diarrhea.
On the other hand, Ficus exasperta, commonly known as Brahma's Banyan, is a deciduous
tree, up to 70 feet tall, native to parts of Africa, Arabian Peninsula and India. The tree has
smooth grey bark. Alternately arranged, ovate-elliptic leaves have very rough surface,

A Compendium of Research Articles by Prospective Researchers 2019-20 Volume II | Page 57
making them look like sandpaper. Young leaves are often lobed. Sap is sticky, not milky.
Figs arise in leaf axils, 1-2 in number. They are rough, spherical or ovoid, 1-1.5 cm in
diameter and yellow, orange or red in colour.Its forage (leaves plus stems less than 6 mm in
diameter) contained 14.6 g and19.9 g crude protein per 100 g dry matter in the wet and dry
season, respectively. The associated species in the community are Ficus asperifolia, Ficus sur,
Ficustsjahela, Ficushispida etc. Ficus exasperatais used as analgesic, anti-arthritic,
diuretic,wound healing, anti-parasitic, vermi-fugue etc. The plant parts are also used as
animal fodder. Rough leaves are widely used as sandpaper for polishing wooden, metal or
ivory articles, like kitchen utensils, chairs etc.
Fig. 1 Eriophorum comosum Fig.2.Ficus exasperate
Materials and Methods
Pre-treatment of plants
Eriophorum Comosum and Ficus exasperata was collected from Akkal-kuva village,
Nandurbar, Maharashtra and further processed for cleaning to prevent the deterioration of
phytochemicals in it. All plants were shade dried, to remove the water content from entire
plant, for longer storage. After complete drying, whole plants are grinded in blender to obtain
fine powdered form which finally applied for Soxhlet extraction using different solvents
(Hexane, Methanol, Acetone and water).
Test Microorganisms
Two different strains were used for testing antibacterial activity includes E. coli (gram-
negative) and Bacillus subtilis (gram-positive) (Naz et al. 2010). The bacterial cultures were
maintained on Nutrient Agar (NA) and preserved at 4°C. All cultures were sub-cultured
periodically under stationary condition, on the same medium(Borate et al. 2014).

A Compendium of Research Articles by Prospective Researchers 2019-20 Volume II | Page 58
Antibacterial Assay
Effect of both plant extracts on bacterial species was assayed by agar well diffusion method.
Antimicrobials present in the plant extracts are allowed to diffuse out into the medium to
interact with the test organisms, seeded in freshly prepared plates. Resulting zones of
inhibition (diameter in mm) is expected to be uniformly circular,due to confluent lawn of
growth.
Reagents:
4. Muller Hinton Agar Medium (1L): The medium was prepared by dissolving 33.9g of
the commercially available Muller Hinton Agar Medium (Hi-Media) in 1000ml of
distilled water. The dissolved medium was autoclaved at 15 lbs pressure at 121°for 15
minutes. The autoclaved medium was mixed well and poured in molten condition,
into 100mm petri plates (25-30ml/plate).
5. Nutrient broth (1L): Nutrient broth was prepared by dissolving 13 g of commercially
available nutrient broth into 1000ml distilled water, followed by shaking till complete
dissolution.
6. Ciprofloxin (Standard antibacterial agent)
Protocol:
5. Petriplates containing 20ml Muller Hinton medium were seeded with 24h incubated
culture of (1ml) bacterial strains (E. coli and Bacillus subtilis).
6. Wells of approximately 10mm was bored using well-borer and exactly 200μl of both
plant extracts (each with hexane, methanol, acetone and water) were added.
7. All plates were incubated at 37°C for 24h., followed by measurement of inhibition
zone.
8. Ciprofoxin, a standard antibacterial agent at a concentration of 200 µl in a well was
used as the positive control (Praveen et al. 2014).
Results and Discussion
Phytochemical screening (secondary metabolites)
Chemical tests were carried out on the aqueous extract of given plant using standard
procedures. Results obtained are shown with details in table 1 and table 2 for both plants
extracts. From the data, it is cleared that both plants exhibit presence of various secondary
metabolites (biomolecules) in different solvent extractions of hexane, methanol, acetone and
water.

A Compendium of Research Articles by Prospective Researchers 2019-20 Volume II | Page 59
Table 1. Phytochemical analysis ofEriophorumcomosum
6(a) Hexane Alkaline
reagent test
Flavonoids 0.5ml filtrate+10%
ammonium
hydroxide=yellow
colour
no colour absent
(b) methanol Yellow
colour
present
(c) Acetone no colour absent
(d) Aqueous Coloured
compound
present
7(a) hexane Saponification
test
Fixed oil and
fats
5 ml
filtrate+15mlDWW+sh
ake =layer of foam
No layer of
foam
absent
(b) methanol No layer of
foam
absent
(c) acetone No layer of
foam
absent
Sr.No. Solvent Test Secondary
metabolite
Procedure Observation Inference
1 (a) Hexane Benedict‟s
test
Carbohydrates 0.5ml filtrate+0.5ml
Benedict‟s
reagent+heat=coloured
precipitate
No coloured
precipitate
absent
(b) Methanol Coloured
compound
present
(c) Acetone Coloured
compound
present
(d) Aqueous Coloured
compound
present
2 (a) Hexane Ferric
chloride
Phenolic
compounds
0.5ml + 5% neutral
ferric chloride= dark
green colour
Colored
compound
present
(b) Methanol Coloured
compound
present
(c) Acetone Colored
compound
present
(d) Aqueous No coloured
compound
absent
3 (a) Hexane Biuret test Proteins 2ml filtrate+1drop
(2%) CuSO4 + 1ml
ethanol(95%) +KOH=
pink ethanolic layer
Pink colour present
(b) Methanol Pink colour present
c) Acetone No change absent
d) aqueous Pink colour present
4 (a) Hexane Wagner‟s test Alkaloids A drop of wagner‟s
reagent + 1ml filtrate=
reddish brown
precipitate
Noppt absent
(b) Methanol No ppt absent
c) Acetone No ppt absent
d) Aqueous No ppt absent
5 (a) Hexane Borntrager‟ s
test
Glycosides 2ml filtrate+ 3ml
chloroform+ 10%
ammonia= pink colour
No colour absent
b) Methanol Pink colour present
c) Acetone No colour absent
d) Aqueous No colour absent

A Compendium of Research Articles by Prospective Researchers 2019-20 Volume II | Page 60
(d) aqueous No layer of
foam
absent
8(a) Hexane Salkowsi test Steroids 2ml filtrate+2ml
chloroform +2ml
Sulphuric acid=red
colour
No change absent
(b) Methanol No change absent
(c) Acetone No change absent
(d) Aqueous Red colour present
9(a) Hexane Libermann-
brchard‟s test
Phytosterols 1ml filtrate+2ml acetic
anhydride + 2 drops
conc. H2SO4= colour
change
No colour
change
absent
(b) Methanol Pink colour Present
(c) Acetone Pink colour Present
(d) Aqueous No color
change
Absent
Table 2. Phytochemical analysis of Ficus exasperata
7(a) Hexane Saponification
test
Fixed oil
and fats
5 ml
filtrate+15mlDWW+shak
No layer of
foam
absent
Sr.
No.
Solvent Test Secondary
metabolite
Procedure Observation Inference
1 (a) Hexane Benedict‟s
test
Carbo-
hydrates
0.5ml Filtrate+0.5ml
Benedict‟s reagent+heat
=coloured precipitate
No coloured
precipitate
absent
(b) Methanol No Coloured
compound
absent
(c) Aqueous Coloured
compound
present
2 (a) Hexane Ferric
chloride
Phenolic
compounds
0.5ml + 5% neutral ferric
chloride= dark green
colour
No colour absent
(b) Methanol No colour absent
(c) Aqueous No coloured
compound
absent
3 (a) Hexane Biuret test Proteins 2ml filtrate+1drop(2%)
CuSO4 + 1ml
ethanol(95%) +KOH=
pink color ethanolic layer
No pink colour absent
(b) Methanol No pink colour absent
(c) Aqueous No pink colour absent
4 (a) Hexane Wagner‟s test Alkaloids A drop of wagner‟s
reagent + 1ml filtrate=
reddish brown precipitate
Reddish
brown ppt.
present
(b) Methanol No ppt. absent
(c) Aqueous No ppt. absent
5 (a) Hexane Borntrager‟ s
test
Glycosides 2ml filtrate+ 3ml
chloroform+ 10%
ammonia= pink colour
No colour absent
(b) Methanol Nocolour absent
(c) Aqueous No colour absent
6(a) Hexane Alkaline
reagent test
Flavonoids 0.5ml filtrate+10%
ammonium
hydroxide=yellow colour
No colour absent
(b) Methanol Nocolour absent
(c) Aqueous No colour absent

A Compendium of Research Articles by Prospective Researchers 2019-20 Volume II | Page 61
(b) Methanol e =layer of foam No layer of
foam
absent
(c) Aqueous No layer of
foam
absent
8(a) Hexane Salkowsi test Steroids 2ml filtrate+2ml
chloroform +2ml
Sulphuric acid=red color
No change absent
(b) Methanol No change absent
(c) Aqueous No change absent
9 (a) Hexane Libermann-
brchard‟s test
Phytosterols 1ml filtrate+2ml acetic
anhydride + 2 drops conc.
Sulphuric acid= colour
change
No colour
change
absent
(b) Methanol Redcolour present
(c) Aqueous No color
change
absent
Antibacterial Activity
The antibacterial activity of the Eriophorum comosum and Ficus exasperate extracts against
Gram-negative bacteria (E.coli) and Gram-positive bacteria (B. subtilis) is given below in
table 3. According to data obtained, it was noticed that Eriphorum comosum extracts in
methanol as well as acetone exhibited the zones of inhibition of 19 mm and 4 mm
respectively, against Gram negative bacteria namely E.coli. On contrary, there was no such
clear zone noticed against Gram positive bacteria namely B. subtilis. This confirmed the
antibacterial nature of concerned plant, particularly again Gram negative bacteria.
In case of Ficus exasperata, there was no zone of clearance observed in any solvent extracts
for E.coli while for B. subtilis, only such zone of 3 mm was noticed in hexane extracts. This
confirmed the antibacterial nature of respective plant against Gram positive bacteria,
specifically using hexane as solvent.
Table 3. Antibacterial activity of Eriophorum comosum and Ficus exasperata
Eriophorumcomosum Ficusexasperata
Extracts Zone of inhibition (mm) Extracts Zone of inhibition (mm)
E. coli B. subtilis E.coli B. subtilis
Standard(Ciprofoxacin) 38 32 Standard(Ciprofoxacin) 30 30
Acetone 19 - Hexane - 3
Methanol 04 - Methanol - -
Aqueous - - Aqueous - -
Conclusion
From the present work, it is concluded that both plant species exhibited variable antibacterial
A Compendium of Research Articles by Prospective Researchers 2019-20 Volume II | Page 62
activities. Eriophorum comosum plant species proved to be more effective against Gram-
negative bacteria in aceto-methanol extracts, while Ficus exasperate in hexane extract
confirmed its antibacterial action against Gram-positive bacteria. Similarly, both plants
exhibited presence of secondary metabolites of varying range. Phytochemical studies
concluded that Eriophorum comosum contains carbohydrates, phenolic compounds, proteins,
glycosides, flavonoids, steroids and phytosterols. On the other hand, Ficus exasperate
contains carbohydrates, alkaloids, steroids and phytosterols, in particular solvent extracts.
References
1. Singh Rana Pratap and Jain D.A (2102), Evaluation of antimicrobial activity of
species, international journal of pharmacy and life sciences ISSN: 0976-7126.
2. Praveen R.P. and Nair Astalatha S (2014), Antimicrobial efficacy of methanolic
extracts of root, callus and fruits extracts of myxopyrumsmilaci foliumblume, Int J
Apppl Sci Biotechnol, vol 2(4): 521-524.
3. Gul Praveen and Bakht Jehan (2015), Antimicrobial activity ofturmeric extract and its
potential use in food industry, J Food Sci Technol, 524(4): 2272-2279.
4. Chattopadhyay I., Biswas K., Bandyopadhyay U., and BaneroeeR.K.(2004) Turmeric
and curcumin: Biological actions and medicinal applications, Current Science,
Vol.87, No.1.
5. Antifungal activities of basil (Ocimumbasilicum L.) extract onFusarium species
(2011), African Journal of Biotechnology Vol. 10(50),pp 10188-10195
6. Junaid A, Anusooya D, Taiselvi A, Suriani I, Rosliza AM (2017),The Concept of
Ayurveda In Medical Science, An Indian Traditional Medicine, International Journal
of public Health and Clinical Science e-IISN: 2289-7577. Vol.4:No.
7. Prain, D. 1903. Bengal Plants. BSI Culcuta, India, vol 2, pp. 234-235.
8. Haines, H. H., Haselfoot, H. 1925. The botany of Bihar and Orissa vol 3: 927.
Adlardand Son and West Newman Ltd, London.
*****

A Compendium of Research Articles by Prospective Researchers 2019-20 Volume II | Page 63
STATISTICS

A Compendium of Research Articles by Prospective Researchers 2019-20 Volume II | Page 64
Statiatical Process Control Tools For Some Quality Parameter Of Brake System
Khatik Shabaj, Neve Pragati S., Deshmukh Ravina U. and Wagh Akash R*.
Department of Statistics, Post Graduate College of Science, Technology & Research, Jalgaon
Abstract
The aim of the study is the safe operation of motor vehicle required for continuous adjusting
of its speed which changes in traffic conditions. The breaks and the tires along with the
steering system are the most important safety and critical accident avoidance component of a
motor vehicle. In this case we study the critical parameters of those components of break
system and then capability has been verified.
Keywords: Caliper, Wheel cylinder, industrial manufacturing process, I and MR Chart
*Corresponding author: [email protected]
Introduction
The wheel cylinder is one of the important break system components. The wheel cylinder is
four wheeler motor vehicle parts and it is used in break system of four wheeler vehicle. Some
are critical parameters of break system are main bore diameter and depth of port hole.30 units
of wheel cylinder were inspected for measurement of main bore diameter. Digital air gauge
was used for this purpose. Here our objective is to check whether the bore size is uniform
over the entire length of cylinder or not.
Objective and Scope
To observe industrial manufacturing process.
To observe the environment and culture.
To indentify sources and causes of variation in industrial process.
Use/Scope of statistical techniques on industrial process.
To carry out the process stability and capability analysis on collected
To carry out the gauge capability analysis on collected data sets.
To suggest the some possible action for improvement.
Data collection and description
Data collection on caliper of break system:
The caliper bracket is four wheeler components and it is used in break system. The bracket is
one of the important parts of break system; produced in Foundation Brake Manufacturing
Pvt. Ltd. Some of the parameters of brackets are critical and we want to see those parameters

A Compendium of Research Articles by Prospective Researchers 2019-20 Volume II | Page 65
are capable or not for break system. So we have decided to collect data on the basis of
following quality characteristics
Specification limits: Only Upper specification is given in the table 1.
Table1: Upper specification Limit
Parameters Targets (mm) USL (mm) LSL (mm) Fig. 1:Break Caliper
CD Parameters:
134 134.1 133.9
Counter Diameter
61.5 61.55 61.45
Seal Gr. Diameter 56.43 56.56 56.3
Material and Methods
An MR chart plots the moving range over time to monitor process variation for individual
observations. Use the MR chart to monitor process variation when it is difficult or impossible
to group measurements into subgroups. This occurs when measurements are Expensive,
production volume is low, or products have a long cycle time. Statistical techniques can be
useful for throughout the product cycle, including development activities. Prior to
manufacturing; in quantifying process variability, in analyzing this variability relative to
product requirements or specifications and in assisting development and manufacturing in
eliminating or greatly reduces this variability. This general activity is called process
capability analysis it is frequently convenient to have a simple, quantitative way to express
Process capability. One way to do so is through the process capability ratio PCR. It is denoted
by Cp Determining the capability of the measurement system is an important aspect of many
quality and process improvement activities.
The purpose of most measurement systems capability study is to
1) Determine how much of the total observed variability is due to the gauge or
instrument.
2) Isolate the components of variability in the measurement system. Assess whether the
instrument or gauge is capable (i.e., is it suitable for the intended application).

A Compendium of Research Articles by Prospective Researchers 2019-20 Volume II | Page 66
Data Analysis for Caliper
Parameter : CD 134
Fig. 2: Process Capability Analysis of CD (134mm Fix-1)
Interpretation:
1. Data distribution shows approximately normal.
2. From I chart we observe that one point is out of control and MR chart
3. Shows two points are out of control. The process is not under control.
4. From the capability analysis it is concluded that the process is well capable. In this
parameter ppm=0 i.e. highly capable process.
Fig 3.Process Capability Analysis of CD (134mm Fix-3)

A Compendium of Research Articles by Prospective Researchers 2019-20 Volume II | Page 67
Interpretation:
1) Data distribution shows approximately normal.
2) From I chart we observe that one point is out of control and MR chart shows three
points are out of control. The process is not under control.
3) From the capability analysis it is concluded that the process is well capable. In this
parameter ppm is zero. i.e. highly capable process
In a same manner we plotted control chart for remaining 2 parameter of Caliper and 6
parameters for wheel cylinder and interpreted the result in final conclusion
Gauge Capability Analysis:
1. Gauge Capability study for caliper:
Parameter: CD (134±0.10)
Table2: specification Limit for parameter CD
USL LSL 𝝈𝒈𝒂𝒖𝒈𝒆𝟐 𝝈𝒕𝒐𝒕𝒂𝒍
𝟐 𝝈𝑷𝒓𝒐𝒅𝒖𝒄𝒕𝟐 P/T ratio
134.1 133.9 0.0007754 0.00036 0 0.835357
Interpretation:
1) Here, precision to tolerance ratio (or P/T) ratio is greater than 0.1. Hence gauge is not
capable.
2) We conclude that gauge capability is poor as precision to tolerance ratio (P/T) ratio is
0.835357.
Similar result obtains from rest 3 parameter and interpreted in final conclusion
Gauge Capability study for Wheel Cylinder:
Parameter: Depth Port-A (7.5±0.5)
Table 3: specification Limit for parameter Depth Port
USL LSL 𝝈𝒈𝒂𝒖𝒈𝒆𝟐 𝝈𝒕𝒐𝒕𝒂𝒍
𝟐 𝝈𝑷𝒓𝒐𝒅𝒖𝒄𝒕𝟐 P/T ratio
8 7 0.0080484 0.0086333 0.0005849 0.535122
Interpretation:
1) Here, P/T ratio is greater than 0.1. Hence gauge is not capable.
2) We conclude that gauge capability is poor as P/T ratio because this ratio is not less than
0.1.
Overall conclusion and suggestion
Table showing overall conclusion analysis of Cp, Cpk, Pp and Ppk:

A Compendium of Research Articles by Prospective Researchers 2019-20 Volume II | Page 68
Table 4: Process capability statistics for caliper
Compound parameter Observation CP CPK Pp Ppk
Caliper
CD
Fix-1 3.83 2.72 3.04 2.16
Fix-2 4.29 3.37 4.24 3.33
Fix-3 4.16 3.07 3.11 2.29
Fix-4 2.1 1.78 1.98 1.68
Counter
Diameter
Fix-1 19.47 1.87 12.35 1.19
Fix-2 3.48 0.22 1.63 0.1
Fix-3 8.52 0.52 8 0.49
Fix-4 8.79 0.21 7.56 0.18
Seal Gr.
Diameter
Fix-1 16.16 1.53 5.16 1.28
Fix-2 4.87 1.49 4.28 1.31
Fix-3 6.36 1.92 5.99 1.82
Fix-4 7.83 2.53 7.42 2.4
Table 5: Process capability statistics for wheel cylinder
Compound parameter Observation CP CPK Pp Ppk
Wheel
Cylinder
Depth Port-A
Fix-1 1.87 1.35 2.07 1.49
Fix-2 1.73 1.08 1.6 1
Fix-3 1.71 1.18 1.83 1.26
Fix-4 1.82 1.27 1.7 1.19
Fix-5 1.91 1.31 1.77 1.22
Fix-6 1.77 1.22 1.88 1.29
Depth Port-B
Fix-1 1.54 1.05 1.69 1.22
Fix-2 2.25 1.33 1.9 1.29
Fix-3 1.6 0.99 1.87 1.15
Fix-4 1.74 1.07 1.78 1.12
Fix-5 2.27 1.49 1.9 1.15
Fix-6 2.13 1.36 2.01 11
Bore
Diameter
Fix-1 2.94 1.5 2.98 1.25
Fix-2 1.48 0.85 0.98 1.28
Fix-3 2.73 1.45 2.9 1.52
Fix-4 1.51 0.86 0.99 0.57
Fix-5 3.01 1.57 2.92 1.54
Fix-6 3.63 1.93 3.16 1.68
Overall conclusion and suggestion for caliper:
1) The process was not under control for some parameters and not capable for some
parameter.
2) Overall we say the process is not well settle. We need control process parameters.

A Compendium of Research Articles by Prospective Researchers 2019-20 Volume II | Page 69
3) The bracket production was stopped because of some reason so we have not got the
data of new settle process. Then we not observed the next process parameter.
Overall conclusion and suggestion for wheel cylinder
1) Observing the process we can conclude that our process is shifted from target and
capability is very good for depth 7.5 but it‟s not capable for bore dia. 19.06 so we
need to minimize the variation between bore dia.19.06.
2) In wheel cylinder the all processes are shifted from target. We want to shift process at
target for further improvement.
3) Overall we say the process is not well settle for parameter bore dia. 19.06. We need to
observe this parameter further for process improvement.
Some suggestions for machine handler for process improvement of products are:
1) After every cycle production machine burr must be cleaned.
2) Focus on casting (raw material) adjustment.
3) Operator should handle each machine smoothly
4) During changing shifts machine setup will be checked regularly.
5) For more stability and improvement of process regular inspection is needed during
process.
References
1. Douglas C. Montgomery –Introduction to statistical Quality Control, 6th
edition.
2. Website: www.chassisbrakes.in
*****

A Compendium of Research Articles by Prospective Researchers 2019-20 Volume II | Page 70
Statistical Analysis on Different Types of Harassment Patil Kunjal P., Patil Mayur N., Chaudhari Amar R., Wagh Prashant B. and Mahajan Uchita V.*
Department of Statistics, KCES‟s Post Graduate College of Science Technology and
Research Jalgaon.
Abstract
This paper explores sexual harassment in the workplace and travelling mode. A questionnaire
has been developed and circulated for that purpose. This information is consider for the
study as it reflects the current position in Jalgaon. The expected outcome of this paper is the
development of policies and creation of awareness, which build on the findings of this
research.
Keywords: Hypothesis testing, Time series based graphs and other statistical tools.
*Corresponding author: [email protected]
Introduction
Sexual harassment is a recurring problem around the globe. Different nations have taken
measures to deal with the consequences of such a problem. Nations or companies are dealing
with the topic by either reacting or pro-acting to the salient situations. India is facing the
problem of increasing number of cases of sexual harassment at workplace despite the fact that
there are numerous laws to curb the menace. Irrefutably, it hampers women‟s constitutional
and fundamental rights to equality, justice and dignity. The paper begins with defining the
concept of sexual harassment and then looks into the various aspects allied to this brutal
issue.
Objective
To observe the frequency of woman and child abused due to harassment in Jalgaon
district.
To find the essential causes which are responsible for harassment.
To analyse the locality is responsible to harassment or not.
Tables and Graphical Representation of the collected data
Table 1: Number of student locality in percentage
student Female Male
Urban 28.4058 26.08696
Rural 21.73913 23.76812
Table 2: No. of response of students on Nirbhaya Pathak in percentage
Response Urban Rural
Yes 20.57971 26.37681
No 23.2 27.82609

A Compendium of Research Articles by Prospective Researchers 2019-20 Volume II | Page 71
From table 1 and 2, it has been observe that the proportion of response of both male and
female are same.
Fig 1: No. of response of causes of child abuse
Fig 2: Responses of student on Types of Harassment
Conclusion: From Fig 1 and 2.it can observe all factors considered under study are highly
responsible for child harassment and harassment respectively.
Fig 3: Determine response of cause of harassment in percentage
0 10 20 30 40 50 ST
U
DE
NT
NT
Causes of Harassment in %
Agree
Strongly agree
Disagree
Stongly disagree
0 10 20 30 40 50 60 70
type
Types of Harassment in %
agree
strongly agree
disagree
stongly disagree
0 20
40 60
80
mental health problem
unrestricted expectation
low self- confidence
stress to underestimate
child
Causes of child abuse in %
agree strongly agree disagree stongly disagree
A Compendium of Research Articles by Prospective Researchers 2019-20 Volume II | Page 72
Conclusion: From Fig 3.it can observe all factors considered under study are highly
responsible for all types of harassment.
Statistical tools used for assumption and hypothetical Responses:Bartlett's test of
Sphericity, Chi-square test for association, Forecasting of Data by using time series analysis
1) Bartlett's test of sphericity:
Null hypothesis H0: Population correlation matrix is an identity matrix
Alternative hypothesis H1: Population correlation matrix is not an identity matrix.
If the hypothesis that the population correlation matrix is an identity matrix is accepted
because the observed significance level is large, the use of the factor model should be
reconsidered. Test statistic is, under 𝐻0, it follows a (𝑘−1)
Decision rule: If the value of 𝜒2 statistics is greater than 𝜒2 table value then these leads to
rejection of null hypothesis.
Conclusion:
The Bartlett‟s Test of Sphericity is significant (0.0000). i.e., 𝑣𝑎𝑙𝑢𝑒 is Less than 0.05.i.e. the
significance level is small enough to reject the null hypothesis. This means that the
correlation matrix is not an identity matrix. That is the variables under Consideration are
correlated. Therefore, we can perform the factor analysis using these variables.
2) Chi-square test for association:
The test is applicable only when you have two categorical variables from a single from a
single population. It is use to determine whether there is a significant association between
two variable.
Null hypothesis H0: There is no association between the two variables
Alternative hypothesis H1: There is association between the two variables
Test Statistics is given by, χ2 = 𝑂𝑖𝑗 −𝐸𝑖𝑗
𝐸𝑖𝑗
2
Where, i is the number of levels for one categorical variable and j is the number of levels for
another categorical variable.
Aim: to test the association between any two pairs of categorical variables in
Open communication with parents:
• For student responses

A Compendium of Research Articles by Prospective Researchers 2019-20 Volume II | Page 73
1) To test independency of gender of parents with respect to communication:
Test Statistics Degrees of freedom p-value Result
4.643 1 0.031 Reject Null Hypothesis
2) To test independency of gender of parents with respect to age:
Test Statistics Degrees of freedom p-value Result
8.975 3 0.030 Reject Null Hypothesis
Interpretation:
It has been observed that the association between factors under consideration is statistically
significant.
3) Forecasting of Data by using time series analysis
One-way Analysis of variance for women harassment:
Conclusion: The maximum cases of cruelty is reported in police station during 2001 to 2007
Overall conclusion:
We have seen maximum female not secure in travelling. In Jalgaon district assault on women
is maximum. People who harassed by someone still they do not share this things with their
friends or family. To reduce harassment people must have share this problems with family,
complaint to police.
References
1. www.ncrb.com
2. Introduction to Statistical quality control by Douglas C. Montgomery, John Wiley and
sons.
*****

A Compendium of Research Articles by Prospective Researchers 2019-20 Volume II | Page 74
The Statistical Analysis of onion production (2003-2019) Mali Nirasha, Patil Rupali, Patil Akshay, Mahajan Shital D*.
Department of Statistics, Post Graduate college science, Technology & Research, Jalgaon
Abstract
Onion production has great importance in crop in recent years because of its very high export
prospective. The cultivation of onion depends on, temperature; photoperiod etc. and it may
suffers from several biological and non biological factors. Therefore one has to study the
various factors which may affect on production of onion. For this we use statistical
techniques such as Pareto chart, ANOVA and t-test.
Keywords : Pareto chart, one way ANOVA, two sample t-test
*Corresponding author: [email protected]
Introduction
Onion (Allium cepa) has been cultivated on Earth for the last 5000 years. It is the largest
vegetable produced and consumed not only in India but also in the world. In India, onion is
an extremely important commercial vegetable, having both food and medicinal values and
grown almost across the country, mainly by small and marginal farmers, for domestic
consumption as well as export. Indian onions are famous for their pungency and are available
around the year, although with varying supply volumes, which sometimes creates volatility in
prices. India produces all three varieties of onion – red, yellow and white.
Objective
To study about the onion production, onion types, climatic conditions, import, export
and consumption of onion and uses of onion.
Our main objective is to use some statistical tools.
To apply time series analysis for forecasting data.
Scope
The project was conceived with the objective of understanding the informative part
of onion plant and onion production and studies the other aspects of onion. The project output
may helpful to find future forecasting.
Statistical tools: Pareto chart: A Pareto chart is simply frequency distribution of attribute
data arranged by category. A special types of bar chart where the plotted in which values are
arranged from largest to smallest.

A Compendium of Research Articles by Prospective Researchers 2019-20 Volume II | Page 75
Fig. 1: Pareto analysis for countrywide total production of onion (2010-2017)
Conclusion: According to the Pareto chart, 80% production of onion is contributed by
China, India, USA, Egypt and 20% production of onion contributed by other countries
Fig. 2: Pareto analysis for statewide total production of onion.(2003-2019)
Conclusion: According to the Pareto chart, 80% of production of onion is contributed by
Maharashtra, Karnataka, Madhya pradesh, Gujarat, Bihar, Andhra pradesh, Rajasthan.
Total 182373 150428 27142 18023 85481
Percent 39.4 32.5 5.9 3.9 18.4
Cum % 39.4 71.8 77.7 81.6 100.0
country OtherEgyptU S AIndiaChina
500000
400000
300000
200000
100000
0
100
80
60
40
20
0
Tota
l
Pe
rce
nt
Pareto Chart of onion production during 2010-2017 in 000 tons
total 76651 34464 30035 20395 17824 12649 10837 46001
Percent 30.8 13.8 12.1 8.2 7.2 5.1 4.4 18.5
Cum % 30.8 44.7 56.7 64.9 72.1 77.2 81.5 100.0
State
Oth
er
Raja
stha
n
Andhr
a Pr
ades
hBiha
r
Guja
rat
Mad
hya
Prad
esh
Karn
atak
a
Mah
aras
htra
250000
200000
150000
100000
50000
0
100
80
60
40
20
0
tota
l
Pe
rce
nt
Pareto chart of Statewide onion production During 2003 to 2019 (In 000 T)

A Compendium of Research Articles by Prospective Researchers 2019-20 Volume II | Page 76
Worldwide statewide rank according to Production of Onion: China has 1st
rank,
India has 2nd
rank and U S A has 3rd
rank of production of onion from 2010 to 2017. In India,
Maharashtra has the first rank in onion production during the period 2003 to 2019.
According to above pie chart, China has largest contribution in onion production which is
41% while India has second largest contribution in onion production which is 34% then U S
A , Egypt, Russia, Turkey, Pakistan, Netherland, Bangladesh have contribution in onion
production 4%, 3%, 3%, 3% and 2% respectively.
Conclusion: According to above pie chart, Maharashtra has largest contribution in onion
production which is 34% .then Madhya Pradesh has second largest contribution of onion
production and Karnataka(15%), Bihar(8%), Rajasthan(5%), Andhra Pradesh(6%),
Haryana(4%), West Bengal(2%), Gujarat(9%) and Uttar Pradesh(3%).
One-way ANOVA: China, India, U S A, Iran, Egypt
Method
𝐻0 : All means are equal for given countries, Vs 𝐻1 : At least one mean is different,
Significance level α = 0.05
Analysis of Variance:
34%
14%15%
8%
5%
6%4%
2%
9%
3%
PIE CHART OF TOP 10 STATES CONTRIBUTION IN ONION PRODUCTION DURING (2003-19)
Maharashtra
Madhya Pradesh
Karnataka
Bihar
Rajasthan
Andhra Pradesh
Haryana
West Bengal
Gujarat
Uttar Pradesh
41%
34%
6%
4%4%3%3%
3% 2%
PIE CHART CONTRYWIDE TOTAL PRODUCTION DURING PERIOD 2010-2017
China P RpIndiaU S AEgypt A RpRussia

A Compendium of Research Articles by Prospective Researchers 2019-20 Volume II | Page 77
Source DF Adj SS Adj MS F-Value P-Value
Factor 4 3249347623 812336906 608.42 0.000
Error 35 46730527 1335158
Total 39 3296078150 - - -
Model Summary and Mean:
Model Summary
Means
S 1155.49 Factor N Mean Std. Dev 95%CI
R-sq 98.58% China 8 22797 958 (21967, 23626)
R-sq(adj) 98.42% India 8 18803 2314 (17974, 19633)
R-sq(pred) 98.15% U S A 8 3392.7 226.8 (2563.4, 4222.1)
Iran 8 2170.2 206.9 (1340.8, 2999.5)
Egypt 8 2253 555 (1424, 3082)
Pooled Standard Deviation = 1155.49
Decision: P-value (0.000) < alpha(0.05) hence, reject null hypothesis.
Conclusion: At least one mean is different.
One-way ANOVA: Maharashtra, Madhya Pradesh, Karnataka, Bihar,
Rajasthan
𝐻0 : All means are equal Vs 𝐻1 : At least one mean is different, Significance level α = 0.05
Analysis of Variance:
Source DF Adj SS Adj MS F-Value P-Value
Factor 4 164574183 41143546 26.87 0.000
Error 75 114852937 1531372
Total 79 279427120
Model Summary and Mean:
Model Summary Means
S 1237.49 Factor N Mean St. Dev 95%CI
R-sq 58.90% Maharashtra 16 4791 2239 (4174, 5407)
R-sq(adj) 56.70% Madhya
Pradesh 16 1877 1283 (1261, 2493)
R-
sq(pred)
53.23% Karnataka 16 2154 924 (1538, 2770)
Bihar 16 1114 142.8 (497.7, 1730.3)
Rajasthan 16 677.3 351 (61.0, 1293.6)

A Compendium of Research Articles by Prospective Researchers 2019-20 Volume II | Page 78
Pooled Std Dev = 1237.49
Decision: P-value (0.000) < alpha (0.05). We reject null hypothesis
Conclusion: Average production of onion in given states are not same.
Two-Sample T-Test and CI: Production 1, Production 2
Two-sample T for Production 1 vs Production 2
N Mean StDev SE Mean
Production 1 4 54478 2102 1051
Production 2 4 61384 3008 1504
Difference = mu (Production 1_1) - mu (Production 2_1), Estimate for difference: -6906
95% CI for difference: (-11623, -2190)
T-Test of difference = 0 (vs not =): T-Value = -3.76 P-Value = 0.013 DF = 5
Decision: P-value (0.013) < alpha (0.05). We reject null hypothesis.
Conclusion: There is significance difference between mean production of onion Period-1 and
Period-2
Overall Conclusion:
1. In India, Maharashtra is largest producer of onion production and in world china is largest
producer of onion production.
2. In world and in India 80% of onion production contributes by China, India, USA, Egypt
,and Maharashtra, Karnataka, Madhya Pradesh, Gujarat, Bihar, Andhra Pradesh,
Rajasthan respectively.
3. The forecasting values of onion production in world are 24796.00, 25689.20, 26550.00,
27378.40, 28174.5 And in India are 24796, 25689.2, 26550, 27378.4, and 28174.5
4. According to Rank table, In world China has 1st rank of onion production in period 2010-
2017.In India Maharashtra has 1st rank of onion production in period 2003-2019.
References:
1) http://agriexchange.apeda.gov.in/
2) Regression Analysis by Douglas C. Montgomery, John Wiley and sons.
*******

A Compendium of Research Articles by Prospective Researchers 2019-20 Volume II | Page 79
Statistical Analysis of Higher Education Quality in India by NAAC
Patil Umakant Prakash, Patil Avinash Sanjay, Nikam Harshal Sanjay, Mahajan S. D. * Zope V. S. *
Department of Statistics, KCES‟s Post Graduate College of Science, Technology and
Research, Jalgaon.
Abstract
As of 2020, India has over 1000 universities, with a break up of 54 central universities, 416
state universities, 125 deemed universities, 361 private universities, 7 Institute under State
Legislature Act, and 159 Institutes of National Importance which include IIMs, AIIMS, IITs,
IIITs, IISERs and NITs among others. There are 39931 Colleges affiliated to these
universities. The students are confused about in which university/ college they should take
admission where there is good quality of teaching staff, Excellent infrastructure, research
culture etc. To solve such type of problem about educational standard, National Assessment
and Accreditation council asses the quality of college and university and award the grade
with CGPA. Using the grade and CGPA we have some statistical technique to check and
compare the quality in various universities in Maharashtra and India. Secondary data of
CGPA obtained from NAAC web site has been used to analyze the data using some statistical
technique for comparison of universities.
*Corresponding authors: [email protected] and dr_zope @rediffmail.com
Introduction
India has one of the largest and diverse education systems in the world. Privatization,
widespread expansion, increased autonomy and introduction of Programmes in new and
emerging areas have improved access to higher education. At the same time, it has also led to
widespread concern on the quality and relevance of the higher education. To address these
concerns, the National Policy on Education (NPE, 1986) and the Programme of Action (PoA,
1992) spelt out strategic plans for the policies, advocated the establishment of an independent
National accreditation agency. Consequently, the National Assessment and Accreditation
Council (NAAC) was established in 1994 as an autonomous institution of the University
Grants Commission (UGC) with its Head Quarter in Bangalore. The mandate of NAAC as
reflected in its vision statement is in making quality assurance an integral part of the
functioning of Higher Education Institutions (HEIs). The NAAC functions through its
General Council (GC) and Executive Committee (EC) comprising educational administrators,

A Compendium of Research Articles by Prospective Researchers 2019-20 Volume II | Page 80
policy makers and senior academicians from a cross- section of Indian higher education
system.
VISION:
To arrange for periodic assessment and accreditation of institutions of higher
education or units thereof, or specific academic programmes or projects
To stimulate the academic environment for promotion of quality in teaching-learning
and research in higher education institutions
To encourage self-evaluation, accountability, autonomy and innovations in higher
education
To undertake quality-related research studies, consultancy and training programmes,
To collaborate with other stakeholders of higher education for quality evaluation,
promotion and sustenance.
The NAAC methodology for Assessment and Accreditation is very much similar to that
followed by Quality Assurance (QA) agencies across the world and consists of self-
assessment by the institution along with external peer assessment organized by NAAC.
CORE VALUES:
(i) Contributing to National Development, (ii) Fostering Global Competencies among
Students, (iii) Inculcating a Value System among Students, (iv) Promoting the Use of
Technology and (v) Quest for Excellence
Revised Assessment and Accreditation (A&A) Framework
The Revised Assessment and Accreditation Framework is launched in July 2017. It
represents an explicit Paradigm Shift making it ICT enabled, objective, transparent, scalable
and robust.
Data based quantitative indicator evaluation with increased objectivity and
transparency
towards extensive use of ICT confirming scalability and robustness
Simplification of the process drastic reduction in number of questions, size of the
report, visit days and so on.

A Compendium of Research Articles by Prospective Researchers 2019-20 Volume II | Page 81
Boosting benchmarking as quality improvement tool. This has been attempted
through comparison of NAAC indicators with other international QA frameworks
Introduction of Pre-qualifier for peer team visit, as 30% of system generated score
Introduction of System Generated Scores (SGS) with combination of online
evaluation (about 70%) and peer judgment (about 30%)
Introduction of the element of third party validation (DVV) of data
Distribution of Qualitative matrics (QnM), Quantitative matrics (QlM) for universities and
colleges along with the key indicators is in Table 1.
Table 1: Distribution of Metrics and KIs across Criteria
Type of HEIs Universities Autonomous
Colleges
Affiliated/Constituent Colleges
UG PG
Criteria 7 7 7 7
Key Indicators (KIs) 34 34 31 32
Qualitative Metrics (QlM) 36 35 35 36
Quantitative Metrics (QnM) 79 72 58 60
Total Metrics (QlM + QnM) 115 107 93 96
Data Analysis and Interpretations:
1. QUALITY INDICATOR FRAMEWORK (QIF) - DESCRIPTION
The criteria based assessment forms the backbone of A&A process of NAAC. The seven
criteria represent the core functions and activities of a HEI. In the revised framework not only
the academic and administrative aspects of institutional functioning but also the emerging
issues have been included. The seven Criteria along with their weightages to serve as basis
for assessment of HEIs are as above tables.
2. Statistical Analysis of CGPA of colleges various Universities in Maharashtra:
Statistical Analysis of CGPA scores of Universities in Maharashtra valid up to March 2019 is
studied for statistical parameters such as range, mean, variance, standard deviation,
coefficient of variation and standard errors. These results are given in table 2.
Institutional CGPA has been calculated by the equation
Institutional CGPA =
Where, Criterion-wise weighted Grade Point : (CrWGPi) and Weightage : (Wi)
3. Statistical Analysis of GRADES of colleges various Universities in Maharashtra:
Grades awarded to the colleges of various universities is studied which is given in table 3.

A Compendium of Research Articles by Prospective Researchers 2019-20 Volume II | Page 82
Table 2: Statistical Analysis of CGPA SCORES of Universities in Maharashtra valid up to
March 2019
Statistics BAMU KBC
NMU
Mumbai Nagpur Amravati Pune Kolhapur Solapur Nanded
Sample
size (No. of
colleges )
23 17 41 38 32 110 23 12 13
Range 1.73 2.03 2.05 1.56 1.53 1.66 1.29 1.66 1.48
Mean 2.5204 2.4906
2.5876 2.4724 2.4409 2.621
1
2.4565 2.2033 2.3631
Variance 0.2024 0.2855
0.2152 0.1810 0.19452 0.139
5
0.1056 0.2136 01976
Std.
Deviation
0.4499 0.5343 0.46387 0.4255 0.44104 0.373
5
0.3249 0.4622 0.4445
Coeff of
variation
0.1785 0.2145 0.17927 0.1721 0.18069 0.142
5
0.1323 0.2097 01881
Std Error 0.0938 0.1296 0.07244 0.0690 0.07797 0.035
6
0.0677 0.1334 0.1233
Table 3: Grade Analysis of Universities in Maharashtra as on March 2019
Grade
/No. of
colleges
(309)
BAMU
23
KBC NMU
17
Mumbai
41
Nagpur
38
Amravati
32
Pune
110
Kolhapur
23
Solapur
12
Nanded
13
A++ (2)
(0.647 %) 2
A+ (6)
(1.942 %) 2 3 1
A (44)
(
14.238%)
5 1 3 4 6 22 2 1
B++ (46)
(14.885
%)
1 3 10 8 4 17 2 1
B+ (62)
(20.06 %) 4 3 12 5 3 25 6 2 2
B (115)
(37.214%
)
11 5 9 15 15 37 12 5 6
C (34)
(11.00 %) 2 3 5 6 4 6 1 4 3
4. Statistical Analysis of CGPA of colleges various Universities in India:

A Compendium of Research Articles by Prospective Researchers 2019-20 Volume II | Page 83
Fig. 1: Average CGPA of Various States in India
Conclusion:
Only two college awarded A++ and 6 colleges awarded A+ grade in Maharashtra.. About
50% of the colleges in Maharashtra awarded either A or B++ grades. Most of the college i.e.
37.214 % of the colleges awarded B grade. Few colleges (11 % ) awarded C grade. Mean
CGPA of Mumbai University, Mumbai is maximum i.e. 2.5876 and minimum for Solapur
and it is 2.2033. Mean CGPA of KBC NMU is 2.4906. Telangana has highest average CGPA
(2.8353) in India and Himachal Pradesh has lowest (1.8825). Maharashtra universities are
among in first top ten in India in terms of average CGPA.
References:
1. www.naac.gov.in
2. Annual Report of NAAC 2017
3. Institution accredited by NAAC up to 4, March 2019.
4. NAAC News May 2020.
5. Manual for Affiliated / Constituent Colleges published in July 2017.
*****
Him
ach…
Trip
ura
Jhar
khan
d
Sikk
im
Aru
nac
h…
Meg
hal…
Jam
mu
…
Od
ish
a
Nag
alan
d
Bh
ihar
Raj
asth
an
utt
ar …
Wes
t …
Utt
arak…
Ch
hat
tis…
Gu
jara
t
Miz
ora
ma
Har
yan
a
Kar
anat…
Mad
hya
…
An
dh
ra …
Mah
ara…
Go
a
Ass
am
An
dm
an …
Tam
ilNa…
Pu
nja
b
kera
la
Del
hi
Tela
nga
na
1.51.71.92.12.32.52.72.9
Avarage CGPA of Various States in India
Average
CGPA

A Compendium of Research Articles by Prospective Researchers 2019-20 Volume II | Page 84
MATHEMATICS

A Compendium of Research Articles by Prospective Researchers 2019-20 Volume II | Page 85
Some Magical Results of Various Numbers Bhamre Neha Devidas, Badgujar Lalita Rajendra & Nhavi Dnyaneshwar R.*
Department of Mathematics, Post Graduate College of Science Technology and Research,
Jalgaon
Abstract
In this paper we express the different numbers in various forms and some of them are
generalized. Also we find the one property related with the number 11.
Keywords: even numbers, odd numbers, squares, divisibility.
Corresponding author: Email: [email protected]
Introduction
A rapid progress of the world in the number theory, there are lots of magical theories are
innovated. Number theory is a major tool in the mathematics and other sciences.
What is the magic number in mathematics? It is 1729(called Hardy-Ramanujan number)
which was discovered by mathematician Srinivas Ramanujan. A number 1729 is called magic
number because it can be expressed as the sum of the cubes of two different sets of numbers.
From the same idea we developed such types of numbers, in which we expressed that
numbers as like number 1729 and also add some mathematical approach. We find another
numbers like as above and express that in interesting forms. There are lots of properties of
various numbers which increase the beauty of the number theory. For example 12 = 1
112 = 121
1112 = 12321
11112 = 1234321 and so on
Also we introduced the one property of number 11.
Methodology
Number 2017:
We express this number as
92 + 442 = 2 × 73 + 113 = 2017
Number 2020:
2020 is the most memorable year. During this year the world suffering from Covid-19
virus. We express this number as sum of squares of two different numbers in two ways
162 + 422 = 2020
242 + 382 = 2020
Number 2025:

A Compendium of Research Articles by Prospective Researchers 2019-20 Volume II | Page 86
This number 2025 can be expressed in following different ways
(20 + 25)2 = 272 + 362 = 2025
52 + 202 + 402 = 2025
102 + 202 + 252 + 302 = 2025
2 + 0 + 2 + 5 × 225 = 2025
Number 1458:
This is the amazing number. We can express this number as follows
1 + 4 + 5 + 8 × [ 1 + 8 × (4 + 5)] = 18 × 81 = 1458
1 + 4 + 5 + 8 + 1 × 4 × 5 × 8 × 1 + 8 = 1458
2 × 272 = 2 × 93 = 1458
[2 1 + 4 + 5 + 8 ]2 +(1+4+5+8)2
2= 1458
2 × 13 + 43 + 53 + 83 + 3 × 1 + 4 + 5 + 8 = 1458
Number 1981:
This can be expressed as (1) the sum of the cubes of four numbers, (2) difference of
cubes of two numbers.
1. 113 + 73 + 63 + 43 + 33 = 1981.
2. 133 − (6)3 = 1981.
Number 1800:
This can be expressed as the sum of the cubes of first five even numbers
23 + 43 + 63 + 83 + 103 = 1800.
If we add these five numbers we get 30 and 2 × 302 = 1800.
In general 23 + 43 + ⋯ + (2𝑛)3 = 2(2 + 4 + ⋯ + 2𝑛)2.
The result for the same is the sum of cubes of first 𝑛 even numbers is equal to eight
times the sum of cubes of n numbers.
23 + 43 + … + (2𝑛)3 = 8(13 + 23 + ⋯ + 𝑛3)
Number 1225:
This can be expressed as the sum of the cubes of first five odd numbers
13 + 33 + 53 + 73 + 93 = 352 = 1225.
Also, it can be expressed as the sum of squares of three different numbers in two ways
102 + 152 + 302 = 1225
62 + 102 + 332 = 1225
Number 12345679:
If the number 12345679 multiplies by table 9 then we get magical answer
12345679 × 9 = 111111111
12345679 × 18 = 222222222
12345679 × 27 = 333333333
…….
12345679 × 81 = 999999999
Property of number 11:
Consider one number between 01 to 99 say 𝑎𝑏 and take 𝑏𝑎 reverse of that number.

A Compendium of Research Articles by Prospective Researchers 2019-20 Volume II | Page 87
Then
1. 𝑎𝑏 + 𝑏𝑎 is divisible by 11
2. The four digit number 𝑎𝑏𝑏𝑎 is divisible by 11.
Conclusion:
We can find such type of numbers and express in various forms. Also we can develop
properties of some numbers.
References:
1. Hardy Ramanujan number, Wikipedia.
2. Elementary Number Theory, David M. Burton, Tata McGraw-Hill Publishing Company
Limited.
3. Introduction to Analytic Number Theory, Tom M. Apostol.
*****
A Compendium of Research Articles by Prospective Researchers 2019-20 Volume II | Page 88
Some Results of Mathematics those are shown in Nature Zambare Kanchan Yuvraj, Sharma Sarita Savarmal and Pawar Prachi P.*
Department of Mathematics, KCES‟s Post Graduate College of Science Technology and
Research, Jalgaon
Abstract
In this paper we discuss about the terms of mathematics that are demonstrate in nature. The
nature shows various patterns in trees, birds, flowers, animals etc in which we introduce the
mathematics regarding with that.
Keywords: symmetry, hexagon, polygon, Fibonacci series
*Corresponding author: [email protected]
Introduction
Mathematics plays vital role in various fields. The nature filled with the full of mathematics.
If we consider flowers there is one of the mathematics related term. There is mathematics on
the animals. In the honey comb there is one type of mathematics like hexagonal symmetry.
The great mathematician Euclid says, "The laws of nature are but the mathematical thoughts
of God".
Mathematics in Nature is an excellent and undaunted introduction to the ideas and methods of
mathematical modeling. To formulate and solve puzzles which are observed in nature and for
the solution of it mathematics plays crucial role. The art of estimation and the effects of scale
are also introduced by the mathematics. Mathematics is all around us. As we discover more
and more about our environment and our surroundings we see that nature can be described
mathematically. The beauty of a flower, the majesty of a tree, even the rocks upon which we
walk can exhibit nature‟s sense of symmetry.
Methodology
The various forms in the nature describe mathematically such as rainbows, river meanders,
spider webs, honeycombs, and the markings on animal coats, etc. The beautiful patterns on
hills, volcanoes, animals, butterfly, leaf, etc can be described mathematically.
I. Geometrical shapes:
There are different types of geometrical shapes observed in nature. Earth is one of
geometrical shape with tremendous gravity on its outer edges. The Earth shows geometric
shape called sphere. Other geometric shape hexagons fit most closely together without
any gaps which is appeared in honey comb. In the honey comb, the hexagonal wax cells
are used for what bees create to store their eggs and larvae. Hexagons are six-sided

A Compendium of Research Articles by Prospective Researchers 2019-20 Volume II | Page 89
polygons, closed, 2-dimensional, many-sided figures with straight edges. Also
geometrical shape cones are made by volcanoes. The formation of cones with the
steepness and height of which depends on the runniness (viscosity) of the lava. If speed
of runny lava is fast then it forms flatter cones and thick, viscous lava forms steep-sided
cones. Cones are 3-dimensional solids.
II. Fibonacci number:
If you construct a series of squares with lengths equal to the Fibonacci numbers (1, 1, 2,
3, 5, 8, 13, 21, etc) and trace a line through the diagonals of each square, it forms a
Fibonacci spiral. Examples of the Fibonacci spiral can be seen in nature, including in the
chambers of a nautilus shell. Fibonacci spiral can be also found in sunflower, Pineapple.
III. Symmetry
Symmetry is everywhere in the Nature. Symmetry is when a figure has two sides that are
mirror images of one another. Symmetry would then be possible to draw a line through a
picture of the object and along either side the image would look exactly the same. This
line would be called a line of symmetry.
There are two kinds of Symmetries: 1.Bilateral symmetry and 2.Radial symmetry
1. Bilateral symmetry: An object has two sides that are mirror images of each other are
called bilateral symmetry. For example human body, butterfly, leaf, etc.
2. Radial symmetry: In the radial symmetry a center point and numerous lines of symmetry
could be drawn. Radial symmetry is rotational symmetry around a fixed point known as
the center. Radial symmetry can be classified as either cyclic or dihedral. For examples
some flowers, spider comb, starfish, China rose, etc. The half orange internal structure is
one of the examples of radial symmetry.
Conclusion
Mathematics is everywhere in this universe. We hardly ever note it. We enjoy nature and
study about what mathematical idea is in it. Mathematics expresses itself everywhere, in all
most every facet of life- in nature all around us.
References
1. Adam, John A; Mathematics in Nature: Modeling Patterns in the Natural World,
published by New Jersey K: Princeton University Press, 2003.
2. Mathematics in nature, Wikipedia.
*****
