a comparison of project delivery systems on united states federal construction projects
TRANSCRIPT

REPORT DOCUMENTATION PAGE Form Approved OMB No. 0704-0188
Public reporting burden for thi» collection of information ii ottimated to average 1 hour par responu, including the tin» for rniowing instructions, Marching »listing data sources, gathoring and maintaining the data needed, and completing and reviewing the collection of information. Send comment» regarding thi» burdan estimate or any other aspect of thii collection of information, including suggestions for reducing this burden, to Washington Headquarters Services, Directorate for Information Oparations and Reports, 1215 Jefferson Davis Highway, Suit» 1204, Arlington, VA 22202-4302, and to the Office of Management and Budget, Paperwork Reduction Project (0704-0108), Washington, DC 20S03.
1. AGENCY USE ONLY {Leaveblank} 2. REPORT DATE
7 August 1998 I 3. REPORT TYPE AND DATES COVERED
4. TITLE AND SUBTITLE
A COMPARISON OF PROJECT DELIVERY SYSTEMS ON UNITED STATES FEDERAL CONSTRUCTION PROJECTS
6. AUTHOR(S)
Shawn D. Moore
5. FUNDING NUMBERS
7. PERFORMING ORGANIZATION NAME(S) AND ADDRESS(ES)
The Pennsylvania State University 8. PERFORMING ORGANIZATION
REPORT NUMBER
98-048
9. SPONSORING/MONITORING AGENCY NAME(S) AND ADDRESS(ES)
THE DEPARTMENT OF THE AIR FORCE AFJT/CIA, BLDG 125 2950 P STREET WPAFB OH 45433
10. SPONSORING/MONITORING AGENCY REPORT NUMBER
11. SUPPLEMENTARY NOTES
12a. DISTRIBUTION AVAILABILITY STATEMENT
Unlimited distribution In Accordance With 35-205/AFIT Sup 1
12b. DISTRIBUTION CODE
13. ABSTRACT (Maximum200 words/
14. SUBJECT TERMS
17. SECURITY CLASSIFICATION OF REPORT
18. SECURITY CLASSIFICATION OF THIS PAGE
18. SECURITY CLASSIFICATION OF ABSTRACT
15. NUMBER OF PAGES
119 16. PRICE CODE
20. LIMITATION OF ABSTRACT
Standard Form 298 (Rev. 2-89) (EG) Prescribed by ANSI Sid. 239.18 Designed using Perform Pro, WHS/DIOR, Oct 94

The Pennsylvania State University
The Graduate School
College of Engineering
A COMPARISON OF PROJECT DELIVERY SYSTEMS ON
UNITED STATES FEDERAL CONSTRUCTION PROJECTS
A Thesis in
Architectural Engineering
by
Shawn D. Moore
Copyright 1998 Shawn D. Moore
Submitted in Partial Fulfillment of the Requirements
for the Degree of
Master of Science
August 1998
%TI0 QUALITY ESSPECTEBI
We approve the thesis of Shawn D. Moore.
Date of Signature
V'4v £4« L- Victor E. Sanvido Professor of Architectural Engineering Thesis Advisor
M. Kevin Parfitt Associate Professor of Architectural Engineering
£/"• m
sfic/n
William P. Bahnfleth Assistant Professor of Architectural Engineering
Richard A. Behr Professor of Architectural Engineering Head of the Department of Architectural Engineering

I grant The Pennsylvania State University the nonexclusive right to use this work for the
University's own purposes and to make single copies for the work available to the public
on a not-for-profit basis if copies are not otherwise available.
^W^-p fyLvg, Shawn D. Moore
Ill
ABSTRACT
Previous subjective research identified shortened project duration as the primary
reason for public owners' selection of design-build for project delivery. This study
presents specific comparisons of the design-bid-build and design-build delivery systems
to objectively inform federal project owners of actual project performance.
The United States Federal Construction Program, deeply rooted in traditional design-
bid-build project delivery, has attempted to a limited degree to deliver projects via the
design-build delivery system to better meet project cost, schedule and quality goals. This
research first analyzed 273 completed private, public and federal construction projects to
provide direct, objective comparison of cost, schedule and quality performance between
design-bid-build and design-build project delivery systems. An in-depth investigation
was then conducted on the 88 federal construction projects to compare projects by
delivery system based on equivalent project delivery system start at zero percent design
complete.
This research collected project specific cost, schedule and quality data, as well as
several variables known to impact project performance. Univariate statistical testing of
15 performance metrics identified several significant differences in delivery system
performance, which were further analyzed by percent design complete prior to
construction contract award. Quality performance measurements addressed the influence
of time in objectively assessing completed facility quality. Multivariate linear regression
modeling tested each delivery system, facility type, and more than 70 variables to explain
the highest proportion of variation in project delivery speed.
IV
TABLE OF CONTENTS
LIST OF FIGURES vi
LIST OF TABLES vii
GLOSSARY OF TERMS viii
ACKNOWLEDGEMENTS xii
CHAPTER 1: INTRODUCTION 1
1.1 Background 2 1.2 Problem Statement 3 1.3 Research Objectives 4
1.3.1 Scope 4 1.3.2 Relevance 5
1.4 Research Methodology 6 1.5 Research Findings 8 1.6 Reader's Guide 9
CHAPTER2: LITERATURE REVIEW 10
2.1 Project Delivery Systems 10 2.2 Relevant Research 15
2.2.1 Delivery Process Modeling and Planning 16 2.2.2 Empirical Project Delivery Research 18 2.2.3 Objective Project Delivery Research 21
2.3 Summary of Literature Review 24
CHAPTER 3: DATA COLLECTION METHODS 25
3.1 Phase One Data Collection 25 3.1.1 Data Collection Tool 26
3.1.1.1 Project Characteristics 26 3.1.1.2 Project Delivery System 27 3.1.1.3 Project Schedule Performance 27 3.1.1.4 Project Cost Performance 27 3.1.1.5 Project Quality Performance 28 3.1.1.6 Project Team Characteristics 29 3.1.1.7 Project Data 31 3.1.1.8 Project Success Criteria 31 3.1.1.9 Lessons Learned 31
3.1.2 Data Standardization 32 3.1.3 Data Verification 34
3.2 Phase Two Data Collection 34 3.3 Summary 38
V
CHAPTER 4: PERFORMANCE MEASUREMENT AND DATA ANALYSIS METHODS 39
4.1 Project Performance Measures 39 4.1.1 Cost Performance Measures 40 4.1.2 Schedule Performance Measures 41 4.1.3 Quality Performance Measures 42
4.2 Data Analysis Methods 43 4.2.1 Univariate Comparisons 44 4.2.2 Multiple Linear Regression Modeling 45
4.3 Summary 47
CHAPTER 5: RESULTS 48
5.1 Delivery System Performance by Private, Public and Federal Owners 48 5.1.1 Univariate Results by Owner Type 49 5.1.2 Summary of Univariate Results by Owner Type 53
5.2 Federal Project Data 55 5.3 Federal Project Univariate Results 59
5.3.1 Univariate Cost Results 60 5.3.2 Univariate Schedule Results 62 5.3.3 Univariate Quality Results 65 5.3.4 Univariate Results by Facility Type 69 5.3.5 Univariate Results by Percent Design Complete 71 5.3.6 Summary of Univariate Results 73
5.4 Multivariate Results for Delivery Speed 74 5.4.1 Federal Multivariate Results 74 5.4.2 Comparison of Federal and CII Delivery Speed Model Results.. 77
5.5 Summary 79
CHAPTER 6: DISCUSSION AND CONCLUSIONS 80
6.1 Main Findings 80 6.2 Discussion 82
6.2.1 Quality 82 6.2.2 Delivery Speed 83
6.3 Implications for Federal Project Owners 86 6.4 Limitations 88 6.5 Contributions 90 6.6 Future Research 91 6.7 Conclusions 92
BIBLIOGRAPHY 95
APPENDIX A: PROJECT DELIVERY SYSTEM DATA COLLECTION TOOL 100
APPENDIX B: SUMMARY STATISTICS - PHASE ONE: ORIGINAL Cn STUDY DATA ... 107
APPENDIX C: SUMMARY STATISTICS - PHASE TWO: NEW FEDERAL DATA 113

VI
LIST OF FIGURES
Figure 2.1: Contractual relationships for design-build projects 11
Figure 2.2: Contractual relationships for design-bid-build projects 12
Figure 2.3: Sequence of activities in the facility delivery process by delivery system for federal projects 13
Figure 5.1: Distribution of original 273 project sample by owner and facility type 49
Figure 5.2: Matrix of significant project delivery system performance for private projects by facility type and metric 51
Figure 5.3: Matrix of significant project delivery system performance for public projects by facility type and metric 52
Figure 5.4: Matrix of significant project delivery system performance for federal projects by facility type and metric 54
Figure 5.5: Distribution of projects by facility type and delivery system 57
Figure 5.6: Distribution of project size in square feet 58
Figure 5.7: Distribution of total project cost 58
Figure 5.8: Distribution of project unit cost in dollars per square feet 59
Figure 5.9: Occurrence of completion versus contracted project cost 61
Figure 5.10: Schedule growth distribution by delivery system 63
Figure 5.11: Occurrence of on-time project schedule performance 64
Figure 5.12: Original mean operation/maintenance scores by delivery system and years since project completion 67
Figure 5.13: New mean operation/maintenance scores by delivery system and years since year completion 67
Figure 5.14: Matrix of significant project delivery system performance for new federal project data by facility type and metric 70
Figure 5.15: Matrix of significance for federal proj ects by design complete phase at construction contract and metric 72

Vll
LIST OF TABLES
Table 5.1:
Table 5.2:
Table 5.3:
Table 5.4:
Table B.l
Table B.2
Table B.3:
Table B.4:
Tabled:
Table C.2:
Table C.3:
Sample statistics for cost performance measures by delivery system 60
Sample statistics for schedule performance measures by delivery system 62
Sample statistics for quality performance measures by delivery system one year the CII study 65
Ordered influence of explanatory variables in delivery speed variation for new federal data and original CII data 78
Summary statistics by project owner type 109
Summary statistics for private projects by facility type and metric 110
Summary statistics for public projects by facility type and metric Ill
Summary statistics for federal projects by facility type and metric 112
Summary statistics for new federal project data by facility type and metric 115
Summary statistics for new federal project data by percent design complete phase at construction contract award and metric 117
Summary statistics for mulitvariate regression model for delivery speed 119
Vlll
GLOSSARY OF TERMS
Construction Procurement Speed: The rate at which a facility is procured for
construction. It is measured by the facility's gross area in square feet divided by the
number of months taken to procure the construction contract. Procurement time is the
total time between the date of construction project advertisement in the Commerce
Business Daily (CBD) and the subsequent notice to proceed date after contract award for
either the construction or design-build effort. For design-build projects, the construction
procurement time begins with either the solicitation for offer or request for proposal
(whichever applies) on the date advertised in the CBD and ends on the notice to proceed
date. Included in this time period are proposal development, submission, evaluation,
selection, negotiation and award of the contract. Design-bid-build construction
procurement time begins on the CBD construction bid invitation announcement date and
ends on the notice to proceed with construction date.
Construction Speed: The rate at which a facility is constructed measured in square feet
per month of construction time. Construction time is the total time elapsed between the
contract award date and the beneficial occupancy date. Design-build construction time
begins on the construction start date and ends on the beneficial occupancy date. Some
design-build projects reported the construction start date on the same date as the design-
build design start date.
Cost: The amount of money paid by an owner for the design and construction of a
facility, measured in U.S. dollars. Costs exclude the value of land acquisition, extensive
site work, process equipment or owner costs.
Design-Build: The process whereby an owner contracts with a single entity to perform
both design and construction under a single design-build contract. Contractually, design-
build offers the owner a single point of responsibility for design and construction

IX
services. Portions or all of the design and construction may be performed by the entity or
subcontracted to other companies (either design or construction).
Design-Bid-Build: Traditional project delivery system in the U.S. construction industry
wherein an owner contracts separately with a designer and a construction contractor. The
owner normally contracts with a design company to provide complete design documents
from concept (0% design) through detailed design drawings and specifications (100%
design). The owner or owner's agent then solicits bids from construction contractors
based on the design drawings. One contractor usually is selected and enters into a
contractual agreement with the owner to construct the facility in compliance with the
design drawings and specifications. The owner contracts separately with a construction
contractor based on acceptable bids estimated from the design documents to execute and
complete facility construction.
Facility Delivery Process: The activities required to provide a facility from facility
programming through facility operation and maintenance.
Facility Programming: "The process of analyzing the owner's desires, needs, goals and
objectives in order to define the essential facility requirements and present that criteria to
the designer. The program must establish and maintain an information framework which
can be utilized as an evaluation and decision making tool throughout the life cycle of
construction" (Perkinson, 1991).
Facility Team: "All parties who perform activities in the facility delivery process.
These may include the owner architect/engineer, constructor, design-build entity, and
subcontractors" (Konchar, 1997).
Project Delivery Speed: The rate at which a facility is delivered from contracted
concept design initiation to beneficial occupancy date at construction completion. Based
on a facility's gross square footage, delivery speed is measured in square feet per month
of project duration.
Project Delivery System: The roles, interaction, and obligations of contracted parties
and the sequence of activities necessary to provide a facility project from design concept
initiation through construction completion.
Project Design Phases: The four sequential phases of a project's design throughout the
entire design process from zero percent design complete to completion of construction
documents. The four phases are as follow:
Concept Design Phase: (0% to 15% design) The start of the facility design process
initiated by the design contract award date. This phase of design includes preliminary
project estimate, site analysis, and conceptual architectural drawings (AIA, 1987).
Schematic Design Phase: (15% to 35% design) Graphical sketches, models, and
spatial relationships from the concept phase are developed into clearly defined project
site layout, interior spaces and dimensions, building systems and component
equipment layout, parametric estimate and engineering reports (AIA, 1987).
Design Development Phase: (35% to 65% design) The phase in the design process
wherein a detailed construction estimate is begun, architectural plan, section and
elevation relationships are finalized, structural foundation and facility frame are
refined, building systems are appropriately sized, outline specifications are developed
into respective sections, and material selection is well-underway (AIA, 1987).
Contract Documents Phase: (65% to 100% design) The phase after design
development is complete wherein the construction project estimate is finalized,
construction drawing details are created and completed, all materials are scheduled,
XI
building systems are fully integrated, specifications are completed, and construction
bidding documents are completed (AIA, 1987).
Quality: The degree to which a facility meets the expected facility performance. Quality
is measured by comparing the actual performance with the facility user's or owner's
expectations of the referenced building.
Schedule: The total elapsed time taken by the facility team to design and construct a
facility, measured in calendar days.

Xll
ACKNOWLEDGMENTS
I would like to thank the Air Force Institute of Technology for this opportunity to
advance my knowledge by believing and investing in my professional and technical skills
through The Pennsylvania State University Construction Management graduate program.
To my mentor and coach, Dr. Victor Sanvido, I express my genuine appreciation and
deepest respect for your persistant inquiry, integrity and vision. Your knowledge,
perspective, and motivation served as a catalyst to drive my academic pursuits, research
frustrations, and dedication to advancing the design and construction industry. Thank
you for teaching me how to learn for life.
To my friends and colleagues in the Computer Integrated Construction Laboratory, I
am sincerely grateful for your camaraderie, support and patience in conducting this
research. I extend particular thanks to Dr. Mark Konchar whose interest, insight and
expert consultation provided tremendous value to this research. Thank you all for
teaching me the importance of collaboration and teamwork.
To my role models, Mom and Dad, I owe my confidence and accomplishments to
your parenting. My goals and dreams would not be attainable were it not for your
constant interest, encouragement, and love. Thank you for teaching me discipline,
responsibility, and compassion.
Most importantly to my two beautiful ladies, my wife Michelle and daughter Katie,
I owe you my eternal love, gratitude and devotion. Your sacrifice, unending belief,
patience, strength and ceaseless smiles put this research effort and life itself into
perspective. Thank you for teaching me the power of love and life.
CHAPTER 1
INTRODUCTION
As early as the 1960s, the design and construction industry recognized that the
success of a project was often impacted by the project delivery system used (AIA, 1975).
Owners sought alternatives to the traditional design-bid-build method to obtain
professional services and guaranteed price to deliver their projects within cost, schedule
and quality requirements without having to commit to complete design.
Over the past several centuries until the conclusion of World War II, the master-
builder was the dominant professional responsible for project delivery (Sanvido et al.,
1992). This master-builder was educated and trained to be fully knowledgeable of and
responsible for both the design and the construction of their projects. However, as
buildings became more specialized, master-builders were replaced by specialists in
planning, design, contracting and construction, thus effectively fragmenting the design
and construction process. As a result, the design-bid-build or traditional method emerged
as the standard project delivery system in the United States construction marketplace.
This is especially true of the United States Federal Government which has structured
its project acquisition and execution policies around the design-bid-build project delivery
system. Over the past several decades the traditional design-bid-build method of
sequentially planning, designing and constructing facilities has successfully met some of
the demands of the cost and schedule driven federal projects. Despite these successes,
this system has some shortcomings. Pocock (1996) reported an average cost growth of
approximately 8% since 1988 for military projects utilizing this traditional system. With
federal construction budgets becoming smaller (Ichniowski, 1998), the government is
looking for more effective methods to deliver projects using increasingly scarce
resources.
As a designer and project manager in the Air Force, the researcher has personally
encountered and contributed to problems stemming from the "hand-off of the design
from the architect to the construction contractor. Often times, the design did not come to
fruition nor did the building support the user's goals or needs. This does not suggest that
all projects encounter problems associated with the use of the traditional system. In fact,
there is no evidence on which to make such a claim of one system's performance over
another for federal projects. An objective and quantitative comparison of projects
accomplished by design-bid-build and design-build will help federal agencies decide
which project delivery approach might be better suited for a project.
1.1 BACKGROUND
The design-build concept has been gaining in project application in recent years in the
general building sector of construction. Most recently it accounted for nearly 25 percent
of the 286 billion dollars expended in 1996 for non-residential construction (Tarricone
1996, U.S. Dept. of Commerce, 1997). This marked a 103 percent increase in the
number of design-build contracts over $5 million in value from the previous year (DBIA,
1996). As the interest in and the use of alternate project delivery mechanisms, especially
design-build, grows within the private sector (Kreikemeier, 96), the United States Federal
Government is likewise seeking to inject contractor expertise into the design process via
design-build project delivery.
In 1967 design-build was introduced into the federal sector by order of Congress for
limited use only on residential projects within the Department of Defense. This was a
major milestone in challenging the policies governing both the procurement of design
A/E services (Brooks Act, 40 U.S.C. SS 541) as well as competitively bid construction
contracting (FAR, Part 36.103). From 1985 to 1993 the use of design-build project
delivery for military construction projects was limited to 3 facilities a year, with less
restrictions imposed on the frequency of its use after 1993 (Duncan, 1997). The United
States Postal Service executed its first design-build project in 1989. It has steadily
increased its use of design-build project delivery by approximately 5 percent each year to
its current 30 percent share of USPS project delivery (Ferrari, 1997). Recently, passage
of the Federal Acquisition Reform Act of 1996 formally authorized design-build project
delivery for broad application by federal agencies for their facilities. This change will
most likely increase the use of this project delivery system.
The Federal Bureau of Prisons (FBOP) recently changed its contracting philosophy
and delivery process to design-build (Ichniowski, et al., 1998). FBOP cited design and
construction collaboration as the main reason for adopting design-build. This integration
of the designer and contractor is usually deemed more desirable since it allows designers
and builders to interact during initial concept design, material selection, and
constructability reviews (The Collaborative Process Group, 1996). This should allow
FBOP to better cope with cost and time pressures to execute several new prison facilities
over the next several years. A recent study of military projects using various project
delivery systems identified a relationship between degree of project integration and
successful project execution (Pocock et al., 1996) worth investigating further.
Unfortunately, very limited literature exists that objectively and quantitatively reports the
successes and lessons learned from the applications of design-build within the federal
government.
1.2 PROBLEM STATEMENT
Very little objective and quantifiable data has been collected that shows specific cost
and schedule savings or enhanced quality performance by delivery systems used on
public projects (Mouritsen, 1993, Songer 1996). A comparison of project costs, schedule
and quality performance of design-bid-build and design-build projects will establish a
benchmark. Next, a list of guidelines to better help owners select delivery systems for
U.S. Federal Construction Program projects can be developed.

1.3 RESEARCH OBJECTIVES
The research had the following four objectives:
1. Compare total project costs, schedule and quality characteristics of U.S. Federal
Government projects using design-build and design-bid-build delivery systems by
facility type and performance metric.
2. Relate these cost, schedule and quality findings to those found in the general public
and private sectors of construction.
3. Investigate objective metrics to equally measure each delivery system's performance.
4. Describe project characteristics which explain the highest proportion of variation in
delivery speed performance.
1.3.1 SCOPE
This research focused on data collected from public sector facility projects completed
inside the continental United States within the past five years. Project data collected
from the General Services Administration, Department of Defense, Department of
Veterans Affairs, the National Aeronautics and Space Administration, and the United
States Postal Service represented federal design and construction projects. Though local
and state governments also execute facility projects within the public sector of the United
States, they adhere to jurisdictional regulations and restrictions which vary by
municipality and state (Roberts et al., 1996). Their procedures are not necessarily in
accordance with federal acquisition regulations; therefore, local and state public agency
facility projects reported in this study are considered independently of the federal
construction sector.
The federal acquisition regulations also served to narrow the scope of alternate
project delivery systems studied. Construction management is another project delivery
system used within the private sector; however, this mechanism is not currently
supported in executing federal construction projects within the United States.
Project performance examined in this study is limited to the installed costs, schedule
and quality measures of the projects reported. The time and costs to accomplish pre-
project planning activities and programming documentation are not included in this
research. These tasks occur prior to the start of the project delivery process as measured
from zero percent design complete in this research. Likewise, actual cost and schedule
data to complete facility start-up and operation beyond the beneficial occupancy date
were not collected. Other costs and benefits, such as organizational, social and
environmental, and compliance with existing ordinances and statutes of various
governmental entities are not addressed in this study.
1.3.2 RELEVANCE
Differences exist between the organizational behavior and composition of the private
sector and the public sector design and construction industry. This is based on the
position of the owner and his/her agents in administering, monitoring, and paying for the
project (NSPE, 1994). However, it is assumed that both delivery systems attempt to
provide facilities at the least possible cost to meet the facility requirements. Certainly,
the private sector is more profit driven, whereby the project delivery system serves to
support the most efficient execution of the facility. In contrast, the federal government is
more process driven in the procurement and execution of projects due to regulatory and
budgetary constraints imposed by Congress (Mouritsen, 1993). Therefore, this research
is critical in reporting accurate project performance data and measures for federal
construction projects. As a result, influential project characteristics that are identified
within the owner's control can help government agencies better execute their facility
projects within their regulatory constraints.

1.4 RESEARCH METHODOLOGY
Critical success factors and criteria identified through the literature review were used
to develop objective project performance measures. A structured survey distributed
throughout the federal construction industry provided comprehensive project data.
Statistical analysis of projects by delivery system and facility type allowed direct
comparison of project performance and the identification of variables most influential in
explaining project outcomes.
To achieve the research objectives, the following steps were taken.
1. Review relevant literature.
Inquiry into project delivery literature provided an understanding of the current state
of project delivery specific knowledge and research. Literature review encompassed
building process models, critical success factors, owner selection criteria, comparative
studies of project delivery performance, and objective measurement and testing.
2. Develop and test objective performance metrics.
A data collection questionnaire was developed to objectively collect cost, schedule
and quality data. The data collection instrument was designed through several trial
attempts using actual project data provided by member organizations of the Construction
Industry Institute (CH) Taskforce sponsoring this research. Project characteristics
identified through literature and expert interview were incorporated into the data
collection tool for use in clearly defining the project type as well as explaining any
specific project attributes that may explain differences in performance.
3. Collect data.
Data was collected in two phases. Phase one data collection distributed a data
collection tool via mail to project owners, architect/engineers, design-builders, and
constructors nation-wide. Use of the survey provided random sampling of the entire
construction industry. Follow-up phone calls to respondents verified the accuracy and
completed the data. The quality rating input was provided by owners, thus preventing
bias by constructors. This data collection effort constituted the original base study data
collection sponsored by the Construction Industry Institute (CII).
Phase two used interviews with each public project owner to identify all federal
projects. Collaboration with federal experts and project owners identified several key
issues omitted in the original study. As a result, new cost and schedule questions were
developed to support new performance measures. New performance measures compared
project delivery systems by performance metric including all design effort starting at zero
percent design complete. Furthermore, federal project owners, specifically project
managers and facility users/ operators, reassessed the quality performance of their
facilities one year after their initial quality ratings were provided in the CII study.
4. Analyze data
To objectively analyze costs and compare similar facilities by delivery system, costs
were indexed and facilities were classified. Project unit costs were adjusted for time and
location to baseline all projects as of December 1996. Based on the initial building type
reported from each respondent, researchers analyzed each facility's systems and their
complexity, team member experience, project systems used, and facility unit cost to
identify any similarities. This exercise subsequently categorized each facility into one of
six facility types: light industrial, multi-unit dwelling, simple office, complex office,
heavy industrial, and high-technology.
8
Univariate comparisons were conducted on the original CII study data when sorted by
private, public and federal projects for each facility type. Univariate comparisons of
delivery systems for each performance metric utilized non-parametric statistical methods
to test for significant inequalities in reported data. Both mean and median values were
statistically tested using 2 sample t-tests and Mood's median tests to represent the central
tendency of the reported cost and schedule performance data. Quality performance data
collected using discrete variables required the sole use of 2 sample t-tests to compare
each delivery system's mean score for significant differences. Hypothesis testing was
conducted on all 85 original projects and 3 new projects by delivery system for all
projects and for each facility type. Results of significant differences were provided at the
95 percent confidence level. Next using new project data, univariate comparisons of
design-build and design-bid-build federal projects analyzed differences based on the new
cost and schedule data inclusive of initial design efforts. Comparisons again addressed
delivery system performance for all projects and for facility type.
Multiple linear regression modeling of the delivery speed metric was used to test the
influence of several variables on the variation in delivery speed for all 88 projects. With
all other variables present in the explanatory model, each delivery system was tested
individually to measure their impact on the performance metric, and hence identify the
differences between them.
1.5 RESEARCH FINDINGS
Based on the objectives previously noted, this research provided the following results:
1. Direct, objective comparisons identified design-build projects performed better than
design-bid-build projects for private, public, and federal projects; however, results
differed by performance measure and facility type for each owner.
2 Federal design-build and design-bid-build projects experienced equal delivery speed
performance when measured from zero percent design start.
3 Qualitative investigation of the influence of time since project completion identified
design-build projects to have less difficulty in facility start-up and lower operation/
maintenance costs than design-bid-build projects.
4 Projects contracted for construction during the concept design phase performed better
than projects contracted during the construction documents phase.
5 Facility size, facility type and delivery system explained the greatest proportion of
project delivery speed variation.
5.1 READER'S GUIDE
Chapter 2 defines the project delivery systems studied in this research and provides
summaries of project delivery related literature. Chapter 2 includes research on project
delivery process modeling and project planning, non-empirical studies of project success
factors and criteria, and empirical studies of project delivery system performance.
Chapter 3 provides a description of the data collection methods used in acquiring
objective data from both industry-wide and federal owner specific projects. The data
collection tool is accompanied by definitions of all the variables included in this
instrument. Federal project owner specific questions are also explained in detail. In
chapter 4, the fifteen project performance metrics are followed by the associated
univariate and multivariate data analysis comparisons of project delivery systems.
Chapter 5 provides the results of comparing delivery systems by performance metric for
both the original CII and new federal data. Chapter 6 presents contributions and
limitations of this research, future research areas and conclusions.
10
CHAPTER 2
LITERATURE REVIEW
Chapter 2 provides a summary of recent and current research to establish the
framework for this thesis. This chapter first defines project delivery for design-build and
design-bid-build, followed by summaries of relevant project delivery system research.
These empirical and objective studies address the delivery system process, its application
and selection within the private and public sector construction industry.
2.1 PROJECT DELIVERY SYSTEMS
Projects can be designed and constructed in a variety of different combinations in
delivering a complete and useable facility. Some of the generic names assigned to
delivery mechanisms used throughout the United States are construction management at
risk, construction management agency, program management, multiple-prime
contracting, design-build and design-bid-build. According to Ireland (1982), all the
various delivery method definitions attempt to "describe the roles of participants, the
relationships between them, both formal and informal, the timing of events and the
practices and techniques of management that are used." Therefore as applied to this
research, a project delivery system is defined as the roles, interaction, and obligations of
contracted parties and the sequence of activities necessary to provide a facility project
from design concept initiation through to final construction completion.
Two of the project delivery systems mentioned previously, design-build and design-
bid-build, are compared in this research. Although each system can exist in various
organizational forms, each system is based on different fundamental commitments to the
project owner.
11
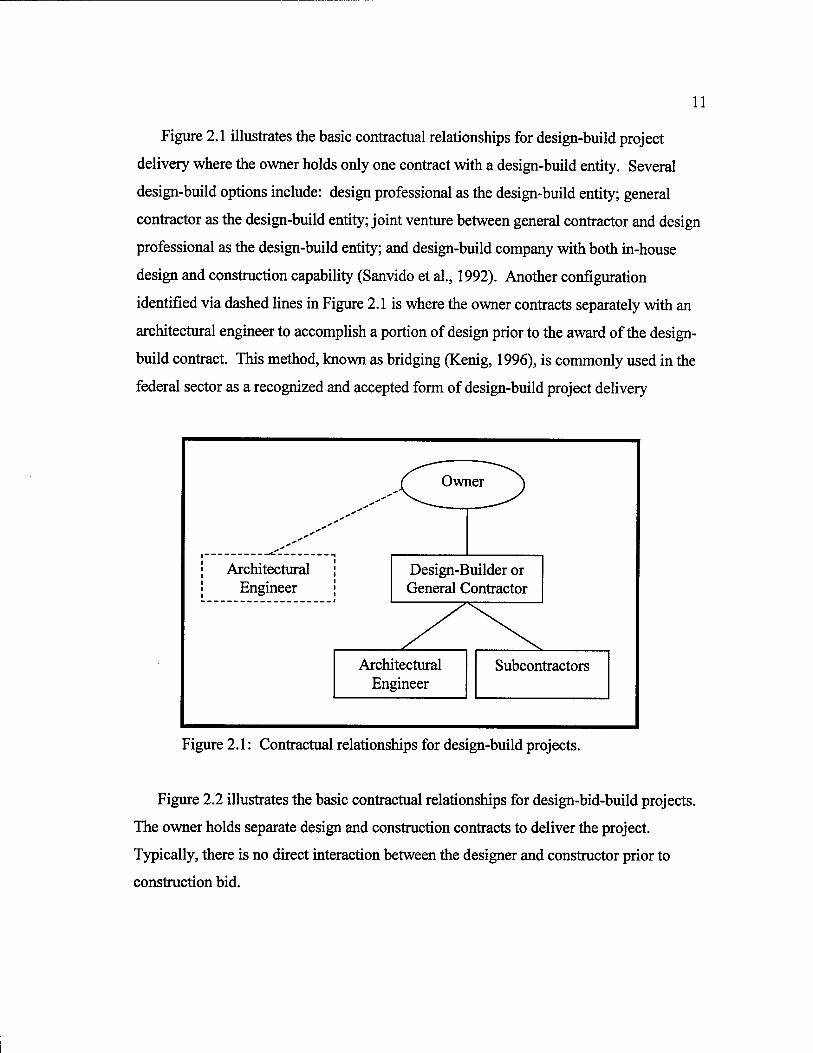
Figure 2.1 illustrates the basic contractual relationships for design-build project
delivery where the owner holds only one contract with a design-build entity. Several
design-build options include: design professional as the design-build entity; general
contractor as the design-build entity; joint venture between general contractor and design
professional as the design-build entity; and design-build company with both in-house
design and construction capability (Sanvido et al., 1992). Another configuration
identified via dashed lines in Figure 2.1 is where the owner contracts separately with an
architectural engineer to accomplish a portion of design prior to the award of the design-
build contract. This method, known as bridging (Kenig, 1996), is commonly used in the
federal sector as a recognized and accepted form of design-build project delivery
Architectural Engineer
Design-Builder or General Contractor
Architectural Engineer
Subcontractors
Figure 2.1: Contractual relationships for design-build projects.
Figure 2.2 illustrates the basic contractual relationships for design-bid-build projects.
The owner holds separate design and construction contracts to deliver the project.
Typically, there is no direct interaction between the designer and constructor prior to
construction bid.

12
Architectural Engineer
General Contractor
Design Subcontractors
Construction Subcontractors
Figure 2.2: Contractual relationships for design-bid-build projects.
Besides the contractual relationships, these two delivery systems are also defined by
relative sequence of activities illustrated in Figure 2.3. The design build contract
typically begins after formal acceptance of the design-build entity's proposal at the
conclusion of the construction procurement phase. However, partial design may be
developed during the construction procurement phase to satisfy the request for proposal's
design submittal criteria. Therefore, the date of project advertisement would reflect the
actual start of design for the design-build project. Furthermore, the design-build bridging
option may initiate an architectural engineer to start concept design in the design phase to
prepare the request for design-build proposals used in the construction procurement
phase.
The design-bid-build delivery system sequence begins with the start of conceptual
design. Typically, once design is completed through the contract documents, the project
is advertised for bid. This begins the construction procurement phase. During the
construction procurement phase, general contractors formulate their bids based on the
contract documents and submit them usually in open competition. The construction
notice to proceed date identifies the start of the construction phase.

13

14
The activities illustrated by dashed lines (see Figure 2.3) prior to the start of the
design phase and after substantial completion of the construction and design-build phases
are not included in the project delivery process as measured by this study. All
programming documentation, site selection, and definition of project scope of work as
well as selection of the designer is accomplished prior to the start of design for both
delivery systems. Likewise, building commissioning or start-up and subsequent facility
operation is conducted after substantial completion of the construction or design-build
contract. Therefore, the costs and time to operate a facility were not formally measured
in this study.
Based upon the contractual arrangements and sequence of activities previously
discussed, this thesis uses the following definitions to describe each of these delivery
systems. Design-Build is a project delivery system in which an owner contracts with a
single entity to perform both design and construction under a single design-build
contract. Contractually, design-build offers the owner a single point of responsibility for
design and construction services; however, a portion of the design may be accomplished
prior to the award of the design-build contract. After contract award, the entire design or
portions of the design and construction may be performed by the entity or subcontracted
to other companies (either design or construction).
Design-Bid-Build is a project delivery system in which an owner contracts separately
with a designer and a construction contractor. The owner normally contracts with a
designer to provide complete design documents from concept (0% design) through
detailed design drawings and specifications (100% design). The owner or owner's agent
then solicits bids from construction contractors based on the design drawings. One
contractor usually is selected and enters into a contractual agreement with the owner to
construct the facility in compliance with the design drawings and specifications. The
owner contracts separately with a construction contractor based on acceptable bids
estimated from the design documents to execute and complete facility construction. The
15
construction entity may perform all of the required construction work or subcontract all
or portions of the construction.
2.2 RELEVANT RESEARCH
In the 1980s, very few if any public agencies were executing projects via design-build
project delivery; therefore, historical project databases tracked and recorded only
traditional design-bid-build project delivery. Increased use of design-build has prompted
many federal and professional organizations to critically address the project delivery
process, identify success criteria for delivery system selection, and subsequently measure
project performance. In response to this need for design-build information, Songer
(1996) created a comprehensive bibliography of design-build studies and articles. This
literature review provided the researcher with a good historical understanding of the
design-build mechanism and the overall lack of empirical research on the subject. It
represented project owner and construction industry experiences with design-build.
Within the federal sector, several agency specific case studies, such as the United
States Postal Service (USPS) General Services Administration (GSA), and Naval
Facilities Engineering Command have attempted to investigate project performance
(Fraga, 1996, General Services Administration, 1997, Emmons, 1996). Extensive case
study investigation of design-build projects and their administration provided several
recommendations to improve the internal effectiveness of the USPS's use of design-build
project execution (Fraga, 1996). A recent GSA benchmarking study compared several
GSA projects within four building types by geographic region across the US in terms of
design time, procurement time, and construction time. However, these two studies either
focused too specifically on individual project delivery performance or not at all, therefore
not providing direct evidence of better or worse project delivery system performance.
Furthermore, no project attributes were used to explain any variation in delivery
performance.

16
Several subjective opinion polls within both public and private industry established a
foundation for comparison of project delivery systems based on owner experiences and
attitudes towards their selection and use (Federal Construction Council, 1993, Molenaar,
1995, Songer, 1996). Many of the success criteria and project characteristics identified in
these studies spawned further survey research of actual project data employing both
empirical and objective measurement (Mouritsen, 1993, Pocock, 1996, Bennett et al.,
1996, Konchar, 1997). Though some advancements have been made in knowledge of
comparative project delivery system performance, more specific inquiry is needed to
explore owner specific differences between delivery systems.
2.2.1 DELIVERY PROCESS MODELING AND PLANNING
Many activities and decisions occur in the process of construction that can influence
the success or failure of a project's outcome (Sanvido et al., 1992). Several models have
been developed that identify the tasks and variables as well as their relative interactions
that form the process of project delivery and the resultant facility product.
Wheeler's (1978) project life-cycle model provided a project activity breakdown
structure representative of the entire building construction process developed through
research within the facility design industry. His model identified nine separate phases in
the process of building from concept master plan through to building operation. He
recognized the complexity of design and construction, building systems integration and
construction cost controls as requiring a collaborative team effort among project
managers, architects, engineers, and constructors in all phases of the building process.
Sanvido's Integrated Building Process Model, IBPM (1990) identified 5 primary
activities required to provide and maintain a facility throughout its lifecycle: manage,
plan, design, construct, and operate. Created from an owner's viewpoint, this model
decomposes the facility delivery process by hierarchy of tasks, participants, and
information flow. Interrelationships and required decisions between the 5 major
17
activities and sub-activities are identified irrespective of project delivery system. When
applied to specific delivery systems, this model identifies those decisions and information
that may become internal to the entity performing more than one major activity.
Perkinson (1991) created an information framework for organizing and implementing
facility programming throughout the life-cycle of a building, inclusive of the five distinct
phases identified by Sanvido (1990). The facility design and the subsequent satisfactory
completion and performance of the constructed project is directly influenced by the
clarity and definition of the facility program (the result of the planning phase). Well
defined requirements and budgeted programs based on the delivery system to be used
positively impacted the design and construction effort by improving communication of
specific facility needs. Though closely linked, programming is accomplished by the
owner prior to and completely separate from the design (Pena, 1987).
Another study (Songer, 1992) focused on modeling the decision process of public
sector owners in planning design-build projects. Developed via survey responses and
personal interviews with public sector owners, this research modeled pivotal owner
decisions in the initial planning, analysis and execution of design-build programs and
their subsequent projects. He noted a paradigm shift was necessary for owners to identify
and provide functional design and construction requirements for design-build projects
rather than prescriptive drawings and specifications used for design-bid-build projects.
Lynch (1996) developed a transaction cost framework for evaluating construction
project organizations in making objective comparisons between project delivery systems.
Based on the owner's perspective, this study identified five levels of cost analysis within
a construction project organization: individual, group, firm, inter-firm, and project.
Lynch defined project delivery systems in terms of contract integration whereby high
contract integration represents design-build, and low contract integration represents
design-build. Interrelationships of the following five separate project activities based on
the level of project contract integration were tested at the project level:
18
• Project procurement
• Contract administration
• Information communication
• Firm interaction
• Production
Empirical model testing gained through case study application identified several
positive and negative relationships between contract integration and project variables.
For example, as the level of contract integration increased so did contractual reliance on
functional requirements which in turn decreased the complexity of the contractual
agreement. In contrast, higher contract integration decreased competition or the available
pool of contractors/design-builders which increased owner's efforts and costs to negotiate
the contract. For contract administration, higher levels of contract integration improved
team experience and continuity of information flow. This subsequently reduced the
likelihood of "developing a design beyond the point which would become necessary to
communicate the design intent." (Lynch, 1996). Tests validated the interrelationships
identified in the model; however, no conclusive or statistically significant results between
delivery systems were provided.
2.2.2 EMPIRICAL PROJECT DELIVERY RESEARCH
The research findings that follow consist of subjective owner and construction
industry opinions and assessments that attempted to quantify aspects of project delivery
systems. Resultant rankings of characteristics, success factors, and project delivery
performance identified several common criteria for using one system over another.
A 1993 survey conducted by the Federal Construction Council Consulting Committee
on Cost Engineering investigated the experiences of nine federal agencies with the
design-build project delivery method based on 27 medium complexity projects.
Respondents provided their reasons for selecting design/build, and their opinion of the

19
relative performance of design/build projects compared to previous experience executing
similar projects via design-bid-build. Reasons for using design-build were to gain time
savings, lower cost, and to test the use of design-build. Increased quality and the size of
project were listed as less important reasons.
Respondents next rated their respective design-build project as "much worse,
somewhat worse, about the same, somewhat better, or much better" than a similar project
procured through design-bid-build. Comparisons addressed the following 17 evaluation
factors:
• Functionality
• User satisfaction
• Quality
- Quality of design
- Quality of materials
- Quality of workmanship
- Overall quality
• Cost
- Cost of planning and programming
- Cost of agency contract administration
- Cost of design
- Cost of construction
- Overall costs
• Number of change orders
• Extent of other contract problems
• Time
- Time required for planning and programming
- Time required for design
- Time required for construction
- Time required overall
20
Average scores for each factor indicated design-build compared favorably with
design-bid-build in all respects. However, detailed inspection of cost and time for design
and construction yielded varying levels of satisfaction based on the percent design
complete prior to hiring the design-build entity. Design-build projects awarded during
the schematic design phase achieved better cost and time scores than other design-build
and traditional design-bid-build projects. Interestingly, the study noted difficulty in
accurately measuring design time for the design-build projects because this time was not
tracked separately on the construction schedule.
Through a subjective survey of public sector owners, Molenaar (1995) reported 88
respondents' rankings of critical project characteristics, critical success criteria, and
critical selection factors regarding public sector design-build. Respondents provided
rankings of pre-selected variables presented in the survey. Of the fifteen critical project
characteristics identified on the survey, the following 6 received the highest mean scores.
These are the most influential for a successful design-build project:
• Well defined scope
• Shared understanding of scope
• Adequate owner staffing
• Owner's construction sophistication
• Established budget
• Established completion schedule
Six project success criteria were also ranked. The three primary criteria in order of
importance were: on budget, conformance to owner expectations, and on schedule. Of
the seven critical selection factors provided in the survey for owners to rank, mean scores
strongly supported shortened project duration as the primary advantage of design-build
procurement. This study concluded that though shortened project duration was identified
as the most important selection factor for using design-build, owners relied more on cost
performance than schedule performance to indicate project success. This study
recognized that differentiation between various forms of design-build regarding percent
21
design complete before design-builder selection and the selection method would have
benefited this research.
2.2.3 OBJECTIVE PROJECT DELIVERY RESEARCH
The following sources reported statistically tested research findings based on actual,
unbiased project data drawn from a representative sample of like-industry or like-owner
projects. Each of the following studies provides various measures directly comparing
project delivery system performance.
Mouritsen (1993) conducted a survey of 36 projects executed by the Naval Facilities
Engineering Command (NAVFAC) using design-bid-build and two distinct forms of
design-build project delivery. These were source selection, and the "Newport" or
bridging method. Solicited in response to a request for proposal, source selection
competitively negotiates with contractors based on best and final offers which does not
limit award to the low cost proposer. The Newport or bridging method is based on
competitive low bid on 30 percent design complete drawings.
Project delivery specific comparisons of child care center, water tank, and training
range projects based on 9 measures resulted in statistically tested cost and schedule
savings favoring the overall use of design-build. Results were based on a relatively small
sample of 13 design-build projects and 23 design-bid-build projects. No explanation of
variance supported by project attribute data between project delivery system performance
was provided.
Pocock (1996) analyzed 209 military projects executed using design-build, design-
bid-build, partnered, or combinations of these project delivery approaches to identify any
significant differences between their performance. Mean measures of cost growth and
schedule growth for projects executed in each category indicated that combination
projects (projects incorporating beneficial aspects of partnering and design-build
22
teamwork) out performed both design-build and design-bid-build individually. Impacts
on cost and schedule were reported in terms of number of contract modifications and
design deficiencies. No significant correlation could be statistically identified among the
alternate project delivery systems. Building upon this research, Pocock (1996) conducted
univariate statistical tests to measure the impact of project integration on project
performance. Consistent with Lynch's modeling of level of contract integration,
Pocock's results indicated higher degrees of team interaction among each of the
alternative delivery systems.
A recent study conducted by the University of Reading's Design and Build Forum
provided the first comprehensive industry-wide survey of project performance for several
delivery systems (Bennett et al., 1996). The Reading study included univariate cost,
schedule and quality results and multivariate cost and schedule project performance
comparisons. Data was drawn from 332 private sector projects. Project attribute data
identified project location, size, construction type, building functions, and project
management organization. These were used as explanatory variables in constructing
multivariate regression models of cost and schedule metrics.
The delivery systems consisted of design-bid-build, design and manage, and three
variations of design-build: traditional UK design-build, develop and construct, and
consultant novation. Using traditional design-build, an owner solicits contractor
assistance in performing initial design and then later negotiates to have full design and
construction accomplished by that contractor. With design and manage, an owner hires a
construction management specialist to coordinate the procurement of both design and
construction. Results of this delivery method's performance were not included in this
study for two reasons: the construction management specialist did not hold any risk in
managing the process, and this method was not adequately represented. Develop and
construct varies only slightly from the traditional design-build approach based on the
extent of design developed prior to engaging the design-build entity. With consultant
novation, owners independently contract to have design accomplished until the point at
23
which the construction entity contractually joins the project team. Once the constructor is
engaged, the designer is contractually assigned to the constructor to complete the
remainder of the design.
Though individual results identified consultant novation as providing the worst
outcome in meeting clients' quality expectations, collectively the design-build projects
provided better results than the comparative use of design-bid-build. Of greatest
significance were: faster construction and delivery speeds with a greater likelihood of
timely completion; lower unit costs with a greater likelihood of completion within five
percent of budget; and a higher likelihood of meeting desired quality.
Multivariate regression analysis was used to further explain construction speed,
delivery speed and unit cost of projects. Results showed that project attribute variables
other than delivery system exerted more influence on the performance of these projects.
Thus, delivery system alone does not ensure better project performance.
Konchar (1997), in collaboration with the researcher, conducted a similar study of
U.S. project delivery systems. Three hundred and fifty one completed projects delivered
via construction management at risk, design-build, or design-bid-build were analyzed and
compared. Specific cost, schedule and quality data were collected for seven project
performance measures. Based on the project delivery framework he developed, a data
collection tool (described in section 3.1.1) was used to objectively record cost, schedule
and quality performance data. Variables known to impact project performance, such as
team communication and facility systems, were included. Cost performance was
measured by two metrics; unit cost and cost growth. Four schedule performance
measures used were schedule growth, delivery speed, construction speed, and intensity.
Seven items were used to present 3 quality performance measures representing building
turnover, building systems, and process equipment.
24
Univariate and multivariate statistical tests of project data showed significant
differences between these delivery systems. Univariate differences between delivery
systems identified all design-build projects to perform better than traditional design-bid-
build projects for six of the nine performance measures overall. Differences by facility
type were noted in favor of design-build delivery for five of the six facility types;
however, each for a different performance measure.
Several limitations were noted as a result of this research:
1. Project performance measures only considered the design and construction process
which prevented identification of impacts resulting from other phases of a project.
2. Change order and claim data was not collected; therefore, not addressing the impact
of both owner initiated changes and design deficiencies on project performance.
3. The age of the facilities may have misrepresented the perception of quality at the time
survey response data was requested.
4. Project delivery timelines vary based on the time necessary to procure design-build
and construction services, making it difficult to equate the actual start for all projects.
2.3 SUMMARY OF LITERATURE REVIEW
Though projects are often viewed as unique endeavors, this literature survey provides
evidence that several project variables have the potential, either independently or in
combination, to explain differences in project performance at various stages in a project's
delivery. Interestingly, Sanvido's (1990) four critical project success factors were
repeatedly found as beneficial project attributes in this literature review. These were
teamwork, contracts that act as catalysts to unite the team, specific facility type
experience, and early constructability input. Other common criteria in the literature that
impact desired outcome included: definition of project scope, user input, prioritized
goals, qualification of designer and constructor, existence and implementation of project
controls, and assessment of risk.
25
CHAPTER 3
DATA COLLECTION METHODS
Chapter 3 outlines the methods used to objectively collect and record project cost,
schedule and quality performance data used to compare design-build and design-bid-
build projects within the federal sector. This research uses quantitative and qualitative
project specific data collected via a structured survey. This research method is based on
previous empirical research methods (Pocock, 1996, Bennett et al., 1996, Mouritsen,
1993). Project performance data was based on factual records maintained by federal
project owners and construction entities. It did not rely on their opinions. Follow-up
survey interviews expanded upon the initial data collection effort and provided two new
sets of data. These were cost and schedule data for design which was accomplished prior
to design-build or construction contract, and quality data measuring the effects of time on
quality assessments. The following sections describe the variables collected and the
methods used to collect and record project data.
3.1 PHASE ONE DATA COLLECTION
As part of a collaborative research effort, this study collected and utilized 85 federal
projects provided via a recent industry-wide project delivery system survey (Konchar,
1997). Three hundred and fifty one project survey responses collected in January 1997
provided a large representative sample of the design and construction industry. It had a
broad geographic distribution of both private and public projects. Public project
responses represented local, state and federal project owners. Of these 351 projects, 273
were executed using either design-build or design-bid-build project delivery. Inclusion of
a non-response study validated the sample as representative of the industry.
26
3.1.1 DATA COLLECTION TOOL
Based on the project delivery framework established in recent research (Konchar,
1997), a survey was developed to organize and capture objective project data known to
impact project performance. Refer to Appendix A for the data collection tool. This data
collection tool was divided into nine information categories: project characteristics,
project delivery system, project schedule performance, project cost performance, project
quality performance, project team characteristics, project data, project success criteria,
and lessons learned. Descriptions of each section and their associated variables are
presented next. Variables known to affect project performance are expressed in italics.
3.1.1.1 PROJECT CHARACTERISTICS
Projects were first identified by name, location, survey respondent, company name,
company type, project facility type, building gross square footage, number of floors, and
percentage of renovation and new construction. This information established whether
the project owner, design-builder, architect/designer, or contractor provided the project
data. Additionally, project location allowed for geographic identification of survey
responses as well as geographic project cost references for labor, materials, and historic
location indices.
This section provided initial physical facility characteristics, such as building gross
square footage and number of floors, to more accurately classify the facility. The size
and number of floors of a project can influence the sequencing of construction activities
and hence the schedule performance (Riley, 1994). Percentage of renovation and new
construction of the project identified the nature of the design and construction.
Renovation projects may have cost or schedule impacts caused by hidden or unforeseen
work on a project.
27
3.1.1.2 PROJECT DELIVERY SYSTEM
Respondents were asked to select the appropriate delivery system which best suited
the project delivery mechanism used on their project. The systems were construction
management at risk, design-build, and design-bid-build. These were defined on the data
collection tool.
Respondents also identified the commercial terms used for the design-builder or
designer and constructor based on their contracts with the owner. These terms define the
incentives and motivations of project team members (Kenig, 1996, Sweets, 1994). Lump
sum, cost plus a fixed or percentage fee and guaranteed maximum price (GMP) were
considered. Lump sum and GMP contracts both restrict the maximum contract price.
GMPs also allow for possible shared cost savings to the project team or owner. Cost plus
contracts reimburse the actual cost of work completed. The owner must monitor and
verify all payments.
3.1.1.3 PROJECT SCHEDULE PERFORMANCE
Respondents were asked to provide project schedule dates. These were the project
advertisement date, design start date (notice to proceed), construction start date (notice
to proceed), and the construction end date (substantial project completion). Dates were
provided for the as-planned or budgeted schedule and the as-built or actual schedule.
Durations between events were calculated in calendar days. All dates were based on the
project schedules maintained by the project respondents.
3.1.1.4 PROJECT COST PERFORMANCE
Project costs were defined as the amount of money invested by the owner to
accomplish the respective design and construction of the facility for the base building.
Property costs, owner costs, costs of installed process or manufacturing equipment,
28
furnishings, fittings and equipment, or other items not a cost of the base building were
omitted. Three itemized costs were requested: budget, contract amount, and final cost.
Each actual cost figure was asked for the design, construction and total costs. However,
if actual costs were not provided, respondents were asked to note that costs were
estimated. These were later verified via follow-up interviews with the survey respondent
and independently with the project owner.
The cost of site work, reported as a percentage of final construction cost for work
done outside the footprint of the building, identified the cost of developing the project
site. This was useful in comparing level of site work effort to both building gross square
footage and number of floors with respect to construction and total project costs.
3.1.1.5 PROJECT QUALITY PERFORMANCE
This section was completed by project owners, specifically project managers or
facility users/ maintainers. Project respondents other than the owner could bias facility
quality assessments. Responses provided by those who were not owners identified the
project owner's point of contact and phone number. Quality input from owners was
provided via telephone interviews or facsimile transmittals. To prevent bias due to initial
facility turnover at time of substantial completion, quality assessments were provided by
owners at least six months after the substantial completion date.
Project quality performance ratings were based on seven quality assessments.
Owners rated the difficulty of the building turnover process as low, medium, or high for
each of the first three measures. These were start-up, operation and maintenance cost,
and number and magnitude of call-backs. The highest possible rating was represented by
low difficulty. Owners next rated four facility systems' performance: envelope, roof,
structure, foundation; interior space and layout; environmental systems (heating,
ventilation, air-conditioning, and lighting); and process equipment and layout. Owners
29
evaluated whether each system's quality met, did not meet or exceeded performance
expectations. In these instances, exceeded expectations was the highest possible rating.
3.1.1.6 PROJECT TEAM CHARACTERISTICS
Nineteen variables describing and evaluating project team characteristics quantify the
individual and collective experience and the composition of the team and its action.
Project team selection identified the method used to procure the design-build and
construction entity contracts. Open bidding represented construction entity selection
based on open competition with selection decided by lowest responsive bid. Open
bidding in conjunction with contract documents identified that the construction bid was
based in full upon complete design drawings provided by the owner. Prequalified
bidding indicated whether source selection was used to narrow the list of qualified
contractors for either open bidding or negotiated contract. Qualification of project teams
based on quantitative scoring criteria evaluates a company's capabilities and its project
proposal (Potter et al., 1995).
Owners and constructors are both impacted by their ability to restrain the contractor
pool as this limits their competitive choices which is further impacted by the existence of
a pool of qualified contractors. The percent design complete when the construction entity
joined the project team provides significant impact to the successful execution of a
project based on early input of construction expertise in the design process (Sanvido, et
al., 1992). However, inexperienced constructors and subcontractors unfamiliar with the
project delivery system or facility type may be the only project bidders or proposal
respondents providing input. This situation might directly and negatively impact project
performance. Therefore, the individual experience of project team members with similar
facilities and with the project delivery system used on the project can impact project
performance. Respondents rated their applicable project team members' experience as
excellent, limited or none.

30
Beyond individual team member experience, the collective prior experience of the
project team as a unit presents many benefits to the owner in the satisfactory completion
of a project. Companies consistently bidding and constructing federal facilities become
familiar with the owner and their procedures as well as repeat subcontracts that can
improve project team communication and team chemistry. Specifically regarding the
owner-project team relationship, a first time project between these parties may lack the
same trust as a partnered effort or repeat relationship (Kenig, 1996).
The project owner maintains a key role in the team based on their ability to make
decisions, define the project scope and their capability to perform necessary project
oversight throughout the delivery process. As identified by Molenaar's study (1995),
public project performance is primarily judged on success criteria within the control of
the project owners. Each respondent was asked to rate the owner's representative for
each of these areas as excellent, adequate, or poor.
Often the manner in which an owner selects the project team depends on the
complexity of the project. High complexity projects may require specialty design and
construction knowledge that may benefit from early construction input. In contrast, low
complexity projects such as pre-fabricated metal buildings may not require detailed
design input from the owner.
Outside of the project team's control, regulatory and legal constraints may limit the
procurement methods available for selecting the team. Respondents were asked to rate
the relative number of such constraints as many, few or none. Similarly, onerous
contract clauses imposed by the owner to offset risk (measured as numerous, several, or
none) can constrain the effectiveness of the project team. Constraints may be posed by
public laws regarding use of disadvantaged businesses or minority/women owned
subcontractor organizations which may not have experience with the delivery system, or
facility type. These imposed organizational and operational restrictions may hinder
communications and development of a shared team culture in executing the project.
31
3.1.1.7 PROJECT DATA
As identified by previous research (Bennett et al., 1996), cost, schedule, and quality
performance of a project delivery system can be influenced by the facility systems and
their components. This section categorizes the physical attributes of facilities into nine
primary systems. These are foundation, structure, architectural interior finishes, exterior
enclosure, roofing, environment (heating/cooling), electric service and use, controls, and
site. Each system is described by specific sub-systems or items that allow respondents to
identify all applicable systems on their project with provisions to identify other systems
or components not listed. It is quite possible that more than one sub-system was used in a
project thus possibly increasing the complexity of the project. For example, a project
located in an urban area requiring mass excavation for slurry wall foundation is much
more constrained than a suburban or rural project utilizing a mat foundation. All of these
physical project attributes served to accurately define facility types by similar systems.
3.1.1.8 PROJECT SUCCESS CRITERIA
In this section respondents were asked to provide in rank order of importance five
criteria that they use to judge project success. Additionally, respondents evaluated each
success factor as it applied to the performance of the project on a scale of excellent,
average, or poor. Based on their overall impression of the project performance,
respondents were provided the opportunity to rate the overall success of the project as
excellent, average, or poor.
3.1.1.9 LESSONS LEARNED
This section allowed respondents to provide their own observations and experiences
resulting from the delivery of the project. Five questions addressed the existence of
possible biases or related experiences regarding the use of the delivery system for the
project. Respondents were to provide any reasons, examples, circumstances, or unique

32
project features that may have impacted project performance. Additionally, solicited
comments provided valuable information used to clarify and expand upon project
characteristics and performance not otherwise captured by the variables on the data
collection tool. For example, project delays caused by environmental impacts or hidden
conditions found in renovation projects are helpful in explaining schedule variations
between what was planned and what was accomplished.
3.1.2 DATA STANDARDIZATION
Cost adjustments for projects were based on year completed and location. This
allowed direct comparison of project costs. Historical data indices (Means, 1995) were
used to equate all reported projects as required to directly compare project performance
based on unit cost.
Projects were categorized by respondents into four primary types: general building,
light industrial, high-technology, and civil structures (i.e. parking garages). Each had
several sub-classifications. The 14 possible facility choices distributed the projects into
small sample sizes which contained wide ranges of costs indicating poor classification.
To better compare delivery systems by similar facility, a facility classification system
was developed. Researchers investigated each survey response regarding building
systems used in the project, team member experience, project complexity, unique features
identified in the lessons learned, and project unit cost to identify similarities. Projects
were re-categorized into one of the following six facility types.
Light industrial facilities consisted of primarily large, open structures with minimal
electrical or mechanical loads with relatively low project complexity. Associated office
space within industrial plants and warehouses is included. Warehouses, storage facilities,
military commissaries, postal facilities, and military aircraft hangars were included.

33
Multi-unit dwelling facilities consisted of low-rise residential structures characterized
by repetitive living units. These are low complexity projects with general lighting and
simple mechanical loads. Federal projects in this category included veteran
retirement/nursing homes, and military family housing such as town-houses, bachelors'
enlisted quarters and dormitories.
Simple office facilities were identified as simple structures of less than five stories in
height with primarily concrete masonry unit exterior finishes. Interior spaces were
mostly open to accommodate systems furniture, training classrooms, or assembly spaces.
General computer and lighting conditions required general office and assembly
mechanical loads. For federal projects, this category included training buildings, youth
centers, fitness centers, and basic office buildings.
Typically greater than five stories in height, complex office facilities consisted of
higher complexity projects using mixed structural systems with monumental exterior
finishes. Most of these facilities reported intensive computer use coupled with large
central mechanical plants to support their operation. This facility type included complex
offices, data processing facilities, out-patient medical clinics, courthouses, libraries, and
military officers' clubs.
Heavy industrial facilities consisted of large projects of average and high complexity
that relied heavily on environmental conditions, controls, and electrical systems.
Structural systems utilized either structural steel frames or cast in place concrete with
panelized exterior enclosures. Food processing facilities and industrial research and
development test facilities were included in this category.
High technology facilities consisted of high complexity, intensive electrical and
mechanical support and high unit costs. Included in this category were hospitals and
micro-electronic facilities requiring clean room environments with strict environmental
tolerances.
34
3.1.3 DATA VERIFICATION
Follow-up telephone interviews with survey respondents verified project data,
clarified survey variables, and collected missing or omitted information (Dillman, 1978,
Ott, 1993). As noted previously in the description of project quality performance, contact
with owners or owner's representatives was required to accurately collect quality ratings.
When owners were contacted to provide their quality input, the researchers used that
opportunity to verify project cost and schedule data provided by design-builders,
architects/designers and constructors.
3.2 PHASE TWO DATA COLLECTION
The initial 85 projects complemented by 3 new federal projects added as of July 1997
created the new federal data set of 88 projects. Preliminary investigation of the original
CII data set during data verification noted inconsistencies in survey cost, schedule and
quality reporting. Direct comparisons of delivery systems rely upon accurate, timely, and
unbiased representations of cost, schedule and quality. In the phase one data collection,
cost and schedule data was provided from several sources other than the owner. In this
phase of the research, all new cost, schedule, and quality data was provided by the owner
(project manager and facility users/ maintainers) via telephone interviews. Telephone
interviews based on pre-prepared questions allows direct and immediate responses
otherwise not achieved through survey distribution (Ott, 1993).
Both researchers and industry experts responding to the initial survey identified
several issues requiring further investigation. Based upon the literature review, expert
federal agency consultation, and lessons learned from the initial broad survey data
collection, eight questions were developed. These questions solicited new project data to
more precisely compare both delivery systems from an equal starting point of zero
percent design complete. Each of the questions are presented and explained as follows:

35
• Would you classify your public organization as belonging at the local, state, or
federal level of authority?
First, the researcher established whether a project response reported as a public
project was applicable to local, state, or federal agency jurisdiction and therefore to
federal acquisition regulations in the procurement and execution of the project. As the
original data collection tool did not specifically allow for federal owner identification, all
public projects required clarification on this point before proceeding further.
• Was the project originally programmed as a design-build or design-bid-build
project?
Development of project requirements for funding approval is accomplished separately
from the design process (Perkinson, 1991) for federal projects. The facility program
establishes either the means and methods or resultant goal of providing for a completed
facility. For example, a design-bid-build project's program might identify specific
architectural materials, interior space relationships, and design-review procedures to aid
the designer in solving the facility problem through detailed drawings and specifications.
Applying the original design-bid-build facility program instead to design-build project
execution requires different description of the facility problem in terms of required
performance and outcome rather than detailed specification.
• What was the design start date for design commencement (Opercent design
complete)?
This question identified whether the reported schedule dates presented in the initial
data collection reflect all of the design effort which directly supported the design-build
contract award or the design-bid-build award. The actual start date of design was
necessary in calculating accurate schedule performance for design-build versus design-
bid-build. The data collection tool only captured the design start date for design-build
36
projects at the design-build notice to proceed date. For example, design could be
advanced via a separate design contractor prior to design-build award. This allows the
owner to establish the architectural theme or concept for the candidate design-builders.
Another example is development of a more detailed proposal and cost estimate used to
evaluate the design-builders' proposals. The design-builder might in fact accomplish
design non-contractually as part of the proposal submittal requirements during the
advertisement and procurement phase.
• What commercial terms were used for this design concept initiation effort?
The method of compensation for the design concept identifies the motives and
incentives of the owner. In some cases no commercial terms may exist at the start of
design. For example, designers may not receive a stipend for developing their
competitive proposals for a project. This lack of compensation could influence the
availability of designers and constructors wishing to pursue the project.
• What were the costs for this design concept initiation effort at contract award and
final completion?
The total cost of design must incorporate all design effort accomplished in direct
support of a project's delivery to allow for direct comparison of like costs between
delivery systems. Though the design cost for design-build is contained within the overall
project purchase price, the relative cost of initial design development in relation to the
design-build contract price provides a true reflection of the actual project design costs.
Any increases in design costs for the initial design effort indicate possible changes or
modifications that might also correspond to any changes in the design-build costs (NSPE,
1994).
37
• Do costs include in-houseproject management or owner's agent costs?
Military construction projects managed through the US Army Corps of Engineers
impose a standard income and overhead fee of approximately 6.5 percent of the
construction contract price. For large projects, this fee can significantly impact the actual
cost of the base building, and subsequently its cost per unit area. Confirmation that these
costs were not included in the reported costs was critical.
• What percentage of design was complete at time of construction contract award?
(0-15, 15-35, 35-65, 65-100)
This question was similar to the percent design complete when the construction entity
joined the team. It requested the relative percentage of design completed prior to the
design-build contract award date. The level of design development prior to design-build
contract award and the project team selection mechanism is useful in identifying the
actual form of design-build used (Molenaar, 1995).
• As of this date how would you rate the seven quality performance measures of
your project?
Individually re-assessing the original seven quality measures one year after the
original quality ratings were collected allowed the researcher to cross-check scores
against the owners' original ratings. This questioning procedure was important for two
reasons. Firstly, inconsistent ratings of projects solicited from the original quality
performance respondent would invalidate the objectivity of the rating scale. Secondly,
significant changes in score or scoring trends in relation to the facility's age identify the
influence and impact of time in accurately measuring quality both in the early phases of a
project's life and throughout its lifecycle (National Research Council, 1991).

38
3.3 SUMMARY
Surveys and telephone interviews were used as the two means of collecting objective
project data from owners, design professionals, design-builders and constructors
throughout the United States. Survey questions were designed to accurately record
project costs, schedule, and quality data to support empirical measurement of project
performance. Other factors known to affect project performance were also included in
the survey to provide possible explanation of variation in performance in subsequent data
analysis. Additionally, project unit costs and facility types were standardized to allow
direct comparison of similar facilities as of a baseline of December 1996. Phase two data
collection clarified the original cost, schedule, and quality data to account for all project
costs and schedule inclusive of the entire design effort from zero percent design
complete. Phase two data collection relied solely on owner provided cost, schedule, and
quality data.
39
CHAPTER 4
PERFORMANCE MEASUREMENT AND DATA ANALYSIS METHODS
Chapter 4 provides definitions and descriptions of the 15 performance measures used
to compare projects and the subsequent statistical analysis methods employed to test
differences between project delivery systems and other key variables. Project
performance measures were calculated using the objective cost, schedule and quality data
collected via the original survey and new telephone interviews previously discussed in
chapter 3. Performance measures were used to objectively and quantitatively compare
delivery systems through univariate and multivariate statistical testing. Univariate
comparisons between design-build and design-bid-build were based on results of
statistical hypothesis testing of mean and median performance values. These results
provided only direct comparison of delivery systems for each performance metric without
the presence of any other explanatory variable. Therefore, multivariate comparisons of
delivery system performance inclusive of other explanatory variables were based on
statistical modeling of the delivery speed performance metric.
4.1 PROJECT PERFORMANCE MEASURES
Interviews conducted with federal agency owners identified available cost, schedule
and quality records used to record and track performance of federal projects. Quality
measures were based on evaluation criteria measured through post-occupancy-surveys
conducted by some federal agencies after project completion. Information gathered
through these interviews was used to develop and test metrics that accurately capture and
report the cost, schedule and quality performance of projects for comparison. Fifteen
project performance measures were created from this information. These fifteen
performance measures were used as the dependent or response variable in analyzing
project data to compare delivery systems. These measures are presented by cost,
schedule, and quality categories.
40
4.1.1 COST PERFORMANCE MEASURES
For this research, cost was defined as the amount of money paid by an owner for the
design and construction of a facility, as measured in U.S. dollars. Costs excluded the
value of land acquisition, extensive site work, process equipment or owner costs. Four
cost performance measures were: unit cost, total cost growth, design cost growth, and
construction cost growth.
The unit cost measure represents the relative cost per unit area of a facility. It is used
as an historical cost reference in programming federal facility projects for funding
approval. This first cost metric was adjusted for time and location using Means (1995)
historical cost indices. This allows direct and equitable comparison of projects
constructed across the United States over the past five years. The following formula was
used to measure unit cost:
Unit cost (S/S.F.) = ((Final Design Cost + Final Construction Cost)/Area)/ (1)
Index
Cost growth provided the resultant percentage of growth of project cost throughout a
project's combined design and construction phases. Final versus contracted costs for
design and construction were used to calculate the cost growth measure. Cost growth
was measured as follows:
Cost growth (%) = [(Final Project Cost - Contract Project Cost)/ (2)
Contract Project Cost] *100
Design cost growth measured the final cost of design resulting from the entire period
of design relative to the contracted design costs. Any applicable costs for design
accomplished prior to the design-build contract award was added to the design-builder's
41
itemized design costs. The design cost growth measure was defined by the following
formula:
Design Cost Growth (%) = [(Final Design Cost - Contract Design Cost)/ (3)
Contract Design Cost] *100
The final cost performance measure, construction cost growth, focused on the
difference between the final and contract costs for completing the construction phase of
each project. Construction cost growth was measured in terms of percentage growth as
follows:
Construction Cost Growth (%) = [(Final Construction Cost - Contract (4)
Construction Cost)/ Contract Construction Cost]* 100
4.1.2 SCHEDULE PERFORMANCE MEASURES
Schedule was defined as the total time taken by the facility team to design and
construct a facility beginning at zero percent design complete. Four schedule metrics
were created to analyze and compare project performance by delivery system: schedule
growth, delivery speed, construction speed, and procurement speed. Similar to the cost
measurements, the schedule growth and delivery speed measures included any time taken
to accomplish design prior to the design-build contract award date.
The first measure, schedule growth, calculated the percent by which the overall
design and construction schedule grew over the course of delivering the project. This
measure calculated the difference between the as-built and as-planned schedule duration
for design and construction, inclusive of design time starting from zero percent complete.
The formula used for schedule growth was:

42
Schedule Growth (%) = [(Total As-Built Time - Total As-Planed Time)/ (5)
Total As Planned Time]* 100
Delivery speed was defined as the rate at which a facility' gross square footage is
designed and constructed per month. It measured from the design start date at contracted
concept design initiation through to substantial construction completion based on the as-
built time to deliver the facility. Delivery speed measured each project using the
following formula:
Delivery Speed (S.F./Month) = [Area/(Total As-Built Time/30)] (6)
Construction speed was the rate at which the construction entity constructed the
facility beginning with the notice to proceed date. The following formula was used to
define construction speed:
Construction Speed (S.F./Month) = [Area/(Total As-Built Construction Time/30)] (7)
The final schedule performance metric, procurement speed, was measured
independently of design and construction time. This measure was defined as the rate at
which a project is procured for either the construction or design-build contract as follows:
Procurement Speed (S.F./Month) = [Area/(Total As Built Procurement Time/30)] (8)
4.1.3 QUALITY PERFORMANCE MEASURES
Quality was defined as the degree to which the facility met the expected facility
requirements as assessed by the project owner or project user (Konchar, 1997). Seven
quality measures were created that measured actual versus expected performance of the
completed facility. The following seven quality performance measures were used in this
research:
43
1. Difficulty of facility start-up
2. Number and magnitude of call-backs
3. Operation and maintenance costs
4. Quality of envelope, roof, structure, and foundation
5. Quality of interior space and layout
6. Quality of environmental systems
7. Quality of process equipment and layout
Owners (specifically owner project managers and facility users/ maintainers)
measured each individual quality metric against a fixed quality rating scale of 1, 2 or 3.
For the first three measures, 1 represented high difficulty, number of incidents or costs, 2
represented medium difficulty, and 3 represented low difficulty. For the final four
measures regarding systems quality, a score of 1 represented expected quality was not
met, 2 represented expectations were met, and 3 reflected that expectations were
exceeded.
4.2 DATA ANALYSIS METHODS
This research relied upon various statistical tests to identify the existence of any
significant relationships between delivery systems for each performance measure. Data
analysis primarily utilized univariate statistical comparisons of delivery systems by
performance metric to identify individual significance based on the central tendencies of
the sample means and medians. This research identified specific benchmark performance
measures for each delivery system based on statistical hypothesis testing of both mean
and median values. Median values were reported as representative of the central
tendency of the data for direct comparison. Additionally, multiple linear regression
models were constructed for the delivery speed metric to identify variables which
explained the highest proportion of variation in the model in the presence of each other.
This model allowed for direct comparison of delivery system impact on the performance
metric when holding all other variables constant.
44
4.2.1 UNIVARIATE COMPARISONS
This research relied strongly on the accurate representation of sample population
behavior for each performance measure. Preliminary descriptive statistics of the projects
identified several extreme outlying projects that influenced the sample mean for each
performance metric. Therefore, non-parametric statistics were used because these tests
do not rely upon the normal distribution of the sample population to identify significant
differences between variables (Daniel, 1978). In particular, the Mood's median test is
highly robust against outliers and errors in data for preliminary data analysis to identify
the central tendency of the sample data (Minitab®, 1995).
For the most accurate representation of differences, analysis used both 2 sample t-
tests for sample means and Mood's median tests for sample medians for each sample.
For 2 sample t-tests, the null hypothesis represented that one system was either less than
or equal to, or greater than or equal to the other delivery system depending on the
performance metric. The alternative hypothesis represented the opposite assumption
from the null hypothesis with a test-statistic greater than the critical value supporting the
null hypothesis. The Mood's median test null hypothesis represented that the sample
medians were all equal versus the alternative hypothesis that the medians were not equal.
A chi-squared value greater than the critical value indicated that the null hypothesis was
false. This redundancy ensured that only those samples supporting both the mean null
hypotheses and the median alternative hypothesis were significantly and consistently
different at the 95 percent confidence level. However, Mood's median tests using fewer
than six observations have confidence less than 95 percent. These tests provided for
univariate comparison of delivery systems for each performance metric unadjusted for
the presence or influence of any other variables in explaining the differences.
The original CII project delivery survey response data was first resorted by private,
public and federal projects to identify project performance by owner type. Projects for
each owner type were tested using mean and median values to establish the central
45
tendencies of their collective projects by delivery system. Sample medians were used to
directly compare each delivery system's performance. The same two testing procedures
were applied to the new federal project data for the cost and schedule performance
measures. The quality performance metrics were based on discrete variables that
required the use of 2-sample t-tests to compare each delivery system's mean score for
significant differences. For example, with individual quality scores reported as either 1,2
or 3, the median value will likely be an even integer of 2 for both delivery systems which
does not allow a wide enough range for effective application of the Mood's median test.
4.2.2 MULTIVARIATE COMPARISONS
The univariate results provided singular, direct comparisons of delivery system and
design complete percentages on certain project performance measures. However,
univariate comparisons do not permit analysis of the relative importance or influence of
project delivery systems, facility type or percent design complete in explaining resultant
project performance. Multiple linear regression analysis allows further statistical
investigation of the impact of delivery system on project performance measurement in
relation to other possible explanatory variables (Neter, 1996). Therefore, multiple linear
regression analysis was used to construct a model explaining direct relationships between
measured project variables and project performance metric within one single model. This
method allowed direct, quantifiable measurement of project delivery system performance
for delivery speed by holding all other explanatory variables constant in the model.
Using Minitab® (1995) statistical software, each of the 70 variables collected via the
data collection tool and interviews were individually included in preliminary best subset
regression models. Best subset regression analysis identified various possible
combinations of variables and their associated level of influence in explaining the
performance metric's outcome. Minitab's statistical software permitted only 20 variables
at a time to be included in each best subset regression model. The variables consistently
providing the highest proportion of variation and lowest Mallow's C-p value in each of
46
the best subset regression models were then collectively entered into one regression
model. Each variable was provided the opportunity to be placed first in the model to
identify its singular contribution to explaining the response variable with all other
variables present.
Residual model diagnostics were performed on the multivariate regression model to
check four linear regression assumptions: normality, interdependence, random
distribution, and non-constant variance. Several unusual observations were noted as a
result of these diagnostic plots and tests. These included non-linear relationships
between variables requiring transformation, and outlying projects that might inaccurately
define a linear relationship in explaining the response variable. Investigation of outlying
observations used Cook's Distance (Minitab, 1995) to graphically test for leverage, and
Hi tests (Minitab, 1995) to test the relative influence of the outlying observations' on the
model's fit. Any unusual observation exhibiting both significant leverage and strong
influence on the response variable's fitted values was closely examined to explain any
unique circumstances impacting the project's outcome. Projects providing unexplained
or highly unusual observations were removed from the model to better calculate the
multivariate regression model fits. A new final regression model was then calculated
based on the reduced number of projects to identify any changes in explanation. Again
residual diagnostics, Cook's Distance and Hi tests were conducted to examine any
extreme values. This procedure of reconstructing the model and examining residual
diagnostics was repeated until no improvement in the level of explained variation was
achieved. This level of explained variation in the model was checked against acceptable
p-values for each independent variable in the model and the collective t-value of all
variables acting together.
Project delivery and facility type were intentionally included in each model. This
allowed direct, quantitative measurement of differences between delivery systems in the
final explanatory model of delivery speed performance. Including these variables within

47
the best subset regression models prevented any extreme interactions or insignificant
relationships from being identified in the final model.
4.3 SUMMARY
Fifteen project performance measures were created to objectively measure project
performance based on specific project cost, schedule and quality data collected from the
survey and interviews. Four cost, four schedule and seven quality metrics were used to
objectively measure project performance. Univariate analysis of project cost and
schedule performance metrics focused on measuring and comparing projects based on
equal project start dates at zero percent design complete. Analysis of seven identical
quality performance measures between the new and original data investigated the
consistency of reported quality over time. Multivariate analysis of project delivery speed
constructed a model identifying variables that explained the highest proportion of
variation in resultant project delivery. This delivery speed model was adjusted for the
influence of outlying observations to accurately construct a linear relationship in
explaining delivery speed. The final explanatory model achieved a high level of
explained variation based on the significance level of each independent variable and the
variables collectively.

48
CHAPTER 5
RESULTS
Results of the statistical analysis are presented first for private, public, and federal
owners, then specifically for federal projects. The first part of this chapter presents the
relative distribution of projects among owner types and facility types to identify
univariate differences among each of the original private, public, and federal projects.
These preliminary comparisons identify basic relationships between delivery systems by
facility type and metric. Unadjusted for the many other variables that may influence and
impact project performance, these univariate results substantiate further specific
investigation into owner specific federal project performance.
The second part of this chapter reports solely on the expanded statistical analysis
results of federal projects. This part first presents the distribution of federal project data
by facility type, project size and project cost. Second, univariate results for each metric
are reported. Further, univariate results describing the relationship between design
complete at design-build or construction contract award and project performance metrics
are then presented independent of any other variables. Finally, multivariate regression
results provide statistically supported conclusions for federal project delivery speed
performance.
5.1 DELIVERY SYSTEM PERFORMANCE BY PRIVATE, PUBLIC AND FEDERAL OWNERS
Of the original 351 projects reported in the CII study (Konchar, 1997), 273 projects
were executed using either design-build or design-bid-build project delivery systems.
These 273 projects comprised 134 private, 54 public, and 85 federal projects. Figure 5.1
illustrates the distribution of the 273 projects by owner type and facility type. Projects
were originally categorized into six facility types: light industrial, multi-story dwelling,
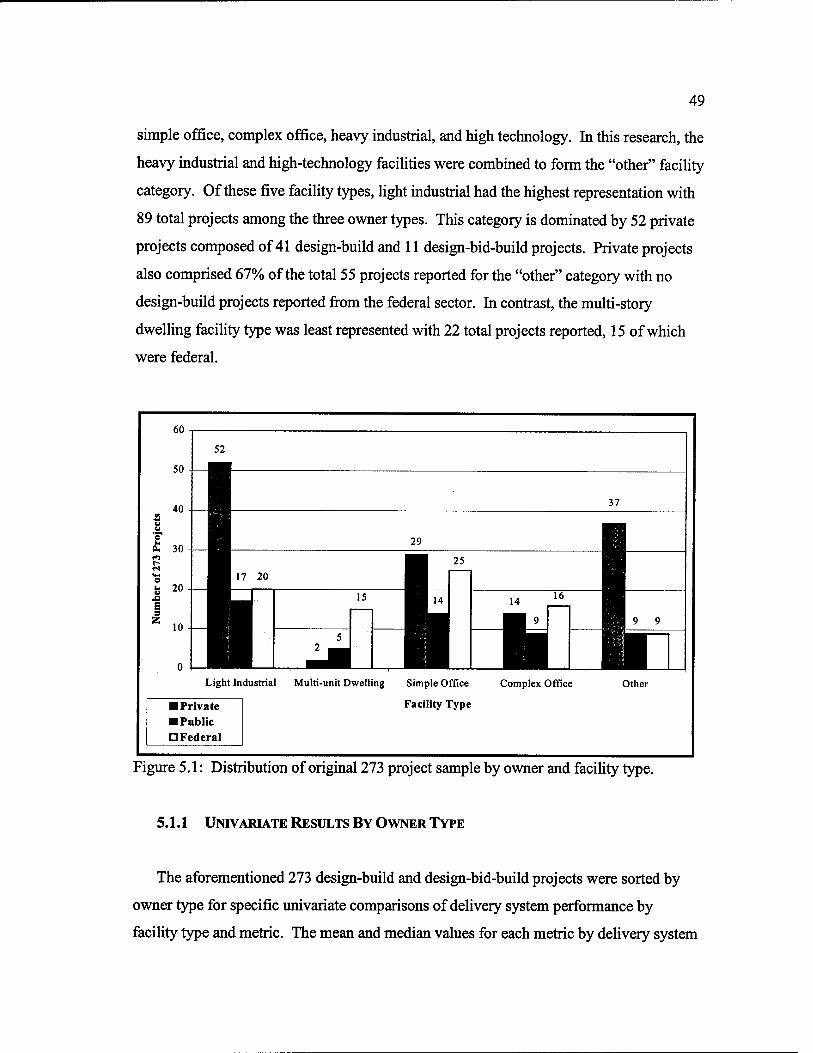
49
simple office, complex office, heavy industrial, and high technology. In this research, the
heavy industrial and high-technology facilities were combined to form the "other" facility
category. Of these five facility types, light industrial had the highest representation with
89 total projects among the three owner types. This category is dominated by 52 private
projects composed of 41 design-build and 11 design-bid-build projects. Private projects
also comprised 67% of the total 55 projects reported for the "other" category with no
design-build projects reported from the federal sector. In contrast, the multi-story
dwelling facility type was least represented with 22 total projects reported, 15 of which
were federal.
60
52
37
17 20
15
2 5
14 16
mt ■ Private ■ Public D Federal
Light Industrial Multi-unit Dwelling Simple Office Complex Office
Facility Type
Other
Figure 5.1: Distribution of original 273 project sample by owner and facility type.
5.1.1 UNIVARIATE RESULTS BY OWNER TYPE
The aforementioned 273 design-build and design-bid-build projects were sorted by
owner type for specific univariate comparisons of delivery system performance by
facility type and metric. The mean and median values for each metric by delivery system

50
and facility type were tested for significance at the 95% confidence level. Only those
sample means and medians with test statistics satisfying 95% confidence level t-values
and Chi-squared values as well as p-values less than or equal to 0.05 are reported.
Appendix B provides summary statistics for the following univariate comparisons. In the
figures discussed next, significant differences are represented by darkened ovals with the
corresponding relationship between delivery systems identified as greater than or less
than (< or >). Open or unshaded ovals indicate no significant differences between
delivery systems.
Figure 5.2 presents the results of significance testing of delivery system performance
by facility type and metric for the 134 private projects. Three of the five facility types
show significant performance differences between design-build and design-bid-build
projects. The light industrial design-bid-build projects have a significantly higher unit
cost than similar design-build projects. Simple office facilities show lower cost growth
for design-build projects than design-bid-build projects. Complex offices have less
schedule growth with design-build than design-bid-build delivery systems. The
combined private projects identified design-build to have both less cost growth and
schedule growth and significantly faster construction speed and delivery speed than
design-build projects. Design-build provided significantly better system quality.
Figure 5.3 presents the results of significance testing within each facility type by
delivery system for the 54 public projects. Of all the performance metrics only unit cost
identified differences between delivery systems by facility type. Light industrial facilities
delivered via design-bid-build had higher unit costs than design-build projects. In
contrast, multi-story dwelling facilities identified design-build high security prison
projects to have higher unit costs than low-income housing design-bid-build projects.
Overall, only design-build was identified as faster than design-bid-build in terms of
delivery speed for the combined sample of all 54 public projects. Additionally, only
turnover quality provided significant differences between the two delivery systems with
design-build achieving a higher turnover quality score than design-bid-build projects.

51
Proc
ess
Equi
pmen
t
3 0 0 0 0 0 Sy
stem
s Q
ualit
y
3 0 0 0 0
DB
>DB
B
Tur
nove
r Q
ualit
y
3 0 0 0 0 3
Del
iver
y Sp
eed
0 0 0 0 0 •
DB
>DB
B
Con
stru
ctio
n Sp
eed
0 0 0 0 0 03
^ 03 Q
Sche
dule
G
row
th
3 0 0 03
^ 03 Q
0 03
^ 03 Q
Cos
t G
row
th
5 0 03
w 03 Q 0 0
DB
<DB
B
Uni
t C
ost
DB
<DB
B
0 0 0 0 3
la
/ £ / »—< / o
73 E
CO
1 1) 3
bo
1 f CO i
<a o s o
t
Com
plex
Off
ice
to
T3 u c
1 o U
73 Ö > o
•0
5 8
.SP 5 M «3 55 C73
T3
<u
CO +-> U <u
p. u IS >
■c a >-i
.2 <D O
CO
>^ CO
V >
-a
u 's1 a,
I x i
p
UH
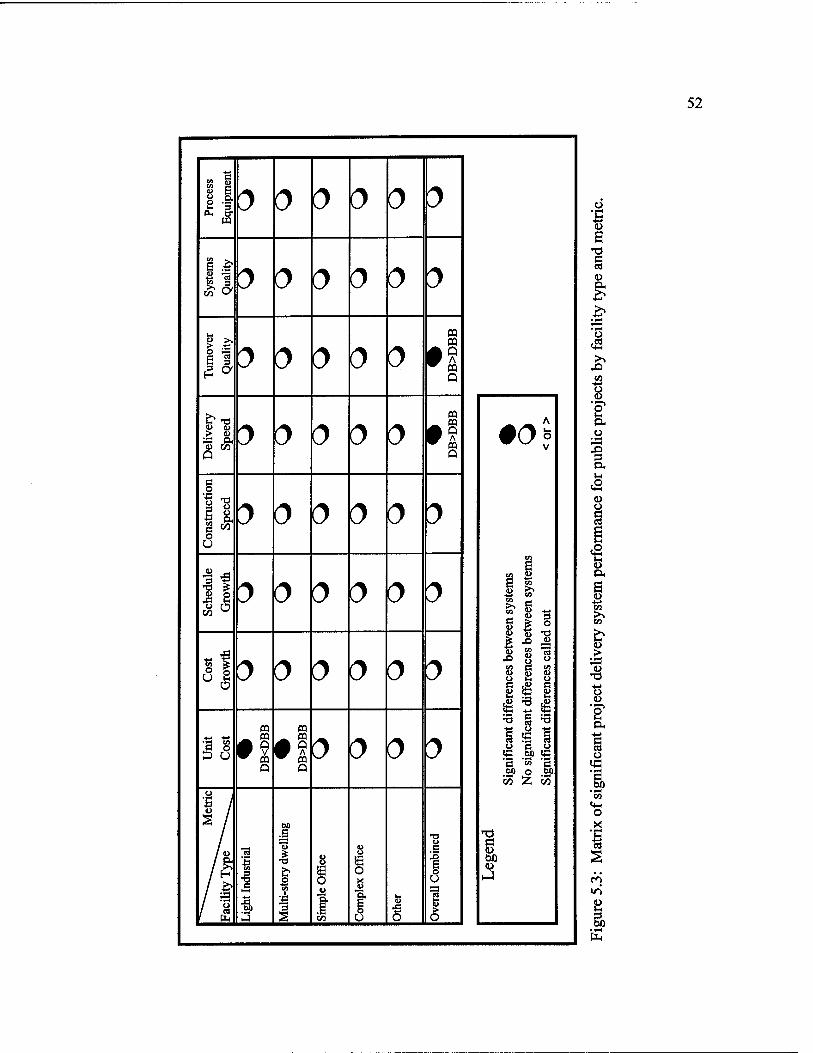
52
Proc
ess
Equ
ipm
ent
3 0 0 0 (3 0 Sy
stem
s Q
ualit
y
3 0 0 0 0 3
Tur
nove
r Q
ualit
y
3 0 0 0 0
DB
>D
BB
Del
iver
y Sp
eed
0 0 0 0 0 05
^ 03 Q
Con
stru
ctio
n S
peed
0 0 0 0 0 3
Sche
dule
G
row
th
0 0 0 0 0 0
Cos
t G
row
th
3 0 0 0 0 0
Uni
t C
ost
03
• v ^ 05
Q
05
w 03 Q 0 0 0 0
w /
s /
/ * / 'o / «9 ' Hi
CO
■§ a
3
60 .g
4 to
1 •a 1
u o m o u
f i/3
u m o u
t o U o
u c
1 o u % > o
A
00* V
<D CO
s >-> CO
CO s O *j
s 9? a> 'O fc ,JD ü
iß s CO a co u 53 u O K u
3 S « O -a 1 1 ^ M Iß
I *co *3 O M
t/3 Z 35
T3 a u 00 a>
hJ
Ü
'B e
U
CO +^ o u 's1 OH
■3
«s o
U
I •4-» co >. CO
• 1—1
o
o «C
'S) CO
«4-1
O
I
fe

53
Figure 5.4 illustrates the significant findings for project delivery system performance
for 85 federal projects by facility type and metric. Of the five facility types, only simple
office projects yielded statistically significant differences between design-build and
design-bid-build in measures. Design-build projects performed better than design-bid-
build with lower schedule growth and faster delivery speed results. No significant
differences were noted between the two delivery systems for each of the quality measures
within each of the five facility types. Regardless of facility type, the overall combined
performance of all 85 reported federal projects again significantly supported design-build
as better than design-bid-build for schedule growth and delivery speed. Regarding
quality, the combined overall performance of the federal projects proved no significant
differences between the two delivery systems for turnover, systems or process equipment
quality.
5.1.2 SUMMARY OF UNIVARIATE RESULTS BY OWNER TYPE
The original result comparisons shown in Figures 5.2, 5.3, and 5.4 revealed that the
design-build projects proved to be better than the design-bid-build projects in nearly
every instance where significance was noted. The only exception provided within public
sector multi-story dwelling facilities where design-build projects were greater than
design-bid-build projects regarding unit cost. However, these significant differences
among delivery systems occurred within different facility types for each owner type. The
quality measures identified no significant differences between the delivery systems for
each facility type by owner. However, design-build had significantly better quality,
although for different measures, than design-bid-build when combining all projects
within each owner. The only metric in which design-build out performed design-bid-
build for each of the three owners was delivery speed without considering facility type.
Though design-build was identified as significantly better than design-bid-build in
many aspects, these preliminary univariate results indicated that each of the three owner
types' projects performed differently from each other based on the original data.
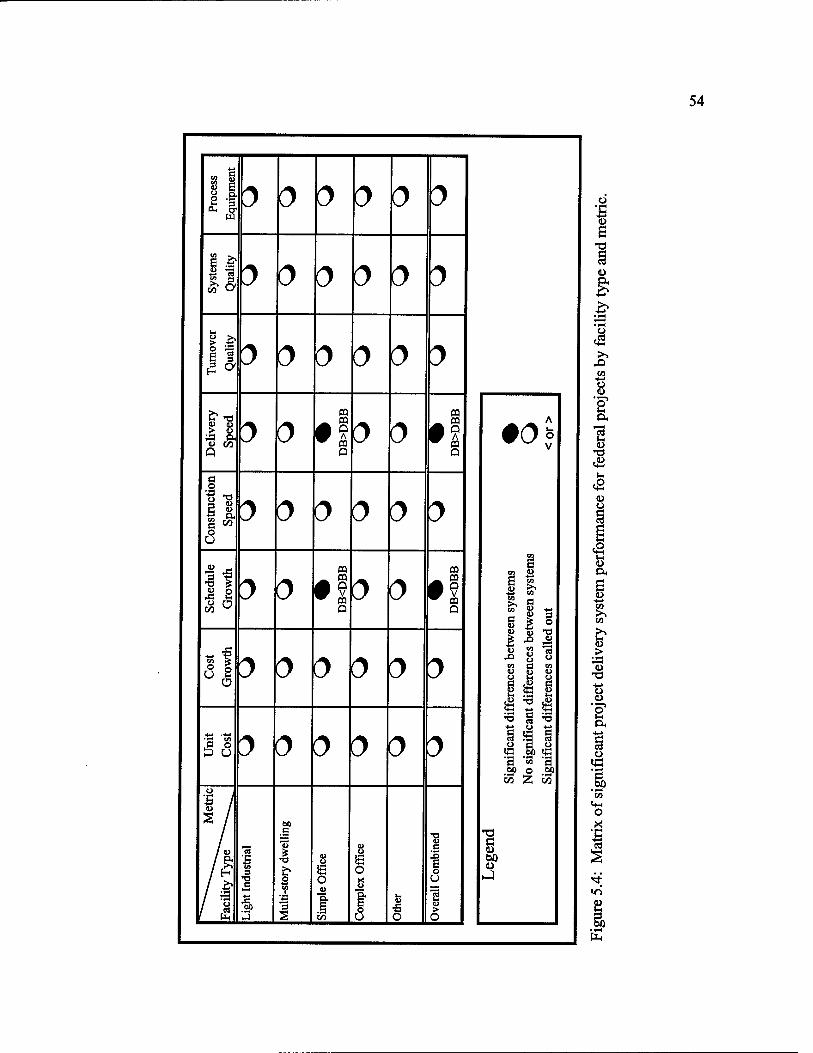
54
Proc
ess
Equi
pmen
t
0 0 0 0 0 0 Sy
stem
s Q
ualit
y
0 0 0 0 0 3
Turn
over
Q
ualit
y
3 0 0 0 0 0
Del
iver
y Sp
eed
3 0 CQ
• * ^ CQ Q
0 0 CQ
^ CQ Q
Con
stru
ctio
n Sp
eed
0 0 0 0 0 3
Sche
dule
G
row
th
3 0 CQ
^ CQ Q
0 0 CQ
^ CQ Q
Cos
t G
row
th
3 0 0 0 0 0
Uni
t C
ost
3 0 0 0 0 0
£ \ s /
/u
I & 1 ^ / a* Li
ght I
ndus
trial
60 c
1 Q u i
■c "3
Sim
ple
Off
ice o
o X o
1 o Urn
t
"8 c
1 o U
1 > o
00
| * Ja U
CO U o a £
3 ^
is 1 y o o JO .5) «a S) o §
tv3 £ w
ß tu) CD
o •c
J t4-H
o
"a1 &,
8 IM
I-
<a <u Q
Ü ft
u -4-» w w
tu >
"öS -4-» o tu
■g1 ft
o 10
w o
I s
PH

55
However, limitations of the original CII study identified the original data did not capture
the cost or schedule data to objectively and directly measure the performance of design-
build versus design-bid-build in every instance (Konchar 1997).
In specific regard to federal projects, interviews conducted with federal owners
identified several shortcomings of the original CII study in reporting total cost and
schedule data. For example, one design-build project reported its design start date for the
design-build contract at 35 percent design already complete prior to the award date.
Therefore, the cost and schedule data did not accurately account for the cost or time to
accomplish the start of design from zero percent complete. In addition to cost and
schedule information, some federal owners indicated that quality performance
assessments were solicited too early in their project's lifecycle to accurately measure
facility performance. More detailed investigations of federal projects are presented in the
following section that address the impact of new design cost and schedule data as well as
quality differences reported since the original CII study was conducted in 1997. The
original CII study (Konchar, 1997) recognized that different project timelines for delivery
systems allowed possible unequal comparisons from other than a zero percent design
starting point.
5.2 FEDERAL PROJECT DATA
This section describes the composition of the 88 federal projects. Three projects not
provided in time for inclusion in the original CII study were added to the original 85
projects. New data collected on these 88 projects focused on cost and schedule data
inclusive of the design start date at zero percent design complete. Also, new quality
assessments were provided for comparison to the original quality ratings.
Federal project responses were collected from several industry sources involved in
the design and construction of federal facilities throughout the United States. Projects
were provided by managers in companies drawn from CII, Design-Build Institute of

56
America (DBIA), Association of General Contractors (AGC), Partnership for Achieving
Construction Excellence (PACE), and several Perm State alumni. Eighty eight projects
were owned by 13 federal agencies in 22 states. Of the 88 federal projects, 69 percent
were provided by federal agencies acting as project owners with the remaining 31 percent
provided by construction entities that had constructed federal facilities. However, only
project owners provided new cost, schedule and quality data via telephone interviews.
Federal project owners included the Department of Veterans Affairs, Departments of the
Army, Navy and Air Force, Federal Aviation Administration, Healthcare Finance
Administration, Office of the Comptroller of the Currency, Internal Revenue Service,
Justice Department, Federal Bureau of Investigations, Jet Propulsion Laboratory,
National Aeronautics and Space Administration, and United States Postal Service.
Forty of the 88 projects used design-build (45 percent of the total sample size) while
48 used design-bid-build (55% of the total sample size). Figure 5.5 presents the
distribution of federal sector projects among each of the facility types by delivery system.
Projects were classified into the same five facility types as previously presented for the
original private, public and federal owner types in Section 4.1: light industrial, multi-unit
dwelling, simple office, complex office, and "other" facilities.
The simple office facility category had the highest representation with 30% of the
project responses. The "other" facilities category had the lowest, representing only 10%
of the reported project total. This category accounted for a total of 9 design-bid-build
projects reported as heavy industrial or high technology projects. Except for the "other"
facilities category, each facility type was equitably represented among the two delivery
systems. Though most project sample sizes for each facility type were less than twenty,
combined use of parametric and non-parametric statistical tests allowed the researcher to
reach supportive conclusions about four of the five facility types.
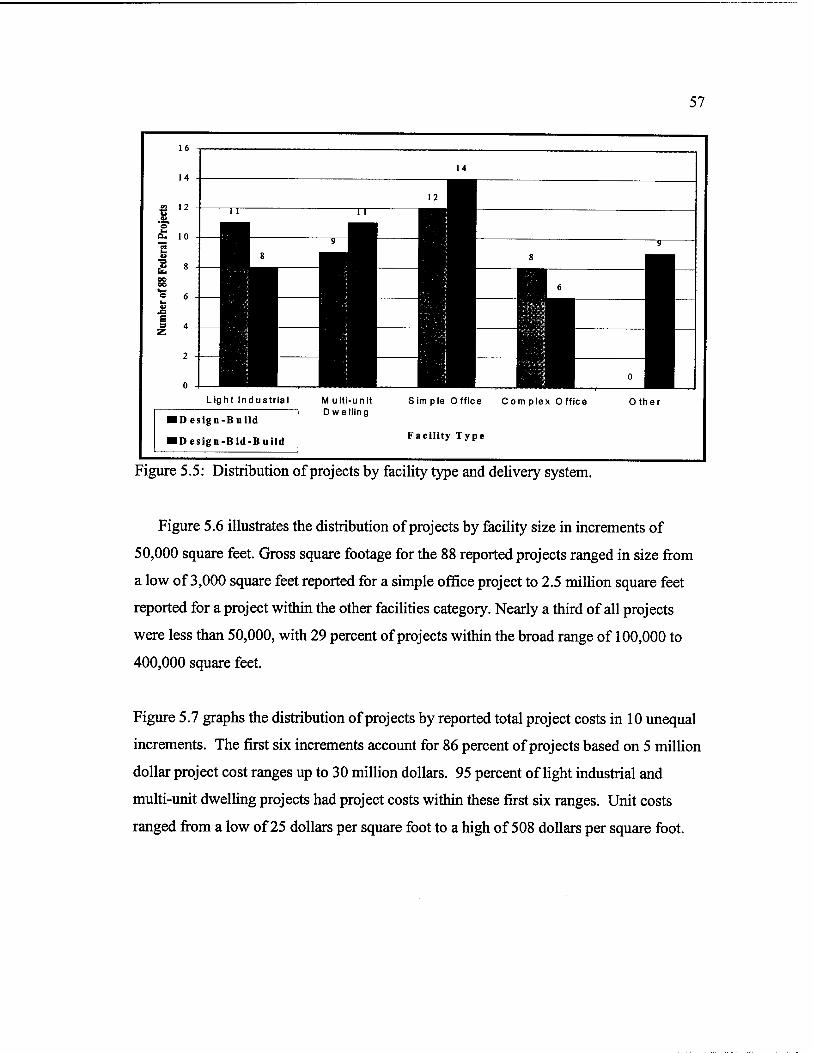
57
16
Light Industrial
ID esign-B uild
IDesign-Bid-Build
M ulti-unit D welling
Simple Office Complex Office
Facility Type
Other
Figure 5.5: Distribution of projects by facility type and delivery system.
Figure 5.6 illustrates the distribution of projects by facility size in increments of
50,000 square feet. Gross square footage for the 88 reported projects ranged in size from
a low of 3,000 square feet reported for a simple office project to 2.5 million square feet
reported for a project within the other facilities category. Nearly a third of all projects
were less than 50,000, with 29 percent of projects within the broad range of 100,000 to
400,000 square feet.
Figure 5.7 graphs the distribution of projects by reported total project costs in 10 unequal
increments. The first six increments account for 86 percent of projects based on 5 million
dollar project cost ranges up to 30 million dollars. 95 percent of light industrial and
multi-unit dwelling projects had project costs within these first six ranges. Unit costs
ranged from a low of 25 dollars per square foot to a high of 508 dollars per square foot.

58
35%
L
9%
13%
0-50 50-100 100-150 150-200 200-250 250-300 300-350 350-400 > 400
Project size in 1000 square feet
Figure 5.6: Distribution of project size in square feet.
30%
25%
■S" 20%
.5 15%
a 10%
28%
14%
13%
6%
1 7%
3% 3% _ 2% ^^ 2%
■ ■ m m 0-5 5-10 10-15 15-20 20-25 25-30 30-40 40-50 50-100 > 100
Project cost in millions of dollars
Figure 5.7: Distribution of total project cost.
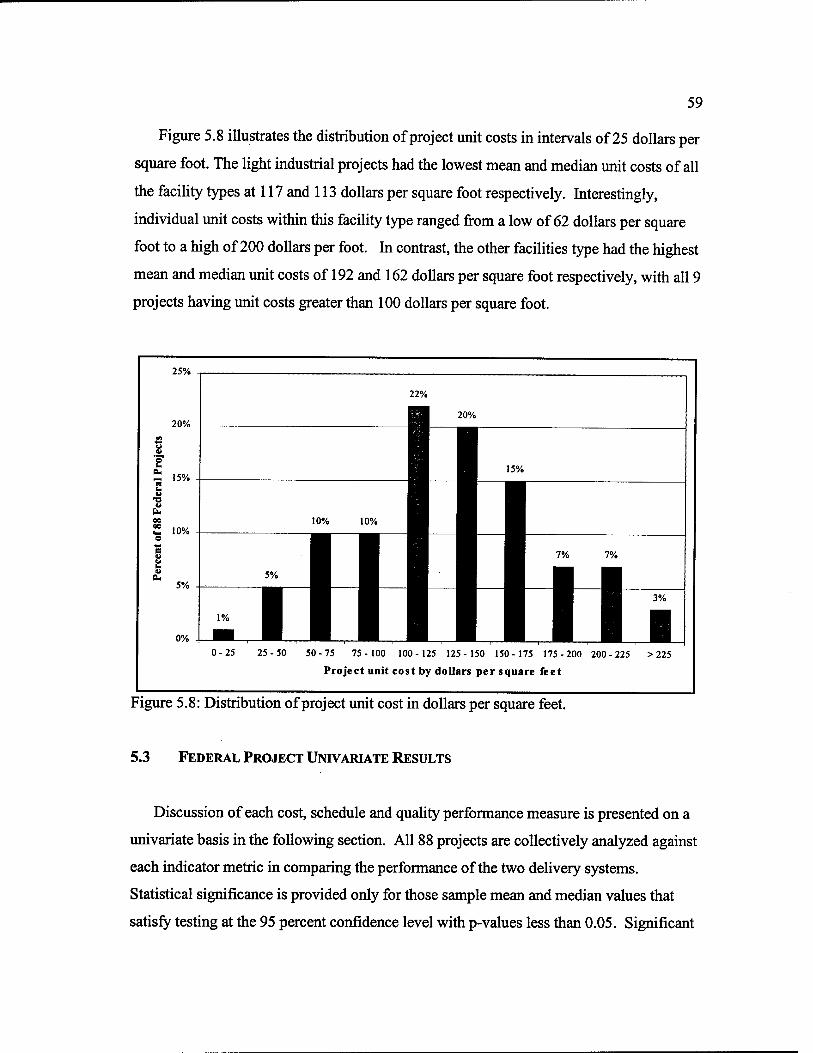
59
Figure 5.8 illustrates the distribution of project unit costs in intervals of 25 dollars per
square foot. The light industrial projects had the lowest mean and median unit costs of all
the facility types at 117 and 113 dollars per square foot respectively. Interestingly,
individual unit costs within this facility type ranged from a low of 62 dollars per square
foot to a high of 200 dollars per foot. In contrast, the other facilities type had the highest
mean and median unit costs of 192 and 162 dollars per square foot respectively, with all 9
projects having unit costs greater than 100 dollars per square foot.
25%
20%
_ 15%
"O
b oe £ 10% e
5%
0%
22%
20%
5%
Hj 3% ■ 0-25 25-50 50-75 75-100 100-125 125-150 150-175 175-200 200-225 > 225
Project unit cost by dollars per square feet
Figure 5.8: Distribution of project unit cost in dollars per square feet.
5.3 FEDERAL PROJECT UNIVARIATE RESULTS
Discussion of each cost, schedule and quality performance measure is presented on a
univariate basis in the following section. All 88 projects are collectively analyzed against
each indicator metric in comparing the performance of the two delivery systems.
Statistical significance is provided only for those sample mean and median values that
satisfy testing at the 95 percent confidence level with p-values less than 0.05. Significant

60
differences between delivery systems are discussed for only those cost and schedule
metrics with both median and mean p-values less than 0.05. The discrete variables used
to score quality require mean values with associated p-value less than 0.05 to identify
significant differences between delivery systems. Refer to Appendix C for summary
statistics regarding phase two federal project data.
5.3.1 UNIVARIATE COST RESULTS
Four metrics were used to analyze project performance by delivery system: unit cost,
cost growth, design cost growth, and construction cost growth. Results of statistical
testing for each cost metric are provided in Table 5.1 by delivery system.
Metric Delivery
System
N Median p-value Mean p-value StDev Significance
Unit Cost DB 40 124.00 0.39 124.00 0.18 50.80 No DBB 48 134.00 141.00 71.30
Cost Growth DB 40 4.01 0.39 5.72 0.12 7.16 No DBB 48 5.19 9.00 12.10
Design DB 40 0.00 0.39 5.30 0.21 21.50 No Cost Growth DBB 48 0.00 6.10 11.80
Construction DB 40 3.67 0.09 5.75 0.11 7.40 No Cost Growth DBB 48 5.56 9.30 12.60
Table 5.1: Sample statistics for cost performance measures by delivery system.
Median values were used to represent the central tendencies of the project cost data.
New data collected since the original CII study included the cost of design work
performed prior to design-build contract award. No significance was noted between the
delivery systems for any of the four cost measures. Measures of design cost growth alone
resulted in median values of 0 percent for both delivery systems. There was no
significant difference between the two. Nearly 70 percent of both design-build and
design-bid-build projects reported design cost growth of 0 percent. Strong outlying
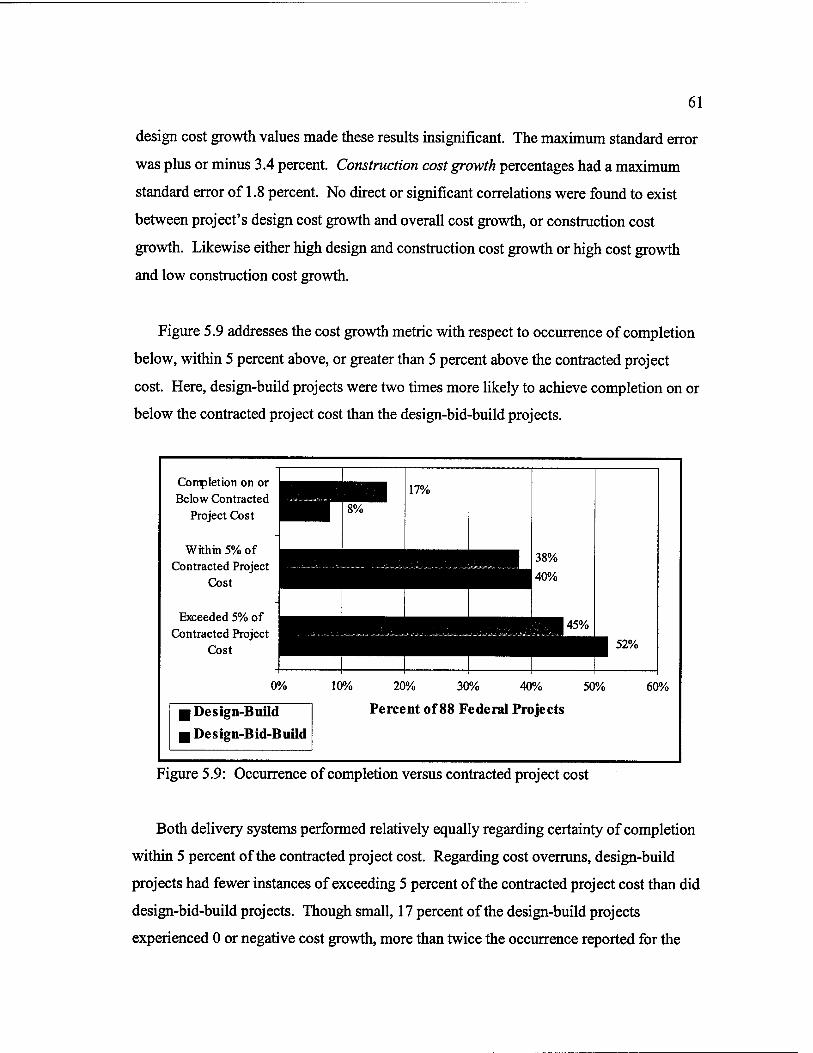
61
design cost growth values made these results insignificant. The maximum standard error
was plus or minus 3.4 percent. Construction cost growth percentages had a maximum
standard error of 1.8 percent. No direct or significant correlations were found to exist
between project's design cost growth and overall cost growth, or construction cost
growth. Likewise either high design and construction cost growth or high cost growth
and low construction cost growth.
Figure 5.9 addresses the cost growth metric with respect to occurrence of completion
below, within 5 percent above, or greater than 5 percent above the contracted project
cost. Here, design-build projects were two times more likely to achieve completion on or
below the contracted project cost than the design-bid-build projects.
Completion on or Below Contracted
Project Cost
Within 5% of Contracted Project
Cost
Exceeded 5% of Contracted Project
Cost
17%
38%
40%
52%
[Design-Build I Design-Bid-Build
10% 20% 30% 40% 50% 60%
Percent of 88 Federal Projects
Figure 5.9: Occurrence of completion versus contracted project cost
Both delivery systems performed relatively equally regarding certainty of completion
within 5 percent of the contracted project cost. Regarding cost overruns, design-build
projects had fewer instances of exceeding 5 percent of the contracted project cost than did
design-bid-build projects. Though small, 17 percent of the design-build projects
experienced 0 or negative cost growth, more than twice the occurrence reported for the

62
design-bid-build projects. Across the whole sample of federal projects, 55 percent of the
design-build projects were more likely to achieve 5 percent or less cost growth as
compared to 48 percent of design-bid-build projects.
5.3.2 UNIVARIATE SCHEDULE RESULTS
Four metrics were used to analyze project performance by project delivery system:
schedule growth, delivery speed, construction speed, and procurement speed. Results of
statistical univariate testing of each metric are presented in Table 5.2 by delivery system.
Of these four metrics only schedule growth was significantly different for each delivery
system by both median and mean values with a maximum standard error of plus or minus
three percent growth.
Metric Delivery
System
N Median p-value Mean p-value StDev Significance
Schedule DB 40 0.2 0.003 1.5 0.005 10 Yes Growth DBB 48 6.9 11.2 20.4
Delivery DB 40 3325 0.087 5448 0.27 5271 No Speed DBB 48 1577 4354 7210
Construction DB 40 5865 0.032 10310 0.41 10547 No Speed DBB 48 3451 7634 12216
Procurement DB 40 20661 0.669 34215 0.042 5552 No Speed DBB 48 25532 66221 14386
Table 5.2: Sample statistics for schedule performance measures by delivery system.
Several of the performance metric results conflict with the univariate findings of the
original federal project data presented previously in Figure 5.4. Interestingly, when one
adds in the time for any design developed prior to the award of the construction contract
for both design-bid-build and design-build projects, the significant differences between
project delivery systems regarding delivery speed disappear. Construction speed
remained insignificant for delivery system performance. Procurement speed, defined as

63
the facility gross square footage divided by the as-built procurement time, measures the
relative speed with which a project is advertised and subsequently contracted to begin the
construction or design-build process. Design procurement speed was not calculated as
the actual advertisement date for professional design services was not recorded.
Furthermore, significant differences in schedule growth between the two delivery
systems remained in favor of design-build projects having less growth than design-bid-
build projects with the inclusion of this design time. A further investigation of schedule
growth is provided.
The median schedule growth values for design-build and design-bid-build are 0.2
percent and 6.9 percent respectively as represented by the horizontal line dividing each
boxplot. Figure 5.10 illustrates the distribution and range of each delivery system's
schedule growth. This plot presents the range of schedule growth percentages by
quartiles of each delivery system sample.
50 —
Xi 40 -
2 30 -
JS 20 —
"g io - ■S n Cfl 0 —
g -10 -
Ö PLH -20 -
-30 -
6.90%
0.20%
1 1
Design-Build Design-Bid-Build
Figure 5.10: Schedule growth distribution by delivery system.

64
The boxplot reports 50 percent of all design-bid-build projects were completed with
6.9 percent or greater schedule growth. Only 25 percent of design-bid-build projects had
less than 0 percent and schedule growth. In contrast, approximately 50 percent of all
design-build projects experienced schedule growth at or below 0 percent.
Figure 5.11 explores more closely the distribution of schedule growth by charting the
percentage of projects whose final schedule completion duration was below the planned
schedule duration, within 5 percent above the planned schedule duration, or exceeded 5
percent of the planned schedule duration. This graph reports 50 percent of all design-
build projects experienced 0 percent or negative schedule growth, nearly two times more
frequent than that reported for the design-bid-build projects. Conversely, 58 percent of
all design-bid-build projects were more likely to exceed 5 percent of planed project
schedule duration, which is nearly twice the occurrence of the design-build projects.
Completion of Schedule either As Planned or Earlier
Within 5% of Planned Schedule Duration
Exceeded 5% of Scheduled Project
Duration
I Design-Build
I Design-Bid-Build
58%
0% 10% 20% 30% 40% 50% 60% 70%
Percent of 88 Federal Projects
Figure 5.11: Occurrence of on-time proj ect schedule performance.
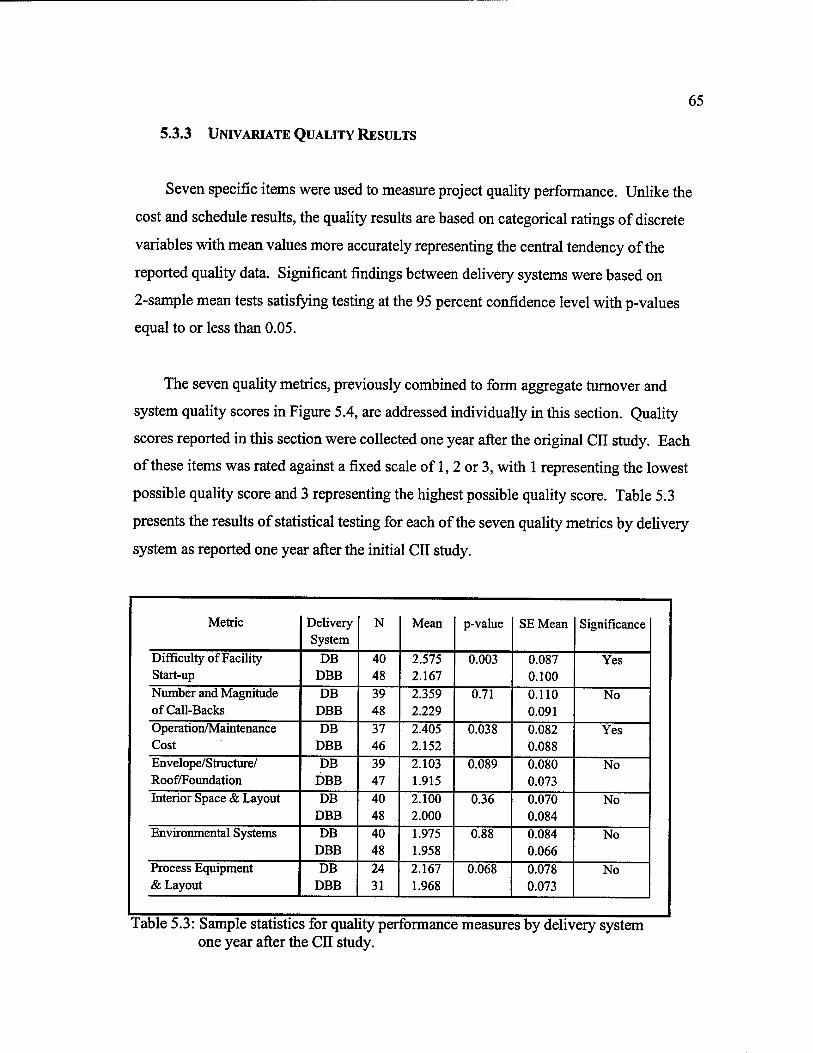
65
5.3.3 UNIVARIATE QUALITY RESULTS
Seven specific items were used to measure project quality performance. Unlike the
cost and schedule results, the quality results are based on categorical ratings of discrete
variables with mean values more accurately representing the central tendency of the
reported quality data. Significant findings between delivery systems were based on
2-sample mean tests satisfying testing at the 95 percent confidence level with p-values
equal to or less than 0.05.
The seven quality metrics, previously combined to form aggregate turnover and
system quality scores in Figure 5.4, are addressed individually in this section. Quality
scores reported in this section were collected one year after the original CII study. Each
of these items was rated against a fixed scale of 1,2 or 3, with 1 representing the lowest
possible quality score and 3 representing the highest possible quality score. Table 5.3
presents the results of statistical testing for each of the seven quality metrics by delivery
system as reported one year after the initial CII study.
Metric Delivery System
N Mean p-value SE Mean Significance
Difficulty of Facility Start-up
DB DBB
40 48
2.575 2.167
0.003 0.087 0.100
Yes
Number and Magnitude of Call-Backs
DB DBB
39 48
2.359 2.229
0.71 0.110 0.091
No
Operation/Maintenance Cost
DB DBB
37 46
2.405 2.152
0.038 0.082 0.088
Yes
Envelope/Structure/ Roof/Foundation
DB DBB
39 47
2.103 1.915
0.089 0.080 0.073
No
Interior Space & Layout DB DBB
40 48
2.100 2.000
0.36 0.070 0.084
No
Environmental Systems DB DBB
40 48
1.975 1.958
0.88 0.084 0.066
No
Process Equipment & Layout
DB DBB
24 31
2.167 1.968
0.068 0.078 0.073
No
Table 5.3: Sample statistics for quality performance measures by delivery system one year after the CII study.
66
New quality data ordered survey responses into time categories of within 2, 3 to 4,
and greater than 4 years since project completion. Approximately 45 percent of each
delivery systems' project data were provided within 2 years of project completion, and an
additional 34 percent between 3 to 4 years. Typically, quality results for all measures
received higher mean scores for project responses provided greater than 4 years since
project completion. The quality assessments for completed projects greater than 4 years
old may not accurately represent quality performance for facility start-up or call-backs
which focus on the early stages of a project's operational life.
Two quality performance metrics consistently identified significant differences
between delivery systems over time: difficulty of facility-start-up and
operation/maintenance costs. Rated on low, medium or high difficulty (3,2 and 1
respectively) design-build projects yielded the highest overall mean score for facility
start-up, significantly outscoring design-bid-build projects. Both systems achieved
results above the accepted limit of medium difficulty with a maximum standard error of
plus or minus 0.10. However, 60 percent of all the design-build projects were
consistently rated as having low difficulty, compared to 30 percent of all design-bid-build
projects receiving the same low difficulty assessment. No changes were reported by the
owners and facility managers for start-up quality over the one-year time period between
the original and new quality assessments.
Regarding the operation and maintenance costs, owners measured their facilities
based on a low, medium or high cost assessment of facility performance to date, with low
cost assigned a score of 3 and high cost assigned a score of 1. The new quality
assessments yielded significantly different mean scores of 2.400 for the design-build
projects and 2.152 for the design-bid-build projects. Interestingly, original quality
assessments for this measure did not identify any difference in performance between
systems. Figures 5.12 and 5.13 graph the original and new operation and maintenance
scores respectively by delivery system and years since project completion.
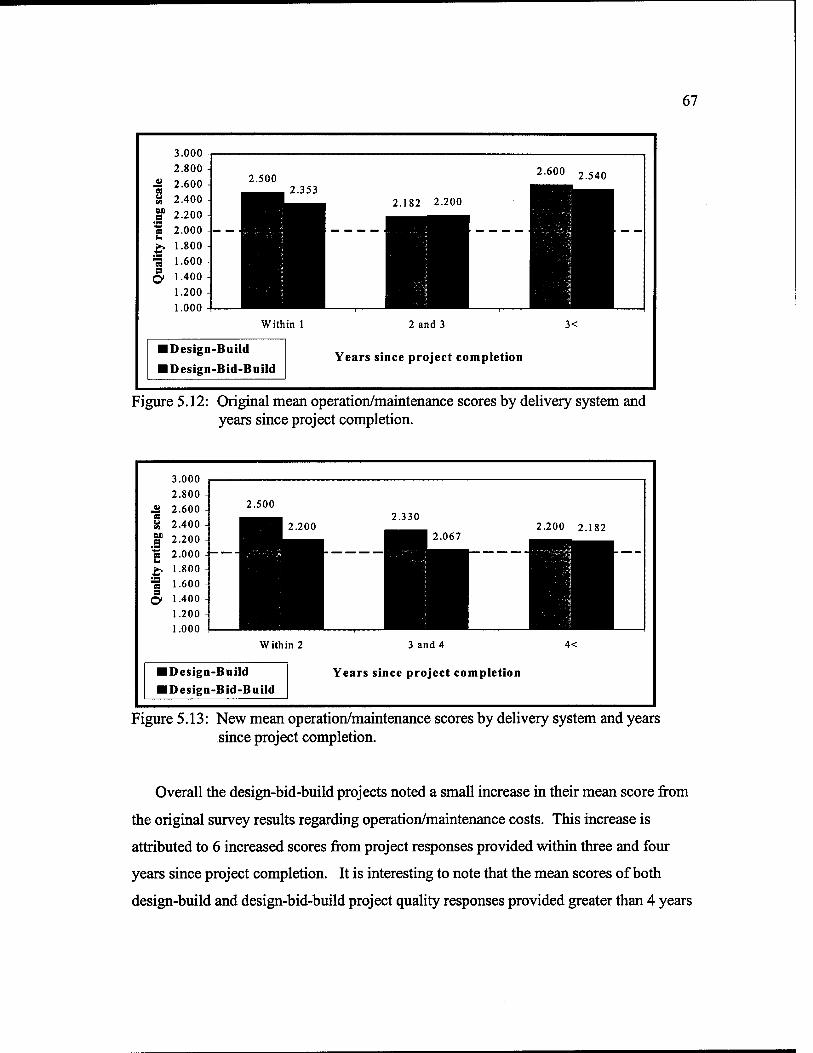
67
MO a
es s O
3.000
2.800
2.600
2.400
2.200
2.000
1.800
1.600 -I
1.400
1.200 A
1.000
2.500 2.600 2_540
2.353 2.182 2.200
Within 1
IDesign-Build
IDesign-Bid-Build
2 and 3
Years since project completion
3<
Figure 5.12: Original mean operation/maintenance scores by delivery system and years since project completion.
at a
s
Within 2
IDesign-Build IDesign-Bid-Build
3 and 4
Years since project completion
4<
Figure 5.13: New mean operation/maintenance scores by delivery system and years since project completion.
Overall the design-bid-build projects noted a small increase in their mean score from
the original survey results regarding operation/maintenance costs. This increase is
attributed to 6 increased scores from project responses provided within three and four
years since project completion. It is interesting to note that the mean scores of both
design-build and design-bid-build project quality responses provided greater than 4 years
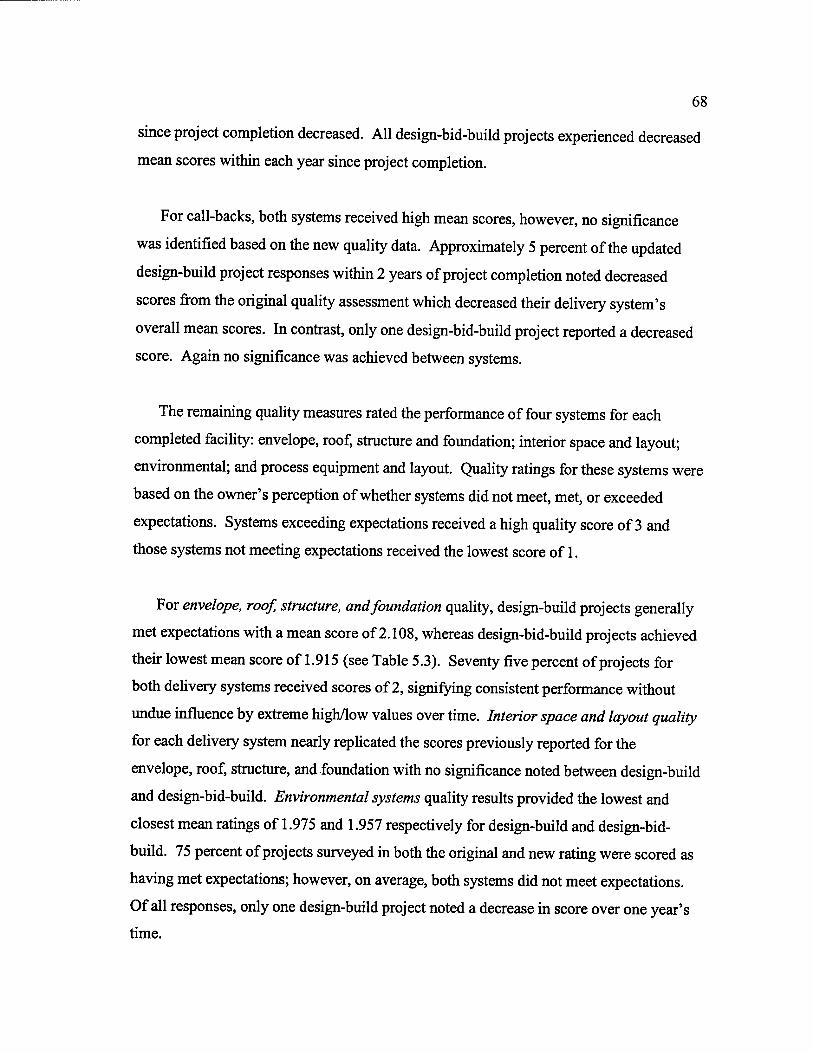
68
since project completion decreased. All design-bid-build projects experienced decreased
mean scores within each year since project completion.
For call-backs, both systems received high mean scores, however, no significance
was identified based on the new quality data. Approximately 5 percent of the updated
design-build project responses within 2 years of project completion noted decreased
scores from the original quality assessment which decreased their delivery system's
overall mean scores. In contrast, only one design-bid-build project reported a decreased
score. Again no significance was achieved between systems.
The remaining quality measures rated the performance of four systems for each
completed facility: envelope, roof, structure and foundation; interior space and layout;
environmental; and process equipment and layout. Quality ratings for these systems were
based on the owner's perception of whether systems did not meet, met, or exceeded
expectations. Systems exceeding expectations received a high quality score of 3 and
those systems not meeting expectations received the lowest score of 1.
For envelope, roof, structure, and foundation quality, design-build projects generally
met expectations with a mean score of 2.108, whereas design-bid-build projects achieved
their lowest mean score of 1.915 (see Table 5.3). Seventy five percent of projects for
both delivery systems received scores of 2, signifying consistent performance without
undue influence by extreme high/low values over time. Interior space and layout quality
for each delivery system nearly replicated the scores previously reported for the
envelope, roof, structure, and foundation with no significance noted between design-build
and design-bid-build. Environmental systems quality results provided the lowest and
closest mean ratings of 1.975 and 1.957 respectively for design-build and design-bid-
build. 75 percent of projects surveyed in both the original and new rating were scored as
having met expectations; however, on average, both systems did not meet expectations.
Of all responses, only one design-build project noted a decrease in score over one year's
time.
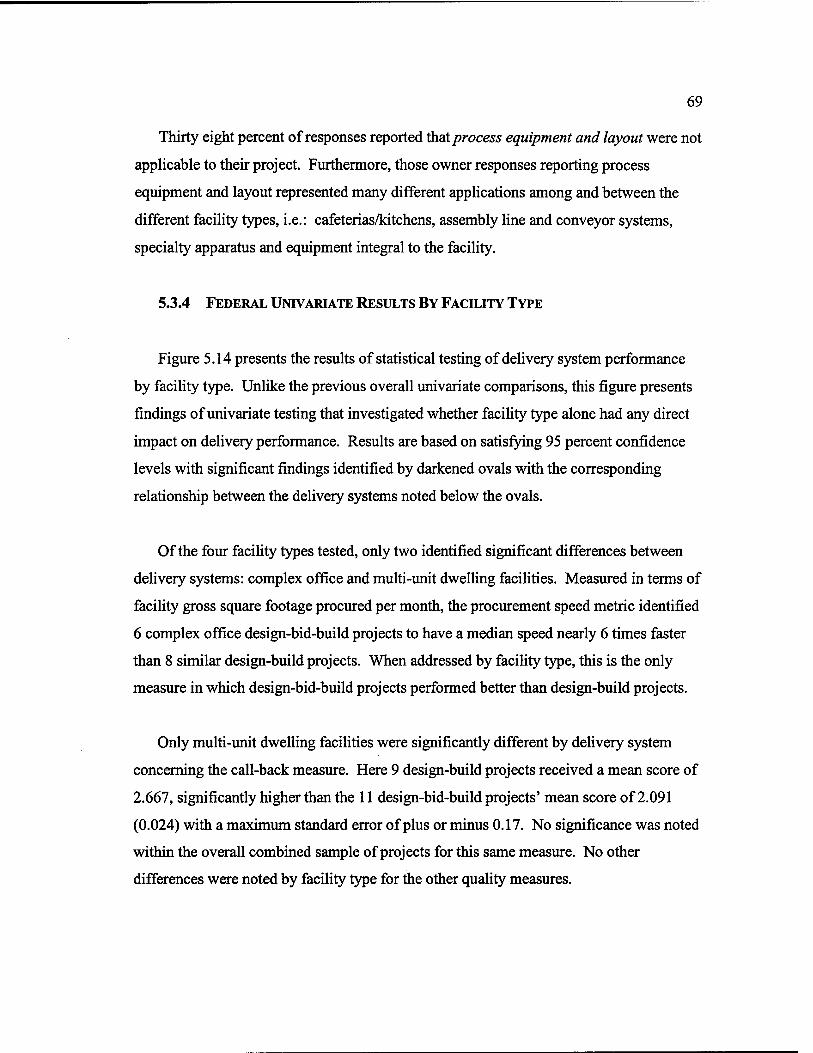
69
Thirty eight percent of responses reported that process equipment and layout were not
applicable to their project. Furthermore, those owner responses reporting process
equipment and layout represented many different applications among and between the
different facility types, i.e.: cafeterias/kitchens, assembly line and conveyor systems,
specialty apparatus and equipment integral to the facility.
5.3.4 FEDERAL UNIVARIATE RESULTS BY FACILITY TYPE
Figure 5.14 presents the results of statistical testing of delivery system performance
by facility type. Unlike the previous overall univariate comparisons, this figure presents
findings of univariate testing that investigated whether facility type alone had any direct
impact on delivery performance. Results are based on satisfying 95 percent confidence
levels with significant findings identified by darkened ovals with the corresponding
relationship between the delivery systems noted below the ovals.
Of the four facility types tested, only two identified significant differences between
delivery systems: complex office and multi-unit dwelling facilities. Measured in terms of
facility gross square footage procured per month, the procurement speed metric identified
6 complex office design-bid-build projects to have a median speed nearly 6 times faster
than 8 similar design-build projects. When addressed by facility type, this is the only
measure in which design-bid-build projects performed better than design-build projects.
Only multi-unit dwelling facilities were significantly different by delivery system
concerning the call-back measure. Here 9 design-build projects received a mean score of
2.667, significantly higher than the 11 design-bid-build projects' mean score of 2.091
(0.024) with a maximum standard error of plus or minus 0.17. No significance was noted
within the overall combined sample of projects for this same measure. No other
differences were noted by facility type for the other quality measures.
70
Proc
urem
ent
Spee
d 3 3 3
DB
<DB
B
3 C
onst
ruct
ion
Spee
d
3 3 3 3 3
Del
iver
y Sp
eed
3 3 3 3 3
•§1 3 3 3 3 CQ m
■ v ^CQ
Q
11 o o
s s? © ©
3 3 3 3 3 ■4-»
so Q
3 3 3 3 3
CO fe
«I 3 3 3 3 3
DO 3 3 3 3 3
'£ £ /
/ M
/ ~ ' 1 UH
"is E CO 3
■4-t fi M 3
.g
Q
i
i
4> o m o
1
u ss o
1
1) 3
1 O U
1 > O
Proc
ess
Eq.
&
Lay
out
3 3 3 3 3
Env
iron
men
tal
Syst
ems
3 3 3 3 3
Inte
rior
Spa
ce
& L
ayou
t
3 3 3 3 3 E
nvel
ope/
Roo
f St
ruct
ure/
Foun
datio
n
3 3 3 3 3
j s s g u C
°£ 3 3 3 3
CQ
Q
CO
CQ
u 3
CQ CQ
m CQ O
3 3 3
5- 3 3 3 3
CQ CQ
PA wm o o
'■S 0) /
s /
/ u
/ a ' 1 ÜH
3 3
a 3
oo .3
1 Q
'3 i
o
o
f
U
o
t o U
T3 V 3
1 O U
1 > O
A
•0° V
W
E CO u
E w
§ >> CO Ö
£? 6 — ee
n et
we
dou
betw
ce
sb
calle
co e co u 83 to o ft o
ren
iffe
re
n
'S § 'S *i ü *i S in S u c u
M o & w Zi»
O Ö <u bi <L> J
1
ü
a
O u
-c? S-H
Ö T3
<U a i-i
«S u o
OH
b >
■1-H
o CD
1 o
I "l-H
o
I
i
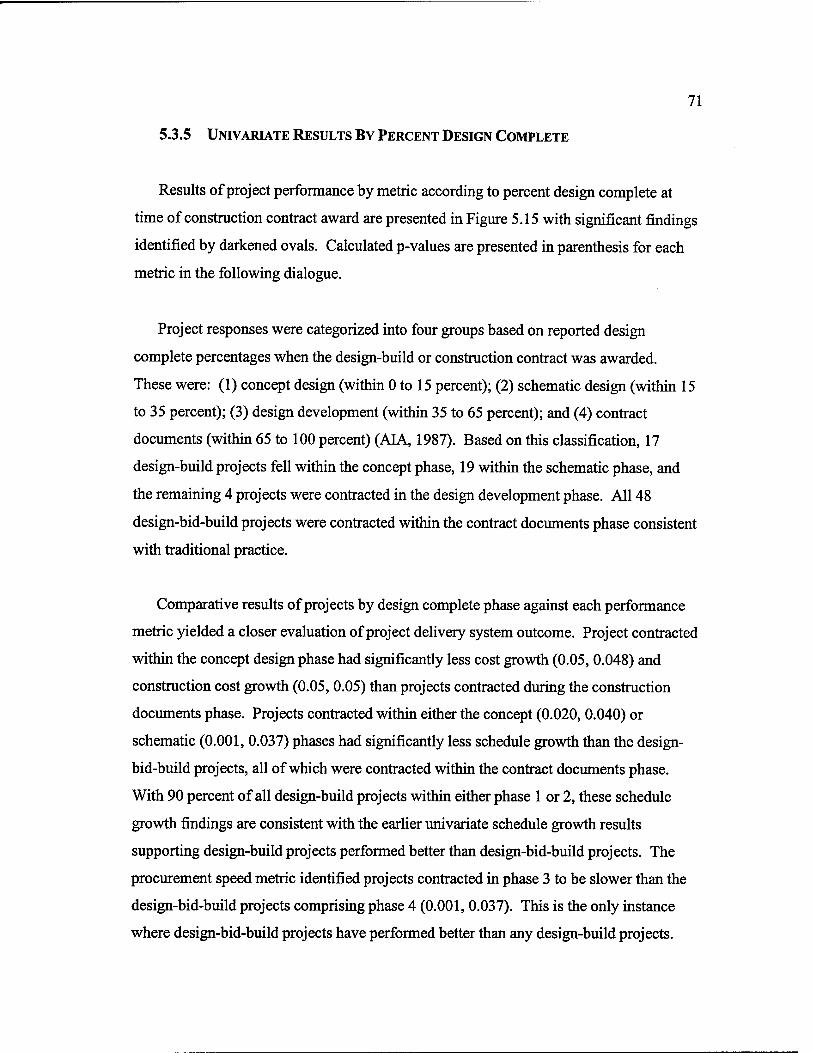
71
5.3.5 UNIVARIATE RESULTS BY PERCENT DESIGN COMPLETE
Results of project performance by metric according to percent design complete at
time of construction contract award are presented in Figure 5.15 with significant findings
identified by darkened ovals. Calculated p-values are presented in parenthesis for each
metric in the following dialogue.
Project responses were categorized into four groups based on reported design
complete percentages when the design-build or construction contract was awarded.
These were: (1) concept design (within 0 to 15 percent); (2) schematic design (within 15
to 35 percent); (3) design development (within 35 to 65 percent); and (4) contract
documents (within 65 to 100 percent) (AIA, 1987). Based on this classification, 17
design-build projects fell within the concept phase, 19 within the schematic phase, and
the remaining 4 projects were contracted in the design development phase. All 48
design-bid-build projects were contracted within the contract documents phase consistent
with traditional practice.
Comparative results of projects by design complete phase against each performance
metric yielded a closer evaluation of project delivery system outcome. Project contracted
within the concept design phase had significantly less cost growth (0.05, 0.048) and
construction cost growth (0.05, 0.05) than projects contracted during the construction
documents phase. Projects contracted within either the concept (0.020, 0.040) or
schematic (0.001, 0.037) phases had significantly less schedule growth than the design-
bid-build projects, all of which were contracted within the contract documents phase.
With 90 percent of all design-build projects within either phase 1 or 2, these schedule
growth findings are consistent with the earlier univariate schedule growth results
supporting design-build projects performed better than design-bid-build projects. The
procurement speed metric identified projects contracted in phase 3 to be slower than the
design-bid-build projects comprising phase 4 (0.001, 0.037). This is the only instance
where design-bid-build projects have performed better than any design-build projects.
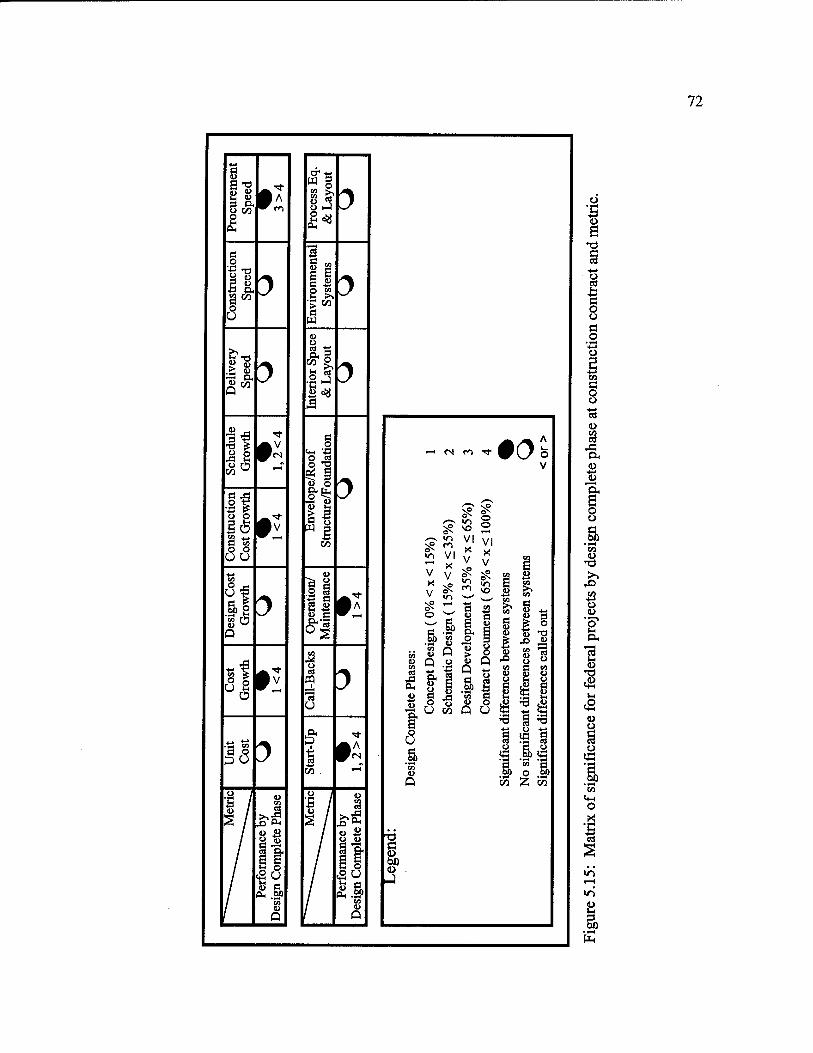
72
Pro
cure
men
t S
peed
3>
4
Con
stru
ctio
n Sp
eed
3
Del
iver
y Sp
eed
3
<8°
'«I SO CO ^ a co o o U U 4-» CO
U £ So g "go Q
3
3I •x
II 0
£ / ID /
s /
Perf
orm
ance
by
Des
ign
Com
plet
e Ph
ase
^1
Jto
CO
o
g-S U O
a*
p
CO
II 2 S ».a
CD
tu
a*;
3 3
51
CO
»—1 tN ci T •Ob V
o m
VI X
VI X!
V
VI X V §
V V cs~- ^? CO, 8 X V
m in £
CO
CO
o v^ a "4
CO CO
a
*w^ ft 6 u ti
ces
betw
ca
lled
o
09 a)
.1 CO 4) n
• 1—1 CO u Q C)
ft "5 >
Ü o Q
u
09
& ID O a
II) a
■*-» u ca
CO U U a
u U n CO u IH S3 n O U
'o CO
IU
Q o u £
jg antd
di
ffe
o +s O § «a a ö
•SP 'co fl»
u S) ia
I *co '3 o 5b
Q CO Z to
T3 C <u bo <D -1
(L>
fl* o o a o
w fl O
IS W
fl, u
O
.1
o <L>
AH
'S <a
^4-1
1- a <L> O
'I O X
1 I—I
fe

73
For the quality measures, start-up produced significant differences by noting projects
within phases 1 and 2 achieved higher scores than projects within phase 4 (0.004). Also,
operation and maintenance quality measured phase 1 projects to have scored lower costs
on average than projects classified into phase 4 (0.034). Interestingly, phase 4 projects
which have the greatest level of design scored significantly lower in each quality measure
noted on Figure 5.15 than projects contracted with much less design information (phases
1 and 2).
5.3.6 SUMMARY OF UNIVARIATE RESULTS
The univariate findings focused on identifying any possible direct relationships
between delivery systems and project performance. These univariate comparisons were
unadjusted for any other variables. They explored the sample population by delivery
system for each of the 15 performance metrics. The effects of facility type and percent
design complete on delivery system performance were also investigated. Comparison of
results between the original CII findings and the federal findings revealed 1 key
difference; the inclusion of all design time from zero percent design complete provided
no significant differences between delivery systems for delivery speed. This is a change
from the original CII study data which identified significant differences between delivery
systems for this metric.
Differences between delivery system performance were reported at the 95 percent
confidence level. The objective results collected with the data collection tool, the data
checking, and telephone interview of each project owner provided high confidence in the
data as accurate and representative of the selected federal projects' performance. The
relatively few instances of statistical differences between design-build and design-bid-
build both overall and facility specific by metric supported further investigation beyond
univariate analysis. A project's delivery system is one of 65 possible explanatory
variables collected in this study. Multivariate regression analysis was conducted to
explore the interaction of these delivery systems with all other reported variables.
74
5.4 MULTIVARIATE RESULTS FOR DELIVERY SPEED
The conflicting univariate results identified for federal projects between the original
and new datafor delivery speed supported further statistical analysis of this performance
measure. Multivariate regression analysis investigated the presence of delivery systems
and facility type in conjunction with other variables in explaining delivery speed
performance. Variables exhibiting the greatest influence on delivery speed for federal
projects were next compared to the original CII study delivery speed model to identify
similarities or differences in variation.
5.4.1 FEDERAL MULTIVARIATE RESULTS
An explanatory model was developed for the delivery speed metric based on
multivariate regression analysis of all reported project data. Resultant computer output of
the final delivery speed regression model and the influence of its associated explanatory
variables are provided in Appendix C. The final regression model achieved a p-value of
0.000 providing statistical significance in the explanation of delivery speed variation.
Of the 88 total federal projects, this model incorporated data from 77 projects to
explain 82 percent of the variation in the delivery speed metric. Ten projects did not
report sufficient variables identified in the model, and therefore were unable to contribute
to any explanation. One project was intentionally removed due to its strong level of
influence exerted on this model identified through residual diagnostic analysis and
examination of Cook's Distance (Minitab, 1995). This design-bid-build project was
awarded for construction more than two years after the design effort had been completed.
Due to funding appropriations, this project resulted in an overall four year project
duration which directly increased delivery speed.
75
The 82 percent R-squared value calculated by the model provides strong statistical
support for the variables identified as having the greatest proportion of variation for
delivery speed. The model identified the following variables ranked by relative influence
in explaining delivery speed performance variation:
1. Project size
2. Facility type
3. Delivery system
4. Design time prior to construction advertisement
5. Contract unit cost
6. Percent design complete at construction contract award
7. Team's prior experience as a unit
8. Project team chemistry
9. Procurement time
10. Experience of members with similar facilities
Initial investigation of best subset regression models identified a non-linear
relationship between delivery speed and the explanatory variables; a transformation of
delivery speed was required. Using the Minitab® statistical software, several trial
transformations identified that the natural log of delivery speed best provided a linear
relationship in defining the model. Of the independent variables identified, project size
explained approximately 48 percent of the total variation in delivery speed performance.
A direct, positive relationship between area and delivery speed was identified by the
model, such that larger project size resulted in faster delivery speed. Most noticeably,
specific interaction between light industrial facilities and their respective gross square
footage provided the next highest single explanation accounting for 11 percent of the
variation. Again, as size of the project increased for this particular facility type so too did
delivery speed.
Facility type was identified as important by collectively explaining 18 percent of the
variation for delivery speed. In addition to the specific relationship identified for light
76
industrial facilities and their size, other facility types held strong, positive relationships
with resultant delivery speed as identified by their model coefficients. Delivery speeds
increased for complex office and simple office projects regardless of delivery system.
Facilities within the "other" facility type category also maintained a positive yet
noticeably less significant relationship with delivery speed. Again, it must be noted that
all projects within the "other" facilities category were delivered using design-bid-build.
The delivery system used on a project provided less importance in explaining delivery
speed, accounting for only 8 percent of the variation. Solving the regression equation
individually for each delivery system, comparisons between design-build and design-bid-
build delivery speed identified only marginal differences between their respective
performance. Based on the model output for each delivery system, design-build was, on
average, 1.1 percent faster than design-bid-build.
The seven remaining variables provided less significant explanation. The model
identified the shorter the design time, the faster the resultant delivery speed noting a very
direct positive correlation in that the time to complete 35 percent design is shorter than a
100 percent design complete effort. Contract unit costs were identified as having a
negative relationship, such that delivery speed decreased as contract unit costs increased.
This finding appears logical since the heavy industrial and high-technology projects
comprising the "other" facilities category had the highest contract unit costs of which all
were design-bid-build projects. Light industrial projects had the lowest contract unit
costs with no significant differences between delivery systems within this category.
The negative coefficient for percent design complete at design-build or construction
contract award indicated that projects contracted within the earliest stage of design
achieved higher delivery speeds than projects contracted after 35 percent design
complete. Most noticeably, complex office projects achieved high delivery speeds
benefiting from contract award at the earliest stage of design complete. However, these
projects reported longer procurement times. This in turn directly relates to the model's
77
findings that longer procurement periods resulted in slower delivery speeds. For
example, more complex projects more often experienced longer procurement time
periods based on the level of detail required in submitting design-build proposals and the
subsequent proposal review and selection process.
Though less influential in explaining delivery speed variation, bad project team
chemistry decreased delivery speed whereas project team's prior experience as a unit
positively impacted delivery speed effectiveness. Competitive bidding of federal projects
often prevents repeat project relationships, which conflicts with the positive influence of
prior team experience on improving delivery speed performance as identified in this
research. Furthermore, project team member's experience with similar facilities,
particularly excellent design-build entities' experience increased delivery speed. This
relationship is important since a design-builder's experience with a particular facility type
is often a factor in prequalification and selection for a project (Potter et al., 1995).
5.4.2 COMPARISON OF FEDERAL AND CII DELIVERY SPEED MODEL RESULTS
Table 5.4 presents a comparison of the variables identified through multivariate
regression analysis of delivery speed derived from the new federal data and original CII
study data. Numerical rankings of each variable identify their relative influence in
explaining delivery speed variation.
Interestingly, project size, facility type and contract unit cost provided high levels of
explanation for delivery speed in each study. Percent design complete, delivery system,
and team member experience with similar facilities were also identified as significant
explanatory variables yet each provided different levels of influence for each respective
model. Each study's respective delivery speed model also identified several other
variables uncommon to each other's model. These variables contributed significantly
less influence in explaining delivery speed variation.

78
Based on the this study's focus on design start time, two variables identified in the
federal delivery speed model were not considered in developing the original CII study
delivery speed model: design time prior to construction contract award and procurement
time. Multivariate results indicate that federal government projects devote more time to
design and procurement prior to construction contract award. It is unknown how these
variables might have contributed to the original CII study had they been included. With
only 10 projects reporting renovation efforts greater than 10 percent, the federal delivery
speed model did not recognize level of new construction as significant. Possible
explanation for these differences may stem from competitive federal acquisition
requirements in procuring design-build services as well as lack of federal renovation
projects for comparison.
New Federal Data
CII Data
Number of Projects 77 328
Explained Variation 82% 88%
Project size 1 1
Facility type 2 4
Delivery system 3 8
Design time prior to construction advertisement 4 N/A
Contract unit cost 5 2
Design complete percentage 6 3
Team's prior experience as a unit 7 N/A
Project team chemistry 8 N/A
Procurement time 9 N/A
Experience of members with similar facilities 10 6
Project team communication N/A 5
Project complexity N/A 7
Level of new construction N/A 9
Presence of onerous clauses in contracts N/A 10
Table 5.4: Ordered influence of explanatory variables in delivery speed variation for new federal data and original CII data.
79
5.5 SUMMARY
Univariate comparisons of the original CII project data for private, public, and federal
projects showed several differences in delivery system performance. Results confirmed
that design-build projects performed better than design-bid-build projects for several
performance measures for all projects and for certain facility types; however, results were
different for each owner type. New cost, schedule and updated quality data collected
from the original 85 and three new federal project owners resulted in significantly
different findings from the original univariate results. Updated quality ratings collected
one year after original data collection identified facility start-up and operation and
maintenance cost quality measures to have the highest number of changed scores over
time. Both measures statistically proved scores for design-build projects to be
significantly higher than design-bid-build project scores. Further univariate analysis
identified significant differences in project performance by percent design complete prior
to design-build or construction contract award.
Univariate differences in delivery speed performance between the original CII data
and the new federal data indicated possible differences resulting from inclusion of design
concept time. Multivariate regression analysis using new design data identified ten
variables, inclusive of delivery system and facility type, that collectively explained 82
percent of the variation in delivery speed. When compared to the original CII study
delivery speed model, only three variables provided similarly high levels of explanation
in each model: facility size, facility type, and contract unit cost. Five of the remaining
seven less significant variables were different between the two models.

80
CHAPTER 6
DISCUSSION AND CONCLUSIONS
This chapter summarizes the main findings of this research and discusses the quality
and delivery speed performance results. Limitations of the research methods, project
performance data collection, measurement and analysis are presented. Contributions of
this study to current project delivery system research are followed by areas for future
research. Finally, this study is concluded.
6.1 MAIN FINDINGS
Univariate comparisons of cost, schedule, and quality identified several differences in
project performance by delivery system for each of three project owner types: private,
public, and federal. Based on the original 273 projects' cost and schedule data collected
in phase one of this study, design-build projects were significantly faster than design-bid-
build projects in overall delivery speed for all owners. However, data verification
identified inconsistencies in 43 project timelines relating to the accurate start of project
design. New cost and schedule data collected in phase two of this study acquired directly
from federal project owners provided direct comparison of project delivery timelines
from zero percent design complete. Inclusion of this concept design time from the start
of project design resulted in no significant speed differences between project delivery
systems by facility type.
Comparison of original quality assessments to new quality data collected one year
later provided fairly consistent results between delivery systems over time. Of the seven
quality measures, only the number and magnitude of call backs and the operation/
maintenance cost metrics changed. Regarding call backs, scores decreased minimally
over the one year time period between quality assessments done within the first two years
since project completion. The greatest change in score occurred for operation/

81
maintenance costs which identified design-build projects to perform better than design-
bid-build projects. Between the original and new data, design-build scores increased over
time compared to decreased design-bid-build scores providing statistical differences
between delivery systems. The most dramatic and influential changes occurred within
three and four years and greater than four years since project completion. These varying
scores suggest that operation/maintenance costs are not a static measure since time is
necessary to establish whether energy consumption goals are being met and to evaluate
the life-cycle costs of the facility.
Investigation of project performance measures by percent design complete at
construction contract award provided statistical differences between and within delivery
systems. By categorizing projects into one of four design phases, various forms of
design-build project delivery were directly compared. No significant differences in
project performance were noted between projects contracted within either the concept or
schematic design phase. However, projects within the concept design phase consistently
performed better than projects contracted within the contract documents phase.
Multivariate linear regression analysis of delivery speed identified 10 variables
providing the highest proportion of explanation for delivery speed variation. Three
variables explained 74 percent of the variation of this model: facility size, facility type,
contract unit cost, and delivery system. These primary variables are fairly consistent with
previous delivery speed model findings (Konchar, 1997) however several other less
significant variables were identified in addition to the three in the original CII delivery
speed model. Inclusion of percent design complete at construction contract award, design
time prior to construction advertisement and procurement time were identified as less
important explanatory variables. Interestingly, a lower percentage of design complete at
construction contract award improved the delivery speed, whereas increased procurement
time decreased delivery speed. Coupled with less design complete percentages, shorter
design times also improved delivery speed. Other variables explaining delivery speed
performance included: team member's experience as a unit, project team chemistry, and

82
team member experience with similar facilities. Except for team chemistry, these last
few variables are all known prior to project commencement and should be considered in
planning the project.
6.2 DISCUSSION
Two primary findings presented above warrant further discussion: the quality results
and measurement of delivery speed. Each topic is presented individually below.
6.2.1 QUALITY
The quality findings provide a better understanding of the relative results obtained
through measuring and comparing quality over a period of time since project completion.
It must be noted that the quality scores reported in this research measured owner
satisfaction rather than actual quantifiable facility quality performance. The researcher
notes a distinction between conformance with design drawings and adherence with
performance criteria in measuring facility quality. Without pre-set evaluation criteria,
measuring facility quality in terms of design, construction, and operation is limited to the
subjective opinion of the facility owner and their degree of satisfaction with the facility.
However, both the Navy's Post Occupancy Evaluation (POE) program (Naval Facilities
Engineering Command, 1995) and current quality research (Corbett, 1997) have
identified the importance of measuring customer satisfaction or customer confidence in
the resultant facility. It must be noted that owners might not have the same expectations
or levels of satisfaction which would impact their evaluation.
The unchanged facility start-up quality scores between the original and new data
suggests consistent interpretation and reliable measurement of building commissioning
and initial building start-up. This consistent scoring provides strong confidence in the
statistical differences reporting design-build to perform better than design-bid-build for
this measure. In contrast, the call back measure changes over time and may be impacted

83
by number of latent defects not found during project inspection. Though operation/
maintenance costs were not collected by the data collection tool, owners were asked to
make their assessment based on recorded costs to operate and maintain the facility
relative to the facility's operation budget. Changes in operation and maintenance costs
identify the dynamic nature of facilities' life cycle costs over time with performance
requirements used on design-build projects performing better than detailed, prescriptive
facility requirements used on design-bid-build projects. However, changes in operation/
maintenance costs could also reflect changes in building occupancy and function from the
original design.
The unchanged quality scoring for each of the four systems quality measures suggest
that no building functions changed since project completion and as a result owner
expectations did not change. However, the consistently low mean quality scores reported
for each of the four building systems could suggest owners or facility users are not
knowledgeable of or familiar with actual system requirements. Additionally, these low
scores could in fact suggest that the facility systems were not adequate for their intended
purpose. Furthermore, owner expectations for system performance may not be as high or
as important as other quality measures.
6.2.2 DELIVERY SPEED
The 1.1 percent difference in delivery speed performance between design-build and
design-bid-build projects is the second issue requiring further discussion. Earliest
possible delivery of a project through shortened project delivery was identified as the
primary reason for public project owners to select design-build for the delivery of their
projects (Molenaar, 1995). Though new cost and schedule data was acquired to account
for initial concept design for design-build projects, no other direct explanatory evidence
was collected to explain this finding. Four possible explanations for these findings are:
84
1. Project owners may have misinterpreted telephone interview questions or
inaccurately provided data regarding concept design start.
Project data provided from several federal agencies was collected to compare design-
build and design-bid-build projects from equal starting dates. Responses from the
Department of Veterans Affairs provide an interesting case study of how project schedule
data was recorded for comparison between design-build and design-bid-build projects.
By their own measure, the Department of Veterans Affairs have noted a 33 percent
reduction in project duration for design-build projects when compared to design-bid-build
projects (Anglim, 1998). Their project duration metric for design-build projects started
with the preparation of the request for proposal. They equated this to the start of
construction documents with approximately 35 percent design complete at that time.
Design start dates provided for design-bid-build projects were reported at the start of
design development. Thus the actual start from zero percent design complete for both
delivery systems is not reported in the project duration, rather an equivalent start point
was selected for both systems—35 percent design complete.
2. Fixed funding cycles may suggest lack of importance or urgency in completing the
initial concept design prior to construction advertisement date.
Design and construction are funded separately and sequentially for federal projects
based on congressional appropriations (Enloe, 1997). As design funds are approved at
the beginning of each fiscal year, initial concept design may commence immediately and
be completed several months in advance of construction funding approval or continue at
a less critical pace until construction funding is provided. These two different approaches
to completing design within a fixed time frame may illustrate the inaccuracy of actual
design time used in the delivery process.
85
3. The noted lack of significance in project delivery speed between delivery systems
could suggest inaccurate or unrealistic project schedules.
The use of design-build requires owner capability in conceptual design, accurate
parametric estimating and scheduling to develop request for proposals. Seventy percent
of all military project responses devoted at least five months to developing concept
design and the request for proposal for projects using design-build. Though this concept
design time is on average shorter than the entire design time for design-bid-build projects,
this research has identified procurement time to acquire the design-build contract to
influence the resultant delivery speed. Though 50 percent of design-build projects were
completed on or below schedule, their overall project durations were not significantly
dissimilar than design-bid-build projects. Careful project pre-planning and continued
experience with design-build project delivery might more accurately establish optimum,
shorter project schedules (Brans, 1997, Songer, 1992).
4. All projects delivered via the design-build method in this study were executed as test
cases and procured under the restrictions set forth in the old Federal Acquisition
Regulations prior to the implementation of the Federal Acquisition Reform Act of
1996.
The old regulations did not formally address how design-builders should be qualified
or selected nor how much design was required prior to design-build contract award.
Previous literature (Potter et al, 1994, NSPE, 1994) identified public agencies created
their own unique approaches to design-build qualification. This research identified the
higher the percentage of design complete prior to construction contract award, the slower
the delivery speed. Furthermore, procurement speed decreased with lower percentages of
design complete prior to construction contract award. In contrast, the reformed
acquisition guidelines provide more flexibility in selecting and applying design-build
project delivery for federal project execution.
86
6.3 IMPLICATIONS FOR FEDERAL PROJECT OWNERS
An important distinction exists between statistical significance and practical
significance that warrants further discussion relating to the delivery of federal projects.
Though previous public owner opinion polls identified shortened project duration as the
primary reason for design-build project delivery selection, delivery speed may not have
been the critical factor in executing and measuring all projects. Rather, the funding
cycles may drive project durations. Federal agencies are charged with expending
allocated funds within specified time periods. Because design and construction occur in
series and are funded sequentially, there is no incentive to speed up the design process.
Though design-build projects had significantly less schedule growth than design-bid-
build projects, there were no significant differences in delivery speed. Since design funds
to accomplish initial design for a design-build project are separate from the construction
funds to accomplish the single source design-build effort, there is no incentive to expedite
the process. Therefore, the current method of separately funding design and construction
provides not method to optimize parallel activities of design and construction for design-
build projects. In addition to design and construction, procurement time constitutes
another component of delivery speed that the federal government must shorten in order to
improve design-build project delivery speed.
Project specific goals may place more weight on costs than schedule for successful
project completion. The government's goal is to acquire projects based on the lowest
responsive cost that satisfies construction of a defined facility. The government is also
allowed to spend the budgeted amount and may add work scope to maximize the facility
quality for the given budget. The use of guaranteed maximum price contracts with
possible shared savings clauses might provide more cost savings to the owner if the
government can "retain" those unspent funds.
87
Projects executed using the design-bid-build delivery system incorporate periodic
design reviews throughout the duration of the design phase to allow owner input in the
development of the design. Typically, reviews are conducted at 35, 65, and 95 percent
design complete phases (Duncan, 1998). In executing design-build projects, federal
owners still participated in periodic design reviews though the design-build entity was not
always contractually bound to incorporate changes. However, incorporated owner
changes resulted in change orders to the contract. Though no actual change order cost or
time data was collected, design-build contracts awarded in the concept design phase
experienced less construction cost growth than design-bid-build projects. This suggests
that the federal government benefits from early design-build creativity and
constructability innovation which in-turn experiences less changes in the construction
phase. Interestingly, design accomplished in the design-build contract did not always
proceed to 100 percent design complete documentation. Anecdotal evidence from project
owners identified that the 65 percent design complete review was often the last
opportunity to provide design input as no further drawings or specifications were
accomplished for the project. From that point on, all work focused on construction.
Recognizing the importance of time in assessing facility performance, the Navy's
POE program is currently being redesigned to incorporate periodic and systematic facility
quality surveys based on quantitative data collected after project completion. The facility
start-up, call backs and operation/ maintenance cost quality measures used in this
research directly address the Navy's POE goal of evaluating operational deficiencies of
completed facilities after project completion. To accomplish this goal, previous research
(Perkinson, 1991) stated that clear and measurable operational requirements defined
during project programming allow objective measurement of facility quality throughout
all phases of a facility's life. Therefore, quality assessments should address facility
output rather than design and construction input based on pre-determined operational
goals over a facility's lifecycle.

88
6.4 LIMITATIONS
Five limitations were identified in planning and conducting this research. They are as
follows:
1. Cost and time to perform project pre-planning and programming activities were not
included in this study.
Project programming documentation as well as final site selection were completed
prior to the start of the delivery process as measured from zero percent design complete
in this study. Federal project programming documentation is often completed several
years in advance of actual start of design (Enloe, 1997) With no cost or time data
collected prior to the design start, it is unknown whether programming effort for a
design-build project is less than or greater than programming a design-bid-build project
in terms of time or cost.
2. Design procurement cost and schedule data were not collected in this research.
Professional design services are selected and contracted for federal projects via
qualification, not price (Brooks Act, 40 U.S.C. SS 541). This applies equally to the
selection of design professionals for design-build bridging design efforts as well as
design-bid-build projects. It was assumed in this research that design procurement for
both delivery systems was approximately equal based on the selection procedures
mandated by the Brooks Act. However, some federal agencies may have selected the
designer from a pool of pre-contracted design professionals for a project several years
prior to the start of the design, or they may have indefinite quantity delivery orders for
design services. This selection of design professionals can possibly vary the equitable
comparison of project delivery timelines.
89
3. The number and cost of change orders and claims were not collected.
This research did not specifically record the number and cost of change orders and
claims. The design cost growth, construction cost growth, and total cost growth measures
attempted to capture the relative change in costs from the contracted cost to final cost.
Without specific knowledge of what actually caused any increase in design, construction
or their combined total, and the timing of these changes, it cannot be ascertained whether
cost increases resulted from scope changes, redesign, owner initiated changes, or claims.
4. Quality performance measures were analyzed only on a univariate basis.
Due to the discrete nature of the quality assessment ratings, nominal logistic
regression could have been used to test the statistical likelihood of one delivery system's
quality score over the other delivery system. Without the use of nominal logistic
regression, no explanation of the variation in quality scores could be provided inclusive
of delivery system and facility type. However, for the callback and operation/
maintenance cost quality measures, the noted change in these ratings over time precluded
the use of nominal logistic regression in explaining consistent variation in quality
performance.
5. Multiple linear regression focused on the delivery speed metric.
A better understanding of delivery systems and facility types in explaining each
performance metric could have been provided through the use of multiple linear
regression. As identified between the univariate and multivariate comparisons performed
on delivery speed, the presence of all possible variables in explaining performance
variation can identify the relative impact of project delivery system and facility type.
90
6.5 CONTRIBUTIONS
This study provided three valuable contributions to project delivery system research
and project performance measurement. These contributions follow:
1. Objective comparison of project delivery system performance by owner type.
Specific inquiry into project performance by private, public and federal project
owners identified several differences in project delivery system performance by owner
type. Previous CII research (Konchar, 1997) favored the use of design-build over design-
bid-build separately for each owner type by performance metric. Further analysis of
project performance within the public sector identified significant differences between
state/local public projects and federal projects. Based on this data, both owner types
identified similar differences between delivery systems for delivery speed, though the
federal projects also noted differences within the schedule growth measure. Therefore,
univariate comparisons suggested that project delivery systems differ by owner type in
some manner. Specific investigation of new federal project data further identified the
impact of measuring projects based on equal starting points. These results contradicted
the delivery speed performance findings of the original public project data.
2. Objective comparison of project performance by percent design complete.
Previous research (Federal Construction Council, 1993) subjectively compared
design-build and design-bid-build federal projects based on federal agencies' previous
experiences using these two delivery systems. Anecdotal evidence provided by that
study identified projects contracted between 15 to 35 percent design complete achieved
the best project performance results. This is different to the objective results of this
study. Objective performance measures based on specific cost and schedule project data
identified projects contracted prior to 15 percent design complete actually performed
significantly better than projects contracted after 65 percent design complete. In this

91
instance, design-build projects contracted between zero and 15 percent design complete
actually performed better than all design-bid-build projects in six of the 15 performance
measures. However, no statistical differences were found between the concept,
schematic or design development phases for the design-build projects.
3. Measurement of project quality performance over time.
Two quality assessments were measured one year apart to address the influence of
time in measuring facility quality. Projects responses were provided for projects
completed within the past five years within the United States. Scores between the
original and new data identified start-up quality to be most accurately reported within the
first two years since project completion when knowledge of the turnover process is still
current in contrast to five years after completion. Changes in operation/maintenance
quality for projects within each time period since project completion identified the
dynamic nature of measuring life-cycle costs over the life of a facility.
6.6 FUTURE RESEARCH
Three areas worthy of future research were identified as a result of this research.
Each area of future inquiry is individually discussed as follows:
1. Objectively compare various forms of design-build project delivery methods to
identify successful project attributes for each.
This study recognized that various forms of design-build project delivery systems
exist, though all forms were collectively grouped under the general design-build
definition provided in this research. A similar investigation comparing sole source, two-
phase design-build, bridging, and turnkey design-build project delivery methods could
identify performance differences.

92
2. Objectively compare projects acquired under the guidelines of the old Federal
Acquisition Regulations to projects completed under the auspices of the Federal
Acquisition Reform Act of 1996.
This study utilized project specific data from design-build projects executed over the
past five years by several federal agencies unfamiliar with the design-build project
delivery process. Many of these projects were executed using the design-build method
simply as test cases. As such, these projects might not present the best examples of
successful design-build project execution possibly due either to lack of owner experience
in administering design-build projects or due to the restrictions set forth in the old Federal
Acquisition Regulations.
3. Model the facility programming and project acquisition process for federal design-
build projects.
An understanding of the activities and decisions necessary to define facility
performance requirements and their implementation into request for proposals would
benefit owners' knowledge of design-build project management. Though this research
focused on the design and construction phases of project delivery, inclusion of
procurement time in the delivery speed model provided interesting results suggesting
factors other than design and construction activities impact project performance. It is
during this procurement time that design-builders respond to the requirements established
in the request for proposals from the owners.
6.7 CONCLUSIONS
Project specific data collection is valuable in the objective measurement of project
performance. The 15 project performance metrics of cost, schedule and quality indices
and the data collection tool and interview questions used to capture factual data were
effective tools to evaluate project performance. Objective measurement of key cost,
93
schedule and quality metrics provided direct and statistically supported comparisons
between design-build and design-bid-build project delivery systems. Therefore, this
study's data collection, objective performance measurement and comparison, and
statistical modeling methods met all research objectives.
Univariate statistical analysis of project performance measures identified conclusive
differences between delivery systems based on the central tendencies of the reported data.
These findings supported federal design-build projects perform better than federal design-
bid-build projects for schedule growth, facility start-up quality and operation/
maintenance cost quality. This study's univariate findings provided benchmarks of
federal project performance for present and future comparison. However, comparison of
the original data to the new federal project data identified time to be a factor in measuring
project performance both in terms of elapsed time since project completion and start of
project delivery timelines. Quality results indicated facility start-up assessments should
be accomplished within the first two years after project completion. In contrast, increases
or decreases in the number and magnitude of call backs over time suggest the existence
or absence of latent defects in the construction of a facility. Moreover, several changes in
operation/ maintenance cost ratings identified the importance of measuring and
comparing project performance throughout its lifecycle.
The investigation of project performance by percent design complete prior to
construction contract award suggests that federal design-build projects should be
contracted within the concept design phase. Projects contracted within the concept
design phase capitalized on early construction input and design creativity which resulted
in both lower cost growth and construction cost growth performance as well as less
schedule growth. Furthermore, simple and concise performance requirements conveyed
during the concept phase provided less difficulty in building commissioning and start-up
and lower operation/ maintenance costs over time.
94
Regarding project timelines, measurement and comparison of overall delivery speed
requires consistent interpretation of the sequence of activities, specifically the delivery
process start date. As no changes were noted for the construction speed measure by
delivery system, this suggested that the change in delivery speeds were influenced by
either design prior to construction contract award and/or procurement time to acquire the
design-build or construction contract.
Unlike previous public sector project research in the United States, this study's use of
multivariate analysis allowed for explanation of variation in delivery speed performance
given the influence of several variables acting on the model at one time. Facility size,
facility type and delivery system explained the greatest proportion of variation in delivery
speed which federal owners should use to estimate the project duration. Seven of the 10
key explanatory variables identified were within the control of the project owner. This
suggests owner knowledge of the delivery process prior to both the start of design and the
creation of the project team could aid the owner in his/her project acquisition strategy.

95
BIBLIOGRAPHY
American Institute of Architects. 1975. Design-Bid-Build Task Force Report Washington D.C.
American Institute of Architects. 1987. The Architect's Handbook of Professional Practice. Washington D.C.
Anglim, Thomas. 1998. Western Team Project Director, Office of Facilities Management, Department of Veterans Affairs. Interview with author. 30 March 1998.
Bennett, J., E. Pothecary, and G. Robinson. 1996. Designing and Building a World-Class Industry. Rep. No. ISBN 07049 1, University of Reading. Reading, United Kingdom.
Brans, Terrance A. 1997. Preproject Planning in the University of Texas System. M.S. thesis, University of Texas at Austin.
Corbett, Deanna. 1997. Quantifying Quality in Industrial Construction. PhD diss., The Pennsylvania State University.
Daniel, Wayne W. 1978. Applied Non-parametric Statistics. Boston: Houghton-Mifflin.
Design-Build Institute of America. 1996. Number of design-build contracts up 103% over previous year. Design-Build Dateline, vol. 3, no. 3:1,11.
Dillman, Don A. 1978. Mail and Telephone Surveys: The Total Design Method. New York: Wiley.
Duncan, Daniel W. 1998. Program Manager, Engineering and Construction Division, Directorate of Military Programs, U.S. Army Corps of Engineers. Interview with author. 9 March 1998.
Duncan, Daniel W. 1997. Design-Build Contracting, <http://www.hq.usace.army.mil/ cemp/e/ea/infpr/dbc.htm>
96
Duncan, Daniel W. 1996. Pitfalls Encountered in Design-Build Contracting. <http://www.hq.usace.army.mil/cemp/e/ea/in^)r/dsgb.htm>
Emmons, Terrel M. 1996. Design-Build: Not Necessarily What You Thought It Was. Alexandria, VA: Naval Facilities Engineering Command. Photocopied.
Enloe, James. 1997. Military Construction Program Manager, Office of the Civil Engineer, United States Air Force. Interview with author. 21 May 1997.
Federal Construction Council, Building Research Board, Consulting Committee on Cost Construction. 1993. Experiences of Federal Agencies with the Design-Build Approach to Construction. Technical Report No. 122. Washington, D.C.
Ferrari, Phillip. (1997). Manager, Major Facilities Office, United States Postal Service. Interview with author. 14 October 1997.
Fraga, Robert. 1996. Report and recommendations on USPS use of design-build. Design Build Institute of America. Washington, D.C.
General Services Administration. 1997. Benchmark Study, Sections One and Two. <http://www.gsa.gov/regions/rll/wpc/red/one.htm>
Ichniowski, Tom. 1998. Federal Bureau of Prisons Shifting to Design-Build. Engineering News Record, vol. 240, no. 1:9.
Ichniowski, Tom, and Sherie Winston. 1998. Clinton Budget Hammers Industry. Engineering News Record, vol.240, no. 6:12-13.
Ireland, V. 1982. Virtually Meaningless Distinctions Between Nominally Different Procurement Methods. Photocopied.
Kenig, Michael. 1996. Construction Terminology: What Does It Mean and Why Should You Care? Area Development, November: 60-61.
Konchar, Mark. 1996. A Comparison of United States Project Delivery Systems. Ph.D. diss., The Pennsylvania State University.
97
Kriekemeier, K. G. 1996. Design-build: A Concept Whose Time Has Come.. .Again. Construction Business Review, March/April: 40-42.
Lynch, Theodore D. 1996. A Transaction Cost Framework for Evaluating Construction Project Organizations. Ph.D. diss., The Pennsylvania State University.
McKew, Howard. 1998. Single-Source Solutions. Engineered Systems. March: 34.
Means, R.S. Co. Inc. 1995. Square Foot Costs. 17th Ed. R.S. Means Co. Inc. Kingston, MA. pp. 426-433.
Minitab Inc. 1995. Minitab Release lOXtra Reference Manual. Minitab Inc. State College.
Molenaar, Keith R. 1995. Appropriate Project Characteristics for Public Sector Design- build Projects. M.S. thesis, University of Colorado.
Molenaar, Keith R., and Anthony D. Songer. 1996. Design-Build Literature Review. University of Colorado, Boulder.
Mouritsen, John W. 1993. An Empirical Analysis of the Effectiveness of Design-Build Construction Contracts Based Upon Projects Executed by The Naval Facilities Engineering Command. M.S. thesis. Purdue University.
National Society of Professional Engineers. 1994. Discussion Paper: Design-Build in the Public Sector. Washington, D.C.
National Research Council. 1991. Inspection and Other Strategies for Assuring Quality in Government Construction. Washington, D.C.
Naval Facilities and Engineering Command. 1995. Post Occupancy Evaluation Program Draft Survey. Norfolk, VA.
Neter, John, Michael Kutner, Christopher Nachtsheim, and William Wasserman. 1996. Applied Linear Statistical Models. Chicago: Irwin. 4th Ed.
Olson, Christopher. 1991. Survey of Public Sector Construction: Government strives to build more for less. Building Design & Construction, December: 40-44.

98
Ott, R. L. 1993. An Introduction to Statistical Methods and Data Analysis. Belmont: Wadsworth. 4th Ed.
Pena, William. 1987. Problem Seeking - An Architectural Programming Primer. Washington, D.C.
Perkinson, Greg. 1991. An Information Framework for Facility Programming. M.S. thesis, The Pennsylvania State University.
Pocock, James B. 1996. The relationship between alternative project approaches, integration, and performance. Ph.D. diss., University of Illinois, Urbana- Champaign.
Pocock, James B., and Laing Y. Liu. 1996. Alternative Approaches to Projects: Better or Worse? The Military Engineer, no. 578:57-59.
Potter, Kevin J. and Victor Sanvido. 1995. Implementing a Design/Build Prequalification System. Journal of Management Engineering, May/June: 30-34.
Riley, David, R. 1994. Modeling the Space Behavior of Construction Activities. Ph.D. diss., The Pennsylvania State University.
Roberts, Kenneth M. and Nancy Smith. 1996. Design-Build Contracts Under State and Local Procurement Laws. Public Contract Law Journal, 25, no. 4:645-709.
Sanvido, Victor E., Francios Grobler, M.Kevin Parfitt, Moris Guvenis, and Michael Coyle. 1992. Critical Success Factors for Construction Projects. Journal of Construction Engineering and Management, 118, no. 1:94-l 11.
Sanvido, Victor E., Steven J. Fenves and John L. Wilson. 1992. Aspects of Virtual Master Builder. Journal of Professional Issues in Engineering Education and Practice, 118, no. 3:261-262.
Sanvido, Victor E. 1990. An Integrated Building Process Model. Technical Report No. 1. The Pennsylvania State University.
Songer, Anthony D. 1992. Toward an improved understanding of public sector design- build planning. Ph.D. diss., University of California, Berkeley.

99
Sweets, Justin. 1994. Legal Aspects of Architecture, Engineering, and the Construction Process. New York: West, 5th Ed.
Tarricone, Paul. 1996. Design-Build It, And They Will Come. Facilities Design & Management, Sept: 60-63.
The Collaborative Process Group. 1996. Collaboration in the Building Process. October: Photocopied.
U.S. Department of Commerce. 1997. Forest Products, Building Materials and Construction Division. Washington, D.C.
Wheeler, C.H. 1978. Managing the Architectural Construction Project. The Pennsylvania State University.

100
APPENDIX A
PROJECT DELIVERY SYSTEM DATA COLLECTION TOOL

101
PROJECT DELIVERY SYSTEM SURVEY
THE CONSTRUCTION INDUSTRY INSTITUTE THE PENNSYLVANIA STATE UNIVERSITY
INSTRUCTIONS
Penn State has been selected to conduct a national survey of the three principal project delivery systems in the U.S. today. Please help us by completing the survey for at least one project you have completed in the last 5 years in the U.S. You may submit up to ten. At your request we will provide you a copy of the survey results.
Each survey form should be coordinated by your Project Manager. Thorough responses to survey sections 1 to 5 are the most critical to this study. Other sections are important to explain the reasons for the measured differences.
Upon receipt of your data, Penn State will number each copy, remove company identification, and remove project identification. The information you provide will be kept in strict confidentiality.
Please return the completed questionnaire by mail or fax before Dec. 31,1996 to:
Dr. Victor E. Sanvido, Dept. of Architectural Engineering, Penn State University, 104 Engineering Unit "A", University Park, PA 16802-1416
Fax: (814) 863-4789 Phone: (814) 865-2869
DEFINITIONS
Design Bid Build is a traditional process in the US construction industry where the owner contracts separately with a designer and a contractor. The owner normally contracts with a design company to provide "complete" design documents. The owner or his/her agent then solicits fixed price bids from contractors to perform the work. One contractor is usually selected and enters into an agreement with the owner to construct a facility in accordance with the plans and specifications.
Design Build is an agreement between an owner and a single entity to perform both design and construction under a single design build contract. Portions or all of the design and construction may be performed by the entity or subcontracted to other companies.
In CM at Risk, the owner contracts with a design company to provide afacility design. The owner separately selects a contractor to perform construction management services and construction work in accordance with the plans and specifications for a fee. The contractor usually has significant input in the design process and generally guarantees the maximum construction price.

102
SECTION I: PROJECT CHARACTERISTICS
Project name:, Project location:
Project executive/ respondent who provided data:
Phone number:
Company name: O Owner O Design-Builder O Architect/Designer O Contractor
Please mark the appropriate oval for project type:
O Office O Light Manuf. O Micro-Elec. O Schools O Warehouse O Pharmeceutical O Recreation O Grocery O FoodProc. O Housing O Postal O R&D
O Parking O Other
Building gross square footage
Percentage of the project: Renovation
sf No of floors
_ % New construction .%
SECTION II: PROJECT DELIVERY SYSTEM
Mark the appropriate oval for the project delivery system which best suits that used on your project:
Construction Management @ Risk O Design-Build O Design-Bid-Build O
Mark the appropriate oval for the commercial terms used for the design-builder or designer and contractor: (If Cost plus, please state fee type in blank provided)
Design-Builder O Lump Sum O Cost Plus Fee O GMP Architect/Designer O Lump Sum O Cost Plus Fee O GMP Contractor O Lump Sum o Cost Plus Fee o GMP
SECTION III: PROJECT SCHEDULE PERFORMANCE
Please provide the following schedule information:
Item As Planned (mm/dd/yy)
As Built (mm/dd/yy)
Date Project was Advertised
Design Start Date (Notice to Proceed)
Construction Start Date (Notice to Proceed)
Construction End Date (Substantial Completion)

103
SECTION IV: PROJECT COST PERFORMANCE
What were the following total project costs. Indicate whether estimated (E) or actual (A). Please deduct all property costs; owner costs; costs of installed process or manufacturing equipment; furnishings, fittings and equipment; or items not a cost of the base building.
Stage / Cost Design Costs Construction Costs Total Project Costs
Budget
Contract Award
Final Cost
Please estimate the cost of site work (work done outside the footprint of the building) as the percent (%) of final construction costs: %
SECTION V: PROJECT QUALITY PERFORMANCE
If you are the owner, please complete section V. If not, please provide the owner's name or point of contact and phone number , and proceed to survey section VI.
Mark the appropriate ovals to evaluate the quality of the building:
Difficulty of facility startup: O High O Medium
Number and magnitude of call backs: O High O Medium
Operation/maintenance cost for building/site: O High O Medium
O Low
O Low
O Low
Did the quality of envelope/roof/structure/foundation meet your expectations? O Exceeded O Yes O No
Did the quality of interior space/layout meet your expectations? O Exceeded O Yes O No
Did the quality of environmental systems (light,HVAC) meet your expectations?
O Exceeded O Yes O No
Did the quality of process equipment/layout meet your expectations? O Exceeded O Yes O No

104
SECTION VI: PROJECT TEAM CHARACTERISTICS
Mark the appropriate oval for each of the following attributes of your project team:
Project team selection: O Open Bidding O Negotiated Contract
O Prequalified Bidding O Contract Documents
Ability to restrain contractor pool: O High
Was there a pool of qualified contractors? O Yes
O Low
O No
What percentage of design was complete when the construction entity joined the project team? %.
Individual experience of members with similar facilities: Owner's Representative O Excellent O Limited Design-Builder O Excellent O Limited Architect/Designer O Excellent O Limited Contractor O Excellent O Limited Subcontractors O Excellent O Limited
Individual experience of members using your project's delivery system: Owner's Representative O Excellent O Limited Design-Builder O Excellent O Limited Architect/Designer O Excellent O Limited Contractor O Excellent O Limited Subcontractors O Excellent O Limited
Team's prior experience as a unit: O Excellent O Limited
Project team communication: O Excellent O Limited
Project team chemistry: O Excellent O Adequate O Poor
Owner type: O Public O Private
Owner-project team relationship: O First Time O Partnering O Repeat
Owner representative's capability: O Excellent O Adequate O Poor
Owner's ability to define scope: O Excellent O Adequate O Poor
Owner's ability to make decisions:O Excellent O Adequate O Poor
Project complexity: O High O Average O Low
Regulatory/legal constraints: O Many O Few O None
Onerous contract clauses: O Numerous O Several O None
Labor type: Union % Non Union %
Contractor's work split: Direct Hire % Subcontracted %
O None o None o None o None o None
ten O
1:
None o None o None o None o None
o None
o None

105
SECTION VII: PROJECT DATA
For the following items please mark the appropriate oval in each category to identify the appropriate systems and/or descriptors that apply to your project:
FOUNDATION: O Slab on grade with spread footings O Mat foundation O Caissons, piles or slurry walls O Other:
STRUCTURE: O Pre-engineered metal building O Bar joists or precast planks on bearing walls O Steel frame and metal deck O Precast concrete frame and decks O Cast-in-place concrete structure O Complex geometry/mixed framing types O Other:
ARCHITECTURAL INTERIOR FINISHES: O Minimal (eg. warehouse, factory) O O Corporate office O O Monumental building finishes (e.g. marble) O Other:
Standard commercial office Clean room environment
EXTERIOR ENCLOSURE: O All glass curtain wall O CMU, brick, or stone O Cast-in-place exterior walls
ROOFING: O Asphalt shingle O Built-up /single-ply membrane O Other:
HEATING/COOLTNCi:
O Metal panels O Precast panels O Other:
O Steep roof with tile/slate O Architectural standing seam
O Roof top units O Central plant O Split system O Heating only O Cooling only O Ventilation only O Other:
ELECTRICAL: O Uninteruptable power supply o Electric heat O General lighting and computer use o Intensive computer use O Process equipment loads o Security system
CONTROLS: O Direct digital controls o Pneumatic controls O Other:
SHE: O Urban O Suburban o Rural O Existing utilities O Existing roads o Mass excavation O Other:

106
SECTION VIII: PROJECT SUCCESS CRITERIA
Please list the criteria your organization uses to measure success and then mark the appropriate oval to rank each as it applied to your project:
1.
3.
4.
5.
0 Excellent O Average O Poor
o Excellent O Average O Poor
0 Excellent 0 Average o Poor
o Excellent o Average o Poor
O Excellent O Average O Poor
Mark the appropriate oval to rate the overall success of the project: O Excellent O Average O Poor
SECTION IX: LESSONS LEARNED
If the answers to any of the following are yes, please list examples or reasons in the space below each question.
List any lessons you learned on this project about the project delivery system:
Could this project have been better delivered or more successful? How?
Did the delivery system enhance or hinder your ability to perform? How?
Did the project meet the intended needs?
Describe any unique features about this building that influenced its cost, schedule, or quality.

107
APPENDIX B
SUMMARY STATISTICS - PHASE ONE: ORIGINAL CII STUDY DATA

108
The legend provided below applies to each of the tables presented in this appendix.
Legend:
N Sample size based on number of projects St.Dev. Standard deviation of the mean data variation
Ql First quartile, lower limit of the middle 50 percent of data Q3 Third quartile, upper limit of the middle 50 percent of data * Insufficient data due to sample size less than 2 projects

109
Metric Owner Type
N Mean StDev Median Ql Q3
Unit Cost Private 134 131.70 378.90 70.50 48.70 133.20 Public 54 225.10 223.50 118.00 61.20 187.70 Federal 85 133.36 64.32 128.00 97.50 163.50
Cost Growth Private 134 4.60 13.64 1.92 -0.04 9.09 Public 54 7.93 11.50 4.30 0.55 11.26
Federal 85 7.32 10.24 4.80 2.09 ' 11.27
Schedule Growth Private 134 5.52 17.57 0.00 0.00 11.63 Public 54 6.28 15.87 3.51 0.00 10.20 Federal 85 5.72 19.76 2.61 -1.50 12.63
Construction Speed Private 134 15887 18487 10081 2980 21512 Public 54 13147 17300 7466 2937 16000 Federal 85 9235 11937 4557 2002 11566
Delivery Speed Private 134 11997 14847 7630 1946 16456 Public 54 9904 15594 4120 1198 10148
Federal 85 6417 8063 3617 1156 8376 Turnover Quality Private 121 22.27 7.39 20.00 15.00 30.00 (Maximum = 30, Public 49 20.61 7.68 25.00 15.00 27.50 Minimum = 0) Federal 85 19.41 7.00 15.00 15.00 25.00 Systems Quality Private 122 17.05 6.95 15.00 15.00 20.00 (Maximum = 30, Public 50 14.80 5.15 15.00 15.00 15.00 Minimum = 0) Federal 85 15.24 5.82 15.00 15.00 15.00 Process Equipment Private 91 5.60 2.22 5.00 5.00 5.00
(Maximum = 10, Public 28 5.18 2.14 5.00 5.00 5.00 Minimum = 0) Federal 60 5.25 1.94 5.00 5.00 5.00
Table B. 1: Summary statistics by project owner type.
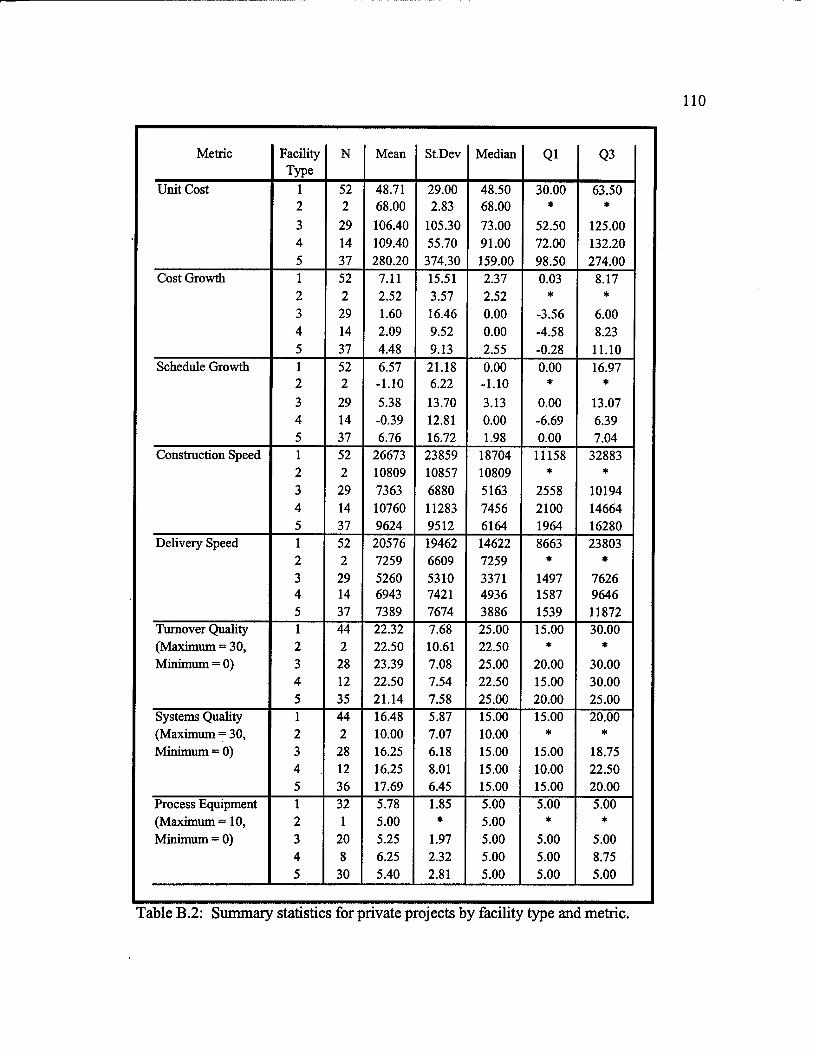
110
Metric Facility Type
N Mean StDev Median Ql Q3
Unit Cost 1 52 48.71 29.00 48.50 30.00 63.50 2 2 68.00 2.83 68.00 * *
3 29 106.40 105.30 73.00 52.50 125.00 4 14 109.40 55.70 91.00 72.00 132.20 5 37 280.20 374.30 159.00 98.50 274.00
Cost Growth 1 52 7.11 15.51 2.37 0.03 8.17 2 2 2.52 3.57 2.52 * *
3 29 1.60 16.46 0.00 -3.56 6.00 4 14 2.09 9.52 0.00 -4.58 8.23 5 37 4.48 9.13 2.55 -0.28 11.10
Schedule Growth 1 52 6.57 21.18 0.00 0.00 16.97 2 2 -1.10 6.22 -1.10 * *
3 29 5.38 13.70 3.13 0.00 13.07 4 14 -0.39 12.81 0.00 -6.69 6.39 5 37 6.76 16.72 1.98 0.00 7.04
Construction Speed 1 52 26673 23859 18704 11158 32883 2 2 10809 10857 10809 * *
3 29 7363 6880 5163 2558 10194 4 14 10760 11283 7456 2100 14664 5 37 9624 9512 6164 1964 16280
Delivery Speed 1 52 20576 19462 14622 8663 23803 2 2 7259 6609 7259 He *
3 29 5260 5310 3371 1497 7626 4 14 6943 7421 4936 1587 9646 5 37 7389 7674 3886 1539 11872
Turnover Quality 1 44 22.32 7.68 25.00 15.00 30.00 (Maximum = 30, 2 2 22.50 10.61 22.50 * *
Minimum = 0) 3 28 23.39 7.08 25.00 20.00 30.00 4 12 22.50 7.54 22.50 15.00 30.00 5 35 21.14 7.58 25.00 20.00 25.00
Systems Quality 1 44 16.48 5.87 15.00 15.00 20.00 (Maximum = 30, 2 2 10.00 7.07 10.00 * *
Minimum = 0) 3 28 16.25 6.18 15.00 15.00 18.75 4 12 16.25 8.01 15.00 10.00 22.50 5 36 17.69 6.45 15.00 15.00 20.00
Process Equipment 1 32 5.78 1.85 5.00 5.00 5.00 (Maximum = 10, 2 1 5.00 * 5.00 »i *
Minimum = 0) 3 20 5.25 1.97 5.00 5.00 5.00 4 8 6.25 2.32 5.00 5.00 8.75 5 30 5.40 2.81 5.00 5.00 5.00
Table B.2: Summary statistics for private projects by facility type and metric.
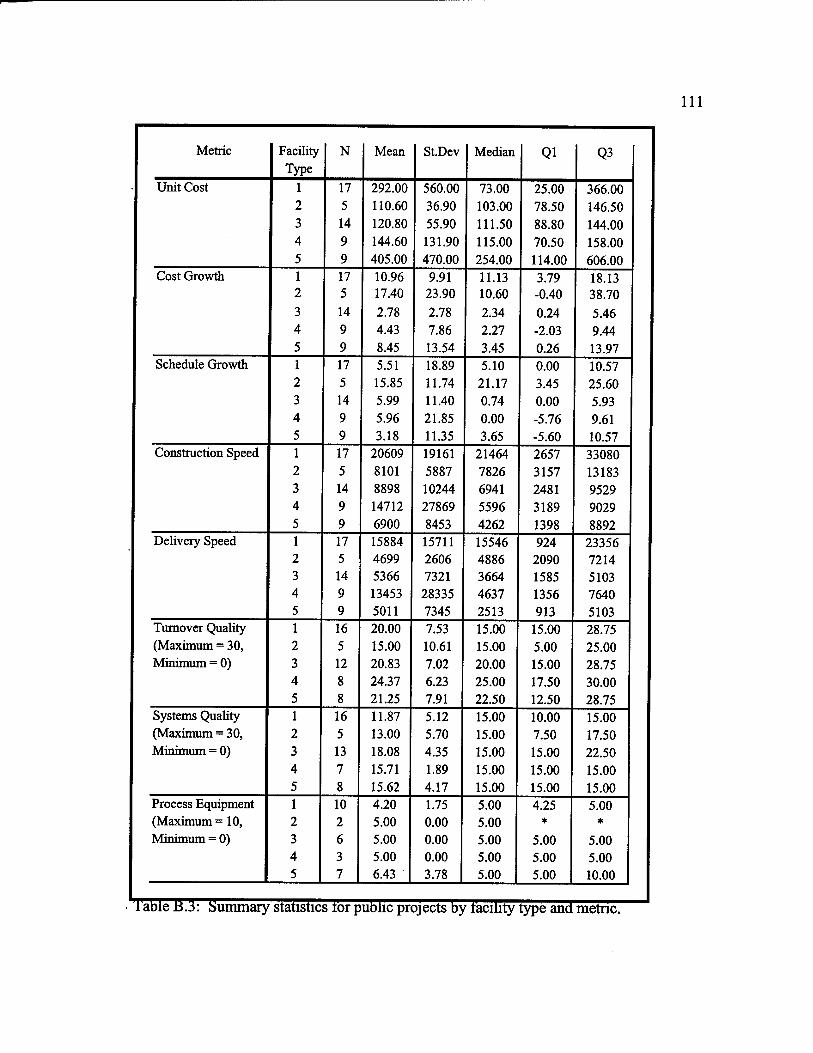
Ill
Metric Facility Type
N Mean StDev Median Ql Q3
Unit Cost 1 17 292.00 560.00 73.00 25.00 366.00 2 5 110.60 36.90 103.00 78.50 146.50 3 14 120.80 55.90 111.50 88.80 144.00 4 9 144.60 131.90 115.00 70.50 158.00 5 9 405.00 470.00 254.00 114.00 606.00
Cost Growth 1 17 10.96 9.91 11.13 3.79 18.13 2 5 17.40 23.90 10.60 -0.40 38.70 3 14 2.78 2.78 2.34 0.24 5.46 4 9 4.43 7.86 2.27 -2.03 9.44 5 9 8.45 13.54 3.45 0.26 13.97
Schedule Growth 1 17 5.51 18.89 5.10 0.00 10.57 2 5 15.85 11.74 21.17 3.45 25.60 3 14 5.99 11.40 0.74 0.00 5.93 4 9 5.96 21.85 0.00 -5.76 9.61 5 9 3.18 11.35 3.65 -5.60 10.57
Construction Speed 1 17 20609 19161 21464 2657 33080 2 5 8101 5887 7826 3157 13183 3 14 8898 10244 6941 2481 9529 4 9 14712 27869 5596 3189 9029 5 9 6900 8453 4262 1398 8892
Delivery Speed 1 17 15884 15711 15546 924 23356 2 5 4699 2606 4886 2090 7214 3 14 5366 7321 3664 1585 5103 4 9 13453 28335 4637 1356 7640 5 9 5011 7345 2513 913 5103
Turnover Quality 1 16 20.00 7.53 15.00 15.00 28.75 (Maximum = 30, 2 5 15.00 10.61 15.00 5.00 25.00 Minimum = 0) 3 12 20.83 7.02 20.00 15.00 28.75
4 8 24.37 6.23 25.00 17.50 30.00 5 8 21.25 7.91 22.50 12.50 28.75
Systems Quality 1 16 11.87 5.12 15.00 10.00 15.00 (Maximum = 30, 2 5 13.00 5.70 15.00 7.50 17.50 Minimum = 0) 3 13 18.08 4.35 15.00 15.00 22.50
4 7 15.71 1.89 15.00 15.00 15.00 5 8 15.62 4.17 15.00 15.00 15.00
Process Equipment 1 10 4.20 1.75 5.00 4.25 5.00 (Maximum = 10, 2 2 5.00 0.00 5.00 * *
Minimum = 0) 3 6 5.00 0.00 5.00 5.00 5.00 4 3 5.00 0.00 5.00 5.00 5.00 5 7 6.43 3.78 5.00 5.00 10.00
1 able B.3: Summary statistics lor public projects by iacility type and metric.
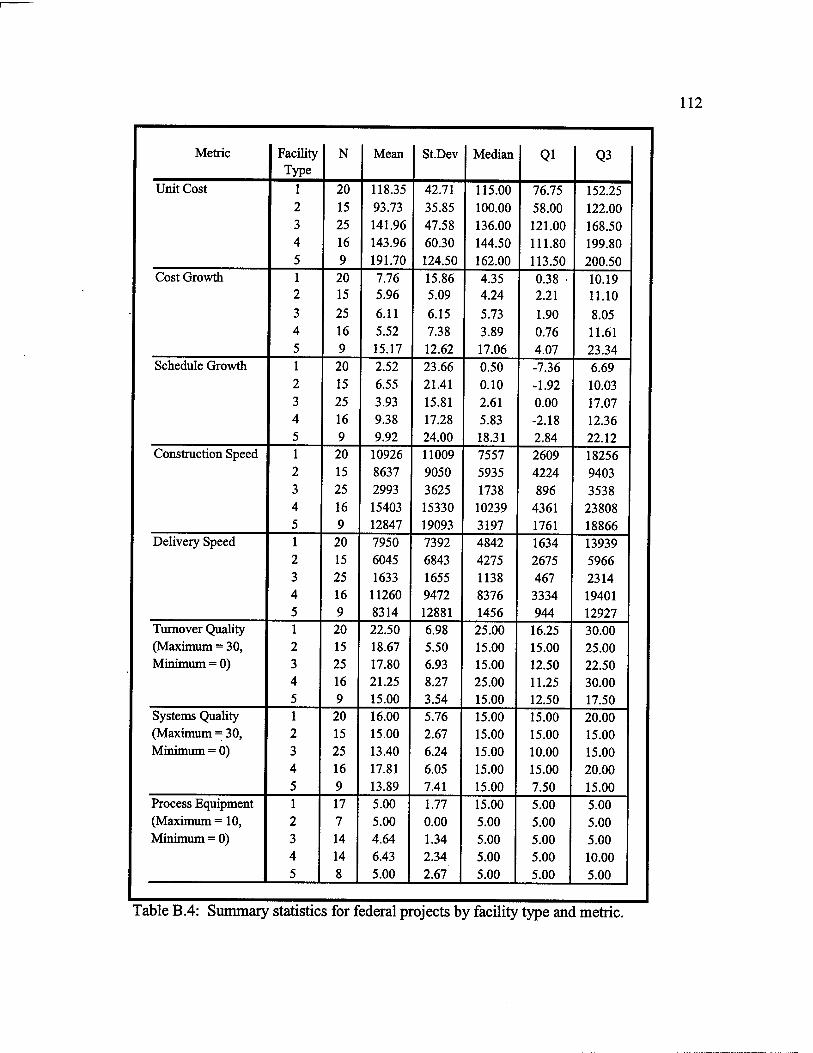
112
Metric Facility Type
N Mean StDev Median Ql Q3
Unit Cost 1 20 118.35 42.71 115.00 76.75 152.25 2 15 93.73 35.85 100.00 58.00 122.00 3 25 141.96 47.58 136.00 121.00 168.50 4 16 143.96 60.30 144.50 111.80 199.80 5 9 191.70 124.50 162.00 113.50 200.50
Cost Growth 1 20 7.76 15.86 4.35 0.38 ■ 10.19 2 15 5.96 5.09 4.24 2.21 11.10 3 25 6.11 6.15 5.73 1.90 8.05 4 16 5.52 7.38 3.89 0.76 11.61 5 9 15.17 12.62 17.06 4.07 23.34
Schedule Growth 1 20 2.52 23.66 0.50 -7.36 6.69 2 15 6.55 21.41 0.10 -1.92 10.03 3 25 3.93 15.81 2.61 0.00 17.07 4 16 9.38 17.28 5.83 -2.18 12.36 5 9 9.92 24.00 18.31 2.84 22.12
Construction Speed 1 20 10926 11009 7557 2609 18256 2 15 8637 9050 5935 4224 9403 3 25 2993 3625 1738 896 3538 4 16 15403 15330 10239 4361 23808 5 9 12847 19093 3197 1761 18866
Delivery Speed 1 20 7950 7392 4842 1634 13939 2 15 6045 6843 4275 2675 5966 3 25 1633 1655 1138 467 2314 4 16 11260 9472 8376 3334 19401 5 9 8314 12881 1456 944 12927
Turnover Quality 1 20 22.50 6.98 25.00 16.25 30.00 (Maximum = 30, 2 15 18.67 5.50 15.00 15.00 25.00 Minimum = 0) 3 25 17.80 6.93 15.00 12.50 22.50
4 16 21.25 8.27 25.00 11.25 30.00 5 9 15.00 3.54 15.00 12.50 17.50
Systems Quality 1 20 16.00 5.76 15.00 15.00 20.00 (Maximum = 30, 2 15 15.00 2.67 15.00 15.00 15.00 Minimum = 0) 3 25 13.40 6.24 15.00 10.00 15.00
4 16 17.81 6.05 15.00 15.00 20.00 5 9 13.89 7.41 15.00 7.50 15.00
Process Equipment 1 17 5.00 1.77 15.00 5.00 5.00 (Maximum = 10, 2 7 5.00 0.00 5.00 5.00 5.00 Minimum = 0) 3 14 4.64 1.34 5.00 5.00 5.00
4 14 6.43 2.34 5.00 5.00 10.00 5 8 5.00 2.67 5.00 5.00 5.00
Table B.4: Summary statistics for federal projects by facility type and metric.

113
APPENDIX C
SUMMARY STATISTICS - PHASE TWO: NEW FEDERAL DATA
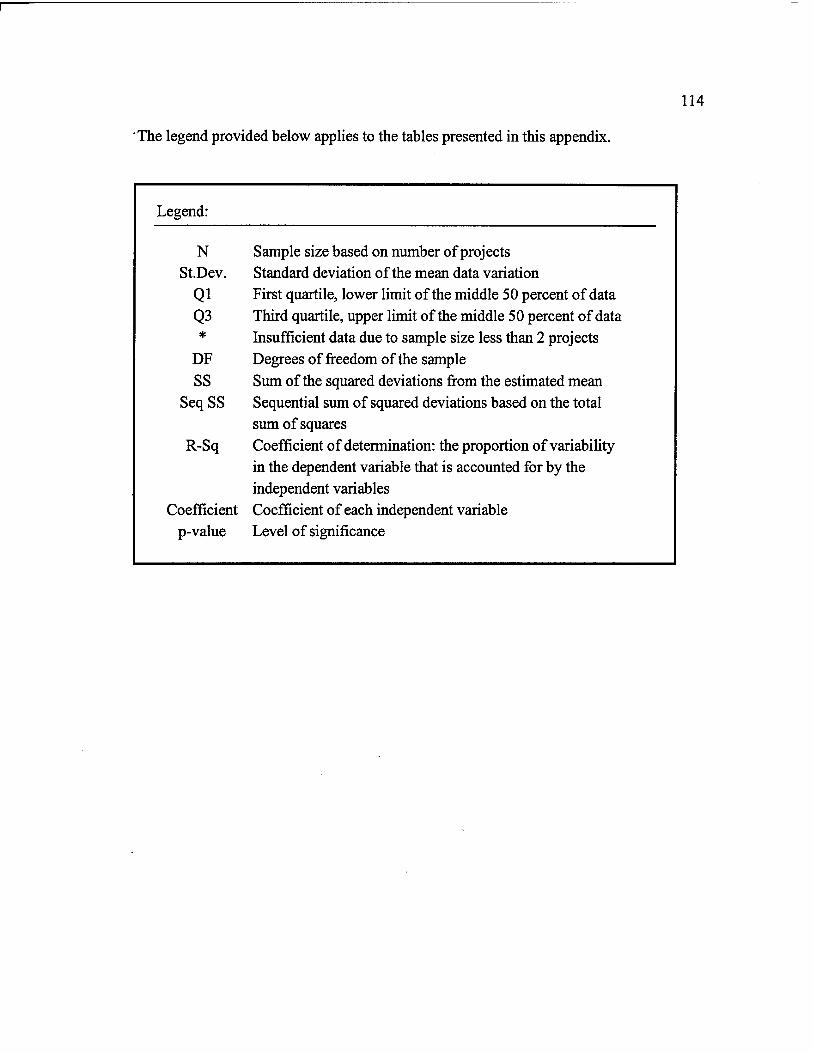
114
The legend provided below applies to the tables presented in this appendix.
Legend:
N Sample size based on number of projects StDev. Standard deviation of the mean data variation
Qi First quartile, lower limit of the middle 50 percent of data Q3 Third quartile, upper limit of the middle 50 percent of data * Insufficient data due to sample size less than 2 projects
DF Degrees of freedom of the sample SS Sum of the squared deviations from the estimated mean
SeqSS Sequential sum of squared deviations based on the total sum of squares
R-Sq Coefficient of determination: the proportion of variability in the dependent variable that is accounted for by the independent variables
Coefficient Coefficient of each independent variable p-value Level of significance
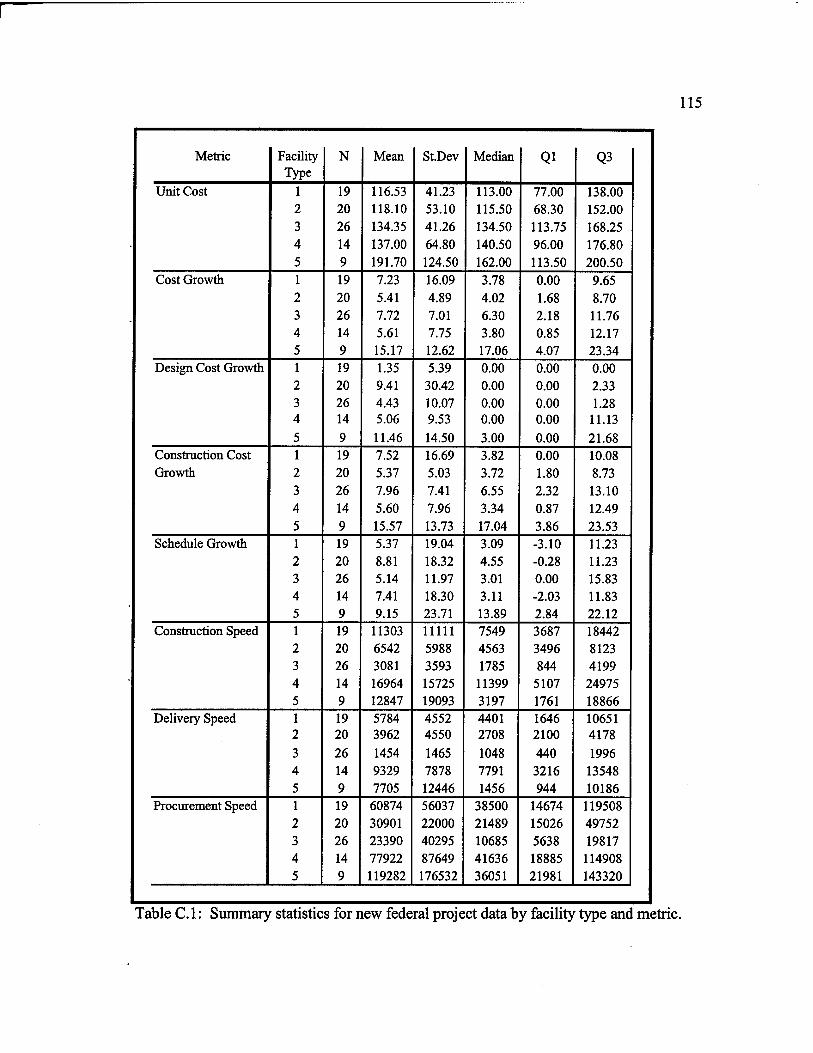
115
Metric Facility Type
N Mean StDev Median Ql Q3
Unit Cost 1 19 116.53 41.23 113.00 77.00 138.00 2 20 118.10 53.10 115.50 68.30 152.00 3 26 134.35 41.26 134.50 113.75 168.25 4 14 137.00 64.80 140.50 96.00 176.80 5 9 191.70 124.50 162.00 113.50 200.50
Cost Growth 1 19 7.23 16.09 3.78 0.00 9.65 2 20 5.41 4.89 4.02 1.68 8.70 3 26 7.72 7.01 6.30 2.18 11.76 4 14 5.61 7.75 3.80 0.85 12.17 5 9 15.17 12.62 17.06 4.07 23.34
Design Cost Growth 1 19 1.35 5.39 0.00 0.00 0.00 2 20 9.41 30.42 0.00 0.00 2.33 3 26 4.43 10.07 0.00 0.00 1.28 4 14 5.06 9.53 0.00 0.00 11.13 5 9 11.46 14.50 3.00 0.00 21.68
Construction Cost 1 19 7.52 16.69 3.82 0.00 10.08 Growth 2 20 5.37 5.03 3.72 1.80 8.73
3 26 7.96 7.41 6.55 2.32 13.10 4 14 5.60 7.96 3.34 0.87 12.49 5 9 15.57 13.73 17.04 3.86 23.53
Schedule Growth 1 19 5.37 19.04 3.09 -3.10 11.23 2 20 8.81 18.32 4.55 -0.28 11.23 3 26 5.14 11.97 3.01 0.00 15.83 4 14 7.41 18.30 3.11 -2.03 11.83 5 9 9.15 23.71 13.89 2.84 22.12
Construction Speed 1 19 11303 11111 7549 3687 18442 2 20 6542 5988 4563 3496 8123 3 26 3081 3593 1785 844 4199 4 14 16964 15725 11399 5107 24975 5 9 12847 19093 3197 1761 18866
Delivery Speed 1 19 5784 4552 4401 1646 10651 2 20 3962 4550 2708 2100 4178 3 26 1454 1465 1048 440 1996 4 14 9329 7878 7791 3216 13548 5 9 7705 12446 1456 944 10186
Procurement Speed 1 19 60874 56037 38500 14674 119508 2 20 30901 22000 21489 15026 49752 3 26 23390 40295 10685 5638 19817 4 14 77922 87649 41636 18885 114908 5 9 119282 176532 36051 21981 143320
Table C. 1: Summary statistics for new federal project data by facility type and metric.

116
Metric Facility Type
N Mean St.Dev Median Ql Q3
Start-up 1 19 2.53 0.61 3.00 2.00 3.00 (Maximum = 3, 2 20 2.30 0.66 2.00 2.00 3.00 Minimum = 0) 3 26 2.39 0.64 2.00 2.00 3.00
4 14 2.50 0.65 3.00 2.00 3.00 5 9 1.56 0.53 2.00 1.00 2.00
Call-backs 1 19 2.47 0.61 3.00 2.00 3.00 (Maximum = 3, 2 20 2.35 0.59 2.00 2.00 3.00 Minimum = 0) 3 26 2.15 0.68 2.00 2.00 3.00
4 13 2.54 0.07 3.00 2.00 3.00 5 9 2.00 0.71 2.00 1.50 2.50
Operation/ 1 16 2.50 0.52 2.50 2.00 3.00 Maintenance 2 19 2.32 0.58 2.00 2.00 3.00 (Maximum = 3, 3 25 2.20 0.50 2.00 2.00 2.50 Minimum = 0) 4 14 2.21 0.80 2.00 1.75 3.00
5 9 2.00 0.00 2.00 2.00 2.00 Envelope/Roof/ 1 19 2.11 0.46 2.00 2.00 2.00 Structure/ 2 20 1.90 0.31 2.00 2.00 2.00 Foundation 3 25 1.92 0.49 2.00 2.00 2.00 (Maximum = 3, 4 13 2.30 0.63 2.00 2.00 3.00 Minimum = 0) 5 9 1.78 0.67 2.00 1.00 2.00 Interior Space & 1 19 2.00 0.47 2.00 2.00 2.00 Layout 2 20 2.10 0.45 2.00 2.00 2.00 (Maximum = 3, 3 26 1.92 0.63 2.00 1.75 2.00 Minimum = 0) 4 14 2.21 0.58 2.00 2.00 3.00
5 9 2.11 0.33 2.00 2.00 2.00 Environmental 1 19 2.00 0.47 2.00 2.00 2.00 Systems 2 20 1.95 0.39 2.00 2.00 2.00 (Maximum = 3, 3 26 1.85 0.54 2.00 1.75 2.00 Minimum = 0) 4 14 2.29 0.47 2.00 2.00 3.00
5 9 1.78 0.44 2.00 1.50 2.00 Process Equipment 1 17 2.00 0.35 2.00 2.00 2.00 & Layout 2 7 2.14 0.38 2.00 2.00 2.00 (Maximum = 3, 3 11 1.91 0.30 2.00 2.00 2.00 Minimum = 0) 4 12 2.25 0.45 2.00 2.00 2.75
5 8 2.00 0.54 2.00 2.00 2.00
Table C.l (cont): Summary statistics for new federal project data by facility type and metric.
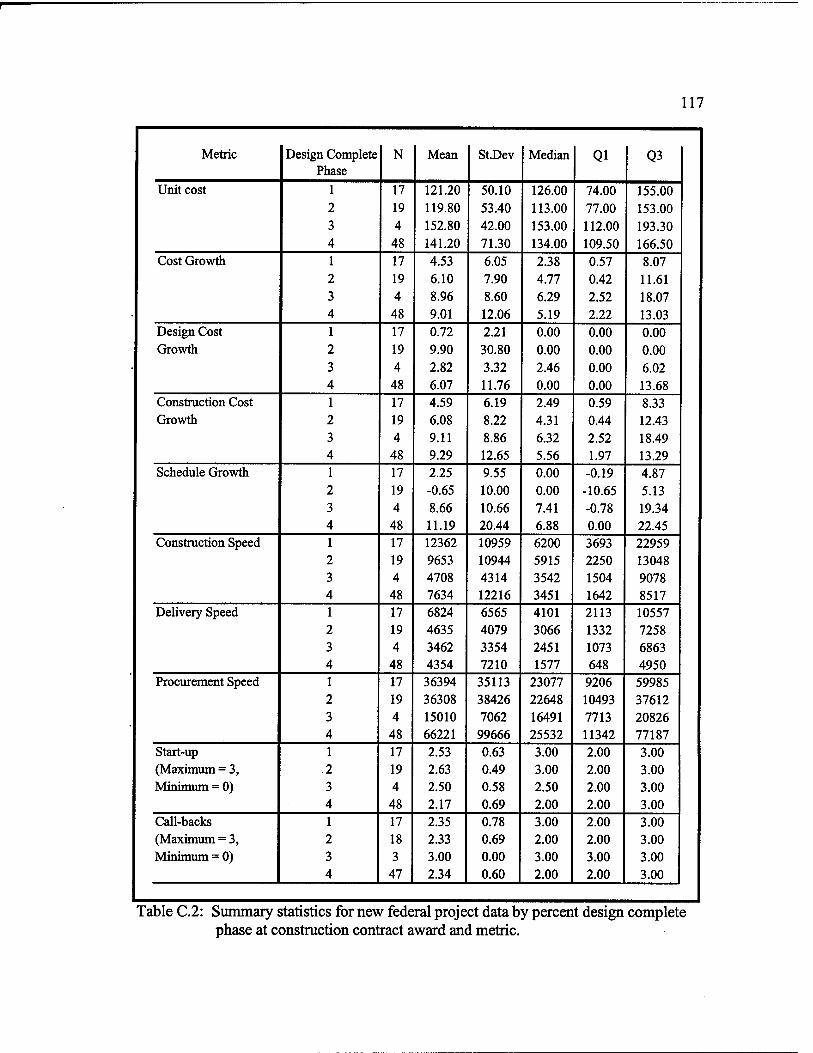
117
Metric Design Complete Phase
N Mean StDev Median Ql Q3
Unit cost 1 17 121.20 50.10 126.00 74.00 155.00 2 19 119.80 53.40 113.00 77.00 153.00 3 4 152.80 42.00 153.00 112.00 193.30 4 48 141.20 71.30 134.00 109.50 166.50
Cost Growth 1 17 4.53 6.05 2.38 0.57 8.07 2 19 6.10 7.90 4.77 0.42 11.61 3 4 8.96 8.60 6.29 2.52 18.07 4 48 9.01 12.06 5.19 2.22 13.03
Design Cost 1 17 0.72 2.21 0.00 0.00 0.00 Growth 2 19 9.90 30.80 0.00 0.00 0.00
3 4 2.82 3.32 2.46 0.00 6.02 4 48 6.07 11.76 0.00 0.00 13.68
Construction Cost 1 17 4.59 6.19 2.49 0.59 8.33 Growth 2 19 6.08 8.22 4.31 0.44 12.43
3 4 9.11 8.86 6.32 2.52 18.49 4 48 9.29 12.65 5.56 1.97 13.29
Schedule Growth 1 17 2.25 9.55 0.00 -0.19 4.87 2 19 -0.65 10.00 0.00 -10.65 5.13 3 4 8.66 10.66 7.41 -0.78 19.34 4 48 11.19 20.44 6.88 0.00 22.45
Construction Speed 1 17 12362 10959 6200 3693 22959 2 19 9653 10944 5915 2250 13048 3 4 4708 4314 3542 1504 9078 4 48 7634 12216 3451 1642 8517
Delivery Speed 1 17 6824 6565 4101 2113 10557 2 19 4635 4079 3066 1332 7258 3 4 3462 3354 2451 1073 6863 4 48 4354 7210 1577 648 4950
Procurement Speed 1 17 36394 35113 23077 9206 59985 2 19 36308 38426 22648 10493 37612 3 4 15010 7062 16491 7713 20826 4 48 66221 99666 25532 11342 77187
Start-up 1 17 2.53 0.63 3.00 2.00 3.00 (Maximum = 3, 2 19 2.63 0.49 3.00 2.00 3.00 Minimum = 0) 3 4 2.50 0.58 2.50 2.00 3.00
4 48 2.17 0.69 2.00 2.00 3.00 Call-backs 1 17 2.35 0.78 3.00 2.00 3.00 (Maximum = 3, 2 18 2.33 0.69 2.00 2.00 3.00 Minimum = 0) 3 3 3.00 0.00 3.00 3.00 3.00
4 47 2.34 0.60 2.00 2.00 3.00
Table C.2: Summary statistics for new federal project data by percent design complete phase at construction contract award and metric.
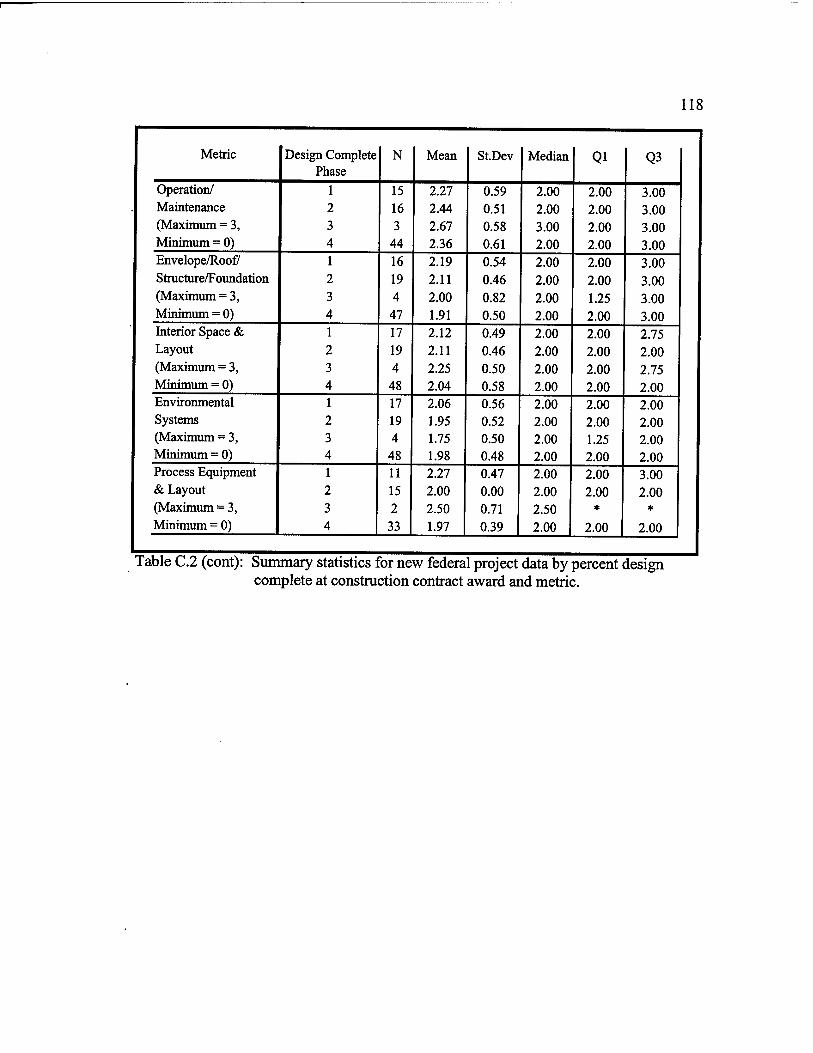
118
Metric Design Complete Phase
N Mean StDev Median Ql Q3
Operation/ 1 15 2.27 0.59 2.00 2.00 3.00 Maintenance 2 16 2.44 0.51 2.00 2.00 3.00 (Maximum = 3, 3 3 2.67 0.58 3.00 2.00 3.00 Minimum = 0) 4 44 2.36 0.61 2.00 2.00 3.00 Envelope/Roof/ 1 16 2.19 0.54 2.00 2.00 3.00 Structure/Foundation 2 19 2.11 0.46 2.00 2.00 3.00 (Maximum = 3, 3 4 2.00 0.82 2.00 1.25 3.00 Minimum = 0) 4 47 1.91 0.50 2.00 2.00 3.00 Interior Space & 1 17 2.12 0.49 2.00 2.00 2.75 Layout 2 19 2.11 0.46 2.00 2.00 2.00 (Maximum = 3, 3 4 2.25 0.50 2.00 2.00 2.75 Minimum = 0) 4 48 2.04 0.58 2.00 2.00 2.00 Environmental 1 17 2.06 0.56 2.00 2.00 2.00 Systems 2 19 1.95 0.52 2.00 2.00 2.00 (Maximum = 3, 3 4 1.75 0.50 2.00 1.25 2.00 Minimum = 0) 4 48 1.98 0.48 2.00 2.00 2.00 Process Equipment 1 11 2.27 0.47 2.00 2.00 3.00 & Layout 2 15 2.00 0.00 2.00 2.00 2.00 (Maximum = 3, 3 2 2.50 0.71 2.50 * *
Minimum = 0) 4 33 1.97 0.39 2.00 2.00 2.00
Table C.2 (cont): Summary statistics for new federal project data by percent design complete at construction contract award and metric.
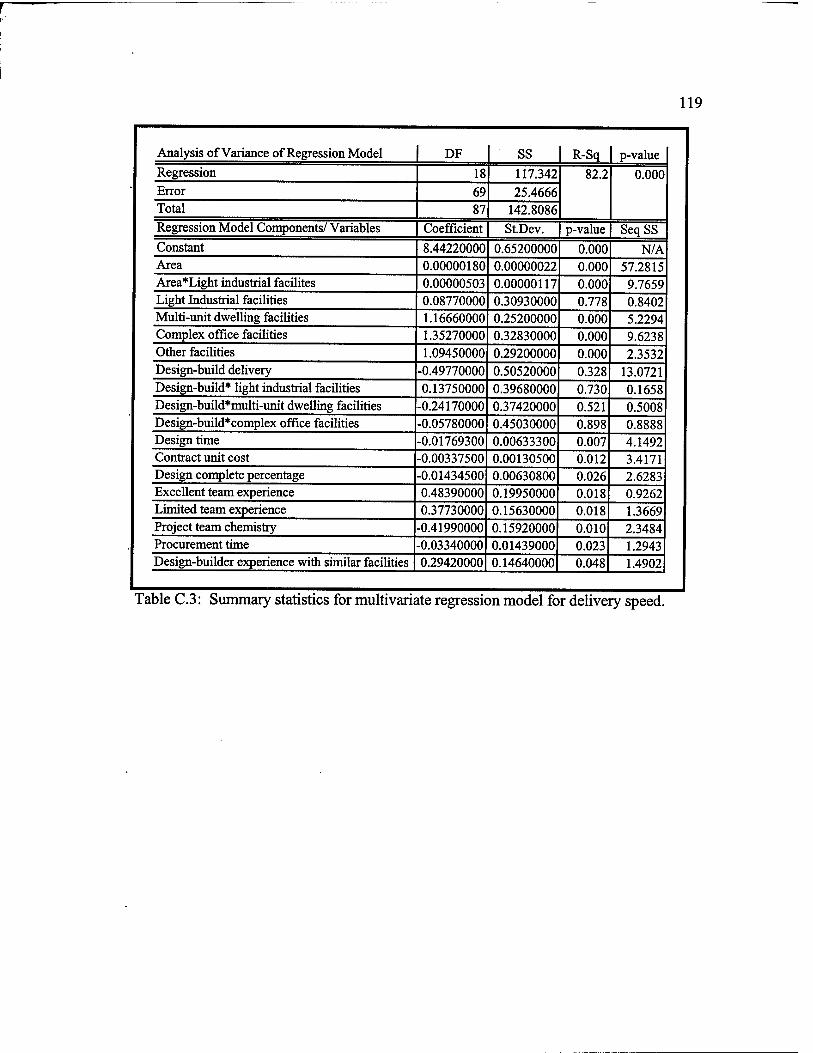
119
Analysis of Variance of Regression Model DF SS R-Sq p-value Regression 18 117.342 82.2 0.000 Error 69 25.4666 Total 87 142.8086 Regression Model Components/ Variables Coefficient StDev. p-value SeqSS Constant 8.44220000 0.65200000 0.000 N/A Area 0.00000180 0.00000022 0.000 57.2815 Area*Light industrial facilites 0.00000503 0.00000117 0.000 9.7659 Light Industrial facilities 0.08770000 0.30930000 0.778 0.8402 Multi-unit dwelling facilities 1.16660000 0.25200000 0.000 5.2294 Complex office facilities 1.35270000 0.32830000 0.000 9.6238 Other facilities 1.09450000 0.29200000 0.000 2.3532 Design-build delivery -0.49770000 0.50520000 0.328 13.0721 Design-build* light industrial facilities 0.13750000 0.39680000 0.730 0.1658 Design-build*multi-unit dwelling facilities -0.24170000 0.37420000 0.521 0.5008 Design-build*complex office facilities -0.05780000 0.45030000 0.898 0.8888 Design time -0.01769300 0.00633300 0.007 4.1492 Contract unit cost -0.00337500 0.00130500 0.012 3.4171 Design complete percentage -0.01434500 0.00630800 0.026 2.6283 Excellent team experience 0.48390000 0.19950000 0.018 0.9262 Limited team experience 0.37730000 0.15630000 0.018 1.3669 Project team chemistry -0.41990000 0.15920000 0.010 2.3484 Procurement time -0.03340000 0.01439000 0.023 1.2943 Design-builder experience with similar facilities 0.29420000 0.14640000 0.048 1.4902
Table C.3: Summary statistics for multivariate regression model for delivery speed.