a comparison of producer gas, biochar, and activated
TRANSCRIPT

Energies 2013, 6, 164-183; doi:10.3390/en6010164
energies ISSN 1996-1073
www.mdpi.com/journal/energies
Article
A Comparison of Producer Gas, Biochar, and Activated Carbon from Two Distributed Scale Thermochemical Conversion Systems Used to Process Forest Biomass
Nathaniel Anderson 1,*, J. Greg Jones 1, Deborah Page-Dumroese 2, Daniel McCollum 3,
Stephen Baker 4, Daniel Loeffler 5 and Woodam Chung 5
1 Rocky Mountain Research Station, USDA Forest Service, 200 East Broadway, Missoula,
MT 59807, USA; E-Mail: [email protected] 2 Rocky Mountain Research Station, USDA Forest Service, Moscow, ID 83843, USA;
E-Mail: [email protected] 3 Rocky Mountain Research Station, USDA Forest Service, Fort Collins, CO 80526, USA;
E-Mail: [email protected] 4 Missoula Fire Sciences Laboratory, USDA Forest Service, Missoula, MT 59808, USA;
E-Mail: [email protected] 5 College of Forestry and Conservation, University of Montana, Missoula, MT 59812, USA;
E-Mails: [email protected] (D.L.); [email protected] (W.C.)
* Author to whom correspondence should be addressed; E-Mail: [email protected];
Tel.: +1-406-329-3398; Fax: +1-406-329-3487.
Received: 18 September 2012; in revised form: 20 December 2012 / Accepted: 2 January 2013 /
Published: 8 January 2013
Abstract: Thermochemical biomass conversion systems have the potential to produce
heat, power, fuels and other products from forest biomass at distributed scales that meet the
needs of some forest industry facilities. However, many of these systems have not been
deployed in this sector and the products they produce from forest biomass have not been
adequately described or characterized with regards to chemical properties, possible uses,
and markets. This paper characterizes the producer gas, biochar, and activated carbon of a
700 kg h−1 prototype gasification system and a 225 kg h−1 pyrolysis system used to process
coniferous sawmill and forest residues. Producer gas from sawmill residues processed with
the gasifier had higher energy content than gas from forest residues, with averages of
12.4 MJ m−3 and 9.8 MJ m−3, respectively. Gases from the pyrolysis system averaged
1.3 MJ m−3 for mill residues and 2.5 MJ m−3 for forest residues. Biochars produced have
OPEN ACCESS
Energies 2013, 6 165
similar particle size distributions and bulk density, but vary in pH and carbon content.
Biochars from both systems were successfully activated using steam activation, with
resulting BET surface area in the range of commercial activated carbon. Results are
discussed in the context of co-locating these systems with forest industry operations.
Keywords: pyrolysis; gasification; biomass; biochar; activated carbon; synthesis gas
1. Introduction
1.1. Background
Sawmills and other wood products manufacturing facilities produce large quantities of woody
biomass in the form of wood chips, sawdust, shavings and bark. These mill residues are commonly
sold as raw material for the manufacture of paper and engineered wood panels (e.g., clean chips for
pulp and sawdust for particle board), for landscaping applications (e.g., bark mulch), and as fuel for
combustion boilers (e.g., hog fuel). The forest sector also produces millions of tons of woody biomass
as a byproduct of silvicultural treatments prescribed to harvest timber, manage fire risk, improve forest
health, and meet other management objectives. These forest residues include foliage, tops, limbs,
unmerchantable roundwood, and stumps, which are frequently burned on site to reduce the risk of
wildfires and clear growing space for regeneration. Both mill residues and forest residues are
commonly used as fuel in combustion boilers to produce process heat and power for forest industry
operations. More than 50% of all biomass energy in the United States is generated by the forest
industry to dispose of waste and provide heat and electricity for manufacturing operations [1]. In some
areas, forest biomass is also used to fuel large power plants and distributed heat and power
systems [2,3].
Over the last twenty years, a complex interaction of social, political and economic factors has
resulted in permanent mill closures in the interior western United States. Declining industry capacity
has reduced the demand for forest biomass and increased average haul distances for timber and
biomass producers in this region. For example, prior to its closure in December, 2009, the
Smurfit-Stone liner board plant in Missoula, MT, used approximately 1.5 million tons of biomass
annually, including wood for both pulp and energy [4]. Since the closure, one-way haul distances for
mill and forest residues in western Montana have increased from 70 miles or less to 130 to 210 miles,
depending on the end user. In general, high transportation costs and weak regional demand for forest
biomass negatively impact the financial viability of wood products manufacturing and silvicultural
treatments by turning previously marketable byproducts into waste materials with disposal costs.
Furthermore, the most widely practiced method of disposal, open burning, can have negative
environmental impacts including increased air pollution, establishment of invasive species, and
reduced nutrient capital and soil productivity at burn sites [5,6].
Recent technical advances and public policies related to greenhouse gas emissions and energy
security have spurred interest in using thermochemical conversion technologies to process forest
biomass closer to harvest sites to improve transportation efficiency and produce renewable high-value
Energies 2013, 6 166
bioproducts that can be more efficiently shipped to distant markets [7]. Specifically, using heat to
convert biomass into dense, value-added fuel and chemical products has the potential to improve the
financial viability of biomass utilization in locations characterized by long haul distances and weak
demand for biomass from pulp mills and other large facilities. Depending on substitutability for
existing products, biofuels and bioproducts may also offset fossil fuel use and associated emissions
with renewable forest resources, possibly at scales that are well-matched to small and medium
sized operations.
In contrast to large-scale centralized facilities that require hundreds of thousands of tonnes of
biomass per year, many of the advanced thermochemical technologies currently being developed are
targeted at smaller-scale demand for distributed heat and power, biofuels and bioproducts production,
and waste processing [8]. In delineating alternative scales of these systems, it is useful to think of
distributed scale systems as small, compact, and clean units located at or near an end user of heat and
power [9]. Several companies manufacture distributed thermochemical conversion systems, and some
have marketed these systems for forest biomass processing [10,11]. Unlike centralized facilities that
procure large volumes of biomass from many suppliers across a large geographic area, distributed
systems have the potential to allow individual firms to match their byproduct and residues streams with
appropriate conversion capacity to produce heat, power, and marketable products from biomass.
1.2. Objectives
It is possible to convert forest biomass into heat, producer gas, biochar, and bio-oil at distributed
scales using pyrolysis and gasification technology. A large body of research is devoted to laboratory
and pilot scale study of pyrolysis and gasification of woody biomass [12–14] and an increasing number
of companies are developing and marketing commercial technologies for biomass conversion.
However, there are gaps in our understanding of how these technologies differ with regards to outputs
and how these systems might be integrated into existing forest products supply chains. Many of these
systems have not been deployed in this sector and the products they produce from forest biomass have
not been adequately described or characterized with regards to chemical properties, possible uses, and
markets. Uncertainty about product quality and potential value represents risk to investment and
presents a significant barrier to the adoption of these technologies by private companies.
The objective of this study is to compare two commercially available technologies with regards to
the physical and chemical properties of their outputs and associated market products in the context of
co-locating these systems with forest industry operations. Specifically, we: (1) use a gasifier and a
pyrolysis system to process coniferous mill and forest residues, (2) characterize the gas and biochar
produced by each, and (3) evaluate potential uses for those outputs, including the use of biochar as a
precursor in the production of activated carbon (AC). This critical new knowledge is needed by
technology firms, investors, and managers to evaluate potential markets for pyrolysis and gasification
products and to assess the commercial potential and financial feasibility of distributed thermochemical
processing deployed in the forest sector. Our results can also be used to inform analysis of the
environmental costs and benefits of these products, including life cycle assessment (LCA).
Energies 2013, 6 167
1.3. Overview of Pyrolysis and Gasification Products
Thermochemical conversion can occur across broad ranges of temperature, pressure, heating rate,
oxidation conditions, and residence time. Generally, pyrolysis of biomass at 200 to 300 °C
(torrefaction) produces a devolatilized, hydrophobic high-carbon content product often referred to as
torrefied wood. Several characteristics of torrefied wood make it more efficient to transport and store
than raw biomass, including lower moisture content, higher energy density, hydrophobicity, resistance
to decay, and homogenous particle size distribution [15]. It is generally considered a fuel product
suitable for combustion applications, including cofiring with coal, but may also be used as a raw
material in some manufacturing processes, including gasification and liquid fuel production [16].
Pyrolysis of biomass at higher temperatures (300 to 700 °C) produces recalcitrant charcoal called
biochar, as well as volatile gases, a fraction of which may be condensed into liquid pyrolysis oil, also
called bio-oil. Biochar can be used in its raw form as a solid fuel, or used as a feedstock for the
production of other products, including chemicals, AC, and soil additives. Similarly, bio-oil can be
used in its raw form as liquid fuel. However, because of its high oxygen and water content and low
stability, bio-oil is generally considered a crude product to be used in the production of refined
(i.e., upgraded) biofuels and industrial chemicals, including liquid transportation fuels [12]. Pyrolysis
in this temperature range often produces residual tars which can be a useful output or an undesirable
byproduct, depending on production objectives [17].
Depending on the conditions of the reaction, specifically the composition and concentration of gas
injected into the system, gasification of biomass at temperatures greater than 700 °C produces more
gas (i.e., producer gas or synthesis gas) and less biochar than pyrolysis, along with some ash.
Depending on gas quality, gases from both pyrolysis and gasification have the potential to be used to
produce heat and power in an internal combustion or gas turbine engine. The producer gas from
gasification can be used to produce liquid fuels and chemicals, including methanol and hydrocarbon
fuels via catalytic conversion processes [18,19]. In addition to these outputs, if conversion is
co-located with wood products manufacturing, excess heat from the conversion process can be used for
heating buildings, drying lumber and heat-treating products for export. The two systems evaluated in
this study operate at the upper end of the temperature spectrum and produce biochar and gas, but no
liquid products.
2. Methods
2.1. Biomass Feedstock
We processed mill and forest residues from Tricon Timber, LLC, Saint Regis, MT, USA. The mill
residues were a byproduct of manufacturing lumber from delimbed, debarked logs, and contained
negligible bark and foliage. In contrast, forest residues were produced from field-dried logging slash
and included both bark and foliage. Both feedstocks were mixed coniferous species dominated by
Douglas-fir (Pseudotsuga menziesii) and lodgepole pine (Pinus contorta). Both feedstocks were
chipped and screened to meet particle size specifications of 0.76 cm to 1.27 cm with less than 5% size
over run, and then dried in a kiln to a moisture content of 10% or less before shipping. Prepared
feedstocks were shipped to study sites in Colorado and North Carolina in 55 gallon drums that were
Energies 2013, 6 168
closed but not airtight. Feedstocks in Colorado did not receive additional kiln drying, but feedstocks in
North Carolina received 12 h of additional drying in two portable kilns due to concerns that ambient
humidity might increase the moisture content above 10%. The moisture content of the feedstocks at the
time of conversion ranged from 5.7% to 8.2% (Table 1). At 98.2% organic matter (OM), the mill
residues had higher OM content than forest residues, which were 91.5% OM (Table 1). Compared to
feedstocks from debarked logs, feedstocks containing bark and foliage generally have higher ash
content associated with inherent inorganic compounds in the cambium and contamination from soil
during harvest and transport [20]. The content of carbon, nitrogen and selected extractable alkaline
metals in these feedstocks are shown in Table 1.
Table 1. Feedstock characteristics.
Feedstock System Moisture
(%) b
Organic
matter (%)
Mean C
(%)
Mean N
(%)
Total extractable cations (mg kg−1) a
Ca Mg K
Mill residues TEA 8.17 98.19 47.4 0.1566 1250.0 146.5 577.5
Mill residues BSI 7.04 c 47.4 0.2062 1919.6 296.4 781.0
Forest residues TEA 5.71 91.51 45.8 0.2904 1299.6 396.3 898.4
Forest residues BSI 7.25 c 48.4 0.2124 2405.8 290.5 1097.6 a Units of mg kg−1 are equivalent to parts per million (ppm); b Moisture content at the time of conversion. All feedstocks
were kiln dried to less than 10% before shipping. Feedstocks for the TEA system received an additional 12 h of kiln
drying before conversion; c Unknown.
2.2. Conversion
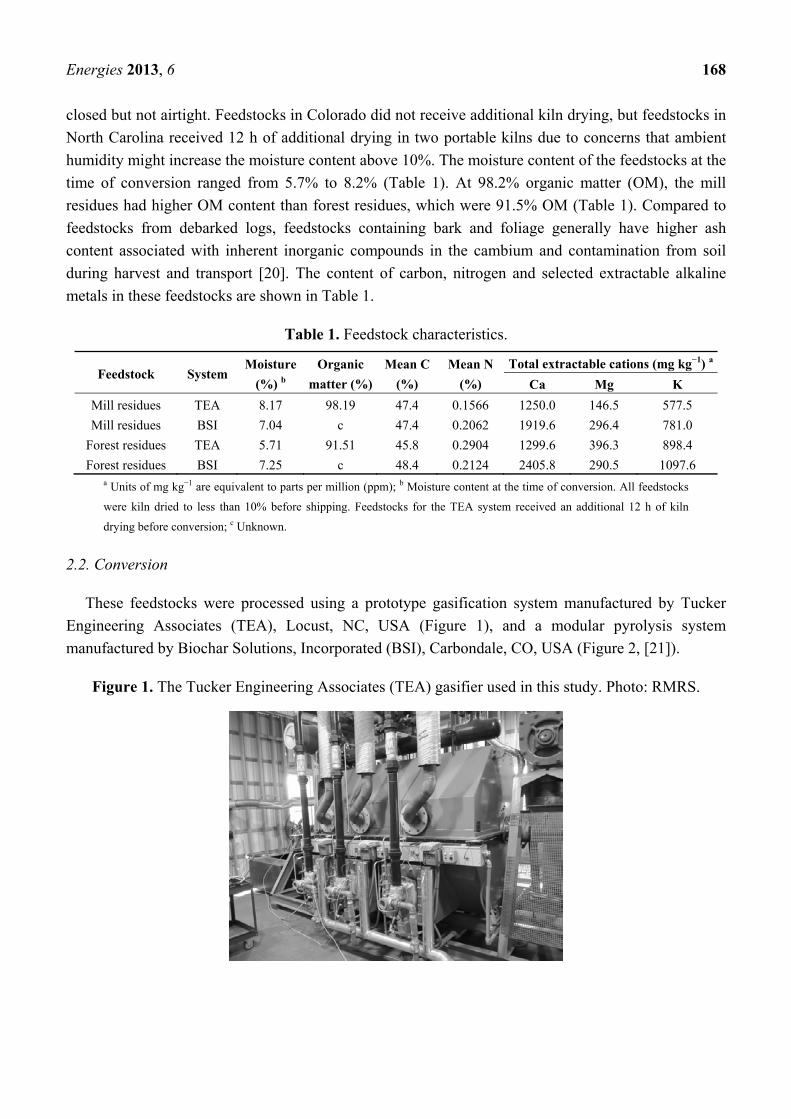
These feedstocks were processed using a prototype gasification system manufactured by Tucker
Engineering Associates (TEA), Locust, NC, USA (Figure 1), and a modular pyrolysis system
manufactured by Biochar Solutions, Incorporated (BSI), Carbondale, CO, USA (Figure 2, [21]).
Figure 1. The Tucker Engineering Associates (TEA) gasifier used in this study. Photo: RMRS.

Energies 2013, 6 169
Figure 2. The Biochar Systems Incorporated (BSI), pyrolysis system Beta model used in
this study. The unit used in this study was fitted with a thermal oxidizer (not shown), which
replaces the open flare shown on the right. Photo: BSI.
The operational dry weight feedstock throughputs of the two systems have been estimated by the
manufacturers to be 700 kg h−1 and 225 kg h−1, respectively. Biochar yields by mass are reported as
between 5% and 25% for the TEA system and up to 24% for the BSI system, with the balance going to
producer gas and a small fraction of ash and tar byproducts.
The TEA system was engineered to produce high-quality, high-energy gas from a wide range of
feedstocks including coal, municipal solid waste, and wood waste. Biochar is considered a co-product
of gas production. The TEA biochars were carbonized at 1040 °C in a direct heat, screw conveyor
reactor heated by six tangential burners fueled with propane. With feedstock airlocks and no inputs of
oxygen, steam, or carrier gas during the conversion process, oxidation during conversion was very
low. The pyrolysis gas pressurizing the system is primarily carbon monoxide, nitrogen, methane, and
hydrogen. Residence time is estimated at 1.5 min per run. Results for TEA biochars below are for a
“double run”, where the feedstock was run through the system to produce biochar, and then the
resulting biochar output was run through the system again to remove any residual volatiles and
simulate a longer auger configuration, which is currently in development by TEA. Total residence time
in this study was approximately 3.0 min. Samples from twelve runs were collected over six days
of operation.
The BSI pyrolysis system was engineered to produce biochar from biomass, including agricultural
residues and wood waste, with a focus on achieving high yields of biochar with a high percentage of
stable, recalcitrant carbon. Energy gas and heat are generally considered co-products of biochar
production. The BSI system uses a two-stage reactor. In the primary reactor, the feedstock is
carbonized in a controlled aerobic environment with limited oxygen at a temperature between 700 and
750 °C for less than one minute. Then the material passes into a second reactor, where material is held
in a sweep gas environment for approximately ten to fifteen minutes at a temperature between 400 and
550 °C, before the material is removed from the machine by a liquid cooled auger with an air lock. The
dust fraction of biochar present in the gas stream is collected by a cyclone trap before the gas is
Energies 2013, 6 170
evacuated from the system by a blower. Dust does not receive the same sweep gas treatment as the
coarse biochar output, which receives full residence time in the second reactor. The dust fraction of
production is not characterized in this study. The pyrolysis gas produced during the first stage of
pyrolysis is used as sweep gas for the second stage and is pulled through the system by a blower. This
gas is composed primarily of carbon monoxide, nitrogen, methane, and hydrogen, with some oxygen.
Some limited oxidation occurs in the first stage, but oxidation is very low in the second stage. Samples
from four runs were collected on a single day of operation.
2.3. Sampling and Laboratory Analysis
During conversion, samples of producer gas were collected in 0.5 L evacuated, inert steel canisters,
which were pressurized to 15 psig (gauge pressure in pound per square inch) using stainless steel
flexible tubing and a battery powered pump apparatus. Each sample generally represents about 15 to
30 s of gas flow. For both systems, tubing was attached to air-tight sampling ports located between the
reactor and the downstream air lock system, which is an enclosed, pressurized water tank on the TEA
system and a blower and cyclone on the BSI system. In total, twenty-five gas samples were collected
from the two systems representing eight runs of each feedstock.
In the laboratory, canister samples of producer gas were analyzed for CO2, CO, CH4, and C2 and
C3 hydrocarbon gases with an Agilent model 7890 gas chromatograph configured with two columns
running simultaneously. Chromatogram data were collected and processed by Agilent Chem Station
software. A set of gas standards bracketing the sample concentrations were analyzed with each set of
samples to construct a standard curve for each compound. Based on the integrated peak areas, the
sample concentrations were calculated from the standard curves and written into a spreadsheet
for analysis.
For measurement of H2 concentrations, a Trace Analytical RGA3 gas analyzer was used. A
molecular sieve column and a mercuric oxide reduction gas detector were used to measure trace levels
of CO, H2 and other reduction gases. The detection limit is 0.1 ppm H2. Data from this instrument were
also collected and processed by Agilent Chem Station software. Calculations of energy content of the
producer gas were made using standard stoichiometric techniques applied to the concentrations of
combustible gas components.
At the time of conversion, feedstock and biochar samples were packaged in zip-type bags and
shipped to the laboratory for analysis. Four 1.0 kg feedstock samples (two of each type) and fifteen
2.0 kg biochar samples were collected. Two additional biochar samples, approximately 10 kg each,
were packaged for use as a precursor in steam activation trials. Feedstock moisture content was
determined in the laboratory using oven drying at 103 ± 2 °C [22]. Feedstock samples were analyzed
for organic matter content using loss-on-ignition methods for 8 hours duration at 400 °C [23]. To
obtain nutrient information, feedstock samples were ashed for 5 h at 475 °C and nutrients were
extracted with a 2N nitric acid solution. The extractable nutrients calcium, magnesium and potassium
were determined by analysis with a Perkin Elmer 5100PC Atomic Absorption Spectrometer (Perkin
Elmer, Inc., Waltham, MA, USA).
A sieve analysis was used to determine the particle size distribution of each biochar product. Using
a mechanical shaker, a 100 g biochar sample was passed through successively smaller screens with
Energies 2013, 6 171
opening sizes ranging from 6.35 to 0.044 mm. An unconsolidated biochar sample was used to assess
sample pH. A biochar-distilled water solution with a 1:4 ratio was made and pH of the solution was
determined with an Orion 4-Star meter and electrode (Thermo Scientific, Beverly, MA, USA).
The determination of total carbon and total nitrogen for both the feedstocks and biochars was made
by dry combustion on a TruSpec CN analyzer, which uses an infrared detector to measure carbon and a
thermal conductivity cell to determine nitrogen (Leco Corporation, St. Joseph, MI, USA). Samples
were dried and homogenized prior to analysis and feedstocks were ground to pass through a 420 µm
screen. Biochar was ground into a fine powder. Differences in analytical methods reflect the unique
composition of the samples—feedstocks were treated as organic material while the biochar was
analyzed using soil (i.e., mineral) methods with higher oxygen flow during the burn phase to ensure
complete combustion of the material. Energy content was determined by calorimetry using a Parr
bomb calorimeter calibrated with a standard of benzoic acid. Total carbon and nitrogen associated with
this test was measured with a LECO CN analyzer.
Two physical activation methods were used to activate biochar outputs from the BSI and TEA
systems. Biochars from both systems were activated with steam using a bench top steam activation
apparatus. Activation temperature was 950 °C, with steam injected at 15 psig. In addition, the TEA
system biochars were activated using a 6.5 inch internal diameter electrically heated Bartlett-Snow
rotary calciner (Alstom Power, Naperville, IL, USA). The calciner has four zones along the furnace
section for temperature control and the hottest zones were set at 927 °C. The calciner cylinder was
nitrogen purged to maintain an inert atmosphere prior to activation and steam was injected at 815 °C.
Retention time was 45 min. Unfortunately, due to cost and logistical considerations, BSI biochars were
not activated using this method.
Iodine number for biochars and AC was calculated using titration methods, specifically ASTM
D4607-94 [24]. Brunauer-Emmet-Teller (BET) surface area of TEA biochars and resultant AC
produced from TEA biochar precursor was measured by nitrogen gas sorption analysis at 77 K using a
BET-201-APC Sorptometer (Porous Materials Incorporated, Ithaca, NY, USA). Before analysis, 1.0 g
samples were vacuum outgassed to 20 µm at 20 °C, with variable outgassing time. In addition to BET
surface area, sorption analysis was used to calculate total pore volume, porosity, and several measures
of pore diameter for TEA biochars and AC.
3. Results
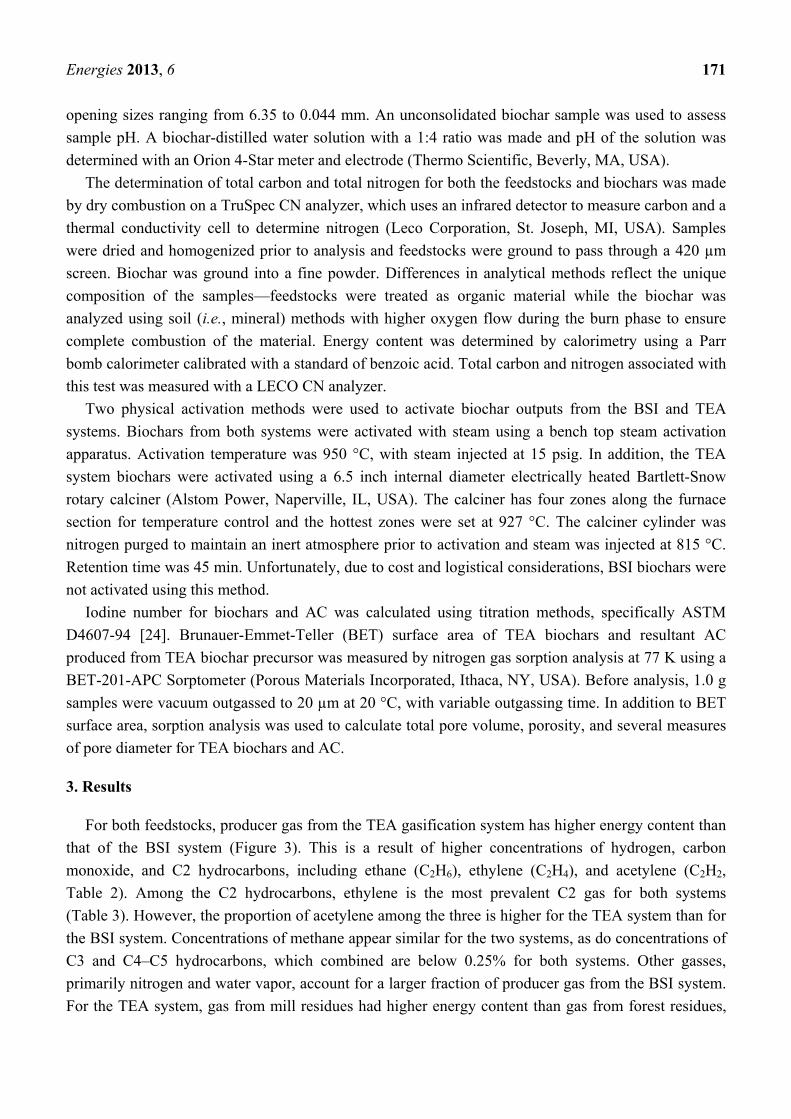
For both feedstocks, producer gas from the TEA gasification system has higher energy content than
that of the BSI system (Figure 3). This is a result of higher concentrations of hydrogen, carbon
monoxide, and C2 hydrocarbons, including ethane (C2H6), ethylene (C2H4), and acetylene (C2H2,
Table 2). Among the C2 hydrocarbons, ethylene is the most prevalent C2 gas for both systems
(Table 3). However, the proportion of acetylene among the three is higher for the TEA system than for
the BSI system. Concentrations of methane appear similar for the two systems, as do concentrations of
C3 and C4–C5 hydrocarbons, which combined are below 0.25% for both systems. Other gasses,
primarily nitrogen and water vapor, account for a larger fraction of producer gas from the BSI system.
For the TEA system, gas from mill residues had higher energy content than gas from forest residues,
Energies 2013, 6 172
with averages of 12.4 MJ m−3 and 9.8 MJ m−3, respectively. Gases from the BSI system were
1.3 MJ m−3 for mill residues and 2.5 MJ m−3 for forest residues.
Figure 3. Gas energy content.
Table 2. Producer gas chemical composition.
Feedstock Mill residues Forest residues
Constituent/System TEA BSI TEA BSI
H2 (%) 8.46 1.84 7.39 2.63
CO (%) 39.03 4.04 34.05 7.83
CO2 (%) 7.66 0.89 5.97 1.90
CH4 (%) 12.68 7.35 10.38 12.08
C2 (%) 3.43 0.24 1.63 0.64
C2H6 (%) 0.14 0.08 0.03 0.15
C2H4 (%) 2.77 0.15 1.18 0.44
C2H2 (%) 0.51 0.01 0.42 0.05
C3 (%) 0.06 0.07 0.01 0.17
C4–C5 (%) 0.00 0.02 0.00 0.05
Other (%) 28.68 85.55 40.57 74.69
Table 3. Biochar characteristics.
Feedstock System H2O
(%)
Bulk density,
dry (Mg m−3) pH C (%) N (%) C:N
BET surface
area (m2 g−1)
Energy
(MJ kg−1)
Mill residues TEA 2.94 0.165 10.2 91.5 0.89 102.8 15.0 33.98
Mill residues BSI 1.31 0.150 9.0 82.1 0.83 98.9 203.0 35.71
Forest residues TEA 1.68 0.183 8.9 70.5 0.81 87.0 11.8 33.40
Forest residues BSI 2.23 0.131 8.7 75.9 0.45 168.7 129.0 33.46
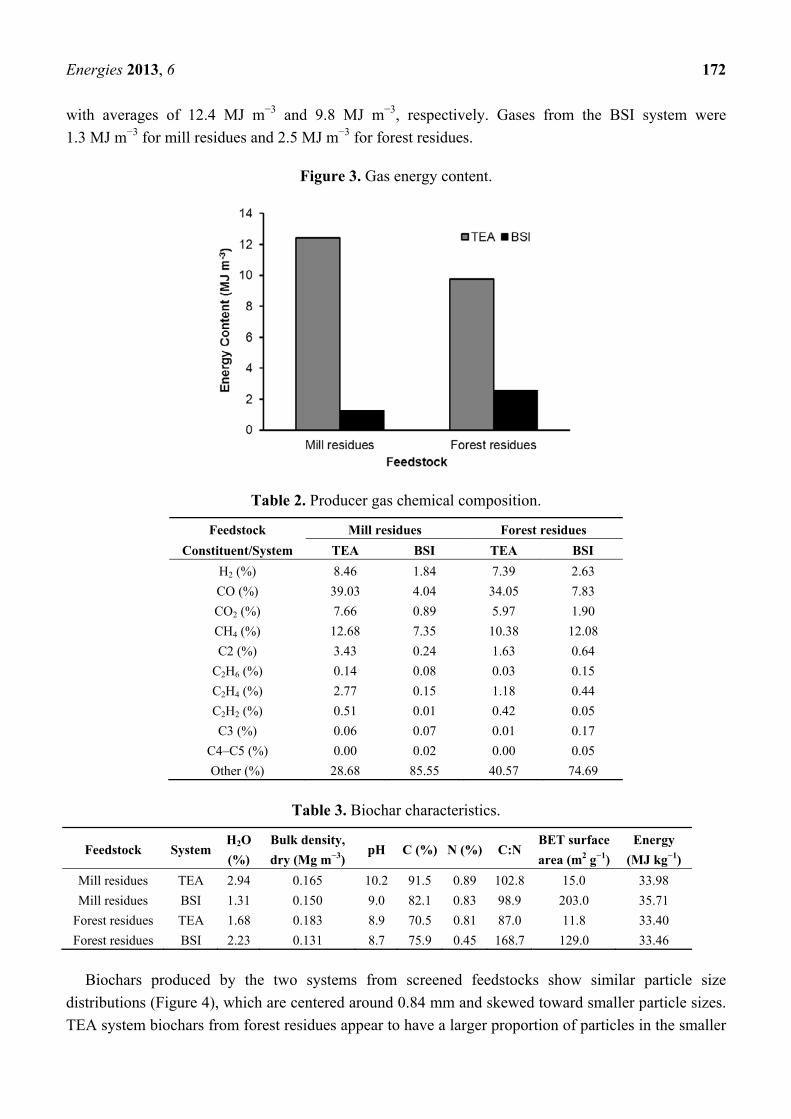
Biochars produced by the two systems from screened feedstocks show similar particle size
distributions (Figure 4), which are centered around 0.84 mm and skewed toward smaller particle sizes.
TEA system biochars from forest residues appear to have a larger proportion of particles in the smaller
Energies 2013, 6 173
than 0.42 mm size classes. Bulk densities for the samples are also similar and range from
0.131 Mg m−3 to 0.183 Mg m−3 (Table 3), which are relatively low for wood biochars and reflect the
low densities of the softwood feedstocks [25]. All of the biochars produced were alkaline, with
biochars from mill residues having a higher pH than those from forest residues. Average pH ranges
from a low of 8.7 for BSI biochar made from forest residues to 10.2 for TEA biochars made from
mill residues.
Figure 4. Biochar particle size distribution.
At 15.0 m2 g−1 (TEA) and 203.0 m2 g−1 (BSI), mill residue biochars also have slightly higher BET
surface areas than forest residue biochars, which are 11.8 m2 g−1 and 129.0 m2 g−1 for the TEA and BSI
systems, respectively. Carbon content for the TEA system biochars made from mill and forest residues
are 91.5% and 70.5%, compared to 82.1% and 75.9% for BSI biochars. The carbon to nitrogen ratio
for these biochars ranges from 87.0 to 168.7. The energy contents of these biochars on a dry weight
basis are similar and range from 33.4 to 35.7 MJ kg−1.
Pre-activation iodine numbers were 7 mg g−1 and 2 mg g−1 for TEA biochars and 142 and 82 mg g−1
for BSI biochars, for mill and forest residues, respectively. Following bench top steam activation at
950 °C with steam injected at 15 psig, iodine number ranged from 245 g cg−1 to 425 g cg−1, indicating
a significant increase in adsorption properties (Figure 5). For the bench top apparatus, AC from BSI
biochars have higher iodine adsorption than AC from TEA biochars. It also appears that mill residues
produce AC with higher adsorption potential. For TEA system biochars, AC iodine adsorption for mill
residue feedstock is 29% higher than for forest residue feedstock. The difference is much smaller

Energies 2013, 6 174
(<3%) for the BSI system. BET surface area was not calculated for AC produced using bench top
steam activation.
Figure 5. Iodine number of AC from biochar using a benchtop steam activation apparatus
at 950 °C with steam injected at 15 psig.
In addition to bench top activation, TEA system biochars were activated using a Bartlett-Snow
rotary calciner at 927 °C with activation by steam injected at 815 °C. Results show that this method of
activation increased BET surface area from 15.0 m2 g−1 to 1283.0 m2 g−1 for biochar made from mill
residues and from 11.0 m2 g−1 to 575.9 m2 g−1 for biochar made from forest residues (Table 4). The
increase in surface area is reflected by the pore characteristics of the AC, with large increases in total
pore volume and porosity, and a decrease in average pore diameter (Table 4).
Table 4. BET surface area and pore characteristics of TEA system biochars and AC
resulting from steam activation in a rotary calciner at 815 °C.
Feedstock Product BET surface
(m2 g−1)
Total pore
volume
(cc g−1)
Porosity (per
g of sample)
Ave. pore
diameter (Å)
Med. PV
pore dia. (Å)
Med. SA
pore dia. (Å)
Mill residues Biochar 15.0 0.0161 0.0158 42.79 45.90 35.97
Forest residues Biochar 11.8 0.0359 0.0347 122.09 175.98 60.92
Mill residues AC 1283.0 0.9591 0.4895 29.90 48.15 26.97
Forest residues AC 575.9 0.4441 0.3075 30.85 51.32 27.28
4. Discussion
This study examines the chemical and physical properties of the outputs of two different
thermochemical conversion technologies used to process mill and forest residues, with an emphasis on
potential uses and markets for those outputs. The two systems were chosen because they are
commercially available, can process a wide range of woody biomass feedstocks of varying quality, and
are small enough to be used in distributed applications by small and medium scale forest industry
facilities. The two systems also represent different ends of the conversion spectrum, with the BSI
Energies 2013, 6 175
pyrolysis system designed to maximize biochar fixed carbon and sorption for an exothermic reaction
between 350 and 750 °C, and the TEA system gasifier designed to produce high-energy gas at
temperatures greater than 1000 °C. The differences between the systems are reflected in differences
between production outputs and their potential uses and markets.
4.1. Producer Gas
The energy content of gas produced from forest biomass by the TEA system gasifier is somewhat
higher than values reported in studies of pilot scale and laboratory systems. For example, using a
Biomax-25 gasifier (Community Power Corporation, Littleton, CO, USA), Elder and Groom [26]
produced gas from pine and mixed hardwood chips with energy content around 6 MJ m−3.
Son et al. [27] reported syngas energy content of 4.6 MJ m−3 for wood chips processed in an
experimental downdraft gasifier. At 12.4 MJ m−3, the TEA system gas produced from mill residue in
this study has relatively high energy content. The energy content of BSI pyrolysis system gas is below
3.0 MJ m−3, which is relatively low compared to gasification systems, but similar to gas produced by
pyrolysis systems operating in this temperature range [28]. It would be expected that mill residue
feedstocks would result in gas with higher energy content than forest residue feedstocks because of the
lower ash content and higher energy density of the raw materials, and this appears to be the case for
the TEA system. However, we do not know if the seemingly contrary results of for the BSI system are
within the range of variability of the system or represent a statistically significant difference between
the feedstocks.
High concentrations of CO2 and N2 are responsible for the lower energy content of the BSI gas.
However, it is also worth noting that the BSI system is exothermic and does not require any gas inputs
for heating once the primary reactor is fired. By contrast, the TEA reactor is endothermic and is
estimated to consume about 1500 MJ h−1 in process heat, which was provided by propane in this study.
Using woody biomass feedstocks, process energy needs could be met with about 15% of the gas
production of the TEA system. Though the prototype is not presently configured to use producer gas as
fuel for its six tangential burners, TEA is currently modifying the system to integrate this option as part
of ongoing research and development.
There are some operational considerations related to air-fuel ratios and lower flame temperature, but
in general retrofitting gas burners to accommodate producer gas from biomass conversion is relatively
straight forward. This means that, with relatively little cost, the gas produced by these systems can be
combusted to produce process heat for mill operations such as feedstock and lumber drying, heat
treating, and facility heating. For example, many conversion systems require feedstock with low
moisture content, but feedstock moisture content less than 10% is below what could be expected from
field-dried forest residues in most parts of the country. Both systems can be configured to use waste
heat and/or combustion of a portion of the gas stream to dry feedstock. BSI currently offers this option
for new pyrolysis systems. Mills that dry solid wood products to meet product specifications or export
requirements also have a significant need for heat.
Producer gas can also be used as fuel for electricity generation using an internal combustion or
turbine engine, but this application is highly dependent on gas quality. Specifically, particulate matter
and tars significantly increase engine wear and must be removed though gas cleaning. Gas quality for
Energies 2013, 6 176
use in turbine engines must be especially high, with narrow parameters for particulate matter
(<30 ppm), particle size (<5 µm), and alkali metals <0.2 ppm [28]. Reductions in engine power (i.e.,
derating) are also a challenge when substituting biomass producer gas for natural gas or liquid fossil
fuel because of its lower energy density. Though we did not evaluate these gas properties in this study,
the need for significant producer gas post-processing for power generation is likely. However, if power
is generated, these systems provide another potential market product—electricity to the grid. If power
generation meets facility requirements, excess power may be sold or credited against future power use,
depending on grid infrastructure and utility sector regulation.
Biomass is the only renewable energy source that can be used as raw material in the production of
liquid hydrocarbon fuels and chemicals. Thermochemical conversion systems are associated with two
general types of liquid outputs: bio-oil and liquids manufactured from producer gas. Neither of the two
systems in this study produces liquid output, but some pyrolysis systems do produce bio-oil, which
could be shipped in its raw form to a refining facility [7]. Industrial systems for the production of
methanol (methyl alcohol) from biomass producer gas with high concentrations of CO and H2
(i.e., synthesis gas) are well established [18]. Furthermore, the development of methods for the
commercial production of liquid fuels and chemicals using Fischer-Tropsch (FT) synthesis of biomass
producer gas is progressing [19] and even commercialized in some cases [29]. However, a variety of
challenges related to economies of scale in refining operations and the technical demands of liquid fuel
production make it unlikely that small-scale catalytic production of liquid fuels and chemicals will be
integrated directly into these systems in the near future. For both methanol production and FT
synthesis, the major barriers to integration at distributed scales are both technical and financial [19].
4.2. Biochar
Biochars produced by the TEA and BSI systems can be used as a solid fuel. Recent research on the
use of torrefied wood and biochar as fuel has focused on utility applications, especially co-firing with
coal [30,31]. Fossil coal energy content is generally higher than that of biochar and ranges from 28 to
40 MJ kg−1, depending on coal quality. In contrast, the calorific value of fuels produced by pyrolysis of
wood biomass have been reported as 20.7 MJ kg−1 for torrefied wood [16], between 22.8 and
31.8 MJ kg−1 for slow pyrolysis biochar (i.e., charcoal, [32]), and 20 to 26 MJ kg−1 for biochars made
from various woody materials [33,34]. With energy content above 30 MJ kg−1, the biochars evaluated
in this study are higher in energy than these fuels, but lower than medium and high quality coal. This
means that biochar, like biomass, is generally a poor substitute for coal in terms of energy content.
However, there may be other reasons that utility companies and other coal users may want to substitute
biochar for coal. Among them, co-firing biochar with coal may reduce fuel costs, reduce some types of
emissions (e.g., sulfur oxide and nitrogen oxide), diversify fuel sources, and offset fossil fuels with
renewable fuels [35]. In some states, cofiring may also meet requirements for renewable portfolio
standards. Whether or not cofiring reduces greenhouse gas emissions depends on the source of the
feedstock as well as the carbon accounting methods used, but it is clear that cofiring substitutes
biogenic emissions for fossil fuel emissions. In addition, forests supplying biomass for cofiring recover
emissions over time through regrowth of harvested stands, as long as forests are not converted to other
land uses.
Energies 2013, 6 177
In general, these benefits are similar to those of cofiring biomass directly without conversion. Some
types of coal-fired boilers, including stoker boilers and pulverized coal boilers, can substitute raw
biomass for coal, often up to 20% by mass, without significant detrimental effects on system
performance [36], but there may be some advantages to using pyrolysis products in these systems
rather than biomass. The energy density of pyrolysis products is higher than that of biomass, which is
typically around 16 MJ kg−1 for biomass used in cofiring [37]. In addition to improving transportation
efficiency and boiler performance through higher energy density, biochar and torrefied wood have
better handling and storage properties than biomass [15]. Furthermore, boiler systems that cannot
cofire biomass directly, such as integrated gasification combined cycle systems, may be capable of
substituting biochar directly for coal, depending on biochar properties. Based on the particle size
distributions and other properties of the biochars produced in this study, we believe that they could be
substituted for coal in most gasification applications.
The use of biochar as a soil amendment is the subject of intensifying scientific inquiry from
researchers in agriculture, forestry, mining, and other fields. Biochar additions have received the most
attention from efforts to increase carbon sequestration while reducing atmospheric carbon dioxide
concentrations [38]. Increases in carbon sequestration can improve overall soil quality because of the
role that carbon plays in chemical, biological, and physical soil processes [39]. Biochar has a higher
surface area and greater porosity than native soil organic matter, which also helps improve soil
aggregation. Application of biochar from forest biomass to forest sites can improve the nutrient and
water holding capacity of the soil by altering soil texture, aggregation, and organic matter
content [40,41]. Biochar can also decrease nutrient leaching and increase nutrient availability by
altering soil cation exchange capacity and soil pH [42]. Understanding the interactions of biochar
application and soil texture, organic matter, and pH will be the key to determining both long-term
impacts and potential market opportunities.
It is difficult to evaluate the use of our biochars for soil applications because most chemical data
available for biochar soil amendments are based on agricultural crop feedstocks (e.g., peanut hulls,
pecan shells, apricot stones) with little information on woody feedstock biochar. As a benchmark,
biochar produced from hardwood forest residues by fast pyrolysis and used in forest soil studies
contained 62% C and 18% N, with a pH of 6.8 and a bulk density of 0.25 Mg m−3 [43]. In comparison
to the biochars produced in this study, these chars have higher C, higher N, lower pH, and higher bulk
density (Table 3).
The greatest impact of biochar additions to forest soil may be the liming effect that occurs as a
result of increased pH. Biochar pH ranged from 8.7 to 10.2 for this study (Table 3). Forest soils
generally have a pH range from 4.5 to 6.0. In this case, the liming effect may not be ideal for all forest
soil types and plant communities. Many forest plants, fungi, and bacteria thrive at lower soil pH [44];
therefore altering forest soil pH through the addition of biochar may result in unfavorable shifts in
above- and belowground flora. However, there are currently not any guidelines on the amounts of
biochar that can be added before a resultant pH shift occurs, as this will likely be soil-specific. Low
application rates (e.g., 1 to 2 Mg ha−1 biochar), which mimic the amount of biomass removed during
harvest operations, may have little impact on soil pH, but would alter water holding and nutrient
cycling conditions enough to improve forest growth. On degraded forest lands (e.g., log landings, skid
trails) biochar may reduce soil bulk density and increase plant available nutrients sufficiently to
Energies 2013, 6 178
rehabilitate the soil and ensure native vegetation regrowth [45]. Though field research is progressing
rapidly, markets for biochar as a soil amendment are still emerging.
In contrast, markets for AC are well developed and diverse. The chemical and physical properties of
carbon that result in improved nutrient and water holding capacity in some soils are also desirable
properties for industrial sorbents. High surface area and high porosity are ideal for adsorbing
contaminants from both liquids and gases. Physical and chemical activation methods can significantly
improve these properties in biochars, potentially adding value by meeting commercial specifications
for AC used in filtering applications. Table 5 summarizes published results of BET surface areas and
other properties of AC produced from fossil coal and biomass feedstocks. Pollard et al. [46] reported
that most commercial ACs have a surface area between 400 and 1600 m2 g−1.
Table 5. Published BET surface areas of AC produced from fossil coal and biomass feedstocks.
Feedstock BET surface
(m2 g−1)
Pyrolysis
temp. (°C) Activat. type
Activat.
temp. (°C)
Pore volume
(cm3 g−1)
Iodine #
(mg g−1) Source
Subbituminous coal 988 700–950 CO2 750 0.482 a [47]
Bituminous coal 536 500 H3PO4 50 0.030 a [48]
Apricot stones 566 200 H2SO4 200 a 548 [49]
Wood 1780 440 H3PO4 + Steam 440 0.130 a [50] a not reported.
In this study we show that the biochar produced by the BSI and TEA systems is suitable for
physical activation using standard physical activation methods. The TEA AC is within the commercial
range, and biochar from mill residue produces AC with a higher BET surface area than biochar from
forest residues. This result is consistent with studies relating high ash content to lower activation
levels [51]. Though we did not activate BSI biochars using the industrial rotary calciner, in laboratory
activation BSI biochars were activated to a higher level than TEA biochars, as evaluated by iodine
adsorption (Figure 5). This result is expected based on the temperature of pyrolysis [52]. Both biochar
products could be used as a precursor for the production of AC. Though it is difficult to compete with
the economic efficiency and consistency of fossil coal as an AC precursor, biochar is from renewable
resources, which may be an advantage in some markets for differentiated carbon products. Further,
because woody biomass is available as a byproduct of forest management and timber production in
many parts of the country and pyrolysis or gasification technology performs well at distributed scales,
AC can be produced from biochar in a more distributed supply chain than characterizes AC from fossil
coal. Distributed production might provide advantages in transportation efficiency to some individual
AC users and local markets.
Activated carbon is only one potential use and market for biochar. The range of potential
market-based uses of biochar, from fuel to soil amendment to AC, can enhance product and market
diversification available to producers. This offers the possibility of increasing the portfolio of
value-added products that can be produced from what are now waste byproducts of solid wood
products manufacturing and forest management.

Energies 2013, 6 179
5. Conclusions
Distributed thermochemical biomass conversion systems have the potential to meet a number of
different operational needs associated with wood products manufacturing, including waste disposal,
heat, power, and the production of marketable value-added products from woody biomass. The extent
to which this potential can be achieved hinges on the qualities of the products these systems produce,
potential uses for those products, and the financial viability of system integration compared to
alternatives. In this study, we evaluated the outputs of two conversion systems used to process mill and
forest residues and determined that the gas and biochar produced by these systems could be used to
produce heat, electricity and a range of marketable products, but many questions remain.
Both of the systems examined in this paper are the subject of ongoing research. The authors and
their colleagues are currently developing detailed financial models for system deployment in the forest
sector based on experimental production and operations studies. Economic input-output models are
being used to evaluate the potential economic benefits of co-locating these technologies with forest
industry facilities in the western United States. The authors are also working to characterize gas,
emissions and biochars from a wide range of woody feedstocks processed with these technologies. In
particular, the variability of product quality, gas flow, and yield is being quantified in commercial
settings over operational periods of days and weeks rather than hours. Additional research on the use
of biochars in the production of AC is focused on chemical activation, and preliminary results using a
proprietary activation process indicate that using a combination of steam and chemical activation can
yield higher BET surface area AC from biochar produced by these systems than using steam
activation alone.
The team is also collaborating on several lines of research to address the environmental impacts of
pyrolysis conversion of woody biomass. BSI biochar has been incorporated into a number of
field-based experimental studies to evaluate its effects on soil quality, soil function, and site
productivity, with an emphasis on biochar application to forest soils. Broader environmental impacts
are being evaluated using LCA of the TEA system and emissions analysis for both systems based on
samples of gaseous and particulate matter emissions taken during testing and production runs. On the
manufacturing side, both TEA and BSI are working to incorporate technical advances in producer gas
utilization, feedstock drying, and biochar cooling into their systems, and have already moved beyond
the prototypes examined in this study. New knowledge about the technical, logistical, economic, and
environmental aspects of these and similar systems will be critical for guiding informed business and
policy decisions associated with biomass conversion technologies.
Acknowledgments
The authors would like to thank our research partners, Tricon Timber, LLC; Biochar Solutions,
Inc.; and Tucker Engineering Associates, especially Charlie Sells, Johan Levine and Richard Tucker.
Emily Lincoln, Joanne Tirocke, Wilfredo Perez, and other personnel at the Rocky Mountain Research
Station worked meticulously to analyze dozens of samples in the laboratories of Wei Min Hao,
Deborah Page-Dumroese, and Jim Reardon. We would also like to acknowledge the work and
guidance of Colleen Rostad and David Rutherford of the USGS, as well as the assistance of Chuck

Energies 2013, 6 180
Rhoades and Kelly Elder in feedstock procurement. Additional thanks to Porous Materials, Inc.;
Chem-Bac Laboratories, Inc.; Professional Analytical and Consulting Services; and Alstom Power.
This research was supported by funding from the Rocky Mountain Research Station’s Competitive
Research Initiative and the USDA National Institute of Food and Agriculture’s Biomass Research and
Development Initiative.
References
1. U.S. Department of Energy. U.S. Billion-Ton Update: Biomass Supply for a Bioenergy and
Bioproducts Industry; Perlack, R.D., Stokes, B.J., Eds.; ORNL/TM-2011/224; Oak Ridge
National Laboratory: Oak Ridge, TN, USA, 2011; pp. 7–15.
2. Peterson, D.; Haase, S. Market Assessment of Biomass Gasification and Combustion Technology
for Small- and Medium-Scale Applications; Technical Report NREL/TP-7A2-46190; National
Renewable Energy Laboratory: Golden, CO, USA, 2009; pp. 1–32.
3. Turnbull, J. Use of biomass in electric power generation: The California experience. Biomass
Bioenergy 1993, 4, 75–84.
4. Morgan, T. An Assessment of Forest-Based Woody Biomass Supply and Use in Montana; Forestry
Assistance Bureau, Forestry Division, Montana Department of Natural Resources and
Conservation: Missoula, MT, USA, 2009.
5. Jones, J.G.; Loeffler, D.; Calkin, D.; Chung, W. Forest residues for thermal energy compared with
disposal by onsite burning: Emissions and energy return. Biomass Bioenergy 2010, 34, 737–746.
6. Korb, J.; Johnson, N.; Covington, W. Pile burning effects on soil biotic and chemical properties
and plant establishment: Recommendations for amelioration. Restor. Ecol. 2004, 12, 52–62.
7. Fransham, P.; Badger, P. Use of mobile fast pyrolysis plants to densify biomass and reduce
biomass handling cost—A preliminary assessment. Biomass Bioenergy 2006, 30, 321–325.
8. Garcia-Perez, M.; Lewis, T.; Kruger, C. Methods for Producing Biochar and Advanced Biofuels
in Washington State, Part 1: Literature Review of Pyrolysis Reactors; Department of Biological
Systems Engineering and the Center for Sustaining Agriculture and National Resources,
Washington State University: Pullman, WA, USA, 2010; pp. 1–137.
9. El-Khattam, W.; Salama, M. Distributed generation technologies, definitions and benefits.
Electric. Power Syst. Res. 2004, 71, 119–128.
10. Biochar Solutions, Incorporated (BSI). BSI Biochar Base Unit: Technical Specifications, Version
3.0.; Biochar Solutions, Incorporated: Carbondale, CO, USA, 2011.
11. PHG Energy. Industrial Grade Downdraft Gasification; PHG Energy: LaVergne, TN, USA,
2011. Available online: http://www.phgenergy.com (accessed on 7 January 2013).
12. Mohan, D.; Pittman, C., Jr.; Steele, P. Pyrolysis of wood/biomass for bio-oil: A critical review.
Energy Fuels 2006, 20, 848–889.
13. Kumar, A.; Jones, D.; Hanna, M. Thermochemical biomass gasification: A review of the current
status of the technology. Energies 2009, 2, 556–581.
14. Van der Stelt, M.; Gerhauser, H.; Kiel, J.; Ptasinski, K. Biomass upgrading by torrefaction for the
production of biofuels: A review. Biomass Bioenergy 2011, 35, 3748–3762.
Energies 2013, 6 181
15. Uslu, A.; Faaij, A.; Bergman, P. Pre-treatment technologies, and their effect on international
bioenergy supply chain logistics. Techno-economic evaluation of torrefaction, fast pyrolysis and
pelletisation. Energy 2008, 33, 1206–1223.
16. Prins, M.; Ptasinski, K.; Janssen F. Torrefaction of wood Part 2. Analysis of products. J. Anal.
Appl. Pyrolysis 2006, 77, 35–40.
17. Rath, J.; Staudinger, G. Cracking reactions of tar from pyrolysis of spruce wood. Fuel 2001, 80,
1379–1389.
18. Hamelinck, C.; Faaij, A. Production of Methanol from Biomass. In Alcoholic Fuels; Miller, S.,
Ed.; Taylor and Francis Group: New York, NY, USA, 2006; pp. 7–50.
19. Tijmensen, M.; Faaij, A.; Hamelinck, C.; van Hardeveld, M. Exploration of the possibilities for
production of Fischer Tropsch liquids and power via biomass gasification. Biomass Bioenergy
2002, 23, 129–152.
20. Jenkins, B.; Baxter, L.; Miles, T., Jr.; Miles, T. Combustion properties of biomass. Fuel Proc.
Technol. 1998, 54, 17–46.
21. Biochar Solutions, Incorporated (BSI). Biochar Solutions: Overview; Biochar Solutions,
Incorporated: Carbondale, CO, USA, 2011. Available online: http://www.biocharsolutions.com/
overview.html (accessed on 7 January 2013).
22. Bergman, R. Drying and Control of Moisture Content and Dimensional Changes. In Wood
Handbook—Wood as an Engineering Material; General Technical Report FPL-GTR-113; USDA
Forest Service, Forest Products Laboratory: Madison, WI, USA, 2010.
23. Nelson, D.; Sommers, L. Total Carbon, Organic Carbon, and Organic Matter. In Methods of Soil
Analysis, Part 3—Chemical Methods; Soil Science Society of America, American Society of
Agronomy: Madison, WI, USA, 1996; pp. 961–1069.
24. American Society for Testing and Materials (ASTM). ASTM D4607-94 (2011) Standard Test
Method for Determination of Iodine Number of Activated Carbon; ASTM International: West
Conshohocken, PA, USA, 2011.
25. Downie, A.; Crosky, A.; Munroe, P. Physical Properties of Biochar. In Biochar for Environmental
Management Science and Technology; Lehmann, J., Joseph, S., Eds.; Earthscan: London, UK,
2006; pp. 13–32.
26. Elder, T.; Groom, W. Pilot-scale gasification of woody biomass. Biomass Bioenergy 2011, 35,
3522–3528.
27. Son, Y.; Yoon, S.; Kim, Y.; Lee, J. Gasification and power generation characteristics of woody
biomass utilizing a downdraft gasifier. Biomass Bioenergy 2011, 35, 4215–4220.
28. Jenkins, B. Chapter 3.2.2: Pyrolysis Gas. In Handbook of Agricultural Engineering Volume V:
Energy and Biomass Engineering; Kitani, O., Ed.; American Society of Agricultural Engineers:
St. Joseph, MI, USA, 1999.
29. KiOR. KiOR Production Facilities. KiOR, Inc.: Columbus, MS, USA, 2011. Available online:
http://www.kior.com/content/?s=6&s2=56&p=56&t=Production-Facilities/ (accessed on 7 January
2013).
30. Bergman, P.; Boersma, A.; Kiel, J.; Zwart, R. Development of Torrefaction for Biomass
Co-Firing in Existing Coal-Fired Power Stations; BIOCOAL Concept Version, ECN Report;
Energy Research Center of the Netherlands: Petten, The Netherlands, 2005.
Energies 2013, 6 182
31. Abdullah, H.; Wu, H. Biochar as a fuel: 1. Properties and grindability of biochars produced from
the pyrolysis of mallee wood under slow-heating conditions. Energy Fuels 2009, 23, 4174–4181.
32. Antal, M., Jr.; Croiset, E.; Dai, X.; DeAlmeida, C.; Shu-Lai Mok, W.; Norberg, N. High-yield
biomass charcoal. Energy Fuels 1996, 10, 652–658.
33. Ertas, M.; Alma, M. Pyrolysis of laurel (Laurusnobilis L.) extraction residues in a fixed-bed
reactor: Characterization of bio-oil and bio-char. J. Anal. Appl. Pyrolysis 2010, 88, 22–29.
34. Sukiran, M.; Kheang, L.; Bakar, N.; May, C. Production and characterization of bio-char from the
pyrolysis of empty fruit bunches. Am. J. Appl. Sci. 2011, 8, 984–988.
35. Federal Energy Management Program (FEMP). Biomass Cofiring in Coal-Fired Boilers; Federal
Technology Alert DOE/EE-0288; U.S. Department of Energy, Energy Efficiency and Renewable
Energy: Washington, DC, USA, 2004.
36. Tillman, D. Biomass cofiring: The technology, the experience, the combustion consequences.
Biomass Bioenergy 2000, 19, 365–384.
37. Demirbas, A. Sustainable cofiring of biomass with coal. Energy Convers. Manag. 2003, 44,
1465–1479.
38. Lehmann, J. Bio-energy in the black. Front. Ecol. Environ. 2007, 5, 381–387.
39. Laird, D.A. The charcoal vision: A win-win-win scenario for simultaneously producing
bioenergy, permanently sequestering carbon, while improving soil and water quality. Agron. J.
2008, 100, 178–181.
40. Mbagwu, J.; Piccolo, A. Effects of Humic Substances from Oxidized Coal on Soil Chemical
Properties and Maize Yield. In The Role of Humic Substances in Ecosystems and in
Environmental Protection; Drozd, J., Gonet, S.S., Senesi, N., Weber, J., Eds.; Polish Society of
Humic Substances: Wroclaw, Poland, 1997; pp. 921–925.
41. Brodowski, S.; John, B.; Flessa, H.; Amelung, W. Aggregate-occluded black carbon in soil. Eur.
J. Soil Sci. 2006, 57, 539–546.
42. Lehmann, J. Biochar for Environmental Management; Earthscan: London, UK, 2009.
43. McElligott, K. Biochar Amendments to Forest Soils: Effects on Soil Properties and Tree Growth.
MSc Thesis, University of Idaho: Moscow, ID, USA, 2011.
44. Meurisse, R.T. Propoerties of Anidsols Important for Forestry. 1985. In Proceedings, Western
Hemlock Management Conference; Atkinson, W.A., Zozoski, R.T., Eds.; University of
Washington: Seattle, WA, USA, 1976.
45. McElligott, K.; Page-Dumroese, D.; Coleman, M. Bioenergy Production Systems and Biochar
Application in Forests: Potential for Renewable Energy, Soil Enhancement, and Carbon
Sequestration; Research Note RMRS-RN-26; Rocky Mountain Research Station: Moscow, ID,
USA, 2011.
46. Pollard, S.; Fowler, G.; Sollars, C. Low-cost adsorbents for waste and wastewater treatment: A
review. Sci. Total Environ. 1992, 116, 31–52.
47. Teng, H.; Lin, H. Activated carbon production from low ash subbituminous coal with CO2
activation. Mater. Interfaces Electrochem. Phenom. 1998, 44, 1170–1177.
48. Teng, H.; Yeh, T.; Hsu, L. Preparation of activated carbon from bituminous coal with phosphoric
acid activation. Carbon 1998, 36, 1387–1395.
Energies 2013, 6 183
49. Kobya, M.; Demirbas, E.; Senturk, E.; Ince, M. Adsorption of heavy metal ions from aqueous
solutions by activated carbon prepared from apricot stone. Bioresour. Technol. 2005, 96,
1518–1521.
50. Benaddi, H.; Bandosz, T.; Jagiello, J.; Schwarz, J.; Rouzaud, J.; Legras, D.; Beguin, F. Surface
functionality and porosity of activated carbons obtained from chemical activation of wood.
Carbon 2000, 38, 669–674.
51. Azargohar, R.; Dalai, A. Biochar as a precursor of activated carbon. Appl. Biochem. Biotechnol.
2006, 131, 762–773.
52. Evans, M.; Halliop, E.; MacDonald, J. The production of chemically-activated carbon. Carbon
1999, 37, 269–274.
© 2013 by the authors; licensee MDPI, Basel, Switzerland. This article is an open access article
distributed under the terms and conditions of the Creative Commons Attribution license
(http://creativecommons.org/licenses/by/3.0/).