a comparison of international student and american student
TRANSCRIPT

A Comparison of International Student and American Student Engagement
In Effective Educational Practices
Chun-Mei Zhao Research Analyst
National Survey of Student Engagement, Indiana University Bloomington
George D. Kuh Chancellor’s Professor and Director
National Survey of Student Engagement, Indiana University Bloomington
Robert M. Carini Senior Research Analyst
National Survey of Student Engagement, Indiana University Bloomington
The research reported in this paper was conducted with the support from The Pew Charitable Trusts. However, the views expressed in this paper are solely those of the authors, not the Pew Trusts. Special Thanks to Paul Umbach for his help with the project. Direct correspondence to Chun-Mei Zhao, National Survey of Student Engagement. Indiana University Bloomington, Center for Postsecondary Research and Planning, Ashton Aley Hall Suite 102, 1913 E Seventh Street, Bloomington, IN 47405-7510. Telephone: 812.856.2169, Fax: 812.856.5150, e-mail: [email protected].

A Comparison of International Student and American Student Engagement
In Effective Educational Practices
Abstract
Although international students are an important source of diversity on American
college campuses, relatively little is known about their college experiences. This study
examines levels of engagement in effective educational practices of nearly 3,000
undergraduate international students and more than 67,000 of their American counterparts
at 317 four-year colleges and universities. Overall, international students were more
engaged in educationally purposeful activities than American students, especially during
the first year of college. They also reported greater gains in desired outcomes, especially
in personal and social development. In the senior year, however, engagement patterns of
international students and American students converged considerably. The ethnic/racial
background of international students and the proportion of international undergraduates
(density) on a campus evidenced mixed effects on student engagement. Implications for
institutional policy and practice were discussed.

2
A Comparison of International Student and American Student Engagement In Effective Educational Practices
American society is more diverse now than at any previous time (Keller, 2002). It is no
surprise, then, that knowledgeable observers both inside and outside the academy say that an
important goal of higher education is to prepare culturally competent individuals with the ability
to work effectively with people from different backgrounds (Carnevale, 1999; Mori, 2000;
Sandhu, 1995, Smith & Schonfeld, 2000). Promising approaches include creating learning
environments that promote and value diversity, as well as intentionally exposing students to
multiple and sometimes competing perspectives that challenge previously unexamined
assumptions. Such challenges, when imbedded in appropriate pedagogy, can promote high
levels of intellectual and personal development (Astin, 1977, 1993; Chickering & Reisser, 1993;
Keniston & Gerzon, 1972; Kuh, et al., 1991; Sanford, 1962). Thus, diversity on college
campuses is not a gratuitous or idealistic goal; it is essential in order for college students to learn
how to live and work effectively with others who differ from themselves (Gurin, 1999; Smith &
Schonfeld, 2000).
International students constitute an increasingly relevant and important source of
diversity on college campuses. Attending a school enrolling substantial numbers of international
students may advantage American students in the marketplace, to the extent that the experience
increases their culturally sensitivities and skills in working with people from different
backgrounds (Calleja, 2000; Carnevale, 1999). The good news is that more American students
may now be getting these opportunities. In 2001, the total international student enrollment at
colleges and universities in the U.S. was nearly 550,000, a 6.4% increase over 2000 and the
biggest single year jump in 20 years (Institute of International Education, 2002). International
3
students represent almost 5% of all students (Department of Education, 2001). About 237,000
are undergraduates, almost 3% of the total number of undergraduates in the U.S. (U. S. News
and World Report, 2000). Asian students comprise over half (56%) of all international
enrollments, followed by students from Europe (14%), Latin America (12%), the Middle East
(7%), Africa (6%), and North America and Oceania (5%) (Institute of International Education,
2002).
Although U.S. colleges and universities enroll more international students than any other
country in the world (U. S. News and World Report, 2000), most of what is reported in the
literature about their experiences emphasizes the transition challenges they face in adapting to a
new, foreign living and learning environment. Most international students report some degree of
culture shock when they arrive and begin their studies (Furnham, 1988; Olaniran, 1996, 1999;
Selvadurai, 1992; Thomas & Althen, 1989) typically manifested as stress, anxiety, and feelings
of powerlessness, rejection and isolation (Oberg, 1960). Being exposed to new values, attitudes
and behavior patterns is not necessarily debilitating, however; indeed, the experience can be
transformative. In fact, some research shows that international students seem to be able to cope
relatively well when faced with other stressful life events (Leong, Mallinckrodt, & Krolj, 1990;
Parr, 1992).
Friendship networks seem to be a critical factor in how well international students deal
with stress (Furnham & Alibhai, 1985). Those who have a strong social support system tend to
more quickly and effectively adjust to college life in their host country (Al-Sharideh & Goe,
1998; Boyer & Sedlacek, 1988; Schram & Lauver, 1988). International students indicate a
stronger preference for making friends from the same country or students from other nations over
students from the host county (Bochner, et al., 1977; Furnham & Alibhai, 1985). At the same
4
time those international students who do cultivate friendships with American students tend to
adapt and adjust more easily (Bochner, et al., 1977; Furnham & Alibhai, 1985).
Becoming accepted into an affinity group that offers social support is much more difficult
for international students if few students are from their country or global region. Moreover,
adapting to customs and mores of American society and campus life may conflict with aspects of
the personal and cultural identity of students from other countries (Furnham & Alibhai, 1985).
As a result, they are more likely to report feeling isolated and lonely, which can escalate into
severe depression (Dillard & Chisolm, 1983; Mori, 2000; Owie, 1982; Schram & Lauver, 1988).
This, in turn, may have a dampening influence on their participation in activities that contribute
to important learning and personal development outcomes of college. One common coping
mechanism is to focus more on academic achievement (Chu, Ye, Klein, Alexander, & Miller,
1971; Dozier, 2001).
While it is plausible that international students channel their efforts toward academics to
compensate for what may be a less than satisfying social life, the literature is silent on the extent
to which they engage in other effective educational practices -- activities that decades of research
show are associated with high levels of learning and personal development (Chickering &
Gamson, 1987; Ewell & Jones, 1993; 1996). In fact, relatively little is known about the extent to
which international students are satisfied with their experience, interact with peers and faculty
members, and participate in a variety of other educationally purposeful activities. Faculty
members, academic and student life administrators, and institutional researchers need more
information about what international students do in college in order to know whether and where
to intervene to improve their experience and, in the process, enhance the quality of
undergraduate education for all students.
5
Purpose of the Study
This study focuses on the extent to which international students engage in effective
educational practices. Specifically, we compare the activities of international undergraduate
students with American students in selected areas that research shows is related to student
learning, personal development, and satisfaction with college, including the degree to which they
perceive their campus to be supportive of academic and social needs. We also examine their
self-reported gains in three domains: personal and social development, general education, and
job-related skills.
Three questions guided the study:
1. To what extent are international students engaged in effective educational practices
compared with their American counterparts? For example, how much do the two
groups read and write, study, interact with faculty members and peers, engage in
diversity related activities, and so forth?
2. Does the ethnic background of international students shape student engagement,
satisfaction, and gains?
3. Does the relative “density” of international students (i.e., the proportion of
international students on a campus) affect how international and American students
spend their time and the extent to which are satisfied and make progress toward
desired outcomes?
Methods
Instrument and Data Source
The College Student Report (Kuh, 2001a) was developed specifically for the National
Survey of Student Engagement (NSSE), an annual survey of first-year and senior students

6
designed to measure the degree to which students participate in educational practices that prior
research shows are linked to valued outcomes of college (Chickering & Gamson, 1987; Kuh,
2001b). Many of its 69 items have been employed in other collegiate surveys such as the
College Student Experiences Questionnaire (CSEQ) and UCLA’s Student Information Form (the
CIRP survey of first-year students). The College Student Report measures student experiences
on several dimensions: (1) involvement in different types of in-class and out-of-class activities,
(2) amount of reading and writing, (3) participation in selected educational programs, such as
study abroad, internships and senior capstone courses, (4) perceptions of the campus
environment including the quality of students’ relationships with peers, faculty members, and
administrators, and (5) student satisfaction with academic advising and their overall collegiate
experience. In addition, students estimate their educational, personal, and social growth and
development in selected areas since starting college and provide background information, such
as their sex, age, race/ethnicity, enrollment status, living arrangements, and major field. The
psychometric properties of the survey instrument are discussed in detail by Kuh (2002) and Kuh,
Hayek, Carini, Ouimet, Gonyea and Kennedy (2001).
The data used in this study were gathered in spring 2001 from 317 four-year colleges and
universities. The final sample of first-year and senior students (n=175,000) was randomly
selected by the Indiana University Center for Survey Research which administers the NSSE
survey. The participating institutions mirror the universe of four-year colleges and universities
with respect to institutional type (as defined by the 2000 Carnegie Classification), sector, region
and urbanicity (National Survey of Student Engagement, 2001). The NSSE survey was
administered from late February through early June using both Web-based and paper surveys.

7
The overall average adjusted response rate was 42 percent. NSSE did not provide incentives for
survey completion.
The large sample scale afforded a rare opportunity to learn about the experiences of a
group of students who typically comprise a very small fraction of the student body on most
campuses. Almost all (97.2% or 308) of the 317 schools had international student respondents.
Of the 71,260 first year and senior undergraduate students who completed the survey at these
institutions, about 4%, or 2,780, identified themselves as international students. This compares
favorably with the percentage reported by the U.S. Department of Education (2001). Of this
group, 47% were first-year students and 53% were seniors, and 43% were males and 57% were
women. Additional information about the biographical characteristics of the respondents
(including ethnic background) is presented in Table 1.
[Insert Table 1 about here]
Variable Specification and Analytic Strategy
We employed 8 measures of student engagement and 4 measures of selected student self-
reported outcomes using combinations of 51 items. The 12 measures represent academic
challenge, active and collaboration learning, student-faculty interaction, supportive campus
environment, diversity experiences, community service, computer technology use, time spent
socializing and relaxing, and student-reported gains in general education, personal and social
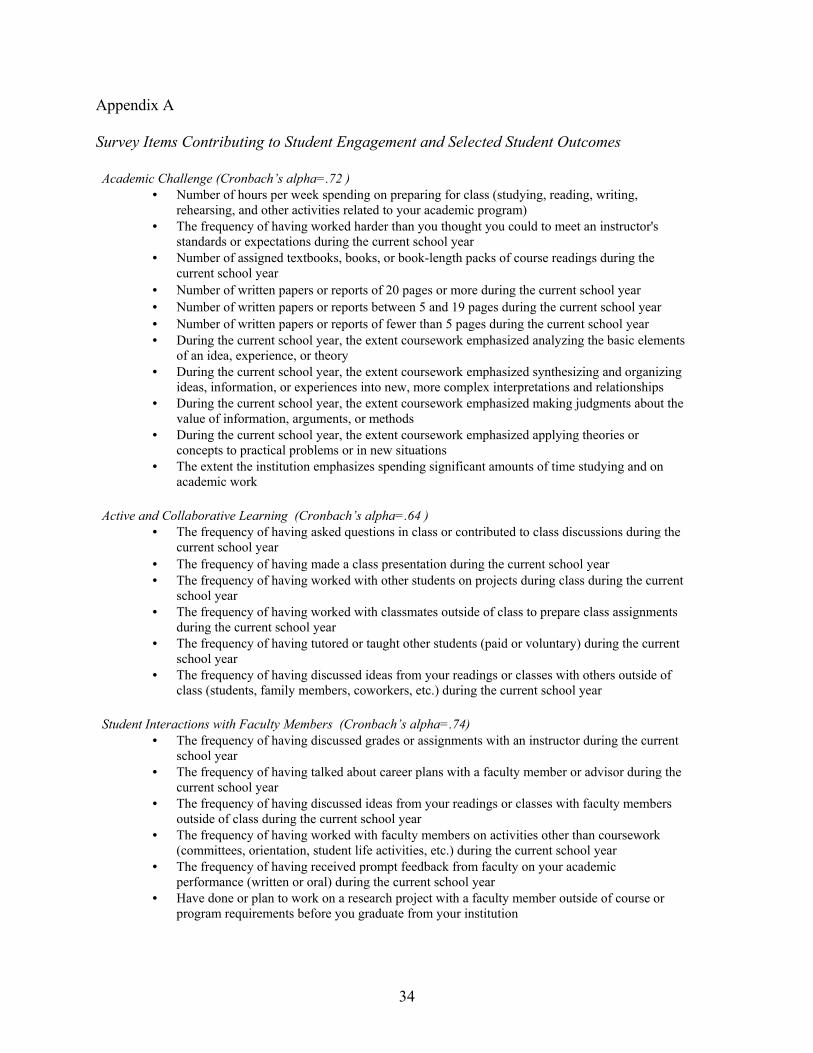
development, job-related skills, and student satisfaction. Appendix A contains the items from
8
the NSSE survey that contributed to the 12 scales along with their internal reliabilities
(Cronbach’s alpha).1
The dependent variables are the 12 engagement scales. The independent variable is
international student status type (coded as 1=international student, 0=American student).
Control variables included student’s sex, race/ethnicity, major, residential status, enrollment
status, age, and parents’ education, and the institution’s Carnegie classification, total
undergraduate enrollment, Barron’s selectivity rating, and sector (private vs. public).
We analyzed the data separately for first-year and senior students because other research
indicated that these two groups have distinctly different behavioral patterns (Feldman &
Newcomb, 1969; Pascarella & Terenzini, 1991). We first examined international students’
responses to the 12 scales. Then, we used t-tests to see if the experiences of international students
differed from American students on the scales. We computed effect sizes to gauge whether the
magnitudes of mean differences were substantively important as well as statistically significant.
Effect sizes were calculated by dividing each mean difference by the pooled standard deviation
of the two comparison groups (Cohen, 1988; Greenwald, Hedges, & Laine, 1996; Light &
Pillemer, 1982; Pascarella, Flowers, & Whitt, 2001). Various guidelines have been proposed for
interpreting the magnitude of effect sizes (Alexander & Pallas, 1985; Cohen, 1988; Rosenthal &
Rosnow, 1984). As suggested by some researchers, we considered an effect size of less than .10
to be substantively trivial, meaning the differences are too small to warrant consideration in
making policy decisions (Alexander & Pallas, 1985; Rosenthal & Rosnow, 1984). In this study,
an effect size larger than 0.10 was thought to be practically important and worthy of attention.
1 All scales were created by equally weighting, and then summing responses to appropriate items. Scales for academic challenge and student-faculty interaction were comprised of items with different response sets; we equalized the minimum and maximum responses for each contributing item prior to creating each these scales.

9
We then employed a series of regression analyses to contrast the scores of the two groups
to account for the influence of potentially confounding background characteristics that other
studies suggest could affect student engagement and satisfaction (Astin, 1993; Pascarella &
Terenzini, 1991). Considering that our data consisted of students nested within institutions, we
conducted regression analyses using both multilevel modeling and ordinary least squares (OLS)
techniques. Where these techniques yielded similar patterns, we present the more familiar OLS-
generated results. We provided y-standardized coefficients (the unstandardized regression
coefficient divided by the pooled standard deviation) as effect sizes for the OLS Models
(Greenwald, Hedges, & Laine, 1996; Light & Pillemer, 1982; Pascarella, Flowers, & Whitt,
2001).
Moreover, we used multilevel modeling to estimate the effects of international student
density (the proportion of international students at each institution) on student engagement. In
this analysis we examined the intercept terms to determine if an increase in international student
density affected student engagement. In particular, we modeled the intercept term to examine
how density might be linked to adjusted institutional engagement means. In other words, we
tested whether an increase in institutional density was associated with a change in institutional
engagement.
Results
T-Test Comparisons
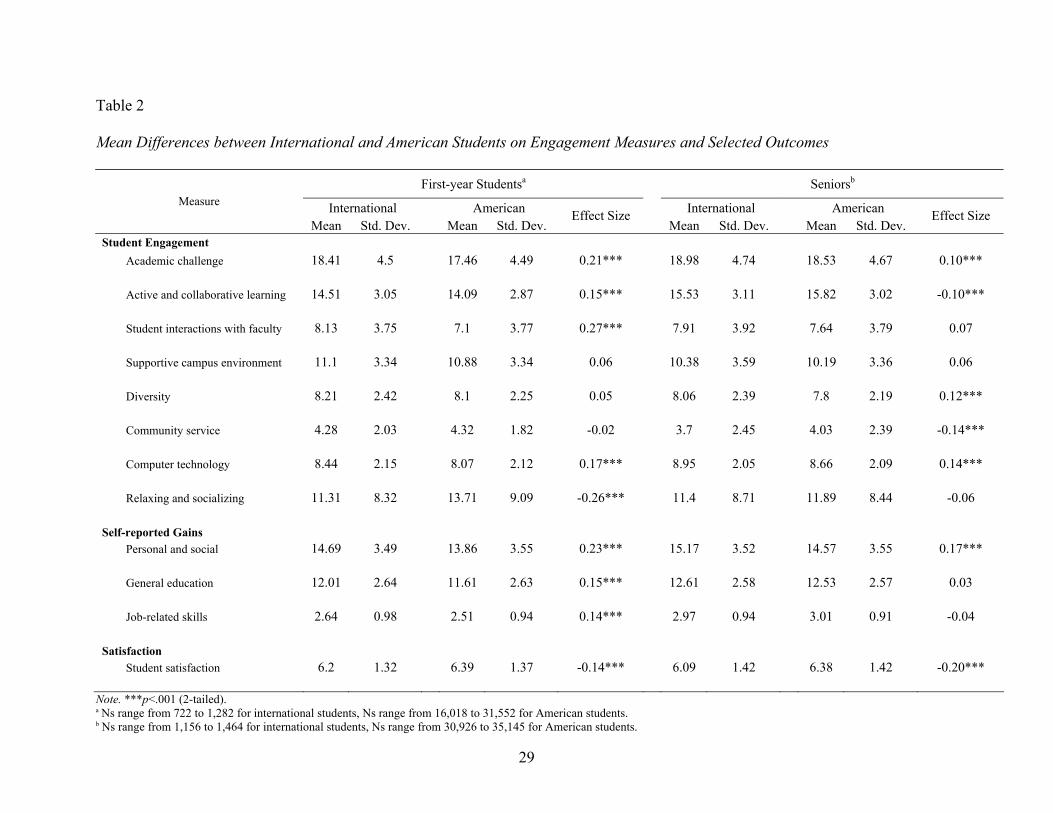
The independent t-tests indicated that international first-year students scored higher than
their American counterparts on level of academic challenge, active and collaborative learning,
student-faculty interaction, and technology use (Table 2). They also reported making more
progress in personal and social development, general education, and job-related skills. However,
10
first-year international students spent less time relaxing and socializing, and were less satisfied
compared with American students.
[Insert Table 2 about here]
Compared with Americans, senior international students were more engaged in academic
work, used technology more frequently, and participated more frequently in diversity-related
activities. They also reported greater gains in the personal and social development domain.
They were not, however, as engaged in active and collaborative learning and community service
and -- like first-year international students – were less satisfied with their overall college
experience. The one striking difference between first-year and senior international students was
that seniors were comparable to their American counterparts in the amount of time they spent
relaxing and socializing.
Multivariate OLS Regression
Table 3 presents the summary of OLS regression models. The independent variable is
international student status and the dependent variables are the engagement, student gain and
satisfaction scales. The results show that after controlling for student-level and institutional level
characteristics the basic patterns of engagement of international students were consistent with
those revealed by the t-tests. That is, first-year international students had significantly higher
engagement scores in the following areas: academic challenge, student-faculty interaction, and
computer technology use. They also reported greater gains in two of the major outcome domains
-- personal and social development and general education gains. Finally, as the t-tests showed,
they spent considerably less time socializing and relaxing compared with American first-year
students. However, after full controls were introduced, international students did not differ from
American students in their satisfaction with college.

11
[Insert Table 3 about here]
Most of the differences between senior international students and American students
based on the t-tests comparisons disappeared after the controls were introduced. Even then,
though, senior international students reported higher gains in personal and social development
and general education and were less engaged in community service.
Interactions between International Status and Race/Ethnicity
It is possible that the observed differences between international and American students
do not hold for all races and ethnicities. To test the robustness of the international status effects
among different races/ethnicities, we examined interactions between international status and
different races/ethnicities in supplementary analyses. We found that the international status
effects reported in Table 3 generally held for different groups; that is, Asians, Blacks, Latino/as,
and Whites. An exception involves Asian students, wherein Americans scored higher than
internationals on diversity and lower on relaxing and socializing.
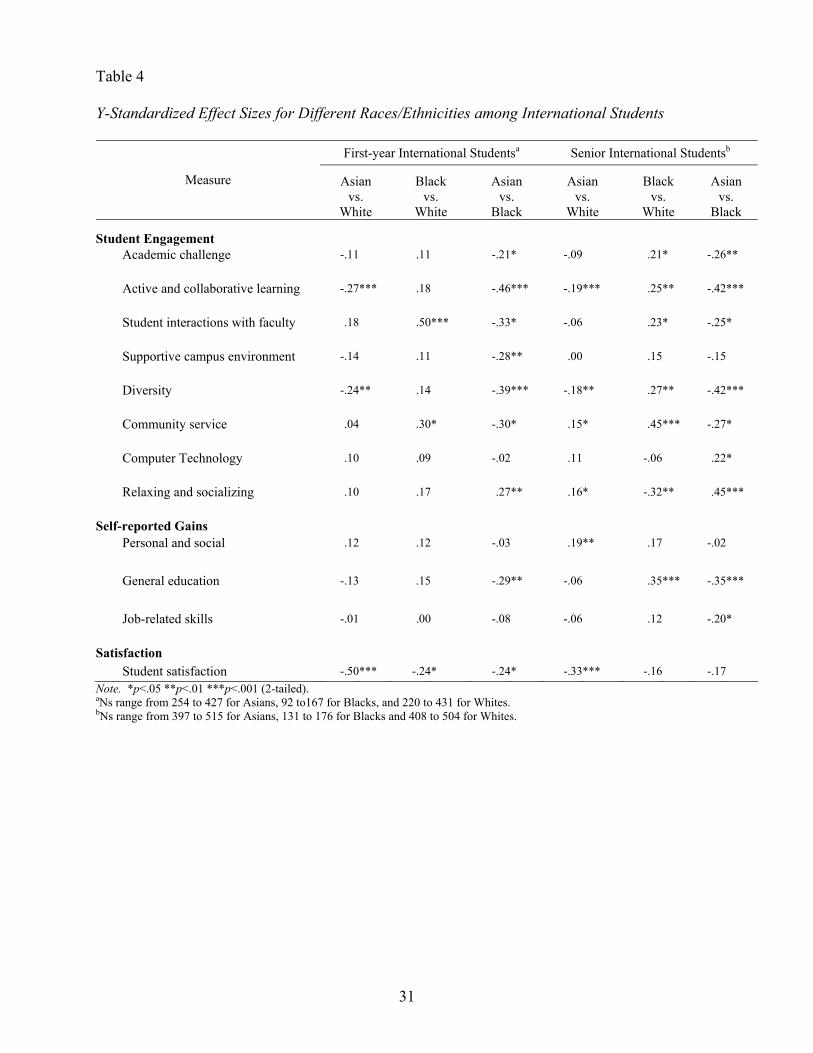
Differences among international students by race and ethnicity.
Considering that college attendance is likely experienced and interpreted differently by
international students depending on their national origin and culture, we examined whether
engagement and educational outcomes of international students differed by race/ethnicity. We
treated international student race/ethnicity as a proxy for their region of origin and cultural
environment. Only those racial/ethnic groups that had a reasonable number of international
student respondents were considered: Asian, White, and Black. The results are reported in Table
4.
[Insert Table 4 Here]

12
Generally speaking, the engagement patterns for a particular race were consistent for both
first-year and senior international students. That is, Asian international students were less
engaged in active and collaborative learning and diversity related activities compared to White
and Black international students. They were also less satisfied with the quality of their campus
environment than the other two groups. Conversely, Black students were more engaged than
Asians across multiple aspects of engagement activities except for computer technology and
relaxing and socializing. Blacks also reported more gains in general education and had higher
levels of satisfaction than Asian students.
Compared with Whites, Black international students’ engagement level differed by class.
In the first year, Blacks were generally compatible to Whites, except for interacting more
frequently with faculty members and performing more community service; in the senior year,
however, Blacks students had higher engagement scores than Whites in almost all areas except
for supportive environment, computer technology, and relaxing and socializing. White senior
international students spent more time relaxing and socializing than Blacks.
Does Density Matter?
Given the importance of satisfying social relations to student success and the generally
positive engagement pattern of international students, we examined whether the proportion of
undergraduates who were international students on a campus -- international student density –
influenced the overall level of student engagement at a school. Density data were obtained from
the Integrated Postsecondary Education Data System (IPEDS) Fall 98 enrollment data file. The
density of the international students ranged from 0% to 32% for the 317 institutions. The mean
density of international students was about 2.4% for first-year students and 2.8% for seniors2.
_________________
2 The density median is 1.6% for first-year students and 1.8% for seniors.

13
The vast majority (95 percent) of the institutions had less than eight percent international
students in their populations. Such limited variability on the variable complicated the task of
finding effects associated with changes of only a few percentage points over an entire student
body. Because the international student density variable was dramatically skewed in the positive
direction we tested several different functional forms to represent the international student
density variable. We first fitted a series of eight dummy variables that divided the density into
different ranges; with some minor fluctuations, we found evidence of general trend that can be
modeled with a natural logarithm distribution. Therefore, we did the natural log transformation
of density to dampen the effects of the few outlying schools that had more than 20 percent
international students.
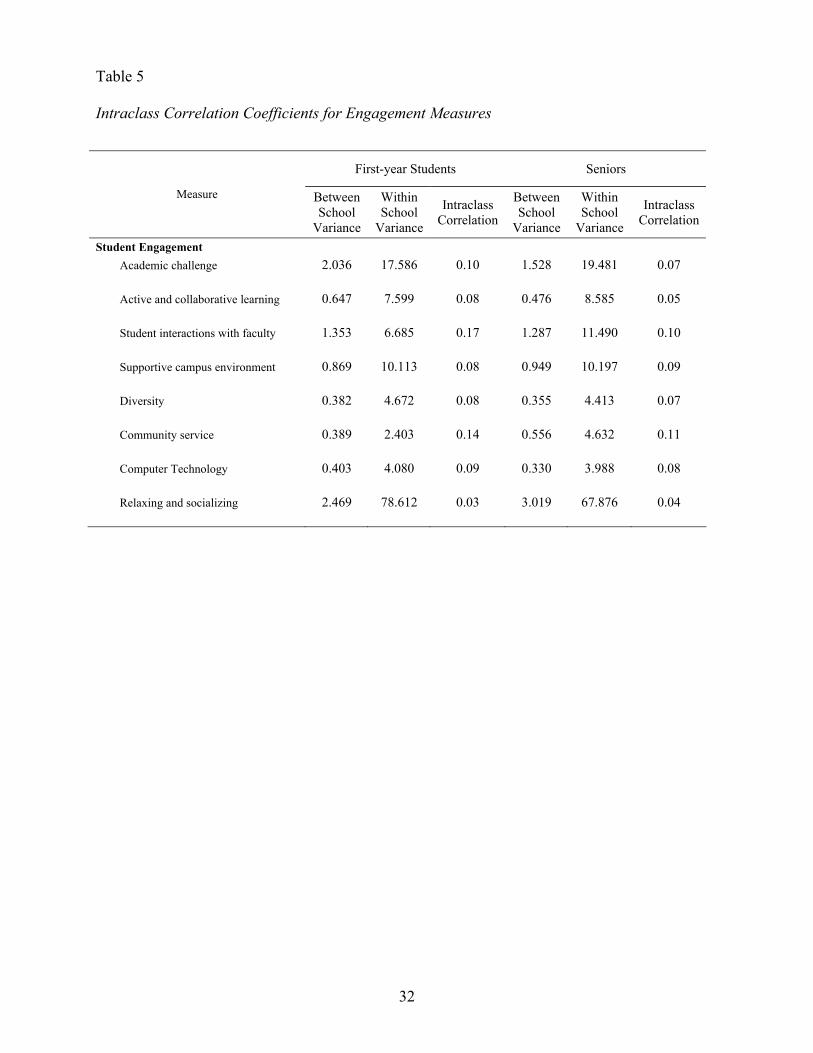
The transformed density variable is approximately normally distributed. Supplementary
analyses showed that a linear specification of density variable yielded similar patterns to those
specified with natural logarithm transformation. We introduced the transformed density variable
into the multi-level models. Table 5 presents the intraclass correlations of the engagement scale,
i.e., the proportion of variance explained by between-institution variables. In our study, the
institutional level variables explained 3% to 17% overall variance for first-year students and 4%
to 11% for seniors. This small amount of variance explained by between-institution variables is
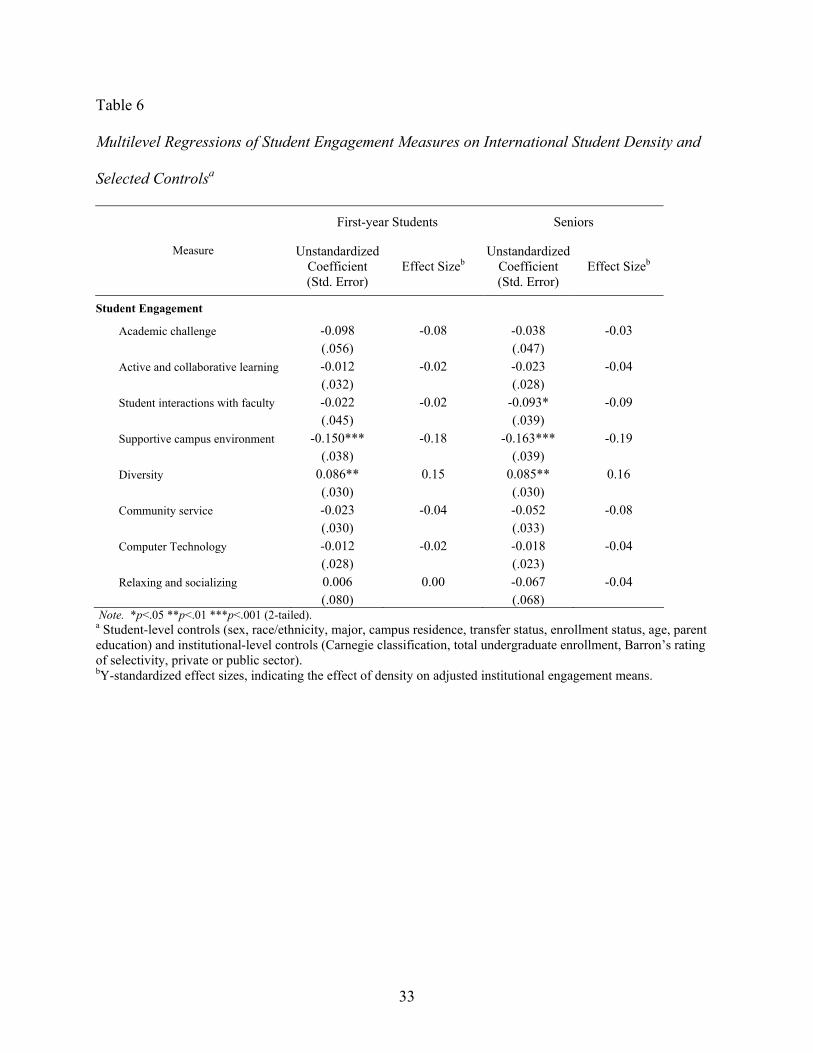
not unusual (Pascarella & Terenzini, 1991). Table 6 presents multilevel regression coefficients
and effect sizes of the density of international students regressed on the student engagement
scales.
[Insert Tables 5 and 6 about here]
As expected, international student density had positive effects on diversity-related
experiences. In fact, both first-year and senior international students reported more diversity-

14
related activities as the percentage of international students on campus increased. One
inexplicable finding was that the greater the density of international students, the lower the
institution’s score on the NSSE supportive campus environment benchmark. In supplementary
analyses (not shown in tabular form) of international and American students separately, density
had essentially the same effects on engagement for both groups.
Limitations
This study has several limitations. First, although the institutions from which the student
sample is drawn are generally representative of the universe of four-year colleges and
universities, schools that administer the NSSE elect to do so. If students from other schools were
included the results might differ in some unknown ways.
Second, the only pre-college variable we were able to take into account in the analyses
was parental education level. Motivation, language proficiency, and academic preparation may
also affect the college experiences of both international and American students.
Third, although finding good fitting prediction models is not the purpose of this study, the
models employed in the study have relatively low R-square; that is, the independent variables
and the control variables together only explained a small portion of the variances of engagement
measures. There might be other variables that have significant effect on engagement activities
and are not included in the models.
Finally, international students from different cultures and nations may differ in ways that
also affect student engagement. Other research suggests that international students from
countries with cultures that are somewhat similar to the host culture tend to adapt more easily
compared with students who come from very different cultural backgrounds (Gudykunst &
Hammer, 1988; Olaniran, 1988). Also, European students and non-European students differ in
15
their adaptation, acculturation and satisfaction to the college experience when studying in foreign
countries (Sam, 2001; Schram & Lauver, 1988). Unfortunately, we did not have specific
information about students’ country of origin in order to examine this issue. We explore the
possibility of differences within the international student respondent group further using
international student racial/ethnic background as a proxy for region of origin. Though we found
some differences among international students by race/ethnicity, international status effects on
student engagement patterns reported earlier were generally robust within different racial/ethnic
groups (interaction effect). The lone exception was for Asian students and diversity experiences.
Perhaps the Asian student culture of orientation is inherently more sociable with people within
the same cultural group compared with people from other cultural groups or American students.
This view is consistent with previous research on international student friendship network
patterns (Furnham & Alibhai, 1985). Further study needs to be done to explore the group
differences within the international student population.
Discussion
The findings from this study indicate that international students are more engaged in
some areas than American students – particularly in the first year of college – and less engaged
in others. First-year international students surpassed their American counterparts in level of
academic challenge, and student-faculty interaction. They also reported greater gains across the
board in personal and social development and general education. In addition, consistent with
other studies (Scott, 1997), first-year international students used computer technology more
frequently in course learning activities. Channeling their energies and efforts through
technology into academic work is one area over which international students have some control
and can immediately experience success (Chu, at al., 1971; Dozier, 2001). It is also possible
16
international students are more comfortable and confident using computer technology, both for
preparing class assignments as well as for communicating with their instructors and other
students. Although technology may help ease the transition to the American college campus, it
may also play a part in social isolation if it substitutes for face-to-face interaction (Parr, 1992).
That is, international students may use technology instead of talking directly to peers or
instructors to avoid embarrassing exchanges created by language barriers and unfamiliarity with
cultural idiom. Perhaps one explanation for why technology use decreases over time is that
students have more face-to-face interaction with peers through socializing and, thus, use
technology less for that purpose.
By their senior year, the international students who are still enrolled tend to be more
adapted to the cultural milieu and generally do not differ from American seniors in their patterns
of student engagement, including time spent socializing and relaxing. There are two notable
exceptions. The first is community service, an activity that may not have clear definition to
many international students. That said, creative programs targeted to issues that concern
international students might be seen as attractive, particularly if “community” is defined in
global terms. Another exception is in the area of personal and social development and general
education gains where international students report making more progress than American
students. This is not surprising, certainly, as living in a foreign land presents continual
challenges to virtually every aspect of one’s personhood.
Because international students devote more effort to academics it would seem that a
critical mass of international students on campus would have uniformly positive effects on other
aspects of student engagement including perceptions of the campus environment. With regard to
diversity-related activities, this is the case as both international students and American students
17
report more experience with diversity as the proportion of international students on campus
increases. But for some reason, as the proportion of international students increases both groups
perceive their campus to be less, not more, supportive. This is counterintuitive, especially for
American students. Perhaps international students perceive their campus as less supportive as
density increases because of negative amplification (Weick, 1979), a situation where focusing on
a disappointment in the company of others leads to interpreting other generally neutral or
ambiguous aspects of a group’s experience also as disappointing or frustrating. That is, when
more international students are present they are more likely to have friends with similar interests
with whom they talk openly about their experiences at the institution. There are many ways
colleges and universities can disappoint or frustrate students; the longer one is in school, the
more likely it is to encounter difficulties in registering for classes, to get parking tickets, to have
trouble seeing an advisor, and so forth. Such disappointments and frustrations are more likely to
be expressed and, perhaps, grow in magnitude (even out of proportion) when students hear their
peers saying similar things. Why American students react in the same way is more puzzling and
warrants additional research.
Implications
The findings of this study have four immediate implications for higher education policy
and practice. First, institutional researchers, assessment teams, and others who share
responsibility for monitoring the quality of student life should determine the extent to which the
international student experiences on their campus are similar to, or differ from, these findings.
Different mixes of students, curricular requirements, and campus cultures could produce varying
patterns of engagement that deviate from the results of this study. In addition, given the limited
amount of research on the experiences of international students, many other instructive questions
18
could be asked. For example, do certain types of early socialization activities (e.g., special
intensive orientation sessions, summer bridge programs) facilitate a successful transition to study
in the U.S.? Are certain housing arrangements more conducive to satisfactory adjustment, such
as pairing students from the same country as roommates or assigning them to the same building?
Do international students and American students benefit equally from these or other
interventions?
Second, a campus cannot simply recruit a critical mass of international students; it must
also intentionally arrange its resources so that international and American students benefit in
desired ways from one another’s presence. On the one hand, increasing the number of
international students on campus makes it more likely that students from different parts of the
world can find peers with similar backgrounds and interests, allowing them to more readily form
affinity groups that are the foundation for a social support system. However, simply increasing
the number of international students will not necessarily enhance the quality of many aspects of
the undergraduate experience, as shown by the research on structural diversity (Chang, 2002;
Gurin, 1999). Thus, any effort to increase the numbers of international students on a campus
must also be accompanied by programs and services that induce these students and their
American counterparts to engage with one another as well as in other educationally purposeful
activities.
Third, the potentially negative effects of both high and low density should be further
investigated and monitored by campus officials who work with international students. Low
density may contribute to social isolation and an over-compensation on academics. High density
could contribute to an inordinate amount of socializing by members of some groups which can
have an adverse affect on academic performance. Helping international students achieve the
19
appropriate balance is the goal. Research on international student friendship patterns suggests
that international students prefer friends who are from the same country or region of the world,
even though socializing with American students tends to enrich the overall quality of their
experience (Furnham & Alibhai, 1985; Gudykunst & Hammer, 1988). Additional studies are
needed to understand how and why density affects student engagement on campuses, especially
the counter-intuitive finding that campuses with high proportions of international students are
viewed as less supportive by all students.
Finally, additional research is needed to determine the factors that contribute to Asian
students spending more time socializing and less time participating in diversity-related college
activities compared with their counterparts from other countries. One possible explanation for
this behavior is that Asian students come from cultures where spending time with friends is
highly valued (Furnham & Alibhai, 1985). But why they interact less with people from other
backgrounds and cultures is not clear.
Assuming institutions view these as legitimate concerns, faculty members could be
encouraged to promote the mingling of Asian international students with students of different
cultures or backgrounds in group study and collaborative projects. Student affairs personnel
might focus on designing programs and activities to bring Asian students into contact with
students from other backgrounds. Most campuses, for example, sponsor celebrations of different
cultures. Special efforts could be made to involve leaders from the Asian student community
and organizations to be involved in the planning of such events and to use their social influence
to encourage their Asian peers to participate.

20
Conclusion
The results of this study reveal previously unknown aspects of the undergraduate
experience of international students, including their engagement in activities that contribute to
high levels of learning and personal development. With some exceptions, international students
generally are more engaged in educationally purposeful activities than their American
counterparts, especially in the first year of college. They also report gaining more in areas that
represent desired outcomes of college. By the senior year, international students are more like
American students in terms of their engagement patterns.
Faculty members and academic and student affairs administrator can use the findings of
this study to better understand, advise, and assist international students in making a successful
transition to college life in the U.S. and finding ways to encourage them to get involved in a
range of educationally productive activities that help them attain their educational goals in a
satisfying manner. In addition, institutions with large numbers of international students should
systematically assess the experiences of various subgroups of international students, such as
Asian students, to be sure that they are investing an appropriate amount of time and energy in
educationally purposeful activities.

21
References
Alexander, K. L. & Pallas, A. M. (1985). School sector and cognitive performance: When is little
a little? Sociology of education, 58(2), 115-128.
Al-Sharideh, K. A. & Goe, W. R. (1998). Ethnic communities within the university: An
examination of factors influencing the personal adjustment of international students.
Research in higher education, 39(6), 1998.
Astin, A. W. (1977). Four critical years. San Francisco: Jossey-Bass.
Astin, A.W. (1991). Assessment for excellence: The philosophy and practice of assessment and
evaluation in higher education. New York: American Council of Education/Macmillan.
Astin, A. W. (1993). What maters in college? Four critical years revisited. San Francisco:
Jossey-Bass.
Boyer, S., & Sedlacek, W. (1988). Noncognitive predictors of academic success for international
students: A longitudinal study. Journal of college student development, 29, 218-223.
Calleja, D. (2000). The world at your door. Canadian business, 73(20), 108-111.
Carnevale, A. P. (1999). Diversity in higher education: Why corporate America cares. Diversity
digest. Washington, DC: Association of American Colleges and Universities.
Chang, M. J. (2002). Preservation or transformation: Who’s the real educational discourse on
diversity? Review of higher education, 25(2), 125-140.
Chickering, A.W., & Gamson, Z.F. (1987). Seven principles for good practice in undergraduate
education. AAHE Bulletin, 39(7), 3-7.
Chickering, A.W., & Reisser, L. (1993). Education and identity (2nd ed.). San Francisco: Jossey-
Bass.
22
Chu, A. M., Yeh, E.K., Klein, N.A., Alexander, A.A., & Miller, M.A. (1971). A study of
Chinese students’ adjustment in the U.S.A. Acts psychological Taiwanica, 13, 206-218.
Cohen, J. (1988). Statistical power analysis for the behavior sciences, 2nd ed. Lawrence
Erlbaum Associates: Hillsdale, New Jersey.
Das, A.K., Chow, S.Y., & Rutherford, B. (1986). The counseling needs of foreign students.
International journal for the advancement of counseling, 9, 167-174.
Digest of Educational Statistics. (2001). National Center for Education Statistics, U.S.
Department of Education. http://nces.ed.gov/pubs2002/digest2001/tables/dt207.asp.
Dillard, J. M. & Chisolm, G. B. (1983). Counseling the international students in a multicultural
context. Journal of college student personnel, 24, 101-105.
Dozier, S. B. (2001). Undocumented and documented international students. Community college
review, 29(2), 43-54.
Ewell, P. T., & Jones, D. P. (1993). Actions matter: The case for indirect measures in assessing
higher education’s progress on the national education goals. Journal of general
education, 42, 123-148.
Ewell, P. T., & Jones, D. P. (1996). Indicators of “good practice” in undergraduate education:
A handbook for development and implementation. Boulder, CO: National Center for
Higher Education Management Systems.
Feldman, K. & Newcomb, T. (1969). The impact of college on students. San Francisco: Jossey-
Bass.
Furnham, A. & Alibhai, N. (1985). The friendship networks of foreign students: A replication
and extension of the functional model. International journal of psychology, 20(6), 709-
722.
23
Furnham, A. (1988). The adjustment of sojourners. In Y. Y. Kim & W. B. Gudykunst (Eds., pp.
42-61), Cross-cultural adaptation: Current approaches. Newbury Park, Beverly Hills,
London, New Delhi: Sage.
Greenwald, R., Hedges, L. V., & Laine, R. D. (1996). The effect of school resources on student
achievement. Review of education research, 66, 361-396.
Gudykunst, W. B., & Hammer, M. R. (1988). Strangers and hosts: An uncertainty reduction
based theory of international adaptation. . In Y. Y. Kim & W. B. Gudykunst (Eds., pp.
106-139), Cross-cultural adaptation: Current approaches. Newbury Park, Beverly Hills,
London, New Delhi: Sage.
Gurin, P. (1999). Expert report of Patricia Gurin. Gratz et al v. Bollinger, et al., No. 97-75321 (E.
D. Mich) and Grutter et al., V. Bollinger, et al., No. 97-75928 (E. D. Mich). The
compelling need for diversity in higher education. [Online] Available:
http://www.umich.edu/~urel/admissions/legal/expert/gurintoc.html
Institute of International Education. http://www.iie.org
Keller, G. (2001). The new demographics of higher education. Review of higher education,
24(3), 219-235.
Keniston, K. & Gerzon, M. (1972). Human and social benefits. In L. Wilson & O. Mills (Eds),
Universal higher education. Washington DC: American Council on Education, 1972.
Kuh, G.D. (2001a). The National Survey of Student Engagement: Conceptual Framework and
Overview of Psychometric Properties. Indiana Postsecondary Research and Planning.
[On-line]. Available: www.indiana.edu/~nsse.
Kuh, G.D. (2001b). Assessing what really matters to student learning: Inside the National Survey
of Student Engagement. Change, 33(3), 10-17, 66.
24
Kuh, G.D., Hayek, J.C., Carini, R.M., Ouimet, J.A., Gonyea, R.M., & Kennedy, J. (2001). NSSE
technical and norms report. Bloomington, IN: Indiana University Center for Postsecondary
Research and Planning.
Kuh, G.D., Schuh, J.S., Whitt, E.J., & Associates. (1991). Involving colleges: Successful
approaches to fostering student learning and personal development outside the
classroom. San Francisco: Jossey-Bass.
Ladd, P. & Ruby, R. (1999). Learning style and adjustment issues of international students.
Journal of education for business, 74(6), 363-67.
Leong, F. T. L., Mallinckrodt, B., & Krolj, M. M. (1990). Cross-cultural variations in stress and
adjustment among Asian and Caucasian graduate students. Journal of multicultural
counseling and development, 18, 19-28.
Light, R. & Pillemer, D. (1982). Numbers and narrative: Combining their strengths in research
reviews. Harvard educational review, 52, 1-26.
Lin, J., & Y. J. K. (1997). Asian international students’ adjustment: Issues and program
suggestions. College student journal, 31, 473-479.
Mori, Sakurako (2000). Addressing the mental health concerns of international students.
Journal of counseling & development, 78, 137-144.
Oberg, K. (1960). Cultural shock: Adjustment to new cultural environment. Practical
anthropology, 7, 197-182.
Olaniran, B. A. (1996). Social skills acquisition: A closer look at foreign students on college
campuses and factor influencing their level of social difficulty in social situations.
Communication studies, 47, 72-88.
Olaniran, B. A. (1999). International teaching assistants (IGTA) workshop as seen from an eye
witness perspective. College student affairs journal, 18(2), 56-71.

25
Owie, I. (1982). Social alienation among foreign students. College student journal, 16, 163-165.
Parr, G., and Others. (1992). Concerns and feelings of international students. Journal of college
student development, 33(1) 20-25.
Pascarella, E. T., Flowers, L. & Whitt, E. J. (2001). Cognitive effect of Greek affiliation in
college: Additional evidence. NASPA Journal, 38, 280-301.
Pascarella, E. R., & Terenzini, P.T. (1991). How college affects students: Findings and insights
from twenty years of research. San Francisco: Jossey-Bass.
Rosenthal, R. & Rosnow, R. L. (1991). Essentials of behavioral research: Methods and data
analysis (2nd ed.). New York: McGraw Hill.
Sam, D. L. (2001). Satisfaction with life among international students: An exploratory study.
Social indicators research, 53(3), 315-337.
Sandhu, D. S. (1995). An examination of the psychological needs of the international students:
Implication for counseling and psychotherapy. International journal for the advancement
of counseling, 17, 229-239.
Sanford, N. (1962). The American college: A psychological and social interpretation of the
higher learning. New York, Wiley.
Schram, J. L. & Lauver, P. J. (1988). Alienation in international students. Journal of college
student development, 29, 146-150.
Scott, N. A. (1997). Student success: Serving international students in an age of technology. In
caring in an age of technology. Proceedings of the 6th international conference on
counseling in the 21st century. Beijing, China, May 29-30.
Selvadurai, R. (1992). Problems faced by international students in American colleges and
universities. Community review, 12(1-2), 27-32.
26
Smith, D. G. & Schonfeld, N. B. (2000). The benefits of diversity: What the research tells us.
About campus 5(5), 16-23.
Stoyboff, S. (1997). Factors associated with international students’ academic achievement.
Journal of instructional psychology, 24, 56-68.
Tabachnick, B. G. & Fidell, L.S. (1996). Using multivariate statistics (3rd edition). HarperCollins
College Publishers.
The NSSE 2000 National Report (2000): National benchmarks of effective educational practice.
Bloomington, IN: Indiana University Center for Postsecondary Research and Planning.
Thomas, K. & Althen, G. (1989). Counseling foreign students. In P.B. Pedersen, J. G. Draduns,
W. J. Lonner, & J.E. Trimble (Eds.), Counseling across cultures (3rd ed., pp.205-241).
Honolulu, HI: University of Hawaii Press.
U.S. news and world report (2000). They are coming to American schools: Colleges look abroad
to fill already tight space. Marcus, D. L. and Hartigan, R., 129(21), 168, 11/27/2000.
Weick, K.E. (1979). The social psychology of organizing (2nd ed). Reading MA: Addison-
Wesley.

27
Table 1
Selected Characteristics of International and American Students
International Students American Students Student/Institutional Characteristics N % N %
Age 19 or younger 875 32.0 28,498 42.9 20-23 1,094 40.0 26,023 39.2 24-29 508 18.6 5,455 8.2 30-39 170 6.2 3,339 5.0 40+ 91 3.3 3,141 4.7 Sex Male 1,196 43.0 22,994 34.3 Female 1,583 57.0 44,067 65.7 Class Rank Freshman/first year students 1,301 46.8 31,736 47.3 Seniors 1,479 53.2 35,336 52.7 Race/Ethnicitya Black 347 12.7 3,964 5.9 Asian 949 34.7 2,869 4.3 White 942 34.5 53,435 79.8 Latino 252 9.2 2,836 4.2 Place of Residence Off-campus 1,685 61.6 36,460 54.7
On-campus (Campus housing or Greek) 1,049 38.4 30,241 45.3
Transfer Status Started college from here 1,787 65.0 51,245 76.7
Started college from elsewhere 963 35.0 15,570 23.3 Enrollment Status Part-time 285 10.4 7,672 11.5 Full-time 2459 89.6 59,076 88.5 Parents’ Education
None of the parents went to college 1,091 40.3 26,904 40.7
Either mother or father went to college 610 22.5 16,938 25.6
Both parents went to college 1,007 37.2 22,339 33.8 Majora Humanities 277 10.4 8,171 12.7 Math & Sciences 930 35.0 15,047 23.4 Social Sciences 355 13.4 11,289 17.6 Preprofessional 957 36.0 27,136 42.2

28
Table 1 (Continued)
International Students American Students Student/Institutional Characteristics N % N %
Carnegie Type DRU Extensive 704 25.3 15,864 23.7 DRU Intensive 428 15.4 7,762 11.6 MA I & II 922 33.2 26,603 39.7 BA Liberal Arts 521 18.7 11,949 17.8 BA General 205 7.4 4,894 7.3 Sector Private 1,365 49.1 37,877 56.5 Public 1,415 50.9 29,195 43.5
Total 2,780 100.0 67,072 100.0 Note. aFor race and major, the columns do not sum to 100.0 due to multiple or “other” responses.
29
Table 2
Mean Differences between International and American Students on Engagement Measures and Selected Outcomes
First-year Studentsa Seniorsb
International American International American Measure
Mean Std. Dev. Mean Std. Dev. Effect Size
Mean Std. Dev. Mean Std. Dev. Effect Size
Student Engagement Academic challenge 18.41 4.5 17.46 4.49 0.21*** 18.98 4.74 18.53 4.67 0.10*** Active and collaborative learning 14.51 3.05 14.09 2.87 0.15*** 15.53 3.11 15.82 3.02 -0.10*** Student interactions with faculty 8.13 3.75 7.1 3.77 0.27*** 7.91 3.92 7.64 3.79 0.07 Supportive campus environment 11.1 3.34 10.88 3.34 0.06 10.38 3.59 10.19 3.36 0.06 Diversity 8.21 2.42 8.1 2.25 0.05 8.06 2.39 7.8 2.19 0.12*** Community service 4.28 2.03 4.32 1.82 -0.02 3.7 2.45 4.03 2.39 -0.14*** Computer technology 8.44 2.15 8.07 2.12 0.17*** 8.95 2.05 8.66 2.09 0.14*** Relaxing and socializing 11.31 8.32 13.71 9.09 -0.26*** 11.4 8.71 11.89 8.44 -0.06
Self-reported Gains Personal and social 14.69 3.49 13.86 3.55 0.23*** 15.17 3.52 14.57 3.55 0.17*** General education 12.01 2.64 11.61 2.63 0.15*** 12.61 2.58 12.53 2.57 0.03 Job-related skills 2.64 0.98 2.51 0.94 0.14*** 2.97 0.94 3.01 0.91 -0.04
Satisfaction Student satisfaction 6.2 1.32 6.39 1.37 -0.14*** 6.09 1.42 6.38 1.42 -0.20***
Note. ***p<.001 (2-tailed). a Ns range from 722 to 1,282 for international students, Ns range from 16,018 to 31,552 for American students. b Ns range from 1,156 to 1,464 for international students, Ns range from 30,926 to 35,145 for American students.

30
Table 3
OLS Multivariate Regressions of Engagement Measures and Selected Outcomes on International
Status (International Students vs. American Students) a
First-year Students Seniors
Unstandardized Regression Coefficient
Unstandardized Regression Coefficient
Measure
(Std. Error)
Effect Sizeb
Adjusted R2
(Std. Error)
Effect Size
Adjusted R2
Student Engagement Academic challenge .723*** .16 .077 .380 .08 .077 (.138) (.133) Active and collaborative learning .298 .10 .050 -.193 -.06 .056 (.089) (.085) Student interactions with faculty .623*** .17 .075 .288 .08 .081 (.153) (.118) Supportive campus environment .234 .07 .051 .242 .07 .053 (.103) (.096) Diversity .012 .01 .046 .12 .05 .037 (.070) (.063) Community service -.064 -.04 .076 -.363*** -.15 .098 (.066) (.073) Computer Technology .248*** .12 .042 .155 .07 .058 (.066) (.059) Relaxing and socializing -1.430*** -.16 .043 -.099 -.01 .072 (.280) (.237)
Self-reported Gains Personal and social .698*** .20 .030 .446*** .13 .055 (.111) (.101) General education .420*** .16 .040 .279*** .11 .066 (.082) (.072) Job-related skills .088 .09 .024 -.012 -.01 .055 (.030) (.026)
Satisfaction Student satisfaction -.072 -.05 .045 -.095 -.07 .040 (.042) (.040)
Note. ***p<.001 (2-tailed). a Controls include student-level controls (sex, race/ethnicity, major, campus residence, transfer status, enrollment status, age, parent education) and institutional-level controls (Carnegie classification, total undergraduate enrollment, Barron’s rating of selectivity, private or public sector). by-standardized coefficient.
31
Table 4
Y-Standardized Effect Sizes for Different Races/Ethnicities among International Students
First-year International Studentsa Senior International Studentsb
Measure Asian vs.
White
Black vs.
White
Asian vs.
Black
Asian vs.
White
Black vs.
White
Asian vs.
Black
Student Engagement Academic challenge -.11 .11 -.21* -.09 .21* -.26** Active and collaborative learning -.27*** .18 -.46*** -.19*** .25** -.42*** Student interactions with faculty .18 .50*** -.33* -.06 .23* -.25* Supportive campus environment -.14 .11 -.28** .00 .15 -.15 Diversity -.24** .14 -.39*** -.18** .27** -.42*** Community service .04 .30* -.30* .15* .45*** -.27* Computer Technology .10 .09 -.02 .11 -.06 .22* Relaxing and socializing .10 .17 .27** .16* -.32** .45***
Self-reported Gains Personal and social .12 .12 -.03 .19** .17 -.02
General education -.13 .15 -.29** -.06 .35*** -.35***
Job-related skills -.01 .00 -.08 -.06 .12 -.20*
Satisfaction Student satisfaction -.50*** -.24* -.24* -.33*** -.16 -.17
Note. *p<.05 **p<.01 ***p<.001 (2-tailed). aNs range from 254 to 427 for Asians, 92 to167 for Blacks, and 220 to 431 for Whites. bNs range from 397 to 515 for Asians, 131 to 176 for Blacks and 408 to 504 for Whites.
32
Table 5
Intraclass Correlation Coefficients for Engagement Measures
First-year Students Seniors
Measure Between School
Variance
Within School
Variance
Intraclass Correlation
Between School
Variance
Within School
Variance
Intraclass Correlation
Student Engagement Academic challenge 2.036 17.586 0.10 1.528 19.481 0.07 Active and collaborative learning 0.647 7.599 0.08 0.476 8.585 0.05 Student interactions with faculty 1.353 6.685 0.17 1.287 11.490 0.10 Supportive campus environment 0.869 10.113 0.08 0.949 10.197 0.09 Diversity 0.382 4.672 0.08 0.355 4.413 0.07 Community service 0.389 2.403 0.14 0.556 4.632 0.11 Computer Technology 0.403 4.080 0.09 0.330 3.988 0.08 Relaxing and socializing 2.469 78.612 0.03 3.019 67.876 0.04
33
Table 6
Multilevel Regressions of Student Engagement Measures on International Student Density and
Selected Controlsa
First-year Students Seniors
Measure Unstandardized Coefficient (Std. Error)
Effect Sizeb Unstandardized
Coefficient (Std. Error)
Effect Sizeb
Student Engagement Academic challenge -0.098 -0.08 -0.038 -0.03
(.056) (.047) Active and collaborative learning -0.012 -0.02 -0.023 -0.04
(.032) (.028) Student interactions with faculty -0.022 -0.02 -0.093* -0.09
(.045) (.039) Supportive campus environment -0.150*** -0.18 -0.163*** -0.19
(.038) (.039) Diversity 0.086** 0.15 0.085** 0.16
(.030) (.030) Community service -0.023 -0.04 -0.052 -0.08
(.030) (.033) Computer Technology -0.012 -0.02 -0.018 -0.04
(.028) (.023) Relaxing and socializing 0.006 0.00 -0.067 -0.04
(.080) (.068) Note. *p<.05 **p<.01 ***p<.001 (2-tailed). a Student-level controls (sex, race/ethnicity, major, campus residence, transfer status, enrollment status, age, parent education) and institutional-level controls (Carnegie classification, total undergraduate enrollment, Barron’s rating of selectivity, private or public sector). bY-standardized effect sizes, indicating the effect of density on adjusted institutional engagement means.
34
Appendix A
Survey Items Contributing to Student Engagement and Selected Student Outcomes
Academic Challenge (Cronbach’s alpha=.72 ) • Number of hours per week spending on preparing for class (studying, reading, writing,
rehearsing, and other activities related to your academic program) • The frequency of having worked harder than you thought you could to meet an instructor's
standards or expectations during the current school year • Number of assigned textbooks, books, or book-length packs of course readings during the
current school year • Number of written papers or reports of 20 pages or more during the current school year • Number of written papers or reports between 5 and 19 pages during the current school year • Number of written papers or reports of fewer than 5 pages during the current school year • During the current school year, the extent coursework emphasized analyzing the basic elements
of an idea, experience, or theory • During the current school year, the extent coursework emphasized synthesizing and organizing
ideas, information, or experiences into new, more complex interpretations and relationships • During the current school year, the extent coursework emphasized making judgments about the
value of information, arguments, or methods • During the current school year, the extent coursework emphasized applying theories or
concepts to practical problems or in new situations • The extent the institution emphasizes spending significant amounts of time studying and on
academic work Active and Collaborative Learning (Cronbach’s alpha=.64 )
• The frequency of having asked questions in class or contributed to class discussions during the current school year
• The frequency of having made a class presentation during the current school year • The frequency of having worked with other students on projects during class during the current
school year • The frequency of having worked with classmates outside of class to prepare class assignments
during the current school year • The frequency of having tutored or taught other students (paid or voluntary) during the current
school year • The frequency of having discussed ideas from your readings or classes with others outside of
class (students, family members, coworkers, etc.) during the current school year Student Interactions with Faculty Members (Cronbach’s alpha=.74)
• The frequency of having discussed grades or assignments with an instructor during the current school year
• The frequency of having talked about career plans with a faculty member or advisor during the current school year
• The frequency of having discussed ideas from your readings or classes with faculty members outside of class during the current school year
• The frequency of having worked with faculty members on activities other than coursework (committees, orientation, student life activities, etc.) during the current school year
• The frequency of having received prompt feedback from faculty on your academic performance (written or oral) during the current school year
• Have done or plan to work on a research project with a faculty member outside of course or program requirements before you graduate from your institution

35
Supportive Campus Environment (Cronbach’s alpha=.76 ) • The extent the institution emphasizes providing the support you need to help you succeed
academically • The extent the institution emphasizes helping you cope with your non-academic responsibilities
(work, family, etc.) • The extent the institution emphasizes providing the support you need to thrive socially • Quality of Relationships with other students at your institution • Quality of Relationships with faculty members at your institution • Quality of Relationships with administrative personnel and offices at your institution
Gains in Personal and Social Development (Cronbach’s alpha=.82)
• The extent your college experience contributed to developing a personal code of values and ethics
• The extent your college experience contributed to understanding people of other racial and ethnic backgrounds
• The extent your college experience contributed to understanding yourself • The extent your college experience contributed to learning effectively on your own • The extent your college experience contributed to working effectively with others • The extent your college experience contributed to acquiring broad general education • The extent your college experience contributed to thinking critically and analytically
Gains in General Education (Cronbach’s alpha=.80)
• The extent your college experience contributed to writing clearly and effectively • The extent your college experience contributed to speaking clearly and effectively • The extent your college experience contributed to acquiring broad general education • The extent your college experience contributed to thinking critically and analytically
Gains in Job-Related Skills (Single item)
• The extent your college experience contributed to acquiring job or work-related knowledge and skills
Computer Technology (Cronbach’s alpha=.55)
• The frequency of having used an electronic medium (list-serv, chat group, Internet, etc.) to discuss or complete an assignment during the current school year
• The frequency of having used e-mail to communicate with an instructor during the current school year
• The extent your college experience contributed to using computing and information technology Diversity (Cronbach’s alpha=.63)
• The frequency of having had serious conversations with students of a different race or ethnicity than your own during the current school year
• The frequency of having had serious conversations with students who differ from you in terms of their religious beliefs, political opinions, or personal values during the current school year
• The extent the institution emphasizes encouraging contact among students from different economic, social, and racial or ethnic backgrounds
Community Service (Cronbach’s alpha=.51)
• The frequency of having participated in a community-based project as part of a regular course during the current school year
• Have done or plan to do community service or volunteer work before you graduate • The extent your college experience contributed to improving the welfare of your community

36
Relaxing and Socializing (Single item) • Number of hours per week spending on relaxing and socializing (watching TV, partying,
exercising, playing computer and other games, etc.) Student Satisfaction (Cronbach’s alpha=.77)
• How would you evaluate your entire educational experience at this institution? • If you could start over again, would you go to the same institution you are now attending?