a comparison of estimated maize and cabbage …
TRANSCRIPT
International Journal of Economics, Commerce and Management United Kingdom Vol. II, Issue 12, Dec 2014
Licensed under Creative Common Page 1
http://ijecm.co.uk/ ISSN 2348 0386
A COMPARISON OF ESTIMATED MAIZE AND CABBAGE
ENTERPRISE BUDGETS OF IDEAL SMALL-SCALE
COMMERCIAL AND SUBSISTENCE FARMS IN THE EASTERN
CAPE PROVINCE OF SOUTH AFRICA
Douglas Kibirige
Department of Agricultural Economics and Management
Faculty of Agriculture, University of Swaziland, Luyengo, Swaziland
Abstract
Millions of people in rural South Africa depend on small-scale subsistence agriculture as their
major source of livelihood. Subsistence farming is characterised by relatively low use of agro-
inputs leading to relatively low yields. The information in this article presents an ideal situation of
small-scale commercial farms compared to the actual subsistence crop production faced by
small-scale farmers in Eastern Cape Province. Despite availability of established small-scale
irrigation facilities in rural Eastern Cape, results presented indicate an observable diversion in
yields, total variable costs and gross margins generated per hectare of an ideal small-scale
commercial farm versus the small-scale subsistence farm given the same size of land. The low
uses of inputs are translated into low production and gross margins. Thus, land owned by small-
scale subsistence farmers seems to be under-utilised .This keeps the rural farmers in circles of
poverty and higher risk of food insecurity. Results suggest recommendable increased use of
agro-inputs by small-scale farmers in Eastern Cape Province through policies related to
improved access to input credit services, input-subsidies, more decentralised input distribution
in rural areas, and extension services geared towards optimal use of these inputs. These
policies can catalyse commercialization of rural small-scale farming in Eastern Cape.
Keywords: Small-scale farmers, Enterprise budgets, agro-inputs, gross margins, Maize,
Agricultural economics

© Douglas
Licensed under Creative Common Page 2
INTRODUCTION
Based on the backward and forward linkages, agro-industrial sector remain one of the major
contributors to South Africa’s national Gross Domestic Product (12%) and provides employment
to approximately 8.5 million people (Kibirige, 2013). Aliber et al. (2009) indicated that there are
approximately 4 million smallholder farmers in South Africa and 92% are considered as
subsistence/communal farmers who produce mainly to meet the household food security
requirement. In the Eastern Cape Province, the agricultural sector contributes about 1.9% of the
Provincial GDP. According to Statistic South Africa (2012), the 2011 census results revealed
that the Eastern Cape Province’s population was estimated at 6 562 053 people and 60% of this
population derive their livelihood from smallholder subsistence farming (Kibirige, 2013).
Smallholder farmers mainly grow crops field crops and vegetables likemaize and cabbage,
respectively, and rear livestock for household food security and household income generation.
Both crop and livestock production systems are dependent on the botanical
characteristics, environment, climate, and land size, location, inputs used, as well as other
variables (Allemann and Young, 2008). For improved food security and household incomes,
these factors and inputs need to be combined in the most efficient way, and reduce
management gaps in terms of quality decision making regarding production, investment,
financing, marketing and human relations aspects (Kibirige, 2013). One sure way of
investigating proper use of inputs gainfully includes establishment of the profitability of these
crops and livestock enterprises. This helps to establish the viability and sustainability of an
enterprise. The estimated profitability (gross margins) was based on one hectare for each
selected enterprise presented in this study (Norman et al., 2002).
Prerequisites for Establishing a Sustainable Farm Enterprise
To establish a viable farm business project, essential production resources and requirements
should be available. Land is one of these natural resources a prerequisite in farming. The
conventional method is when planting crops and rearing animals is done on the open land, the
common areas under production range from 0.25-2 hectares of land for communal subsistence
farmers and 2 – 50ha for smallholder commercial (“emerging”) farmers, but for a viable farm
business project the area should be greater than one hectare (> 1 ha).
In South Africa, of the 12.5 km3/year total available fresh water, 31% is used for
domestic purposes, 6% is used in industrial and 63% is used in agricultural production (CIA,
2012; Kibirige, 2013). The 63% agricultural water use signifies its importance in crop and
livestock production. Both most crops and livestock can hardly survive in water scarce areas

International Journal of Economics, Commerce and Management, United Kingdom
Licensed under Creative Common Page 3
especially vegetables which require large quantities of water and they can only thrive under
adequate soil moisture conditions (Kodua-Agyekum, 2009; Kibirige, 2013). For a sustainable
farm business, there must be a reliable water supply source throughout the year including
rivers, lakes, springs, dams, borehole or any other available source. The quality of water
especially in terms of pH has a great influence on the type of crops to be grown. While some
crops prefer acidic conditions, others thrive on neutral to alkaline environments. For optimal
crop production aimed at profit maximization, it is crucial to strike a balance between the water
and soil conditions.
In the face of scarce rainwater and extreme weather conditions, efficient use of irrigation
systems in countries like South Africa would be the best option. Irrigation can be defined as the
deliberate application of water by humans to the soil for the purpose of supplying moisture
essential for plant growth (Kodua-Agyekum, 2009). In areas like most parts of the Eastern Cape
Province in South Africa where the water is not adequate, reservoirs including dams could be
constructed and used as buffer for a sustainable farm production.
In the Eastern Cape, different irrigation systems are being used by smallholder farmers
to convey water in their gardens, and these include furrowing, sprinkler, hose pipe, bucket, and
flooding and pivot irrigation systems (Kibirige, 2013).Use of sprinklers is the most common
method of irrigation system employed by smallholder commercially oriented farmers and hose-
pipe connected to water taps irrigation method is mainly practiced by communal subsistence
farmers (Kodua-Agyekum, 2009; Kibirige, 2013).
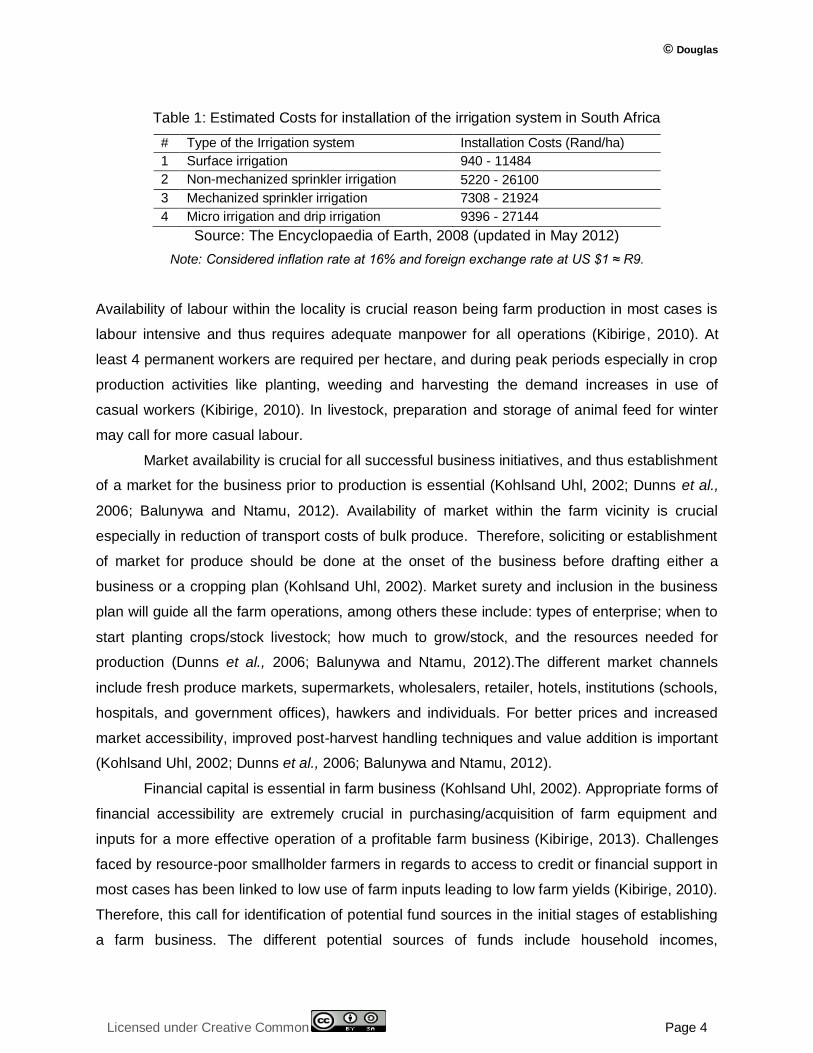
A number of pumping units are used for drawing and pressurizing water into the system.
The most commonly used are mono and centrifugal pumps. Considering the existence of a dam
or river, the cost of a complete set of non-mechanized sprinkler irrigation and drip irrigation
systems per hectare are estimated at R26100and R27144, respectively, (The Encyclopaedia of
Earth, 2008), as shown in Table 1. Applicants are strongly advised to consult with irrigation
officers for proper design of systems before purchasing irrigation equipment. The annual costs
incurred by the farmer to pay for water, maintenance, and administration of the scheme, vary
from R3132/ha to up to R13572/ha under exceptional circumstances. Location of the field, soil
types, crops grown, type of irrigation system, and the time of year in use dictates the amount of
water required per day.
© Douglas
Licensed under Creative Common Page 4
Table 1: Estimated Costs for installation of the irrigation system in South Africa
# Type of the Irrigation system Installation Costs (Rand/ha)
1 Surface irrigation 940 - 11484
2 Non-mechanized sprinkler irrigation 5220 - 26100
3 Mechanized sprinkler irrigation 7308 - 21924
4 Micro irrigation and drip irrigation 9396 - 27144
Source: The Encyclopaedia of Earth, 2008 (updated in May 2012)
Note: Considered inflation rate at 16% and foreign exchange rate at US $1 ≈ R9.
Availability of labour within the locality is crucial reason being farm production in most cases is
labour intensive and thus requires adequate manpower for all operations (Kibirige, 2010). At
least 4 permanent workers are required per hectare, and during peak periods especially in crop
production activities like planting, weeding and harvesting the demand increases in use of
casual workers (Kibirige, 2010). In livestock, preparation and storage of animal feed for winter
may call for more casual labour.
Market availability is crucial for all successful business initiatives, and thus establishment
of a market for the business prior to production is essential (Kohlsand Uhl, 2002; Dunns et al.,
2006; Balunywa and Ntamu, 2012). Availability of market within the farm vicinity is crucial
especially in reduction of transport costs of bulk produce. Therefore, soliciting or establishment
of market for produce should be done at the onset of the business before drafting either a
business or a cropping plan (Kohlsand Uhl, 2002). Market surety and inclusion in the business
plan will guide all the farm operations, among others these include: types of enterprise; when to
start planting crops/stock livestock; how much to grow/stock, and the resources needed for
production (Dunns et al., 2006; Balunywa and Ntamu, 2012).The different market channels
include fresh produce markets, supermarkets, wholesalers, retailer, hotels, institutions (schools,
hospitals, and government offices), hawkers and individuals. For better prices and increased
market accessibility, improved post-harvest handling techniques and value addition is important
(Kohlsand Uhl, 2002; Dunns et al., 2006; Balunywa and Ntamu, 2012).
Financial capital is essential in farm business (Kohlsand Uhl, 2002). Appropriate forms of
financial accessibility are extremely crucial in purchasing/acquisition of farm equipment and
inputs for a more effective operation of a profitable farm business (Kibirige, 2013). Challenges
faced by resource-poor smallholder farmers in regards to access to credit or financial support in
most cases has been linked to low use of farm inputs leading to low farm yields (Kibirige, 2010).
Therefore, this call for identification of potential fund sources in the initial stages of establishing
a farm business. The different potential sources of funds include household incomes,
International Journal of Economics, Commerce and Management, United Kingdom
Licensed under Creative Common Page 5
government agricultural grants (can be in form of assets or subsidies), Non-Governmental
Organisations (NGOs), and agricultural loans from banks and micro-finance institutions
(Kibirige, 2013).
Ostrom (1998), FAO (2000), Padilla-Fernandez and Nuthall (2001), and Kibirige (2013)
defined human capital as the acquired knowledge and skills through education, training and
experience that an individual brings to an activity. Many studies including Padilla-Fernandez and
Nuthall (2001), and Kibirige (2013) have attested the efficacy of basic farming skills and
experience for improved farm production and productivity. Farm production is a very labour
intensive and requires both dedication and skill to maximize output and profits (kibirige, 2013).
Therefore acquisition of farm knowledge through basic training in production and farm business
principles or experience in the same field is very crucial. Acquisition of basic managerial skill is
important and can enhance farmer’s competitiveness in farm business. In instances where there
is lacks of such skills and knowledge, both the owner of the farm and workers need to
undertake trainings in farm production principles and farm business concepts to realize more
output and profits (Ostrom, 1998, FAO, 2000; Kibirige, 2013).
Generally, a farmer needs substantial knowledge about the different crop varieties and
cultivars, and livestock breeds (FAO, 2000). Proper and efficient use of agro-inputs like the
Integrated Pest Management (IPM) control system is important for sustainable farm production,
reduce risks of agro-chemical hazards related to humans and animals, and reduced negative
impacts to the general environment (Kibirige, 2013). Other farm management practices include
record keeping and these records are important to facilitate proper monitoring of the enterprise
and support decision making for the whole farm operations. Among essential records include,
farm inventory of fixed assets, total farm land under production, total variable inputs bought,
total variable inputs used, yields, and diseases and causes.
Other key factors important for a transformation from subsistence to small-scale
commercial farming are fixed assets including: permanent water source (water reservoirs, dams
and boreholes), irrigation equipment, fencing, store rooms, net shade, protective clothing,
garden tools, permanent labour and other assets related to livestock production. These can be
categorised into farm machinery, fencing material, buildings, protective clothes and garden
tools, and infrastructure. When establishing a 1 ha of crop production or 3 ha of livestock
production ideally there is no need of owning heavy machinery. In this situation hired machinery
can be used in a few farm activities like land preparation. The common machinery important in
farm production include: tractor, planter, and harrow.
The location of the project will dictate the type of fencing material. Most smallholder
farmer and communal farmers are located in rural area where most livestock is reared on a free
© Douglas
Licensed under Creative Common Page 6
range system exposing crops to animal destruction. Therefore, fence with small animal proof
material can be used to keep out small animals. The farmer may start with constructing less
costly semi-permanent structures and after establishment the semi-permanent structures can be
upgraded into permanent structures. These buildings may include net-shade, store-room,
packaging shed, and livestock shed/kraal/pen among others. Construction of these buildings
should be guided by technical personnel for safety, hygiene, and prevention of pests and
disease spread. In terms of infrastructure, farmers’ access to services like electricity, roads,
markets and telecommunication are crucial in facilitating value addition and marketing of
agricultural produce. Availability and access to electricity facilitates water pumping, cooling
facilities and other farm amenities including lighting and agro-processes is key for small-scale
commercial farming.
The widely used/applied variable inputs in crop production are pesticides, seeds,
herbicides, fertilizers, protective clothing, and the post-harvest handling related inputs like
packaging materials. In livestock production, feeds (supplementary and pastures) vaccination,
veterinary drugs, acaricides, dewormers. Other variable inputs are found under financial
projection. Some of these variable inputs can be sourced from agro-input stores. Amounts of
inputs purchased and applied in the field vary based on targeted output, the intensity of soil
infertility, the level pest invasion and disease infection, and level of maturity and growth rate of
crops and livestock.
Like any other business, establishing and operating a farm business calls for financial
capital from owners’ equity (Contribution) and/or credit/loans and grants from various financial
institutions and government programs. Among others, sources of support may include
government development programmes, Non-Governmental Organisations (NGOs), private
business company’s community support programmes, banks and other micro-finance
institutions (Kibirige, 2013). For a sustainable farm business project, the principal amount
(initial/start-up capital) covers the entire project establishment and operational costs for 1
hectare for crops and at least 3 ha for livestock production within a period not exceeding 12
months. The initial capital outlay can be up based on the prevailing input costs and anticipated
profits per enterprise. In this case, the estimated enterprise budget assumes that farmers have
access to land as owner’s contribution. The anticipated production levels and profits are based
on key assumptions related to farm location, farm size, production costs, accessibility to loan
and interest rates thereof, and input/output prices.

International Journal of Economics, Commerce and Management, United Kingdom
Licensed under Creative Common Page 7
METHODOLOGY
Both primary and secondary data were used to estimate the profitability of enterprises under
study. Primary data was collected from over 120 farmers in the Eastern Cape Province. A
random sampling technique was used based on the available lists of farmers who were
participating frequently in researches carried out by the Agricultural Rural Development and
Research Institute (ARDRI)-housed by University of Fort Hare. According to Doll and Orazem
(1984), and Tweeten (1979), profit can operationally be defined as the total revenue less total
production costs and it is the basic economic measurement of profitability. In case of scarce
information on fixed cost, profitability can be measured using and gross margin analysis. Gross
margin is an appropriate measure to compare enterprises that place similar demands for limited
resources like farmers and it is a good measure for short run and annual planning decisions
(Castle et al., 1987). Furthermore, gross margin is a simple but a realistic measure of the
performance of enterprises. According to Norman et al. (2002), gross margin refers to the gross
income minus the variable costs associated with an enterprise/activity.
Gross margins were evaluated by identifying and quantifying the Total Variable Costs
(TVC) incurred by the farmers, and the Total Revenues (TR) realized in the production of
selected enterprises per season. The TR is estimated as the prevailing market price of a given
output (Py) multiplied by quantity of output sold (Qys) (Py * Qys). Total variable costs is a
summation of all input variable costs incurred by a given firm, and the input variable cost is
estimated as the prevailing market price of a given input (Pxi) multiplied by quantity of the input
used (Qxi) (Pxi * Qxi). Thus, 𝑇𝑉𝐶 = 𝑃𝑥𝑖 ∗ 𝑄𝑥𝑖 .𝑛𝑖=1 Gross margin for each enterprise is
calculated as: 𝐺𝑀 = (𝑃𝑦 ∗ 𝑄𝑦𝑠 ) − 𝑃𝑥𝑖 ∗ 𝑄𝑥𝑖 𝑛𝑖=1 …………………………………………… (1)
Enterprise Budget for One Hectare
A brief and systematic description of each of the selected enterprise and its budget are
presented in the following sections. The selected enterprises were grouped into two categories
including a field crop (maize), and vegetables (cabbage and carrots).
RESULTS AND DISCUSSIONS
Maize Enterprise
South Africa exhibit two maize production systems, the intensive commercial farming system
and the resource-poor subsistence (communal) farming systems (FANRPAN, 2012; Kibirige,
2013). On average, there are approximately 9.2 million tonnes of maize produced per annum, of
which 8 million tonnes is utilised in the country as food and fodder. Whereas commercial farms
have access to and use recommended amounts of agricultural inputs and practice improved

© Douglas
Licensed under Creative Common Page 8
post-harvest handling techniques, communal subsistence farmers lack the required resources to
ensure efficient production and quality grain throughout the maize value chain(FANRPAN, 2012;
Kibirige, 2013).Inefficient productivity of communal subsistence farmers may be due to
insufficiency of hybrid seed, fertilisers and pesticides, poor soil fertility, fungal infections and
pest damage(FANRPAN, 2012; Kibirige, 2013).Maize is a staple food for most parts of the
Eastern Cape Province, and therefore, the crop is vital in enhancing household food security in
these areas (Kodua-Agyekum, 2009; Kibirige, 2013).Maize grows well at temperatures ranging
between 20 and 32, and growth slows down at temperatures below 12. Growth of maize is
greatly affected by frost. The crop grows on a wide range of soil types, well drained and
achieves best growth in the range of pH 5.6 - 7.5 (Department of Agriculture, 2003). Table 2
displays the seed rate (about 34kg/ha), growth period (approximately 100 to 130 days) and
plant population (about 25 000 to 40000 plants/ha) in maize production.
Table 2: Seed rate, Growth period and Plant Population in Maize production
Seed rate Growth period Plant population
Approximately 34Kg Plants reach maturity at least
100 to 130 days, dependon
variety planted
Approximately 25 000 to 40 000
plants/ha
Among others, the possible pests and disease which can attack the maize in field include
Beetles, Cutworms, Stalk borer, and these can be controlled by use of Gauchu, Cypermethrin
and Bulldock, respectively.
Table 3: Pests in Maize Production
Pests & Disease Control Units Quantity/ha Unit price
(Rand)
Total cost
(Rand)
Pests
Beetles
Cutworms
Stalk borer
Gauchu grams 60.00 2.23 133.80
Cypermethrin Litre 0.15 67.28 10.09
Bulldock Litre 0.20 266.80 53.36
Source: Eastern Cape Department of Agriculture (2008)
On average, results indicate that there is an observed gap between the recommended
commercial amount of pesticide per hectare used commercially (R200spent) and the actual
pesticides used per hectare by rural small-scale famers (R33 spent)in Eastern Cape. These
results presented in the Table 4 match with Kibirige (2013). Kibirige (2013) reported that the
applied amount of fertilizer, pesticide and herbicides per hectare by smallholder irrigators were
58.03Kg/ha, 0.74L/ha, 0.64L/ha, respectively, whereas homestead food gardeners applied

International Journal of Economics, Commerce and Management, United Kingdom
Licensed under Creative Common Page 9
fertilizer of 50Kg/ha, 0.73L/ha of pesticide and 0.40L/ha of herbicide, respectively. These figures
suggest a relatively low use of agro-chemical by small-scale farmers in the Eastern Cape
Province of South Africa. More specifically, the recommended fertiliser rates for irrigated maize
vary depending on the yield potential, but can be as high as 220 kg/ha for a yield target of 10
tons/ha in South African (Fanadzo et al., 2009; Kibirige, 2013). However, results in this article
suggest that subsistence farmers apply far less fertilizer than the recommended rate and these
findings are consistent with Kibirige (2013) and Fanadzoet al. (2009) studies.
Table 4: Estimated Crop Budget of Maize Production
Item Commercial Farming Subsistence Farming
Quantity/ha Unit
price
Rand
Total
Rand
Quantity/ha Unit
price
Rand
Total
Rand
Revenues (Gross
incomes)
Production (Kg) 8500 3.00 25500 2200 3.00 6600
Variable Inputs Costs
Modified seeds (Kg) 22.5 26.00 585 18 26.00 468
Recycled/local seeds (Kg) 29 3.00 87
Fertilizer (Kg or L) 2:3:4 500 14.00 7000 100 14.00 1400
Fertilizer (LAN) 250 12.00 3000
Herbicides (Litres) 1.5 95.00 145 0.21 40.00 8.40
Pesticide (Variety) 200 0.55 60.00 33.
Irrigation pump costs 165
labour (Man-days)/Tractor
Land preparation/plough Tractor (1d) 650 650 21md 30.00 630
Planting Tractor (1d) 590 590 10md 30.00 300
Fertilizer Application Tractor (1d) 590 590 10md 30.00 300
Weeding 30md 30 900 30md 30.00 900
Spraying Tractor (1d) 400 400 10md 30.00 300
Irrigation 10md 30 300
Harvesting Tractor (1d) 650 650 30md 30.00 900
Transport costs 200 200
Marketing costs 2000
Total Variable Costs (TVC) 17375 5576.4
Gross Margin 8125 1023.6
Kg = Kilograms, L = Litre, 1d = one working day, md = man-day = 8 working hours per day.
According to Fanadzo et al. (2009), South Africa has the potential grain yields that can be
obtained under irrigation farming range from 7 to 12 tons/ha. However, based on the results
presented in Table 4, subsistence small-scale farmers’ yields (2.2 tons/ha) far below the
anticipated amount (between 7 and 12tons/ha) produced per hectare. These results do not differ

© Douglas
Licensed under Creative Common Page 10
from Kibirige (2013) who indicated an average yield of about 1.8tons/ha harvested by small-
scale farmers in the Eastern Cape Province of South Africa. Fanadzoet al. ( 2009) also they
recorded low yields on Zanyokwe Irrigation Scheme, Eastern Cape, South Africa. The low yields
may be attributed to low fertilizer, pesticides and herbicides applications, among others
(Kibirige, 2013). Further, the low use of these agro-chemicals may be due to lack of investment
capital to purchase these inputs.
Cabbage Enterprise
Considering climatic conditions, cabbages grow well in cool and moist conditions with
temperatures ranging between 5 and 24 °C, although they can survive at temperatures as low
as -3°C. The crop attains its optimum growth at temperatures between 15 to 18 °C (Allemann
and Young, 2008). South African farmers have adopted cabbage varieties that survive under
different climatic conditions in regards to temperature. Green Star, Hercules, Star 3001 and
others are considered to be heat tolerant, and Conquistador, Green Coronet among others are
considered to be cold tolerant (Allemann and Young, 2008).Soils conditions/characteristics
suitable for cabbage production are Deep, well-drained with a relative moisture content and
loamy soil type. Heavier soils characterized by high fertility and moisture are preferred to light
ones. Further, soils should have an optimum pH of 5.3 to 5.8 with saturated acid of less than 2
(Allemann and Young, 2008). Deep tillage is required for cabbages to attain an effective root
system of depth of 600mm. Table 5 presents the seed rate, estimated growth period and plant
population in cabbage production of South Africa.
Table: 5: Seed rate, Growth period and Plant population in Cabbage production
Seed rate Growth period Plant population
Approximately 300 g for
seedbeds, 120 to 200 g for
seed trays, and 500 to 2 000
g for direct seeding
Plants reach maturity within
90 to 130 days from time of
transplanting, and vary
based on varieties
Approximately 40 000 to 45 000
plants/ha
Source: Allemann and Young (2008)
The identified pests and diseases common in cabbage production include Cabbage looper,
Diamond Back Moth, Cabbage Aphid, Bagradabug, American bollworm, Cutworm, Black rot,
Downymildew. These pests and diseases can be treated by use of pesticides and other agro-
chemicals which include Methomex, Bulldock, Confidor, Methamidifos, Manager/
Trimangol, Aquarite, respectively (Eastern Cape Department of Agriculture, 2008). This
information is presented in Table 6.

International Journal of Economics, Commerce and Management, United Kingdom
Licensed under Creative Common Page 11
Table 6: Pests and Diseases, and their Control in Cabbage Production
Pests & Disease Control Units Quantity/ha Unit price
(Rand)
Total cost
(Rand)
Pests
Cabbage looper,
Diamond Back Moth,
Cabbage Aphid, Bagrada
bug, American
bollworm, Cutworm
Diseases
Black rot, Downy
Mildew
Methomex Kg 1.00 168.20 168.2
Bulldock Litre 0.30 266.80 80.04
Confidor Litre 0.50 614.80 307.4
Methamidifos Litre 3.20 75.40 241.28
Manager/
Trimangol
Litre 12.00 40.60 487.2
Aquarite Litre 0.75 33.06 24.795
Source: Eastern Cape Department of Agriculture (2008)
Note: Unit prices were inflated by 16% to estimate the current prices
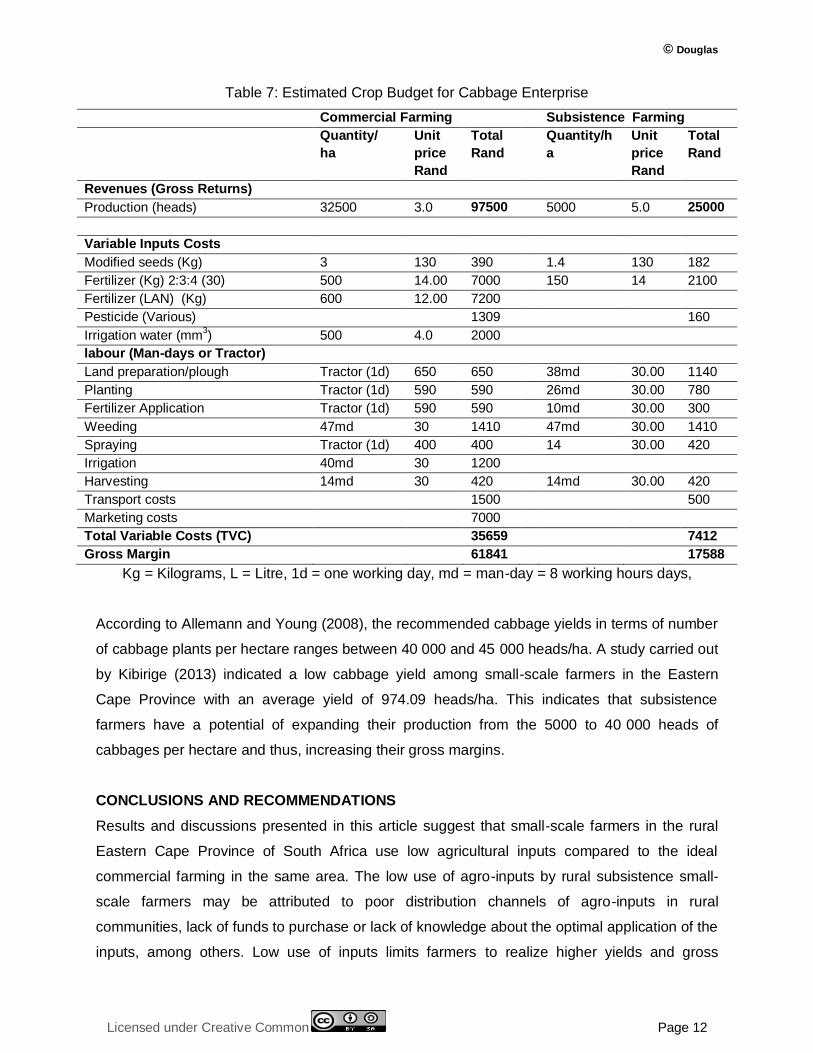
According to Allemann and Young (2008), the recommended amount of fertilizers to be applied
in one hectare of Cabbage ranges between 500 and 1000Kg/ha in some parts of South Africa.
However, results presented in Table 7 indicate far less fertilizers (150kgs/ha) applied by
communal subsistence farmers.
Furthermore, communal farmers seem to be applying lesser pesticides when compare
costs incurred in the purchase of the item by commercially oriented farmers (R309/ha) and
communal subsistence farming (R160/ha). The results presented in this article do not differ
much from a study carried out by Kibirige (2013) who indicated a relatively low fertilizer and
pesticide application per hectare in cabbage production among small-scale farmers in Eastern
Cape Province of South Africa. The study indicated that small-scale farmers were applying only
41.12kg/ha of fertilizer and 1.38liters/ha of pesticide.
Results in Table 7 indicate that communal subsistence farmer can only harvest yields of
about 5000 heads of cabbages whereas in the ideal situation of a small-scale commercial
farming can harvest over 32500 heads of cabbage per hectare. This indicates that communal
subsistence farmers do not utilize all the available land to grow cabbages resulting in estimated
low gross margins earned. Suboptimal utilization of land may be attributed to lack of funds to
meet their operational costs including purchase of fertilizers and pesticides.
© Douglas
Licensed under Creative Common Page 12
Table 7: Estimated Crop Budget for Cabbage Enterprise
Commercial Farming Subsistence Farming
Quantity/
ha
Unit
price
Rand
Total
Rand
Quantity/h
a
Unit
price
Rand
Total
Rand
Revenues (Gross Returns)
Production (heads) 32500 3.0 97500 5000 5.0 25000
Variable Inputs Costs
Modified seeds (Kg) 3 130 390 1.4 130 182
Fertilizer (Kg) 2:3:4 (30) 500 14.00 7000 150 14 2100
Fertilizer (LAN) (Kg) 600 12.00 7200
Pesticide (Various) 1309 160
Irrigation water (mm3) 500 4.0 2000
labour (Man-days or Tractor)
Land preparation/plough Tractor (1d) 650 650 38md 30.00 1140
Planting Tractor (1d) 590 590 26md 30.00 780
Fertilizer Application Tractor (1d) 590 590 10md 30.00 300
Weeding 47md 30 1410 47md 30.00 1410
Spraying Tractor (1d) 400 400 14 30.00 420
Irrigation 40md 30 1200
Harvesting 14md 30 420 14md 30.00 420
Transport costs 1500 500
Marketing costs 7000
Total Variable Costs (TVC) 35659 7412
Gross Margin 61841 17588
Kg = Kilograms, L = Litre, 1d = one working day, md = man-day = 8 working hours days,
According to Allemann and Young (2008), the recommended cabbage yields in terms of number
of cabbage plants per hectare ranges between 40 000 and 45 000 heads/ha. A study carried out
by Kibirige (2013) indicated a low cabbage yield among small-scale farmers in the Eastern
Cape Province with an average yield of 974.09 heads/ha. This indicates that subsistence
farmers have a potential of expanding their production from the 5000 to 40 000 heads of
cabbages per hectare and thus, increasing their gross margins.
CONCLUSIONS AND RECOMMENDATIONS
Results and discussions presented in this article suggest that small-scale farmers in the rural
Eastern Cape Province of South Africa use low agricultural inputs compared to the ideal
commercial farming in the same area. The low use of agro-inputs by rural subsistence small-
scale farmers may be attributed to poor distribution channels of agro-inputs in rural
communities, lack of funds to purchase or lack of knowledge about the optimal application of the
inputs, among others. Low use of inputs limits farmers to realize higher yields and gross

International Journal of Economics, Commerce and Management, United Kingdom
Licensed under Creative Common Page 13
margins in maize and cabbage production as reflected in the results. The observed gap
between the ideal commercial farming and subsistence farming indicate that rural small-scale
farmers have a potential of uplifting rural communities from low household incomes, food
insecurity and abject poverty. Results suggest recommendable increased use of agro-inputs by
small-scale farmers in rural Eastern Cape Province through establishment and catalysing policy
implementations related to improved access to input credit services, input-subsidies, more
decentralised input distribution in rural areas, and extension services geared towards optimal
use of these inputs. Establishment and strengthening farmers’ associations still plays a big role
in pulling resources together including agro-inputs, lobbing for input-credit from financial
institution, and easiness to train by extension workers from government, NGOs and private
sector. The transformation of subsistence farming to small-scale commercial farming can be
catalysed by a combination of these policy strategies. Deviating from the norms used in the
colonial and post-colonial era, rural development policies should be participatory at all stages
from initiation –implementing to evaluation.
Acknowledgement
I acknowledge the support provided by the Department of Agriculture, Forestry and Fisheries (DAFF)-
South Africa through Agricultural Rural Development Research Institute (ARDRI)-university of Fort Hare.
My sincere thanks go to Professor Patrick J Masikaand Tendai Chiguware who availed this opportunity to
participate in DAFF-exercise that led to compiling some of this information presented in the article.
Thanks also go to Mr. Lawrence Musis who helped with some information related to this article.
REFERENCES
Aliberetet al.(2009), Strategies to support South African smallholders as a contribution to government’s second economy strategy: Situation analysis, Research report 41, Volume 1: fieldwork findings and main conclusions, Published by the Institute for Poverty, Land and Agrarian Studies, School of Government, Faculty of Economic and Management Sciences, University of the Western Cape, South Africa.
Allemann L. and YoungB.W.(2008), Vegetable production in a nutshell: Directorate Agriculture Information Service, Department of Agriculture in cooperation with KwaZulu-Natal Department of Agriculture and Environmental Affairs: Printed and published by Department of Agriculture, Pretoria, South Africa.
BalunywaW.,and Ntamu D. N.(2012): “Social Marginalization of Women, Business Start-up and Poverty Alleviation: A Case of Women Entrepreneurs in Roadside Markets in Uganda”: Makerere University Business School, Uganda: Chapter Twenty four of Africa Casebook - Synergies in African Business and Management Practices: ISBN 978-9966-1570-0-3: AJBUMA Publishing, University of Nairobi - School of Business: VOL. I, 2012.Pgs 372-382.
CIA World Fact book(2012), “South Africa Geography”, Web page: http://www.theodora.com/wfbcurrent/south_africa/south_africa_geography.html (accessed on 1/08/2012).
Department of Agriculture-South Africa(2003): Maize production; Compiled by Directorate Agricultural Information Services; Department of Agriculture in cooperation with ARC-Grain Crops Institute.Printed and published by the Department of Agriculture, Pretoria, South Africa.

© Douglas
Licensed under Creative Common Page 14
Dunn J. W., BerryJ. W., KimeL., HarshR. M., and HarperJ. K. (2006): “Developing a Roadside Farm Market: Agricultural Alternatives”. © The Pennsylvania State University 2006; Code # UA434; 5M3/06mpc3995g: web-page: http://extension.psu.edu/business/ag-alternatives/marketing/developing-a-roadside-farm-markets (accessed on 14/03/2013)
Eastern Cape Department of Agriculture (2008): “Crop and livestock enterprise budgets”, (un-published)
Fanadzo M., Chiduza C., and Mnkeni P. N. S. (2009): “Comparative response of direct seeded and Transplanted Maize (Zea mays l.) To Nitrogen Fertilization at Zanyokwe Irrigation Scheme, Eastern Cape, South Africa”, African Journal of Agricultural Research, Vol. 4 (8), pp.689-694, August, 2009: ISSN 1991-637X © 2009 Academic Journals
FAO-UN. (2000): “Socio-economic impact of smallholder irrigation development in Zimbabwe; Case studies of ten irrigation schemes”, SAFR/AGLW/DOC/002: Food and Agriculture Organization of the United Nations (FAO); Sub-Regional Office for East and Southern Africa (SAFR); Harare.
Kibirige D., KiizaB.,and ElepuG. (2010):Analysis of Technical and Allocative Efficiency of Agricultural Productivity Enhancement Program on Maize Farmers;Masindi District (U), monogram Book; ISBN: 978-3-8383-7163-4, Published by LAP-Lambert Academic Publishers and printed in the USA and UK.
Kibirige D. (2013): “The Impact of Human Dimensions on Smallholder Farming in the Eastern Cape Province of South Africa” PhD Thesis: Department of Agricultural Economics and Extension, Faculty of Science and agriculture, University of Fort Hare-Alice South Africa.
Kodua-Agyekum C.(2009): “The transfer of technology to the rural poor: The case of Qamata Irrigation Scheme in the Eastern Cape Province of South Africa”. Phd Thesis, Faculty of Humanities, Development and Social Sciences, University of Kwazulu-Natal, South Africa.
KohlsR. L. and UhlJ. N.(2002): Marketing of Agricultural Products (9th edition).
KwaZulu-Natal Department of Agriculture and Environmental Affairs(2006):“ COMBUD Enterprise Budget”.
Ostrom E.(1998): “Social capital: a fad or a fundamental concept?”, Center for the Study of Institutions, Population and Environmental Change Workshop in Political Theory and Policy Analysis, Indiana University.
Padilla-Fernandez M. D. and NuthallP.(2001):Farmers’ goals and efficiency in the production of sugar cane: The Philippine case, Farm and Horticultural Management Group Lincoln University, ISSN 1174-8796, Research Report 07/2001.
Statistic South Africa (2012): Census 2011, Statistical release P0301.4
The Encyclopaedia of Earth(2008)“Water Profile of South Africa”, (Updated in May 2012), website: http://www.eoearth.org/article/Water_profile_of_South_Africa. (Accessed on 1/08/2012)