a comparison of authentic and simulated mmpi profiles
TRANSCRIPT

Western Michigan University Western Michigan University
ScholarWorks at WMU ScholarWorks at WMU
Master's Theses Graduate College
11-1965
A Comparison of Authentic and Simulated MMPI Profiles A Comparison of Authentic and Simulated MMPI Profiles
Gaylis D. Brown
Follow this and additional works at: https://scholarworks.wmich.edu/masters_theses
Part of the Clinical Psychology Commons, and the Personality and Social Contexts Commons
Recommended Citation Recommended Citation Brown, Gaylis D., "A Comparison of Authentic and Simulated MMPI Profiles" (1965). Master's Theses. 3541. https://scholarworks.wmich.edu/masters_theses/3541
This Masters Thesis-Open Access is brought to you for free and open access by the Graduate College at ScholarWorks at WMU. It has been accepted for inclusion in Master's Theses by an authorized administrator of ScholarWorks at WMU. For more information, please contact [email protected].

A CCl1PARISON OF AUTHENTIC AND SIMULATED MMPI PROFILES
by
Gaylia D. Brown
A thesis submitted to the
Faculty of the School of Graduate Studies in partial fulfillment
of the Degree of Master of Arts
Western Michigan University Kalamazoo, Michigan
November 1965

ACKNOWLEDGMENTS
Sincerest and deepest appreciation is extended to Dr. M. H.
Robertson, who gave so generously of his time and experience while
serving as thesis adviser and committee chairman. The author is
especially grateful to Dr. Robertson for his additional inspiration,
concern, and guidance.
The author wishes to thank Dr. E. J. Asher and Dr. F. A. Fatzinger
for serving as members of her thesis committee. Their helpful sugges
tions and constructive criticisms are greatly appreciated.
A special thank you is given to Miss B. L. Townsend for her
assistance, continued interest and encouragement during the entire
study and preparation of the manuscript.
The author also expresses sincere gratitude to her parents,
Mr. and Mrs. V. E. Brown, for making both her thesis and degree
financially possible.
Gaylia D. Brown
ii

LIST OF TABLES
INTRODUCTION
METHOD
RESULTS • •
DISCUSSION
SUMMARY • •
REFERENCES
TABLE OF CONTENTS
. . . . . . '.
iii
PAGE
iv
1
6
9
27
32
34

LIST OF TABLES
TABLE PAGE
l Analysis of Performance Differences betweenMale-Female and Instruction Groups on the Lie (L)Scale . . .
2 Analysis of Performance Differences betweenMale-Female and Instruction Groups on the Validity
10
(F) Sea le . . . . . . . . . . . . . . . . . . . . . 12
3 Analysis of Performance Differences between Male-Female and Instruction Groups on the Defensive-ness (K) Sea le. . • . . . . . . . . . . . . . . . . . 13
4 Analysis of Performance Differences between Male-Female and Instruction Groups on the Hypochon-driasis (Hs) Scale. . . . . . . . . . . . • . . . . 14
5 Analysis of Performance Differences between Male-Female and Instruction Groups on the Depression (D) Scale . . . . . . . . . . . • . . . . . . . . . . 16
6 Analysis of Performance Differences between Male-Female and Instruction Groups on the Hysteria (Hy) Scale. . • . . . . . . . . . . . . . • . . . • . 17
7 Analysis of Performance Differences between Male-Female and Instruction Groups on the Psycho-pathic Deviate (Pd) Scale . . . . . . . . . 18
8 Analysis of Performance Differences between Male-Female and Instruction �roups on the Masculinity-Femininity (Mf) Scale . . . . . . . . . . . . . . . . 20
9 Analysis of Performance Differences between Male-Female and Instruction Groups on the Paranoia (Pa) Scale. . . . . . . . . . . . . . . . . . . . . 21
10 Analysis of Performance Differences between Male-Female and Instruction Groups on the Psychas-thenia (Pt) Scale • • • . . . . . . . . . • • . • . . 22
iv

TABLE
11 Analysis of Performance Differences between Male-Female and Instruction Groups on the Schizo-
PAGE
phrenia (Sc) Scale. . . . . . . . . . . . . 24
12 Analysis of Performance Differences between Male-Female and Instruction Groups on the Hypomania (Ma) Scale. • . . . . . • . . • . . . • . . . • . • . 25
13 Analysis of Performance Differences between Male-Female and Instruction Groups on the Social Introversion (Si) Scale . . . . . . . . . . . 26
14 Summary Table of Instruction Group Means for 13 MMPI Seales. . . . . . . . • . . . . . . .
V
28

INTRODUCTION
The Minnesota Multiphasic Personality Inventory (MMPI) is
widely used in government, Civil Service, and Peace Corps selection
and selection research. Particularly in the Peace Corps, it is
mandatory that all trainees be administered the MMPI as part of the
extensive selection process. Since Peace Corps trainees represent
a highly selected group, it is desirable to determine those person
ality traits which are unique or specific to these individuals. It
is, however, difficult to compare a Peace Corps group with matched
groups. Therefore, only similar groups may be used for such a
comparison. A group similar to the Peace Corps trainees is a
sample of subjects comparable in number, age, education, and sex
ratio.
Limited research has been conducted specifically with the
Peace Corps. Guthrie and McKendry (1963) studied the characteris
tics of 331 Peace Corps volunteers and found a high incidence of
social service and esthetic interests on the Strong Vocational
Interest Blank and the Study of Values. Adjustment patterns on the
MMPI had a lower than average incidence of anxiety symptoms; there
were few atypical profiles. Both men and women were significantly
lower in variability on the scales. There were elevated K scales
which suggested a strong emphasis on appearing symptom-free. The
subjects were found to be strongly motivated to make a favorable
impression. The motives for joining the Peace Corps were educational,
altruistic, and political. Their patterns of interest were so narrow
l

and specific as to allow for only a limited number of satisfying
career opportunities.
In this study, the MMPI was used to determine the personality
characteristics of Peace Corps trainees. This particular personal
ity test was chosen because it is required in Peace Corps selec
tion. It was more meaningful to compare the Peace Corps trainees
to college students, rather than to the actual norms of the MMPI.
Therefore, a sample of trainees was compared with a second similar
sample of college students. Both groups were administered the MMPI
with standard test instructions. However, there is some question
regarding the authenticity of the responses to self-report tests,
such as the MMPI, depending upon the conditions under which these
tests are taken. In this particular study, the investigator be
lieved that the Peace Corps trainees would not be completely honest
in their responses. The tendency to "fake good" might exist be
cause the trainees were aware that their final acceptance was
partially determined by the results of their tests.
A study was conducted by Michel (1965) with forty-one Peace
Corps volunteers. The volunteers were given self-report measures
and various ratings during training in the U. S. They were told
that the results of their tests would be used for research purposes
only and would not in any way influence Peace Corps decisions.
Scores on the self-report measures were related significantly to
performance abroad; the volunteers gave honest responses because
they knew the test results did not influence any decisions. Ratings
by training faculty, assessment board, peer groups, and interviewers
2

were not significantly related to the criterion of performance; the
volunteers knew that these ratings influenced selection decisions
and they presented false images of being very well-adjusted.
The findings of Delay, Pichot, and Perse (1960) also supported
this investigator's belief. Forty medical students were asked to
give very favorable responses on the MM.PI. This group was compared
with two matched control groups who were given standard test instruc
tions. The results indicated that the medical students in the con
trol groups ''faked goo�• and gave very favorable responses, even
though not being instructed to do so. These students were not in
formed regarding the purpose or future use of the test. Conse
quently, they assumed that the test results influenced some medical
school decisions, and they faked the MM.Pl to appear well-adjusted.
Due to the possibility of the Peace Corps trainees faking their
responses on the MMPI, it was necessary to compare a third group with
the trainees. This group consisted of college students who faked
(simulated) their test responses to appear the type of person they
thought the Peace Corps would select.
3
Thus, this study compared three groups on the MM.Pl: (1) authentic
Peace Corps trainees, (2) authentic college students, and (3) college
students simulating an interest in Peace Corps work, placing them
selves in a selection process where their final selection is par
tially determined by the results of the MM.PI.
Considerable research has demonstrated that the MM.Pl can be sim
ulated or faked, resulting in significantly good (well-adjusted) pro
files. For example, Grayson and Olinger (l957)administered the MMPI
with standard instructions to forty-five psychiatric patients on
entering the hospital. The next day the test was repeated, but
with instructions to answer it II the way a typical, well-adjusted
person on the outside would do". As a result, ,the simulated per
formance was better than the original. The patients mostly changed
to a lesser degree of severity or changed the nature of the behavior
disorder.
Wiggins (1959) contrasted the protocols of two groups of sub
jects who had taken the MMPI under standard and fake instructions,
respectively. In the fake or modified set of instructions, the sub
jects were to respond to the questions the way they thought "people
in general" would consider to be more desirable. The resulting
profiles of the simulated group demonstrated significant social ex
troversion, high activity, and an absence of anxiety and somatic
complaints.
Welsh and Dahlstrom (1960) also supported the previous find
ings on simulation, stating that responses on the MMPI may be manip
ulated to give the impression of a greater or lesser degree of ab
normality. The profiles may be II faked good" or II faked bad".
Groups of college students were given Pd and K scales of the
MMPI by Lawton and Powell (1963). The students were instructed to
respond in three different ways: honestly, faking good, and faking
bad, All groups successfully manipulated these scales according to
their specific instructions.
The previous research demonstrated that the MMPI can be manipu
lated. Subjects can fake their responses when instructed to do so.
4

Subjects may alao tend to give favorable responses, depending upon
the test conditions and future use of the results. In this study,
the Peace Corps trainees were compared with two other similar groups
to determine specific personality traita of the trainees. In order
to determine and analyze these traits, the following hypothesis was
postulated:
"There are no significant differences among the Peace Corps group, the 'authentic' (standard) group, and the 'simulation' group on any of the individual MMPI sea les."
5

METHOD
Subjects
The experimental design involved three groups consisting of
50 Ss each. One-third of the Ss (25 males and 25 females) was a
sample selected from a population of 100 Peace Corps trainees be
ing tested at �estern Michigan University during the summer of 1965.
These 50 trainees were all unmarried, 21 and 22 year-old college
graduates.
The two other groups combined consisted of 100 (50 males and
50 females) college undergraduate juniors and seniors enrolled in
the 1965 summer session at Purdue University. The age range of the
50 males was 19-22; the 50 females ranged 19-21. All Ss were un
married.
Procedure
The 150 Ss in the three groups were administered the Group
Short-Form of the Minnesota Multiphasic Personality Inventory (MM.PI).
The sample of 50 Peace Corps trainees was administered the MM.PI by
the staff of the Psychology Department at W.M.U. in conjunction with
other tests being given there during the summer evaluation program.
These trainees were administered the MM.PI with standard test in
structions, and were required to put their names on the answer sheets.
The sample of 50 Peace Corps protocols was selected from the total
number of trainees (100) to approximate the other two groups in age,
education, and male-female ratio. The 100 protocols were sorted
6

and 50 of the youngest trainees were chosen resulting in only 21 and
22 year-old Ss, consisting of 25 males and 25 females.
The investigator administered the MMPI to a second group of 50
Ss with standard test instructions, and assurances regarding confi
dential treatment of individual data. Constituting this group were
25 males and 25 females. The testing was done in two different ses
sions, with 25 mixed Ss in each group.
A third group of 50 Ss (25 males and 25 females) was adminis
tered the MMPI in sessions equivalent to the second group. However,
this group was not given standard test instructions, but had instruc
tions to simulate or "fake good" their responses. These Ss were in
structed to answer the test questions in a way that would demonstrate
an interest in Peace Corps work. They were told to present a very
favorable impression of themselves, realizing that their acceptance
into the Peace Corps depended partially on the results of the MMPI.
A brief description of the simulated situation was given as follows:
"You are being considered for Peace Corps work. You are interested in going to an African country to teach for two years. You have gone through an extensive selection process and are now being considered for final admission. Your admission depends partially on the results of this personality test that you are about to take. On this test, you will want to present a very favorable image of yourself to portray the kind of person that you think the Peace Corps wants as a teacher in an African country. You are under tremendous pressure to look good, since you are aware that the results of the MMPI will be used for selection decisions."
The 100 Ss in both the standard and simulation groups were vol
unteers selected from several different classes in various depart
ments at Purdue University. Four different testing times were set
7

and the Ss who volunteered merely signed up for one of the conven
ient times. The four testing sessions were previously designated
by the investigator to be either standard or simulation instructions,
with two sessions for each. The volunteers were not aware of this
designation, and each S had an equal chance of receiving either set
of instructions. Therefore, the volunteer procedure was random and
neither standard nor simulation group was biased in any way regard
ing characteristics of the sample. Each session was limited to 25
Ss with an approximately equal number of males and females (13 males
and 12 females or 12 males and 13 females). The sessions were con
ducted in a general classroom building on the Purdue campus. All Ss
were given as much time as necessary; however, every S completed the
test within one hour.
There was no form of identification requested on the standard
and simulated MMPI answer sheets. After all 100 Ss had been tested
by the investigator, the answer sheets were subsequently coded (eg:
male - sim., female - stand.). Three validity scales (L, F, K) and
ten clinical scales (Hs, D, Hy, Pd, Mf, Pa, Pt, Sc, Ma, Si) were
then machine scored. The K correction factor was applied to the
required clinical scales, and all 150 protocols were analyzed.
8

RESULTS
The analysis of variance was used to determine the statistically
significant differences. This analysis, although not ideally suited
to the MMPI, was the method of statistical analysis thought to be
most appropriate. The investigator was fully cognizant that this
analysis treats each scale independently, although there is inter
dependence among the scales. However, a total profile analysis
would not have produced the results desired in this study.
The analysis of variance was used to examine the effects on
each of the scales for: (1) sex (a difference between males and fe
males), (2) instructions (differences in the three sets of instruc
tions), and (3) interaction (the interaction between sex differences
and instructions). On the scales where there was a significant inter
action effect, these interactions were analyzed by observation. On
the scales where the instructions were significant, a Newman-Keuls
test was employed to determine the significant differences within
the three sets of instructions. On scales with significant differ
ences between the sexes, no further analysis was necessary.
Scale 1 (L)
Males and females did not differ significantly on the lte scale
(Table 1). There was a difference in the effect of instructions,
significant at the .01 level. All three instructional groups dif
fered significantly (.01 and .05 levels) from each other; the simu
lation group had the highest scores with the standard group lowest.
No significant interaction effect was found.
9
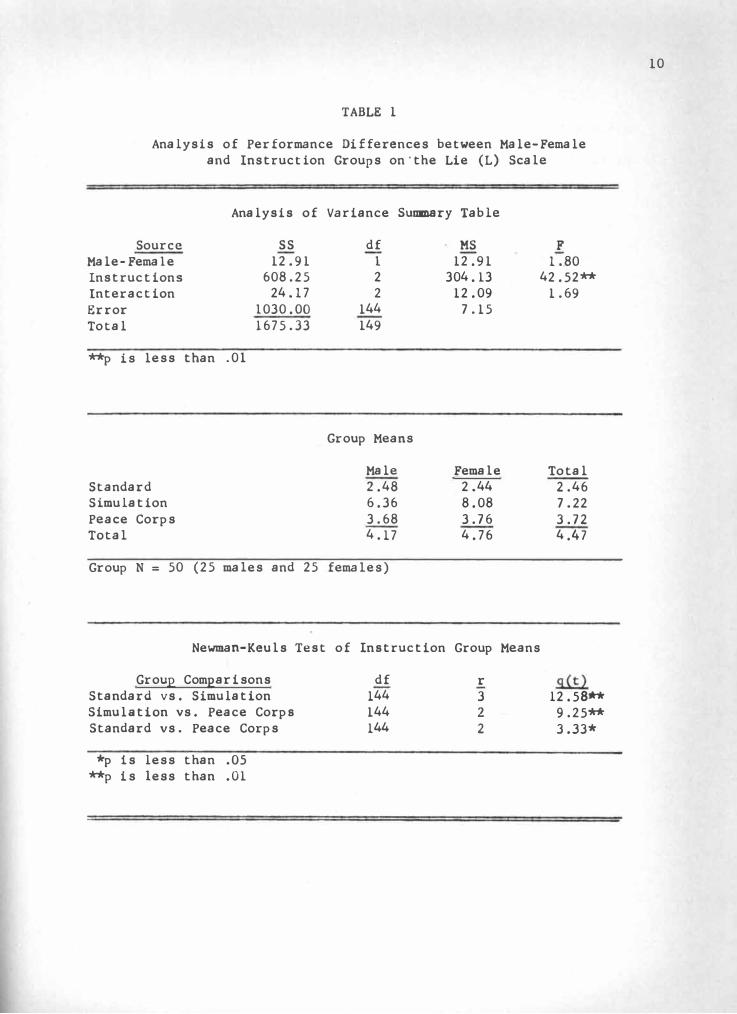
TABLE 1
Analysis of Performance Differences between Male-Female and Instruction Groups on·the Lie (L) Scale
Analysis of Variance Swmnary Table
Source Male-Female Instructions Interaction Error Total
ttp is less than
Standard Simulation Peace Corps Total
.01
ss
12. 91608.25
24 .17 1030.00 1675.33
df 1 2 2
144 149
Group Means
Male 2.48 6.36 3.68 4.17
Group N = 50 (25 males and 25 females)
MS
12.91 304 .13 12.09
7.15
Female 2.44 8.08 3.76 4.76
Newman-Keuls Test of Instruction Group Means
Group Comparisons Standard vs. Simulation Simulation vs. Peace Corps Standard vs. Peace Corps
"kp is less than .05 ttp is less than .01
df 144 144 144
r 3
2
2
F
1.80 42.52tt
1.69
Total 2.46 7.22 3.72 4.47
12.58"'""' 9.25-A--A-3.33*
10

Scale 2 (F)
Males and females did differ significantly on the validity scale
at the .01 level; the males had significantly higher scores (Table 2).
There was also a significant difference in instructions at the .05
level. The standard group differed significantly from both the sim
ulation (.01 level) and Peace Corps (.05 level) groups. There was
no significant difference between the simulation and Peace Corps
groups. The standard group obtained the highest scores, and the
simulation group obtained the lowest scores on this scale. There
was no significant interaction.
Scale 3 (K)
Males and females did not differ significantly on the defensive
ness scale (Table 3). There was also no significant interaction ef
fect. The instructions of the three groups were significant at the
.01 level. The standard group differed significantly from the sim
ulation group (.01) and from the Peace Corps group (.01). The
simulation group did not differ significantly from the Peace Corps
group. The simulation group was highest and the standard group low
est on the K scale.
Scale 4 (Hs)
There were no significant differences on the hypochondriasis
scale (Table 4). Males and females did not differ; there was no dif
ference in instructions, and there was no significant interaction.
11

TABLE 2
Analysis of Performance Differences between Male-Female and Instruction Groups on the Validity (F) Scale
Analysis of Variance Sumnary Table
Source Male-Female Instructions Interaction Error Total
'frp is less
'k*p is less
Standard Simulation Peace Corps Total
than .OSthan .01
ss
62. 7366.72
3.57 1017.52 1150 .54
df 1 2 2
144 149
Group Means
Male 4.84 3.36 4.00 4.07
Group N = 50 (25 males and 25 females)
- MS
62.73 33.36
1.79 7.07
Female 3.84 2.20 2.28 2 .77
Newman-Keuls Test of Instruction Group Means
Groue Comearisons df r \
Standard vs. Simulation 144 3 Simulation vs. Peace Corps 144 2 Standard vs. Peace Corps 144 2
'frp is less than .05
'k*p is less than .01
F
8.88tt
4.72* .25
Total 4.34 2.78 3.14 3.42
4 .14tt .95
3 .19*
12

TABLE 3
Analysis of Performance Differences between Male-Female and Instruction Groups on the Defensiveness (K) Scale
Analysis of Variance Summary Table
Source Male-Female Instructions Interaction Error Total
'k"kp is less than .01
Standard Simulation Peace Corps Total
ss
4T:° 61 534.28
16.41 2639.76 3232.06
df l 2 2
144 149
Group Means
Male 15.40 19.72 17.72 17.61
Group N = 50 (25 males and 25 females)
MS 4T:°61
267.14 8.21
18.33
Female 15.80 20.52 19 .58 18.67
Newman-Keuls Test of Instruction Group Means
Group Comparisons Standard vs. Simulation Simulation vs. Peace Corps Standard vs. Peace Corps
**Pis less than .01
df 144 144 144
r 3 2 2
F 2.27
14.57tt .45
Total --
15.60 20.12 18.70 18.14
7.46tt 2.34 5 .11**
13

TABLE 4
Analysis of Performance Differences between Male-Female and Instruction Groups on the Hypochondriasis (Hs) Scale
Source Male-Female Instructions Interaction Error Total
Standard Simulation Peace Corps Total
Analysis of
ss
°f:"41 36.17 12.25
964.56 1015.39
Variance Sunmary Table
df l 2 2
144 149
Group Means
Male 12.40 12.16 11.64 --
12.07
MS
°f:"41 18.09
6 .13
Female 13 .36 11.72 11.88 12.32
Group N = 50 (25 male and 25 female)
F
.36 2 .70
. 91
Total 12.88 11.94 11.76 --
12 .19
14

Scale 5 (D)
Males and females did not differ significantly on the depression
scale (Table 5). There were significant instructions (,01), with
the standard group having highest scores and the Peace Corps group
lowest scores. The standard and simulation groups differed signifi
cantly (.05); the standard and Peace Corps groups also differed sig
nificantly (.01). There was no significant difference between the
simulation and Peace Corps groups. A significant (.01) interaction
effect was found on the D scale.
Scale 6 (Hy)
There were no significant differences on the hysteria scale
(Table 6). Males and females did not differ; there was no signifi
cant interaction, and the instructions were not significant.
Scale 7 (Pd)
The only significant difference on the psychopathic deviate
scale was between males and females (Table 7). Males had the high
est scores which were significantly different from the females at
the .05 level. There was no interaction and no significant differ
ence in instructions.
Scale 8 (Mf)
Males and females differed significantly (.01) on the mascu
linity-femininity scale; females had higher scores (Table 8). There
was also a significant (.01) difference with instructions; the Peace
Corps was highest and the simulation group lowest. The standard and
15

TABLE 5
Analysis of Performance Differences between Male-Female and Instruction Groups on the Depression (D) Scale
Analysis of Variance Summary Table
Source ss df MS
Male-Female -.43 l -.43Instructions 257.97 2 128.99 Interaction 190.77 2 95.39 Error 2648. 72 144 18.39 Total 3087.89 149
**Pis less than .01
Group Means
Male Female
Standard 17.80 21.08 Simulation 18.24 16 .48 Peace Corps 16.88 15.68
--
Total 17.64 17.75
Group N = 50 (25 males and 25 females)
Newman-Keuls Test of Instruction Group Means
Group Comparisons Standard vs. Simulation Simulation vs. Peace Corps Standard vs. Peace Corps
1rp is less than .05 *""Pis less than .01
df 144 144 144
r
2
2
3
F
.02 7.01** 5 .19tt
Total 19.44 17 .36 16.28 17.69
3.42* 1.78 5.20*""
16
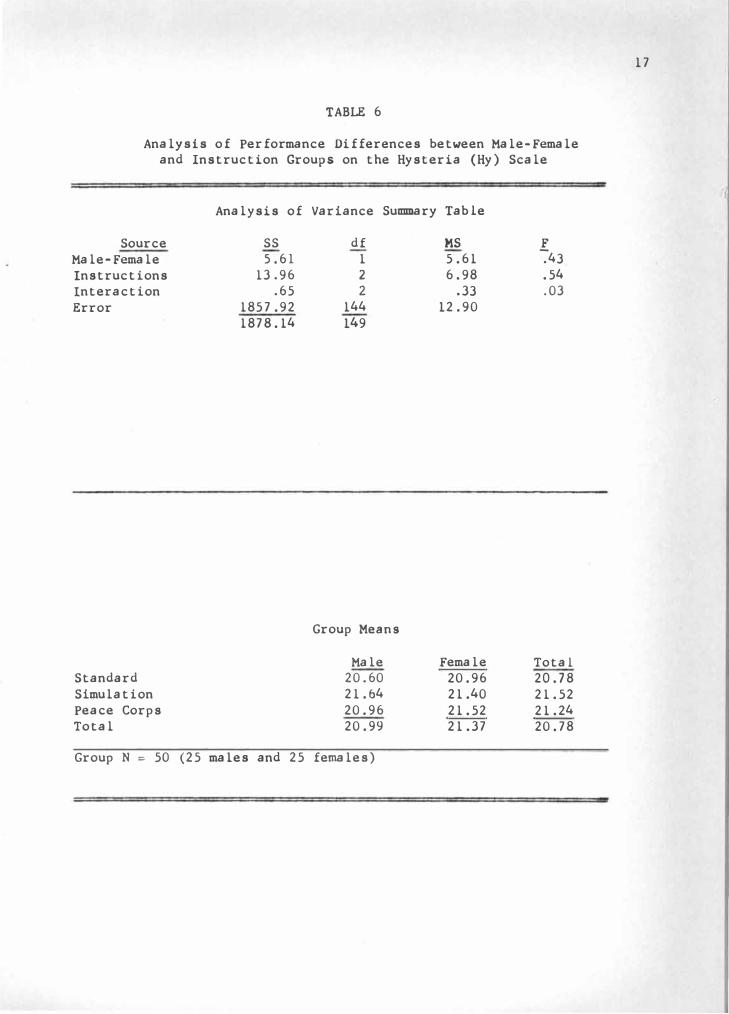
TABLE 6
Analysis of Performance Differences between Male-Female and Instruction Groups on the Hysteria (Hy) Scale
Source Male-Female Instructions Interaction Error
Standard Simulation Peace Corps Total
Analysis of
ss
5.61 13.96
.65 1857. 92 1878.14
Variance Summary
df l 2
2
144 149
Group Means
Male 20.60 21.64 20.96 20.99
Group N = 50 (25 males and 25 females)
Table
MS
5.61 6.98
.33 12.90
Female 20.96 21.40 21.52 21.37
F
:43 .54 .03
Total 20. 7821.5221.2420.78
17

TABLE 7
Analysis of Performance Differences between Male-Female and Instruction Groups on the Psychopathic Deviate (Pd) Scale
Analysis of Variance Sunnnary °Table
Source ss df MS F
Male-Female 80.67 l 80.67 5:20* Instructions 55.84 2 27.92 1.80 Interaction 16.37 2 8 .19 .53 Error 2234 .16 144 15.52 Total 2387.04 149
*P is less than .05
Group Means
Male Female Total Standard 23.24 22.28 22.76 Simulation 23.40 21.00 22.20 Peace Corps 21.80 20. 76 21.28
-- -- --
Total 22.81 21.35 22.08
Group N = 50 (25 males and 25 females)
18

simulation groups differed significantly (.01), and the simulation
and Peace Corps groups differed significantly (.05). There was no
significant difference between the standard and Peace Corps groups.
A significant (.05) interaction was also noted. The simulation
males were exceptionally low on the Mf scale.
Scale 9 (Pa)
There were no significant differences on the paranoia scale
(Table 9).
Scale 10 (Pt)
Males and females did not differ significantly on the psychas
thenia scale (Table 10). There was a difference in instructions
significant at the .01 level. The standard group differed signifi
cantly from both the simulation and Peace Corps groups at the .01
level. There was no significant difference between the simulation
and Peace Corps groups. The standard group obtained the highest
scores on the Pt scale, while the simulation group obtained the low
est scores. The interaction effect was significant at the .05 level.
The standard females were exceptionally high on the Pt scale.
Scale 11 (Sc)
There was no significant difference between males and females
on the schizophrenia scale (Table 11), Instructions were signifi
cant (.01); the standard group was highest and the simulation group
lowest. The standard group differed significantly from the simula
tion group (.01) and the Peace Corps group (.05). There was no
19

TABLE 8
Analysis of Performance Differences between Male-Female and Instruction Groups on the Masculinity-Femininity (Mf) Scale
Analysis of Variance Sunnnary Table
Source ss df MS F
Male-Female 3408.17 l 3408.17 132.83tt Instructions 262.34 2 131.17 5 ,11-lrlr
Interaction 163.61 2 81.81 3 .19* Error 3694.88 144 25.66 Total 7529.00 149
� is less than .05 *'kp is less than .01
Group Means
Male Female Total Standard 26. 76 36.92 31.84 Simulation 23.28 35.00 29 .14 Peace Corps 28.68 35.40 32.04 Total 26.24 35. 77 31.01
Group N = 50 (25 males and 25 females)
Newman-Keuls Test of Instruction Group Means
Group Comparisons Standard vs. Simulation Simulation vs. Peace Corps Standard vs. Peace Corps
*p is less than .05**p is less than .01
df 144 144 144
r
2
3
2
3.76** 4.04*
.27
20

TABLE 9
Analysis of Performance Differences between Male-Female and Instruction Groups on the Paranoia (Pa) Scale
Analysis of Variance Summary Table
Source ss df MS F Male-Female .81 l .81 .14 Instructions .09 2 .05 .01 Interaction 6.97 2 3.49 .59 Error 852.72 144 Total 860.59 149
Group Means
Male Female Total Standard 9.04 9.36 9.20 Simulation 9.60 8.88 9.24 Peace Corps 9.20 9.16 9.18 Total 9.28 9.13 9.21
Group N = 50 (25 males and 25 females)
21

TABLE 10
Analysis of Performance Differences between Male-Female and Instruction Groups on the Psychasthenia (Pt) Scale
Analysis of Variance Summary Table
Source ss df .MS Male-Female 5�00 l 54.00Instructions 421. 7 8 2 210.89 Interaction 190.84 2 95.42 Error 3172.56 144 22.03 Total 3839.18 149
*P is less than .05**P is less than .01
Group Means
Male Female Standard 26.64 31.00 Simulation 25.52 24. 76Peace Corps 25.40 25.40
--
Total 25.85 27.05
Group N = 50 (25 males and 25 females)
Newman-Keuls Test of Instruction Group Means
Group Comparisons Standard vs. Simulation Simulation vs. Peace Corps Standard vs. Peace Corps
**Pis less than .01
df 144 144 144
r
3
2
2
F
2 .45 9.57** 4.33*
Total --
28.82 25.14 25 .40 26.45
5.54** .39
5.15*-k
22

significant difference between the simulation and Peace Corps groups.
There was also no significant interaction.
Scale 12 (Ma)
Males and females did not differ significantly on the hypomania
scale (Table 12). However, there were significant instructions at
the .05 level. The standard and simulation groups did not differ
significantly; the simulation and Peace Corps groups did differ sig
nificantly (.05), as did the standard and Peace Corps groups (.05).
Highest scores on the Ma scale were obtained by the simulation group;
the lowest scores were obtained by the Peace Corps group. There was
an interaction, also significant at the .05 level.
Scale 13 (Si)
There was no significant difference between males and females
on the social introversion scale (Table 13). The instructions were
significant at the .01 level; the standard group was high and the
simulation group low. The standard group differed significantly
from both the simulation and Peace Corps groups at the .01 level.
There was no significant difference between the simulation and Peace
Corps groups. A significant (.05) interaction was found on the Si
scale. Standard females were exceptionally high on this scale;
simulation females were exceptionally low.
23

TABLE 11
Analysis of Performance Differences between Male-Female and Instruction Groups on the Schizophrenia (Sc) Scale
Analysis of Variance Summary Table
Source Male-Female Instructions Interaction Error Total
ss
.80 204.96
17 .98 2888. 72 3112.46
'lhlrp is less than .01
Standard Simulation Peace Corps Total
Group N = 50 (25 males and 25
df 1 2 2
144 149
Group Means
Male 27.32 25.20 25.88 26.13
females)
· MS.80
102.48 8.99
20.06
Female 28.08 24.92 24 .96 --
25.99
Newman-Keuls Test of Instruction Group Means
Group Comparisons Standard vs. Simulation Simulation vs. Peace Corps Standard vs. Peace Corps
'kp is less than .05 **p is less than .01
df 144 144 144
r 3 2 2
F .04
5. lltt .45
Total --
27.70 25.06 25.42 --
26.06
4.16'lhlr .56
3.59*
24

TABLE 12
Analysis of Performance Differences between Male-Female and Instruction Groups on the Hypomania (Ma) Scale
Analysis of Variance Summary Table
Source Male-Female Instructions Interaction Error Total
*p is less than . 05
Standard Simulation Peace Corps Total
ss
2.67 107.05 102. 57
1999.04 2211.33
df l 2
2
144 149
Group Means
Male 21.76 20.28 19.16 20.40
Group N = 50 (25 males and 25 females)
· MS
2.67 53.53 51.29 13.88
Female 19.92 22.48 19.60 20.67
Newman-Keuls Test of Instruction Group Means
Group Comparisons Standard vs. Simulation Simulation vs. Peace Corps Standard vs. Peace Corps
*p is less than .05
df 144 144 144
r
2
3
2
F .19
3.86* 3.69
Total 20.84 21.38 19.38 20.53
.9.itl 1.02 3.79* 2 .77*
25

TABLE 13
Analysis of Performance Differences between Male-Female and Instruction Groups on the Social Introversion (Si) Scale
Analysis of Variance Summary Table
Source ss df . MS F
Male-Female 4T:_04 l 4T:,04 1.70 Instructions 1138.41 2 569.21 20.52** Interaction 250 .12 2 125.06 4.51* Error 3994.00 144 27.74 Total 5429.57 149
-lrp is less than .05 *""'P is less than .01
Group Means
Male Female Total Standard 16.04 18.28 17 .16 Simulation 12.68 8.64 10.66 Peace Corps l3 .12 11.56 12.34 Total 13.95 12.83 l3 .39
Group N = 50 (25 males and 25 females)
Newman-Keuls Test of Instruction Group Means
Group Comparisons Standard vs. Simulation Simulation vs. Peace Corps Standard vs. Peace Corps
ttp is less than .01
df 144 144 144
r 3 2 2
8. 72**2.256 .47"'*
26
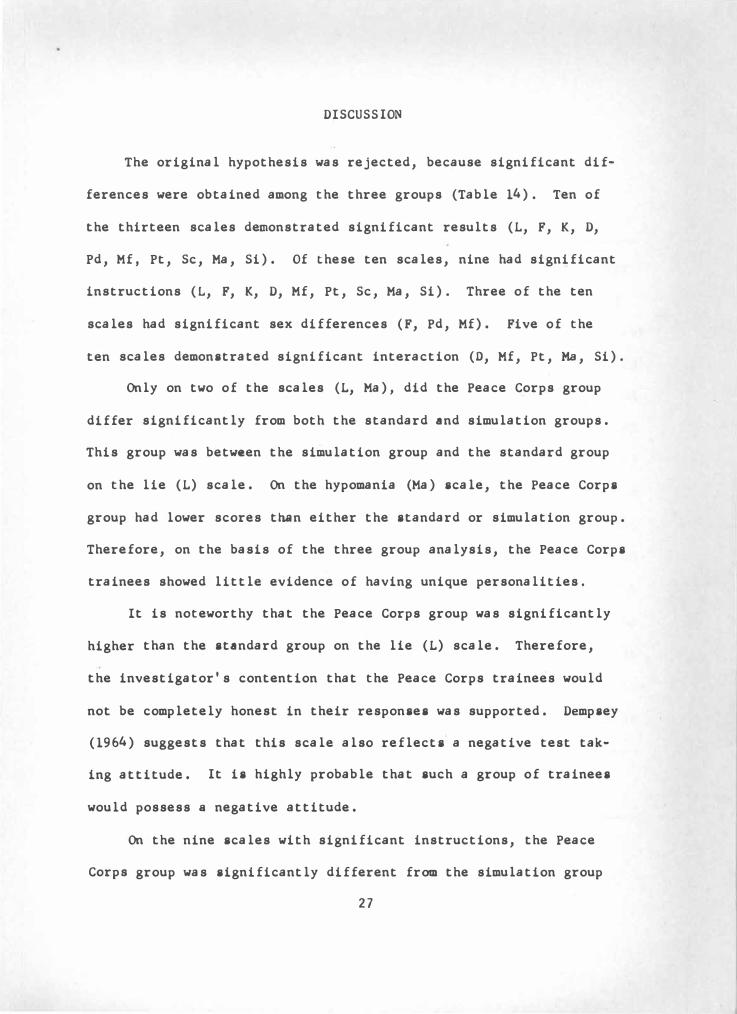
DISCUSSION
The original hypothesis was rejected, because significant dif
ferences were obtained among the three groups (Table 14), Ten of
the thirteen scales demonstrated significant results (L, F, K, D,
Pd, Mf, Pt, Sc, Ma, Si). Of these ten scales, nine had significant
instructions (L, F, K, D, Mf, Pt, Sc, Ma, Si), Three of the ten
scales had significant sex differences (F, Pd, Mf), Five of the
ten scales demonstrated significant interaction (D, Mf, Pt, Ma, Si).
Only on two of the scales (L, Ma), did the Peace Corps group
differ significantly from both the standard and simulation groups.
This group was between the simulation group and the standard group
on the lie (L) scale, On the hypomania (Ma) scale, the Peace Corps
group had lower scores than either the standard or simulation group.
Therefore, on the basis of the three group analysis, the Peace Corps
trainees showed little evidence of having unique personalities.
It is noteworthy that the Peace Corps group was significantly
higher than the standard group on the lie (L) scale. Therefore,
the investigator's contention that the Peace Corps trainees would
not be completely honest in their responses was supported. Dempsey
(1964) suggests that this scale also reflects a negative test tak
ing attitude, It is highly probable that such a group of trainees
would possess a negative attitude,
On the nine scales with significant instructions, the Peace
Corps group was significantly different from the simulation group
27

,
TABLE 14
Summary Table of Instruction Group Means for 13 MMPI Scales
Scale Standard Simulation --
M F M X
Lie (L) 2.48 2.44* 6.36 8.08*
Validity (F) 4.84 3.84* 3.36 2.20
Defensiveness (K) 15 .40 15.80* 19.72 20.52
Hypochondria sis (Hs) 12.40 13 .36 12 .16 11. 72
Depression (D) 17 .80 21.08* 18.24 16 .48
Hysteria (Hy) 20.60 20.96 21.64 21.40
Psychopathic Deviate (Pd) 23.24 22.28 23.40 21.00
Masculinity-Femininity (Mf) 26.76 36.92 23.28 35.00*
Paranoia (Pa) 9 ,04 9.36 9.60 8.88
Psychasthenia (Pt) 26.64 31. 00* 25. 52 24.76
Schizophrenia (Sc) 27.32 28.08* 25.20 24.92
Hypomania (Ma) 21.76 19 .92 20.28 22.48
Socia 1 Introversion (Si) 16.04 18.28* 12.68 8.64
Group N = 50 (25 males and 25 females)
Peace
M
3.68
4.00
17.72
11.64
16.88
20.96
21.80
28.68
9.20
25.40
25.88
19.16
13 .12
*Group mean significant from other group means at .05 level
28
Corps
F
3 .76*
2.28
19.68
11.88
15.68
21.52
20. 76
35.40
9.16
25.40
24.96
19.60*
11.56

on only three scales (L, Mf, Ma). The Peace Corps group differed
significantly from the standard group on eight of the nine scales
(L, F, K, D, Pt, Sc, Ma, Si). Therefore, in general, the Peace Corps
group was more similar to the simulation group than to the standard
group on the MMPI scales.
The results of this study also demonstrated a significant dif
ference between the standard and simulation groups on eight scales
(L, F, K, o, Mf, Pt, Sc, Si). Early research, such as Calvin (1952),
Cofer (1949), and Hunt (1948) showed that on the MMPI, 11fake good"
profiles could not be discriminated from honest profiles. However,
later research findings of Braun (1962), Braun (1963), Dicken (1959),
Grayson and Olinger (1957), Lawton (1963), and Wiggins (1959) support
the present study. Simulated and honest (standard) profiles can be
discriminated and do differ significantly. These differences are
consistently in the direction of better adjustment from the standard
to the simulation group.
Specific trends were indicated by the results of this study.
For example, females were more successful than males at simulating
good adjustment. This is also consistent with Noll's study (1951).
The greater simulation in the present study was evident because the
females had lower mean scores on all clinical scales except hypomania
(Ma) and masculinity-femininity (Mf). The lower scores indicate
better adjustment. However, the simulation females had high Mf
scores tending toward masculinity. Considering the activities of
Peace Corps volunteers, these higher scores suggest appropriate good
29

adjustment. A similar trend occurred on the Ma scale, where the
simulation females had higher scores than the simulation males.
Wiggins (1959) reported that elevated Ma scores indicate a high
level of energy and activity. Again, considering the activities
in the Peace Corps, these higher scores suggest good rather than
poor adjustment.
The females in the simulation group had higher lie (L) scores
than the corresponding males. This difference also indicates the
females' greater success with simulation. The defensiveness (K)
scores are consistent with the L scores. The simulation females had
higher K scores than the simulation males, indicating that the fe
males were more defensive. Tyler (1963) supports the correlation
between Land K scores,
In the only other study of Peace Corps volunteers on the MMPI,
Guthrie and McKendry (1963) found that elevated K scales suggested
a strong emphasis on appearing symptom-free. They also found male
and female volunteers to be low on depression (D) and psychasthenia
(Pt) scales. The present study showed similar findings. The sig
nificantly elevated K scale of the Peace Corps group seemed to indi
cate the importance of making a good impression and appearing
symptom-free. Also, D and Pt scales of the Peace Corps group were
significantly lower than the standard group.
The results of this study determined the Peace Corps group was
significantly different from the standard group on a majority of
MMPI scales. According to individual scale descriptions by Hathaway
30

and McKinley (1951), the following differences were apparent. The
Peace Corps group was: (1) more dishonest in responses -- higher
L scores, (2) more rational and pertinent in responses -- lower F
scores, (3) more defensive against weaknesses -- higher K scores,
(4) less depressed -- lower D scores, (5) less phobic and compul
sive -- lower Pt scores, (6) less bizarre and unusual -- lower Sc
scores, (7) less overproductive and manic
less withdrawn and more socially extroverted
lower Ma scores, (8)
lower Si scores.
The Peace Corps and simulation groups were found to be more
similar. However, the question arises whether the Peace Corps
trainees were dishonest in their responses (" faking good") or ac
tually were "good". Colmen, Kaplan, and Boulger (1964), in their
experience with Peace Corps volunteers, reported that defensiveness
(K) scores tend to be positively related to overseas competence and
maturity. They also reported social introversion (Si) scores nega
tively related to competence and performance abroad. Thus, the
possibility remains that these select individuals not only appeared
well-adjusted, but in reality were well-adjusted.
31

SUMMARY
The purpose of this study was to determine whether Peace Corps
trainees have unique personality traits which direct their interest
into such an area as Peace Corps work. The Minnesota Multiphasic
Personality Inventory (MMPI) was used to determine these traits. A
sample of 50 Peace Corps trainees was administered the MMPI with
standard test instructions. A second similar group, consisting of
50 college students, was also administered the MMPI ·with standard
test instructions. A third group of 50 college students was adminis
tered the MMPI with instructions to simulate an interest in Peace
Corps work, portraying the type of person they thought the Peace
Corps would select.
The Peace Corps trainees were compared with the standard or
autherrtic college group to determine personality differences on the
MMPI scales. However, the investigator believed that the trainees
would not be completely honest in their responses. The tendency to
11 fake good" might exist because they were aware that their final
acceptance into the Peace Corps was partially determined by the re
sults of the MMPI. Consequently, the third or simulation group was
used to compare the simulated and Peace Corps responses.
The results demonstrated that the standard and Peace Corps
groups differed significantly on a majority of scales, as did the
standard and simulation groups. On almost half of the scales, the
32

Peace Corps and simulation groups were not significantly different.
However, although the Peace Corps trainees were more similar to
the simulation group than to the standard group, the possibility re
mains that the trainees not only appeared well-adjusted, but actually
were well-adjusted.
33

REFERENCES
Braun, J., Effects of positive and negative faking sets on the Survey of Interpersonal Values. Psychological Reports, 1963, 13, 171-173.
Braun, J., Effects of top management faking set on the Gordon Personal Inventory. Psychological Reports, 1962, 10, 611-614.
Calvin, A. and Hanley, c., An investigation of dissimulation on the MMPI by means of the lie detector. Journal of Applied Psychology, 1952, 41, 312-316.
Cofer, c., Chance, R. and Judson, L., A study of malingering on the MMPI. Journal .2! Psychology, 1949, 27, 491-499.
Colmen, J., Kaplan, S. and Boulger, J., Selection and selection research in the Peace Corps. Research Notes, 7, (August 1964), 13.
Delay, S., Pichot, R. and Perse, c., The detection of simulation on the MMPI. � de Psychologie Appliquee, 1960, 10, 249-262.
Dempsey, P., Overall performance on the MMPI as it relates to test taking attitudes and clinical scale scores. Journal of Clinical Psychology, 1964, 20, 154-156.
Dicken, C. F., Simulated patterns on the Edwards Personal Preference Schedule. Journal of Applied Psychology, 1959, 43, 372-378.
Grayson, H. and Olinger, L., Simulation of normalcy by psychiatric patients on the MMPI. Journal of Consulting Psychology, 1957, 21, 73-77.
Guthrie, G. and McKendry, M., Interest patterns of Peace Corps volunteers in a teaching project. Journal of Educational Psy
chology, 1963, 54, 261-267.
Hathaway, S. R. and McKinley, J. c., Minnesota Multiphasic Personality Inventory Manual. New York: The Psychological Corporation, 1951.
Hunt, H., The effect of deliberate deception on MMPI performance. · Journal of Consulting Psychology, 1948, 12, 396-402.
34

Lawton, M. and Powell, R., Deliberate faking on the Pd scale of the MMPI. Journal of Clinical Psychology, 1963, 19, 327-330.
Marks, P. and Seeman, w., The Actuarial Description of Abnormal Personality. Baltimore: Williams and Wilkins Co., 1963,
Mischel, W., Predicting the success of Peace Corps volunteers in Nigeria. Journal of Personality and Social Psychology, 1965, l, 510-517.
Noll, V., Simulation by college students of a prescribed pattern on a personality scale. Educational and Psychological Measurement, 1951, 11, 478-488.
Tyler, L., Tests and Measurements. New Jersey: Prentice-Hall, Inc., 1963.
Welsh, G. S. and Dahlstrom, W. G., An MMPI Handbook: ! Guide!£� in Clinical Practice and Research. Minneapolis: University of Minnesota Press, 1960.
Wiggins, J. S., Interrelationships among MMPI measures of dissimulation under standard and social desirability instructions. Journal of Consulting Psychology, 1959, 23, 419-427.
35