a comparison between ltc in japan and sweden 2002 -2010 in terms of population, needs, provided...
TRANSCRIPT

A comparison between LTC in Japan and Sweden 2002 -2010 in terms of population,
needs, provided services and costs
Marten LagergrenNoriko KurubeYasuhiko Saito
Presentation at the REVES conference in Singapore June 4 , 2015

The system of long-term care of the elderly in Japan
• A National Long-Term Care Insurance system financed by premiums was introduced in 2000. Major reform in 2005 in order to curb cost increase
• Traditional emphasis on long-term care in hospitals – now more services in the community and in nursing homes
• Many elderly persons live with their children -emphasis on relief support
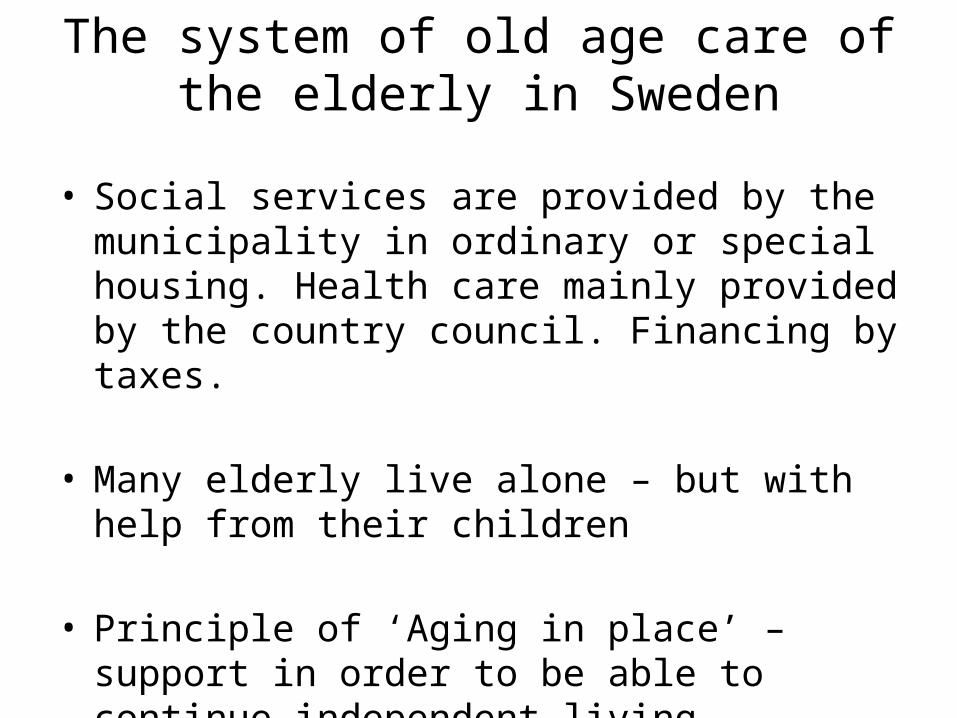
The system of old age care of the elderly in Sweden
• Social services are provided by the municipality in ordinary or special housing. Health care mainly provided by the country council. Financing by taxes.
• Many elderly live alone – but with help from their children
• Principle of ‘Aging in place’ – support in order to be able to continue independent living

Assessment of aged care needs in Japan
• Very formal assessment of needs through detailed questionnaire and computer calculation.
• According to law only personal dependency should form basis of decision.

Assessment of aged care needs in Sweden
• Informal assessment by care managers in the municipality
• According to the law the entire life situation of the old person should be taken into consideration
• Detailed decision concerning type and amount of services
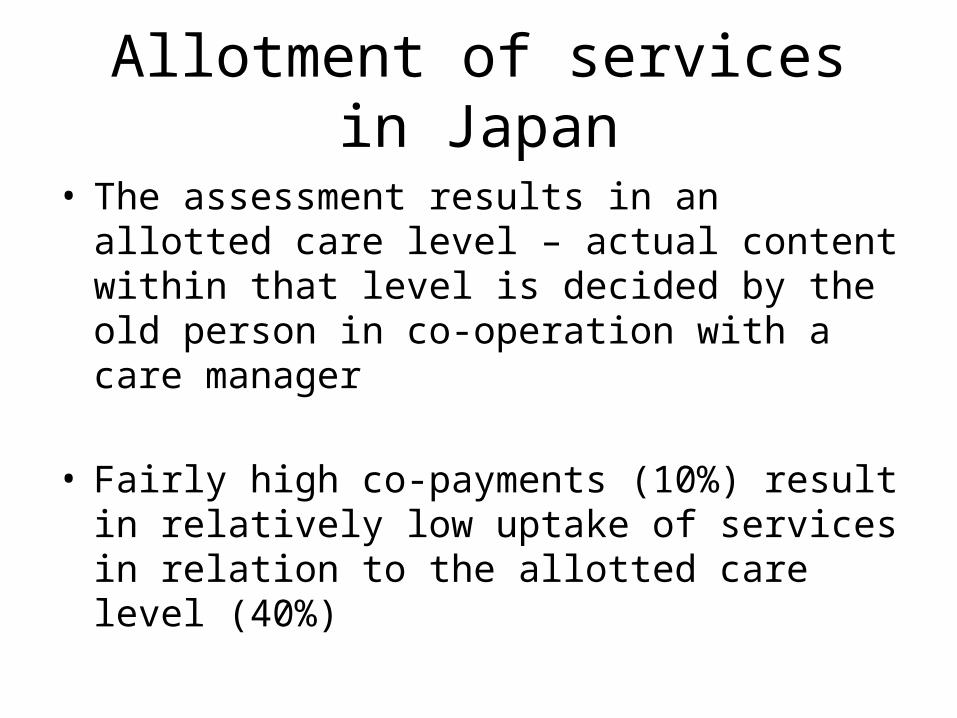
Allotment of services in Japan
• The assessment results in an allotted care level – actual content within that level is decided by the old person in co-operation with a care manager
• Fairly high co-payments (10%) result in relatively low uptake of services in relation to the allotted care level (40%)

Allotment of services in Sweden
• Large differencies between municipalities when it comes to coverage and amount of allotted services
• Very low co-payments – average 4%. High uptake of allotted services
• Actually executed services may differ from decided
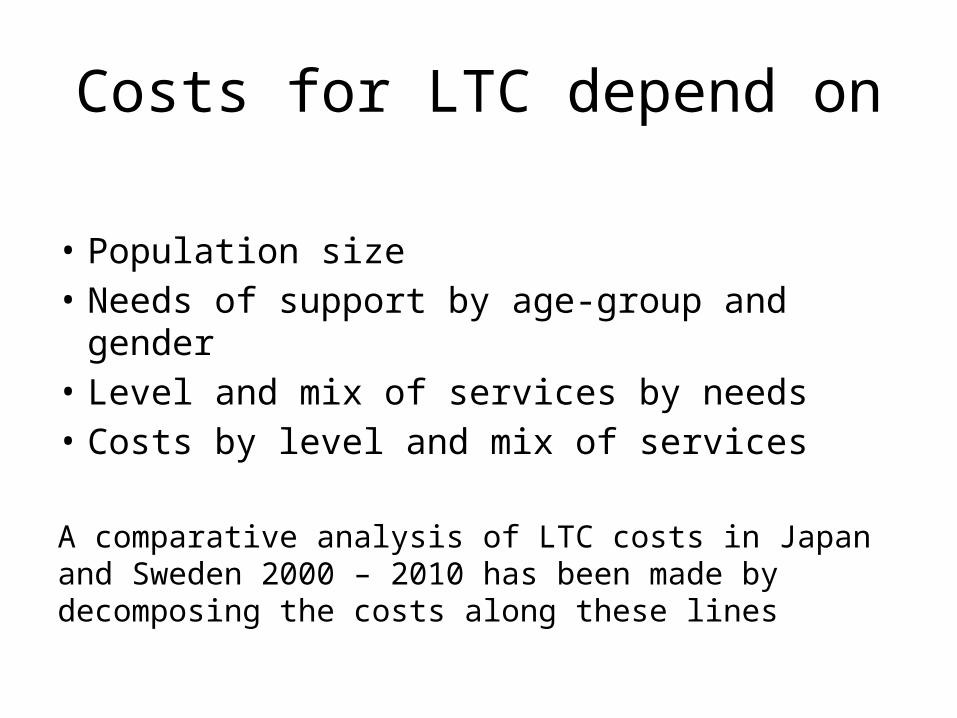
Costs for LTC depend on
• Population size• Needs of support by age-group and gender• Level and mix of services by needs• Costs by level and mix of services
A comparative analysis of LTC costs in Japan and Sweden 2000 – 2010 has been made by decomposing the costs along these lines

Data sources: Needs by age-group and gender
• Japan: ADL-dependency by age-group and gender according to five waves of the NUJLSOA-study, 1999 -2009. In total 19602 obs.
• Sweden: Index of ill-health (self-rated, GALI, mobility limitations and chronic disease) by age-group and gender according to three waves of the Swedish Survey of Living conditions (SSLC), 2000 - 2011. In total 9 433 obs.

Data sources: Provided services by needs
• Japan: Data from registrations in the LTC insurance system in nine municipalities, 2001 - 2011, connecting provision of services to functional limitations, in total 81 608 obs.
• Sweden: Data collected for the purpose of tax equalisation in eight municipalities (The ”field surveys”) connecting provision of services to level of ill-health , in total around 10 000 obs.
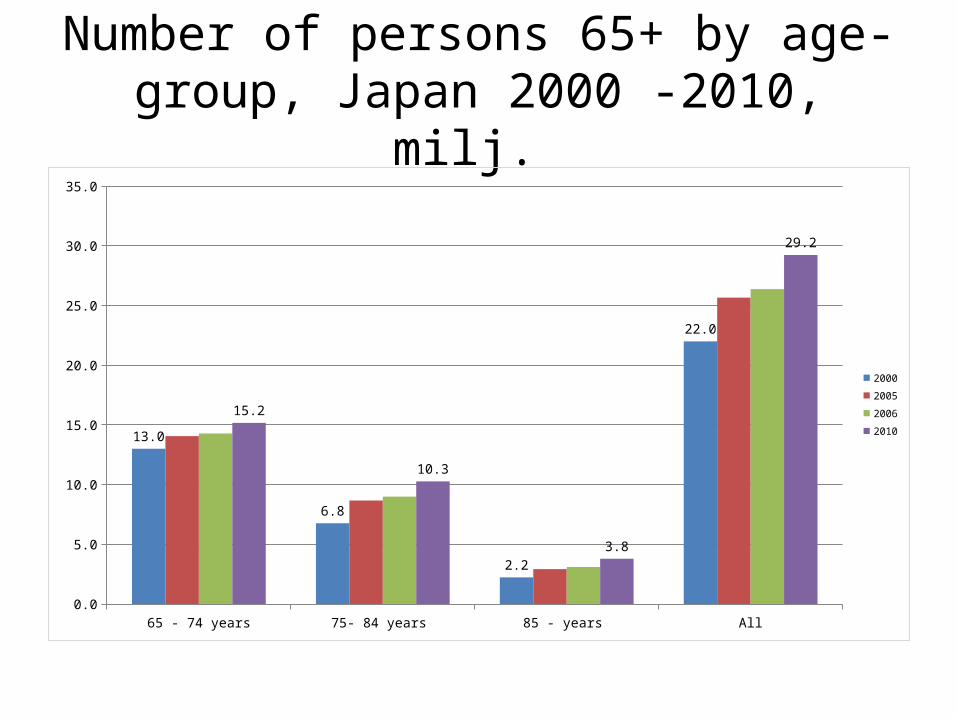
Number of persons 65+ by age-group, Japan 2000 -2010, milj.
65 - 74 years 75- 84 years 85 - years All0.0
5.0
10.0
15.0
20.0
25.0
30.0
35.0
13.0
6.8
2.2
22.0
15.2
10.3
3.8
29.2
2000200520062010
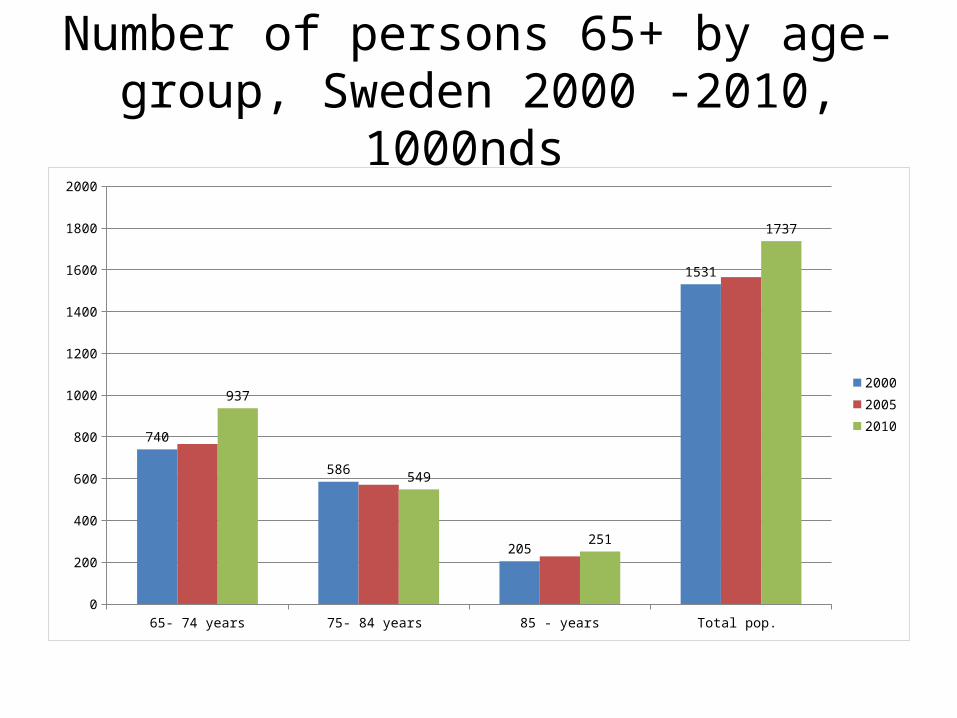
Number of persons 65+ by age-group, Sweden 2000 -2010, 1000nds
65- 74 years 75- 84 years 85 - years Total pop. 0
200
400
600
800
1000
1200
1400
1600
1800
2000
740
586
205
1531
937
549
251
1737
200020052010
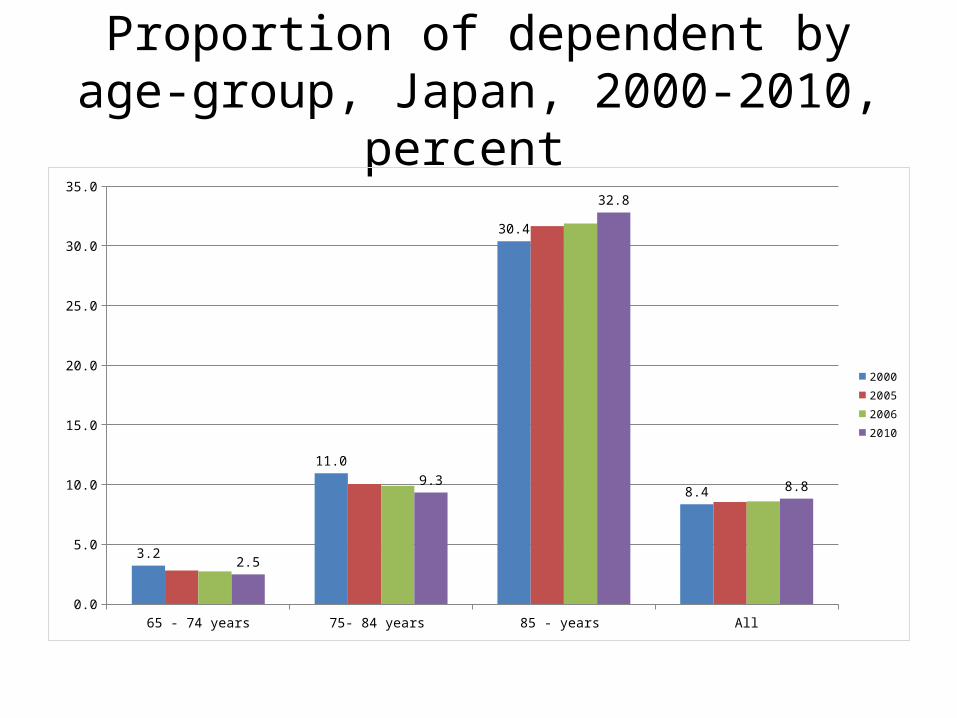
Proportion of dependent by age-group, Japan, 2000-2010, percent
65 - 74 years 75- 84 years 85 - years All0.0
5.0
10.0
15.0
20.0
25.0
30.0
35.0
3.2
11.0
30.4
8.4
2.5
9.3
32.8
8.8
2000200520062010

Prevalence of ill-health by age-group, Sweden, 2000-2010
65- 74 years 75- 84 years 85 - years Total pop. 0%
5%
10%
15%
20%
25%
30%
35%
40%
45%
10%
22%
42%
19%
9%
18%
32%
15%
200020052010
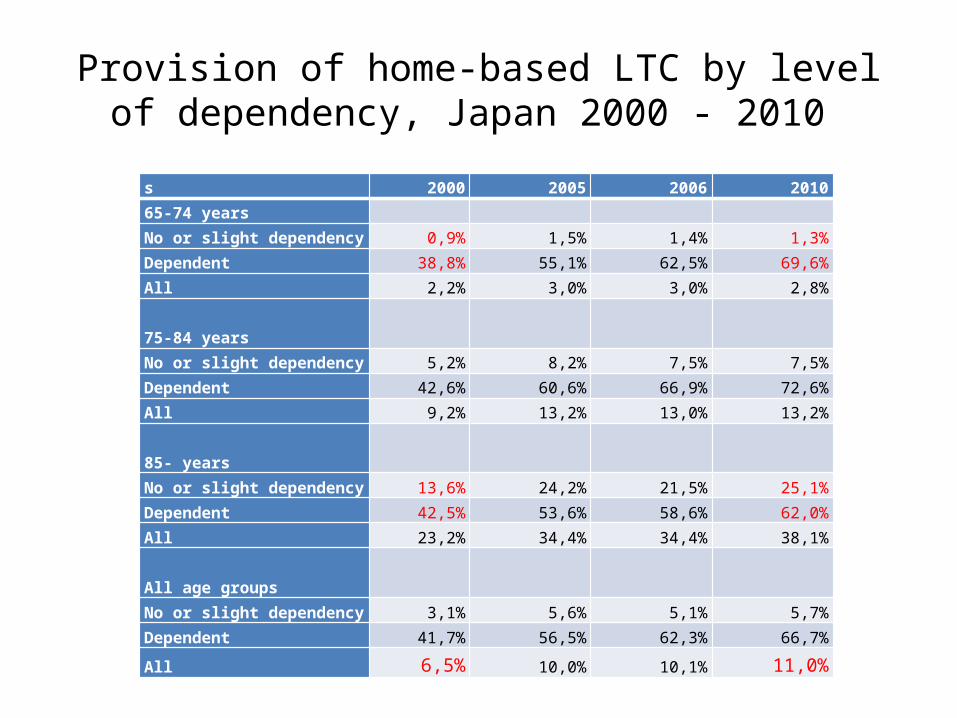
Provision of home-based LTC by level of dependency, Japan 2000 - 2010
s 2000 2005 2006 201065-74 years No or slight dependency 0,9% 1,5% 1,4% 1,3%Dependent 38,8% 55,1% 62,5% 69,6%All 2,2% 3,0% 3,0% 2,8% 75-84 yearsNo or slight dependency 5,2% 8,2% 7,5% 7,5%Dependent 42,6% 60,6% 66,9% 72,6%All 9,2% 13,2% 13,0% 13,2% 85- years No or slight dependency 13,6% 24,2% 21,5% 25,1%Dependent 42,5% 53,6% 58,6% 62,0%All 23,2% 34,4% 34,4% 38,1% All age groups No or slight dependency 3,1% 5,6% 5,1% 5,7%Dependent 41,7% 56,5% 62,3% 66,7%All 6,5% 10,0% 10,1% 11,0%
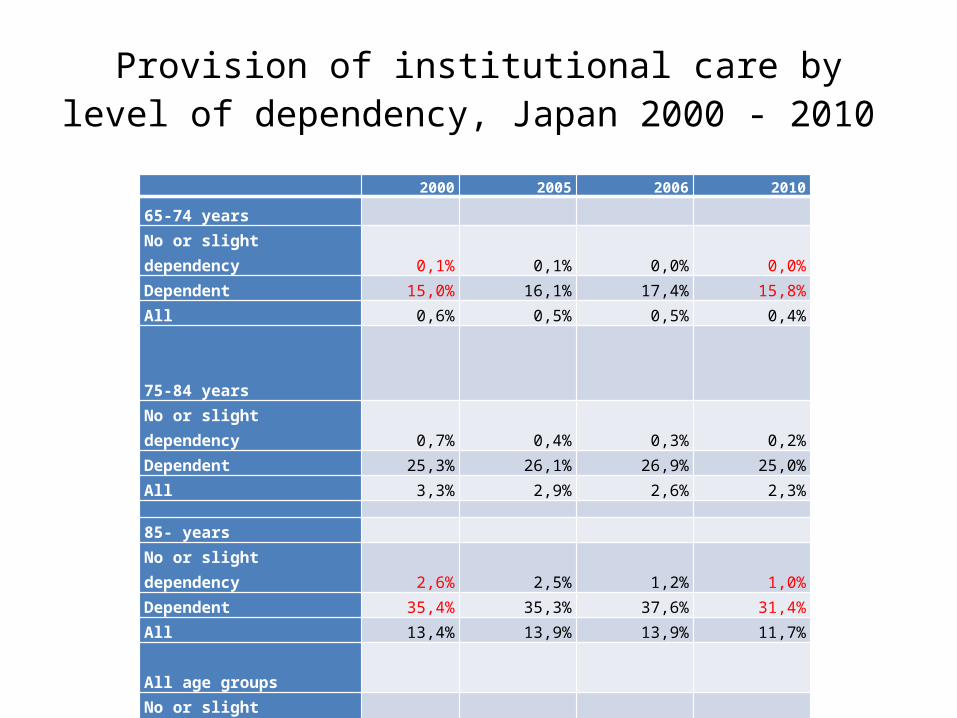
Provision of institutional care by level of dependency, Japan 2000 - 2010
2000 2005 2006 2010
65-74 years No or slight dependency 0,1% 0,1% 0,0% 0,0%Dependent 15,0% 16,1% 17,4% 15,8%All 0,6% 0,5% 0,5% 0,4% 75-84 yearsNo or slight dependency 0,7% 0,4% 0,3% 0,2%Dependent 25,3% 26,1% 26,9% 25,0%All 3,3% 2,9% 2,6% 2,3%
85- years No or slight dependency 2,6% 2,5% 1,2% 1,0%Dependent 35,4% 35,3% 37,6% 31,4%All 13,4% 13,9% 13,9% 11,7% All age groups No or slight dependency 0,5% 0,4% 0,2% 0,2%Dependent 26,9% 28,5% 30,3% 27,1%All 2,7% 2,9% 2,8% 2,5%
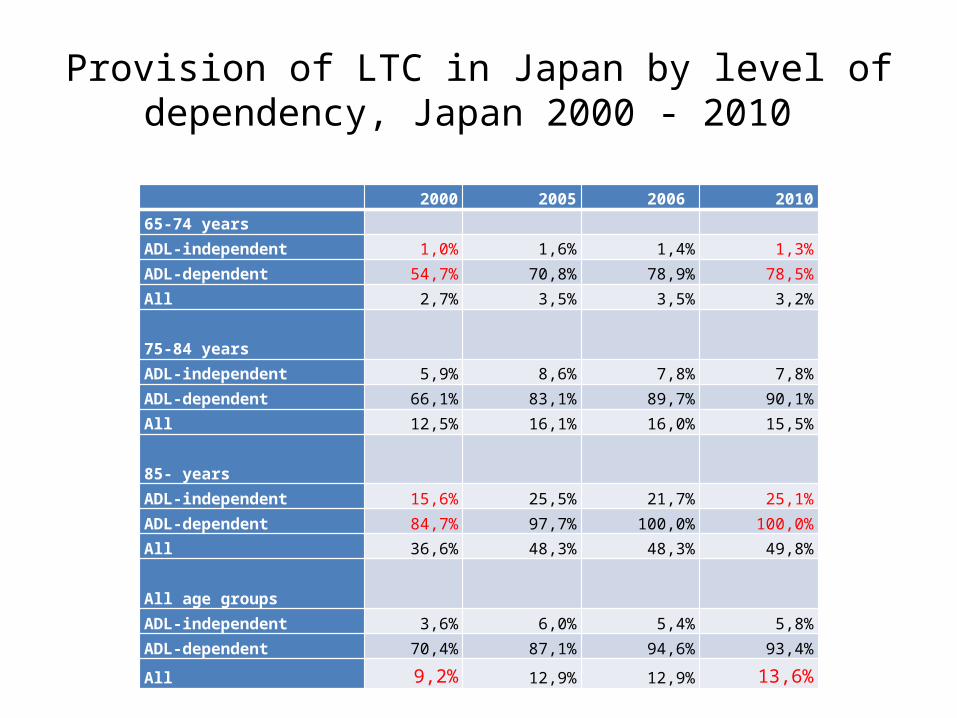
Provision of LTC in Japan by level of dependency, Japan 2000 - 2010
2000 2005 2006 201065-74 years ADL-independent 1,0% 1,6% 1,4% 1,3%ADL-dependent 54,7% 70,8% 78,9% 78,5%All 2,7% 3,5% 3,5% 3,2% 75-84 yearsADL-independent 5,9% 8,6% 7,8% 7,8%ADL-dependent 66,1% 83,1% 89,7% 90,1%All 12,5% 16,1% 16,0% 15,5% 85- years ADL-independent 15,6% 25,5% 21,7% 25,1%ADL-dependent 84,7% 97,7% 100,0% 100,0%All 36,6% 48,3% 48,3% 49,8% All age groups ADL-independent 3,6% 6,0% 5,4% 5,8%ADL-dependent 70,4% 87,1% 94,6% 93,4%All 9,2% 12,9% 12,9% 13,6%

Provision of home-based LTC by level of ill-health, Sweden 2000 - 2010
2000 2005 201065-74 years No to moderate ill-health 2,2% 1,8% 2,3%Severe ill-health 10,7% 8,6% 8,4%All 3,1% 2,5% 2,4% 75-84 yearsNo to moderate ill-health 10,3% 9,7% 9,5%Severe ill-health 20,0% 19,3% 21,7%All 12,5% 11,1% 11,8% 85- years No to moderate ill-health 5,7% 5,6% 5,4%Severe ill-health 34,9% 33,4% 36,8%All 34,4% 31,5% 32,4% All age groups No to moderate ill-health 8,3% 7,6% 7,5%Severe ill-health 21,9% 20,8% 22,2%All 10,9% 9,9% 9,7%

Provision of institutional care by level of ill-health, Sweden 2000 - 2010
2000 2005 201065-74 years No to moderate ill-health 0,3% 0,3% 0,3%Severe ill-health 4,3% 6,0% 8,0%All 0,7% 0,9% 0,9% 75-84 yearsNo to moderate ill-health 2,3% 2,3% 2,1%Severe ill-health 14,2% 17,8% 20,5%All 4,9% 5,3% 5,4% 85- years No to moderate ill-health 14,0% 12,8% 11,3%Severe ill-health 40,1% 42,5% 44,9%All 24,9% 23,8% 22,1% All age groups No to moderate ill-health 2,4% 2,4% 2,1%Severe ill-health 19,2% 22,3% 24,1%All 5,6% 5,8% 5,4%
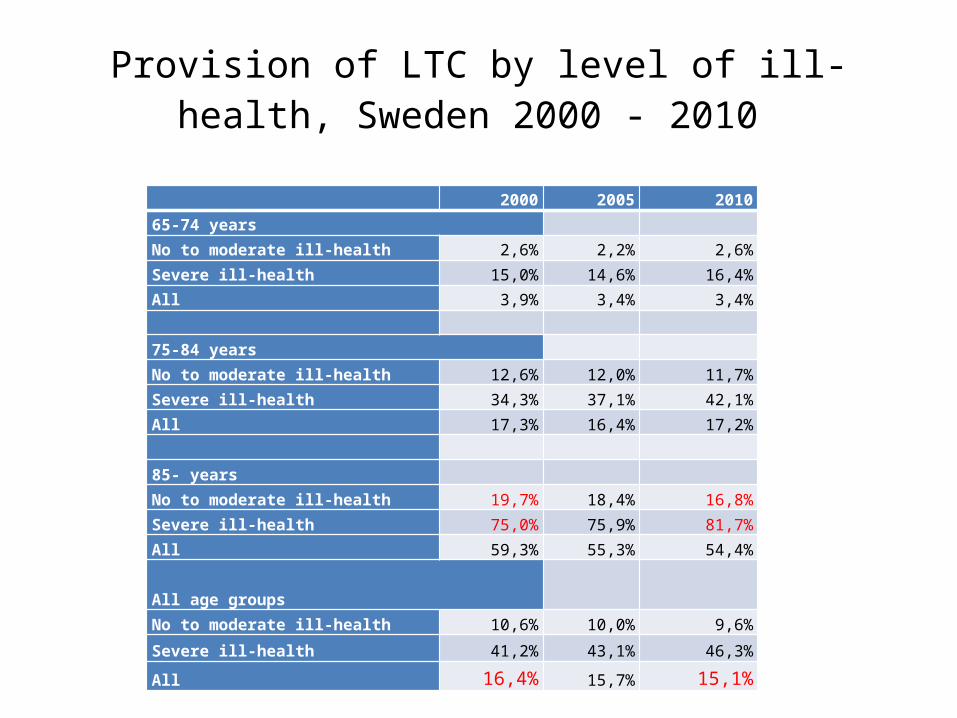
Provision of LTC by level of ill-health, Sweden 2000 - 2010
2000 2005 201065-74 years No to moderate ill-health 2,6% 2,2% 2,6%Severe ill-health 15,0% 14,6% 16,4%All 3,9% 3,4% 3,4% 75-84 yearsNo to moderate ill-health 12,6% 12,0% 11,7%Severe ill-health 34,3% 37,1% 42,1%All 17,3% 16,4% 17,2% 85- years No to moderate ill-health 19,7% 18,4% 16,8%Severe ill-health 75,0% 75,9% 81,7%All 59,3% 55,3% 54,4% All age groups No to moderate ill-health 10,6% 10,0% 9,6%
Severe ill-health 41,2% 43,1% 46,3%All 16,4% 15,7% 15,1%
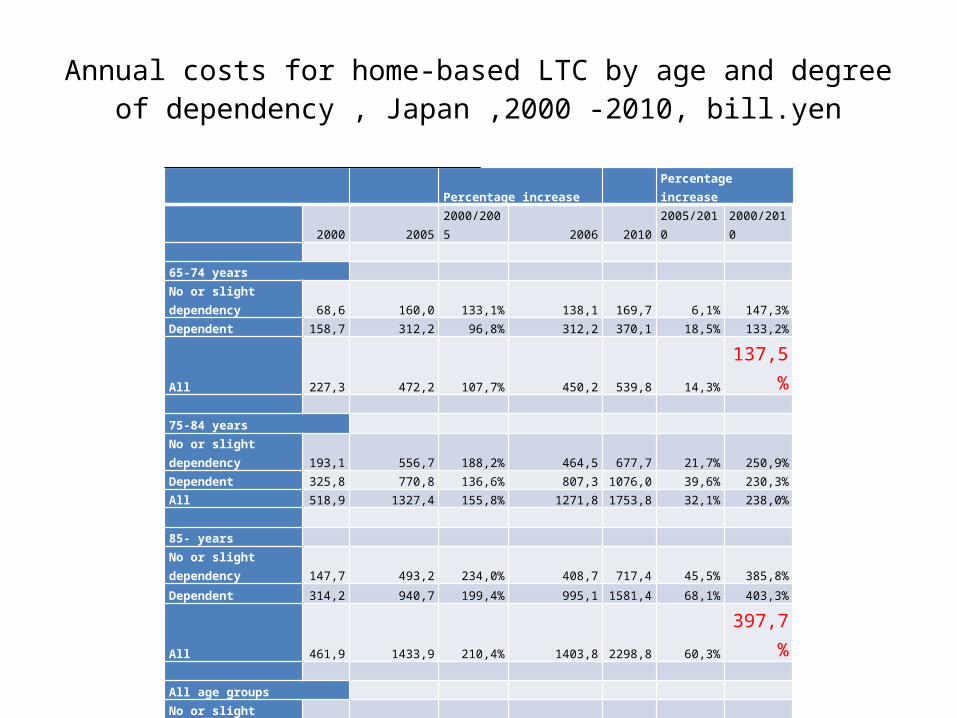
Annual costs for home-based LTC by age and degree of dependency , Japan ,2000 -2010, bill.yen
Percentage increase Percentage increase
2000 2005 2000/2005 2006 2010 2005/2010 2000/2010
65-74 years
No or slight dependency 68,6 160,0 133,1% 138,1 169,7 6,1% 147,3%Dependent 158,7 312,2 96,8% 312,2 370,1 18,5% 133,2%
All 227,3 472,2 107,7% 450,2 539,8 14,3% 137,5%
75-84 years
No or slight dependency 193,1 556,7 188,2% 464,5 677,7 21,7% 250,9%Dependent 325,8 770,8 136,6% 807,3 1076,0 39,6% 230,3%All 518,9 1327,4 155,8% 1271,8 1753,8 32,1% 238,0%
85- years
No or slight dependency 147,7 493,2 234,0% 408,7 717,4 45,5% 385,8%
Dependent 314,2 940,7 199,4% 995,1 1581,4 68,1% 403,3%
All 461,9 1433,9 210,4% 1403,8 2298,8 60,3% 397,7%
All age groups
No or slight dependency 409,4 1209,8 195,5% 1011,3 1564,9 29,3% 282,2%
Dependent 798,7 2023,7 153,4% 2114,6 3027,6 49,6% 279,1%
All 1208,1 3233,5 167,7% 3125,9 4592,4 42,0% 280,1%

Annual costs for institutional care by age and degree of dependency , Japan ,2000 -2010, bill. yen
Percentage increase Percentage increase
2000 2005 2000/2005 2006 2010 2005/2010 2000/2010
65-74 years
No or slight dependency 40,1 33,3 -16,9% 17,5 5,8 -82,6% -85,6%Dependent 257,8 263,5 2,2% 217,6 218,3 -17,2% -15,3%All 297,8 296,8 -0,3% 235,0 224,1 -24,5% -24,8%
75-84 years
No or slight dependency 148,0 135,6 -8,4% 62,3 51,0 -62,4% -65,5%Dependent 731,4 909,3 24,3% 754,8 885,2 -2,7% 21,0%9ll 879,4 1044,9 18,8% 817,1 936,2 -10,4% 6,5%
85- years
No or slight dependency 147,9 193,9 31,1% 70,7 90,6 -53,3% -38,8%
Dependent 1094,3 1541,8 40,9% 1384,5 1711,7 11,0% 56,4%All 1242,0 1735,7 39,7% 1455,3 1802,3 3,8% 45,1%
All age groups
No or slight dependency 336,0 362,8 8,0% 150,4 147,4 -59,4% -56,1%
Dependent 2083,4 2714,6 30,3% 2357,0 2815,2 3,7% 35,1%
All 2419,4 3077,4 27,2% 2507,4 2962,6 -3,7% 22,5%
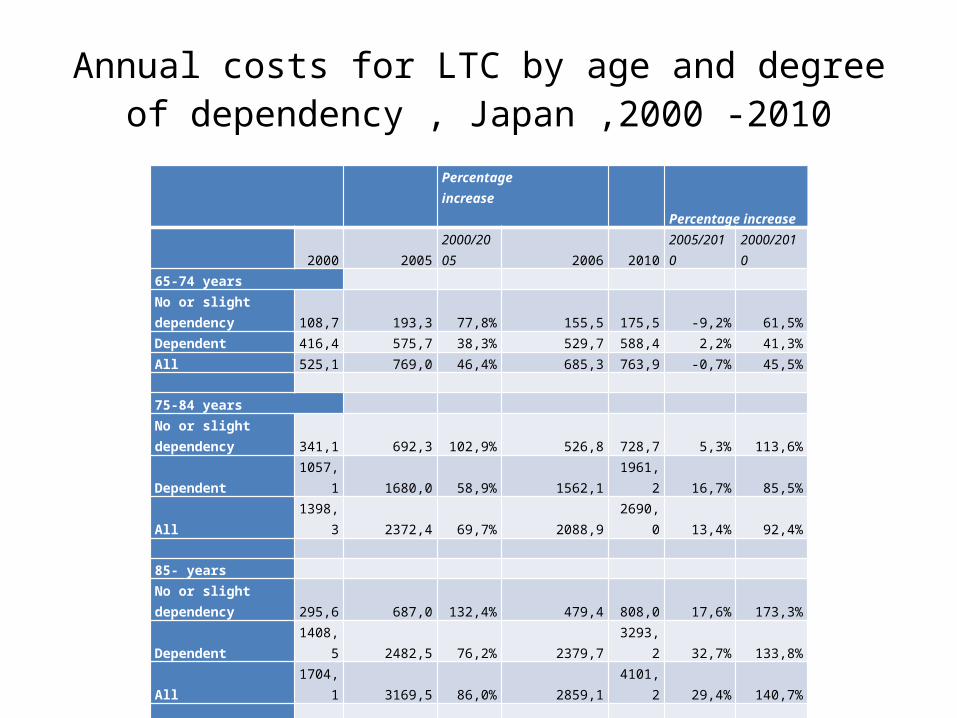
Annual costs for LTC by age and degree of dependency , Japan ,2000 -2010
Percentage increase Percentage increase
2000 20052000/2005 2006 2010
2005/2010
2000/2010
65-74 years
No or slight dependency 108,7 193,3 77,8% 155,5 175,5 -9,2% 61,5%Dependent 416,4 575,7 38,3% 529,7 588,4 2,2% 41,3%All 525,1 769,0 46,4% 685,3 763,9 -0,7% 45,5%
75-84 years
No or slight dependency 341,1 692,3 102,9% 526,8 728,7 5,3% 113,6%Dependent 1057,1 1680,0 58,9% 1562,1 1961,2 16,7% 85,5%All 1398,3 2372,4 69,7% 2088,9 2690,0 13,4% 92,4%
85- years
No or slight dependency 295,6 687,0 132,4% 479,4 808,0 17,6% 173,3%Dependent 1408,5 2482,5 76,2% 2379,7 3293,2 32,7% 133,8%All 1704,1 3169,5 86,0% 2859,1 4101,2 29,4% 140,7%
All age groups
No or slight dependency 745,4 1572,6 111,0% 1161,7 1712,2 8,9% 129,7%Dependent 2882,1 4738,3 64,4% 4471,6 5842,8 23,3% 102,7%
All 3627,5 6310,9 74,0% 5633,3 7555,0 19,7% 108,3%

Annual costs for home-based LTC by age and level of ill-health, Sweden,2000 -2010, mill. SEK
Perc. increase
Perc. increase 2000 2005 2000/2005 2010 2005/2010 2000/2010
65-74 years
No to moderate ill-health 2052 1826 -11,0% 2363 29,4% 15,1%
Severe ill-health 2215 1772 -20,0% 1970 11,2% -11,1%
All 4267 3597 -15,7% 4332 20,4% 1,5%
75-84 years
No to moderate ill-health 6001 5296 -11,8% 5556 4,9% -7,4%
Severe ill-health 6956 5621 -19,2% 5813 3,4% -16,4%
All 12957 10916 -15,8% 11368 4,1% -12,3%
85- years
No to moderate ill-health 6057 6328 4,5% 7206 13,9% 19,0%Severe ill-health 8441 7721 -8,5% 7812 1,2% -7,5%All 14498 14049 -3,1% 15018 6,9% 3,6%
All age groups
No to moderate ill-health 14110 13449 -4,7% 15125 12,5% 7,2%
Severe ill-health 17612 15114 -14,2% 15594 3,2% -11,5%
All 31722 28563 -10,0% 30719 7,5% -3,2%
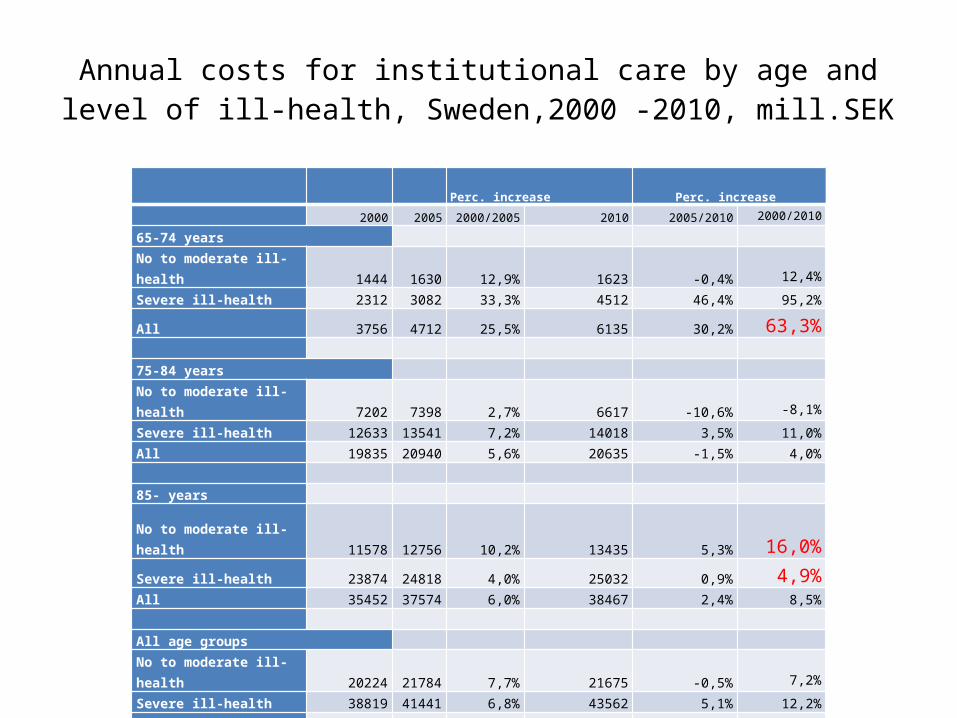
Annual costs for institutional care by age and level of ill-health, Sweden,2000 -2010, mill.SEK
Perc. increase
Perc. increase
2000 2005 2000/2005 2010 2005/2010 2000/2010
65-74 years
No to moderate ill-health 1444 1630 12,9% 1623 -0,4%12,4%
Severe ill-health 2312 3082 33,3% 4512 46,4% 95,2%
All 3756 4712 25,5% 6135 30,2% 63,3%
75-84 years
No to moderate ill-health 7202 7398 2,7% 6617 -10,6%-8,1%
Severe ill-health 12633 13541 7,2% 14018 3,5% 11,0%
All 19835 20940 5,6% 20635 -1,5% 4,0%
85- years
No to moderate ill-health 11578 12756 10,2% 13435 5,3% 16,0%Severe ill-health 23874 24818 4,0% 25032 0,9% 4,9%All 35452 37574 6,0% 38467 2,4% 8,5%
All age groups
No to moderate ill-health 20224 21784 7,7% 21675 -0,5%7,2%
Severe ill-health 38819 41441 6,8% 43562 5,1% 12,2%
All 59043 63226 7,1% 65237 3,2% 10,5%

Annual costs for LTC by age and level of ill-health, Sweden,2000 -2010, mill.SEK
Perc. increase
Perc. increase 2000 2005 2000/2005 2010 2005/2010 2000/2010
65-74 years
No to moderate ill-health 3496 3456 -1,2% 3985 15,3% 14,0%
Severe ill-health 4527 4854 7,2% 6482 33,5% 43,2%
All 8023 8310 3,6% 10467 26,0% 30,5% 75-84 years
No to moderate ill-health 13203 12694 -3,9% 12173 -4,1% -7,8%
Severe ill-health 19590 19162 -2,2% 19830 3,5% 1,2%
All 32792 31856 -2,9% 32003 0,5% -2,4%
85- years
No to moderate ill-health 17635 19084 8,2% 20641 8,2% 17,0%
Severe ill-health 32315 32539 0,7% 32844 0,9% 1,6%
All 49950 51623 3,4% 53485 3,6% 7,1%
All age groups
No to moderate ill-health 34334 35234 2,6% 36799 4,4% 7,2%
Severe ill-health 56431 56555 0,2% 59156 4,6% 4,8%
All 90765 91789 1,1% 95956 4,5% 5,7%

Conclusions 1• Japan and Sweden have somewhat different growth patterns
regarding the elderly population. In Japan most rapid increase for the oldest old 85+, in Sweden for the younger old.
• In both Japan and Sweden prevalence of dependency/ill-health by age-group is reducing but patterns differ. In Japan the younger old are getting more independent, in Sweden the oldest old.
• Provision of services follows need in both countries. In Sweden the provision in relation to need was stable, in Japan it increased for home-based care and decreased for institutional care.

Conclusions 2• Rate of increase in the period 2000 - 2010 was much slower in Sweden than in
Japan. This reflects that Japan and Sweden are in different phases with regard to the development of the LTC system.
• The more rapid cost increase in Japan may also indicate that cost increase control is
much harder to achieve in an insurance-based system than in a tax-based.
• Japanese cost increase slowed down after the 2005 reform pointing at some success. However, cost increase was still much more rapid than in Sweden.
• In Japan home-based LTC took a much higher proportion of total LTC costs in 2010 than in 2000. In Sweden the proportion stayed more or less the same.
• • The most rapid cost increase in Japan was recorded for persons above 85 with no or
slight ADL-dependency. This may reflect changing household patterns.

That’s all folks!
Thanks for your attention!!