a comparison antialiasing techniques · three antialiasing techniques were applied to a scene...
TRANSCRIPT
Three antialiasing techniques were applied to a scene of moderate complexity. Earlyresults suggest that prefiltering is still the most computationally effective method.
A Comparison of
Antialiasing Techniques
Franklin C. Crow
Ohio State University
In the effort to attain realism, computer graphicsworkers are generating increasingly complicated scenes.
However, the quantization involved in generating thesescenes can produce image defects such as jagged edgesand disappearing detail. The source of these defects is aphenomenon known as aliasing, a problem arising from a
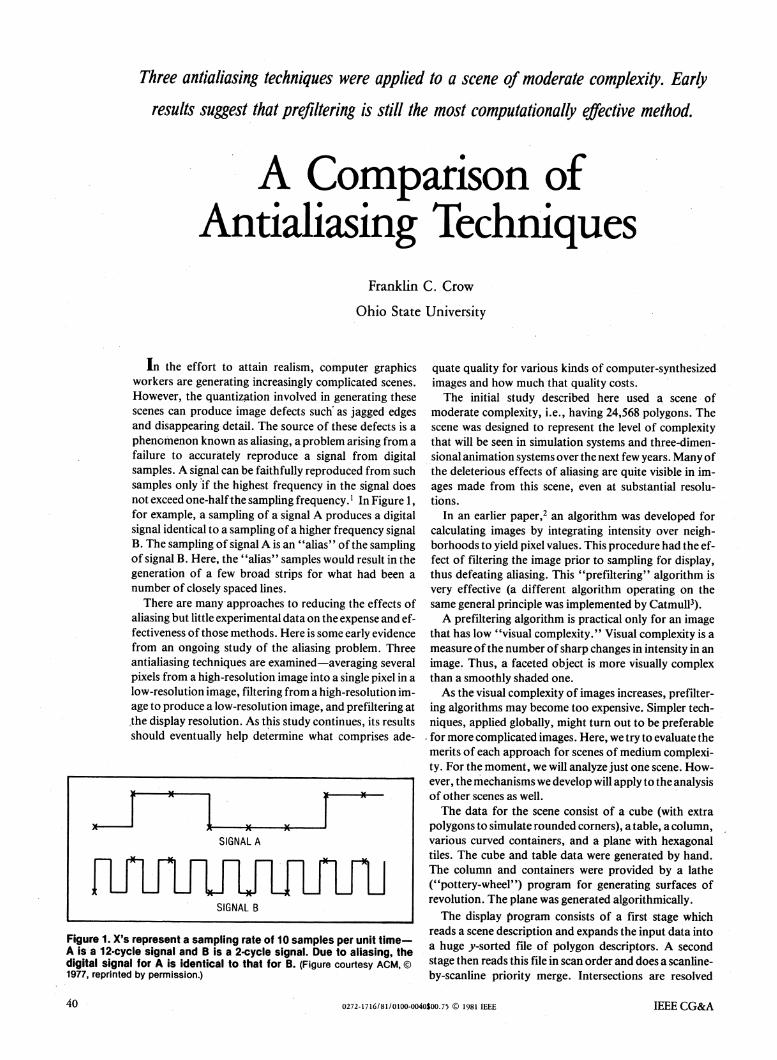
failure to accurately reproduce a signal from digitalsamples. A signal can be faithfully reproduced from suchsamples only if the highest frequency in the signal doesnot exceed one-halfthe sampling frequency. I In Figure 1,for example, a sampling of a signal A produces a digitalsignal identical to a sampling of a higher frequency signalB. The sampling of signal A is an "alias" of the samplingof signal B. Here, the "alias" samples would result in thegeneration of a few broad strips for what had been anumber of closely spaced lines.
There are many approaches to reducing the effects ofaliasing but little experimental data on the expense and ef-fectiveness of those methods. Here is some early evidencefrom an ongoing study of the aliasing problem. Threeantialiasing techniques are examined-averaging severalpixels from a high-resolution image into a single pixel in alow-resolution image, filtering from a high-resolution im-age to produce a low-resolution image, and prefiltering atthe display resolution. As this study continues, its resultsshould eventually help determine what comprises ade-
Figure 1. X's represent a sampling rate of 10 samples per unit time-A is a 12-cycle signal and B is a 2-cycle signal. Due to aliasing, thedigital signal for A is identical to that for B. (Figure courtesy ACM,1977, reprinted by permission.)
quate quality for various kinds of computer-synthesizedimages and how much that quality costs.The initial study described here used a scene of
moderate complexity, i.e., having 24,568 polygons. Thescene was designed to represent the level of complexitythat will be seen in simulation systems and three-dimen-sional animation systems over the next few years. Many ofthe deleterious effects of aliasing are quite visible in im-ages made from this scene, even at substantial resolu-tions.
In an earlier paper,2 an algorithm was developed forcalculating images by integrating intensity over neigh-borhoods to yield pixel values. This procedure had the ef-fect of filtering the image prior to sampling for display,thus defeating aliasing. This "prefiltering" algorithm isvery effective (a different algorithm operating on thesame general principle was implemented by Catmull3).A prefiltering algorithm is practical only for an image
that has low "visual complexity." Visual complexity is ameasure of the number of sharp changes in intensity in animage. Thus, a faceted object is more visually complexthan a smoothly shaded one.
As the visual complexity of images increases, prefilter--ing algorithms may become too expensive. Simpler tech-niques, applied globally, might turn out to be preferablefor more complicated images. Here, we try to evaluate themerits of each approach for scenes of medium complexi-ty. For the moment, we will analyze just one scene. How-ever, the mechanisms we develop will apply to the analysisof other scenes as well.The data for the scene consist of a cube (with extra
polygons to simulate rounded corners), a table, a column,various curved containers, and a plane with hexagonaltiles. The cube and table data were generated by hand.The column and containers were provided by a lathe("pottery-wheel") program for generating surfaces ofrevolution. The plane was generated algorithmically.The display program consists of a first stage which
reads a scene description and expands the input data intoa huge y-sorted file of polygon descriptors. A secondstage then reads this file in scan order and does a scanline-by-scanline priority merge. Intersections are resolved
0272-1716/81/0100-0040$00.75 1981 IEEE
X A I
SIGNAL A
FLrLFLFLFLFLFLrLniUSIGNAL B
40 IEEE CG&A
during the priority merge by splitting offending polygons.Finally, individual scan segments are rendered in scanorder .4The following sections describe the various ex-
periments, giving performance statistics for each methodalong with pictures of the visual results.
Increasing the resolution
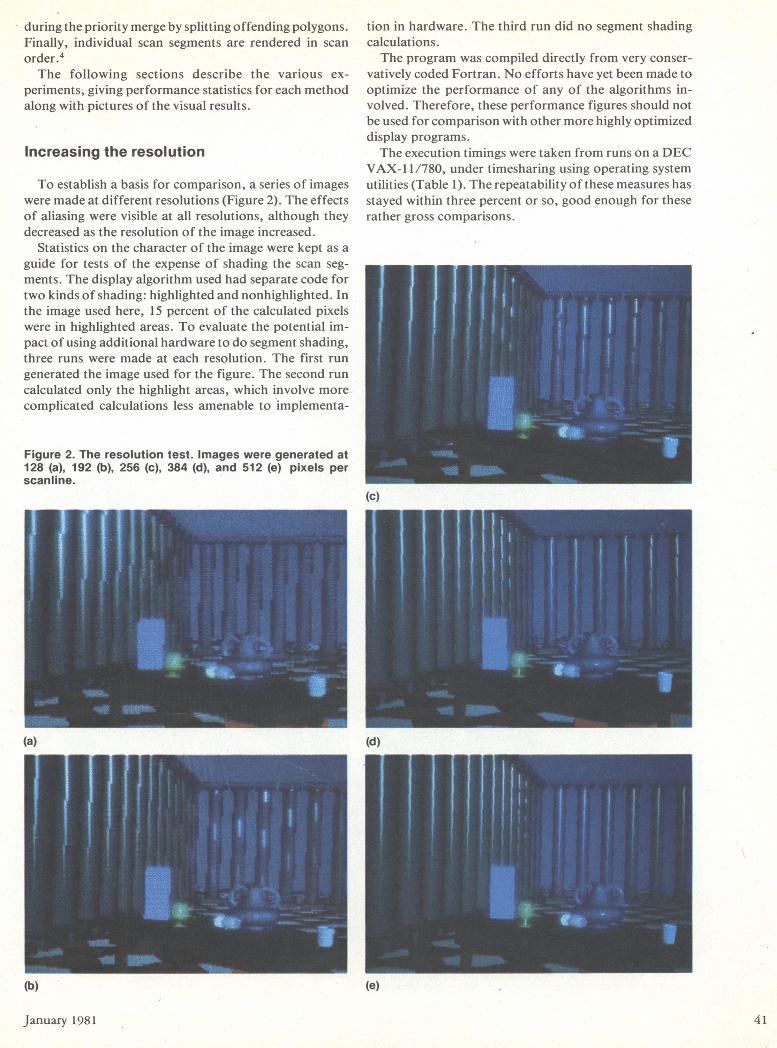
To establish a basis for comparison, a series of imageswere made at different resolutions (Figure 2). The effectsof aliasing were visible at all resolutions, although theydecreased as the resolution of the image increased.
Statistics on the character of the image were kept as aguide for tests of the expense of shading the scan seg-ments. The display algorithm used had separate code fortwo kinds of shading: highlighted and nonhighlighted. Inthe image used here, 15 percent of the calculated pixelswere in highlighted areas. To evaluate the potential im-pact of using additional hardware to do segment shading,three runs were made at each resolution. The first rungenerated the image used for the figure. The second runcalculated only the highlight areas, which involve morecomplicated calculations less amenable to implementa-
Figure 2. The resolution test. Images were generated at128 (a), 192 (b), 256 (c), 384 (d), and 512 (e) pixels perscanline.
tion in hardware. The third run did no segment shadingcalculations.The program was compiled directly from very conser-
vatively coded Fortran. No efforts have yet been made tooptimize the performance of any of the algorithms in-volved. Therefore, these performance figures should notbe used for comparison with other more highly optimizeddisplay programs.The execution timings were taken from runs on a DEC
VAX- 11/780, under timesharing using operating systemutilities (Table 1). The repeatability of these measures hasstayed within three percent or so, good enough for theserather gross comparisons.
(c)
(d)
(e)
January 1981 41
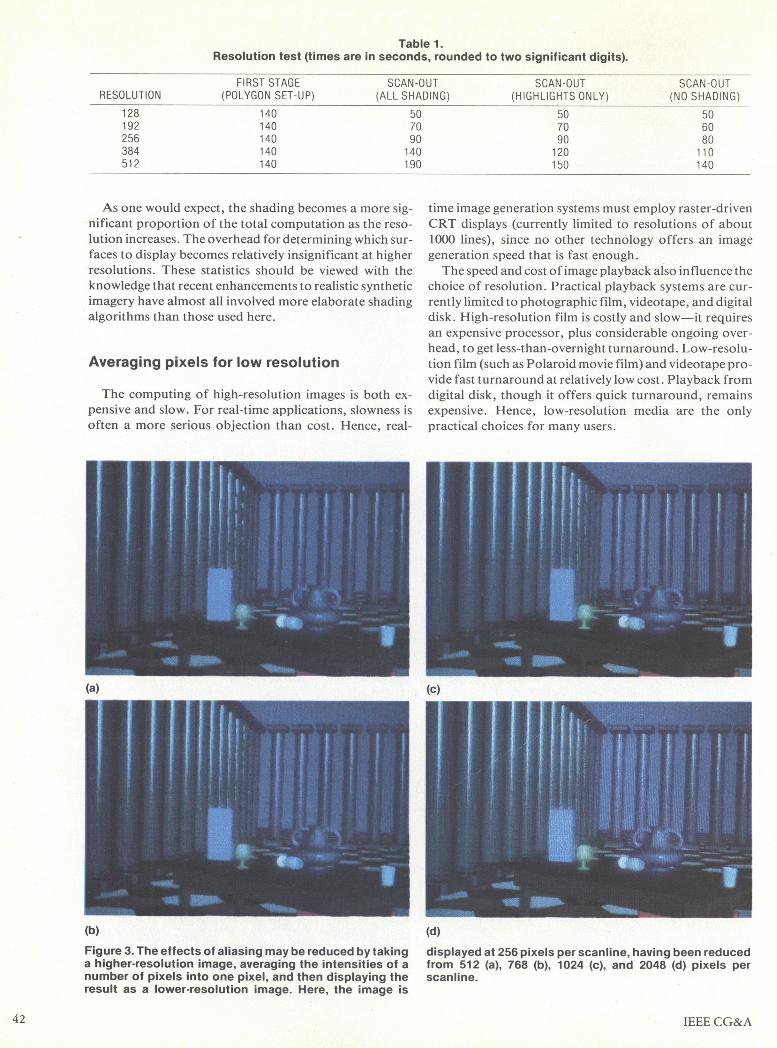
Table 1.Resolution test (times are in seconds, rounded to two significant digits).
FIRST STAGE(POLYGON SET-UP)
140140140140140
SCAN-OUT(ALL SHADING)
507090140190
SCAN-OUT(HIGHLIGHTS ONLY)
507090120150
As one would expect, the shading becomes a more sig-nificant proportion of the total computation as the reso-
lution increases. The overhead for determining which sur-
faces to display becomes relatively insignificant at higherresolutions. These statistics should be viewed with theknowledge that recent enhancements to realistic syntheticimagery have almost all involved more elaborate shadingalgorithms than those used here.
Averaging pixels for low resolution
The computing of high-resolution images is both ex-
pensive and slow. For real-time applications, slowness isoften a more serious objection than cost. Hence, real-
(a)
time image generation systems must employ raster-drivenCRT displays (currently limited to resolutions of about1000 lines), since no other technology offers an imagegeneration speed that is fast enough.The speed and cost of image playback also influence the
choice of resolution. Practical playback systems are cur-
rently limited to photographic film, videotape, and digitaldisk. High-resolution film is costly and slow-it requiresan expensive processor, plus considerable ongoing over-
head, to get less-than-overnight turnaround. Low-resolu-tion film (such as Polaroid movie film) and videotape pro-vide fast turnaround at relatively low cost. Playback fromdigital disk, though it offers quick turnaround, remainsexpensive. Hence, low-resolution media are the onlypractical choices for many users.
(c)
(b) (d)Figure 3. The effects of aliasing may be reduced by taking displayed at 256 pixels per scanline, having been reduceda higher-resolution image, averaging the intensities of a from 512 (a), 768 (b), 1024 (c), and 2048 (d) pixels pernumber of pixels into one pixel, and then displaying the scanline.result as a lower-resolution image. Here, the image is
RESOLUTION
128192256384512
SCAN-OUT(NO SHADING)
506080110140
42 IEEE CG&A
Even though speed and cost considerations mandatelow resolution, images made at low resolutions can beperfectly adequate if aliasing effects are sufficiently re-duced. One approach is to calculate the image at a higherresolution and then, by averaging the intensities of severalpixels into one, display it at a lower resolution. Of course,it would be advantageous to know how many pixels mustbe averaged in order to sufficiently reduce aliasing.
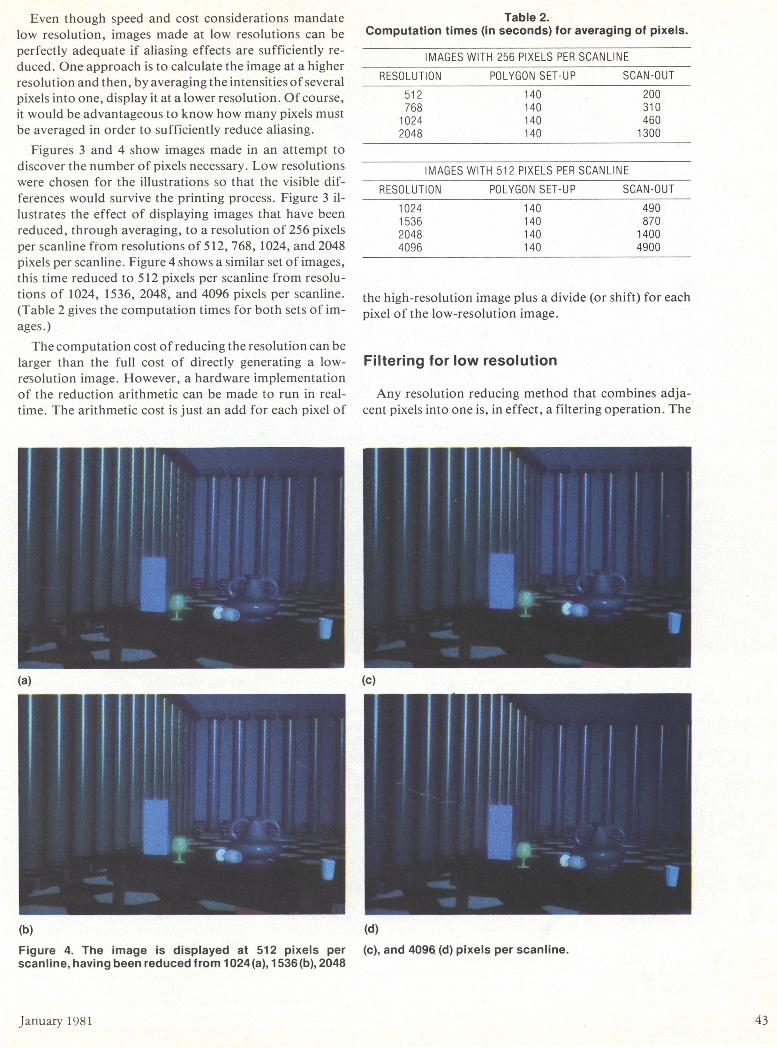
Figures 3 and 4 show images made in an attempt todiscover the number of pixels necessary. Low resolutionswere chosen for the illustrations so that the visible dif-ferences would survive the printing process. Figure 3 il-lustrates the effect of displaying images that have beenreduced, through averaging, to a resolution of 256 pixelsper scanline from resolutions of 512, 768, 1024, and 2048pixels per scanline. Figure 4 shows a similar set of images,this time reduced to 512 pixels per scanline from resolu-tions of 1024, 1536, 2048, and 4096 pixels per scanline.(Table 2 gives the computation times for both sets of im-ages.)The computation cost of reducing the resolution can be
larger than the full cost of directly generating a low-resolution image. However, a hardware implementationof the reduction arithmetic can be made to run in real-time. The arithmetic cost is just an add for each pixel of
Table 2.Computation times (in seconds) for averaging of pixels.
IMAGES WITH 256 PIXELS PER SCANLINE
RESOLUTION POLYGON SET-UP SCAN-OUT
512 140 200768 140 310
1024 140 4602048 140 1300
IMAGES WITH 512 PIXELS PER SCANLINE
RESOLUTION POLYGON SET-UP SCAN-OUT
1024153620484096
140140140140
490870
14004900
the high-resolution image plus a divide (or shift) for eachpixel of the low-resolution image.
Filtering for low resolution
Any resolution reducing method that combines adja-cent pixels into one is, in effect, a filtering operation. The
(c)
(b)
Figure 4. The image is displayed at 512 pixels perscanline,havingbeenreducedfrom1024(a),1536(b),2048
(d)
(c), and 4096 (d) pixels per scanline.
January 1981 43
(a)
(b) (d)
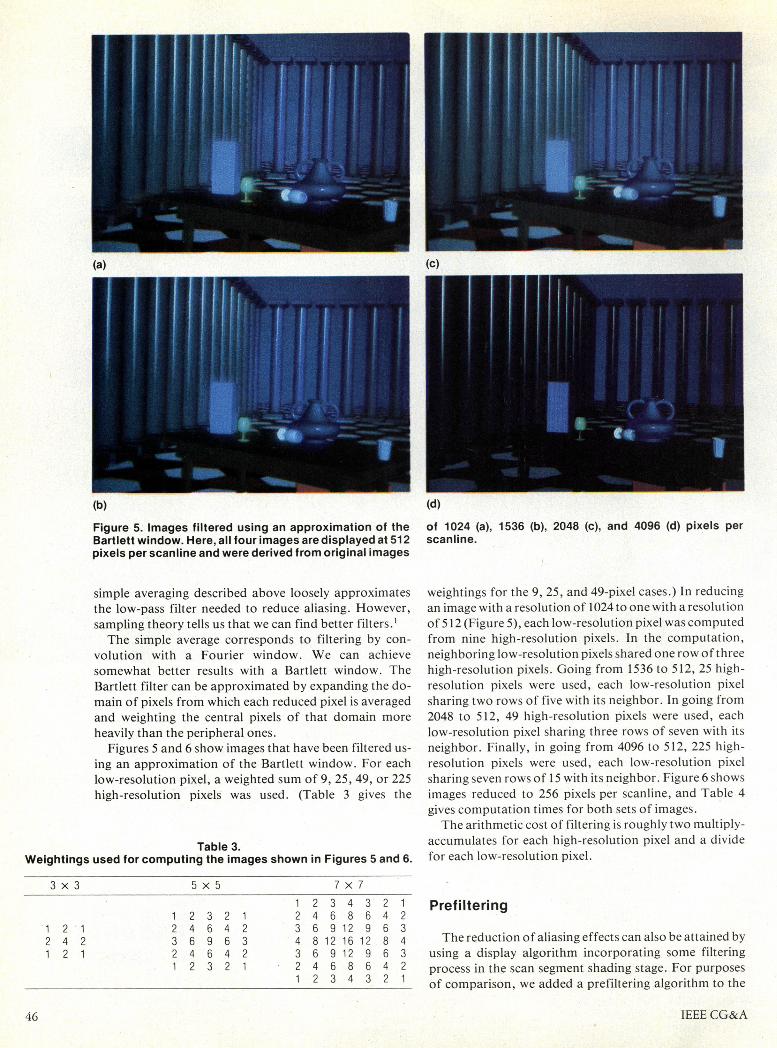
Figure 5. Images filtered using an approximation of the of 1024 (a), 1536 (b), 2048 (c), and 4096 (d) pixels perBartlett window. Here, all four images are displayed at 512 scanline.pixels per scanline and were derived from original images
simple averaging described above loosely approximatesthe low-pass filter needed to reduce aliasing. However,sampling theory tells us that we can find better filters.'The simple average corresponds to filtering by con-
volution with a Fourier window. We can achievesomewhat better results with a Bartlett window. TheBartlett filter can be approximated by expanding the do-main of pixels from which each reduced pixel is averagedand weighting the central pixels of that domain moreheavily than the peripheral ones.
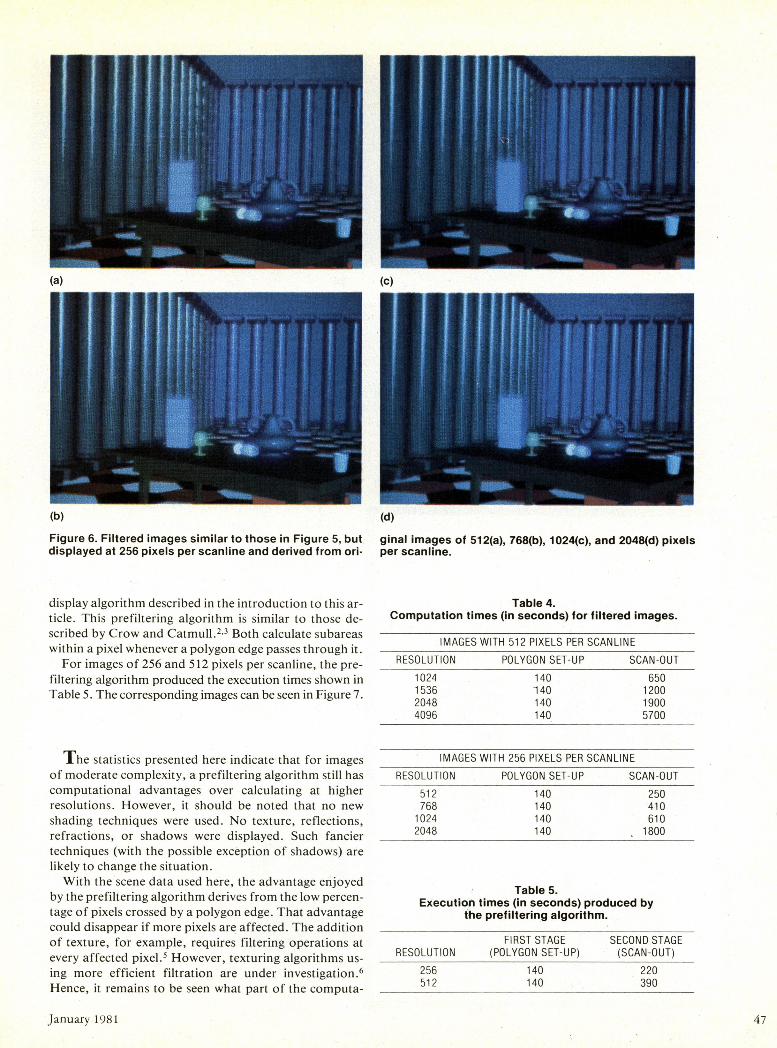
Figures 5 and 6 show images that have been filtered us-ing an approximation of the Bartlett window. For eachlow-resolution pixel, a weighted sum of 9, 25, 49, or 225high-resolution pixels was used. (Table 3 gives the
Table 3.Weightings used for computing the images shown in Figures 5 and 6.
3 x 3 5 x 5
weightings for the 9, 25, and 49-pixel cases.) In reducingan image with a resolution of 1024 to one with a resolutionof 512 (Figure 5), each low-resolution pixel was computedfrom nine high-resolution pixels. In the computation,neighboring low-resolution pixels shared one row of threehigh-resolution pixels. Going from 1536 to 512, 25 high-resolution pixels were used, each low-resolution pixelsharing two rows of five with its neighbor. In going from2048 to 512, 49 high-resolution pixels were used, eachlow-resolution pixel sharing three rows of seven with itsneighbor. Finally, in going from 4096 to 512, 225 high-resolution pixels were used, each low-resolution pixelsharing seven rows of 15 with its neighbor. Figure 6 showsimages reduced to 256 pixels per scanline, and Table 4gives computation times for both sets of images.The arithmetic cost of filtering is roughly two multiply-
accumulates for each high-resolution pixel and a dividefor each low-resolution pixel.
7 x 7
1 2 3 2 12 4 6 4 23 6 9 6 32 4 6 4 21 2 3 2 1
12 3 4 3 2 12 4 6 8 6 4 23 6 9 12 9 6 34 8 12 16 12 8 43 6 9 12 9 6 32 4 6 8 6 4 212 3 4 3 2 1
Prefiltering
The reduction of aliasing effects can also be attained byusing a display algorithm incorporating some filteringprocess in the scan segment shading stage. For purposes
of comparison, we added a prefiltering algorithm to the
IEEE CG&A
12 124 212 1
(c)
46
(a)
(b) (d)Figure 6. Filtered images similar to those in Figure 5, but ginal images of 512(a), 768(b), 1024(c), and 2048(d) pixelsdisplayed at 256 pixels per scanline and derived from ori- per scanline.
display algorithm described in the introduction to this ar-ticle. This prefiltering algorithm is similar to those de-scribed by Crow and Catmull.2'3 Both calculate subareaswithin a pixel whenever a polygon edge passes through it.
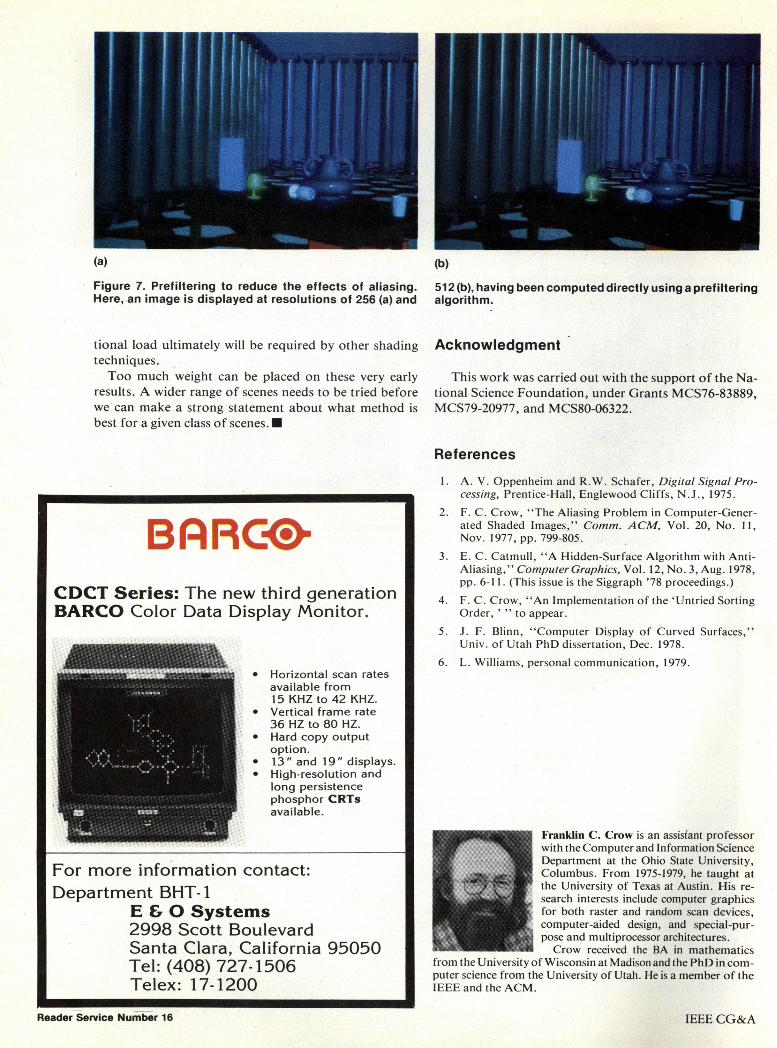
For images of 256 and 512 pixels per scanline, the pre-filtering algorithm produced the execution times shown inTable 5. The corresponding images can be seen in Figure 7.
The statistics presented here indicate that for imagesof moderate complexity, a prefiltering algorithm still hascomputational advantages over calculating at higherresolutions. However, it should be noted that no newshading techniques were used. No texture, reflections,refractions, or shadows were displayed. Such fanciertechniques (with the possible exception of shadows) arelikely to change the situation.With the scene data used here, the advantage enjoyed
by the prefiltering algorithm derives from the low percen-tage of pixels crossed by a polygon edge. That advantagecould disappear if more pixels are affected. The additionof texture, for example, requires filtering operations atevery affected pixel.5 However, texturing algorithms us-ing more efficient filtration are under investigation.6Hence, it remains to be seen what part of the computa-
Table 4.Computation times (in seconds) for filtered images.
RESOLU1
IMAGES WITH 512 PIXELS PER SCANLINE
FION POLYGON SET-UP SCAN-OUT1024 140 6501536 '140 12002048 140 19004096 140 5700
IMAGES WITH 256 PIXELS PER SCANLINERESOLUTION POLYGON SET-UP SCAN-OUT
512 140 250768 140 4101024 140 6102048 140 1800
Table 5.Execution times (in seconds) produced by
the prefiltering algorithm.
RESOLUTION
256512
FIRST STAGE(POLYGON SET-UP)
140140
SECOND STAGE(SCAN -OUT)
220390
January 1981
(c)
47
(a) (b)
Figure 7. Prefiltering to reduce the effects of aliasing.Here, an image is displayed at resolutions of 256 (a) and
tional load ultimately will be required by other shadingtechniques.Too much weight can be placed on these very early
results. A wider range of scenes needs to be tried beforewe can make a strong statement about what method isbest for a given class of scenes. -
BARCnOmThe new third generationData Display Monitor.
* Horizontal scan ratesavailable from15 KHZ to 42 KHZ.
* Vertical frame rate36 HZ to 80 HZ.
* Hard copy outputoption.
* 13 " and 19 " displays.* High-resolution and
long persistencephosphor CRTsavailable.
For more information contact:Department BHT-1
E & 0 Systems2998 Scott BoulevardSanta Clara, California 95050Tel: (408) 727-1506Telex: 17-1200
512 (b), having been computed directly using a prefilteringalgorithm.
Acknowledgment
This work was carried out with the support of the Na-tional Science Foundation, under Grants MCS76-83889,MCS79-20977, and MCS80-06322.
References
1. A. V. Oppenheim and R.W. Schafer, Digital Signal Pro-cessing, Prentice-Hall, Englewood Cliffs, N.J., 1975.
2. F. C. Crow, "The Aliasing Problem in Computer-Gener-ated Shaded Images," Comm. ACM, Vol. 20, No. 11,Nov. 1977, pp. 799-805.
3. E. C. Catmull, "A Hidden-Surface Algorithm with Anti-Aliasing, " Computer Graphics, Vol. 12, No.3, Aug. 1978,pp. 6-11. (This issue is the Siggraph '78 proceedings.)
4. F. C. Crow, "An Implementation of the 'Untried SortingOrder, ' " to appear.
5. J. F. Blinn, "Computer Display of Curved Surfaces,"Univ. of Utah PhD dissertation, Dec. 1978.
6. L. Williams, personal communication, 1979.
Franklin C. Crow is an assistant professorwith the Computer and Information ScienceDepartment at the Ohio State University,Columbus. From 1975-1979, he taught atthe University of Texas at Austin. His re-search interests include computer graphicsfor both raster and random scan devices,computer-aided design, and special-pur-pose and multiprocessor architectures.Crow received the BA in mathematics
from the University of Wisconsin at Madison and the PhD in com-puter science from the University of Utah. He is a member of theIEEE and the ACM.
CDCT Series:BARCO Color
Reader Service Number 16 IEEE CG&A