a compariso of thn effectivenese of pitfals anl longwortd...
TRANSCRIPT

ACTA THERIOLOGICA Vol. 32,15: 245—259,1987
A Comparison of the Effectiveness of Pitfall and Longworth Live-trapping Techniques in Population Studies
of House Mice
Grant R. SINGLETON
Singleton G. R., 1987: A comparison of th>e effectiveness of pitfall and Longworth live-trapping techniques in population studies of house mice. Acta theriol., 32, 15: 245—259 [With 3 Tables & 4 Figs.].
A population of house mice (Mus musculus Linnaeus, 1758) on a cereal f a rm in Australia was trapped for 6 months during a period of rapid population growth using Longworth and several designs of pitfall live-traps. The most effective method of capturing mice in pitfall traps was by interconnecting the pitfalls with a dr i f t fence that was positioned over the centre of each trap. Pitfall t raps without fences and those prebaited fo r five weeks, caught few mice. The trappability of mice ranged f rom 30 to 40% for pitfalls and f rom 11 to 20% for Longworths, indicating the mice may have a greater tendency to avoid repeated captures in Longworths than in pitfalls. Both trapping methods were effective in sampling all age classes of nvce. Overall, mice caught in pitfall traps were not significantly lighter or smaller than those caught in Longworth traps. The results of this study indicate that the two trapping methods provided similar, although independent, samples of a mouse population.
[Division of Wildlife & Rangelands Research. CSIRO, P.O. Box 84, Lyneham, A.C.T. 2602, Australia]
1. INTRODUCTION
Most demographic studies of small mammals rely heavily on informa-tion obtained f rom live-trapping techniques. An assumption in the analysis and interpretation of live-trapping data is that trappable mem-bers of a given population respond similarly to a particular trapping method. The use of different trapping methods provides a test of this assumption (Boonstra & Krebs, 1978). In population studies of Microtus townsendii (Bachman, 1839) pitfall live-traps (pitfalls) and Longworth live-traps (Longworths) captured different segments of the population and many of the young voles caught in pitfalls never entered Longworths (Beacham & Krebs, 1980; Boonstra & Krebs, 1978). In contrast, in a population study of Microtus pennsylvanicus (Ord, 1815) Longworths were found to be more effective than pitfalls, although first capture of young voles occurred more often in pitfalls (Boonstra & Rodd, 1984). Andrzejewski & Rajska (1972) found live-traps (dimensions 160X100X X100 mm, see Olszewski, 1968) more effective than pitfalls in capturing Clethrionomys glareolus (Schreber, 1780); and although the trappability
[245]

246 Singleton G. R.
in the former increased with age of bank voles, that in the latter was low across all age classes. It is clear from these studies that a response to a particular trapping method cannot be extrapolated across species.
This study addresses initially the effectiveness of different pitfall trapping methods {e.g. with or without dr i f t fences) for capturing house mice, Mus musculus (Linnaeus, 1758) and then compares the effectiveness of the best pitfall method with that of the Longworth live-trap.
2. STUDY AREA
The study area was part of the Mallee Research Station at Walpeup in the central Mallee wheatlands of northwestern Victoria, Australia. This region is extensively farmed and main crops are the winter cereals, wheat and barley. The study was conducted during the period Janua ry 1984 to July 1984, in a stubble paddock which had been sown to ryecorn (Triticale sp.) and wheat (Trit icum aestivum) in May 1983 and harvested in November 1983 (Fig. 1).
3. MATERIALS AND METHODS
3.1. Pitfall Trap Designs
(a) Drift fences. The drif t fence consisted of a 400 m m high fence of fine mesh aluminium fly-screen and ran between pitfalls of each line. The drif t fence cut across the centre of pitfalls except for prebaited pitfalls where the fence was offset to one side.
(b) Prebait ing versus baiting traps when set. From January to April a subsample of pitfalls was fit ted with a prebaiting platform similar to a design described by Boonstra and Krebs (19i78). Pitfalls were prebaited for the five weeks between trapping periods by adding wheat and oats to a p la t form suspended 100 mm from the top of the pitfall. The platform was covered and the cover was raised from the ground allowing ad libitum access to the bait. The bait was checked weekly, and additional grain added if required. Pi tfal ls not prebaited were baited when set; wheat was added to and lightly sprinkled around each pitfall.
(c) Trap diameter. Two types of pitfalls were used; one 390 mm in diameter and 455 mm deep and the other 300 mm in diameter and 580 mm deep. Both types were placed along the drif t fence which had 15 pitfalls, eight were 390 mm in diameter and seven (two prebaited) were 300 mm in diameter.
3.2. Pitfall Trapping Schedules
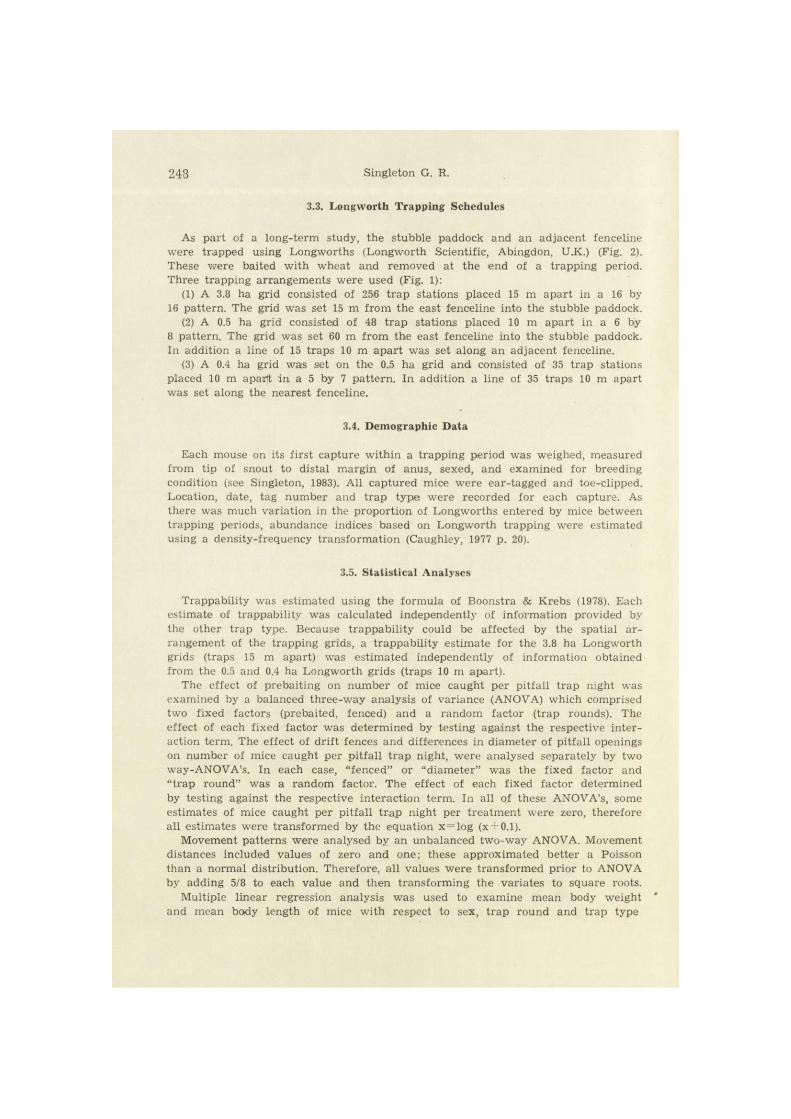
Two trapping arrangements were used: (1) A line of 15 fenced pitfalls plus nine scattered and unfenced pitfalls were set in the stubble paddock in January 1984. (2) From April to July 1984 a new trapping arrangement was used. Three solitary, unfenced pitfalls, and two fenced pitfall t rapping lines, one containing 15 pitfalls and the other 10, were set. Pitfalls along the dr i f t fences were placed, on average, 5 m apar t (Fig.l). The schedule of pitfall t rapping is shown in Figure 2. A 200 mm length of 45 mm diameter PVC pipe was placed in the bottom of each pitfall to provide shelter f rom rain and protection f rom foxes and avian predators.
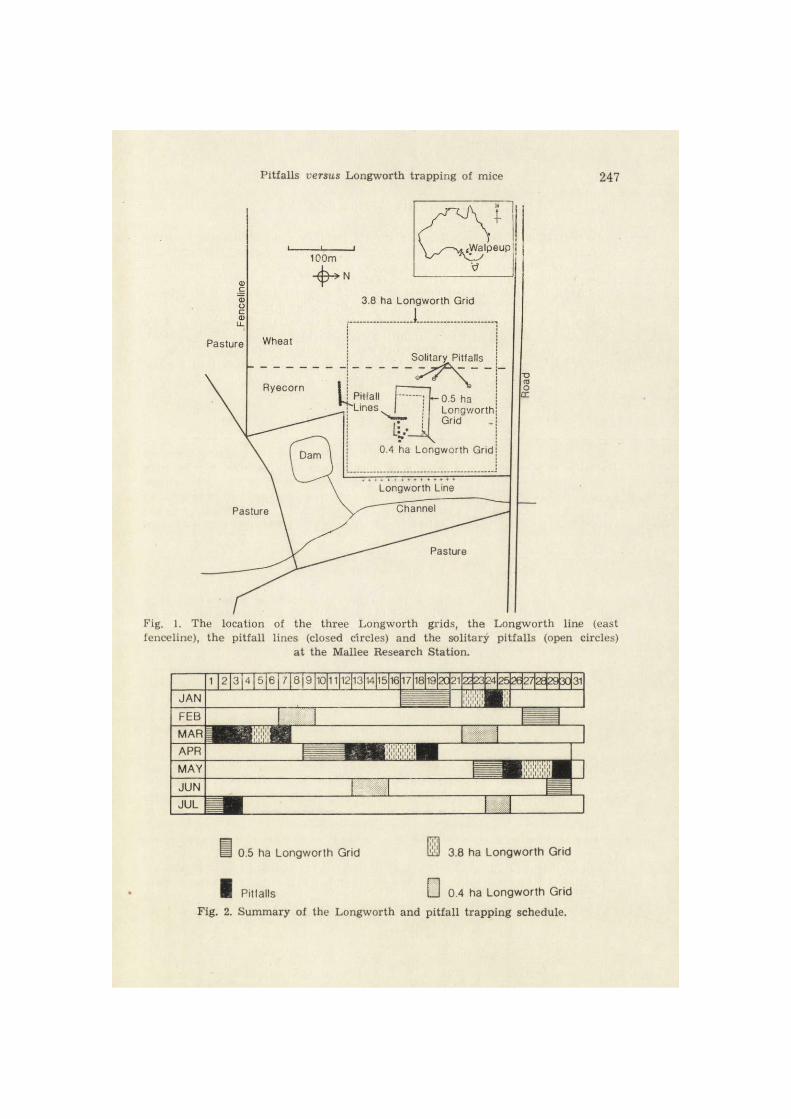
Pitfalls versus Longworth trapping of mice 247
fenoeline), the pitfall lines (closed circles) and the solitary pitfalls (open circles) at the Mallee Research Station.
• 0.5 ha Longworth Grid ISl 3.8 ha Longworth Grid
I Pitfalls • 0.4 ha Longworth Grid Fig. 2. Summary of the Longworth and pitfall t rapping schedule.
4 Singleton G. R.
3.3. Longworth Trapping Schedules
As part of a long-term study, the stubble paddock and an adjacent fenceline were trapped using Longworths (Longworth Scientific, Abingdon, U.K.) (Fig. 2). These were baited with wheat and removed at the end of a trapping period. Three trapping arrangements were used (Fig. 1):
(1) A 3.8 ha grid consisted of 256 t rap stations placed 15 m apart in a 16 by 16 pattern. The grid was set 15 m f rom the east fenceline into the stubble paddock.
(2) A 0.5 ha grid consisted of 48 t rap stations placed 10 m apart in a 6 by 8 pattern. The grid was set 60 m f rom the east fenceline into the stubble paddock. In addition a line of 15 traps 10 m apar t was set along an adjacent fenceline.
(3) A 0.4 ha grid was set on the 0.5 ha grid and consisted of 35 t rap stations placed 10 m apar t i n a 5 by 7 pat tern. In addition a line of 35 t raps 10 m apart was set along the nearest fenceline.
3.4. Demographic Data
Each mouse on its f irst capture within a trapping period was weighed, measured f rom tip of snout to distal margin of anus, sexed, and examined for breeding condition (see Singleton, 1983). All captured mice were ear-tagged and toe-clipped. Location, date, tag number and t rap type were recorded for each capture. As there was much variation in the proportion of Longworths entered by mice between trapping periods, abundance indices based on Longworth trapping were estimated using a density-frequency t ransformation (Caughley, 1977 p. 20).
3.5. Statistical Analyses
Trappability was estimated using the formula of Boonstra & Krebs (1978). Each estimate of trappability was calculated independently of information provided by the other t rap type. Because trappabil i ty could be affected by the spatial a r -rangement of the trapping grids, a trappabili ty estimate for the 3.8 ha Longworth grids (traps 15 m apart) was estimated independently of information obtained f rom the 0.5 and 0.4 ha Longworth grids (traps 10 m apart).
The effect of prebaiting on number of mice caught per pitfall t rap night was examined by a balanced three-way analysis of variance (ANOVA) which comprised two fixed factors (prebaited. fenced) and a random factor (trap rounds). The effect of each fixed factor was determined by testing against the respective inter-action term. The effect of drif t fences and differences in diameter of pitfall openings on number of mice caught per pitfall t rap night, were analysed separately by two way-ANOVA's. In each case, "fenced" or "diameter" was the fixed factor and "trap round" was a random factor. The effect of each fixed factor determined by testing against the respective interaction term. In all of these ANOVA's, some estimates of mice caught per pitfall t r ap night per t reatment were zero, therefore all estimates were transformed by the equation x = l o g (x + 0.1).
Movement patterns were analysed by an unbalanced two-way ANOVA. Movement distances included values of zero and one; these approximated better a Poisson than a normal distribution. Therefore, all values were t ransformed prior to ANOVA by adding 5/8 to each value and then t ransforming the variates to square roots.
Multiple linear regression analysis was used to examine mean body weight and mean body length of mice with respect to sex, t rap round and t rap type

Pitfalls versus Longworth trapping of mice 249
4. RESULTS
4.1. Pitfall Trap Designs
The number of mice caught in the four designs of pitfalls across the five trapping rounds is presented in Table 1. Over the five trapping rounds, 2-way ANOVA's indicated that: (1) the diameter of the pitfall opening (300 mm or 390 mm) had no significant effect on the number of mice caught (Fl,2 —1.46, p>0.50). Therefore, mice caught in the two pitfall types were combined for the comparisons of the four pitfall designs. (2) pitfalls connected by a dr i f t fence caught significantly more mice than pitfalls with no fence (F 1,4=11.18 p<0.05).
Table 1 Number of mice caught in the various pitfall designs over the five t r ap rounds. Number of pitfall t rap nights
per t reatment is shown in parentheses.
Trap No fence No fence Fence Fence+ no prebait round prebait No prebait Prebai t 300 diam. 390 diam.
1 0 (15) 0 (6) 1 (4) 7 (10) 9 (16) 2 1 (25) 4 (15) 3 (10) 18 (25) 24 (40) 3 9 (24) 33 (40) 4 (12) 22 (30) 72 (48) 4 0 (8) 116 (28)a 119 (27)a
5 0 (6) 41 (14)a 128 (14)a
a Does not include mice caught in the second fenced line of 10 pitfalls.
For trap rounds 1 to 3, a 3-way ANOVA (prebait, drif t fence, trap round) indicated that: (1) pitfalls connected by a drif t fence caught significantly more mice (Fl,2 = 24.11, p<0.05). (2) prebaiting did not have a significant effect on capture rate (Fl,2 = 14.56, 0 .10>p>0.05) .
There were no significant interaction effects. The high F value for the factor "prebaited" may simply reflect the low number of replicates in this study and indicates that this factor needs more study. Fewer mice were caught in the prebaited pitfalls.
4.2. Population Dynamics
The following demographic information was obtained from the 0.5 ha and 0.4 ha grids. A rapid increase in mouse abundance began during the summer of 1983/84 (December to February) and continued through to late autumn (May). Mouse abundance remained high until the end of the study in Ju ly 1984 (Fig. 3).

250 Singleton G. R.
Breeding began at the study site in September 1983. In March 1981 40% of adult (head body leng th>72 mm) females (n=95) were pregnant (21%) or lactating, in April 50% of adult females (iV=127) were pregnant (4%) or lactating, and in May only 2% of adult females ( n = 207) were pregnant (1%) or lactating.
1983 | 1984
Fig. 3. Mouse abundance on the Mallee Research Station, November 1983 to September 1984. The index of mouse abundance was greater than 140 f rom May
to August 1984. Extent of breeding season is represented by the shaded bar.
4.3. Body Length and Weight Comparisons
Only 7% of the variance in multiple linear regression analysis of mean body weight on first capture of mice per trap round, was accounted for by a model which included the factors sex, t rap round and t rap type. Analysis of variance of these data indicated significant interactions between trap round and sex (F4,2855 = 2.37, p<0.01), and trap round and trap type (F4,2855 = 6.82, p<0.01). Consideration of each factor as a separate component is not possible because these interaction terms are contributing significantly to the overall variance and the experimental design is not orthogonal. Similarly, only 7% of the variance in mean body length was accounted for by a model including the above factors. Analysis of variance of these data indicate significant interactions between trap round and sex (F4,2848 = 7.88, p<0.01), and sex and trap type (F4,2848 = 12.25, p<C0.01). For first captures of mice per trap round,

Pitfalls versus Longworth trapping of mice 251
Longworth captured males were on average 1.7 g heavier (range 0.6 to 2.4) and 2.7 mm longer (range 1.4 to 5.4) over trap rounds 1 to 4, but were 0.9 g lighter and 1.9 mm longer in t rap round 5, and females were 2.0 g heavier (range 0.7 to 3.2) and 2.3 mm longer (range 0.2 to 4.6) over all t rap rounds than males and females respectively, caught in pitfalls (Table 2).
Table 2 Mean body weight (g) and mean body length (mm) of first captures of mice in each t rap round for each sex and t rap type, and of recaptures of mice within a t rap round for each sex and t rap type, over the five t rap rounds. N = sample size,
Wt—mean weight; Lgth—mean length.
Trap First captures Recaptures within a round round Longworths Pitfalls Longworths Pitfalls
& sex N Wt Lgth N Wt Lgth N Wt Lgth N Wt Lgth
1 Males 166 16.4 80.4 12 14.0 78.7 46 16.9 80.9 0 Females
o 86 15.8 76.7 5 12.6 74.0 16 19.0 80.9 0
Z Males 284 13.5 74.9 20 11.9 72.6 32 13.6 75.1 2 12.6 73.0 Females
Q 203 14.9 76.6 27 12.6 74.3 24 16.5 80.0 2 17.2 80.0
O Males 265 14.3 77.6 58 11.9 72.2 41 16.6 81.5 6 15.7 81.0 Females
A
250 15.1 78.8 73 12.7 74.2 29 16.7 82.0 4 12.5 73.0
Males 381 14.2 77.0 133 13.6 75.6 61 14.8 78.2 29 12.2 73.7 Females
tz
386 16.2 80.7 120 15.0 78.4 103 17.8 83.0 25 14.3 76.4 D
Males 88 14.0 77.0 112 14.9 78.9 23 14.5 77.7 11 15.6 79.4 Females 110 15.8 79.6 92 15.1 79.4 33 16.8 81.7 6 14.2 79.2
Size distribution of mice varied throughout the six month study. Also, size distribution within a trapping round was generally different for males and females. This was most evident in trap round 4; females exhibited a bimodal and males a unimodal size distribution in captures by Longworths and pitfalls. Despite these differences in size distribution there was no obvious size class in either sex missing from or additional to those caught in Longworth versus pitfall traps (Fig. 4).
Only 15% of the variance in regression analysis of mean body weight cf mice recaptured within trap rounds was accounted for by a model including the factors sex, trap type and trap round. Analysis of variance of these data indicate a significant interaction between sex and trap round (F4,478 = 2.98, p<0.05) and that mice recaught in Longworths were significantly heavier than mice recaught in pitfalls (Fl,478 = 25.0, p<0.01). Regression analysis of mean body length accounted for 12% of the variance. Analysis of variance of these data indicated a significant

252 Singleton G. R.
interaction between sex and trap round (F4,479 = 2.81, p<0.05) and that mice recaught in Longworths were significantly longer than mice recaught in pitfalls (Fl,479 = 22.88, p<0.001). The largest sample was obtained in trap round 4 when males recaught in Longworths were 2.6 g heavier and 4.5 mm longer, and females recaught in Longworths were 3.5 g heavier and 6.6 mm longer than those recaught in pitfalls (Table 2).
Number of Mice Caught
3? 16 0 3? 16 0 16 32 16 0 16 80 6J 46 32 16 0 16 16 0 16
January March April May July
t Longworths * ' " " - - » 0 Pitfalls
Fig. 4. Size distribution of males and females caught in Longworths (shaded) a::d pitfalls (unshaded) over the five t rap rounds.
4.4. Mice Caught in Both Trap Types
Over the five trapping rounds 495 different mice were caught first in pitfalls; of these, 29 (6%) were re-caught in Longworths. The propor-tion of animals first caught in Longworths that were re-caught in pitfalls was 7% (139 of 1908 mice).
Of the few juveniles and sub-adults caught in both t rap types, 61% of those first caught in Longworths (ni=23) and 63% of those first caught in pitfalls (n=8) were re-caught in the second trap type within 5 weeks.

Pitfalls versus Longworth trapping of mice 253
A short time-lag between captures in the two trap types was apparent also amongst both sexes of the adult age class. Seventy-six percent of both male (ti=58) and female (w=58) adults first caught in Longworths were re-caught in pitfall traps within 5 weeks; all adults first caught in pitfalls (ti=21) entered Longworths within 5 weeks.
Mean captures per mouse of those caught more than twice, were similar across all combinations of trap type, time period and grid size (Table 3).
Analyses of movement patterns of mice reflected similar mean dis-tances moved by mice within a sampling round (Longworths to pitfalls mean = 35.9 ± 3.81 m, n=102; pitfalls to Longworths mean = 34.8 ± 5.38 m, n=18) and different mean distances moved by mice between sampling rounds (Longworths to pitfalls mean = 49.6 ± 6.53 m, n — 47; pitfalls to
Table 3 Trappabil i ty estimates, sample sizes, and mean captures of mice caught
than twice, for each t rap type and for two sample periods.
Trap type & sex
Period No. No. mice different potentially
mice caught caught > tw ice
Mean captures of mice caught > tw ice
Trappabili ty
Pitfal l Males January 209 27 3.3 (0.13) 37.8 Females to July 207 19 3.7 (0.26) 37.4
Longworth Males •1029 176 4.0 (0.18) 11.2 Females 872 147 4.2 (0.21) 15.5
Pitfall Males January 126 17 3.2 (0.15) 40.9 Females to May 133 13 3.6 (0.26) 30.4
Longworth Males 789 147 11.0 Females 631 136 19.9
(1) 3.8 ha grid Males 522 66 3.7 (0.17) 18.8 Females 404 66 3.5 (0.12) 22.8
(2) 0.5 & 0.4 ha grid Males 289 59 3.8 (0.21) 23.3 Females 245 52 4.1 (0.24) 23.1
Longworths mean = 25.1 ± 6.29, 71=28). However, apart f rom mice pre-viously caught in Longworths moving significantly longer distances to enter a pitfall between sampling rounds (Fl,145 = 3.94, p<C0.05), there were no significant differences in distances moved by mice between the two trap types with respect to capture order (Fl,191 = 0.08, p>0.05), trap rounds (Fl,191 = 3.27, p>0.05), or the interaction between trap round and capture order (Fl,191 =3.27, p>0.05).

254 Singleton G. R.
Capture in Longworths would depend also on the availability of empty traps; 70, 48, 41, 4 and 0 per cent respectively, of Longworths were unoc-cupied in t rap rounds 1 to 5. *
4.5. Trappability
Trappability of males and females was similar in both trap types, between January and July. In the same period, males were 3.4 times and females were 2.4 times more trappable in pitfalls than Longworths, yet the proportion of mice potentially caught more than twice in either trap type was higher for each sex in mice caught in Longworths (Table 2). Trappabilities were similar on the large and small Longworth grids.
5. DISCUSSION
5.1. Effectiveness of Different Pitfall Designs
There have been no previous studies of the effectiveness of pitfalls for capturing house mice. The studies most relevant to the present work are those comparing the effectiveness of Longworth and pitfall traps in populations of M. townsendii (Boonstra & Krebs, 1978; Beacham & Krebs, 1980) and M. pennsylvanicus (Boonstra & Rodd, 1984). In these studies pitfalls were prebaited and unfenced. Unfenced pitfalls, prebaited or not, caught few house mice in the present study. Trapping of mice was greatly enhanced by a drif t fence positioned across the middle of each pit. Prebaiting resulted in fewer mice caught, however, the placement of a prebaiting platform along a dr if t fence necessitated prebaited pitfalls to be offset f rom the fence. The position of the drif t fence over the centre of the pit may be more important than prebaiting if pitfalls are to be effective traps for mice.
5.2. Population Densities
Population densities estimated in the studies of Microtus species (loc. cit.) could be compared readily because a pitfall t rap was placed at each Longworth grid point. A more simple design of pitfall t rap placement was chosen in the present study because of expense, time and design problems involved in placing a pitfall at each Longworth grid point and then positioning drift fences between them. Consequently, the contrast in spatial configuration between the two trap types in the present study rendered meaningless any comparison of population densities calculated

Pitfalls versus Longworth trapping of mice 255
from the two trapping methods. However, important demographic infor-mation essential for comparison of the effectiveness of the two trapping methods in capturing house mice was obtained.
5.3. Weight, Size and Age Structure Comparisons
Overall, mice caught in pitfalls were approximately 2 g lighter and 2.5 mm shorter than those caught in Longworths. However, significant interactions between sex and trap round, and between trap round and trap type indicated that weight and length differences between mice caught in pitfalls and Longworths varied considerably over the five trapping rounds. Weight and length differences were most pronounced in a young population. Despite these differences, the most common size classes of mice caught during each trap round were similar for both types of trap. Also, the time-lag between when young mice entered a pitfall and then entered a Longworth was generally less than five weeks, the minimum time between trap rounds.
Competition for live-traps has been reported in a number of small mammal species; larger, dominant individuals usually being more trap-pable than smaller subordinate individuals (Kikkawa, 1964; Gliwicz, 1970; Summerlin & Wolfe, 1973). The level of competition for traps in a pop-ulation of C. glareolus increased as the density of trappable animals increased (Kikkawa, 1964). If there was a positive association between social dominance and trappability in the present study, then competition would be expected to be intense in the latter trap rounds when all but a few Longworths were occupied each night and the smaller size classes of mice would be noticeably underrepresented amongst those caught in Longworths compared to those caught in pitfalls. However, the smaller size classes of mice were not underrepresented in Longworth captures in trap rounds 4 and 5, suggesting that Longworth and pitfall traps are equally effective in sampling all age classes of the population. The two trap types appeared to be providing similar, although independent, samples of a mouse population.
5.4. Movements Between Trap Types
Comparison of overlap in captures between the two trap types is compounded because the Longworths were set over a larger trapping area and the two trap types were generally not set concurrently. Even so, there was no evidence that capture in either trap type affected the likelihood of capture in the other. This is surprising. The opportunity for mice to move from pitfall to Longworth traps was reduced because:

256 Singleton G. R.
(i) half of the pitfall trapping effort occurred at the end of a t rap round during which time no Longworths were set, and (ii) there was intense ccmpetition for empty Longworths in trap rounds 4 and 5 when all but a few traps were full each night. If the latter had an effect one would expect the distances moved by mice f rom pitfalls to Longworths within a trap round to be longer than the reverse movements. This was not the case; the respective mean distances moved between trap types were similar. However, there was a large difference between trap rounds in mean distance of mouse movements between trap type; mice moved twice as far between Longworths and pitfalls than between pitfalls and Long- worths. The reason for this difference is not apparent.
5.5. Trappability
Repeated captures of M. townsendii and M. pennsylvanicus in pitfalls range from 5 to 35%, whereas trappability in Longworths was greater than 50% (Boonstra & Krebs, 1978; Beacham & Krebs, 1980; Boonstra & Rodd, 1984). My results indicate an opposite trap response; mice had a greater tendency to avoid repeated captures in Longworth than in pitfalls. However, this tendency should be viewed with caution. Firstly, the measures of trappability of mice in Longworths were underestimated because of the competition for empty traps in the latter trapping rounds. Secondly, although trappability of mice in Longworths was only mar-ginally influenced by length of sample period, periodicity of trapping and/or spatial layout of traps, significant changes in trappability may have occurred if the spatial layout of Longworths had been changed from a grid to a line. Trappability in voles may be modified by the trapp-ing regime (Krebs & Boonstra, 1984), consequently, comparisons of trapp-ability of house mice between pitfall t rap lines and Longworth trapping grids may not be valid.
5.6. Comparison with Microtus Studies
The differences in effectiveness of Longworths compared to pitfalls in capturing mice are small relative to those reported in voles. Long- worths generally caught M. townsendii over 40 g whereas pitfalls gen-erally caught animals under 40 g, there was a time lag of 5 to 9.3 weeks between first capture in a pitfall and later capture in a Longworth, and pitfalls captured over 70% and Longworths 55—60% of the pop-ulation (Boonstra & Krebs, 1978; Beacham & Krebs, 1980). More M. pen-nsylvanicus juveniles (<22 g) were captured in pitfalls and more adults

Pitfalls versus Longworth trapping of mice 257
(>33 g) were captured in Longworths, there was a time lag of 4 to 6 weeks between first capture in a pitfall and later capture in a Longworth, and Longworths captured 82% and pitfalls 46% of the population (Bo-onstra & Rodd, 1984).
The studies of voles differed f rom that of mice. Design and spatial layout of the pitfalls were different, vole populations were trapped more frequently, Longworth traps were locked open and left in situ between trap rounds, the North American grassland habitats in which the vole studies were conducted were very different to the Mallee wheatland habitat of southeastern Australia, and mice are at least twice as small as voles. The latter point is noteworthy. The lightest weight classes of mice captured in Longworths (minimum weight 4.5 g) may be under-represented because the triggers of some traps may not be sufficiently sensitive. Deermice, Peromyscus maniculatus, (Wagner, 1845) are similar in weight to house mice, but weight classes below 7.5 g violated the assumption that all traps are equally efficient at capturing this species (Grant, 1970). Particular attention was paid to setting the trigger finely in every trap in the present study. This form of trap capture bias would be minimal in the heavier voles. Therefore it is not surprising that thef» response of house mice to the two trap types is different to that reported for voles.
5.7. Concluding Remarks
The present study was conducted principally on high density mouse populations. Pitfalls were as effective as Longworths in providing a sound data base for demographic studies when mouse density was high. At lower densities pitfalls may be as effective as Longworths but they may be far less efficient; for similar time and effort, Longworth trapp-ing covers a much larger area and many more traps may be set. Further comparative studies of the two trapping methods are required during periods of low mouse population density.
Drift fences are necessary for pitfall trapping of house mice to be as effective as Longworth trapping. Although neither Longworths nor pitfalls captured a large proportion of the mouse population during the period of rapid population increase, they both provided consistent quantitative estimates of the various demographic parameters, in a relative rather than an absolute sense. The small difference in response of mice to the two trapping methods is in contrast to the pronounced differences report-ed in M. townsendii and to a lesser extent in M. pennsylvanicus. Varia-tion in design between the present mouse study and the three vole

14 Singleton G. R.
studies may account for some of this contrast in trap response. However, given the pronounced interspecies differences in Microtus in response to trap types, marked inter-family differences are not surprising.
Acknowledgements: I thank Dr. Trevor Redhead for his advice and enthusiasm throughout the study, and Drs. Caughley and Redhead for their assistance in the analyses of the data. Kathy Masters, Ross Cooper and Colin Tann provided expert field assistance and formed a team of excellent and enthusiastic workers. Drs. Boonstra, Redhead and Spratt provided helpful suggestions and critical discussion of an earlier draf t of the manuscript. My appreciation is also extended to John Griffi ths and his staff for their assistance during my work at the Mallee Research Station. I thank Glenn Schipp for drawing the diagrams. This research was funded by the Wheat Research Council of Australia, project number CS44.
REFERENCES
1. Andrzejewski R. & Rajska E., 1972: Trappability of bank voles in pitfalls and live traps. Acta theriol., 17: 41—56.
2. Beacham T. D. & Krebs C. J., 1980: Pitfall versus l ive-trap enumerat ion of fluctuating populations of Microtus townsendii. J. Mammal., 61: 486—499.
3. Boonstra R. & Krebs C. J., 1978: Pitfall t rapping of Microtus townsendii. J. Mammal., 59: 136—148.
4. Boonstra R. & Rodd F. H., 1984: Efficiency of pitfall versus live t raps in enumeration of populations of Microtus pennsylvanicus. Can. J. Zool., 62: 758—165.
5. Caughley G. C., 1977: Analysis of vertebrate populations. John Wiley & Sons, London, New York, Sydney & Toronto.
6. Gliwicz J., 1970: Relation between trappability and age of individuals in a population of the bank vole. Acta theriol., 15: 15—23.
7. Grant P. R., 1970: A potential bias in the use of Longworth traps. J. Mammal., 51: 831—835.
8. Kikkawa J., 1964: Movements, activity, and distribution *of the small rodents Clethrionomys glareolus and Apodemus sylvaticus in woodland. J. Anim. Ecol., 33: 259—299.
9. Krebs C. J. & Boonstra R., 1984: Trappability estimates for mark-recapture data. Can. J. Zool., 62: 2440—2444.
10. Olszewski J. L., 1968: Role of uprooted trees in the movements of rodents in forests. Oikos, 19: 99—104.
11. Singleton G. R., 1983: The social and genetic s tructure of a natura l colony of house mice, Mus musculus, at Healesville Wildlife Sanctuary. Aust. J. Zool., 31: 155—166.
12. Summerlin C. T. & Wolfe J. L., 1973: Social influence on t rap response of the cotton rat, Sigmodon hispidus. Ecology, 54: 1156—1159.
Received 1 June 1986, Accepted 3 March 1987.

Pitfalls versus Longworth trapping of mice 259
Grant R. SINGLETON
PORÓWNANIE EFEKTYWNOŚCI DWU TYPÓW PUŁAPEK ŻYWOŁOWNYCH W BADANIACH POPULACYJNYCH MYSZY DOMOWEJ
Streszczenie
Populacja myszy domowej (Mus musculus Linnaeus, 1758) zasiedlająca pole zboża wokół fa rmy w Australii badana była przez 6 miesięcy w czasie szybkiego wzrostu liczebności. Użyto dwa typy pułapek żywołownych. Najefektywniejszą metodą oka-zało się połączenie cylindrów z płotkiem przegradzającym umieszczonym wzdłuż średnicy pułapki. Cylindry bez płotków oraz cylindry z przynętą wykładaną przez 5 tygodni przed odłowami złowiły niewiele myszy (Tabela 1). Częstość ponownych złowień wahała się od 30 do 40°/o w przypadku cylindrów oraz od 11 do 20% w przypadku pułapek Longwortha, co może wskazywać, że myszy bardziej unikają powtórnych złowień w pułapki Longwortha, niż w cylindry. Obie metody były jednakowo skuteczne w łowieniu wszystkich klas wiekowych myszy domowej. Osobniki schwytane w cylindry nie były istotnie mniejsze i lżejsze od osobników złowionych w pułapki Longwortha (Tabela 2). Oba typy pułapek dostarczają więc podobne, choć niezależne, próby z populacji myszy domowej.