a comparative study of environmental expenditure in the
TRANSCRIPT

A Comparative Study of Environmental Expenditure in the
European Union and Latin America. Cases of Germany, Brazil and Argentina
Inés del Valle Asis-Fernando H. SonnetAuxiliar de Investigación: Natalia Suarez
Instituto de Economía y FinanzasFacultad de Ciencias Económicas
20 de Mayo de 2008
General TargetTo evaluate the importance of the economies related
to the environmental problems resolution, one of the key variables to analyze is the amount of resources that those economies use for that
purpose. These monetary items are the manifestation of the importance of the
environment in the agendas of each actor of the economy.
General target: to carry a comparative analysis of environmental expenditure in Germany, Brazil and Argentina, as part of the economic blocks to which these economies belong (EU and LA).
For it, was discussed:The scope of the main methodologies used for the estimation of environmental expenditureThe building comparable series of environmental expenditure for Germany, Brazil and Argentina, with the aim of analyzing their symmetries and asymmetries in absolute and relative terms (their participation in the GDP, the share of each item of expenditure, the function of expenditure, its nature, and the sector responsible for the expense).
The study will focused only on the perspective of the public sector (it was excluded the contributions being
made by the private sector in the economy)

Methodologies used for the estimation of environmental expenditure
Pollution Abatement and Control Expenditure-PACE- of the Organization for Economic Cooperation and DevelopmentThe System of Environmental and Economic Accounts – SEEA, developed by the United Nations OrganizationThe European System for the Collection of Economic Information on the Environment-SERIEE implemented by EurostatThe experience of countries such as Denmark, Canada and Australia which have developed accounting systems
PACE:Pollution Abatement and Control Expenditure OCDE (1998)
( I )
Definition: Spending on environmental protection and control is defined as all those activities directly related to the prevention, reduction and elimination of pollution or nuisance caused by residual production processesObjective: To define activities as protection of the environment (water, land, air, etc.), depending on the nature of expenditure (consumer goods or capital goods) and by the function (prevention, control, mitigation, etc.)

PACE:Pollution Abatement and Control Expenditure OCDE (1998)
( II )Reach: Accounts whose aim is strictly environmental.
Excludes resources allocated to natural resource management, to the activities of species protection, management and protection of ecosystems and security that influences the production processes of economic activit, and the cost of research, development of new technologies, and training and environmental education. Establishes guidelines for quantifying the "flow" cross to identify the level of mitigation performed by each agent (abater principle), as well as to estimate the financial burden for each sector (finarcer principle). Suggests building statistics flows for current expenses or capital formation incurred in the sectors

SEEA: System of Environmental and Economic Accounts
World Bank (1994)Definition: The environmental spending is defined on the basis of the standard Environmental Expenditure rating (CEPA) EUROSTATObjective: To provide a mechanism for organizing information in physical and monetary terms and also to enable the construction of indicators to assess and formulate public policies in the context of sustainable developmentReach: Develops the necessary adjustments to the monetary aggregates (GDP) to reflect environmental costs.Includes spending on protection Environmental and derivatives resource management. Generates macroeconomic indicators (adjusted GDP) according to spending on the environmental protection being made by many sectors. Differentiates environmental assets and the economic assets, and physical flows of assets and environmental pollution emissions

SERIEE: European System for the Collection on Economic Information on Environment. UE
Definition: Environmental protection constitutes all the actions and activities that aim at the prevention, reduction and elimination of pollution or other environmental degradationObjective: To build a procedures manual that seeks to estimate the monetary flows related to environmental protection, and to characterize the impact on the economy at national and regional levels, besides trying to build indicators.Reach: Part of agreed criteria for the valuation and description of theresources allocated for environmental protection, for classification and identification of the areas that absorb the cost. Quantifies the market for environmental protection. It includes the consumption of goods and services and activities that aim to prevent, reduce, reverse or mitigate the volume of pollutant emissions and / or the risk of contamination, monitoring and control, waste collection, treatment services, research and development of new technologies, trainingand environmental education, and activities related to biodiversity and natural resources.

EPEA: Environmental Protection Expenditure Account Australia (1990-91)
Definition: Uses methodologies OECD and SERIEE but with a broader definition than the OECDObjective: To develop a statistical system that can provide high-level decision makers with enough information, and elements to evaluate and develop policies, legislation, markets and economic instruments of environmental policy. It includes all levels of government, industry and household items. To analyze the efficiency of environmental expenditure-ecoefficiencyReach: It measures environmental spending, identifies and quantifies the responses of different sectors to regulation and environmental policy. It incorporates environmental information relevant to the economic accounts. It serves as a benchmark to compare the amount of the national effort in relation to international action

European UnionThe UE´s expenditure environment analysis can be done from their two
major components: the spendings incurred in pollution control and reduction, and the research and development budget for
environmental protection. The information available allows us toanalyse the situation for the members of european Union countries. In
this context, Germany´s case is dealt with.
Germany CaseThe Germany's public sector, as well as Denmark´s, shows the major financial efforts directed to pollution abatement and control, with percentages of GNP environmental expenditure between 1.2 and 1.4%. The public sector expenditure in Germany shows that the environmental expenditure decreased in the 2000s´ by 1,30 and 1,14, in terms of GDP while, Germany has spent an average of 300 USD per capita for environmental expenditure for 2000´s.The public sector expenditure in Germany shows over the years 2000 two different shares. About one third of environmental expenditure is allocated to environmental protection (expenses environment, nature protection and environmental security costs), while two thirds are spent in housing costs and community services (including expenses as support for the agricultural sector, spending on energy and water management).
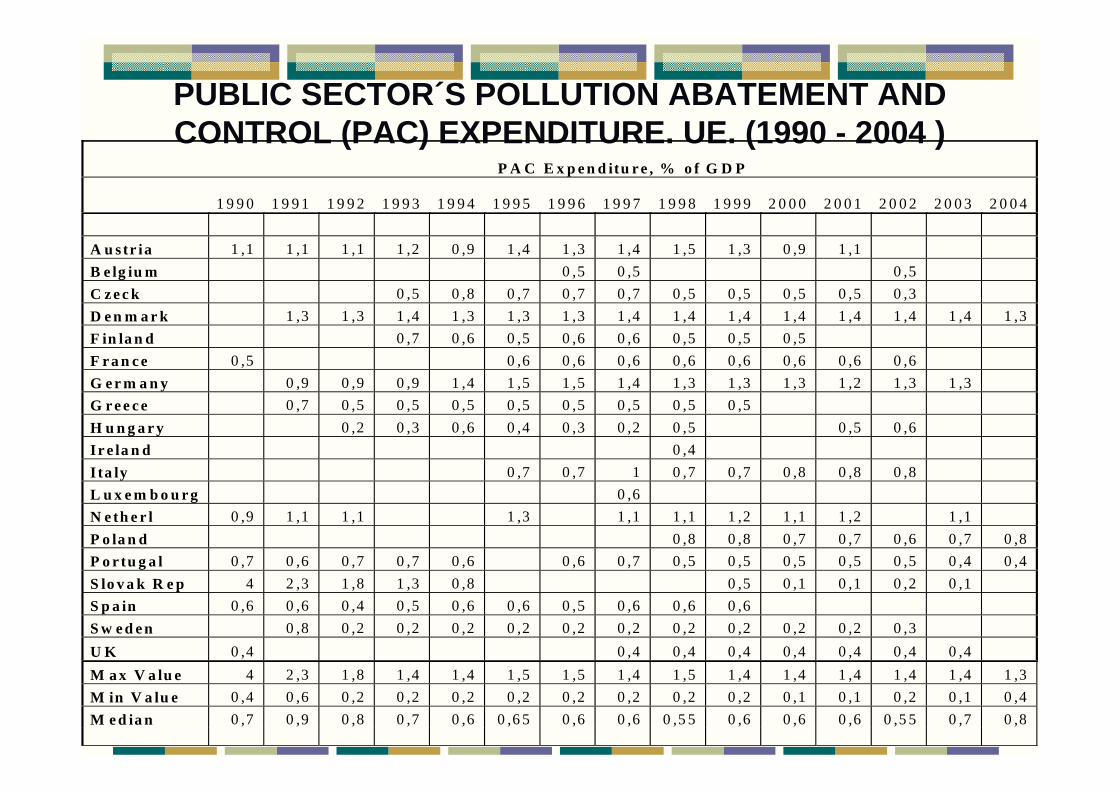
PUBLIC SECTOR´S POLLUTION ABATEMENT AND CONTROL (PAC) EXPENDITURE. UE. (1990 - 2004 )
P A C E x p e n d itu r e , % o f G D P
1 9 9 0 1 9 9 1 1 9 9 2 1 9 9 3 1 9 9 4 1 9 9 5 1 9 9 6 1 9 9 7 1 9 9 8 1 9 9 9 2 0 0 0 2 0 0 1 2 0 0 2 2 0 0 3 2 0 0 4 A u str ia 1 ,1 1 ,1 1 ,1 1 ,2 0 ,9 1 ,4 1 ,3 1 ,4 1 ,5 1 ,3 0 ,9 1 ,1 B e lg iu m 0 ,5 0 ,5 0 ,5 C z e c k 0 ,5 0 ,8 0 ,7 0 ,7 0 ,7 0 ,5 0 ,5 0 ,5 0 ,5 0 ,3 D e n m a r k 1 ,3 1 ,3 1 ,4 1 ,3 1 ,3 1 ,3 1 ,4 1 ,4 1 ,4 1 ,4 1 ,4 1 ,4 1 ,4 1 ,3 F in la n d 0 ,7 0 ,6 0 ,5 0 ,6 0 ,6 0 ,5 0 ,5 0 ,5 F r a n c e 0 ,5 0 ,6 0 ,6 0 ,6 0 ,6 0 ,6 0 ,6 0 ,6 0 ,6 G e r m a n y 0 ,9 0 ,9 0 ,9 1 ,4 1 ,5 1 ,5 1 ,4 1 ,3 1 ,3 1 ,3 1 ,2 1 ,3 1 ,3 G r e e c e 0 ,7 0 ,5 0 ,5 0 ,5 0 ,5 0 ,5 0 ,5 0 ,5 0 ,5 H u n g a r y 0 ,2 0 ,3 0 ,6 0 ,4 0 ,3 0 ,2 0 ,5 0 ,5 0 ,6 Ir e la n d 0 ,4 I ta ly 0 ,7 0 ,7 1 0 ,7 0 ,7 0 ,8 0 ,8 0 ,8 L u x e m b o u r g 0 ,6 N e th e r l 0 ,9 1 ,1 1 ,1 1 ,3 1 ,1 1 ,1 1 ,2 1 ,1 1 ,2 1 ,1 P o la n d 0 ,8 0 ,8 0 ,7 0 ,7 0 ,6 0 ,7 0 ,8 P o r tu g a l 0 ,7 0 ,6 0 ,7 0 ,7 0 ,6 0 ,6 0 ,7 0 ,5 0 ,5 0 ,5 0 ,5 0 ,5 0 ,4 0 ,4 S lo v a k R e p 4 2 ,3 1 ,8 1 ,3 0 ,8 0 ,5 0 ,1 0 ,1 0 ,2 0 ,1 S p a in 0 ,6 0 ,6 0 ,4 0 ,5 0 ,6 0 ,6 0 ,5 0 ,6 0 ,6 0 ,6 S w e d e n 0 ,8 0 ,2 0 ,2 0 ,2 0 ,2 0 ,2 0 ,2 0 ,2 0 ,2 0 ,2 0 ,2 0 ,3 U K 0 ,4 0 ,4 0 ,4 0 ,4 0 ,4 0 ,4 0 ,4 0 ,4 M a x V a lu e 4 2 ,3 1 ,8 1 ,4 1 ,4 1 ,5 1 ,5 1 ,4 1 ,5 1 ,4 1 ,4 1 ,4 1 ,4 1 ,4 1 ,3 M in V a lu e 0 ,4 0 ,6 0 ,2 0 ,2 0 ,2 0 ,2 0 ,2 0 ,2 0 ,2 0 ,2 0 ,1 0 ,1 0 ,2 0 ,1 0 ,4 M e d ia n 0 ,7 0 ,9 0 ,8 0 ,7 0 ,6 0 ,6 5 0 ,6 0 ,6 0 ,5 5 0 ,6 0 ,6 0 ,6 0 ,5 5 0 ,7 0 ,8

GERMANY. ENVIRONMENTAL EXPENDITURE, % OF GDP -YEARS 2000-2005
Year Total Environmental Expenditure
- Public Sector (Millions of USD)
Environmental Expenditure
(% GDP)
Environmental Expenditure Per capita (in USD)
2000 24.703 1.30 300 2001 22.692 1.19 276 2002 26.243 1.30 318 2003 31.743 1.30 385 2004 31.316 1.14 379 2005 31.771 1.14 385
Source: Based on data from OCDE, Bundesministerium der Finanzen and World Bank.

Latin America This case does not allow a study of Latin American countries to a
level of detail similar to that conducted for the EU, and this isdue to the lack of a uniform system of statistics as applied by Eurostat or the OECD.
The performance of individual countries is very uneven and the realization of its environmental expenditure estimates has responded rather to particular projects of some organizations in the region-in particular, CEPAL-only for some economies and for certain periods (since 1992, with the signing of the Rio 92 Conference).
Countries in which there have been progress in this field are: Argentina, Brazil, Chile, Colombia, Costa Rica, Mexico, and Peru.

Argentina and Brazil Progress ( I )
Argentina Case (Oscar Cetrángolo, O.- Chidiak, M.- Curcio, J.–Gutman, V. CEPAL: 2004 and Chudnovsky, D.- López, A.: 2002)
There is a system of environmental statistics of environmental public spending.The minimum levels reached in 2002 both in absolute value (397 million dollars) in relation to GDP (0.38%). The bulk of environmental spending is done by municipalities (3 / 4 of the total), about 1 / 5 is done by the provinces and only 5% by the NationalGovernment. There is the preponderance of funding from the National Treasury with a growing involvement of external sources.

Argentina and Brazil Progress ( II ) Brasil Case (Young, C.E.-Roncisvalle, C.A.CEPAL: 2002)At the federal government level, it was estimated that environmental expenditures were between 0.4% and 1% of the federal spending.The overall federal government expenditures in environmental issues did not increase during the 1993-2000 periodFor the 1996-98 period show that, if sanitation costs are included (an overestimate since it also considers water supply),environmental expenditures are relatively more important for local governments: around 9% of the total public spending in the sample of municipios considered.For the year 2000 that the public spending on environmental issues was of 1.5% of the total, the public environmental spending would be of 0.33% of GDP, and an annual expenditure per capita of US$ 9.2 . If the estimated industrial environmental spending is added, the total spending becomes 0.34% of GDP or US$ 9.6 per capita.Most of the funding for environmental projects comes from the government (mainly federal, through BNDES), international development agencies, or from companies’ own resources.Foreign resources for projet presented a declining trend since 1994, oscillating between 6% and 17% of total expenditures.

B R A Z I L .E N V I R O N M E N T A L T O T A L P U B L I C E X P E N D I T U R E B Y G O V E R N M E N T – Y E A R S 1 9 9 6 -1 9 9 8
Y e a r F e d e r a l G o v e r n m e n t
S ta te G o v e r n m e n t
M u n ic ip a l e x p e n d i tu r e
T o ta l
M il . R % M il . R % M il . R % M il .R % 1 9 9 6
T o ta l e x p e n d itu r e
1 .0 3 5 .2 8 5 1 5 ,3 1 1 .7 1 5 .5 4 7 2 5 ,3 6 4 .0 1 2 .1 6 2 5 9 ,3 2 6 .7 6 2 .9 9 4 1 0 0 ,0 0
C u r r e n t e x p e n s e s
5 .0 3 5 .2 1 8 7 4 ,4 5
I n v e s te m e n t 1 .7 2 7 .7 7 6 2 5 ,5 5
1 9 9 7
T o ta l e x p e n d itu r e
1 .2 1 4 1 8 7 1 7 ,8 1 2 .1 0 4 .6 6 1 3 0 ,8 8 3 .4 9 7 .1 0 2 5 1 ,3 1 6 .8 1 5 .9 5 0 1 0 0 ,0 0
C u r r e n t e x p e n s e s
5 .4 8 5 .4 7 4 8 0 ,4 8
I n v e s te m e n t 1 .3 3 0 .4 7 6 1 9 ,5 2
1 9 9 8
T o ta l e x p e n d itu r e
1 .7 8 3 .9 3 8 2 0 ,9 3 3 .0 4 7 .5 2 1 3 5 ,7 6 3 .6 9 1 .3 3 6 4 3 ,3 1 8 .5 2 2 5 9 5 1 0 0 ,0 0
C u r r e n t e x p e n s e s
6 .7 5 1 .8 2 1 7 9 ,2 2
I n v e s te m e n t 1 .7 7 0 .7 7 4 2 0 ,7 8 S o u r c e : B a s e d in Y o u n g , C .E .-R o n c is v a l le , C .A .(2 0 0 2 )
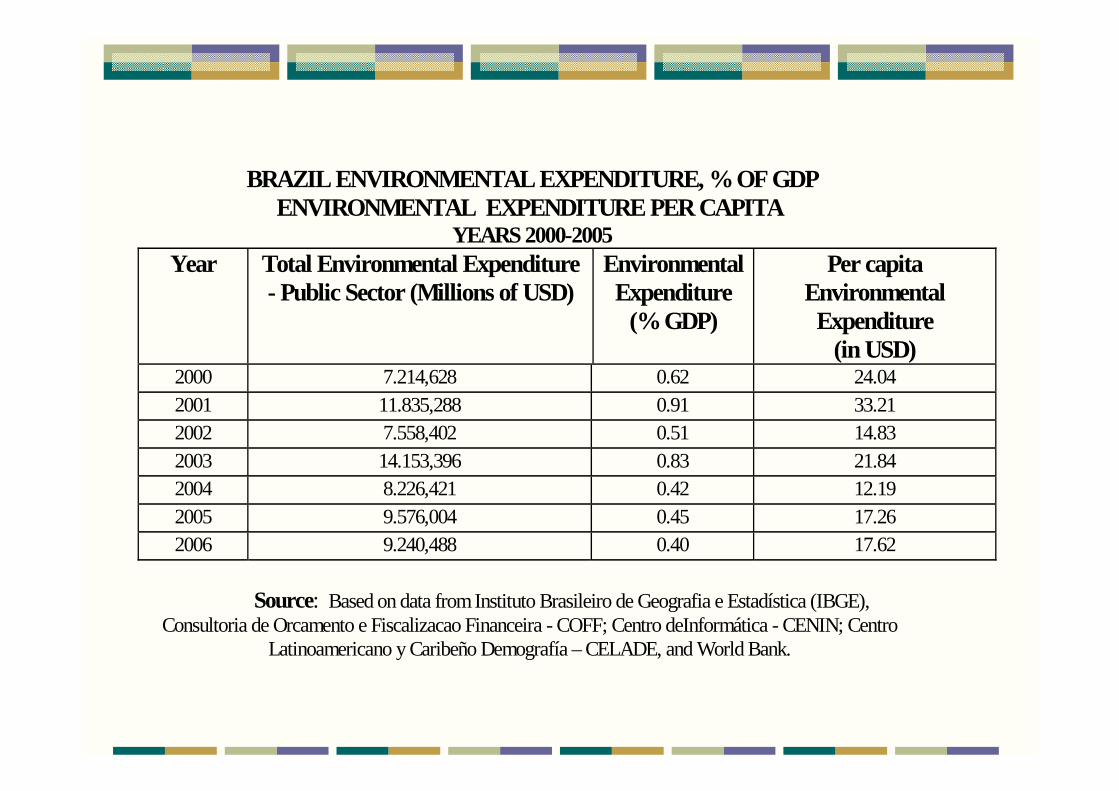
BRAZIL ENVIRONMENTAL EXPENDITURE, % OF GDP ENVIRONMENTAL EXPENDITURE PER CAPITA
YEARS 2000-2005 Year Total Environmental Expenditure
- Public Sector (Millions of USD)
Environmental Expenditure
(% GDP)
Per capita Environmental Expenditure
(in USD) 2000 7.214,628 0.62 24.04 2001 11.835,288 0.91 33.21 2002 7.558,402 0.51 14.83 2003 14.153,396 0.83 21.84 2004 8.226,421 0.42 12.19 2005 9.576,004 0.45 17.26 2006 9.240,488 0.40 17.62
Source: Based on data from Instituto Brasileiro de Geografia e Estadística (IBGE),
Consultoria de Orcamento e Fiscalizacao Financeira - COFF; Centro deInformática - CENIN; Centro Latinoamericano y Caribeño Demografía – CELADE, and World Bank.
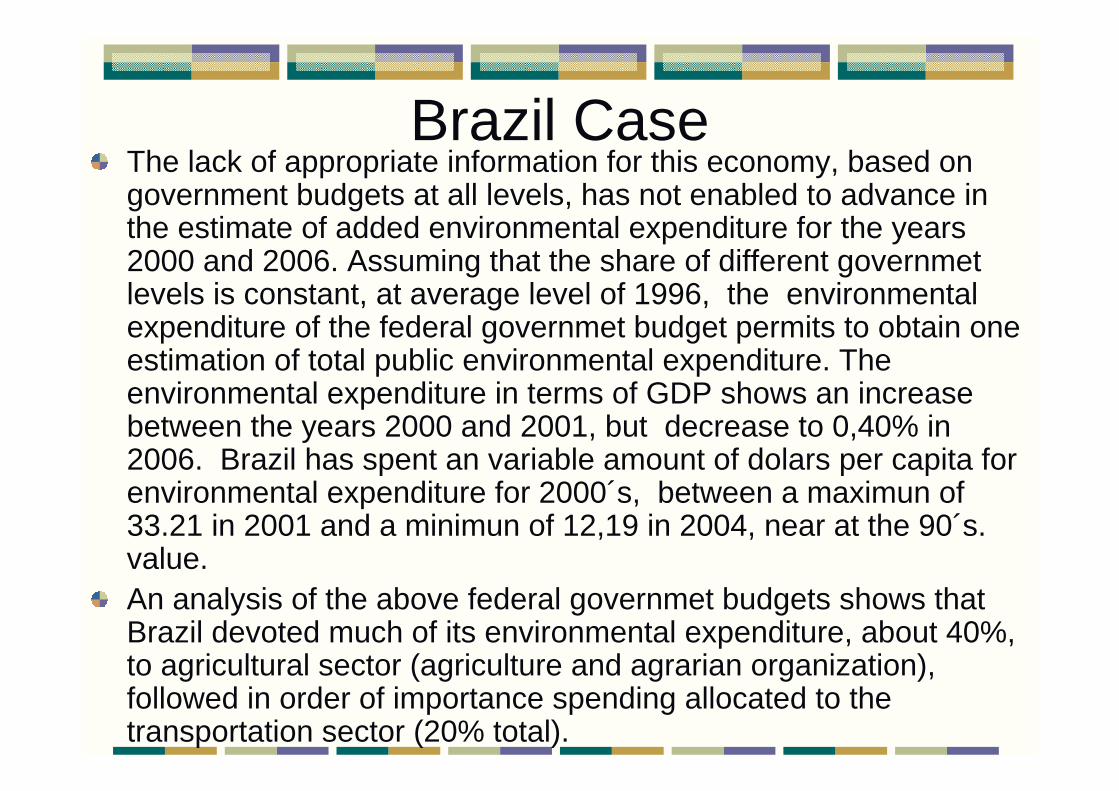
Brazil CaseThe lack of appropriate information for this economy, based ongovernment budgets at all levels, has not enabled to advance in the estimate of added environmental expenditure for the years2000 and 2006. Assuming that the share of different governmetlevels is constant, at average level of 1996, the environmentalexpenditure of the federal governmet budget permits to obtain oneestimation of total public environmental expenditure. The environmental expenditure in terms of GDP shows an increase between the years 2000 and 2001, but decrease to 0,40% in 2006. Brazil has spent an variable amount of dolars per capita for environmental expenditure for 2000´s, between a maximun of 33.21 in 2001 and a minimun of 12,19 in 2004, near at the 90´s. value. An analysis of the above federal governmet budgets shows that Brazil devoted much of its environmental expenditure, about 40%,to agricultural sector (agriculture and agrarian organization), followed in order of importance spending allocated to the transportation sector (20% total).

ARGENTINA. ENVIRONM ENTAL TOTAL PUBLIC EXPENDITURE (*) BY LEVELS OF GOVERNM ENT AND % IN THE GDP -YEARS 1994-2000
Nation Province
(**) M unicipios
(***) Total Year
M ill. $
% s/ Total
M ill. $
% s/ Total
M ill. $
% s/ Total
M ill. $
% s/ Total
%GDP
1994 43 3.28 330 25.72 908 71.00 1281 100 0.50 1995 57 4.56 335 26.82 856 68.61 1248 100 0,48 1996 69 6.01 241 21.01 837 72.97 1147 100 0.42 1997 69 5.57 236 18.92 933 75.50 1237 100 0.42 1998 109 7.74 290 20.18 1017 72.07 1407 100 0,47 1999 94 6.18 437 28.20 1.046 65.61 1521 100 0.53 2000 67 4.68 390 25.99 996 69.32 1431 100 0.51 2001 61 4.65 254 19.36 997 75,99 1312 100 0.49 2002 59 4.95 212 17.78 921 77,26 1192 100 0.38 M ínimo 43 - 212 - 837 - 1147 - 0.38 M áximo 109 - 437 - 1046 - 1521 - 0.53 M edia 70 5.43 318 24.02 946 70.54 1308 100 0.47 (*) Net expenditure on transfers to provinces, municipalities and National Universities. (**) The data for the year 2002 was estimated according to the available data. (***) The figures for the years 1998-2002 were estimated according to the available data. Source: Based on data of Chudnosky, D.; López, A. (2002) and Cetrángolo, O., and Chidiak, M ., Curcio, J., Gutman, V 2004
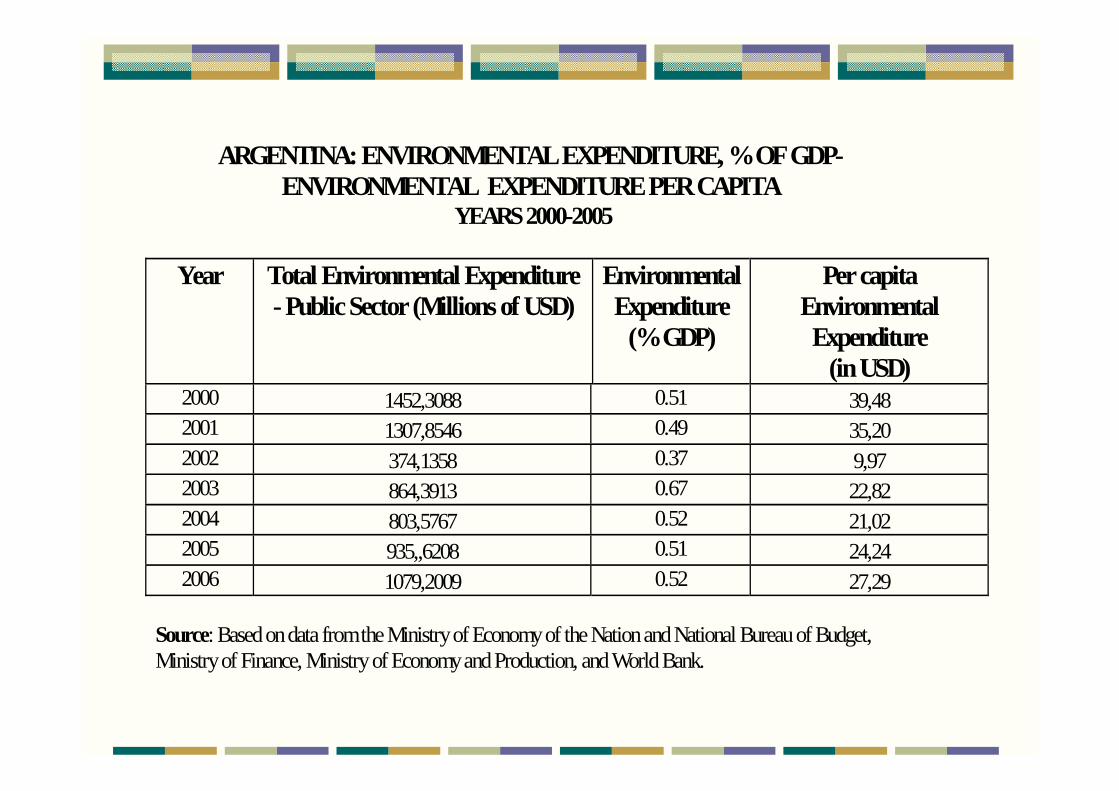
ARGENTINA: ENVIRONMENTAL EXPENDITURE, % OF GDP- ENVIRONMENTAL EXPENDITURE PER CAPITA
YEARS 2000-2005
Year Total Environmental Expenditure - Public Sector (Millions of USD)
Environmental Expenditure
(% GDP)
Per capita Environmental Expenditure
(in USD) 2000 1452,3088 0.51 39,48 2001 1307,8546 0.49 35,20 2002 374,1358 0.37 9,97 2003 864,3913 0.67 22,82 2004 803,5767 0.52 21,02 2005 935,,6208 0.51 24,24 2006 1079,2009 0.52 27,29
Source: Based on data from the Ministry of Economy of the Nation and National Bureau of Budget, Ministry of Finance, Ministry of Economy and Production, and World Bank.

Argentina CaseBased on data from the budgets of the federal
government, applying equally methodologyChudnosky, D. , and López, A. (2002), and assuming that the share of different governmentlevels is constant at the 90´s levels, the series may be extended until the year 2006. It shows that the environmental expenditure, in terms of GDP decreased until the year 2002 at 0,37%, and latter, increase at average value of 90´s (0,50), while, Argentina has spent in emvironmental expenditure per capita between a maximun value in 2000 (40 usd), and a minimun in 2002 (9,97usd). The signifficative difference is deu to the financial crisis of 2001.

Environmental Expenditure per capita.
050
100150200250300350400450
2000 2001 2002 2003 2004 2005 2006
Year
uds/
per c
apita
Germany
Brazil
Argentina

Environmental Expenditure/GDP Años 2000-2006
0
0,2
0,4
0,6
0,8
1
1,2
1,4
2000 2001 2002 2003 2004 2005 2006
Year
%
GermanyBrazilArgentina

Conclusions (I)The methodologies developed to estimate the environmental if it is seen as a starting point for the OECD, tried to broadenthe concept of items which are included. The OECD methodology only consider disbursements resulting in the prevention, control and mitigation of environmental impacts; in the other, is being expanded to include costs arising in environmental protection, working well in calling precautionary effect of the policy environmental.The methodology proposed by Australia appears to be related to the above; it has a very important element from the strictly economic point of view to incorporating a measurement of the efficiency of environmental spending, it pushes the level of analysis and has developed a lot in the estimate of the environmental spending of local governments.

Conclusions (II)
The Latin America´s case does not allow a study to a level of detail similar to that conducted for the EU. However, there are some countries that exhibit improvements in this field are: Argentina, Brazil, Chile, Colombia, Costa Rica, Mexico and Peru.The Germany's public sector shows the major financial efforts directed to pollution abatement and control, with percentages shares GNP's environmental expenditure between 1.2 and 1.4%. However, these figures should be supported by other indicators to understand the importance of the environmental issue presented in this society.

Conclusions (III)The indicators environmental total public expenditure in % of GDP, and environmental total public expenditure per capita in Gemany, Brazil and Argentina shows that while Germany devoted over 1 % of its GDP in all years, Brazil and Argentina have directed around of 0,5% for the same purpose. The diferences between Germany and the two Latin American countries are more evident, in terms of the environmental totalpublic expenditure per capita, while Germany has spent an average of 300 USD per capita, in Brazil and Argentina has been lower than 35 USD per capita. To conclude and, taking into consideration the complexity faced when writing this paper, it should be considered as a first attempt to be enlarged through further reseach in the future

The future researchs
The following research looks for toadvance on the environmental
expenditure of the local governmentsin:
BrazilArgentina