a comparative propulsion system analysis for the …...nasa/tm—2005-213414 1 a comparative...
TRANSCRIPT

Jeffrey J. Berton, William J. Haller, Paul F. Senick, Scott M. Jones, and Jonathan A. SeidelGlenn Research Center, Cleveland, Ohio
A Comparative Propulsion System Analysisfor the High-Speed Civil Transport
NASA/TM—2005-213414
February 2005

The NASA STI Program Office . . . in Profile
Since its founding, NASA has been dedicated tothe advancement of aeronautics and spacescience. The NASA Scientific and TechnicalInformation (STI) Program Office plays a key partin helping NASA maintain this important role.
The NASA STI Program Office is operated byLangley Research Center, the Lead Center forNASA’s scientific and technical information. TheNASA STI Program Office provides access to theNASA STI Database, the largest collection ofaeronautical and space science STI in the world.The Program Office is also NASA’s institutionalmechanism for disseminating the results of itsresearch and development activities. These resultsare published by NASA in the NASA STI ReportSeries, which includes the following report types:
• TECHNICAL PUBLICATION. Reports ofcompleted research or a major significantphase of research that present the results ofNASA programs and include extensive dataor theoretical analysis. Includes compilationsof significant scientific and technical data andinformation deemed to be of continuingreference value. NASA’s counterpart of peer-reviewed formal professional papers buthas less stringent limitations on manuscriptlength and extent of graphic presentations.
• TECHNICAL MEMORANDUM. Scientificand technical findings that are preliminary orof specialized interest, e.g., quick releasereports, working papers, and bibliographiesthat contain minimal annotation. Does notcontain extensive analysis.
• CONTRACTOR REPORT. Scientific andtechnical findings by NASA-sponsoredcontractors and grantees.
• CONFERENCE PUBLICATION. Collectedpapers from scientific and technicalconferences, symposia, seminars, or othermeetings sponsored or cosponsored byNASA.
• SPECIAL PUBLICATION. Scientific,technical, or historical information fromNASA programs, projects, and missions,often concerned with subjects havingsubstantial public interest.
• TECHNICAL TRANSLATION. English-language translations of foreign scientificand technical material pertinent to NASA’smission.
Specialized services that complement the STIProgram Office’s diverse offerings includecreating custom thesauri, building customizeddatabases, organizing and publishing researchresults . . . even providing videos.
For more information about the NASA STIProgram Office, see the following:
• Access the NASA STI Program Home Pageat http://www.sti.nasa.gov
• E-mail your question via the Internet [email protected]
• Fax your question to the NASA AccessHelp Desk at 301–621–0134
• Telephone the NASA Access Help Desk at301–621–0390
• Write to: NASA Access Help Desk NASA Center for AeroSpace Information 7121 Standard Drive Hanover, MD 21076

Jeffrey J. Berton, William J. Haller, Paul F. Senick, Scott M. Jones, and Jonathan A. SeidelGlenn Research Center, Cleveland, Ohio
A Comparative Propulsion System Analysisfor the High-Speed Civil Transport
NASA/TM—2005-213414
February 2005
National Aeronautics andSpace Administration
Glenn Research Center

Available from
NASA Center for Aerospace Information7121 Standard DriveHanover, MD 21076
National Technical Information Service5285 Port Royal RoadSpringfield, VA 22100
This report is a formal draft or workingpaper, intended to solicit comments and
ideas from a technical peer group.
Trade names or manufacturers’ names are used in this report foridentification only. This usage does not constitute an officialendorsement, either expressed or implied, by the National
Aeronautics and Space Administration.
This report contains preliminaryfindings, subject to revision as
analysis proceeds.
Available electronically at http://gltrs.grc.nasa.gov
Document History
This research was originally published internally as HSR007 in October 1995.
Note that at the time of writing, the NASA Lewis Research Centerwas undergoing a name change to the
NASA John H. Glenn Research Center at Lewis Field.Both names may appear in this report.
NASA/TM—2005-213414 1
A Comparative Propulsion System Analysis for the High-Speed Civil Transport
Jeffrey J. Berton, William J. Haller, Paul F. Senick, Scott M. Jones, and Jonathan A. Seidel
National Aeronautics and Space Administration Glenn Research Center Cleveland, Ohio 44135
Abstract
Six of the candidate propulsion systems for the High-Speed Civil Transport are the turbojet, turbine bypass engine, mixed flow turbofan, variable cycle engine, Flade engine, and the inverting flow valve engine. A comparison of these propulsion systems by NASA’s Lewis Research Center, paralleling studies within the aircraft industry, is presented. This report describes the Lewis Aeropropulsion Analysis Office’s contribution to the High-Speed Research Program’s 1993 and 1994 propulsion system selections. A parametric investigation of each propulsion cycle’s primary design variables is analytically performed. Performance, weight, and geometric data are calculated for each engine. The resulting engines are then evaluated on two airframer-derived supersonic commercial aircraft for a 5000 nautical mile, Mach 2.4 cruise design mission. The effects of takeoff noise, cruise emissions, and cycle design rules are examined. (This report was written in 1995 for NASA’s High Speed Research Program.)
Introduction
There is a renewed, worldwide interest in developing an economically viable and environmentally acceptable commercial supersonic transport to begin operations early in the twenty-first century. Several attempts have been made over the last quarter century to develop a U.S. supersonic commercial transport. The Supersonic Transport Program, which ran from the mid-1960s to 1971, focused on establishing an airframe and propulsion system that could compete in the international supersonic transport marketplace. The program was canceled when political support waned in the face of increasing technical, environmental, and economic concerns. From 1972 to 1981, NASA conducted the Supersonic Cruise Research Program. This cooperative government/industry effort investigated areas where advanced technology would produce significant enhancements in supersonic cruise performance. New engine concepts and better jet noise reduction techniques were developed (ref. 1). In 1989, the NASA-sponsored High-Speed Research (HSR) Program was initiated with the objective of providing solutions to the environmental issues associated with a proposed future High-Speed Civil Transport (HSCT). NASA-spon-sored studies involving both airframe and engine manufacturers have determined that an economically viable, environmentally acceptable Mach 2.4 HSCT could enter the market as early as 2005. The HSCT’s potential economic impact is enormous. The findings of Boeing’s 1993 Focus Group indicate that due to increased pro-ductivity, time savings, and passenger preference, the HSCT could capture up to seventy percent of the long-haul markets in cases where it can offer significant time
savings over long-range subsonic aircraft. Boeing’s market research also suggests that sufficient profitability is possible with little or no fare premiums. The problems that plagued the U.S. Supersonic Transport Program are still present today. In addition to difficult economic challenges, there are problems posed by environmental concerns. Namely, the stratospheric propulsion emissions must be minimized such that the HSCT fleet will have no significant effect on the ozone layer, and the propulsion noise must be reduced to meet current Federal Aviation Regulation (FAR) Part 36 Stage 3 noise rules (ref. 2). Indeed, noise regulations of the near future may become even more stringent in the airport vicinity, and additional rules may regulate noise levels many miles from the airport as the aircraft climbs. These economic and environmental requirements pose a signifi-cant propulsion engineering challenge. This study builds upon earlier research performed by the NASA Lewis mission analysis team (refs. 3 and 4). The candidate propulsion systems evaluated here for the HSCT are the turbojet, turbine bypass engine, mixed flow turbofan, variable cycle engine, Flade engine, and the inverting flow valve family of engines (see figs. 1 to 7). The design variables of each of these cycles are paramet-rically varied and the performance and weight data are analytically computed. The resulting engines are then evaluated on two airframer-derived HSCTs for 5000 nautical mile, Mach 2.4 cruise missions. The effects of takeoff noise, cruise emissions, and the addition of alternate missions are also examined. The intent of this study was to provide guidance for the NASA/industry propulsion system downselect team. This team, consisting of representatives from NASA,

NASA/TM—2005-213414 2
General Electric, Pratt & Whitney, Boeing, and McDon-nell Douglas, selected two propulsion system concepts, a prime and a backup, in October, 1993. Additional updated propulsion system evaluations are also presented for the downselect confirmation of April, 1994. Contained in this paper are the NASA Lewis mission analysis team’s recommendations for the selection of these two propulsion system concepts based on our independent engine cycle and mission analysis. The reader who is familiar with the ongoing HSR Program will note that many changes have been made to the HSCT propulsion system concepts since the 1994 downselect confirmation. Even the propulsion system choices themselves would have been made very differ-ently had the results of many studies and component tests been known in 1993. This paper is written to describe the state of affairs as they were known to exist in April, 1994. The reader is asked to consider the data and conclusions in this paper from that point of view.
Method of Analysis
Propulsion System Analysis
Cycle, Aeromechanical, Flowpath, and Weight Analyses The uninstalled performance of each engine is predicted by the NASA Engine Performance Program (refs. 5 and 6). This computer code calculates the unin-stalled performance of each engine based on a steady, one-dimensional, thermodynamic cycle analysis. Off-design engine performance is calculated with the aid of individual component performance maps supplied by the HSR engine manufacturers, General Electric and Pratt & Whitney. The physical and thermodynamic limitations used in this analysis have been identified by NASA and industry as being commensurate with a 2005 entry into service date. An abridged list of these design “ground rules” are shown in tables 1 through 3. The first set of ground rules is used for the initial, 1993, downselect. Due to independent detailed materials study recommendations, the compressor discharge, turbine rotor inlet, and nozzle throat temperature limits became more conservative during the course of the program (see table 1). The effects of these changes have been calculated for the 1994 downselect confirmation and are also presented in this paper. Bare engine weights and dimensions are calculated using an extensively updated version of the Boeing weight and flowpath analysis code described in reference 7. The weight and flowpath design parameters shown in table 2 are used in this analysis. Miscellaneous pod weights (i.e., nacelle, pylon, mounts, firewall, and controls and accessories) are computed using empirical relations for commercial transports (refs. 8, 9, 10, and table 2).
Installation Effects A mixed-compression translating centerbody inlet is used for each of the engine cycles in this study. The performance and aerodynamic characteristics of this inlet are derived from reference 7 and some of its more dominant performance characteristics are plotted in figures 8 to 12. The throttle-dependent, isolated nacelle inlet installation drags consist of pre-entry spillage drag, bypass drag, bleed drag, and cowl lip drag. These installation drags are calculated and are subtracted from the uninstalled net thrust determined from the thermody-namic cycle analysis described above. The inlet’s weight and dimensions are computed by the mission analysis team from a method incorporating empirically-derived actuation system weights and analytically-derived structural weights modeled using the Internally Pressur-ized Structural Synthesis and Optimization code (refs. 8 to 11). The throttle-dependent, isolated nacelle nozzle boattail drags are also subtracted from the uninstalled net thrust. These drags are computed, in part, from inviscid linearized aerodynamic perturbation theory. Inviscid boattail drag coefficients are computed for this study using the program described in reference 12 for both axisymmetric and 2D nozzle exit geometries. To account for the additional viscous drag component, boattail drag coefficients derived from a set of agreed-upon experimen-tal axisymmetric data by NASA Lewis, General Electric, and Pratt & Whitney are used. This viscous drag compo-nent is determined by subtracting the analytically derived inviscid drag from the empirical total drag for each axisymmetric geometry. The viscous drags are then added to the inviscid drags of the 2D geometries, resulting in a total drag database for 2D exit nozzles. For reasons that are explained below, each of the propulsion systems analyzed in this study is assumed to have a 2D nozzle exit. For the valved engines, however, an axisymmetric nozzle may be a superior choice when propulsion-airframe integration effects are considered. These 2D boattail drag coefficients are plotted for various external area ratios in figures 13 to 15. Since these boattail drags are calculated simultane-ously with the nozzle’s thrust, the opportunity is taken to optimize thrust. Specifically, the nozzle is operated in a slightly overexpanded flow configuration. Without considering boattail drag, this would seem to be detrimen-tal due to the pressure drag and possible flow separation near the nozzle exit plane. However, the artificially larger exit area of an overexpanded nozzle reduces the boattail drag by lowering the nozzle’s boattail angle. The exact amount of overexpansion is calculated by optimizing the installed thrust. In the transonic regime, where boattail drags are greatest, this technique can improve the installed gross thrust for some configurations by as much as six percent. This significant thrust improvement can help the

NASA/TM—2005-213414 3
HSCT pass through the transonic regime more quickly and, if it is sized at the transonic drag rise, with poten-tially smaller engines.
Mixer-Ejector Nozzles
High velocity jet noise, which dominates the acoustic signature of the HSCT, can be reduced by ejecting large amounts of ambient air into the primary jet within an acoustically lined duct. The resultant mixed jet has a lower velocity than an unmixed primary jet. The mixed jet generates less shear layer interaction with the ambient air and is quieter than a conventional convergent-divergent nozzle operating under the same conditions. Shock cell noise can be reduced by careful, shock-free, expansion of the jet. Nozzles with these characteristics are called mixer-ejector nozzles, and their use currently appears to be the best approach to suppressing the jet noise of the turbojet, turbine bypass engine, mixed flow turbofan, and the variable cycle engine. In this study, engines that are already inherently quiet (i.e., the Flade and valved engines described below) are not equipped with these nozzles. Other propulsion noise sources, such as fan, turbine, and core noise, do not dominate the acoustic signature and are not specifically calculated in this study. An acoustic margin is used to account for these sources (as described later) to ensure compliance with noise regulations. The weights and dimensions of the mixer-ejector nozzles described here are calculated using a nozzle model created by the Lewis team specifically for this study. This model is database-oriented and draws upon the characteristics of a family of hybrid axisymmetric and 2D mixer-ejector nozzles analytically designed by General Electric. The model assumes that the amount of secondary entrained air that is required to suppress the jet noise to certification levels can be determined from the primary stream conditions. Specifically, this entrained mass flow augmentation is assumed to be a function of the velocity of the primary jet hypothetically expanded through a convergent-divergent nozzle with a velocity coefficient of 0.95. This relationship is shown in figure 16. Since the weight and dimensions of the nozzle are assumed to increase with increasing mass flow augmenta-tion, the curve shown in this figure can therefore be viewed as a nozzle weight and size severity model. The shape of this curve has been calibrated to reflect current estimates of mixer-ejector nozzle weights and dimensions with respect to their suppression requirements. The mixer-ejector nozzle length (fig. 17), maximum nozzle cross-sectional area (fig. 19), and weight (fig. 20) are derived from the database for various nozzle pressure ratios for the 1993 model. These relationships were used for the initial October, 1993 downselect. In January of 1994, the model’s database was updated to reflect General Elec-tric’s decision to remove excessive acoustic liner material
at the nozzle entrance. These changes resulted in shorter, lighter nozzles. The revised nozzle length and weight relationships of the 1994 model are shown in figures 18 and 21, respectively. These relations were used for the April, 1994 downselect confirmation. The nozzle thrust coefficient with the ejectors in their stowed position is also assumed to be a function of the nozzle pressure ratio and is shown in figure 22. The nozzle thrust coefficient with ejectors deployed is assumed to be 0.95 throughout the takeoff segment of the mission. These mixer-ejector nozzle aeroacoustic performance models are considered to be representative and achievable if HSR nozzle develop-ment continues along its present course.
Exhaust Emissions
Nitric oxide (NO) and nitrogen dioxide (NO2), collectively known as NOX, are products of combustion that are known to affect stratospheric ozone. An emission index, defined as the ratio of an emittant’s mass to one thousand times the mass of fuel burned, is computed for NOX for every engine data point of every engine cycle studied. These emission indices, which are a function of Mach number, altitude, and power setting, are integrated over the HSCT’s flight path to give a total mass of NOX produced for the mission. The NOX emission index (EI) is calculated from the following set of relations:
8.3 - T 0.01555 = EI 3
for compressor discharge total temperatures (T3, in degrees Rankine) less than 1100 °R, or
w
w
T
T
P4
P 0.46 -
1000
T 2.899 = EI
toc
4
4toc
toc
43max⎟⎠
⎞⎜⎝
⎛⎟⎠
⎞⎜⎝
⎛
( ) T 0.014611 -T 2.087 + 72.28- exp ff×
for T3 greater than 1100 °R. The subscript “toc” denotes the top-of-climb cycle conditions, T3max is the highest compressor discharge total temperature in degrees Rankine encountered by the engine over the entire mission, P4 is the combustor exit total pressure, T4 is the combustor exit total temperature, w is the combustor airflow, and Tf is the combustor flame total temperature in degrees Rankine, defined as the greater of either 3600 °R or
( ) T - T 1.1765 + T = T 343f
These relations are based on a simplified generic low-emissions HSR combustor model developed jointly by the combustor analysis and design groups at General Electric, Pratt & Whitney, and NASA Lewis.

NASA/TM—2005-213414 4
Turbojet and Turbine Bypass Engines The conventional single-spool turbojet (fig. 1) is evaluated in this study to measure the advantages and disadvantages of the other cycles relative to this classical standard. The single-spool Turbine Bypass Engine (TBE, fig. 2) is similar to the turbojet operating with a fixed-area, choked turbine. The advantage a TBE holds over a turbojet is a bypass valve that routes compressor exit air through a duct around the combustor and turbine. This bypass stream allows the engine to maintain constant corrected turbine airflow throughout the flight envelope without reducing the turbomachinery’s rotational speed. Bypassing this compressor discharge air around the turbine allows cycle pressures, temperatures, and total engine airflow to remain higher than those in a turbojet operating under similar conditions. In addition, this bypass flow helps to maintain high total engine airflow during part-power operation, which reduces both spillage and boattail drags in throttled conditions. The TBE and turbojet are desirable because of their high specific thrust. Due to the turbine bypass flow, however, the subsonic cruise air-handling capabilities make the TBE a better candidate for the HSCT than a turbojet. Unfortunately, both the turbojet’s and the TBE’s high sea level primary jet velocities necessitate the addition of a relatively large noise-suppressing mixer-ejector nozzle to meet takeoff noise regulations. A small, lightweight mixer-ejector nozzle with good aeroacoustic performance is crucial to the success of the TBE. The cycle design parameters investigated for the TBE are the combustor exit temperature, the overall pressure ratio (OPR), and the turbine bypass flow (TBP), ex-pressed as a percentage of the total engine airflow. Values quoted for each of these parameters are always at sea level static (SLS) conditions. During previous studies of the NASA Lewis downselect team (refs. 3 and 4), the OPRs and TBPs investigated for the TBE ranged from 11.0 to 18.5 and from 2.5 to 18.4 percent, respectively. It was discovered that the TBEs resulting in the lowest takeoff gross weight aircraft were those that had the highest allowable OPRs and the lowest TBPs. This is due to the improvement in thrust-specific fuel consumption (TSFC) provided by high OPRs and the improvement in top-of-climb specific thrust provided by low TBPs. Therefore, the TBEs and the turbojet presented here have the highest OPRs allowed by the 1993 maximum compressor discharge temperature limit: 18.5 at T3 = 1710 °R. The TBEs presented here have SLS TBPs of 8.7 percent, which results in no bypass flow at top-of-climb condi-tions. The ranges of SLS combustor exit temperatures and turbine rotor inlet temperatures (T4 and T41, respectively) for the turbojet and TBEs investigated are shown below.
Engine Designation T4 (°R) T41 (°R)
TJ3010 3489 3360 TBE3010 3489 3360 TBE3021 3309 3207 TBE3031 3202 3120 TBE3041 2990 2930
The turbine rotor inlet temperatures are calculated by mass-averaging the core stream and cooling stream enthalpies. Note that the highest temperature cycles, TJ3010 and TBE3010, are T41-limited at 3360 °R for the initial 1993 downselect study. Since the TBE was eliminated in the 1993 downselect (as discussed below), no turbojets or TBEs are presented for the 1994 down-select study’s ground rules (see table 1). Understanding the tradeoffs between the high- and low-temperature cycles is difficult without performing an aircraft mission and sizing analysis (to be discussed below). The high-temperature engines provide higher specific thrust and could likely be sized smaller than the lower temperature engines, but their high primary jet velocities require larger, heavier mixer-ejector nozzles. The low-temperature engines benefit from lower TSFCs, smaller mixer-ejector nozzles, and potentially greater turbine blade life, but they would need to be sized larger to meet mission thrust requirements because of their lower specific thrust. The influence of transonic afterburning is also investigated. These additional afterburning engine data are calculated for flight Mach numbers between 0.90 and 1.40 to provide supplementary thrust throughout the drag rise of the transonic regime. The amount of afterburning is limited by either a 600 °R stream temperature rise or by the maximum allowable mixer-ejector nozzle temperature of 2710 °R, whichever occurs first. The relatively small temperature increase of 600 °R is chosen to reflect the use of a compact, lightweight, limited-performance after-burner. The level of supplementary thrust is a maximum at Mach 1.10, and decreases linearly to zero at Mach numbers 0.90 and 1.40. The additional weight and dimensions of an afterburning duct are considered.
Mixed Flow Turbofan The two-spool Mixed Flow Turbofan (MFTF, fig. 3) has a core bypass stream that rejoins the core flow through a forced mixer downstream of the turbine. Bypassing the engine core results in a loss of specific thrust, but leads to lower TSFCs and jet velocities than a comparable TBE. Depending on the amount of bypass airflow designed in the cycle, these potentially low primary jet velocities make the MFTF an inherently qui-eter engine than the TBE. Its mixer-ejector nozzle is therefore typically required to provide less noise sup-

NASA/TM—2005-213414 5
pression than the TBE’s nozzle. Because of these reduced noise suppression requirements, the MFTF benefits from potentially lower nozzle size, weight, and boattail drag levels. And since the maximum propulsion pod cross sectional area occurs in the nozzle’s ejector region, better nacelle forebody shapes can be designed on a MFTF pod than the TBE’s pod, leading to more favorable airframe integration aerodynamics. The key cycle parameters investigated for the MFTF are the fan pressure ratio (FPR), overall pressure ratio (OPR), mixer secondary-to-primary total pressure ratio, and the temperature throttle ratio (TTR). The TTR is defined as the ratio of the maximum T41 encountered to the SLS design point T41 and is directly related to the airflow lapse of the inlet. Greater inlet airflow lapses lead to lower TTRs. By choosing to vary these four design parameters, the engine bypass ratio (BPR) becomes a dependent variable. A series of MFTFs are examined using the 1993 ground rules. The values of TTR (1.13) and SLS OPR (21.0) are determined by the inlet airflow schedule and the desire to achieve the maximum compressor discharge temperature at the top of the aircraft climb path, respec-tively. Like the TBE, earlier NASA Lewis studies (refs. 3 and 4) determined that the highest OPR allowed by the compressor discharge temperature limit leads to the best cycle performance. These studies also determined that a SLS design point mixer pressure ratio slightly greater than unity is optimal. All of the turbofans evaluated here have a mixer pressure ratio design value of 1.02. Higher values produce supersonic mixing problems. Consequently, the only parameters varied for this particular evaluation are the maximum allowable T41, FPR, and BPR. The follow-ing five cycles are modeled using the maximum T41 allowed by the 1993 ground rules (3360 °R) with SLS FPRs ranging from 3.0 to 4.6. The ranges of SLS FPRs and BPRs of these high-temperature MFTFs using the 1993 ground rules are shown below.
Maximum T41 = 3360 °R
Engine Designation FPR BPR
MFTF1093 3.00 1.20 MFTF2093 3.40 0.83 MFTF3093 3.80 0.55 MFTF4093 4.20 0.35 MFTF5093 4.60 0.18
Another effect investigated is the reduction of the maximum allowable T41. Each of the five MFTFs described above are redesigned for reductions in maxi-mum T41 of 150 and 250 °R. This analysis expands the analytical design envelope of the turbofan. The specific thrust penalty of a low-temperature turbofan can be partially offset by the benefits of reduced specific fuel consumption and jet noise. Engines with lower combustor
temperatures also produce fewer NOX emissions and may potentially have greater hot section life. The same FPR range above is used for this evaluation. The OPR and T3max for these turbofans remains constant at 21.0 and 1710 °R, respectively. By dropping T41 but holding the OPR constant, the engine BPR must decrease to compen-sate. Because of this, an engine with an FPR of 4.6 is not achievable for a T41 of 3110 °R and there are therefore only four turbofans analyzed at that temperature. The ranges of SLS FPRs and BPRs of these low-temperature MFTFs using the 1993 cycle ground rules are shown below.
Maximum T41 = 3210 °R
Engine Designation FPR BPR
MFTF1193 3.00 0.98 MFTF2193 3.40 0.64 MFTF3193 3.80 0.40 MFTF4193 4.20 0.21 MFTF5193 4.60 0.06
Maximum T41 = 3110 °R
Engine Designation FPR BPR
MFTF1293 3.00 0.81 MFTF2293 3.40 0.50 MFTF3293 3.80 0.27 MFTF4293 4.20 0.10
The effect of transonic afterburning is investigated for the 1993 MFTFs. Like the TBE, an afterburner tempera-ture increase of up to 600 °R is permitted between flight Mach numbers 0.90 and 1.40. For the low bypass turbofans, the maximum temperature augmentation must be limited to observe the mixer-ejector nozzle temperature limit. The engines that include thrust augmentation have an additional weight and length increase to account for the augmentor. For the 1994 cycle ground rules, the decrease in maximum allowable T3 and T41 requires the MFTF cycle design process to be repeated. A similar procedure to the one explained above is employed to obtain five new MFTFs. The drop in maximum allowable T3 to 1660 °R forces the cycle OPR from 21.0 to 19.5. As before, five MFTFs are derived with the same FPR range. Since it will be shown that the aircraft noise, mission, and sizing analyses of the reduced combustor temperature 1993 turbofans resulted in poor aircraft performance, no reduced temperature turbofans are investigated using the 1994 ground rules. The ranges of SLS FPRs and BPRs of the MFTFs investigated using the 1994 cycle ground rules are shown below.

NASA/TM—2005-213414 6
Maximum T41 = 3260 °R
Engine Designation FPR BPR
MFTF1094 3.00 1.06 MFTF2094 3.40 0.71 MFTF3094 3.80 0.44 MFTF4094 4.20 0.25 MFTF5094 4.60 0.09
In selecting the optimum MFTF for this application, several factors must be considered. A low bypass, high temperature MFTF has a higher specific thrust than a high bypass, low temperature MFTF and has a smaller installed engine size requirement. The corresponding high takeoff jet velocities produced, however, have greater noise suppression requirements, which lead to a larger mixer-ejector nozzle. The overall thrust benefit of a small capture area may be offset by a large nozzle diameter that could produce unreasonably high boattail drag levels. These nozzles are also heavier than those requiring less suppression. For a given airflow, the low bypass MFTF’s bare engine weight is also higher. This occurs because a greater portion of the engine airflow must pass through the core, requiring larger, heavier turbomachinery compo-nents. Therefore, like the TBE, the trade between the MFTF’s cycle performance, engine and nozzle weight, and installation effects must be derived through the aircraft noise, mission, and sizing analyses.
Variable Cycle Engine
The Variable Cycle Engine (VCE, fig. 4) has been used in various applications since being proposed for the Supersonic Cruise Research Program, the most notable application being a variant used in the U.S. Air Force’s Advanced Tactical Fighter. The VCE is similar to the conventional two-spool MFTF described above with two exceptions. The first is the additional secondary outer bypass duct, which can be used to increase the overall BPR and flow handling capability of the engine. This second bypass stream, at the expense of additional complexity and weight, improves TSFC and improves fan surge control by allowing the fan to pass its maximum amount of air throughout a broader flight regime. This allows greater flexibility in cycle operation at both high flight speeds and part-power operation. The second difference is the presence of a core-driven fan stage (CDFS) placed directly in front of the high-pressure compressor. This stage gives a boost in pressure to both the core and inner bypass flow streams. Unlike the MFTF, the VCE enjoys a nearly constant overall BPR regardless of flight condition because the front fan is allowed to pass only as much airflow as the core-driven fan can handle. Depending on the amount of bypass flow, the VCE is also
a relatively quiet engine whose mixer-ejector nozzle is required to deliver less noise suppression. In previous studies made for the Supersonic Cruise Research Program, the front fan was oversized and the secondary bypass duct was opened during takeoff in an effort to reduce jet noise. Operating the cycle in this manner increased the amount of low-energy bypass flow which reduced the overall exhaust velocity and resulted in a quieter engine. It was determined, however, that this reduction in jet velocity was not great enough to justify the increased size and weight of the front fan. Recent studies performed by the NASA Lewis team and General Electric confirm this conclusion. In the current HSR Program, the VCE’s secondary bypass is only opened at flight speeds in excess of Mach 1.6 to provide fan surge control and to improve TSFC. Designed this way, the VCE produces takeoff and climb exhaust jet velocities comparable to a similar BPR MFTF cycle. Because there is no significant inner bypass growth, the VCE designer is allowed greater latitude in selecting design parameters which would otherwise result in unacceptably high inner bypass and thrust lapse values at top-of-climb conditions. The ranges of the parameters investigated for the VCE are shown below. All values are given at SLS conditions except the outer BPR, which is given at top-of-climb conditions.
Parameter Range
FPR 2.75 - 4.00 OPR 16.8 - 26.7
T4 (°R) 3260 - 3560 Inner BPR 0.15 - 0.80
Top-of-Climb Outer BPR 0 - 0.30 TTR 1.00 - 1.21
CDFS PR 1.10 - 1.38 Like the TBE and MFTF, the VCE’s optimum OPR is determined by the highest T3 allowed by the 1993 ground rules. The high pressure compressor’s pressure ratio is chosen to maximize T3 at top-of-climb conditions. The fan pressure ratio is chosen to achieve a mixing balance of inner bypass and core streams. Due to experience gained from the TBE and MFTF, the VCE uses the highest T4 allowed by the 1993 T41 limit. Inner BPRs greater than 0.8 produce VCEs with too little thrust during climb and are not considered in this study. Outer BPRs are optimized for performance and flow control and are a function of the inner BPR. For inner BPRs less than 0.4, an outer BPR of 0.1 is found to provide the best trade between TSFC reduction and front fan surge margin. For inner BPRs between 0.3 and 0.9, the front fan surge margin requires more flow from the secondary bypass and the outer BPR is increased to 0.2. TTRs between 1.00 and 1.05 lead to VCEs with attractive TSFCs and acceptable thrust throughout the mission. The CDFS pressure ratio is

NASA/TM—2005-213414 7
varied within the bounds and strategies already men-tioned. The four primary 1993 study VCEs are listed below. Each of these cycles have SLS OPR, SLS T4, and TTR values of 22.3, 3560 °R, and 1.00, respectively.
Engine Designation
FPR Inner BPR
Outer BPR
VCE701510 4.00 0.15 0.10 VCE703010 3.52 0.30 0.10 VCE706520 2.96 0.65 0.20 VCE708020 2.75 0.80 0.20
The effect of transonic afterburning is investigated for the VCE. Since the VCE was eliminated in the 1993 downselect (as discussed below), no VCEs are presented for the 1994 downselect ground rules.
Flade Engine
The Fan-on-Blade (Flade) cycle (fig. 5) is a hybrid propulsion system that consists of a core engine sur-rounded by a bypass duct. This bypass duct, or flade stream duct, contains variable inlet guide vanes and a single compression stage created by extending one row of the core engine’s fan blades into the stream. The flade stream is ducted downward to the lower half of the engine where it is exhausted through a variable area nozzle. The flade stream, in addition to lowering the overall primary jet noise, acts as a fluid acoustic shield that partially masks the jet noise perceived by ground observers. One benefit of this nozzle is its reduction of weight and length relative to the mixer-ejector nozzles used with the TBE, MFTF, and VCE cycles. Due to the relatively small nozzle diameter, the maximum cross sectional area of the pod is located near the fan, which results in steep angles in the nacelle forebody region and may create adverse aerodynamic installation effects. The amount of noise suppression achieved from this nozzle is discussed below. Initial versions of the Flade concept contained a VCE as its core engine. After the VCE was eliminated in the initial 1993 propulsion selection (as discussed below), the MFTF became the Flade’s core engine. Only fladed VCEs using the 1993 cycle ground rules are evaluated in this study. The key cycle design parameters investigated for the Flade engine are similar to those of the MFTF and VCE: the FPR, CDFS pressure ratio, TTR, and the mixer secondary-to-primary total pressure ratio. The design value of the flade stage pressure ratio could be varied as well; however, it is held constant for this analysis at 1.8. This is very near the maximum achievable pressure ratio in a single stage at the tip speeds encountered in this application. There has been debate on the merits of flading multiple stages of the fan, which would increase
the low speed thrust of the overall engine. The Flade appears, however, to produce ample thrust in this regime, and such a design is contrary to the flade stream’s purpose of providing low velocity air for the fluid acoustic shield. Like the MFTF, all Flades in this study have the same design mixer pressure ratio. The total design engine airflow for the cycle screening is 900 lb/s, with 650 lb/s entering the VCE and 250 lb/s entering the flade duct. This airflow split is another design parameter that may warrant future investigation. The inner BPR is the dependent variable in this analysis. A series of Flade engines are investigated. Two TTRs, two FPRs, and two CDFS pressure ratios produce a matrix of eight candidate cycles. The major SLS design point parameters of these eight Flades are shown in the following table.
Engine FPR TTR OPR CDFS PR
BPR (VCE)
F193 3.30 1.06 20.5 1.50 0.14 F293 3.00 1.06 20.5 1.50 0.28 F393 3.30 1.06 20.5 1.60 0.05 F493 3.00 1.06 20.5 1.60 0.18 F593 3.30 1.03 21.0 1.50 0.21 F693 3.00 1.03 21.0 1.50 0.37 F793 3.30 1.03 21.0 1.60 0.12 F893 3.00 1.03 21.0 1.60 0.26
The primary jets of the above Flade engines have velocities ranging from 2300 to 2600 ft/s. These jets would produce noise levels well in excess of allowable limits when unattenuated. With the addition of the flade stream’s fluid acoustic shield, however, significant noise reduction is possible.
Inverting Flow Valve Engines The inverting flow valve family of engines consists of turbojets (TJ/IFVs, fig. 6) and turbofans (TF/IFVs, fig. 7) with a valve downstream of the fan or low-pressure compressor that allows for dual-mode cycle operation. During normal, high-speed flight operations, with the outer stream of air ducted around the core, these engines provide the relatively high specific thrust typical of a turbojet or moderate-bypass turbofan. At takeoff, however, the valve is turned to a position that inverts, or switches, the paths of the inner and outer streams through the engine. At the same time, auxiliary inlet doors are opened to provide additional airflow, or flow shift, to the engine core. The bypass stream is either mixed down-stream of the turbine or is allowed to remain separate, and exits through either a single or dual flow conventional convergent-divergent exhaust nozzle, respectively. During takeoff high-flow operations, the resultant nozzle jet velocities become comparable to those of a low-noise,

NASA/TM—2005-213414 8
high-bypass turbofan. All IFV engines in this analysis are designed with maximum dry jet velocities low enough such that no jet noise suppression is required for FAR 36 Stage 3 noise certification. This jet velocity, approxi-mately 1450 ft/s, is determined using the noise analysis tools described below. These valved engines have the advantage of not requiring a heavy, complex, mixer-ejector noise suppression nozzle. This advantage is offset, of course, by the large flow inversion valve that contrib-utes to weight, complexity, and nacelle aerodynamic integration challenges of its own. The original concept for the IFV engine was a single-spool turbine bypass engine with the flow inversion valve located behind the first stage of the high pressure compressor. Previous studies have shown, however, that a twin-spool TBE can have a larger amount of additional airflow than the single-spool TBE can when the flow inversion valve is located behind the low pressure compressor. Since the IFV engines are designed for low nozzle jet velocities at takeoff, a large flow shift is critical to achieving takeoff thrust levels comparable to other cycles. The turbine bypass feature is therefore eliminated in this study because it degrades the full-power perform-ance of a twin-spool turbojet with a flow inversion valve, and its added complexity offsets any potential part-power benefit. The cycle design parameters investigated for the IFV engines are the combustor exit temperature, the overall pressure ratio, the fan or low-pressure compressor pressure ratio, and the amount of additional airflow used at takeoff. In addition, the bypass ratio for the TF/IFV cycles is also investigated. Like the other cycles in this investigation, it was discovered that the IFV cycles resulting in the lowest takeoff gross weight aircraft are those having the highest allowable combustor exit temperatures and the highest allowable OPRs. Thus, all IFV cycles presented here have the highest OPR and T4 allowed by the T3 and T41 limits of the 1993 cycle ground rules: 1710 °R and 3360 °R, respectively. Since the IFV engines were eliminated in the 1993 downselect (as discussed below), no IFV engines are presented for the 1994 downselect study’s ground rules. The relatively poor takeoff thrust of the IFV cycles results in aircraft that are severely field length con-strained. Large thrust loadings and small wing loadings, resulting in heavy aircraft, are required to meet the minimum field length requirement (to be discussed below). Consequently, these IFV cycles are designed for the maximum possible flow augmentation at takeoff subject to other cycle constraints. Due to this flow augmentation, the HPC never operates at corrected speeds greater than 86 percent while in low-flow mode. When in high-flow mode, the flow to the core increases and the HPC corrected speed operates at 100 percent. Even when the flow augmentation and thrust are maximized, severe field length penalties cannot be avoided. Therefore, the
additional thrust gained through ground run afterburning is assumed. Each of the IFV engines has afterburning data calculated for takeoff ground run operations. The aircraft begins its ground run with its afterburners turned on. The added noise of the afterburners during this phase is alleviated by both ground attenuation and engine-by-engine shielding effects. As the aircraft climbs through the second segment of the takeoff, the afterburners are gradually and automatically turned off so that the jet noise over the measurement points is reduced to acceptable levels. It is assumed that future regulations will allow computer-controlled throttling to occur under the minimum 689-foot altitude restriction described in FAR 25 (ref. 13). The afterburners are later activated once again through the transonic drag rise. As with the other engines, the amount of afterburning is limited by either a 600 °R stream temperature rise or by the maximum allowable nozzle temperature of 2710 °R. For the twin-spool turbojet IFV cycles, the range of low pressure compressor pressure ratios is limited. For a TJ/IFV with a mixed exhaust, the LPC pressure ratio can vary between 2.0 and 2.4. Pressure ratios outside this range make a static pressure balance in the mixer unachievable. This range is small enough that varying the pressure ratio has a negligible influence on airplane performance. For a TJ/IFV with separate exhaust streams, the LPC pressure ratio must equal 3.0 for the highest specific thrust while still meeting the noise requirements. The range of fan pressure ratios for the turbofan IFV cycles is similarly limited. For a TF/IFV with a mixed exhaust, both the fan pressure ratio and the bypass ratio become linked. The higher bypass ratios at takeoff needed to meet the noise goals require a low fan pressure ratio to achieve a static pressure balance in the mixer. This mixing requirement also means that there is a minimum low-flow mode bypass ratio that is attainable by this cycle type. This minimum BPR is approximately 0.8. The turbofan IFV with separate exhaust streams, on the other hand, can have any low-flow mode bypass ratio desirable; but, like the separate flow TJ/IFV, the fan pressure ratio for the separate flow TF/IFV must be equal to 3.0. The range of bypass ratios for the IFV engines investigated are shown below.
Engine Designation Low-Flow BPR
High-Flow BPR
AIV222 0.41 2.22 AIV216 0.35 2.16 AIV209 0.29 2.09 AIV202 0.24 2.02 AIV196 0.19 1.96 AIV189 0.14 1.89 AIV181 0.08 1.81 AIV139 0.00 1.39

NASA/TM—2005-213414 9
All of the bypass ratios above are quoted at SLS condi-tions. AIV139 is the only TJ/IFV engine evaluated. The most challenging part of the aeromechanical design of the IFV cycle is the inverting flow valve. Given two concentric flow streams, the IFV flips the inner stream flow to the outer passage and flips the outer stream flow to the inner passage without ever mixing the two streams. In the high-flow mode, when the valve is inverting the flow streams, the high pressure compressor maximum corrected speed is 100 percent. The corrected speed quickly decreases to 85 percent during the transition to the low-flow mode. The transient behavior when converting from high-flow to low-flow mode may cause surging or stalling in either compressor and is one of the critical design issues for IFV engines. Except for the flow inversion valve, the mechanical design of the IFV cycles is similar to the mixed-flow turbofan cycle described above.
Aircraft Analysis
Airframe Design and Sizing The U.S. HSR airframers, Boeing and McDonnell Douglas, provided the NASA Lewis mission analysis team with sufficient information to model each of their proposed HSCTs under a strict, limited distribution agreement. The general arrangements of each of the planforms are shown in figures 23 and 24. The Boeing model 1080-924 HSCT has a double-cranked delta wing which provides relatively good aerodynamic performance at subsonic cruise and low speed takeoff conditions. The McDonnell Douglas model D-3235-2.4-7A HSCT, with its arrow wing, has a configuration designed with emphasis on the optimization of supersonic cruise aerodynamics. A comparison of some of the major design parameters of each company’s HSCT using the 1994 MFTF5000 Lewis turbofan is shown below.
Boeing Douglas
Still-Air Range (nm) 5000 5186 MTOGW (lb) 747800 762800 OEW (lb) 288900 328400 Payload (lb) 64890 61500 Passengers 309 300 Overall Length (ft) 313 334 Wingspan (ft) 136 160 Effective Wing Area (ft2) 7860 10210 SLS Net Thrust (lb) 45400 47900 Aspect Ratio 2.36 2.50 Wing Loading (lb/ft2) 95.2 74.7 Thrust Loading 0.243 0.251 Subsonic L/D 16.1 14.8 Supersonic L/D 8.4 9.0
The aircraft loadings are given at maximum takeoff weight conditions, and the subsonic and supersonic lift/drag ratios are given at the subsonic and supersonic cruise midpoint aircraft weights, respectively. The mission and sizing analyses are performed for each aircraft/engine combination using the Flight Optimization System code (ref. 14). The wing and engine sizes are parametrically varied to obtain minimum gross weight, design point aircraft that satisfy the design mission requirements. As the wing and engine vary in size, the aircraft weights and aerodynamics are systemati-cally altered according to accepted methods applicable to high-speed transport aircraft. The aspect ratio remains constant as the wing area changes. This analysis is graphically typified in so-called aircraft sizing “thumb-prints,” where the effects of various constraining parameters show the required sizes of the engine and wing that result in a minimum gross weight, constrained aircraft. For example, the thumbprint for the 1993 TBE3010 on the Boeing HSCT is shown in figure 25. In this particular case, the vehicle is constrained by the FAR 25 takeoff field length and fuel volume requirements and the engine thrust and wing are sized at 43000 lb and 7935 ft2, respectively. The constrained airplane’s maximum takeoff gross weight is minimized at 744046 lb. In cases where engine and wing sizes can be traded with little or no gross weight penalty, airframers will frequently choose larger wing and smaller engine sizes. This should allow for the less expensive purchase of engines, which are typically priced on a thrust basis, and larger wings often allow for future growth of the airplane. Because of the preliminary nature of this study, no such trades are performed. Aircraft gross weight is the measure of merit assigned to each of the propulsion cycles. Inputs required for the Flight Optimization System program include the engine data (calculated as described previously), airplane dry weight data and scaling relation-ships, airplane aerodynamics and scaling relationships, the mission profile, and airplane constraining details. Each is discussed below. The dry airplane weight scaling relationships are provided by the airframers and are illustrated in figures 26 and 27. The operating empty weight (less the propulsion system weight, which is calculated by the Lewis team as described above) is a function of both the maximum takeoff gross and wing weights. The wing weight, in turn, varies with the wing area and with the propulsion pod weight, both of which change during the sizing process. The changes with respect to pod weight reflect the design requirements of the supporting wing spar. The weight scaling relationships in figures 26 and 27 are presented for the reference pod weights and for a range of wing loadings.

NASA/TM—2005-213414 10
Aerodynamics The aircraft aerodynamics are also provided by the airframers and are shown in figures 28 and 29. These aerodynamics are also a function of Reynolds number, but are accurate as shown in the figure at altitudes along the trajectory. Low-speed aerodynamics are also provided by each airframer for takeoff trajectory calculations. The pods used in Boeing’s and McDonnell Douglas’ aerody-namic calculations are Pratt & Whitney’s STJ989 TBE and General Electric’s D6 Flade engine, respectively. Ideally, these aerodynamics should be scaled with respect to the propulsion pod size and shape. Studies have shown, however (e.g., ref. 15), that if careful consideration is given to the proper nacelle placement, nacelle contours, wing cambering, and wing twist, the overall effect of reasonable pod size and shape variations on the overall airplane aerodynamics can be relatively small. Therefore, in the interest of screening a large number of engine sizes and types in a short time, changes in aerodynamics due to propulsion-airframe integration effects are not considered directly in this study. The throttle-dependent, isolated nacelle installation drags discussed previously, of course, are included in the installed engine data, but the Boeing and McDonnell Douglas nacelle aerodynamics remain unchanged with respect to the original STJ989 and D6 engine pods, respectively. Nevertheless, these propulsion-airframe integration issues are important and are studied in other NASA Lewis in-house efforts (see ref. 16). The study described in this reference shows that incorporating propulsion-airframe integration effects does not affect the propulsion system selections.
Mission Definitions and Constraints The missions suggested by Boeing and McDonnell Douglas are shown in figures 30 through 32. The Boeing design mission (fig. 30) consists of typical taxi-out, takeoff, and climb segments, followed by an over-water, Mach 2.4 climbing cruise segment. A traditional step-cruise profile typical of subsonic aircraft is not used, since air traffic between 55000 and 65000 feet will be light compared to the subsonic fleet’s cruise altitudes. In addition, air traffic control technology will likely be able to handle climbing cruise flight profiles when the HSCT enters service. Typical descent, approach, landing, and taxi-in segments follow, for a still-air range of 5000 nm. A reserve mission, consisting of a six percent of trip fuel contingency allowance, a 260 nm subsonic alternate airport diversion, and a 30-minute hold, is also included. The design mission occurs with the full payload comple-ment of 309 passengers. To prevent sonic boom noise, the regulations of reference 17 prohibit supersonic flight of civil aircraft over U.S. land. For this reason, and for the need to provide a more “typical” HSCT mission for
economic direct operating cost calculations, an off-design, “economic” mission which includes a subsonic cruise leg is also analyzed. This economic mission, shown in figure 31, includes a 600 nm outbound cruise leg at Mach 0.90, has a reduced, 201-passenger complement, and has a reduced range of 3436 nm. Performing the subsonic cruise leg on the outbound side of the supersonic cruise leg requires less fuel and is more optimistic than the reverse, since the airplane is therefore lighter during the remaining climb to supersonic cruise. The McDonnell Douglas design mission (fig. 32) uses a 300-passenger complement and incorporates an overland, Mach 0.95 outbound subsonic leg. Its range is 5000 nm with headwinds, which is equivalent to a still-air distance of 5186 nm. A reserve mission, consisting of a three percent block fuel contingency allowance and a 200 nm subsonic alternate airport diversion, is also included. Climb and descent altitude-Mach number profiles suggested by the airframers are shown in figures 33 and 34. Every airplane sized in this study is constrained to an 11000 foot, 86 °F FAR 25 field length to allow operations out of most of the world’s major airports. The approach velocity is limited to 155 keas. A minimum potential rate of climb constraint is also applied to the entire climb profile. This minimum value is 500 and 1000 ft/min for the Boeing and McDonnell Douglas HSCTs, respectively. Each HSCT’s wing area is also constrained by the amount of available fuel volume for its design mission. The wing area and fuel volume relationships are provided by the manufacturers. In addition to these constraints, each HSCT must also comply with the FAR 36 Stage 3 noise regulations. Although no domestic noise regulations exist for future supersonic commercial aircraft, the FAA has stated its intentions (ref. 18) to restrict these aircraft to FAR 36 Stage 3 noise levels. The takeoff noise constrain-ing process is described below.
Takeoff and Noise Analysis
Operational Procedures
Applying the methods of reference 14, a detailed takeoff analysis is performed for each HSCT using the aircraft physical characteristics and low-speed aerody-namics supplied by the airframers. Since the FAR 36 noise certification field length need not necessarily coincide with the FAR 25 performance field length, this constraint is relaxed from 11000 feet to 12000 feet for noise certification evaluations. The arrangement of the Effective Perceived Noise Level (EPNL) measurement points used in FAR 36 certification is shown in figure 35. Approach power settings are not available and approach noise levels are not calculated. The noise constraining process for each aircraft is determined only by the sideline and community noise levels.

NASA/TM—2005-213414 11
The regulations of reference 2 specify the operational procedures that may be used for takeoff. For a four-engine aircraft, the throttle setting during takeoff must remain constant from the point of brake release until the aircraft reaches an altitude of at least 689 feet. Above this altitude, with all engines operating, the thrust may be reduced to a level that maintains a four percent minimum climb gradient. This standard throttle cutback is designed to reduce the noise perceived by the community observer (see fig. 35). During the ground roll, the throttle may be set at either a part-power setting or at maximum power. Both of these tactics can be used to reduce noise. A simple part-power takeoff reduces noise directly through quieter engine operation. The part-power setting used in this type of takeoff is determined by the thrust necessary to achieve the 12000 foot field requirement using the minimum allowable rotation velocity. A maximum dry power takeoff, although producing more direct engine noise, may indirectly generate lower effective perceived noise levels by delaying rotation until the 12000 foot field limit is reached. This allows the aircraft to build up greater speeds on the runway, achieve a higher climbout velocity, and increase its rate of climb. The EPNLs can be reduced because passage by the sideline and community measurement points occurs at higher altitudes. Further noise reduction for the commu-nity observer occurs when this higher climbout velocity allows the pilot to cutback to a lower power setting. Other, smaller, benefits of a high-speed, delayed rotation takeoff include noise reduction due to reduced aircraft-observer dwell time, reduced frequency of the received noise due to increased Doppler shift, and greater forward-velocity jet noise attenuation (refs. 19 and 20). Note that even an HSCT that is field length con-strained at 11000 feet for performance reasons may take some advantage of part-power or delayed rotation takeoffs due to the extra one thousand feet of available field length used in noise certification. The TBE HSCT shown previously in figure 25 is one example of this. Conversely, aircraft with relatively low specific thrust engines are typically sized to meet climb constraints and therefore may have very short performance field lengths. These aircraft, such as the Boeing HSCT with the MFTF2000, can take much greater advantage of part-power or delayed rotation 12000 foot takeoffs. Further, this engine is already inherently much quieter than its high specific thrust relative, the MFTF5000. When performing advanced takeoff procedures (discussed below), this engine requires very little mixer-ejector nozzle noise suppression at all. Some advanced takeoff procedures are proposed that do not yet strictly conform to current FAA safety and noise certification regulations. One such procedure, called the auto-throttle, or programmed lapse rate (PLR) maneuver, is considered in this study. FAR 36’s require-ment of maintaining a constant throttle setting under the
689 foot altitude limit is thought to be avoidable if computer-controlled throttle scheduling is used. After the 35 foot commercial obstacle is cleared, but before the conventional throttle cutback takes place, the throttle setting is automatically reduced to lessen the sideline noise. The final level and rate of this PLR thrust reduction are considered to be free variables in this study. Their optimization for minimum total EPNL production is discussed below. The level to which the throttle may be reduced is limited by the second- and final-segment climb gradient criteria. It will be shown that the PLR maneuver can greatly reduce the problematic sideline noise levels and considerably lower the amount of overall nozzle noise suppression required. This noise reduction, however, is not without consequences. The PLR throttle reduction adversely affects the aircraft’s rate of climb and forces the aircraft to pass over the community noise measurement point at a lower altitude than it would if a standard takeoff had been performed. For this reason, PLR maneuvers, despite their sideline noise reduction advantages, are in direct conflict with keeping community noise levels low. Since the 2005 subsonic fleet is expected to be, on average, more than 5 EPNdB under current FAR 36 Stage 3 regulations, unfavorable comparisons will undoubtedly be made with the HSCT. Many think that the HSCT should not be designed with a low-suppression nozzle to be used in conjunction with a PLR takeoff. For many propulsion cycles, however, meeting the sideline noise requirement is a serious challenge, and the advantages of a PLR are not easily dismissed. For these reasons, both standard and advanced takeoffs are calculated in this study. Each is described below.
Standard Takeoff
A standard takeoff is defined in this study as one which uses only a fixed, part-power initial throttle setting and a throttle cutback. The fixed, part-power throttle setting is determined by the ground run thrust derate level required to achieve a 12000 foot field length using the minimum rotation velocity. This throttle setting remains constant throughout the ground run, rotation, liftoff, obstacle clearance, and first constant climb segments of the takeoff. A throttle cutback is then performed. Al-though regulations governing four-engine aircraft allow cutbacks at altitudes as low as 689 feet, the cutbacks performed in this study occur at a point 19000 feet downrange from the point of brake release. At this point, depending on the amount of ground run derate, typical Boeing HSCTs are generally at altitudes of about one thousand feet. Even though a late cutback increases sideline noise somewhat (ref. 21), it is used because it improves the rate of climb throughout the second constant climb segment to the benefit of the community noise observer. The trajectory and throttle history of the Boeing TBE3010 HSCT using a standard takeoff is shown in

NASA/TM—2005-213414 12
figure 36. The ground run derate for this configuration is four percent less than SLS maximum dry thrust. The throttle in this case is cut back to 61 percent of maximum dry net thrust at ten percent per second.
Advanced Takeoff
An advanced takeoff is defined in this study as one which uses both part-power derate and delayed rotation ground run tactics and combines them with PLR and throttle cutback maneuvers. The effects of the derated throttle setting and the amount of delayed rotation overspeed must combine to yield no more than a 12000 foot field length. The ground run derate and delayed rotation speed of the TBE3010 Boeing HSCT in figure 36, for example, are three percent less than SLS maximum dry net thrust and 30 percent more than the aircraft stall speed, respectively. The PLR is considered to consist of two free variables: the thrust lapse and the thrust lapse rate. The PLR shown in figure 36, for example, has a lapse rate of two percent per second and lapses to a level of 78 percent of SLS maximum dry net thrust. A throttle cutback to 59 percent thrust at a downrange distance of 19000 feet is performed as before. Note that due to the greater climbout velocity achieved through runway overspeeding, the advanced takeoff method allows a lower, quieter throttle cutback power setting to be used than the standard takeoff method’s setting. Both trajecto-ries are constrained to the four percent second-segment climb gradient requirement. These values of derate, delayed rotation overspeed, and thrust lapse and lapse rate above are the optimum values for minimum noise production of the TBE3010 Boeing HSCT. The actual amounts of ground run derate and overspeed, though linked through the field length requirement, are systemati-cally varied and numerically optimized along with the PLR’s two lapse variables to yield minimum overall noise production as described below.
Noise Evaluation
The takeoff trajectory, aircraft orientation, primary jet properties, and throttle history data for each HSCT are passed to the noise analysis portion of the mission analysis code derived from reference 22. Jet noise is calculated for each propulsion system using the Motsinger-Sieckman single-stream convergent jet noise model (ref. 23). This jet noise model, which is incorpo-rated into the mission analysis code specifically for this study, is chosen for its accuracy in predicting high pressure ratio jet noise. The jet noise is corrected for spherical spreading, atmospheric attenuation (ref. 24), extra ground attenuation (ref. 25), and shielding effects (ref. 22). The resulting tone-weighted perceived noise level (PNLT) time traces for the TBE Boeing HSCT trajectories of figure 36 are shown in figure 37. Note that
the theoretically continuous sideline is approximated by an array of observers at discrete intervals of one thousand feet along the sideline. These noise levels are numerically integrated on a logarithmic basis with respect to time to yield the EPNLs at the noise measurement points. The greatest of these sideline EPNLs is the sideline noise defined by FAR 36. Note that the sideline noise for the TBE HSCT occurs at the ninth sideline observer location for both the standard and advanced takeoff profiles. The PNLT trace at this position is integrated with respect to time to yield sideline EPNLs of 119.3 and 116.1 EPNdB for the standard and advanced profiles, respectively. The community EPNLs are coincidentally identical at 118.9 EPNdB. The overall results for the TBE profiles shown in figure 37 are summarized in tables 4 and 5. Note that the gross weight-dependent FAR 36 Stage 3 rule is slightly different due to the difference in weight between the two aircraft. Optimization of the advanced takeoff profile for minimum sideline and community EPNLs is conducted using the individual procedures discussed above. The ground roll derate, thrust lapse, and thrust lapse rate are parametrically varied by a Hooke and Jeeves optimization algorithm modified with a gradient search correction. The level of delayed rotation used in each optimization iteration is determined by the amount of throttle derate used and the 12000 foot field requirement. The sideline and community EPNL exceedance levels relative to the rule for the TBE Boeing HSCT are graphically shown in figures 38 and 39, respectively. A ground run derate of three percent is pictured. It can be seen from figure 38 that the more severe PLR maneuvers greatly reduce the sideline noise. The community noise levels of figure 39, however, are adversely affected by these same PLR maneuvers. An overall required suppression level, defined as the maximum of either sideline or community EPNLs, is therefore the object function necessary for optimization with respect to FAR 36. This parameter, shown in figure 40, graphically illustrates the tradeoff of the PLR maneuver with respect to the two noise measurements. Overlaid on the object function is the optimization path computed by the modified Hooke and Jeeves algorithm. The trajectory defined by the final, optimized values of derate, delayed rotation, and PLR is checked to ensure that the minimum climb gradients required by the regulations of reference 2 are not violated. Since jet noise is the only noise source calculated in this study, an additional two decibels are added to each aircraft’s nozzle noise suppression requirement to account for propulsion noise sources other than the jet and to provide a noise sizing assurance margin for each airplane. The jet noise suppression requirements for the TBE of tables 4 and 5, for example, are 18.9 and 15.8 dB for the standard and advanced takeoff profiles, respectively. For aircraft with engines equipped with mixer-ejector nozzles, subsequent sizing iterations are necessary and are

NASA/TM—2005-213414 13
calculated using the results of each previous noise calculation. This iteration process is illustrated in figure 41. For each iteration, aircraft sizing thumbprints are prepared using engine and aircraft data, a perform-ance-constrained aircraft is designed, and detailed takeoff and noise analyses are performed. Since the nozzle mass flow augmentation used for the first iteration is based on the primary stream’s maximum dry jet velocity (via fig. 16), the amount of noise suppression the mixer-ejector nozzle provides is always too great for takeoffs using noise abatement procedures with lower jet velocities. Ideally, a specific mass flow augmentation value for each engine is required that is commensurate with suppressing the amount of noise generated. The iteration on flow augmentation is considered necessary. Using an augmen-tation that is too low would violate noise requirements, while using an augmentation that is too high would unnecessarily penalize the aircraft with excessive nozzle weight, boattail drag, and more complex airframe integration problems. This ideal mass flow augmentation is derived iteratively using the mixer-ejector severity model relationship to the primary jet velocity shown in figure 16. This primary jet velocity, in turn, is derived analytically from the sideline EPNL-jet velocity relation-ship determined by the jet noise analysis of reference 23. Convergence, thankfully, is quick: no more than three sizing iterations are typically required before the appro-priate amount of mass flow augmentation and noise suppression is achieved. Note that after the first iteration, the primary jet velocity used for the nozzle model calculations is no longer the actual, physical primary jet velocity, but is rather an “effective,” or “average” primary jet velocity whose magnitude is that which generates the EPNLs calculated at the noise measurement points. The tacit assumption in this method is that the mixer-ejector nozzle’s assumed noise suppression capability is inde-pendent of the primary jet velocity’s variations with throttle setting. This assumption is borne out in many recent nozzle acoustic tests, but as the design of mixer-ejector nozzles becomes more finely calibrated to primary stream conditions, this assumption may ultimately prove to be flawed. Ideally, in addition to mass flow augmenta-tion, the nozzle noise suppression’s dependency on throttle setting should be included. Such information, however, is not available at the time of this writing.
Flade Engine Considerations
The Flade-engined HSCTs’ unique noise sizing process is illustrated in figure 42. Unlike the mixer-ejector nozzles, whose noise suppression ability is an adjustable variable depending on the amount of flow augmentation assumed, the Flade nozzle is assumed to be capable of delivering a fixed, limited amount of suppression. This level of suppression, shown in figure 43, is based on General Electric’s studies and is assumed to be a function
of the mixed jet velocity of the flade and primary streams. Flade-engined HSCTs have a distinct disadvantage relative to HSCTs with mixer-ejector nozzles. If the amount of flade suppression is not adequate to suppress the noise to acceptable levels, the entire Flade engine must be sized larger than that required by simple perform-ance requirements. These oversized engines are then throttled to a greater degree during takeoff to reduce the EPNLs. The iteration on engine size proceeds by following the locus of minimum gross weight increases with respect to increasing engine size until FAR 36 is satisfied. This will be shown to be an inefficient method to reduce noise. In general, with mixer-ejector nozzle weights and dimensions determined by the model illustrated in figures 17 through 21, the ability to design the level of noise suppression into the airplane through the nozzle is always preferable to reducing the noise through oversizing the engines. Indeed, as shown below, the increased propulsion weights and corresponding increased gross weights of Flade HSCTs due to oversized engines make all but one of the Flade HSCTs unreasonably heavy.
Results and Discussion
Results for each of the propulsion systems evaluated are presented in tables 6 through 46. The maximum takeoff gross weight results for the 1993 turbojet and TBE Boeing HSCTs are shown in figures 44 and 45. Note that for the TBE, there is virtually no gross weight penalty in reducing the design combustor exit temperature from the maximum 3489 °R (TBE3010) to 3309 °R (TBE3021). The cooler TBE’s specific thrust penalty is offset by its lower specific fuel consumption rates and its smaller, lighter, mixer-ejector nozzle. At design combustor temperatures less than 3309 °R, however, the airplane requires increasingly larger engines to satisfy its thrust requirements and the gross weight begins to increase. The dramatic effect of the advanced takeoff procedure on the noise suppression requirement can be seen in figure 45. The nozzle noise suppression requirement for the TBE3010 Boeing HSCT, for example, can be reduced from 18.9 to 15.8 dB by employing the advanced takeoff procedures described above. The mixer-ejector flow augmentation requirement, which falls from 126 to 74 percent, results in an aircraft gross weight reduction of 15000 pounds. The benefits of a PLR advanced takeoff for the TBE are clear. The influence of the design combustor exit temperature on noise production is dramatic as well. The noise suppres-sion requirement drops 1.5 and 3.4 dB over the temperature range investigated for the standard and advanced takeoff procedures, respectively. The increased fuel flow and added weight of the afterburners adversely affects the transonic afterburning TBEs. Gross weight penalties of about 4000 pounds due

NASA/TM—2005-213414 14
to transonic afterburning can be seen in figures 44 and 45. Even the lower temperature, lower specific thrust TBEs have sufficient thrust to climb through the transonic drag rise without the aid of an afterburner. The benefit of the turbine bypass feature is clear. The reference turbojets shown in figure 44 have gross weights over 30000 pounds more than the corresponding TBEs. Interestingly, however, due to their considerably poorer SLS thrust, the high-temperature turbojets shown in figure 45 require much less noise suppression than the high-temperature TBEs. The maximum takeoff gross weight results for the 1993 and 1994 MFTFs are shown in figures 46 through 53. The influence of bypass ratio and maximum allowed T41 for the 1993 MFTFs using the Boeing HSCT is shown for both standard and advanced takeoff proce-dures in figures 46 and 47. Minimum gross weight aircraft are achieved in this study by designing the highest temperature and lowest bypass turbofans possible. A mixer-ejector weight model that more conservatively penalizes large mass flow nozzles, however, can easily force the gross weight minimum towards somewhat larger bypass ratios. Optimum bypass ratio selection is also heavily affected by boattail drag models, mission requirements, and airplane characteristics. The noise impact of these 1993 MFTFs is shown in figure 48. Note that for the Boeing HSCT, the best 1993 turbofan (MFTF5093) enjoys 23000 pound gross weight and 1.9 dB noise suppression advantages over the best 1993 TBE. Unlike the TBEs, the lower specific thrust MFTFs generally have more difficulty climbing through the higher drag of the transonic regime. It is therefore possible for the MFTFs to benefit from transonic afterburning while the TBEs do not. The increasing gross weight benefit of transonic afterburning with increasing bypass ratio for the 1993 turbofans using the Boeing HSCT is shown in figure 49. The influence of the more conservative 1994 cycle ground rules on the MFTF is shown in figure 50. The 4.6 fan pressure ratio MFTF carries more than a 25000 pound gross weight penalty due to the lower maximum allowable T3 and T41 requirements (see table 1). The results of airplane selection on the 1994 turbofans are shown in figures 51 through 53. Although the aerodynamics, empty weights, scaling models, constraining requirements, and design mission profiles of the Boeing and McDonnell Douglas HSCTs differ, their calculated gross weights are remarkably similar. The McDonnell Douglas HSCT has lower gross weights than the Boeing HSCT when designed with the higher bypass MFTFs (figs. 51 and 52). This is primarily due to the presence of the subsonic cruise leg in the McDonnell Douglas design mission. The airplane is able to take better advantage of the higher bypass turbofans’ good subsonic performance. The advantages of good low-speed aerody-
namics can be seen in figure 53. The Boeing HSCT, with its superior lift-drag ratio over a greater range of angle of attack, is able to take better advantage of advanced takeoff procedures than the McDonnell Douglas HSCT. The noise suppression requirement for the MFTF5094 HSCTs using a standard takeoff profile is identical at 18.8 dB. In an advanced takeoff, however, a much more effective PLR can be implemented with Boeing’s better low-speed aerodynamics. This results in a 1.6 dB reduction in the nozzle suppression requirement for the MFTF5094 Boeing HSCT. The maximum takeoff gross weight results for the 1993 VCE Boeing HSCTs are shown in figures 54 and 55. Like the turbofans, the lowest inner bypass VCE produces the lowest gross weight aircraft. Unlike the MFTF, however, the better transonic air-handling qualities of the VCE negate any benefit of transonic afterburning. Even at the relatively high inner bypass ratio of 0.80, a level at which the turbofan profits from transonic afterburning, the additional weight and fuel expenditure of the afterburner reverses any advantage of afterburning for the VCE. Note that the gross weight of the VCE701510 HSCT is nearly identical to the weight of the low bypass MFTF5093 HSCT. Although capable of slightly better performance than the turbofan, the VCE has a larger propulsion pod weight that results in 1.5 and 1.2 percent gross weight penalties for the standard and advanced takeoff procedures, respectively. Each of the eight 1993 Flade engines are initially analyzed from a simple performance standpoint using the Boeing HSCT without a noise analysis. The special noise constraining analysis for the Flade cycles described above is then performed. This noise analysis is applied to the Flade HSCTs in order of increasing gross weight until a minimum gross weight noise-constrained airplane is found. Due to the limited noise suppression capabilities of the unique fluid acoustic shield Flade nozzle, however (see fig. 43), not all of the Flade cycles can meet the FAR 36 Stage 3 noise requirements. The F393 and F793 Flade HSCTs, for example, have the lowest gross weights without a noise constraint, but are unable to meet the noise requirements without incurring excessive engine oversizing gross weight penalties. The F193 HSCT, although ranked third in gross weight for Flades without noise constraints, has the lowest noise-constrained gross weight of all eight Flade cycles considered. This perform-ance is achieved by implementing an advanced takeoff procedure with PLR, delayed rotation, and ten percent engine oversizing. This analysis results in a 748373 lb aircraft that is 6.1 percent heavier than the 1993 MFTF5093 Boeing HSCT using advanced takeoff procedures. Due to the tedium involved in the noise analysis process, the remaining five heavier Flade HSCTs remain unconstrained with respect to the noise require-ment. None of the Flade engines are analyzed using the

NASA/TM—2005-213414 15
1994 cycle ground rules, transonic afterburning, or the McDonnell Douglas airplane. The maximum takeoff gross weight results for the 1993 IFV Boeing HSCTs are shown in figure 56. Like the other cycles evaluated in this study, the highest specific thrust TF/IFV results in the lowest gross weight aircraft. The AIV181 Boeing HSCT has a gross weight of 728173 lb, which is 3.2 percent greater than the 1993 MFTF5093 Boeing HSCT using advanced takeoff procedures, and only one percent greater than the MFTF5093 Boeing HSCT using a standard takeoff. The TJ/IFV HSCT, due to its reduced versatility relative to the TF/IFV HSCTs, has a 19 percent higher gross weight than the AIV181 HSCT. None of the IFV engines are analyzed using the 1994 cycle ground rules or the McDonnell Douglas airplane. A maximum takeoff gross weight, design mission block fuel weight, and economic mission block fuel weight comparison is shown in figure 57 for the best of each of the 1993 cycles evaluated on the Boeing HSCT using advanced takeoff procedures. Note that the cycle ranking is similar regardless of which weight measure of merit is chosen. The low bypass MFTF5093 HSCT is the lowest weight aircraft and has the best fuel economy of the group. A similar weight comparison for aircraft using standard takeoff procedures is shown in figure 58. The Flade and IFV HSCTs, which exclusively use only advanced takeoff procedures as explained above, are not represented in the figure. Emissions comparisons of the same engines are shown in figures 59 and 60. The emission indices shown are taken at the mid-weight supersonic cruise point of the Boeing HSCT design mission. A new emissions parameter called specific NOX is introduced. Defined as the amount of cruise NOX generated per passenger mile, it delineates the effect of both aircraft fuel consumption performance and payload-carrying capabilities. Using the generic HSR combustor emissions model described previously, cruise emission indices ranging from 6.7 to 8.5 lb/klb are indicated for the HSCTs using advanced takeoff proce-dures. These indices are greater than the HSR combustor emission index goal of 5 lb/klb. A fleet of 600 HSCTs with combustors operating at the emissions goal perform-ance levels will likely have little or no effect on the steady-state amount of atmospheric ozone (ref. 26). One method of reducing these emission indices to the goal value is to reduce the design T4 of the cycles. A gross weight and emissions sensitivity of the 1993 TBEs and MFTFs across the temperature range investigated is shown in figure 61. Note that for a given temperature reduction, the MFTF is able to reduce cruise emissions much more effectively than the TBE. Another method of reducing these emission indices comes as a natural consequence of adopting the newer, more conservative, 1994 cycle ground rules. These ground rules, which reduce both T4 and T3, lower the supercruise emission
index of the 4.6 FPR MFTF from 8.2 lb/klb to the near-goal performance value of 5.7 lb/klb.
Concluding Remarks
Although maximum gross weight, fuel burned, noise, and emissions data are very important in selecting the primary and secondary propulsion systems, other effects that are not directly evaluated in this study must also be considered. Engine cost, operating life, reliability, maintainability, manufacturing complexity, versatility, risk, operating cost, and airframe integration considera-tions all contribute to the downselect process. Many of these issues are addressed in various NASA-sponsored studies throughout industry. For example, the use of afterburning is rejected by the NASA/industry propulsion downselect team due to its high temperature material requirements and impact on component life. This decision is made despite studies that indicate modest performance benefits in some low specific thrust applications. The valved engine HSCTs, which require afterburning thrust performance during the takeoff ground run to shorten their exceptionally long field lengths, are severely penalized by the lack of afterburners. Afterburning jet noise produced during the ground run and transient performance during valve clocking movements are also concerns. Although capable of respectable performance (see e.g., fig. 57), the afterburning issue, combined with their somewhat unconventional design and element of risk, effectively eliminates the IFV engines from contention. Added complexity is also an undesirable characteris-tic. Although the VCE is capable of good performance, its additional aeromechanical requirements are difficult to justify for an HSCT application. Although the VCE’s thrust and fuel consumption performance is slightly better than the MFTF’s, it is the VCE’s additional engine weight that contributes to its overall heavier aircraft weight. For these reasons, the VCE is dropped from the competition. Interestingly, unlike the IFV and VCE, the TBE is the only cycle analyzed here that is eliminated from consid-eration by using aircraft sizing and noise data alone. This conclusion was established using these criteria as early as 1991 (ref. 3). Although the TBE is the simplest of the concepts considered, the MFTF is only slightly more complex and holds a three percent gross weight advantage over the TBE. Due to the difficulty involved in suppress-ing the noise of its high pressure primary flow stream, the TBE also has a poor ability to cope with the possible introduction of more restrictive future noise regulations. The primary propulsion concept selected by the NASA/industry propulsion team for further study is the MFTF. Its good performance, resulting in low aircraft weights, and low risk and complexity lead to the best direct operating costs of any propulsion system consid-ered to date. And since its design bypass ratio can be

NASA/TM—2005-213414 16
varied, its performance can be adjusted somewhat to more effectively match both mixer-ejector nozzle and aircraft design requirements. The secondary propulsion concept selected is the Flade engine with a fluid acoustic shield nozzle. The Flade cycle represents a reasonable balance of design compromises and pursues distinctly different technologies than the mixer-ejector propulsion systems. Should the mixer-ejector design of the MFTF provide insufficient noise suppression, the Flade cycle provides an alternative technology path to follow. Continued studies of both of these engines, as well as other concepts, are needed to secure our stake in the revolutionary supersonic aircraft of the future.
References 1. Fishbach, L.; Stitt, L.; Stone, J.; and Whitlow, Jr., J.:
NASA Research in Supersonic Propulsion - A Dec-ade of Progress. NASA TM 82862, 1982.
2. Noise Standards: Aircraft Type and Airworthiness Certification. FAR, Part 36, Federal Aviation Ad-ministration, 1974. (Consolidated Reprint Aug. 12, 1985.)
3. Seidel, J.; Haller, W.; and Berton, J.: Comparison of Turbine Bypass and Mixed Flow Turbofan Engines for a High-Speed Civil Transport. AIAA Aircraft Design Systems and Operations Meeting, AIAA 91-3132, 1991.
4. Berton, J.; Haller, W.; Seidel, J.; and Senick, P.: A NASA Lewis Comparative Propulsion System As-sessment for the High-Speed Civil Transport. First Annual High-Speed Research Workshop, NASA Conference Publication 10087, Part II, 1991.
5. Plencner, R.; and Snyder, C.: The Navy/NASA Engine Program (NNEP89) - A User’s Manual. NASA TM 105186, 1991.
6. Klann, J.; and Snyder, C.: NEPP Programmer’s Manual (NASA Engine Performance Program), Vol-umes I and II. NASA TM 106575, 1994.
7. Onat, E.; and Klees, G.: A Method to Estimate Weight and Dimensions of Large and Small Gas Turbine Engines. NASA CR 159481, 1979.
8. Kowalski, E.; and Atkins, Jr., R.: A Computer Code for Estimating Installed Performance of Aircraft Gas Turbine Engines, Volumes I, II, and III. NASA CRs 159691, 159692, and 159693, 1979.
9. Los Angeles Aircraft Division of Rockwell Interna-tional Corporation: Methods for Comparative Evaluations of Propulsion System Designs for Super-sonic Aircraft. NASA CR 135110, 1976.
10. Schmidt, A.: Preliminary Weight Estimation of Engine Section Structure. SAWE Paper No. 1311, Index Category No. 23, 1979.
11. Moses, P.; and Jones, S.: Internally Pressurized Structural Synthesis and Optimization Code. Docu-mentation, first updated release: April 24, 1987, NASA LaRC.
12. Craidon, C.: User’s Guide for a Computer Program for Calculating the Zero-Lift Wave Drag of Complex Aircraft Configurations. NASA TM 85670, 1983.
13. Airworthiness Standards, Transport Category Airplanes. FAR, Part 25, Federal Aviation Admini-stration, March, 1984.
14. McCullers, L.: Aircraft Configuration Optimization Including Optimized Flight Profiles. Proceedings of the Symposium on Recent Experiences in Multidisci-plinary Analysis and Optimization, NASA CP 2327, April 1984.
15. Barnhart, P.: A Supersonic Through Flow Fan Engine Airframe Integration Study. NASA CR 185140, 1989.
16. Baumgarten, W.: Propulsion / Airframe Aerodynamic Integration Effects for a Mach 2.4 High-Speed Civil Transport. Limited Distribution NASA TM 106673, 1995. Date for general release: July, 1999.
17. General Operating and Flight Rules. FAR, Part 91, Federal Aviation Administration, 1974. (Consoli-dated Reprint with changes 1 through 67 as of May 1, 1986.)
18. Civil Supersonic Aircraft Noise Type Certification Standards and Operating Rules; Notice of Proposed Rulemaking. Federal Register vol. 55, no. 104, May 30, 1990.
19. Stone, J.: Interim Prediction Method for Jet Noise. NASA TMX-71618, 1975.
20. Stone, J.; Groesbeck, D.; and Zola, C.: An Improved Prediction Method for Noise Generated by Conven-tional Profile Coaxial Jets. NASA TM 82712, AIAA-81-1991, 1981.
21. Olson, E.: Advanced Takeoff Procedures for High-Speed Civil Transport Community Noise Reduction. SAE Paper No. 921939, 1992.
22. Clark, B.: A Computer Program to Predict Aircraft Noise Levels. NASA TP 1913, 1981.
23. Gliebe, P.; Motsinger, R.; and Sieckman, A.: High Velocity Jet Noise Source Location and Reduction, Task 3 - Experimental Investigation of Suppression Principles. Report No. FAA RD 76-79, III-I (R78AEG27), 1978.
24. Standard Values of Atmospheric Absorption as a Function of Temperature and Humidity. Aerospace Recommended Practice 866, 1964, SAE.
25. Method for Calculating the Attenuation of Aircraft Ground to Ground Noise Propagation during Takeoff and Landing. Aerospace Information Report 923, Aug. 15, 1966, SAE.
26. Shaw, R.; Gilkey, S.; and Hines, R.: Engine Technol-ogy Challenges for a 21st Century High-Speed Civil Transport. NASA TM 106216, 1993.

NASA/TM—2005-213414 17
Appendix: Nomenclature
Symbol Description
A9
A10
AC
AO
AOi
AB
AN2
AR
BPR
CD
CDFS
CDSP
CDβ
CET
CM
CV
C&A
Dmax
E
EI
ESAD
FG
FN
HPC
HPT
ISA
IFV
keas
Lbare
L/D
L/H
Nozzle exit area
Maximum propulsion pod cross-sectional area
Inlet capture area
Inlet streamtube area
Inlet streamtube area plus bleed area
Afterburning
Blade root centrifugal stress parameter
Blade aspect ratio
Bypass Ratio
Convergent-Divergent (Laval) nozzle
Core-Driven Fan Stage
Inlet spillage drag coefficient
Nozzle boattail drag coefficient
Combustor Exit Temperature
Mixer momentum coefficient
Nozzle velocity coefficient
Controls and Accessories
Maximum propulsion pod diameter
Mixer effectiveness
Emissions Index
Equivalent Still Air Distance
Gross Thrust
Net Thrust
High Pressure Compressor
High Pressure Turbine
International Standard Atmosphere
Inverting Flow Valve
equivalent airspeed in knots
Bare engine length
Lift/Drag ratio
Length/height ratio

NASA/TM—2005-213414 18
Symbol Description
LHV
LPC
LPT
M∞
ME
MFA
MFTF
MTOGW
Nbl
NPR
PAX
PR
PROC
RF
Rh/Rt
S
SLS
tr
T3
T4
T41
T8
TBE
TJ
TO
TOGW
TSFC
Utip
Utip corr
Vcomb
VJP
VABI
Fuel Lower Heating Value
Low Pressure Compressor
Low Pressure Turbine
Freestream Mach number
Mixer-Ejector nozzle
Mixer-Ejector nozzle Mass Flow Augmentation
Mixed Flow Turbofan
Maximum Takeoff Gross Weight
Number of blades
Nozzle Pressure Ratio
Passengers
Pressure Ratio
Potential Rate of Climb
Range Factor
Hub-to-tip ratio
Effective wing reference area
Sea Level Static
Combustor residence time
Compressor exit total temperature
Combustor exit total temperature
Turbine rotor inlet total temperature
Nozzle throat total temperature
Turbine Bypass Engine
Turbojet
Takeoff
Takeoff Gross Weight
Thrust Specific Fuel Consumption
Blade tip velocity
Corrected blade tip velocity
Combustor throughflow velocity
Hypothetically expanded primary jet velocity
Variable Area Bypass Injector
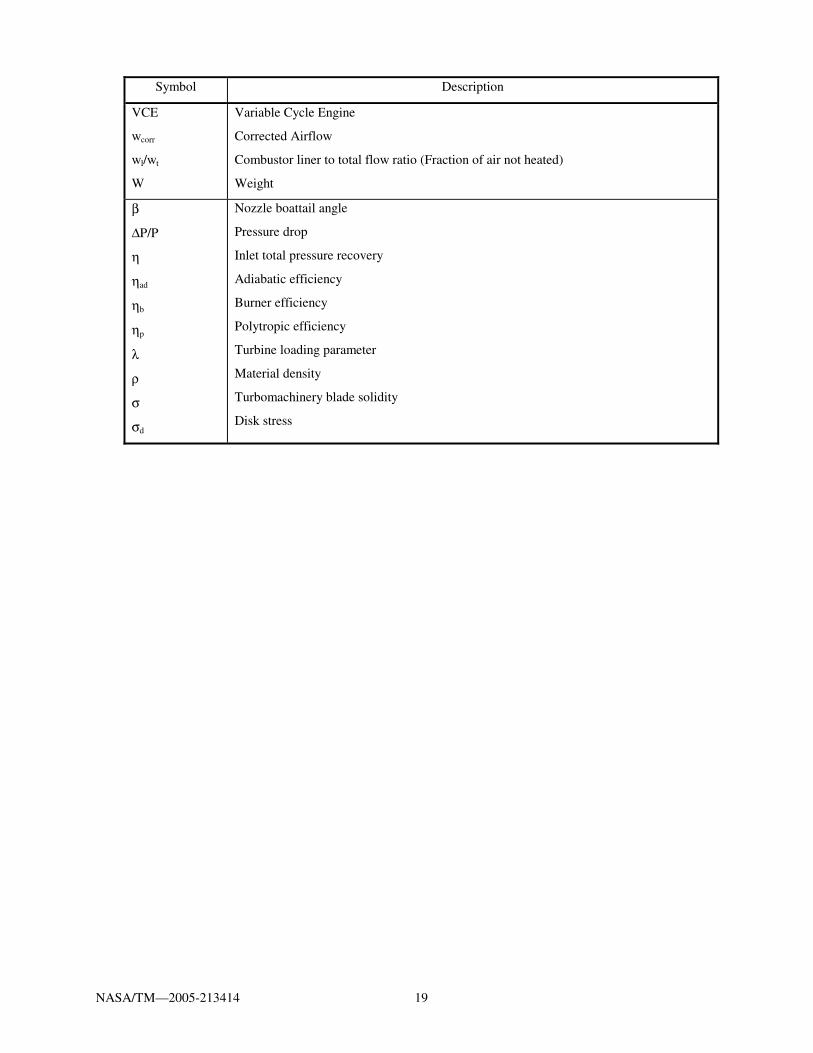
NASA/TM—2005-213414 19
Symbol Description
VCE
wcorr
wl/wt
W
Variable Cycle Engine
Corrected Airflow
Combustor liner to total flow ratio (Fraction of air not heated)
Weight
β
∆P/P
η
ηad
ηb
ηp
λ
ρ
σ
σd
Nozzle boattail angle
Pressure drop
Inlet total pressure recovery
Adiabatic efficiency
Burner efficiency
Polytropic efficiency
Turbine loading parameter
Material density
Turbomachinery blade solidity
Disk stress

NASA/TM—2005-213414 20
Table 1.—Abridged HSR Cycle Design Ground rules (Thermodynamic)
Component Specification Specification Revision, 1/94
Inlet wcorr= 650 lb/s @ SLS,
Recoveries given in Figs 8-10.
Fan/LPC ηp = 0.895 @ SLS
CDFS ηp = 0.845 @ SLS
HPC ηp = 0.920 @ SLS
T3 max = 1250 °F (1710 °R)
T3 max = 1200 °F (1660 °R)
Combustor ηb = 0.999
LHV = 18,500 BTU/lb
∆P/P = 0.060
wl/wt = 0.14
HPT ηad = 0.920 (Peak)
T41 max = 2900 °F (3360 °R)
T41 max = 2800 °F (3260 °R)
LPT ηad = 0.925 (Peak)
Mixer E = 0.40 (Unforced mixers)
E = 0.80 (Forced mixers)
CM = 0.95
Ducts ∆P/P = 0.010 (duct, splitter, or VABI)
∆P/P = 0.005 (turbine exit frame)
∆P/P = 0.040 (IFV)
∆P/P = 0.020 (VCE/Flade bypass)
∆P/P = 0.020 (IFV bypass)
Augmentor ηb = 0.920
∆P/P = 0.020
Nozzles T8 max = 2250 °F (2710 °R)
CV = 0.982 (conventional CD Nozzle)
CV = CV(NPR) (ME nozzles, see fig. 22)
T8 max = 1700 °F (2160 °R)
Parasitics 200 HP high spool power extraction
1.0 lb/s customer bleed (ref.: 650 lb/s airflow)

NASA/TM—2005-213414 21
Table 2.—Abridged HSR Cycle Design Ground rules (Flowpath/Mechanical/Weight)
Component Specification
Inlet See figs. 11 and 12
Fan/LPC PRmax = 2.65 (for single stage)
PRmax = 4.00 (for two stages)
Utip corr max = 1720 ft/s
Utip max = 1800 ft/s
Min max = 0.625
Mout max = 0.500
Rh/Rt min, entrance = 0.37
σ = 0.95
Nbl = 30 to 35
ARin = 3.5
ARout = 2.5
ρ = 0.12 lb/in3
CDF PRmax = 2.10 (for single stage)
Utip corr max = 1650 ft/s
Utip max = 1865 ft/s
Min max = 0.550
Rh/Rt min, entrance = 0.40
σ = 0.90
Nbl = 40 to 55
ARin = 2.0 to 2.5
HPC PRmax = 1.80 (for single stage)
Utip corr max = 1600 ft/s
Min max = 0.400 (0.550 for IFV engines)
Mout max = 0.350
Rh/Rt min, entrance = 0.400
Rh/Rt max, exit = 0.935
σ = 0.85
Nbl = 50 to 60
ARin = 2.0

NASA/TM—2005-213414 22
Table 2 (Continued)
Component Specification
HPC ARout = 1.4
ρ = 0.16 lb/in3
Combustor Vcomb = 200 ft/s
tr = 0.0075 s
ρliner = 0.20 lb/in3
ρinner case = 0.20 lb/in3
ρouter case = 0.20 lb/in3
L/Hdiffuser = 5.75
HPT Utip max = 1900 ft/s
AN2max = 45x109 in2-RPM2
Mout max = 0.670
λmin = 0.210
σ = 0.90
ARin = 1.6
ARout = 2.5
σd max = 200,000 psi
LPT Rh/Rt exit min = 0.60
AN2max = 50x109 in2-RPM2
Mout max = 0.600
λmin = 0.30
σ = 0.80
ARin = 2.0 to 3.0
ARout = 3.0 to 4.0
σd max = 200,000 psi
Nozzles See figs. 16 to 21.

NASA/TM—2005-213414 23
Table 2 (Concluded)
Component Specification
Miscellaneous Wnacelle (lb) = 1.956 Lbare (ft) D2max (ft
2)
Wmounts (lb) = 0.003 FN SLS (lb)
Wfirewall (lb) = 3.1 Lbare (ft) Dmax (ft)
Wpylon (lb) = )2(ft captA)2(ft captA 2.184 + (ft) bareL(ft) maxD
(lb) SLS NF5-8.407x10 ⎟
⎠
⎞⎜⎝
⎛
WC&A (lb) = 0.10 Wbare (lb)
Table 3.—Flight Data Performance Envelope Altitude (ft) Mach
0
689
2000
10000
15000
20000
30000
36089
40000
50000
55000
60000
65000
70000
80000
0.00, 0.20, 0.30, 0.40
0.00, 0.20, 0.30, 0.40
0.00, 0.20, 0.30, 0.40, 0.60
0.40, 0.60, 0.90
0.40, 0.60, 0.90
0.40, 0.60, 0.90, 1.10
0.90, 1.10, 1.40, 1.60, 1.63
0.90, 1.10, 1.40, 1.60, 1.63, 1.80
0.90, 1.10, 1.40, 1.60, 1.63, 1.80, 2.10
1.40, 1.60, 1.63, 1.80, 2.10, 2.40
1.80, 2.10, 2.40
1.60, 1.63, 1.80, 2.10, 2.40
1.80, 2.10, 2.40
1.80, 2.10, 2.40
2.10, 2.40
Key: Bold indicates throttle hook is computed Italic indicates hot day (ISA + 18 °F) data

NASA/TM—2005-213414 24
Table 4.—TBE3010 Boeing HSCT Noise Summary, Standard Takeoff
Downrange Distance (ft)
Lateral Distance (ft)
Maximum PNLT (PNdB)
FAR36 Stage 3 Rule (EPNdB)
EPNL (EPNdB) Exceedance of Rule (EPNdB)
21325 0 122.0 105.2 118.9 13.7 9500 1476 115.2 102.4 112.8 10.4
10500 1476 116.5 102.4 113.6 11.2 11500 1476 118.0 102.4 114.8 12.4 12500 1476 119.7 102.4 116.2 13.8 13500 1476 120.3 102.4 116.9 14.5 14500 1476 120.7 102.4 117.6 15.2 15500 1476 121.2 102.4 118.3 15.9 16500 1476 121.5 102.4 118.8 16.4 17500 1476 121.7 102.4 119.3 16.9 18500 1476 120.8 102.4 118.6 16.2 19500 1476 116.8 102.4 116.4 14.0 20500 1476 115.3 102.4 115.4 13.0
Key: Bold indicates maximum sideline noise location
Table 5.—TBE3010 Boeing HSCT Noise Summary, Advanced Takeoff
Downrange Distance (ft)
Lateral Distance (ft)
Maximum PNLT (PNdB)
FAR36 Stage 3 Rule (EPNdB)
EPNL (EPNdB) Exceedance of Rule (EPNdB)
21325 0 124.5 105.1 118.9 13.8 9500 1476 115.1 102.3 113.1 10.8
10500 1476 115.6 102.3 113.5 11.2 11500 1476 116.3 102.3 114.0 11.7 12500 1476 117.0 102.3 114.4 12.1 13500 1476 117.2 102.3 114.9 12.6 14500 1476 117.6 102.3 115.3 13.0 15500 1476 118.0 102.3 115.7 13.4 16500 1476 118.4 102.3 116.0 13.7 17500 1476 118.8 102.3 116.1 13.8 18500 1476 115.5 102.3 115.3 13.0 19500 1476 114.7 102.3 114.6 12.3 20500 1476 114.9 102.3 114.0 11.7
Key: Bold indicates maximum sideline noise location
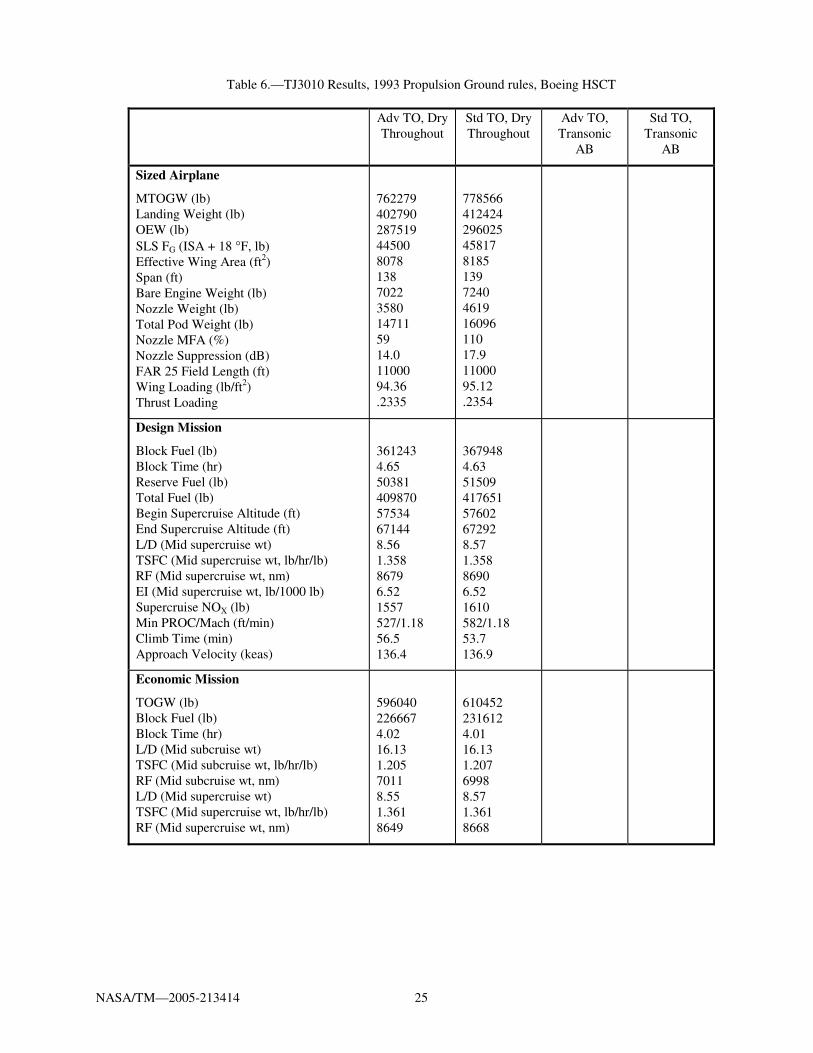
NASA/TM—2005-213414 25
Table 6.—TJ3010 Results, 1993 Propulsion Ground rules, Boeing HSCT
Adv TO, Dry Throughout
Std TO, Dry Throughout
Adv TO, Transonic
AB
Std TO, Transonic
AB
Sized Airplane
MTOGW (lb) Landing Weight (lb) OEW (lb) SLS FG (ISA + 18 °F, lb) Effective Wing Area (ft2) Span (ft) Bare Engine Weight (lb) Nozzle Weight (lb) Total Pod Weight (lb) Nozzle MFA (%) Nozzle Suppression (dB) FAR 25 Field Length (ft) Wing Loading (lb/ft2) Thrust Loading
762279 402790 287519 44500 8078 138 7022 3580 14711 59 14.0 11000 94.36 .2335
778566 412424 296025 45817 8185 139 7240 4619 16096 110 17.9 11000 95.12 .2354
Design Mission
Block Fuel (lb) Block Time (hr) Reserve Fuel (lb) Total Fuel (lb) Begin Supercruise Altitude (ft) End Supercruise Altitude (ft) L/D (Mid supercruise wt) TSFC (Mid supercruise wt, lb/hr/lb) RF (Mid supercruise wt, nm) EI (Mid supercruise wt, lb/1000 lb) Supercruise NOX (lb) Min PROC/Mach (ft/min) Climb Time (min) Approach Velocity (keas)
361243 4.65 50381 409870 57534 67144 8.56 1.358 8679 6.52 1557 527/1.18 56.5 136.4
367948 4.63 51509 417651 57602 67292 8.57 1.358 8690 6.52 1610 582/1.18 53.7 136.9
Economic Mission
TOGW (lb) Block Fuel (lb) Block Time (hr) L/D (Mid subcruise wt) TSFC (Mid subcruise wt, lb/hr/lb) RF (Mid subcruise wt, nm) L/D (Mid supercruise wt) TSFC (Mid supercruise wt, lb/hr/lb) RF (Mid supercruise wt, nm)
596040 226667 4.02 16.13 1.205 7011 8.55 1.361 8649
610452 231612 4.01 16.13 1.207 6998 8.57 1.361 8668

NASA/TM—2005-213414 26
Table 7.— TBE3010 Results, 1993 Propulsion Ground rules, Boeing HSCT
Adv TO, Dry
Throughout
Std TO, Dry Throughout
Adv TO, Transonic AB
Std TO, Transonic AB
Sized Airplane
MTOGW (lb) Landing Weight (lb) OEW (lb) SLS FG (ISA + 18 °F, lb) Effective Wing Area (ft2) Span (ft) Bare Engine Weight (lb) Nozzle Weight (lb) Total Pod Weight (lb) Nozzle MFA (%) Nozzle Suppression (dB) FAR 25 Field Length (ft) Wing Loading (lb/ft2) Thrust Loading
729055 384575 272033 41800 7835 136 6065 3210 12670 74 15.8 11000 93.05 .2293
744046 393496 279937 43000 7935 137 6248 4223 13969 126 18.9 11000 93.77 .2312
732634 386744 273960 42100 7858 136 6337 3234 12992 74 15.7 11000 93.23 .2299
748225 395952 282106 43350 7963 137 6534 4259 14321 126 18.9 11000 93.96 .2317
Design Mission
Block Fuel (lb) Block Time (hr) Reserve Fuel (lb) Total Fuel (lb) Begin Supercruise Altitude (ft) End Supercruise Altitude (ft) L/D (Mid supercruise wt) TSFC (Mid supercruise wt, lb/hr/lb) RF (Mid supercruise wt, nm) EI (Mid supercruise wt, lb/1000 lb) Supercruise NOX (lb) Min PROC/Mach (ft/min) Climb Time (min) Approach Velocity (keas)
346285 4.56 47652 392132 56579 66255 8.52 1.366 8585 7.42 1701 1147/1.18 50.8 135.4
352408 4.55 48669 399219 56301 66034 8.53 1.364 8609 6.90 1623 1228/1.18 48.6 136.0
347709 4.53 47895 393785 56422 66198 8.52 1.366 8589 7.28 1698 1342/2.40 46.9 135.6
354145 4.52 48956 401229 56150 65978 8.53 1.363 8613 6.77 1624 1465/1.44 44.8 136.1
Economic Mission
TOGW (lb) Block Fuel (lb) Block Time (hr) L/D (Mid subcruise wt) TSFC (Mid subcruise wt, lb/hr/lb) RF (Mid subcruise wt, nm) L/D (Mid supercruise wt) TSFC (Mid supercruise wt, lb/hr/lb) RF (Mid supercruise wt, nm)
566450 215153 3.96 16.11 1.162 7260 8.52 1.369 8567
579671 219625 3.96 16.13 1.164 7254 8.53 1.367 8593
569798 216360 3.94 16.12 1.162 7260 8.52 1.368 8571
583471 221012 3.94 16.13 1.165 7252 8.53 1.366 8597

NASA/TM—2005-213414 27
Table 8.— TBE3021 Results, 1993 Propulsion Ground rules, Boeing HSCT
Adv TO, Dry Throughout
Std TO, Dry Throughout
Adv TO, Transonic
AB
Std TO, Transonic
AB
Sized Airplane
MTOGW (lb) Landing Weight (lb) OEW (lb) SLS FG (ISA + 18 °F, lb) Effective Wing Area (ft2) Span (ft) Bare Engine Weight (lb) Nozzle Weight (lb) Total Pod Weight (lb) Nozzle MFA (%) Nozzle Suppression (dB) FAR 25 Field Length (ft) Wing Loading (lb/ft2) Thrust Loading
729610 386630 274114 42100 7815 136 6308 3264 13136 68 15.4 11000 93.36 .2308
744445 395454 281926 43300 7913 137 6497 4251 14418 121 18.6 11000 94.08 .2327
733261 388951 276192 42400 7838 136 6593 3310 13493 70 15.4 11000 93.55 .2313
748379 397846 284051 43617 7938 137 6792 4284 14774 121 18.6 11000 94.28 .2331
Design Mission
Block Fuel (lb) Block Time (hr) Reserve Fuel (lb) Total Fuel (lb) Begin Supercruise Altitude (ft) End Supercruise Altitude (ft) L/D (Mid supercruise wt) TSFC (Mid supercruise wt, lb/hr/lb) RF (Mid supercruise wt, nm) EI (Mid supercruise wt, lb/1000 lb) Supercruise NOX (lb) Min PROC/Mach (ft/min) Climb Time (min) Approach Velocity (keas)
344744 4.57 47625 390605 56683 66079 8.52 1.354 8663 6.39 1426 789/2.40 55.2 135.7
350806 4.56 48638 397629 56383 65863 8.53 1.352 8683 6.41 1478 1067/2.40 52.5 136.2
346087 4.53 47869 392179 56495 66014 8.52 1.354 8665 6.40 1458 860/2.40 50.3 135.8
352362 4.52 48904 399438 56208 65803 8.53 1.352 8685 6.41 1510 1137/2.40 47.9 136.3
Economic Mission
TOGW (lb) Block Fuel (lb) Block Time (hr) L/D (Mid subcruise wt) TSFC (Mid subcruise wt, lb/hr/lb) RF (Mid subcruise wt, nm) L/D (Mid supercruise wt) TSFC (Mid supercruise wt, lb/hr/lb) RF (Mid supercruise wt, nm)
567977 214521 3.97 16.12 1.159 7280 8.52 1.357 8645
581046 218941 3.96 16.13 1.161 7272 8.53 1.355 8666
571482 215728 3.94 16.12 1.160 7280 8.52 1.356 8648
584740 220273 3.94 16.13 1.162 7271 8.53 1.354 8670

NASA/TM—2005-213414 28
Table 9.— TBE3031 Results, 1993 Propulsion Ground rules, Boeing HSCT
Adv TO, Dry Throughout
Std TO, Dry Throughout
Adv TO, Transonic
AB
Std TO, Transonic
AB
Sized Airplane
MTOGW (lb) Landing Weight (lb) OEW (lb) SLS FG (ISA + 18 °F, lb) Effective Wing Area (ft2) Span (ft) Bare Engine Weight (lb) Nozzle Weight (lb) Total Pod Weight (lb) Nozzle MFA (%) Nozzle Suppression (dB) FAR 25 Field Length (ft) Wing Loading (lb/ft2) Thrust Loading
734219 391506 278716 43150 7813 136 6815 3365 14023 61 14.2 10916 93.97 .2351
748214 399592 285934 43917 7910 137 6943 4341 15198 115 18.3 11000 94.59 .2348
737156 392937 280031 43033 7835 136 7052 3345 14228 60 14.1 11000 94.09 .2335
750965 401430 287588 44150 7925 137 7244 4314 15493 112 18.1 11000 94.76 .2352
Design Mission
Block Fuel (lb) Block Time (hr) Reserve Fuel (lb) Total Fuel (lb) Begin Supercruise Altitude (ft) End Supercruise Altitude (ft) L/D (Mid supercruise wt) TSFC (Mid supercruise wt, lb/hr/lb) RF (Mid supercruise wt, nm) EI (Mid supercruise wt, lb/1000 lb) Supercruise NOX (lb) Min PROC/Mach (ft/min) Climb Time (min) Approach Velocity (keas)
344457 4.58 47901 390613 56549 65436 8.50 1.337 8748 6.34 1381 500/2.40 58.6 136.1
350399 4.58 48768 397390 56523 65430 8.52 1.337 8771 6.34 1408 528/2.40 58.4 136.6
345960 4.54 48016 392235 56338 65289 8.49 1.337 8741 6.34 1396 500/2.40 55.7 136.2
351321 4.53 48952 398487 56342 65461 8.53 1.337 8782 6.34 1438 583/2.40 53.3 136.7
Economic Mission
TOGW (lb) Block Fuel (lb) Block Time (hr) L/D (Mid subcruise wt) TSFC (Mid subcruise wt, lb/hr/lb) RF (Mid subcruise wt, nm) L/D (Mid supercruise wt) TSFC (Mid supercruise wt, lb/hr/lb) RF (Mid supercruise wt, nm)
573353 214962 3.97 16.12 1.152 7326 8.49 1.339 8728
585284 218962 3.97 16.14 1.152 7338 8.52 1.339 8754
575609 215817 3.95 16.13 1.150 7344 8.49 1.339 8727
588029 219880 3.94 16.14 1.152 7337 8.53 1.339 8766

NASA/TM—2005-213414 29
Table 10.—TBE3041 Results, 1993 Propulsion Ground rules, Boeing HSCT
Adv TO, Dry Throughout
Std TO, Dry Throughout
Adv TO, Transonic
AB
Std TO, Transonic
AB
Sized Airplane
MTOGW (lb) Landing Weight (lb) OEW (lb) SLS FG (ISA + 18 °F, lb) Effective Wing Area (ft2) Span (ft) Bare Engine Weight (lb) Nozzle Weight (lb) Total Pod Weight (lb) Nozzle MFA (%) Nozzle Suppression (dB) FAR 25 Field Length (ft) Wing Loading (lb/ft2) Thrust Loading
747038 400744 286978 45067 7878 137 7640 3504 15380 50 12.4 10782 94.83 .2413
759460 407925 293389 45733 7960 137 7759 4372 16432 99 17.4 10867 95.41 .2409
750614 402350 288450 44867 7908 137 7890 3488 15593 50 12.4 10891 94.92 .2391
763440 409600 294926 45450 7993 138 7997 4377 16648 100 17.4 11000 95.51 .2381
Design Mission
Block Fuel (lb) Block Time (hr) Reserve Fuel (lb) Total Fuel (lb) Begin Supercruise Altitude (ft) End Supercruise Altitude (ft) L/D (Mid supercruise wt) TSFC (Mid supercruise wt, lb/hr/lb) RF (Mid supercruise wt, nm) EI (Mid supercruise wt, lb/1000 lb) Supercruise NOX (lb) Min PROC/Mach (ft/min) Climb Time (min) Approach Velocity (keas)
348048 4.58 48877 395170 55899 64640 8.46 1.319 8830 6.27 1356 500/2.40 61.3 136.7
353316 4.58 49645 401181 55896 64621 8.48 1.319 8847 6.27 1376 500/2.40 61.3 137.2
350011 4.55 49010 397274 55663 64460 8.45 1.319 8821 6.27 1363 500/2.40 59.3 136.8
355609 4.55 49784 403624 55632 64400 8.47 1.319 8837 6.27 1380 500/2.40 59.9 137.2
Economic Mission
TOGW (lb) Block Fuel (lb) Block Time (hr) L/D (Mid subcruise wt) TSFC (Mid subcruise wt, lb/hr/lb) RF (Mid subcruise wt, nm) L/D (Mid supercruise wt) TSFC (Mid supercruise wt, lb/hr/lb) RF (Mid supercruise wt, nm)
585692 218087 3.97 16.14 1.151 7344 8.47 1.322 8822
596280 221632 3.97 16.13 1.149 7352 8.49 1.322 8842
588278 219113 3.95 16.14 1.147 7368 8.46 1.322 8811
598998 222738 3.95 16.13 1.145 7378 8.47 1.322 8823

NASA/TM—2005-213414 30
Table 11.—MFTF5093 Results, 1993 Propulsion Ground rules, Boeing HSCT
Adv TO, Dry Throughout
Std TO, Dry Throughout
Adv TO, Transonic
AB
Std TO, Transonic
AB
Sized Airplane
MTOGW (lb) Landing Weight (lb) OEW (lb) SLS FG (ISA + 18 °F, lb) Effective Wing Area (ft2) Span (ft) Nozzle Weight (lb) Total Pod Weight (lb) Nozzle MFA (%) Nozzle Suppression (dB) FAR 25 Field Length (ft) Wing Loading (lb/ft2) Thrust Loading
705592 382295 273684 44067 7483 133 3615 14215 58 13.9 10285 94.29 .2498
721046 390610 281155 44483 7595 134 4691 15395 119 18.6 10481 94.94 .2468
706981 382025 273524 43033 7503 133 3540 14139 60 14.0 10543 94.23 .2435
721825 389990 280684 43400 7613 134 4571 15265 119 18.6 10737 94.81 .2405
Design Mission
Block Fuel (lb) Block Time (hr) Reserve Fuel (lb) Total Fuel (lb) Begin Supercruise Altitude (ft) End Supercruise Altitude (ft) L/D (Mid supercruise wt) TSFC (Mid supercruise wt, lb/hr/lb) RF (Mid supercruise wt, nm) EI (Mid supercruise wt, lb/1000 lb) Supercruise NOX (lb) Min PROC/Mach (ft/min) Climb Time (min) Approach Velocity (keas)
324944 4.57 43721 367019 55780 64795 8.44 1.310 8871 8.19 1758 500/2.40 54.5 136.3
332098 4.59 44565 375000 55613 64572 8.45 1.310 8878 8.19 1774 500/2.40 56.9 136.8
326564 4.53 43611 368567 55139 64262 8.40 1.310 8827 8.20 1752 500/2.40 53.6 136.3
333457 4.55 44416 376251 55018 64042 8.40 1.310 8828 8.20 1761 500/2.40 56.3 136.7
Economic Mission
TOGW (lb) Block Fuel (lb) Block Time (hr) L/D (Mid subcruise wt) TSFC (Mid subcruise wt, lb/hr/lb) RF (Mid subcruise wt, nm) L/D (Mid supercruise wt) TSFC (Mid supercruise wt, lb/hr/lb) RF (Mid supercruise wt, nm)
551992 202267 3.99 16.13 1.113 7592 8.44 1.313 8849
564421 206568 3.99 16.14 1.108 7626 8.45 1.313 8860
551692 202295 3.95 16.13 1.104 7650 8.40 1.313 8810
563556 206373 3.96 16.14 1.100 7683 8.40 1.312 8811

NASA/TM—2005-213414 31
Table 12.—MFTF5093 Results, 1993 Propulsion Ground rules, McDonnell Douglas HSCT
Adv TO, Dry Throughout
Std TO, Dry Throughout
Adv TO, Transonic
AB
Std TO, Transonic
AB
Sized Airplane
MTOGW (lb) Landing Weight (lb) OEW (lb) SLS FG (ISA + 18 °F, lb) Effective Wing Area (ft2) Span (ft) Nozzle Weight (lb) Total Pod Weight (lb) Nozzle MFA (%) Nozzle Suppression (dB) FAR 25 Field Length (ft) Wing Loading (lb/ft2) Thrust Loading
728271 385202 313470 45117 9840 157 4808 15672 121 18.5 11000 74.01 .2478
Design Mission
Block Fuel (lb) Block Time (hr) Reserve Fuel (lb) Total Fuel (lb) L/D (Mid subcruise wt) TSFC (Mid subcruise wt, lb/hr/lb) RF (Mid subcruise wt, nm) EI (Mid subcruise wt, lb/1000 lb) Subcruise NOX (lb) Begin Supercruise Altitude (ft) End Supercruise Altitude (ft) L/D (Mid supercruise wt) TSFC (Mid supercruise wt, lb/hr/lb) RF (Mid supercruise wt, nm) EI (Mid supercruise wt, lb/1000 lb) Supercruise NOX (lb) Min PROC/Mach (ft/min)
344072 5.27 10232 353301 14.74 1.114 7377 5.97 379 57833 65204 8.97 1.314 9399 7.62 1483 1000/2.40

NASA/TM—2005-213414 32
Table 13.—MFTF5094 Results, 1994 Propulsion Ground rules, Boeing HSCT
Adv TO, Dry Throughout
Std TO, Dry Throughout
Adv TO, Transonic
AB
Std TO, Transonic
AB
Sized Airplane
MTOGW (lb) Landing Weight (lb) OEW (lb) SLS FG (ISA + 18 °F, lb) Effective Wing Area (ft2) Span (ft) Nozzle Weight (lb) Total Pod Weight (lb) Nozzle MFA (%) Nozzle Suppression (dB) FAR 25 Field Length (ft) Wing Loading (lb/ft2) Thrust Loading
730775 390760 280509 44850 7740 135 3283 14706 64 14.4 10444 94.42 .2455
747843 400067 288861 45417 7860 136 4465 16039 129 18.8 10633 95.15 .2429
Design Mission
Block Fuel (lb) Block Time (hr) Reserve Fuel (lb) Total Fuel (lb) Begin Supercruise Altitude (ft) End Supercruise Altitude (ft) L/D (Mid supercruise wt) TSFC (Mid supercruise wt, lb/hr/lb) RF (Mid supercruise wt, nm) EI (Mid supercruise wt, lb/1000 lb) Supercruise NOX (lb) Min PROC/Mach (ft/min) Climb Time (min) Approach Velocity (keas)
341729 4.57 45361 385376 54588 64047 8.36 1.341 8586 5.67 1254 500/2.40 58.8 136.4
349512 4.59 46316 394092 54476 63836 8.37 1.341 8598 5.67 1269 500/2.40 60.8 137.0
Economic Mission
TOGW (lb) Block Fuel (lb) Block Time (hr) L/D (Mid subcruise wt) TSFC (Mid subcruise wt, lb/hr/lb) RF (Mid subcruise wt, nm) L/D (Mid supercruise wt) TSFC (Mid supercruise wt, lb/hr/lb) RF (Mid supercruise wt, nm)
568099 210491 3.98 16.13 1.107 7627 8.38 1.344 8580
581981 215293 3.99 16.14 1.104 7655 8.39 1.344 8593

NASA/TM—2005-213414 33
Table 14.—MFTF5094 Results, 1994 Propulsion Ground rules, McDonnell Douglas HSCT
Adv TO, Dry Throughout
Std TO, Dry Throughout
Adv TO, Transonic
AB
Std TO, Transonic
AB
Sized Airplane
MTOGW (lb) Landing Weight (lb) OEW (lb) SLS FG (ISA + 18 °F, lb) Effective Wing Area (ft2) Span (ft) Nozzle Weight (lb) Total Pod Weight (lb) Nozzle MFA (%) Nozzle Suppression (dB) FAR 25 Field Length (ft) Wing Loading (lb/ft2) Thrust Loading
733553 383916 311991 46927 9710 156 3586 15564 77 16.0 11000 75.55 .2559
762750 400732 328437 47885 10208 160 4764 17000 126 18.8 11000 74.72 .2511
Design Mission
Block Fuel (lb) Block Time (hr) Reserve Fuel (lb) Total Fuel (lb) L/D (Mid subcruise wt) TSFC (Mid subcruise wt, lb/hr/lb) RF (Mid subcruise wt, nm) EI (Mid subcruise wt, lb/1000 lb) Subcruise NOX (lb) Begin Supercruise Altitude (ft) End Supercruise Altitude (ft) L/D (Mid supercruise wt) TSFC (Mid supercruise wt, lb/hr/lb) RF (Mid supercruise wt, nm) EI (Mid supercruise wt, lb/1000 lb) Supercruise NOX (lb) Min PROC/Mach (ft/min)
350705 5.25 10425 360062 14.71 1.125 7289 7.67 497 57494 65647 8.96 1.357 9092 5.15 1051 1000/2.40
363107 5.25 10795 372813 14.82 1.122 7366 7.53 501 57251 65305 9.01 1.357 9143 5.14 1082 1000/2.40

NASA/TM—2005-213414 34
Table 15.—MFTF5193 Results, 1993 Propulsion Ground rules, Boeing HSCT Adv TO, Dry
Throughout Std TO, Dry Throughout
Adv TO, Transonic
AB
Std TO, Transonic
AB
Sized Airplane
MTOGW (lb) Landing Weight (lb) OEW (lb) SLS FG (ISA + 18 °F, lb) Effective Wing Area (ft2) Span (ft) Nozzle Weight (lb) Total Pod Weight (lb) Nozzle MFA (%) Nozzle Suppression (dB) FAR 25 Field Length (ft) Wing Loading (lb/ft2) Thrust Loading
715649 387738 278476 44917 7558 134 3664 14958 60 14.0 10266 94.69 .2511
732074 396525 286367 45367 7678 135 4785 16198 121 18.7 10468 95.35 .2479
Design Mission
Block Fuel (lb) Block Time (hr) Reserve Fuel (lb) Total Fuel (lb) Begin Supercruise Altitude (ft) End Supercruise Altitude (ft) L/D (Mid supercruise wt) TSFC (Mid supercruise wt, lb/hr/lb) RF (Mid supercruise wt, nm) EI (Mid supercruise wt, lb/1000 lb) Supercruise NOX (lb) Min PROC/Mach (ft/min) Climb Time (min) Approach Velocity (keas)
329609 4.59 44372 372284 55912 64907 8.46 1.310 8893 5.14 1115 500/2.40 55.3 136.6
337264 4.60 45268 380817 55744 64698 8.47 1.310 8903 5.14 1126 500/2.40 57.9 137.1
Economic Mission
TOGW (lb) Block Fuel (lb) Block Time (hr) L/D (Mid subcruise wt) TSFC (Mid subcruise wt, lb/hr/lb) RF (Mid subcruise wt, nm) L/D (Mid supercruise wt) TSFC (Mid supercruise wt, lb/hr/lb) RF (Mid supercruise wt, nm)
560458 205428 3.99 16.13 1.113 7589 8.47 1.313 8878
573592 209993 4.00 16.14 1.108 7626 8.47 1.313 8886

NASA/TM—2005-213414 35
Table 16.—MFTF4093 Results, 1993 Propulsion Ground rules, Boeing HSCT Adv TO, Dry
Throughout Std TO, Dry Throughout
Adv TO, Transonic
AB
Std TO, Transonic
AB
Sized Airplane
MTOGW (lb) Landing Weight (lb) OEW (lb) SLS FG (ISA + 18 °F, lb) Effective Wing Area (ft2) Span (ft) Nozzle Weight (lb) Total Pod Weight (lb) Nozzle MFA (%) Nozzle Suppression (dB) FAR 25 Field Length (ft) Wing Loading (lb/ft2) Thrust Loading
715768 389965 280746 46450 7528 134 3876 15340 45 11.9 10298 95.08 .2596
729760 397380 287421 46767 7630 134 4841 16387 104 17.9 10488 95.64 .2563
715830 389313 280300 45350 7533 134 3795 15270 48 12.6 10539 95.03 .2534
729622 396395 286686 45467 7638 135 4746 16253 106 18.0 10769 95.53 .2493
Design Mission
Block Fuel (lb) Block Time (hr) Reserve Fuel (lb) Total Fuel (lb) Begin Supercruise Altitude (ft) End Supercruise Altitude (ft) L/D (Mid supercruise wt) TSFC (Mid supercruise wt, lb/hr/lb) RF (Mid supercruise wt, nm) EI (Mid supercruise wt, lb/1000 lb) Supercruise NOX (lb) Min PROC/Mach (ft/min) Climb Time (min) Approach Velocity (keas)
327434 4.59 44329 370132 55609 64428 8.44 1.295 8972 7.88 1679 500/2.40 57.1 136.9
334021 4.60 45069 377449 55444 64209 8.45 1.295 8979 7.88 1687 500/2.40 59.9 137.3
328109 4.54 44123 370640 55023 63916 8.40 1.295 8932 7.88 1672 500/2.40 55.5 136.9
334824 4.56 44819 378046 54832 63605 8.39 1.294 8927 7.88 1668 500/2.40 59.5 137.2
Economic Mission
TOGW (lb) Block Fuel (lb) Block Time (hr) L/D (Mid subcruise wt) TSFC (Mid subcruise wt, lb/hr/lb) RF (Mid subcruise wt, nm) L/D (Mid supercruise wt) TSFC (Mid supercruise wt, lb/hr/lb) RF (Mid supercruise wt, nm)
561828 204407 3.99 16.13 1.102 7660 8.45 1.298 8963
572904 208254 4.00 16.13 1.097 7697 8.44 1.298 8960
560589 203855 3.95 16.13 1.094 7721 8.40 1.297 8913
571170 207550 3.96 16.13 1.088 7766 8.39 1.297 8905

NASA/TM—2005-213414 36
Table 17.—MFTF4093 Results, 1993 Propulsion Ground rules, McDonnell Douglas HSCT
Adv TO, Dry Throughout
Std TO, Dry Throughout
Adv TO, Transonic AB
Std TO, Transonic AB
Sized Airplane
MTOGW (lb) Landing Weight (lb) OEW (lb) SLS FG (ISA + 18 °F, lb) Effective Wing Area (ft2) Span (ft) Nozzle Weight (lb) Total Pod Weight (lb) Nozzle MFA (%) Nozzle Suppression (dB) FAR 25 Field Length (ft) Wing Loading (lb/ft2) Thrust Loading
729915 388178 316485 46620 9674 156 4832 16340 105 17.6 11000 75.45 .2555
Design Mission
Block Fuel (lb) Block Time (hr) Reserve Fuel (lb) Total Fuel (lb) L/D (Mid subcruise wt) TSFC (Mid subcruise wt, lb/hr/lb) RF (Mid subcruise wt, nm) EI (Mid subcruise wt, lb/1000 lb) Subcruise NOX (lb) Begin Supercruise Altitude (ft) End Supercruise Altitude (ft) L/D (Mid supercruise wt) TSFC (Mid supercruise wt, lb/hr/lb) RF (Mid supercruise wt, nm) EI (Mid supercruise wt, lb/1000 lb) Supercruise NOX (lb) Min PROC/Mach (ft/min)
342719 5.28 10193 351931 14.70 1.101 7446 5.97 377 57386 64656 8.93 1.298 9471 7.11 1367 1000/2.40

NASA/TM—2005-213414 37
Table 18.—MFTF4094 Results, 1994 Propulsion Ground rules, Boeing HSCT
Adv TO, Dry Throughout
Std TO, Dry Throughout
Adv TO, Transonic
AB
Std TO, Transonic
AB
Sized Airplane
MTOGW (lb) Landing Weight (lb) OEW (lb) SLS FG (ISA + 18 °F, lb) Effective Wing Area (ft2) Span (ft) Nozzle Weight (lb) Total Pod Weight (lb) Nozzle MFA (%) Nozzle Suppression (dB) FAR 25 Field Length (ft) Wing Loading (lb/ft2) Thrust Loading
736347 396362 285794 46267 7743 135 3458 15619 50 12.8 10343 95.10 .2513
749718 403599 292304 46683 7840 136 4372 16648 104 17.8 10493 95.63 .2491
Design Mission
Block Fuel (lb) Block Time (hr) Reserve Fuel (lb) Total Fuel (lb) Begin Supercruise Altitude (ft) End Supercruise Altitude (ft) L/D (Mid supercruise wt) TSFC (Mid supercruise wt, lb/hr/lb) RF (Mid supercruise wt, nm) EI (Mid supercruise wt, lb/1000 lb) Supercruise NOX (lb) Min PROC/Mach (ft/min) Climb Time (min) Approach Velocity (keas)
341642 4.59 45678 385663 54467 63563 8.37 1.323 8709 5.57 1217 500/2.40 61.2 136.9
347791 4.60 46405 392525 54373 63396 8.38 1.323 8719 5.57 1225 500/2.40 63.2 137.3
Economic Mission
TOGW (lb) Block Fuel (lb) Block Time (hr) L/D (Mid subcruise wt) TSFC (Mid subcruise wt, lb/hr/lb) RF (Mid subcruise wt, nm) L/D (Mid supercruise wt) TSFC (Mid supercruise wt, lb/hr/lb) RF (Mid supercruise wt, nm)
574548 211228 3.99 16.13 1.100 7680 8.37 1.326 8692
585373 214978 4.00 16.14 1.096 7709 8.38 1.326 8703

NASA/TM—2005-213414 38
Table 19.—MFTF4094 Results, 1994 Propulsion Ground rules, McDonnell Douglas HSCT
Adv TO, Dry Throughout
Std TO, Dry Throughout
Adv TO, Transonic
AB
Std TO, Transonic
AB
Sized Airplane
MTOGW (lb) Landing Weight (lb) OEW (lb) SLS FG (ISA + 18 °F, lb) Effective Wing Area (ft2) Span (ft) Nozzle Weight (lb) Total Pod Weight (lb) Nozzle MFA (%) Nozzle Suppression (dB) FAR 25 Field Length (ft) Wing Loading (lb/ft2) Thrust Loading
735468 387313 315429 47057 9738 156 3644 16023 64 14.6 11000 75.53 .2559
757910 400822 328671 48270 10068 159 4578 17293 106 17.9 11000 75.28 .2548
Design Mission
Block Fuel (lb) Block Time (hr) Reserve Fuel (lb) Total Fuel (lb) L/D (Mid subcruise wt) TSFC (Mid subcruise wt, lb/hr/lb) RF (Mid subcruise wt, nm) EI (Mid subcruise wt, lb/1000 lb) Subcruise NOX (lb) Begin Supercruise Altitude (ft) End Supercruise Altitude (ft) L/D (Mid supercruise wt) TSFC (Mid supercruise wt, lb/hr/lb) RF (Mid supercruise wt, nm) EI (Mid supercruise wt, lb/1000 lb) Supercruise NOX (lb) Min PROC/Mach (ft/min)
349158 5.26 10384 358539 14.72 1.112 7379 5.74 369 56849 64500 8.91 1.333 9198 4.97 996 1000/2.40
358118 5.26 10651 367739 14.79 1.112 7415 5.73 378 56879 64471 8.98 1.333 9273 4.96 1019 1000/2.40

NASA/TM—2005-213414 39
Table 20.—MFTF4193 Results, 1993 Propulsion Ground rules, Boeing HSCT
Adv TO, Dry Throughout
Std TO, Dry Throughout
Adv TO, Transonic
AB
Std TO, Transonic
AB
Sized Airplane
MTOGW (lb) Landing Weight (lb) OEW (lb) SLS FG (ISA + 18 °F, lb) Effective Wing Area (ft2) Span (ft) Nozzle Weight (lb) Total Pod Weight (lb) Nozzle MFA (%) Nozzle Suppression (dB) FAR 25 Field Length (ft) Wing Loading (lb/ft2) Thrust Loading
725106 394837 285024 46450 7598 134 3859 16017 45 11.9 10195 95.43 .2562
739747 402984 292351 47017 7698 135 4889 17202 106 17.9 10345 96.10 .2542
Design Mission
Block Fuel (lb) Block Time (hr) Reserve Fuel (lb) Total Fuel (lb) Begin Supercruise Altitude (ft) End Supercruise Altitude (ft) L/D (Mid supercruise wt) TSFC (Mid supercruise wt, lb/hr/lb) RF (Mid supercruise wt, nm) EI (Mid supercruise wt, lb/1000 lb) Supercruise NOX (lb) Min PROC/Mach (ft/min) Climb Time (min) Approach Velocity (keas)
331930 4.60 44923 375193 55522 64400 8.45 1.295 8985 5.15 1108 500/2.40 58.2 137.2
338445 4.61 45743 382506 55432 64270 8.46 1.295 8997 5.15 1120 500/2.40 59.7 137.6
Economic Mission
TOGW (lb) Block Fuel (lb) Block Time (hr) L/D (Mid subcruise wt) TSFC (Mid subcruise wt, lb/hr/lb) RF (Mid subcruise wt, nm) L/D (Mid supercruise wt) TSFC (Mid supercruise wt, lb/hr/lb) RF (Mid supercruise wt, nm)
569427 207275 4.00 16.14 1.101 7671 8.45 1.299 8961
581438 211321 4.00 16.13 1.098 7693 8.47 1.298 8979

NASA/TM—2005-213414 40
Table 21.—MFTF4293 Results, 1993 Propulsion Ground rules, Boeing HSCT
Adv TO, Dry Throughout
Std TO, Dry Throughout
Adv TO, Transonic
AB
Std TO, Transonic
AB
Sized Airplane
MTOGW (lb) Landing Weight (lb) OEW (lb) SLS FG (ISA + 18 °F, lb) Effective Wing Area (ft2) Span (ft) Nozzle Weight (lb) Total Pod Weight (lb) Nozzle MFA (%) Nozzle Suppression (dB) FAR 25 Field Length (ft) Wing Loading (lb/ft2) Thrust Loading
738225 401549 290815 46383 7700 135 3851 16903 50 12.7 10431 95.87 .2513
753277 409824 298252 46917 7805 136 4885 18094 108 18.0 10592 96.51 .2491
Design Mission
Block Fuel (lb) Block Time (hr) Reserve Fuel (lb) Total Fuel (lb) Begin Supercruise Altitude (ft) End Supercruise Altitude (ft) L/D (Mid supercruise wt) TSFC (Mid supercruise wt, lb/hr/lb) RF (Mid supercruise wt, nm) EI (Mid supercruise wt, lb/1000 lb) Supercruise NOX (lb) Min PROC/Mach (ft/min) Climb Time (min) Approach Velocity (keas)
338354 4.60 45845 382520 55510 64350 8.46 1.298 8973 5.12 1115 500/2.40 59.3 137.5
345151 4.62 46682 390135 55409 64204 8.47 1.298 8981 5.12 1127 500/2.40 61.1 137.9
Economic Mission
TOGW (lb) Block Fuel (lb) Block Time (hr) L/D (Mid subcruise wt) TSFC (Mid subcruise wt, lb/hr/lb) RF (Mid subcruise wt, nm) L/D (Mid supercruise wt) TSFC (Mid supercruise wt, lb/hr/lb) RF (Mid supercruise wt, nm)
580058 211372 4.00 16.13 1.106 7638 8.47 1.301 8958
592341 215572 4.01 16.13 1.102 7663 8.48 1.301 8972

NASA/TM—2005-213414 41
Table 22.—MFTF3093 Results, 1993 Propulsion Ground rules, Boeing HSCT
Adv TO, Dry Throughout
Std TO, Dry Throughout
Adv TO, Transonic
AB
Std TO, Transonic
AB
Sized Airplane
MTOGW (lb) Landing Weight (lb) OEW (lb) SLS FG (ISA + 18 °F, lb) Effective Wing Area (ft2) Span (ft) Nozzle Weight (lb) Total Pod Weight (lb) Nozzle MFA (%) Nozzle Suppression (dB) FAR 25 Field Length (ft) Wing Loading (lb/ft2) Thrust Loading
732078 400076 289640 48150 7633 134 4131 16533 30 8.9 9822 95.91 .2631
744231 406932 295810 48683 7715 135 4989 17535 85 16.5 9932 96.47 .2617
729881 397237 287346 46017 7633 134 3973 16135 37 10.1 10211 95.62 .2522
741339 403150 292674 46183 7718 135 4749 16958 86 16.7 10380 96.05 .2492
Design Mission
Block Fuel (lb) Block Time (hr) Reserve Fuel (lb) Total Fuel (lb) Begin Supercruise Altitude (ft) End Supercruise Altitude (ft) L/D (Mid supercruise wt) TSFC (Mid supercruise wt, lb/hr/lb) RF (Mid supercruise wt, nm) EI (Mid supercruise wt, lb/1000 lb) Supercruise NOX (lb) Min PROC/Mach (ft/min) Climb Time (min) Approach Velocity (keas)
333647 4.61 45546 377549 55523 64164 8.46 1.284 9070 7.99 1704 500/2.40 60.7 137.5
338961 4.62 46232 383531 55469 64076 8.47 1.284 9083 7.99 1721 500/2.40 61.8 137.9
334216 4.57 45001 377646 54686 63243 8.37 1.283 8983 8.00 1653 500/2.40 63.1 137.3
339765 4.59 45586 383774 54588 63014 8.37 1.283 8981 8.00 1647 500/2.40 66.5 137.6
Economic Mission
TOGW (lb) Block Fuel (lb) Block Time (hr) L/D (Mid subcruise wt) TSFC (Mid subcruise wt, lb/hr/lb) RF (Mid subcruise wt, nm) L/D (Mid supercruise wt) TSFC (Mid supercruise wt, lb/hr/lb) RF (Mid supercruise wt, nm)
576809 209344 4.01 16.13 1.109 7613 8.46 1.287 9046
586904 212728 4.01 16.13 1.106 7632 8.47 1.287 9060
572210 207634 3.96 16.13 1.093 7725 8.37 1.286 8960
581024 210697 3.97 16.13 1.089 7757 8.36 1.286 8950

NASA/TM—2005-213414 42
Table 23.—MFTF3093 Results, 1993 Propulsion Ground rules, McDonnell Douglas HSCT
Adv TO, Dry Throughout
Std TO, Dry Throughout
Adv TO, Transonic
AB
Std TO, Transonic
AB
Sized Airplane
MTOGW (lb) Landing Weight (lb) OEW (lb) SLS FG (ISA + 18 °F, lb) Effective Wing Area (ft2) Span (ft) Nozzle Weight (lb) Total Pod Weight (lb) Nozzle MFA (%) Nozzle Suppression (dB) FAR 25 Field Length (ft) Wing Loading (lb/ft2) Thrust Loading
744524 397735 325887 47920 9824 157 5039 17379 90 16.6 11000 75.79 .2575
Design Mission
Block Fuel (lb) Block Time (hr) Reserve Fuel (lb) Total Fuel (lb) L/D (Mid subcruise wt) TSFC (Mid subcruise wt, lb/hr/lb) RF (Mid subcruise wt, nm) EI (Mid subcruise wt, lb/1000 lb) Subcruise NOX (lb) Begin Supercruise Altitude (ft) End Supercruise Altitude (ft) L/D (Mid supercruise wt) TSFC (Mid supercruise wt, lb/hr/lb) RF (Mid supercruise wt, nm) EI (Mid supercruise wt, lb/1000 lb) Supercruise NOX (lb) Min PROC/Mach (ft/min)
347727 5.29 10347 357137 14.73 1.100 7465 5.93 381 57118 64292 8.95 1.288 9562 7.28 1408 1000/2.40

NASA/TM—2005-213414 43
Table 24.—MFTF3094 Results, 1994 Propulsion Ground rules, Boeing HSCT
Adv TO, Dry Throughout
Std TO, Dry Throughout
Adv TO, Transonic
AB
Std TO, Transonic
AB
Sized Airplane
MTOGW (lb) Landing Weight (lb) OEW (lb) SLS FG (ISA + 18 °F, lb) Effective Wing Area (ft2) Span (ft) Nozzle Weight (lb) Total Pod Weight (lb) Nozzle MFA (%) Nozzle Suppression (dB) FAR 25 Field Length (ft) Wing Loading (lb/ft2) Thrust Loading
752283 405437 293283 48867 7903 137 3769 16943 38 10.4 10247 95.95 .2578
762237 411295 298653 49150 7965 137 4386 17640 85 16.5 10347 96.33 .2562
Design Mission
Block Fuel (lb) Block Time (hr) Reserve Fuel (lb) Total Fuel (lb) Begin Supercruise Altitude (ft) End Supercruise Altitude (ft) L/D (Mid supercruise wt) TSFC (Mid supercruise wt, lb/hr/lb) RF (Mid supercruise wt, nm) EI (Mid supercruise wt, lb/1000 lb) Supercruise NOX (lb) Min PROC/Mach (ft/min) Climb Time (min) Approach Velocity (keas)
348486 4.62 47263 394110 53780 62705 8.35 1.316 8732 5.68 1246 500/2.40 66.5 137.5
352590 4.63 47753 398694 53713 62596 8.35 1.316 8733 5.68 1252 500/2.40 67.8 137.8
Economic Mission
TOGW (lb) Block Fuel (lb) Block Time (hr) L/D (Mid subcruise wt) TSFC (Mid subcruise wt, lb/hr/lb) RF (Mid subcruise wt, nm) L/D (Mid supercruise wt) TSFC (Mid supercruise wt, lb/hr/lb) RF (Mid supercruise wt, nm)
592653 217431 4.00 16.13 1.096 7711 8.34 1.319 8704
599849 219887 4.01 16.13 1.093 7728 8.34 1.319 8705

NASA/TM—2005-213414 44
Table 25.—MFTF3094 Results, 1994 Propulsion Ground rules, McDonnell Douglas HSCT
Adv TO, Dry Throughout
Std TO, Dry Throughout
Adv TO, Transonic
AB
Std TO, Transonic
AB
Sized Airplane
MTOGW (lb) Landing Weight (lb) OEW (lb) SLS FG (ISA + 18 °F, lb) Effective Wing Area (ft2) Span (ft) Nozzle Weight (lb) Total Pod Weight (lb) Nozzle MFA (%) Nozzle Suppression (dB) FAR 25 Field Length (ft) Wing Loading (lb/ft2) Thrust Loading
747574 395604 323515 49690 9773 156 3899 17305 51 12.9 11000 77.01 .2641
765338 406138 333833 50507 10047 159 4626 18264 89 16.8 11000 76.67 .2623
Design Mission
Block Fuel (lb) Block Time (hr) Reserve Fuel (lb) Total Fuel (lb) L/D (Mid subcruise wt) TSFC (Mid subcruise wt, lb/hr/lb) RF (Mid subcruise wt, nm) EI (Mid subcruise wt, lb/1000 lb) Subcruise NOX (lb) Begin Supercruise Altitude (ft) End Supercruise Altitude (ft) L/D (Mid supercruise wt) TSFC (Mid supercruise wt, lb/hr/lb) RF (Mid supercruise wt, nm) EI (Mid supercruise wt, lb/1000 lb) Supercruise NOX (lb) Min PROC/Mach (ft/min)
352963 5.26 10590 362559 14.72 1.105 7427 6.50 425 56109 63779 8.93 1.331 9234 5.18 1061 1000/2.40
360209 5.27 10805 370005 14.77 1.103 7464 6.46 430 56045 63679 8.96 1.331 9272 5.18 1080 1000/2.40

NASA/TM—2005-213414 45
Table 26.—MFTF3193 Results, 1993 Propulsion Ground rules, Boeing HSCT
Adv TO, Dry Throughout
Std TO, Dry Throughout
Adv TO, Transonic
AB
Std TO, Transonic
AB
Sized Airplane
MTOGW (lb) Landing Weight (lb) OEW (lb) SLS FG (ISA + 18 °F, lb) Effective Wing Area (ft2) Span (ft) Nozzle Weight (lb) Total Pod Weight (lb) Nozzle MFA (%) Nozzle Suppression (dB) FAR 25 Field Length (ft) Wing Loading (lb/ft2) Thrust Loading
744152 406954 295812 49700 7713 135 4114 17569 30 8.8 9953 96.48 .2671
756351 413783 301951 50233 7798 136 4950 18556 84 16.5 10061 96.99 .2657
Design Mission
Block Fuel (lb) Block Time (hr) Reserve Fuel (lb) Total Fuel (lb) Begin Supercruise Altitude (ft) End Supercruise Altitude (ft) L/D (Mid supercruise wt) TSFC (Mid supercruise wt, lb/hr/lb) RF (Mid supercruise wt, nm) EI (Mid supercruise wt, lb/1000 lb) Supercruise NOX (lb) Min PROC/Mach (ft/min) Climb Time (min) Approach Velocity (keas)
338870 4.62 46253 383450 55583 64213 8.48 1.283 9097 5.16 1110 500/2.40 61.7 137.9
344258 4.63 46942 389509 55525 64125 8.49 1.283 9108 5.16 1121 500/2.40 62.9 138.3
Economic Mission
TOGW (lb) Block Fuel (lb) Block Time (hr) L/D (Mid subcruise wt) TSFC (Mid subcruise wt, lb/hr/lb) RF (Mid subcruise wt, nm) L/D (Mid supercruise wt) TSFC (Mid supercruise wt, lb/hr/lb) RF (Mid supercruise wt, nm)
586619 212447 4.01 16.13 1.102 7662 8.48 1.286 9075
596651 215804 4.01 16.12 1.099 7680 8.49 1.286 9086

NASA/TM—2005-213414 46
Table 27.—MFTF3293 Results, 1993 Propulsion Ground rules, Boeing HSCT
Adv TO, Dry Throughout
Std TO, Dry Throughout
Adv TO, Transonic
AB
Std TO, Transonic
AB
Sized Airplane
MTOGW (lb) Landing Weight (lb) OEW (lb) SLS FG (ISA + 18 °F, lb) Effective Wing Area (ft2) Span (ft) Nozzle Weight (lb) Total Pod Weight (lb) Nozzle MFA (%) Nozzle Suppression (dB) FAR 25 Field Length (ft) Wing Loading (lb/ft2) Thrust Loading
752782 411121 299438 49300 7783 136 4096 18126 34 9.5 10166 96.72 .2620
766331 418805 306352 49933 7875 137 5030 19249 89 16.8 10278 97.31 .2606
Design Mission
Block Fuel (lb) Block Time (hr) Reserve Fuel (lb) Total Fuel (lb) Begin Supercruise Altitude (ft) End Supercruise Altitude (ft) L/D (Mid supercruise wt) TSFC (Mid supercruise wt, lb/hr/lb) RF (Mid supercruise wt, nm) EI (Mid supercruise wt, lb/1000 lb) Supercruise NOX (lb) Min PROC/Mach (ft/min) Climb Time (min) Approach Velocity (keas)
343340 4.62 46793 388454 55319 64022 8.47 1.286 9064 5.12 1113 500/2.40 62.3 138.1
349227 4.63 47563 395089 55280 63942 8.49 1.286 9081 5.12 1126 500/2.40 63.3 138.5
Economic Mission
TOGW (lb) Block Fuel (lb) Block Time (hr) L/D (Mid subcruise wt) TSFC (Mid subcruise wt, lb/hr/lb) RF (Mid subcruise wt, nm) L/D (Mid supercruise wt) TSFC (Mid supercruise wt, lb/hr/lb) RF (Mid supercruise wt, nm)
593411 215206 4.01 16.12 1.100 7676 8.47 1.289 9043
604734 218995 4.02 16.12 1.097 7692 8.48 1.289 9054

NASA/TM—2005-213414 47
Table 28.—MFTF2093 Results, 1993 Propulsion Ground rules, Boeing HSCT
Adv TO, Dry Throughout
Std TO, Dry Throughout
Adv TO, Transonic
AB
Std TO, Transonic
AB
Sized Airplane
MTOGW (lb) Landing Weight (lb) OEW (lb) SLS FG (ISA + 18 °F, lb) Effective Wing Area (ft2) Span (ft) Nozzle Weight (lb) Total Pod Weight (lb) Nozzle MFA (%) Nozzle Suppression (dB) FAR 25 Field Length (ft) Wing Loading (lb/ft2) Thrust Loading
769157 420658 307775 53750 7895 137 4826 18952 30 5.9 9691 97.42 .2795
776979 424899 311584 54050 7950 137 5343 19553 64 14.5 9764 97.73 .2783
762432 414083 302290 50133 7878 137 4486 18012 30 7.8 10224 96.78 .2630
769805 418162 305970 50417 7928 137 4997 18604 66 14.8 10299 97.10 .2620
Design Mission
Block Fuel (lb) Block Time (hr) Reserve Fuel (lb) Total Fuel (lb) Begin Supercruise Altitude (ft) End Supercruise Altitude (ft) L/D (Mid supercruise wt) TSFC (Mid supercruise wt, lb/hr/lb) RF (Mid supercruise wt, nm) EI (Mid supercruise wt, lb/1000 lb) Supercruise NOX (lb) Min PROC/Mach (ft/min) Climb Time (min) Approach Velocity (keas)
350131 4.65 47993 396491 55257 63633 8.46 1.278 9112 8.03 1736 500/2.40 67.0 138.6
353722 4.66 48424 400505 55207 63552 8.47 1.278 9123 8.03 1742 500/2.40 68.2 138.8
349871 4.62 46904 395252 54311 62170 8.34 1.277 8988 8.04 1612 500/2.40 75.3 138.1
353174 4.62 47302 398946 54280 62091 8.34 1.277 8991 8.04 1618 500/2.40 76.2 138.4
Economic Mission
TOGW (lb) Block Fuel (lb) Block Time (hr) L/D (Mid subcruise wt) TSFC (Mid subcruise wt, lb/hr/lb) RF (Mid subcruise wt, nm) L/D (Mid supercruise wt) TSFC (Mid supercruise wt, lb/hr/lb) RF (Mid supercruise wt, nm)
608099 220327 4.03 16.12 1.110 7601 8.46 1.282 9086
614393 222486 4.03 16.11 1.108 7613 8.47 1.282 9097
597741 216628 3.98 16.12 1.087 7763 8.31 1.280 8940
603740 218636 3.98 16.12 1.085 7779 8.32 1.280 8948
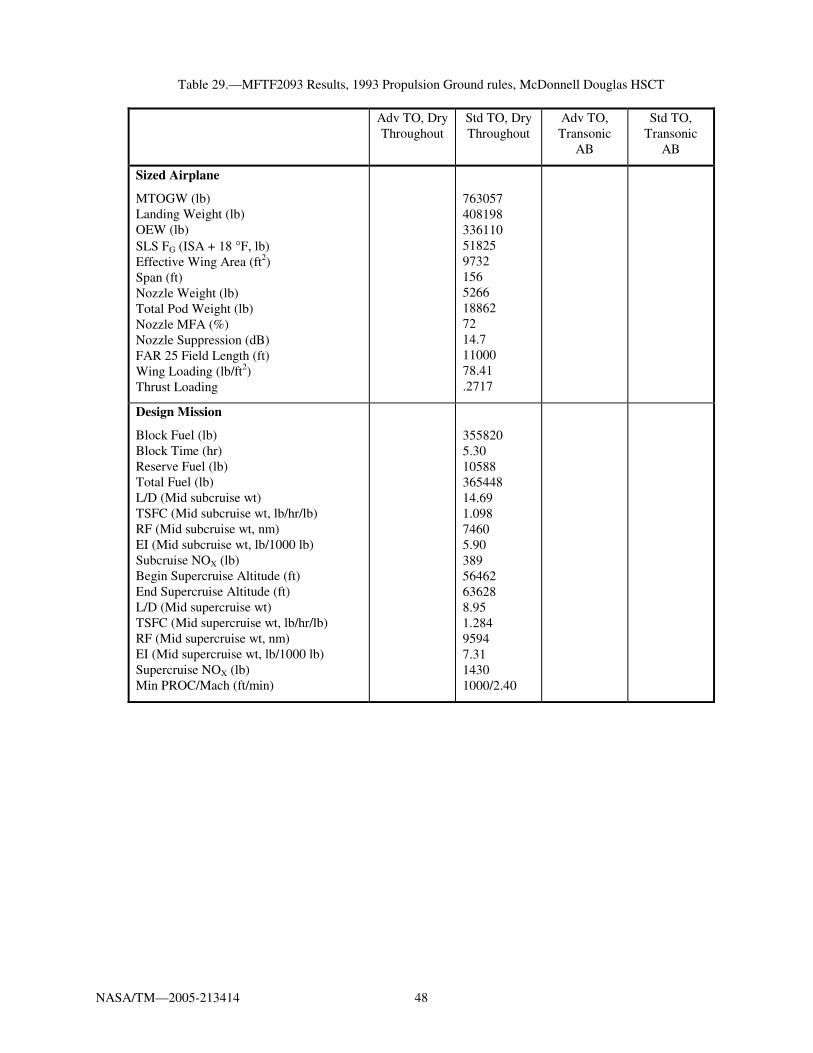
NASA/TM—2005-213414 48
Table 29.—MFTF2093 Results, 1993 Propulsion Ground rules, McDonnell Douglas HSCT
Adv TO, Dry Throughout
Std TO, Dry Throughout
Adv TO, Transonic
AB
Std TO, Transonic
AB
Sized Airplane
MTOGW (lb) Landing Weight (lb) OEW (lb) SLS FG (ISA + 18 °F, lb) Effective Wing Area (ft2) Span (ft) Nozzle Weight (lb) Total Pod Weight (lb) Nozzle MFA (%) Nozzle Suppression (dB) FAR 25 Field Length (ft) Wing Loading (lb/ft2) Thrust Loading
763057 408198 336110 51825 9732 156 5266 18862 72 14.7 11000 78.41 .2717
Design Mission
Block Fuel (lb) Block Time (hr) Reserve Fuel (lb) Total Fuel (lb) L/D (Mid subcruise wt) TSFC (Mid subcruise wt, lb/hr/lb) RF (Mid subcruise wt, nm) EI (Mid subcruise wt, lb/1000 lb) Subcruise NOX (lb) Begin Supercruise Altitude (ft) End Supercruise Altitude (ft) L/D (Mid supercruise wt) TSFC (Mid supercruise wt, lb/hr/lb) RF (Mid supercruise wt, nm) EI (Mid supercruise wt, lb/1000 lb) Supercruise NOX (lb) Min PROC/Mach (ft/min)
355820 5.30 10588 365448 14.69 1.098 7460 5.90 389 56462 63628 8.95 1.284 9594 7.31 1430 1000/2.40

NASA/TM—2005-213414 49
Table 30.—MFTF2094 Results, 1994 Propulsion Ground rules, Boeing HSCT
Adv TO, Dry Throughout
Std TO, Dry Throughout
Adv TO, Transonic
AB
Std TO, Transonic
AB
Sized Airplane
MTOGW (lb) Landing Weight (lb) OEW (lb) SLS FG (ISA + 18 °F, lb) Effective Wing Area (ft2) Span (ft) Nozzle Weight (lb) Total Pod Weight (lb) Nozzle MFA (%) Nozzle Suppression (dB) FAR 25 Field Length (ft) Wing Loading (lb/ft2) Thrust Loading
775769 417771 305059 50117 8023 138 4186 18054 30 7.8 10129 96.69 .2584
781013 420712 307704 50367 8058 138 4540 18481 70 15.2 10170 96.92 .2580
Design Mission
Block Fuel (lb) Block Time (hr) Reserve Fuel (lb) Total Fuel (lb) Begin Supercruise Altitude (ft) End Supercruise Altitude (ft) L/D (Mid supercruise wt) TSFC (Mid supercruise wt, lb/hr/lb) RF (Mid supercruise wt, nm) EI (Mid supercruise wt, lb/1000 lb) Supercruise NOX (lb) Min PROC/Mach (ft/min) Climb Time (min) Approach Velocity (keas)
359620 4.70 47822 405820 53578 61854 8.30 1.304 8760 5.77 1196 500/1.19 80.9 138.1
361931 4.70 48118 408419 53569 61826 8.30 1.304 8761 5.77 1201 500/1.19 81.3 138.2
Economic Mission
TOGW (lb) Block Fuel (lb) Block Time (hr) L/D (Mid subcruise wt) TSFC (Mid subcruise wt, lb/hr/lb) RF (Mid subcruise wt, nm) L/D (Mid supercruise wt) TSFC (Mid supercruise wt, lb/hr/lb) RF (Mid supercruise wt, nm)
606550 222148 4.05 16.13 1.078 7830 8.29 1.307 8732
610909 223626 4.05 16.13 1.077 7836 8.30 1.307 8743

NASA/TM—2005-213414 50
Table 31.—MFTF2094 Results, 1994 Propulsion Ground rules, McDonnell Douglas HSCT
Adv TO, Dry Throughout
Std TO, Dry Throughout
Adv TO, Transonic
AB
Std TO, Transonic
AB
Sized Airplane
MTOGW (lb) Landing Weight (lb) OEW (lb) SLS FG (ISA + 18 °F, lb) Effective Wing Area (ft2) Span (ft) Nozzle Weight (lb) Total Pod Weight (lb) Nozzle MFA (%) Nozzle Suppression (dB) FAR 25 Field Length (ft) Wing Loading (lb/ft2) Thrust Loading
768431 408544 336305 51430 9895 157 4334 18585 39 10.7 11000 77.66 .2977
780480 415578 343188 51897 10086 159 4821 19208 76 15.7 11000 77.38 .2660
Design Mission
Block Fuel (lb) Block Time (hr) Reserve Fuel (lb) Total Fuel (lb) L/D (Mid subcruise wt) TSFC (Mid subcruise wt, lb/hr/lb) RF (Mid subcruise wt, nm) EI (Mid subcruise wt, lb/1000 lb) Subcruise NOX (lb) Begin Supercruise Altitude (ft) End Supercruise Altitude (ft) L/D (Mid supercruise wt) TSFC (Mid supercruise wt, lb/hr/lb) RF (Mid supercruise wt, nm) EI (Mid supercruise wt, lb/1000 lb) Supercruise NOX (lb) Min PROC/Mach (ft/min)
360844 5.28 10739 370626 14.73 1.094 7508 5.99 397 55549 63238 8.92 1.318 9320 5.35 1096 1000/2.40
365868 5.28 10889 375792 14.78 1.093 7542 5.95 400 55458 63121 8.94 1.318 9339 5.35 1109 1000/2.40

NASA/TM—2005-213414 51
Table 32.—MFTF2193 Results, 1993 Propulsion Ground rules, Boeing HSCT
Adv TO, Dry Throughout
Std TO, Dry Throughout
Adv TO, Transonic
AB
Std TO, Transonic
AB
Sized Airplane
MTOGW (lb) Landing Weight (lb) OEW (lb) SLS FG (ISA + 18 °F, lb) Effective Wing Area (ft2) Span (ft) Nozzle Weight (lb) Total Pod Weight (lb) Nozzle MFA (%) Nozzle Suppression (dB) FAR 25 Field Length (ft) Wing Loading (lb/ft2) Thrust Loading
775058 423458 310276 53233 7943 137 4780 19353 30 6.2 9867 97.58 .2747
783545 428068 314430 53517 8000 138 5364 20018 69 15.0 9958 97.94 .2732
Design Mission
Block Fuel (lb) Block Time (hr) Reserve Fuel (lb) Total Fuel (lb) Begin Supercruise Altitude (ft) End Supercruise Altitude (ft) L/D (Mid supercruise wt) TSFC (Mid supercruise wt, lb/hr/lb) RF (Mid supercruise wt, nm) EI (Mid supercruise wt, lb/1000 lb) Supercruise NOX (lb) Min PROC/Mach (ft/min) Climb Time (min) Approach Velocity (keas)
353272 4.66 48291 399891 55139 63561 8.46 1.279 9102 5.14 1116 500/2.40 68.1 138.7
357157 4.67 48748 404225 55065 63456 8.46 1.279 9106 5.14 1120 500/2.40 69.4 139.0
Economic Mission
TOGW (lb) Block Fuel (lb) Block Time (hr) L/D (Mid subcruise wt) TSFC (Mid subcruise wt, lb/hr/lb) RF (Mid subcruise wt, nm) L/D (Mid supercruise wt) TSFC (Mid supercruise wt, lb/hr/lb) RF (Mid supercruise wt, nm)
612369 221932 4.03 16.12 1.104 7643 8.46 1.283 9079
619251 224314 4.04 16.12 1.101 7662 8.46 1.283 9084

NASA/TM—2005-213414 52
Table 33.—MFTF2293 Results, 1993 Propulsion Ground rules, Boeing HSCT
Adv TO, Dry Throughout
Std TO, Dry Throughout
Adv TO, Transonic
AB
Std TO, Transonic
AB
Sized Airplane
MTOGW (lb) Landing Weight (lb) OEW (lb) SLS FG (ISA + 18 °F, lb) Effective Wing Area (ft2) Span (ft) Nozzle Weight (lb) Total Pod Weight (lb) Nozzle MFA (%) Nozzle Suppression (dB) FAR 25 Field Length (ft) Wing Loading (lb/ft2) Thrust Loading
781170 427963 314236 53617 7973 137 4780 20115 30 6.1 9907 97.98 .2745
790483 431918 317808 53333 8050 138 5350 20599 71 15.1 10099 98.20 .2699
Design Mission
Block Fuel (lb) Block Time (hr) Reserve Fuel (lb) Total Fuel (lb) Begin Supercruise Altitude (ft) End Supercruise Altitude (ft) L/D (Mid supercruise wt) TSFC (Mid supercruise wt, lb/hr/lb) RF (Mid supercruise wt, nm) EI (Mid supercruise wt, lb/1000 lb) Supercruise NOX (lb) Min PROC/Mach (ft/min) Climb Time (min) Approach Velocity (keas)
354911 4.64 48837 402044 55276 63853 8.50 1.279 9149 5.12 1133 500/2.40 65.1 139.0
360261 4.67 49219 407784 55078 63527 8.48 1.279 9130 5.12 1117 500/2.40 70.4 139.1
Economic Mission
TOGW (lb) Block Fuel (lb) Block Time (hr) L/D (Mid subcruise wt) TSFC (Mid subcruise wt, lb/hr/lb) RF (Mid subcruise wt, nm) L/D (Mid supercruise wt) TSFC (Mid supercruise wt, lb/hr/lb) RF (Mid supercruise wt, nm)
618460 223574 4.03 16.12 1.104 7642 8.50 1.282 9125
624867 226178 4.04 16.12 1.098 7687 8.48 1.282 9106

NASA/TM—2005-213414 53
Table 34.—MFTF1093 Results, 1993 Propulsion Ground rules, Boeing HSCT
Adv TO, Dry Throughout
Std TO, Dry Throughout
Adv TO, Transonic
AB
Std TO, Transonic
AB
Sized Airplane
MTOGW (lb) Landing Weight (lb) OEW (lb) SLS FG (ISA + 18 °F, lb) Effective Wing Area (ft2) Span (ft) Nozzle Weight (lb) Total Pod Weight (lb) Nozzle MFA (%) Nozzle Suppression (dB) FAR 25 Field Length (ft) Wing Loading (lb/ft2) Thrust Loading
848853 457572 339788 59350 8545 142 5882 22589 30 3.9 10230 99.34 .2798
854460 460465 342409 59400 8583 143 6282 23005 55 13.1 10311 99.55 .2781
835693 455194 338230 58917 8388 141 5837 22944 30 3.9 10176 99.63 .2820
842248 459057 341698 59350 8428 141 6277 23516 55 13.0 10211 99.93 .2819
Design Mission
Block Fuel (lb) Block Time (hr) Reserve Fuel (lb) Total Fuel (lb) Begin Supercruise Altitude (ft) End Supercruise Altitude (ft) L/D (Mid supercruise wt) TSFC (Mid supercruise wt, lb/hr/lb) RF (Mid supercruise wt, nm) EI (Mid supercruise wt, lb/1000 lb) Supercruise NOX (lb) Min PROC/Mach (ft/min) Climb Time (min) Approach Velocity (keas)
392992 4.80 52894 444174 54753 62386 8.44 1.284 9046 8.53 1780 500/2.40 92.8 139.9
395708 4.81 53166 447161 54700 62267 8.44 1.284 9046 8.53 1775 500/2.40 94.3 140.1
382198 4.61 52073 432572 54412 62356 8.45 1.284 9058 8.53 1870 500/2.40 74.3 140.2
384902 4.61 52470 435660 54415 62355 8.46 1.284 9069 8.53 1884 500/2.40 74.2 140.4
Economic Mission
TOGW (lb) Block Fuel (lb) Block Time (hr) L/D (Mid subcruise wt) TSFC (Mid subcruise wt, lb/hr/lb) RF (Mid subcruise wt, nm) L/D (Mid supercruise wt) TSFC (Mid supercruise wt, lb/hr/lb) RF (Mid supercruise wt, nm)
670909 247254 4.12 16.10 1.114 7568 8.44 1.289 9015
675461 248984 4.13 16.10 1.111 7591 8.43 1.288 9007
661308 239829 3.97 16.09 1.118 7540 8.44 1.288 9019
666913 241650 3.97 16.08 1.117 7542 8.45 1.288 9029

NASA/TM—2005-213414 54
Table 35.—MFTF1093 Results, 1993 Propulsion Ground rules, McDonnell Douglas HSCT
Adv TO, Dry Throughout
Std TO, Dry Throughout
Adv TO, Transonic
AB
Std TO, Transonic
AB
Sized Airplane
MTOGW (lb) Landing Weight (lb) OEW (lb) SLS FG (ISA + 18 °F, lb) Effective Wing Area (ft2) Span (ft) Nozzle Weight (lb) Total Pod Weight (lb) Nozzle MFA (%) Nozzle Suppression (dB) FAR 25 Field Length (ft) Wing Loading (lb/ft2) Thrust Loading
825610 441370 368402 57483 10364 161 5970 22126 51 11.1 11000 79.66 .2785
Design Mission
Block Fuel (lb) Block Time (hr) Reserve Fuel (lb) Total Fuel (lb) L/D (Mid subcruise wt) TSFC (Mid subcruise wt, lb/hr/lb) RF (Mid subcruise wt, nm) EI (Mid subcruise wt, lb/1000 lb) Subcruise NOX (lb) Begin Supercruise Altitude (ft) End Supercruise Altitude (ft) L/D (Mid supercruise wt) TSFC (Mid supercruise wt, lb/hr/lb) RF (Mid supercruise wt, nm) EI (Mid supercruise wt, lb/1000 lb) Supercruise NOX (lb) Min PROC/Mach (ft/min)
385226 5.33 11468 395708 14.80 1.110 7432 5.81 415 55862 62868 9.07 1.293 9657 8.28 1694 1000/2.40

NASA/TM—2005-213414 55
Table 36.—MFTF1094 Results, 1994 Propulsion Ground rules, Boeing HSCT
Adv TO, Dry Throughout
Std TO, Dry Throughout
Adv TO, Transonic
AB
Std TO, Transonic
AB
Sized Airplane
MTOGW (lb) Landing Weight (lb) OEW (lb) SLS FG (ISA + 18 °F, lb) Effective Wing Area (ft2) Span (ft) Nozzle Weight (lb) Total Pod Weight (lb) Nozzle MFA (%) Nozzle Suppression (dB) FAR 25 Field Length (ft) Wing Loading (lb/ft2) Thrust Loading
840372 451218 334102 58383 8508 142 5223 21686 30 4.1 9946 98.77 .2779
842971 452278 335053 58300 8528 142 5376 21814 53 12.8 9998 98.85 .2766
Design Mission
Block Fuel (lb) Block Time (hr) Reserve Fuel (lb) Total Fuel (lb) Begin Supercruise Altitude (ft) End Supercruise Altitude (ft) L/D (Mid supercruise wt) TSFC (Mid supercruise wt, lb/hr/lb) RF (Mid supercruise wt, nm) EI (Mid supercruise wt, lb/1000 lb) Supercruise NOX (lb) Min PROC/Mach (ft/min) Climb Time (min) Approach Velocity (keas)
390854 4.74 52226 441381 53302 61241 8.33 1.318 8700 6.01 1310 500/1.20 87.5 139.6
392390 4.75 52335 443028 53250 61122 8.32 1.318 8690 6.01 1306 500/1.07 88.9 139.6
Economic Mission
TOGW (lb) Block Fuel (lb) Block Time (hr) L/D (Mid subcruise wt) TSFC (Mid subcruise wt, lb/hr/lb) RF (Mid subcruise wt, nm) L/D (Mid supercruise wt) TSFC (Mid supercruise wt, lb/hr/lb) RF (Mid supercruise wt, nm)
660679 243478 4.08 16.11 1.096 7693 8.30 1.321 8650
662566 244343 4.08 16.11 1.094 7708 8.29 1.321 8638

NASA/TM—2005-213414 56
Table 37.—MFTF1094 Results, 1994 Propulsion Ground rules, McDonnell Douglas HSCT
Adv TO, Dry Throughout
Std TO, Dry Throughout
Adv TO, Transonic
AB
Std TO, Transonic
AB
Sized Airplane
MTOGW (lb) Landing Weight (lb) OEW (lb) SLS FG (ISA + 18 °F, lb) Effective Wing Area (ft2) Span (ft) Nozzle Weight (lb) Total Pod Weight (lb) Nozzle MFA (%) Nozzle Suppression (dB) FAR 25 Field Length (ft) Wing Loading (lb/ft2) Thrust Loading
824335 436635 363564 57947 10294 160 5182 21516 30 7.7 11000 80.08 .2812
831195 440547 367389 58192 10407 161 5430 21848 57 13.5 11000 79.87 .2800
Design Mission
Block Fuel (lb) Block Time (hr) Reserve Fuel (lb) Total Fuel (lb) L/D (Mid subcruise wt) TSFC (Mid subcruise wt, lb/hr/lb) RF (Mid subcruise wt, nm) EI (Mid subcruise wt, lb/1000 lb) Subcruise NOX (lb) Begin Supercruise Altitude (ft) End Supercruise Altitude (ft) L/D (Mid supercruise wt) TSFC (Mid supercruise wt, lb/hr/lb) RF (Mid supercruise wt, nm) EI (Mid supercruise wt, lb/1000 lb) Supercruise NOX (lb) Min PROC/Mach (ft/min)
388709 5.30 11570 399270 14.78 1.096 7515 5.59 394 54700 62267 8.99 1.341 9228 5.85 1269 1000/2.40
391661 5.30 11659 402306 14.80 1.095 7534 5.59 396 54652 62184 9.00 1.341 9237 5.85 1276 1000/2.40

NASA/TM—2005-213414 57
Table 38.—MFTF1193 Results, 1993 Propulsion Ground rules, Boeing HSCT
Adv TO, Dry Throughout
Std TO, Dry Throughout
Adv TO, Transonic
AB
Std TO, Transonic
AB
Sized Airplane
MTOGW (lb) Landing Weight (lb) OEW (lb) SLS FG (ISA + 18 °F, lb) Effective Wing Area (ft2) Span (ft) Nozzle Weight (lb) Total Pod Weight (lb) Nozzle MFA (%) Nozzle Suppression (dB) FAR 25 Field Length (ft) Wing Loading (lb/ft2) Thrust Loading
852451 460382 342248 59483 8558 142 5870 23090 30 3.9 10012 99.61 .2791
857833 463245 344839 59583 8593 143 6257 23508 54 12.8 10080 99.83 .2778
Design Mission
Block Fuel (lb) Block Time (hr) Reserve Fuel (lb) Total Fuel (lb) Begin Supercruise Altitude (ft) End Supercruise Altitude (ft) L/D (Mid supercruise wt) TSFC (Mid supercruise wt, lb/hr/lb) RF (Mid supercruise wt, nm) EI (Mid supercruise wt, lb/1000 lb) Supercruise NOX (lb) Min PROC/Mach (ft/min) Climb Time (min) Approach Velocity (keas)
393798 4.79 53244 445313 54804 62428 8.45 1.283 9069 5.14 1097 500/1.07 89.8 140.1
396321 4.80 53516 448104 54768 62327 8.45 1.283 9071 5.14 1095 500/1.07 91.1 140.3
Economic Mission
TOGW (lb) Block Fuel (lb) Block Time (hr) L/D (Mid subcruise wt) TSFC (Mid subcruise wt, lb/hr/lb) RF (Mid subcruise wt, nm) L/D (Mid supercruise wt) TSFC (Mid supercruise wt, lb/hr/lb) RF (Mid supercruise wt, nm)
674743 248296 4.11 16.11 1.116 7557 8.44 1.287 9029
679292 250035 4.12 16.09 1.113 7571 8.44 1.287 9030

NASA/TM—2005-213414 58
Table 39.—MFTF1293 Results, 1993 Propulsion Ground rules, Boeing HSCT
Adv TO, Dry Throughout
Std TO, Dry Throughout
Adv TO, Transonic
AB
Std TO, Transonic
AB
Sized Airplane
MTOGW (lb) Landing Weight (lb) OEW (lb) SLS FG (ISA + 18 °F, lb) Effective Wing Area (ft2) Span (ft) Nozzle Weight (lb) Total Pod Weight (lb) Nozzle MFA (%) Nozzle Suppression (dB) FAR 25 Field Length (ft) Wing Loading (lb/ft2) Thrust Loading
861224 464079 345376 58733 8633 143 5768 23528 30 3.9 10252 99.76 .2728
868978 469128 349879 59617 8675 143 6253 24293 55 13.0 10233 100.17 .2744
Design Mission
Block Fuel (lb) Block Time (hr) Reserve Fuel (lb) Total Fuel (lb) Begin Supercruise Altitude (ft) End Supercruise Altitude (ft) L/D (Mid supercruise wt) TSFC (Mid supercruise wt, lb/hr/lb) RF (Mid supercruise wt, nm) EI (Mid supercruise wt, lb/1000 lb) Supercruise NOX (lb) Min PROC/Mach (ft/min) Climb Time (min) Approach Velocity (keas)
398871 4.81 53813 450958 54679 62222 8.44 1.285 9047 5.11 1085 500/1.21 92.7 140.2
401603 4.80 54359 454209 54747 62372 8.47 1.285 9071 5.11 1108 500/2.40 90.5 140.5
Economic Mission
TOGW (lb) Block Fuel (lb) Block Time (hr) L/D (Mid subcruise wt) TSFC (Mid subcruise wt, lb/hr/lb) RF (Mid subcruise wt, nm) L/D (Mid supercruise wt) TSFC (Mid supercruise wt, lb/hr/lb) RF (Mid supercruise wt, nm)
681374 251356 4.13 16.09 1.112 7575 8.43 1.289 9006
688315 253321 4.12 16.08 1.115 7555 8.45 1.289 9028

NASA/TM—2005-213414 59
Table 40.—VCE701510 Results, 1993 Propulsion Ground rules, Boeing HSCT
Adv TO, Dry Throughout
Std TO, Dry Throughout
Adv TO, Transonic
AB
Std TO, Transonic
AB
Sized Airplane
MTOGW (lb) Landing Weight (lb) OEW (lb) SLS FG (ISA + 18 °F, lb) Effective Wing Area (ft2) Span (ft) Bare Engine Weight (lb) Nozzle Weight (lb) Total Pod Weight (lb) Nozzle MFA (%) Nozzle Suppression (dB) FAR 25 Field Length (ft) Wing Loading (lb/ft2) Thrust Loading
714108 384193 273193 44250 7610 134 6043 3341 13738 52 12.3 10299 93.84 .2479
732155 394224 282137 44933 7735 135 6142 4613 15179 127 19.1 10487 94.65 .2455
718794 386288 275022 44250 7648 135 6288 3341 13983 52 12.3 10382 93.98 .2462
737021 395840 283525 44567 7785 136 6336 4574 15296 127 19.1 10644 94.67 .2419
Design Mission
Block Fuel (lb) Block Time (hr) Reserve Fuel (lb) Total Fuel (lb) Begin Supercruise Altitude (ft) End Supercruise Altitude (ft) L/D (Mid supercruise wt) TSFC (Mid supercruise wt, lb/hr/lb) RF (Mid supercruise wt, nm) EI (Mid supercruise wt, lb/1000 lb) Supercruise NOX (lb) Min PROC/Mach (ft/min) Climb Time (min) Approach Velocity (keas)
331726 4.52 46110 376025 55250 64446 8.40 1.326 8720 8.54 1850 500/2.40 52.7 136.0
339770 4.53 47196 385128 55142 64283 8.41 1.326 8734 8.53 1876 500/2.40 54.3 136.6
334316 4.50 46375 378881 55123 64332 8.40 1.326 8717 8.54 1859 500/2.40 51.8 136.1
343005 4.52 47425 388606 54899 64001 8.39 1.326 8715 8.54 1864 500/2.40 55.7 136.6
Economic Mission
TOGW (lb) Block Fuel (lb) Block Time (hr) L/D (Mid subcruise wt) TSFC (Mid subcruise wt, lb/hr/lb) RF (Mid subcruise wt, nm) L/D (Mid supercruise wt) TSFC (Mid supercruise wt, lb/hr/lb) RF (Mid supercruise wt, nm)
555597 204632 3.94 16.12 1.095 7706 8.40 1.329 8703
570460 209704 3.95 16.14 1.094 7727 8.41 1.329 8716
559216 206221 3.93 16.12 1.094 7713 8.40 1.329 8700
573730 211432 3.94 16.13 1.091 7740 8.39 1.328 8695

NASA/TM—2005-213414 60
Table 41.—VCE703010 Results, 1993 Propulsion Ground rules, Boeing HSCT
Adv TO, Dry Throughout
Std TO, Dry Throughout
Adv TO, Transonic
AB
Std TO, Transonic
AB
Sized Airplane
MTOGW (lb) Landing Weight (lb) OEW (lb) SLS FG (ISA + 18 °F, lb) Effective Wing Area (ft2) Span (ft) Bare Engine Weight (lb) Nozzle Weight (lb) Total Pod Weight (lb) Nozzle MFA (%) Nozzle Suppression (dB) FAR 25 Field Length (ft) Wing Loading (lb/ft2) Thrust Loading
732242 394931 281680 46033 7745 135 6403 3593 14841 40 10.0 10279 94.54 .2515
749371 403216 289101 45917 7878 137 6387 4721 15939 119 18.5 10606 95.12 .2451
737154 396224 282839 45400 7798 136 6582 3549 14906 43 10.5 10488 94.53 .2464
754079 404400 290154 45300 7930 137 6567 4655 15985 119 18.5 10812 95.09 .2403
Design Mission
Block Fuel (lb) Block Time (hr) Reserve Fuel (lb) Total Fuel (lb) Begin Supercruise Altitude (ft) End Supercruise Altitude (ft) L/D (Mid supercruise wt) TSFC (Mid supercruise wt, lb/hr/lb) RF (Mid supercruise wt, nm) EI (Mid supercruise wt, lb/1000 lb) Supercruise NOX (lb) Min PROC/Mach (ft/min) Climb Time (min) Approach Velocity (keas)
339104 4.54 48361 385671 54920 63842 8.38 1.314 8781 8.95 1919 500/2.40 58.0 136.5
347944 4.56 49225 395380 54659 63341 8.36 1.314 8761 8.96 1893 500/2.40 64.6 136.9
342698 4.52 48495 389425 54644 63429 8.35 1.314 8750 8.96 1889 500/2.40 60.4 136.5
351443 4.55 49356 399035 54425 62929 8.33 1.313 8731 8.96 1856 500/2.40 67.3 136.9
Economic Mission
TOGW (lb) Block Fuel (lb) Block Time (hr) L/D (Mid subcruise wt) TSFC (Mid subcruise wt, lb/hr/lb) RF (Mid subcruise wt, nm) L/D (Mid supercruise wt) TSFC (Mid supercruise wt, lb/hr/lb) RF (Mid supercruise wt, nm)
575724 213797 3.95 16.13 1.194 7072 8.38 1.317 8760
588461 218487 3.96 16.14 1.183 7145 8.36 1.316 8742
578526 215393 3.94 16.13 1.185 7126 8.35 1.317 8730
591079 220006 3.94 16.14 1.174 7195 8.33 1.316 8712

NASA/TM—2005-213414 61
Table 42.—VCE706520 Results, 1993 Propulsion Ground rules, Boeing HSCT
Adv TO, Dry Throughout
Std TO, Dry Throughout
Adv TO, Transonic
AB
Std TO, Transonic
AB
Sized Airplane
MTOGW (lb) Landing Weight (lb) OEW (lb) SLS FG (ISA + 18 °F, lb) Effective Wing Area (ft2) Span (ft) Bare Engine Weight (lb) Nozzle Weight (lb) Total Pod Weight (lb) Nozzle MFA (%) Nozzle Suppression (dB) FAR 25 Field Length (ft) Wing Loading (lb/ft2) Thrust Loading
778601 420824 306244 52317 8045 138 7613 4264 18343 30 6.2 9971 96.78 .2688
790722 427558 312253 52833 8130 139 7692 5075 19300 81 16.1 10076 97.26 .2673
783294 423385 308552 52317 8080 138 7985 4264 18715 30 6.2 10047 96.94 .2672
795525 430327 314761 52883 8160 139 8076 5113 19728 82 16.1 10151 97.49 .2659
Design Mission
Block Fuel (lb) Block Time (hr) Reserve Fuel (lb) Total Fuel (lb) Begin Supercruise Altitude (ft) End Supercruise Altitude (ft) L/D (Mid supercruise wt) TSFC (Mid supercruise wt, lb/hr/lb) RF (Mid supercruise wt, nm) EI (Mid supercruise wt, lb/1000 lb) Supercruise NOX (lb) Min PROC/Mach (ft/min) Climb Time (min) Approach Velocity (keas)
359592 4.61 49689 407467 54104 61959 8.31 1.299 8804 10.73 2134 500/2.40 79.7 138.1
364997 4.61 50414 413579 54099 61853 8.32 1.299 8815 10.73 2136 500/2.40 81.7 138.5
361724 4.54 49942 409852 53960 61810 8.31 1.299 8805 10.74 2152 500/2.40 75.7 138.3
367032 4.55 50676 415874 53926 61721 8.32 1.299 8816 10.73 2172 500/2.40 76.6 138.6
Economic Mission
TOGW (lb) Block Fuel (lb) Block Time (hr) L/D (Mid subcruise wt) TSFC (Mid subcruise wt, lb/hr/lb) RF (Mid subcruise wt, nm) L/D (Mid supercruise wt) TSFC (Mid supercruise wt, lb/hr/lb) RF (Mid supercruise wt, nm)
607211 220347 3.98 16.13 1.037 8150 8.30 1.304 8764
617185 223746 3.99 16.13 1.036 8156 8.31 1.304 8771
611139 221764 3.94 16.13 1.036 8155 8.29 1.303 8753
621338 225162 3.94 16.13 1.035 8161 8.31 1.303 8771

NASA/TM—2005-213414 62
Table 43.—VCE708020 Results, 1993 Propulsion Ground rules, Boeing HSCT
Adv TO, Dry Throughout
Std TO, Dry Throughout
Adv TO, Transonic
AB
Std TO, Transonic
AB
Sized Airplane
MTOGW (lb) Landing Weight (lb) OEW (lb) SLS FG (ISA + 18 °F, lb) Effective Wing Area (ft2) Span (ft) Bare Engine Weight (lb) Nozzle Weight (lb) Total Pod Weight (lb) Nozzle MFA (%) Nozzle Suppression (dB) FAR 25 Field Length (ft) Wing Loading (lb/ft2) Thrust Loading
846074 453224 330983 57267 8623 143 8606 4906 20929 30 5.2 10090 98.12 .2707
856848 459009 336131 57667 8695 144 8669 5601 21741 72 14.9 10191 98.54 .2692
Design Mission
Block Fuel (lb) Block Time (hr) Reserve Fuel (lb) Total Fuel (lb) Begin Supercruise Altitude (ft) End Supercruise Altitude (ft) L/D (Mid supercruise wt) TSFC (Mid supercruise wt, lb/hr/lb) RF (Mid supercruise wt, nm) EI (Mid supercruise wt, lb/1000 lb) Supercruise NOX (lb) Min PROC/Mach (ft/min) Climb Time (min) Approach Velocity (keas)
396104 4.66 57351 450201 54105 61795 8.37 1.302 8849 11.07 2298 500/2.40 86.6 139.1
401116 4.67 57988 455827 54103 61686 8.38 1.302 8859 11.07 2290 500/2.40 89.0 139.4
Economic Mission
TOGW (lb) Block Fuel (lb) Block Time (hr) L/D (Mid subcruise wt) TSFC (Mid subcruise wt, lb/hr/lb) RF (Mid subcruise wt, nm) L/D (Mid supercruise wt) TSFC (Mid supercruise wt, lb/hr/lb) RF (Mid supercruise wt, nm)
664291 246861 4.01 16.12 1.072 7872 8.36 1.304 8825
672924 249867 4.01 16.11 1.070 7884 8.37 1.304 8832

NASA/TM—2005-213414 63
Table 44.—F193 Results, 1993 Propulsion Ground rules, Boeing HSCT
Adv TO, Dry, 10% Oversize
Sized Airplane
MTOGW (lb) Landing Weight (lb) OEW (lb) SLS FG (ISA + 18 °F, lb) Effective Wing Area (ft2) Span (ft) Total Pod Weight (lb) FAR 25 Field Length (ft) Wing Loading (lb/ft2) Thrust Loading
748373 402409 293082 55569 7813 136 16286 8764 95.79 .2970
Design Mission
Block Fuel (lb) Block Time (hr) Reserve Fuel (lb) Total Fuel (lb) Begin Supercruise Altitude (ft) End Supercruise Altitude (ft) L/D (Mid supercruise wt) TSFC (Mid supercruise wt, lb/hr/lb) RF (Mid supercruise wt, nm) EI (Mid supercruise wt, lb/1000 lb) Supercruise NOX (lb) Min PROC/Mach (ft/min) Climb Time (min) Approach Velocity (keas)
347998 4.47 44448 390401 56059 65701 8.54 1.348 8719 7.51 1853 500/2.40 39.1 137.4
Economic Mission
TOGW (lb) Block Fuel (lb) Block Time (hr) L/D (Mid subcruise wt) TSFC (Mid subcruise wt, lb/hr/lb) RF (Mid subcruise wt, nm) L/D (Mid supercruise wt) TSFC (Mid supercruise wt, lb/hr/lb) RF (Mid supercruise wt, nm)
582545 213831 3.94 16.14 1.026 8239 8.54 1.352 8698

NASA/TM—2005-213414 64
Table 45.—AIV222, AIV216, AIV209, AIV202 Results, 1993 Propulsion Ground rules, Boeing HSCT
AIV222 AIV216 AIV209 AIV202
Sized Airplane
MTOGW (lb) Landing Weight (lb) OEW (lb) SLS FG (ISA + 18 °F, lb) Effective Wing Area (ft2) Span (ft) Total Pod Weight (lb) FAR 25 Field Length (ft) Wing Loading (lb/ft2) Thrust Loading
778344 417097 304563 43667 8063 138 17023 9891 96.53 .2244
757651 406812 296159 41267 7898 137 16059 10132 95.93 .2179
751757 403385 293107 39783 7858 136 15668 10524 95.67 .2117
745472 400645 290770 39033 7803 136 15443 10859 95.54 .2094
Design Mission
Block Fuel (lb) Block Time (hr) Reserve Fuel (lb) Total Fuel (lb) Begin Supercruise Altitude (ft) End Supercruise Altitude (ft) L/D (Mid supercruise wt) TSFC (Mid supercruise wt, lb/hr/lb) RF (Mid supercruise wt, nm) EI (Mid supercruise wt, lb/1000 lb) Supercruise NOX (lb) Min PROC/Mach (ft/min) Climb Time (min) Approach Velocity (keas)
368716 4.56 47644 408891 54015 62103 8.31 1.337 8555 7.47 1519 500/2.40 77.9 138.0
351902 4.56 45762 396601 54010 62185 8.29 1.337 8532 7.15 1430 500/2.40 77.0 137.5
349550 4.54 45388 393760 54034 62340 8.29 1.338 8528 7.45 1503 500/2.40 73.4 137.3
346158 4.55 44985 389812 53960 62702 8.29 1.339 8520 6.79 1397 500/2.40 71.1 137.2
Economic Mission
TOGW (lb) Block Fuel (lb) Block Time (hr) L/D (Mid subcruise wt) TSFC (Mid subcruise wt, lb/hr/lb) RF (Mid subcruise wt, nm) L/D (Mid supercruise wt) TSFC (Mid supercruise wt, lb/hr/lb) RF (Mid supercruise wt, nm)
603471 225967 3.94 15.50 1.023 7819 8.30 1.340 8529
585896 212120 3.94 15.54 1.025 7829 8.28 1.340 8505
580931 210637 3.93 15.56 1.027 7817 8.28 1.341 8503
575886 208435 3.94 15.57 1.030 7806 8.29 1.342 8507

NASA/TM—2005-213414 65
Table 46.—AIV196, AIV189, AIV181, AIV139 Results, 1993 Propulsion Ground rules, Boeing HSCT
AIV196 AIV189 AIV181 AIV139
Sized Airplane
MTOGW (lb) Landing Weight (lb) OEW (lb) SLS FG (ISA + 18 °F, lb) Effective Wing Area (ft2) Span (ft) Total Pod Weight (lb) FAR 25 Field Length (ft) Wing Loading (lb/ft2) Thrust Loading
739387 397224 287585 37250 7763 136 15052 10922 95.25 .2015
737166 396418 286904 36883 7738 135 15027 11000 95.27 .2001
728173 394366 285221 36567 7635 134 15111 11000 95.37 .2009
869077 456572 337396 45417 8835 145 20893 11000 98.37 .2090
Design Mission
Block Fuel (lb) Block Time (hr) Reserve Fuel (lb) Total Fuel (lb) Begin Supercruise Altitude (ft) End Supercruise Altitude (ft) L/D (Mid supercruise wt) TSFC (Mid supercruise wt, lb/hr/lb) RF (Mid supercruise wt, nm) EI (Mid supercruise wt, lb/1000 lb) Supercruise NOX (lb) Min PROC/Mach (ft/min) Climb Time (min) Approach Velocity (keas)
343264 4.55 44749 386912 54287 62878 8.32 1.343 8523 7.37 1516 500/2.40 69.9 137.0
341909 4.54 44624 385373 54652 63560 8.37 1.344 8571 7.07 1513 500/2.40 63.0 137.0
335060 4.50 44255 378062 54735 64534 8.44 1.349 8615 6.69 1469 500/2.40 54.2 137.1
414091 4.73 54286 466790 57599 66736 8.62 1.371 8656 5.23 1361 500/2.40 65.5 139.3
Economic Mission
TOGW (lb) Block Fuel (lb) Block Time (hr) L/D (Mid subcruise wt) TSFC (Mid subcruise wt, lb/hr/lb) RF (Mid subcruise wt, nm) L/D (Mid supercruise wt) TSFC (Mid supercruise wt, lb/hr/lb) RF (Mid supercruise wt, nm)
570974 206658 3.94 15.59 1.037 7758 8.31 1.345 8504
570271 206736 3.94 15.57 1.037 7754 8.37 1.347 8557
564790 203209 3.93 15.56 1.048 7662 8.45 1.351 8610
669397 247961 4.00 15.46 1.071 7452 8.62 1.373 8641

NASA/TM—2005-213414 66
TakeoffCruise
Figure 1.—Turbojet
TakeoffCruise
Figure 2.—Turbine Bypass Engine
TakeoffCruise
Figure 3.—Mixed Flow Turbofan
TakeoffCruise
Figure 4.—Variable Cycle Engine

NASA/TM—2005-213414 67
TakeoffCruise
Figure 5.—Flade Engine
TakeoffCruise
Figure 6.—Turbojet/Inverting Flow Valve Engine
TakeoffCruise
Figure 7.—Turbofan/Inverting Flow Valve Engine

NASA/TM—2005-213414 68
η
M∞
0.91
0.92
0.93
0.94
0.95
0.96
0.97
0.98
0.99
0 0.5 1.5 2.5
1.00
0.901.0 2.0
Figure 8.—Reference matched inlet recovery
M∞
0
1
2
3
4
5
0 0.5 1.5 2.5
AO
/AC
1.0 2.0
Figure 9.—Reference matched AO/AC

NASA/TM—2005-213414 69
η
0.92
0.94
0.96
0.98
0 0.5 1.5 2.5 3.5
M∞0.100.200.300.400.600.801.001.211.411.50
AO/A
C
(Symbols indicate match point locations)
1.00
0.901.0 2.0 3.0 4.0
Figure 10.—Additional unmatched recoveries, 0.10 ≤ M∞ ≤ 1.50
M∞
00 0.5 1.5 2.5
C
C
1.0 2.0
Ref: A
DSP
0.010
0.015
0.020
0.025
0.030
0.035
Figure 11.—Reference spillage drag

NASA/TM—2005-213414 70
M∞
0
0.2
0.4
0.6
0.8
1.2
0 0.2 0.4 0.6 0.8
C
AOi
/AC
0.40
0.20
0.60
0.80
1.001.21
1.411.50
C
(Additional C = 0 for M ∞ > 1.50)1.0
1.0
Ref: A
DSP
DSP
Figure 12.—Additional unmatched spillage drags
0
0.1
0.2
0.3
0.4
0.5
0 0.5 1.5 2.5
M∞
10
CDβ
14
12
108
4
1.0 2.0 3.0
β = 16
Ref: A
Figure 13.—2D nozzle boattail drag coefficients, A9/A10 = 0.25

NASA/TM—2005-213414 71
0
0.1
0.2
0.3
0.4
0.5
0 0.5 1.5 2.5
M∞
10
CDβ
1412
108
4
1.0 2.0 3.0
β = 16
Ref: A
Figure 14.—2D nozzle boattail drag coefficients, A9/A10 = 0.50
0
0.1
0.2
0.3
0.4
0.5
0 0.5 1.5 2.5M∞
10
CDβ
141210
4
1.0 2.0 3.0
β= 16
Ref: A
Figure 15.—2D nozzle boattail drag coefficients, A9/A10 = 0.75

NASA/TM—2005-213414 72
20
40
60
80
100
120
140
1500 2000 2500 3000 3500VJP (ft/s)
MFA (%)
Figure 16.—1993, 1994 mixer-ejector nozzle MFA severity model
180
200
220
240
260
280
300
30 40 50 60 70 80 90 100 110 120 130 140MFA (%)
3.03.5
4.0
4.55.0
LNoz
(in)
Ref:w
corr = 650 lb/s (SLS)
°F):NPR (M0.3, 689 ft, ISA+18
Figure 17.—1993 mixer-ejector nozzle length model

NASA/TM—2005-213414 73
170
180
190
200
210
220
230
240
250
30 40 50 60 70 80 90 100 110 120 130 140MFA (%)
3.03.54.04.55.0
LNoz
(in)
Ref:w
corr = 650 lb/s (SLS)
A9 = 3500 in 2 (Cruise)
°F):NPR (M0.3, 689 ft, ISA+18
Figure 18.—1994 mixer-ejector nozzle length model
5000
5200
5400
5600
5800
6000
6200
6400
30 40 50 60 70 80 90 100 110 120 130 140MFA (%)
3.03.5
4.0
4.5
5.0A10
(in2)
Ref:w
corr = 650 lb/s (SLS)
A9 = 3500 in 2 (Cruise)
°F):NPR (M0.3, 689 ft, ISA+18
Figure 19.—1993, 1994 mixer-ejector nozzle A10 model

NASA/TM—2005-213414 74
MFA (%)
3000
3500
4000
4500
5000
5500
6000
30 40 50 60 70 80 90 100 110 120 130 140
3.03.5
4.0
4.55.0
W (lb)
Ref:w
corr = 650 lb/s (SLS)
° F):NPR (M0.3, 689 ft, ISA+18Noz
Figure 20.—1993 mixer-ejector nozzle weight model
MFA (%)
3000
3500
4000
4500
5000
5500
6000
30 40 50 60 70 80 90 100 110 120 130 140
3.03.54.04.55.0
W (lb)
Ref:w
corr = 650 lb/s (SLS)
A9 = 3500 in 2 (Cruise)
°F):NPR (M0.3, 689 ft, ISA+18
Noz
Figure 21.—1994 mixer-ejector nozzle weight model

NASA/TM—2005-213414 75
0.975
0.985
15 20 25 30
NPR (M2.4, 60000 ft)
CV
0.990
0.980
0.970
Figure 22.—1993, 1994 mixer-ejector nozzle thrust coefficient model (ejector stowed)
Figure 23.—Boeing HSCT Configuration 1080-924

NASA/TM—2005-213414 76
Figure 24.—McDonnell Douglas HSCT Configuration D-3235-2.4-7A

NASA/TM—2005-213414 77
40
42
44
46
48
50
7500 8000 8500 9000
2Effective Wing Area (ft )
SLS Thrust per Engine (1000 lb)
.
745725 klb 765 785 805
FuelVolume
Field Length
DesignPoint
MTOGW:
Figure 25.—Aircraft sizing “thumbprint” - 1993 TBE3010 on Boeing HSCT

NASA/TM—2005-213414 78
300
280
260
240
220
200700 800 900
Maximum Takeoff Gross Weight (klb)
OEW LessPropulsion
Weight (klb) W/S (lb/ft ):2
80
90
100110
Ref:
PodW = 18464 lb
.
750 850
Figure 26.—Boeing HSCT operating empty weight scaling relationship
Maximum Takeoff Gross Weight (klb)
OEW LessPropulsionWeight (klb)
W/S (lb/ft ):2
Ref:
Pod
70
80
90
100
300
280
240
260
220
200700 800 900
.
W = 15219 lb
750 850
Figure 27.—McDonnell Douglas HSCT operating empty weight scaling relationship

NASA/TM—2005-213414 79
0
2
4
6
8
10
12
14
16
18
0 0.1 0.2 0.3
W2
Ref:S = 8180 ft
Mach:
L/D
C L
0.600.900.950.981.001.051.101.301.501.802.102.40
Figure 28.—Boeing HSCT aerodynamics
0
2
4
6
8
10
12
14
16
0 0.1 0.2 0.3
Ref:S = 9500 ftW
2
L/D
CL
Mach:
0.950.700.500.301.001.101.201.301.401.802.002.40
Figure 29.—McDonnell Douglas HSCT aerodynamics

NASA/TM—2005-213414 80
10 MinTaxi
Climb to BestCruise Altitude Descent
5 MinTaxi
Flight Profile Reserve Mission
Trip Fuel
Block Time and Fuel
30 Min Hold (15000 ft,Best Endurance Mach)
Contingency(6% Trip Fuel)
Payload: 309 PAX @ 64890 lb
.
2 MinTakeoff
2.1 MinApproach
5000 nm
Mach 2.4 Climbing Cruise
260 nm Cruise(M0.9, 37800 ft)
Figure 30.—Boeing HSCT design mission
10 MinTaxi
Climb to BestCruise Altitude
Descent
5 MinTaxi
Flight Profile Reserve Mission
Trip Fuel
Block Time and Fuel
30 Min Hold (15000 ft,Best Endurance Mach)
Contingency(6% Trip Fuel)
Cruise(M0.9, 33000 ft)
Payload: 201 PAX @ 42179 lb
2 MinTakeoff
2.1 MinApproach
Mach 2.4 Climbing Cruise
600 nm
3436 nm
260 nm Cruise(M0.9, 37800 ft)
Figure 31.—Boeing HSCT economic mission

NASA/TM—2005-213414 81
Climb to BestCruise Altitude
Descent
Flight Profile Reserve Mission
Trip Fuel
Block Time and Fuel
Contingency(3% Block Fuel)
12 MinTaxi
6 MinTaxi
Payload: 300 PAX @ 61500 lb
Cruise(M0.95, 31000 ft)
5000 NM + Winds;5186 NM ESAD
1.7 MinTakeoff
4 MinApproach
Mach 2.4 Climbing Cruise
827 nmESAD
200 nm Cruise(M0.95, 39000 ft)
Figure 32.—McDonnell Douglas HSCT design mission
0
10000
20000
30000
40000
50000
60000
70000
0 0.5 1.5 2.5
Climb
Descent
Altitude (ft)
M∞
1.0 2.0
Figure 33.—Boeing HSCT climb and descent trajectories

NASA/TM—2005-213414 82
Climb
Descent
Altitude (ft)
M∞
0
10000
20000
30000
40000
50000
60000
70000
0 0.5 1.5 2.51.0 2.0
Figure 34.—McDonnell Douglas HSCT climb and descent trajectories
450 m(1476 ft)
6500 m(21 325 ft)
2000 m(6562 ft)
SidelineReference
CommunityReference
ApproachReference
Figure 35.—Noise measurement arrangement

NASA/TM—2005-213414 83
0
300
600
900
1200
1500
0 10000 20000 30000 40000.
100
90
80
70
60
50
Altitude (ft)
Standard
Advanced
Ground RunDerate
Lapse
LapseRate
Advanced
Standard
Distance from Brake Release (ft)
19000 ft Cutback Point
ThrottleSetting
(% Max SLSNet Thrust)
Figure 36.—Standard and advanced takeoff profiles for the 1993 TBE3010 Boeing HSCT

NASA/TM—2005-213414 84
80
90
100
110
120
130
80
90
100
110
120
130
0 20 40 60 80 100 120Observer Time (s)
Standard Takeoff
Advanced Takeoff
Community Noise
Community Noise
Sideline Noise
Sideline Noise
Figure 37: Takeoff noise traces for the 1993 TBE3010 Boeing HSCT
PNLT (PNdB)
PNLT (PNdB)

NASA/TM—2005-213414 85
Thrust Lapse Rate (%/s)
ThrustLapse (%)
9.5 EPNdB
10.0
10.5
11.0
11.5
12.0
12.5
13.0
13.5
14.0
14.5
.
60
65
70
75
80
85
1 2 3 4 5 6 7 8 9 10
Figure 38.—Sideline noise suppression required - programmed lapse rate maneuver for the 1993 TBE3010 Boeing HSCT with three percent ground roll thrust derate

NASA/TM—2005-213414 86
60
65
70
75
80
85
1 2 3 4 5 6 7 8 9 10
Thrust Lapse Rate (%/s)
ThrustLapse (%)
13.5 EPNdB
14.0
14.5
15.0
15.5
16.0
16.5
17.0
17.5
18.0
.
Figure 39.—Community noise suppression required - programmed lapse rate maneuver for the 1993 TBE3010 Boeing HSCT with three percent ground roll thrust derate

NASA/TM—2005-213414 87
60
65
70
75
80
85
1 2 3 4 5 6 7 8 9 10
Thrust Lapse Rate (%/s)
ThrustLapse (%)
1
2
3
45
68
7
9
14.5
15.0
15.5
16.0
16.5
17.0
17.5
18.0
18.5
19.0
14.0 EPNdB
14.5
15.0
Figure 40.—Overall noise suppression required - programmed lapse rate maneuver for the 1993 TBE3010 Boeing HSCT with three percent ground
roll thrust derate showing optimization path

NASA/TM—2005-213414 88
= 0
RefinedMixer-Ejector
Nozzle
Motsinger-Sieckman JetNoise Model
Mission andSizing Analysis
≠ 0
Standard orAdvanced Takeoff
Analysis
Observer/AircraftGeometry and
Propagation Effects
NoiseSuppression
Required
Sized Aircraft:Standard Takeoff orAdvanced Takeoff
Baseline EnginePerformance and
Weight Model
Baseline AircraftPerformance and
Weight Model
Figure 41.—Analysis flowpath for propulsion systems with mixer-ejector nozzles

NASA/TM—2005-213414 89
= 0
Motsinger-Sieckman JetNoise Model
Mission andSizing Analysis
≠ 0
Observer/AircraftGeometry and
Propagation Effects
NoiseSuppression
Required
Baseline EnginePerformance and
Weight Model
Baseline AircraftPerformance and
Weight Model
RefinedEngine Size
Advanced TakeoffAnalysis
Sized Aircraft:Advanced Takeoff
Figure 42.—Analysis flowpath for Flade propulsion systems

NASA/TM—2005-213414 90
0
3
6
9
12
15
1200 1400 1600 1800 2000 2200 2400 2600
Mixed Flade/Primary Jet Velocity (ft/s)
NoiseSuppressionRelative toConvergentNozzle (dB)
Figure 43.—Flade nozzle noise suppression capability
700
710
720
730
740
750
760
770
780
790
800
2800 3000 3200 3400 3600.
Dry TJ3010, Std TO
Dry TJ3010, Adv TO
TBEs
°Design CET ( R)
Std TO:
Adv TO:MTOGW
(klb)
ABDry
ABDry
Figure 44.—1993 Turbojet and Turbine Bypass Engine Boeing HSCT gross weights: Influence of design combustor exit temperature and transonic afterburning

NASA/TM—2005-213414 91
700
710
720
730
740
750
760
770
780
790
800
10 12 14 16 18 20Suppression Required (dB)
.
Dry TJ3010, Std TO
Dry TJ3010, Adv TO
MTOGW(klb)
TBEs, Adv TOABDry
TBEs, Std TOABDry
Figure 45.—1993 Turbojet and Turbine Bypass Engine Boeing HSCT gross weights: Influence of noise constraint and transonic afterburning
700
720
740
760
780
800
820
840
860
880
900
0 0.2 0.4 0.6 0.8 1 1.2 1.4
Standard Takeoff
MTOGW(klb)
3360
3210
3110
°Maximum T ( R):41
SLS Bypass Ratio
Figure 46.—1993 Dry Mixed Flow Turbofan Boeing HSCT gross weights: Influence of bypass ratio and maximum turbine inlet temperature

NASA/TM—2005-213414 92
700
720
740
760
780
800
820
840
860
880
900
0 0.2 0.4 0.6 0.8 1 1.2 1.4
Advanced Takeoff
MTOGW(klb)
3360
3210
3110
°Maximum T ( R):41
SLS Bypass Ratio
Figure 47.—1993 Dry Mixed Flow Turbofan Boeing HSCT gross weights: Influence of bypass ratio and maximum turbine inlet temperature
Advanced Takeoff
MTOGW(klb)
700
720
740
760
780
800
820
840
860
880
900
2 4 6 8 10 12 14 16 18 20 22Suppression Required (dB)
Standard Takeoff
.
33603210
3110
3110
32103360
MaximumT ( R):
41
MaximumT ( R):
41 °
°
Figure 48.—1993 Dry Mixed Flow Turbofan Boeing HSCT gross weights: Influence of noise constraint and maximum turbine inlet temperature

NASA/TM—2005-213414 93
MTOGW(klb)
700
720
740
760
780
800
820
840
860
880
900
0 0.2 0.4 0.6 0.8 1 1.2 1.4
Dry
Advanced Takeoff, Maximum T = 3360 R41 °
SLS Bypass Ratio
AB
Figure 49.—1993 Mixed Flow Turbofan Boeing HSCT gross weights: Influence of bypass ratio and transonic afterburning
MTOGW(klb)
700
720
740
760
780
800
820
840
860
880
900
0 0.2 0.4 0.6 0.8 1 1.2 1.4
19941993
Advanced TakeoffMaximum T = 3360 R (1993)Maximum T = 3260 R (1994)41
41 °°
SLS Bypass Ratio
Figure 50.—Dry Mixed Flow Turbofan Boeing HSCT gross weights: Influence of bypass ratio and propulsion ground rules

NASA/TM—2005-213414 94
MTOGW(klb)
700
720
740
760
780
800
820
840
860
880
900
0 0.2 0.4 0.6 0.8 1 1.2 1.4
Boeing
McDonnell Douglas
Boeing
McDonnell Douglas
Standard Takeoff, Maximum T = 3260 R41 °
SLS Bypass Ratio
Figure 51.—1994 Dry Mixed Flow Turbofan gross weights: Influence of bypass ratio and aircraft
MTOGW(klb)
Boeing
McDonnell Douglas
Boeing
McDonnell Douglas
700
720
740
760
780
800
820
840
860
880
900
0 0.2 0.4 0.6 0.8 1 1.2 1.4
Advanced Takeoff, Maximum T = 3260 R41 °
SLS Bypass Ratio
Figure 52.—1994 Dry Mixed Flow Turbofan gross weights: Influence of bypass ratio and aircraft

NASA/TM—2005-213414 95
MTOGW(klb)
Boeing
McDonnell Douglas
Boeing
McDonnell Douglas
700
720
740
760
780
800
820
840
860
880
900
2 4 6 8 10 12 14 16 18 20 22
Advanced Takeoff Standard Takeoff
Suppression Required (dB)
Maximum T = 3260 R41 °
Figure 53.—1994 Dry Mixed Flow Turbofan gross weights: Influence of noise constraint, takeoff procedure, and aircraft
MTOGW(klb)
700
720
740
760
780
800
820
840
860
880
900
0 0.2 0.4 0.6 0.8 1
Adv TO
Std TO
Dry
SLS Bypass Ratio
Transonic AB
Figure 54.—1993 Variable Cycle Engine Boeing HSCT gross weights: Influence of bypass ratio and transonic afterburning

NASA/TM—2005-213414 96
MTOGW(klb)
Dry
Suppression Required (dB)
700
720
740
760
780
800
820
840
860
880
900
2 4 6 8 10 12 14 16 18 20 22
Dry
Advanced Takeoff Standard Takeoff
AB
AB
Figure 55.—1993 Variable Cycle Engine Boeing HSCT gross weights: Influence of noise constraint and transonic afterburning
MTOGW(klb)
700
720
740
760
780
800
820
840
860
880
900
0 0.1 0.2 0.3 0.4 0.5Low-Flow SLS Bypass Ratio
TJ/IFV
TF/IFVs
Figure 56.—1993 Inverting Flow Valve Boeing HSCT gross weights: Influence of low-flow mode bypass ratio

NASA/TM—2005-213414 97
0
100
200
300
400
500
600
700
800
TBE MFTF VCE Flade TF/IFV
Weight(klb)
MTOGW
DesignBlockFuel
EconomicBlockFuel
Figure 57.—Maximum takeoff gross weight, design mission block fuel, and economic mission block fuel comparison: 1993 cycle ground rules, advanced takeoff, Boeing HSCT
TBE MFTF VCE
Weight(klb)
0
100
200
300
400
500
600
700
800
MTOGW
DesignBlockFuel
EconomicBlockFuel
Figure 58.—Maximum takeoff gross weight, design mission block fuel, and economic mission block fuel comparison: 1993 cycle ground rules, standard takeoff, Boeing HSCT

NASA/TM—2005-213414 98
TBE MFTF VCE Flade TF/IFV0
1
2
3
4
5
6
7
8
9
x
EI (lb/klb)
or
Specific NO(klb/Seat-nm)
x Specific
NO
EI
Figure 59.—Emissions index and specific NOX comparison: 1993 cycle ground rules, advanced takeoff, Boeing HSCT
0
1
2
3
4
5
6
7
8
9
TBE MFTF VCE
x
EI (lb/klb)
or
Specific NO(klb/Seat-nm)
x Specific
NO
EI
Figure 60.—Emissions index and specific NOX comparison: 1993 cycle ground rules, standard takeoff, Boeing HSCT

NASA/TM—2005-213414 99
700
710
720
730
740
750
760
770
780
1000 1200 1400 1600 1800 2000
MTOGW(klb)
Cruise NO (lb)X
33093202
3489
3489
3321
.
3210
2990°°MFTF
Design T ( R):
TBEDesign T ( R):
4
4
Figure 61.—Achieving lower emissions by lowering T4 (1993 TBEs 3010, 3021, 3031, 3041, and 1993 MFTFs 5093, 5193, 4293, standard takeoff, Boeing HSCT)

This publication is available from the NASA Center for AeroSpace Information, 301–621–0390.
REPORT DOCUMENTATION PAGE
2. REPORT DATE
19. SECURITY CLASSIFICATION OF ABSTRACT
18. SECURITY CLASSIFICATION OF THIS PAGE
Public reporting burden for this collection of information is estimated to average 1 hour per response, including the time for reviewing instructions, searching existing data sources,gathering and maintaining the data needed, and completing and reviewing the collection of information. Send comments regarding this burden estimate or any other aspect of thiscollection of information, including suggestions for reducing this burden, to Washington Headquarters Services, Directorate for Information Operations and Reports, 1215 JeffersonDavis Highway, Suite 1204, Arlington, VA 22202-4302, and to the Office of Management and Budget, Paperwork Reduction Project (0704-0188), Washington, DC 20503.
NSN 7540-01-280-5500 Standard Form 298 (Rev. 2-89)Prescribed by ANSI Std. Z39-18298-102
Form Approved
OMB No. 0704-0188
12b. DISTRIBUTION CODE
8. PERFORMING ORGANIZATION REPORT NUMBER
5. FUNDING NUMBERS
3. REPORT TYPE AND DATES COVERED
4. TITLE AND SUBTITLE
6. AUTHOR(S)
7. PERFORMING ORGANIZATION NAME(S) AND ADDRESS(ES)
11. SUPPLEMENTARY NOTES
12a. DISTRIBUTION/AVAILABILITY STATEMENT
13. ABSTRACT (Maximum 200 words)
14. SUBJECT TERMS
17. SECURITY CLASSIFICATION OF REPORT
16. PRICE CODE
15. NUMBER OF PAGES
20. LIMITATION OF ABSTRACT
Unclassified Unclassified
Technical Memorandum
Unclassified
National Aeronautics and Space AdministrationJohn H. Glenn Research Center at Lewis FieldCleveland, Ohio 44135–3191
1. AGENCY USE ONLY (Leave blank)
10. SPONSORING/MONITORING AGENCY REPORT NUMBER
9. SPONSORING/MONITORING AGENCY NAME(S) AND ADDRESS(ES)
National Aeronautics and Space AdministrationWashington, DC 20546–0001
Available electronically at http://gltrs.grc.nasa.gov
February 2005
NASA TM—2005-213414
E–14934
WBS–22–714–09–46
105
A Comparative Propulsion System Analysis for the High-Speed Civil Transport
Jeffrey J. Berton, William J. Haller, Paul F. Senick, Scott M. Jones,and Jonathan A. Seidel
Jet propulsion; Supersonic aircraft; Turbine engines; Aircraft engines; Aircraft noise;Noise prediction-aircraft
Unclassified -UnlimitedSubject Category: 07 Distribution: Nonstandard
This research was originally published internally as HSR007 in October 1995. Responsible person, Jeffrey J. Berton,organization code PBA, 216–977–7031.
Six of the candidate propulsion systems for the High-Speed Civil Transport are the turbojet, turbine bypass engine,mixed flow turbofan, variable cycle engine, Flade engine, and the inverting flow valve engine. A comparison of thesepropulsion systems by NASA's Glenn Research Center, paralleling studies within the aircraft industry, is presented.This report describes the Glenn Aeropropulsion Analysis Office's contribution to the High-Speed Research Program's1993 and 1994 propulsion system selections. A parametric investigation of each propulsion cycle's primary designvariables is analytically performed. Performance, weight, and geometric data are calculated for each engine. Theresulting engines are then evaluated on two airframer-derived supersonic commercial aircraft for a 5000 nautical mile,Mach 2.4 cruise design mission. The effects of takeoff noise, cruise emissions, and cycle design rules are examined.

