a comparative analysis of energy use …agritrop.cirad.fr/553489/1/document_553489.pdf · marpaung...
TRANSCRIPT

A COMPARATIVE ANALYSIS OF ENERGY USE PATTERNS IN SMALL AND LARGE SCALE IRRIGATED RICE FARMING
SYSTEMS: A CASE STUDY IN AYUTTHAYA PROVINCE IN THE CENTRAL REGION OF THAILAND
By
Asmat Ullah
A research study submitted in partial fulfillment of the requirements for the degree of Master of Science in
Natural Resources Management
Examination Committee: Dr. Sylvain Roger Perret (Chairperson) Dr. Charles Marpaung (Member) Dr. Peeyush Soni (Member)
Nationality: Previous Degree:
Scholarship Donor:
Pakistani Bachelor of Science (Honours) in Agri. Economics University of Agriculture, Faisalabad, Pakistan Higher Education Commission (HEC), Pakistan - AIT Fellowship
Asian Institute of Technology School of Environment, Resources and Development
Thailand December 2009

ii
Acknowledgements
The author wishes to express his deepest gratitude and respect to his advisor, Associate Professor, Dr. Sylvain Roger Perret for his in depth supervision and invaluable guidance throughout this study. The author would like to extend his profound gratitude to Dr. Charles Marpaung and Dr. Peeyush Soni for their invaluable suggestions, continued support and serving as committee member. The author is grateful to the Higher Education Commission (HEC) of Pakistan for providing the financial support and Asian Institute of Technology (AIT) for providing him the opportunity to learn and enabling him to pursue his studies at this institute. The author express his deepest respect and gratitude to the government officers for providing data, the local leaders and especially to the farmers in the study area for their kind cooperation during the survey in the field. The author is grateful to his beloved parents, brother, sisters, wife and daughter for their sacrifices, endless love, and all support they have given.

iii
Abstract
Rice is not only the staple food of many countries but it is also a source of earning of millions of people. In Thailand, rice farming is the major source of income of the farmers which is highly dependent on the energy inputs. There is a complex relationship between energy use pattern and rice yield. This study was performed to examine the energy use pattern of the rice growers depending upon the size of the farms and its relationship the crop production in the Ayutthaya province in central region of Thailand. Its subjects are the field practices, technology use and chemical inputs. Information was collected through the field survey. Results shows that mean energy output-input ratio of small farmers is higher with low specific energy and high energy productivity than the large farmers. Energy ratio is 8.20 in small farms, 7.00 in medium farms and 6.02 in large farms.
Key words: Rice, Energy use patterns, Energy ratio

iv
Table of Contents Chapter Title Page Title page i Acknowledgement ii Abstract iii Table of contents iv List of tables v List of figures vi 1 Introduction 1 1.1 Background of the study 1 1.2 Problem statement 2 1.3 Research questions 4 1.4 Objectives of study 4 1.5 Scope and limitations of study 4 1.6 Conceptual Framework 6 2 Literature Review 7 2.1 Energy inputs and energy coefficient of inputs in rice
production 7
2.2 Direct energy inputs 8 2.3 Human labour 8 2.4 Draft animal 8 2.5 Mechanical power 8 2.6 Indirect energy inputs 8 2.7 Physical energy 10 2.8 Chemical energy 10 2.9 Biological energy 10 2.10 Energy coefficients of output 10 2.11 Energy output-input ratio 11 3 Methodology 13 3.1. Selection of study area 13 3.2 Data collection and selection of the respondents 14 3.3 Energy requirements and conversion factor 14 3.4 Human labour energy 14 3.5 Mechanical energy 15 3.6 Fertilizer energy 15 3.7 Seed energy 16 3.8 Pesticides, herbicides and other chemical energy inputs 16 3.9 Rice production energy equivalent 16 3.10 Energy ratio 16 3.11 Analysis of energy consumption and energy output 16

v
4 Results and Discussions 18 4.1 General 18 4.2 Land holding and rice planted area 18 4.3 Farm mechanization and labour 19 4.4 Land preparation 19 4.5 Animal draft 20 4.6 Planting 20 4.7 Plant protection measures 21 4.8 Irrigation 22 4.9 Fertilizer application 23 4.10 Harvesting 23 4.11 Estimation of energy inputs from different sources to
irrigated rice farming 24
4.12 Physical, chemical and biological energy consumption in field operation
24
4.13 Major energy consumption as per farm types 26 4.14 Physical energy consumption 27 4.15 Chemical energy input composition 29 4.16 Biological energy input 30 4.17 Energy output as per farmer types 30 4.18 Output - Input ratio of rice as per farmer types 31 4.19 Specific energy and energy productivity of rice as per
farmer types 32
4.20 Comparison of energy output – input ratio with international research
33
5 Conclusions and Recommendations 35 5.1 Conclusions 35 5.2 Recommendations 36 References 37 Appendices 40
vi
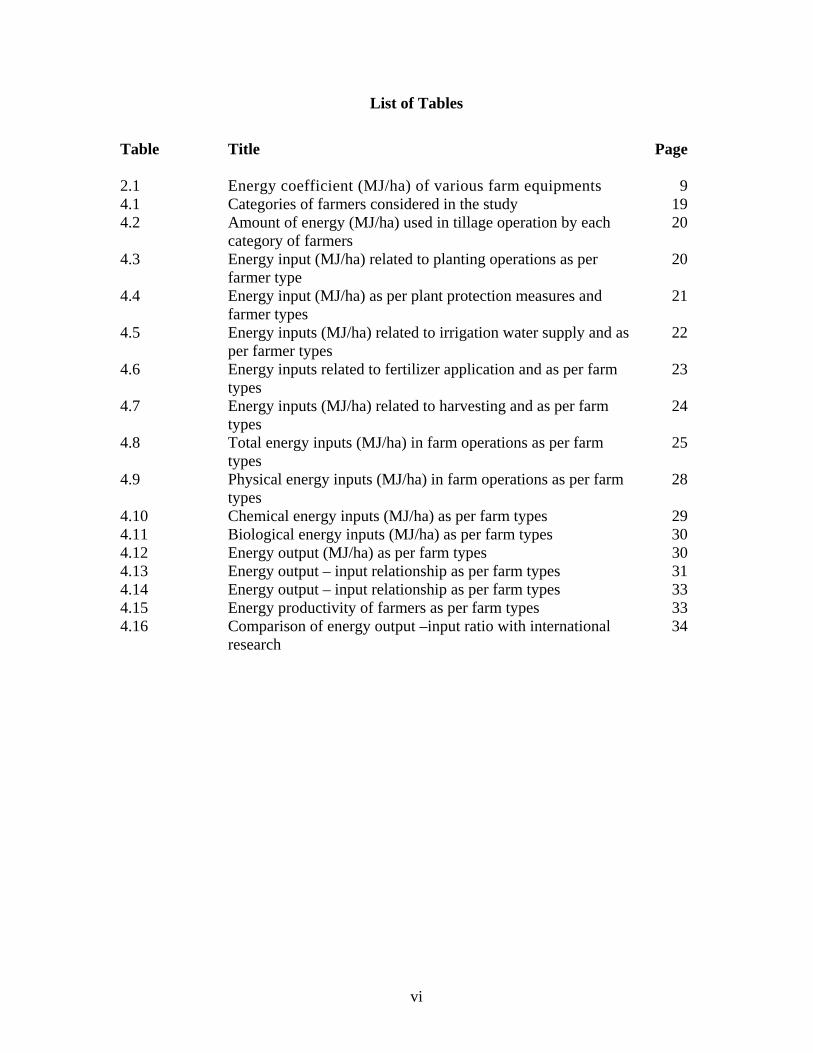
List of Tables
Table Title Page 2.1 Energy coefficient (MJ/ha) of various farm equipments 94.1 Categories of farmers considered in the study 194.2 Amount of energy (MJ/ha) used in tillage operation by each
category of farmers 20
4.3 Energy input (MJ/ha) related to planting operations as per farmer type
20
4.4
Energy input (MJ/ha) as per plant protection measures and farmer types
21
4.5 Energy inputs (MJ/ha) related to irrigation water supply and as per farmer types
22
4.6 Energy inputs related to fertilizer application and as per farm types
23
4.7 Energy inputs (MJ/ha) related to harvesting and as per farm types
24
4.8 Total energy inputs (MJ/ha) in farm operations as per farm types
25
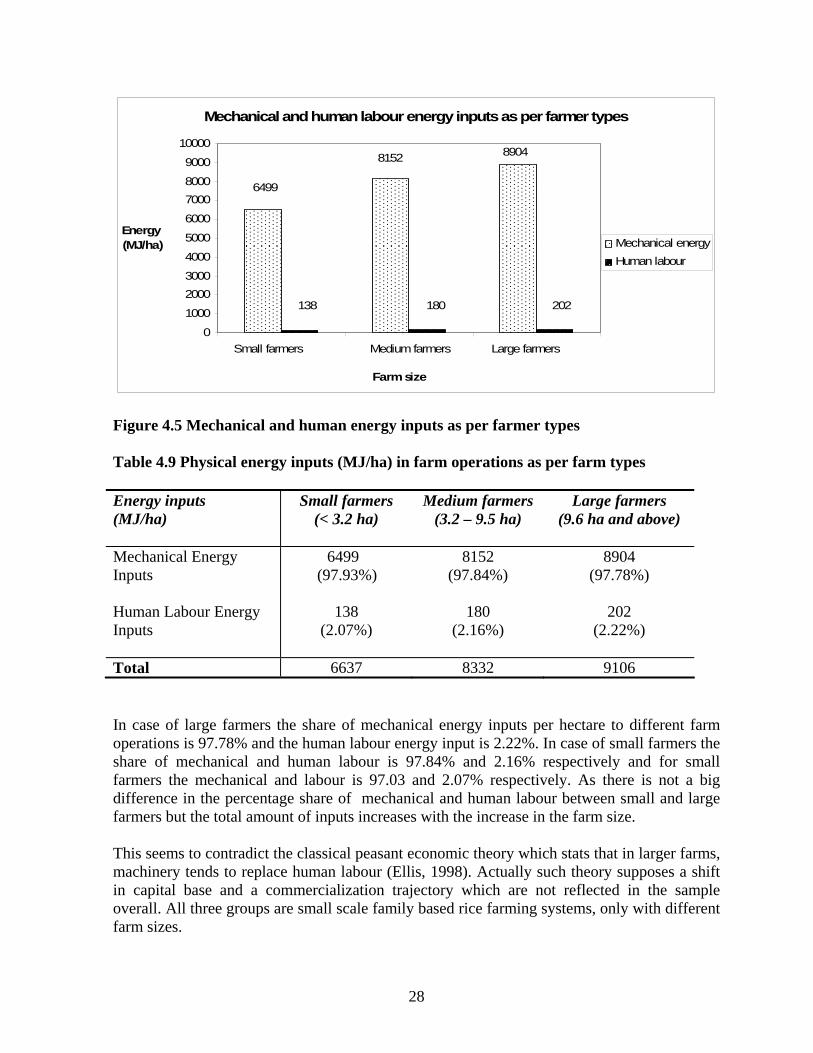
4.9 Physical energy inputs (MJ/ha) in farm operations as per farm types
28
4.10 Chemical energy inputs (MJ/ha) as per farm types 294.11 Biological energy inputs (MJ/ha) as per farm types 304.12 Energy output (MJ/ha) as per farm types 304.13 Energy output – input relationship as per farm types 314.14 Energy output – input relationship as per farm types 334.15 Energy productivity of farmers as per farm types 334.16 Comparison of energy output –input ratio with international
research 34

vii
List of Figures Figure Title Page 1.1 Energy flow from factors to rice product 63.1 Location of the study area 134.1 Physical, chemical and biological energy inputs as per farmer
types 25
4.2 Commercial and non-commercial energy consumption of small farmers
26
4.3 Commercial and non-commercial energy consumption of medium farmer
26
4.4 Commercial and non-commercial energy consumption of large farmer
27
4.5 Mechanical and human energy inputs as per farmer types 284.6 Chemical energy inputs as per farmer types 294.7 Comparison of energy ratio as per farmer types 31

1
Chapter 1
Introduction
1.1 Background of the study
Thailand is located in South East Asia with total area about 51 million hectares and generally it is divided into four geographical regions named as north, northeast, central and south regions. Total population of Thailand is about 62 millions. The labour force of the country is about 56.3 percent of the total population of the country. Out of the total labour force about 40.7 percent is engaged in agriculture (NSO, 2006).
Agriculture is contributing 10 percent to the total Gross Domestic Product (GDP) of the country. The export of Thailand is contributing about 60 percent to the GDP and the share of agriculture into the export earning is about 22 percent. The rice and the natural rubber are the main agricultural export commodities of Thailand (OAE, 2006). The demand for the fertilizers and pesticides inputs to the agriculture is mainly being fulfilled from the imports. 10 percent of the total imports are being used in agriculture as inputs. The main inputs that are being imported for agriculture purposes are the chemical fertilizers, chemical pesticides and animal feeds. In term of land use rice, maize, sugarcane, cassava, mungbean and soybean are the important crop commodities of the country. (OAE, 2005).
Agriculture sector plays a key role in Thailand economy. It provides employment to the rural people, food supply and food self sufficiency to the country, and also a source of foreign earnings. About 40 percent of the land area is under agriculture. The average land holding is about 3.7 hectares per household (OAE, 2005).
Rice is a very important food crop and it feed almost half of the population of the world. It is a source of earnings for millions of the people engaged in the production, processing and trading of the rice and related commodities. It is the need of the time to develop sustainable rice based cropping system in order to eradicate the poverty and hunger from the world and to conserve the resources needed for the production as well as the environment for present and for future generations (FAO, 2004). There are multiple outputs from the rice farming besides the paddy rice. The paddy rice and straw are the economic desirable commodity output. However, there are some other non commodity desirable outputs from the rice farming like food security, rural employment as well as the cultural and traditional conservation. It also generates undesirable outputs in the farm of Green House Gases (GHGs) emissions (Matsuno et al., 2006).
Rice farming is a dominant rural economic as well as culturally important activity in rural Thailand. It is a very important crop of Thailand as it is the staple food for the people of the country. It is the source of the employment and thus income for rural people of the country and is also a source of the foreign earning as Thailand is the world biggest rice producer and exporter.
Rice is cultivated in all the provinces of Thailand. The area under the rice crop is about the half of the total agricultural land (10.4 million hectares). In Thailand 80 percent of the irrigated area is under the rice crop (OAE, 2005). Out of the total area under rice, 57 percent are located in the northeast region. However 22 percent of rice is grown in the northern region,

2
17 percent in the central region and 4 percent in the southern region. Main land use for agriculture at regional level is under rice farming except southern region, where rubber is dominant. At regional level the area under rice farming is 49%, 65%, 40% and 14% in northern, northeast, central and southern regions respectively (OAE, 2005).
Rice farming in the country is not only important for food security point of view but it also provide the employment opportunities to the people. Different economic, social and environmental constraints are being faced by the rice growers of the country. The agriculture practices evolve along with the scarce production factors. The development of the irrigation sector was evolved when the scarcity of water was realized. During the green revolution era the chemical fertilizers and pesticides and other plant protection products were widely used. At present, the use alternate energy sources and the efficient energy use is being focused. The current high rate of energy expenditure through out the world related to many factors like urbanization, population growth and the resource consumption trend. However, the energy consumption rate is faster then the population growth rate. In many developed countries the proportion of energy uses in food production ranges from 15 to 30% and the share of human energy are little (Pimentel and Pimentel., 2008).
The shortage of the fossil fuels and the price hike, as the fossil fuels are running out, are the main driving forces to change the present trend of energy use. But in absolute term the use of fossil fuels is increasing and still there is a high dependency on the fossil fuels in order to ensure high productivity in the developing world, and the same is true for Thailand. The negative environmental impacts in the farm of greenhouse gases emissions i.e. Carbon dioxide (CO2), Methane (CH4) and Nitrous Oxides (N2O) are the focus point of the recent debate of climate change and global warming.
Rice farming is highly dependent on the flood irrigation and application of organic fertilizers. The flooded condition generate methane gas emission while excessive used of nitrogen fertilizers cause the emission of nitrous oxide and leaching down of nitrate. The magnitude of these environmental impacts and energy use in different forms varies depending upon the farm management practices, soil properties, and agro-ecosystem conditions (Choudhury and Kennedy., 2005).
In order to increase the rice production to fulfill the food requirement of the population the fossil fuels, fertilizers and chemicals as well as irrigation water is being intensively used in line with the green revolution pillars. In most of the developing countries major energy expenditure is human labour Pimentel and Pimentel (2008) and the same is true in case of Thailand where the rice farms are not mechanized rice. Main source of labour supply to the agriculture sector of the country is the rice farming community. At present out of 17.8 millions households in Thailand, 5.8 millions are engaged with agriculture (NSO, 2006). Out of 5.8 million agricultural households 2.6 millions household are from the northeast region and 1.4 million in the north region. In the central and southern regions both have the same share i.e. 0.9 million each in total agricultural households.
1.2 Problem statement
Rice is a very important farming activity of Thailand and about half of the agricultural land of the country is under the rice crop (OAE, 2005). The production of the paddy rice is about 27 million metric tons. The actual average rice yield of Thailand is 2.6 tones per hectare, however

3
the potential yield is about 5.3 tons per ha (Roy and Misra., 2003). It means that the yield gap is almost double of the present yield. The reasons of this gap may be caused by different physical factors such as temperature, pattern of rainfall, floods, salinity and low fertility, biological factors like different verities of rice, insect and pest attack, diseases and weed and socioeconomic factors i.e. farmers knowledge related to management of farm, input use, cost of production and the institutions involved (Choudhary et al., 2002). It means that in Thailand there is a huge gap between the actual yield per hectare and the potential yield per hectare that needs a substantial production improvement to bridge the gap.
Rice production system in Thailand is divided into two agro ecosystems i.e. irrigated and rainfed. Most of the irrigated rice fields are situated in the central region and the main rainfed area is situated in the northeast region. Depending upon the availability of the irrigation water the numbers of rice crop per year vary from region to region. In irrigated areas three crops of rice are grown per year, however in the non-irrigated areas rice crop is cultivated twice a year (Chaichana et al., 2008).
Irrigated rice production play a very important role in the economy of the country. The productivity of the rice heavily relies on the improved management practices as well as on farm production inputs such as irrigation water, fertilizers, pesticides, human and animal labour, farm machinery, and electricity and fossils fuels. However the modern production technologies and practices heavily dependent on the tremendous use of fossil fuels that created many concerns for the sustainable use of the energy resources (Deike et al., 2008).
The increase in the productivity of any factor of production is not possible only through the improved management practices of that particular input but it depends on improved management practices of all other inputs. The modern mechanized production systems heavily dependent on the fossil fuel, commercial fertilizers and other chemicals. The heavy reliance on the fossil fuel in the crop production system raised many concerns and the growth and stability of world food production would face a potential threat if the use of fossil fuel will have the same increasing trend (Deike et al., 2008).
The energy efficiency in the rice crop cultivation depends upon the socioeconomic condition of the farmers, mode of irrigation, availability of the commercial and non-commercial energy resources as well as the policies of the government. The growing demand of the food products and the increasing trend of the use of commercial inputs are inevitable.
To meet the increasing demand of the growing population as well as to earn the foreign exchange by exporting the rice the productivity of land, labour as well as other farm inputs need to be increased at substantial and sustainable level that needs the best management practices and increased use of energy to the food production system. In addition to that the cost of energy resources is going to increase. Therefore, it is needed to assess the consumption pattern of energy in the production systems of rice in order to understand the current situation of energy use in the irrigated rice production.
Considering inputs and outputs of rice production system, inputs of rice production can be categorized into conventional and non-conventional inputs. The conventional inputs consist of land, labors, machines, and seed, while non-conventional inputs comprise chemical fertilizers and chemical pesticides and fossil fuels. Mostly the farmers focus the productivity of the factors of production without considering the energy use efficiency. Therefore an assessment

4
of consumption pattern of over all energy in production system, especially mechanical and chemical energy is required at small scale in order to understand the detail picture at local level is required. Keeping in view these facts the following questions are tried to be answered through this research.
1.3 Research questions
1. What is the pattern of present energy consumption in the existing rice production system between small, medium and large farmers (soil preparation, cultural and management practices) in Thailand?
2. What is the magnitude of energy consumption, output-input ratio and productivity of the energy consumed?
1.4 Objectives of the study
The general objective of this study is to assess the pattern of energy inputs used by small medium and large categories of farmers and to compare the energy output-input ratio of each category of farmers. The specific objectives are:
1. To identify and document main energy requiring in different farm operations in selected rice production system.
2. To analyze the energy output input ratio of small, medium and large categories of rice farmers.
3. To compare the results of energy use pattern by small, medium and large farmers in rice farming system of selected case study area and discuss with regards to international research.
1.5 Scope and limitation of the study
The use of different farm of energy in the irrigated crop production systems and its management depends upon various factors like socioeconomic conditions of the farming community, size of holding of the farmers, physical condition of the systems, availability of the different factors of production, mode of irrigation, agronomic practices, transportation, an processing. The output of rice production systems is not only the economic desirable output but it also negatively effects the environment. The importance of the energy scarcity and environmental issues call for a study of a vast area however due to time and financial constraints it is impossible to address all these broad issues into a single study. Therefore this study is limited only in calculating the physical, chemical and biological energy inputs in term of mega joule per hectare (MJ/ha) used at farm level in production of rice and the output of energy in term of MJ/ha from paddy crop at farm gate.
All the machinery, chemical fertilizers and plant protection products and the human and animal labour used at the farm level is considered in this study. The energy used in the processing and transportation of different farm inputs as well as the farm output is beyond the

5
scope of this study. The causal human labour inputs is not considered in this study as it is difficult to figure out the exact working hour of the causal labour due to time constraint. The energy used in by the supply of water through gravitational flow in the study area is beyond the scope of this study and the farmers do not know the exact amount of water they are using.
The central part of Thailand is very popular for rice production and intensive crop cultivation. Different types and sources of energy, used in the rice farming system, need to be defined properly; otherwise it will make the study very complicated because there are different types like direct, indirect and embodied energy and sources of energy e.g. physical, chemical and biological energy. So, the study is only confined that how much MJ energy is being at farm level to produce one MJ of rice based on the size of the farm.

6
1.6 Conceptual Framework
The concept of the study is around the sole of issue of the energy output-input ratio of three categories of farmers i.e. small, medium and large farmers. The comparison of the energy output-input ratio and specific energy of rice was performed based on the size of land holding of the farmers after converting the physical units into energy units. The below mentioned conceptual framework represents the linkages between the important components of the research.
Inputs (MJ) Field Operations Output (MJ)
Figure 1.1 Energy flow from factors to rice product
1. Field preparation
4. Harvesting
3. Field Operation
2. Planting
a. Irrigation
b. Weed control
c. Pest control
a. Fertilization
Seed
Irrigation water
Diesel
Machinery
Animal labour
Human labour
Fertilizers (N, P, K)
Farm Manure
Electricity
Chemicals (Insecticides, Herbicides, Molluscicides, and Fungicides)
Inputs
Raw grain and straw (kg/ha)
Yield
Large Farmers
Small Farmers
Total Energy Inputs (MJ/ha)
Total Energy outputs (MJ/ha)
Medium Farmers
Comparison of a. Output-input ratio b. Energy Productivity c. Specific Energy
7
Chapter 2
Literature Review
The higher production of rice is a direct function of the use of different factors of production e.g. fertilizers, irrigation water, chemicals (pesticides, fungicides, herbicides etc), mechanization of the system and other renewable and non-renewable energy inputs. The energy inputs used in rice production are classified into biological, physical and chemical energy inputs. There is a trade off between energy inputs and the yield. The higher yield can be attributed through a higher level of energy inputs but many concerns were raised due to heavy reliance of modern agriculture on the fossil fuels (Mushtaq et al., 2009 and Deike et al., 2008).
With the development of technology, the energy consumption was increased and the level of production in a system also increased (Hatirli et al., 2006). In ancient time the farmers were used to apply low energy inputs into their farms and were getting fewer yields from their farming. However, at present time due to market driven forces, the precise techniques are being used in the production practices of rice that needs large quantity of energy inputs especially fossil fuel in order to get sustainable yield from the rice crop to feed the growing population of the world. The dependency on the fossil fuel for production system is more in developed countries as compared to developing countries. There are lot of concern about environmental degradation and resources depletion. Therefore sustainable approach is needed in the energy management in rice cultivation practices (Mushtaq et al., 2009).
At farm level the activity of the rice cultivation are started with the preparation of the soil for cultivation and for nursery raising. Different types of tractors are used for this purpose. The cultivation can be done either by broadcast method or through the transplanting of the young seedlings from the nursery into the main field. The irrigation can be done either through the gravitational flow of water or with the help of diesel, gasoline or electric pumps. Diesel, gasoline or manual pumps are used for spraying the chemicals. For reaping and threshing three possible options are available i.e. reaping and threshing only by human labour, reaping by human labour and threshing by machine or reaping and threshing both can be done by machines (Chaichana et al., 2008)
2.1 Energy inputs and energy coefficient of inputs in rice production
Different types of energy inputs are required in rice production. The sources of these energy inputs are different and for identification and accounting purpose these energy inputs are classified into direct and indirect energy inputs required for rice production on the basis of sources and use (Chamsing et al., 2006).
Direct energy is consumed directly in the rice production i.e. human labour, animal labour, fossil fuels, and electricity etc. The sources of these energy are human, animal, petrol, diesel and water required to perform different tasks in the crop production processes such as filed preparation, cultural practices, irrigation, harvesting, threshing and transportation. However the energy that is used in manufacturing, packaging and transportation of different farm inputs such as seed, fertilizers, farmyard manure, pesticides and other chemicals and machineries are called indirect energy. The energy that come from human, animal, seed and farmyard manure are classified as renewable energy, however the non-renewable energy sources are petrol,

8
diesel, electricity, chemical, fertilizers and machinery. On the other hand the petrol, diesel, electricity, chemicals, fertilizers, machinery and seed falls under the category of commercial energy but the human, animal and farmyard manure fall under the category of non-commercial energy (Singh et al., 2007).
2.2 Direct energy inputs
The direct energy input is the energy that is consumed directly from the physical sources during different operations in the field as reported by Chamsing et al (2006) that may be in the farm of human, animal, machinery, canal, electricity, and most importantly fossil fuels (Singh et al., 2007). Each of the physical input has different energy equivalent.
2.3 Human labour
The muscle power of the human labour is considered as the direct energy input to the agricultural farm and is used in order to accomplish different field operations for agricultural production. The energy equivalent of human labour for adult man is 1.96 MJ/hour as recorded by Singh et al (2002), however Nassiri and Singh (2009) reported that energy equivalent for an adult woman is 1.57 MJ/hour as 1 adult woman is equal to 0.80 adult man.
2.4 Draft animal
The energy equivalent of a large pair of bullock is 14.05 MJ/h with a body weight above 450 kg and for a small pair of bullock the energy equivalent is 10.10MJ/h with a body weight ranges 350-450 kg (Nassiri and Singh., 2009). But Chamsing et al (2006) reported that the draft animal as a power source is almost negligible in case of central part of Thailand.
2.5 Mechanical power
There are two types of energy comes from machinery, the indirect embodied energy of the machinery i.e. the energy that is consumed during the manufacturing and transportation of the machinery and the direct energy of fuel that is consumed by the machines during the field operations. The direct energy that is used in the machinery is in the farm of fossil fuels that includes gasoline, patrol or it may be in the farm of electricity. The energy consumption during mechanical operation in the field depends on many factors that include the physical characteristics of soil, weather, the farming practices etc. The energy equivalent of diesel is 15.67 KWh/L (Mandal et al., 2002, Yilmaz at el., 2005 and Hatirli at el., 2006). However, Singh et al (2002) and Nasssiri et al (2009) reported that the energy equivalent of diesel is 56.31MJ/liter and electricity is 11.93KWh. The energy equivalent of petrol is 48.23MJ/liter (Nasssiri et al., 2009).
2.6 Indirect energy inputs
In addition to the direct energy that is used in the farm, the indirect energy also necessary for the cultivation of the rice crop. The indirect energy is the amount of energy that is used in the production processes of goods and services required for the cultivation of the rice. The Indirect energy is used to produce the machinery, equipments, chemical fertilizers, farmyard manure, chemicals i.e. pesticides, fungicides etc, and biological energy i.e. seeds and hormones (Singh et al., 2007 and Chamsing et al., 2006). For clear understanding the energy is divided into three sub groups i.e. Physical energy, chemical energy and biological energy.

9
Table 2.1 Energy coefficient (MJ/ha) of various farm equipments Power Source Equipment Energy coefficient (MJ/h)
Manual Spade Spickle Sickle Bund former Sprayer Wheel hand hoe
0.314 0.031 0.836 0.502 0.502 0.502
Animal Plough Cultivator Disk harrow Planter Seed drill/planter Puddler Bund former Cart Toka
0.627 1.881 3.135 1.568 1.254 1.254 1.442 5.204 1.290
Tractor M.B. Plough Cultivator Disk Plough Planter Disk harrow Seed drill/planter Leveler Bund former Reaper Puddler Rotavator Trailer Combine
2.508 3.135 3.762 9.405 7.336 8.653 4.703 2.063 5.518 2.508 10.283 17.431 47.025
Others Thresher/sheller Power toka Centrifugal pump Electric motor 35 hp Electric motor (others) Diesel engine Tractor Ford 45 hp & above Tractor (others) Self propelled combine
7.524 1.568 1.750 0.343 0.216 0.581 16.416 10.944 171.00
Source: Nassiri and Singh, 2009

10
The amount of chemical fertilizer and pesticides inputs is very different from farm to farm depends on different factors. According to Blengini and Busto (2009), the amount horn meal (12%N) and urea (46%N) as nitrogen, triple superphosphate as P2O5 , and potassium chloride as K2O is 171.8 kg/ha, 234.3kg/ha, 83.3 kg/ha and 270.1 kg/ha respectively is being used in Vercelli, Italy. The total amount of pesticides that is being used in the rice production in Vercelli, Italy is 6.085 kg/ha.
2.7 Physical energy
Physical energy is the farm of indirect energy input that is provided by the machinery and equipments used in the crop production system. The mechanical power is the main source of physical energy that used at farm. The energy used in the manufacturing, distribution and repair and maintenance are the indirect energy inputs for mechanical power source (Chamsing et al., 2006). Different farm equipments have different energy coefficients. The energy coefficients of different farm equipments are given in table 2.1.
2.8 Chemical energy
The energy that is consumed during the production, processing and transportation of chemical fertilizers and pesticides fall under the category of indirect chemical energy inputs to the rice field. The total chemical energy for the fertilizers is calculated on the basis of the respective percentage of the Nitrogen (N), Phosphorus (P2O5) and Potassium K2O present in respective fertilizer. The energy equivalents of N, P2O5 and K2O are 60.60 MJ/kg, 11.10 MJ/kg and 6.7 MJ/kg respectively. Different types of chemicals are used in the rice crop in the field. In order to control the insects and pest attack as well as to control the weeds insecticides and pesticides are used. According to Pimentel (1980) 300 man-hours per hectare were used in order to control the weeds. However during the year 1972-73 in dry season rice about 26,073 Kcal/ha were used in Philippines. But presently different chemicals are being used. The energy coefficient of insecticides is 55.5 KWh/liter, herbicides 66.7 KWh/liter, fungicides 17.2 KWh/liter, Molluscicides 28.1 KWh/liter and Fungicides 17.2 KWh/liter (Mushtaq et al., 2009).
2.9 Biological energy
Among the biological energy seed and the hormones are the main biological energy inputs and fall under the category of indirect input in rice cultivation. The energy equivalent of rice seed is 14.7 MJ/ha Nassiri and Singh (2009). The average seed rate reported by Blengini & Busto (2009) in Vercelli, Italy is 200 kg/ha.
2.10 Energy coefficients of output
The main output of the rice crop is the rice seed (produce). The straw is the by product of the rice crop. The energy coefficient of the rice produce is reported by Mandal et al (2002) is 4.08 KWh/kg and the energy coefficient of the rice straw reported by Mandal et al (2002) as 3.47 KWh/kg. However, energy coefficients of seed and straw adopted by Nassiri et al (2009) as 14.7 MJ/kg of seed as well as for rice straw.
The straw to grain ratio varies from place to place depending upon the many factors. Different studies were conducted in order to find out the straw to grain ratio as reported by Gadde

11
(2007) and he concluded that the 0.75 is a fairly reliable and representative number for straw to grain ratio of rice with a moister content of 10%. 2.11 Energy output-input ratio
Energy input and output relationship are calculated on the basis using different equations. Form the literature Canacki et al ( 2005), Khan et al (2009), Mushtaq et al ( 2009), Ozkan et al (2004) and Hatirli et al (2005) suggested the following equations for the calculation of the energy input output relationship.
(MJ)input energy Total(MJ)output energy Total ratioEnergy = (2.1)
(MJ)input energy Total
(Kg) YieldGrain ty ProductiviEnergy = (2.2)
(Kg) yieldGrain (MJ)input energy Total Energy Specific = (2.3)
Net Energy Return = Total energy output – Total energy input (2.4)
The energy ratio of different systems and different crops is different depending upon many factors i.e. the cultural practices, availability of the resources and also the socioeconomic conditions of the farmers.
The energy ratio varies from year to year and from place to place. The energy ratio of rice crop in Mississippi and Philippines for the year 1977 was 1.03 and 1.17 respectively. However in 1972-73 value of output – input ratio was 3.41 and 3.36 for wet season and dry season respectively in Philippines (Pimentel., 1980).
By using almost the same approach Mandel et al., (2002) compared and concluded that in soybean based crop production system the major share of energy inputs came from the organic manure and chemical fertilizers, cultural practices and sowing management in central India. They also concluded that even soybean-wheat consumed and provided higher biomass and bioenergy, but the energy use efficiency (EUE) was low and was considered as capital and energy intensive crop production system. On the other hand they found that soybean-chickpea required less energy inputs and gave higher energy use efficiency and was suggested to the central ecological niche of India.
Yilmaz et al., (2005) reported that the energy consumed in cotton production mainly dependent on the fossil fuels and the diesel was the highest direct energy input followed by fertilizer and machinery as the indirect energy inputs. He concluded that the energy output input ratio was low i.e. 0.74 and the net return was insufficient to cover the economic costs. Better energy efficiency, energy productivity and economic performance were observed in large farmers as compared to small farmers as the energy cost per unit area is decreased with the increase in farm size and on the other hand in the large farms the energy can also be used in the best possible way to achieve maximum possible output.
12
Kizilaslan (2009) calculated that 48,667 MJ energy was used per hectare for the production of cherries in Tokat region of Turkey. Out of the total energy 42% energy was provided by fertilizers and 58% of energy was provided by other inputs i.e. chemicals 2%, labour 2%, machinery 5%, fuel (diesel) 21%, and electricity 22%. The output input ratio was calculated as 0.96 that indicated that the inputs were not used efficiently. He also calculated that out of total 80% non-renewable energy was used and only 20% renewable energy was used that is a seriously harmful for the environment. In comparing the energy demand of rice production Kasmaprapruet et al (2009), reported that in drying, harvesting, cultivation, seeding, transportation and milling processes consumes 55%, 15%, 10%, 10%, 6% and 4% respectively.
Pimentel and Pimentel (2008) compared the output-input ratios rice production in United State and Japan. They concluded that the human labour input for ice production in US is 24h/ha, still relatively high figure if compared with the grain production in US. Bun in Japan rice production is labour intensive a require 640 h/ha of human labour. The output input ratio of US is reported by Pimentel and Pimentel, (2008) as 2.24 however for Japan it is 2.8. That reflects the efficient use of energy in Japan than that of US system.
Generally small farmers commit more labour to a production process when compared to large farmers. In contrast large farmers use more mechanical energy to the production process and they substitute machine for labour and they consider the land and machine as abundant even in the land and capital scarce and labour abundant economy and therefore the large farmers are socially inefficient hence small farmers use more efficient use of resource than large farmers (Ellis., 1998).

13
Chapter 3
Methodology
To asses the pattern of energy consumption of rice farmers with different sizes of land holdings i.e. small, medium and large farmers having different uses of various types and amount of energy consumption, primary data for the different types of energy inputs was collected through field survey and personal interviews. The secondary data was collected from different available literature.
3.1. Selection of study area
The study was conducted in Pakh Hai district, Ayutthaya province in the central region of Thailand. Most of the cultivated area of the province is irrigated. Rice crop was selected for the present study as it is the major crop of Thailand and is the staple food of the population of the country. During the production process of rice lot of energy is being consumed. Rice is also the main crop of the study area.
Figure 3.1 Location of the study area

14
Lad Chit canal, that is a main canal in Pakh Hai district was selected for this study. Farmers from the head to the tail of the canal were selected for the present study. Farmers having different size of land holdings were selected for interview. 3.2 Data collection and selection of the respondents
The data of energy input resources for rice cultivation was collected from the three different categories of the farmers’ i.e. small, medium and large farmers based on the size of land holding. The proportionate number of the farmers of each category was selected based on the percentage share of that category into the total population of the farming households.
The data of different inputs used for field operations (land preparation, cultural practices, management, chemical fertilizers and pesticides and harvesting) was collected from all categories of the farmers. The data of energy inputs from different physical sources (human, animal and machinery etc.) as well as in the farm of material (seed, fertilizer and chemicals etc.) was collected through personal interviews of the farmers.
Total 36 farmers were selected for this study and they were interviewed. Among 36 farmers 10 small farmers, 17 medium farmers and 9 large farmers were selected. They farmers are categorized on the basis of land holding. He farmers having with land holding less then 9.2 are considered as small, 3.2 to 9.5 ha were considered as medium and 9.6 and abve were conider as large farmers. The data for one crop cycle of the recent crop harvested, about the labour involved in the farming operations, area under rice crop of each farm, size and number of power sources and its working hours for different field operation during a crop cycle, the amount and type of chemical fertilizers and other chemicals for plant protection measures etc was collected. The average yield of the rice crop per unit area from each farmer was also collected.
3.3 Energy requirements and conversion factor
There are three main groups of energy inputs namely physical, chemical and biological energy and each agricultural input has its own energy equivalent. These energy inputs may be in the farm of chemicals (fertilizers and pesticides), human labour, animal labour and machinery power or it may be in the farm of fissile fuel, water and seed. The physical units of different inputs and output were converted into energy units by using the respective conversion factors i.e. energy equivalent available in the literature (Canacki et al., 2005; Hatirli et al., 2006; Mandal et al., 2002; Mushtaq et al., 2009; Nassiri and Singh., 2009; Ozkan et al., 2004; Singh et al., 2002; Sing and Mittal 1992 and Yilmaz at el., 2005;)
3.4 Human labour energy The human labour (man hours) will be converted into energy units by multiplying the number of total human labour (family and higher labour) with working hours to the energy coefficient available in the literature. The energy equivalent of an adult man is 1.97 MJ/h and for an adult woman it is 1.57 MJ/ha. The following equation was followed for the conversion of physical unit of human labour into energy unit.
(ha) area Plantdeqr En. HlWh (MJ/ha)Labour Human ××
= 3.1

15
Where,
Wh = Total working hours of human labour
Hl = Total human labour
En. Eq = Energy equivalent of human labour
3.5 Mechanical energy Mechanical energy inputs was calculated based on the fuel consumption (liter/hour) of the machinery, types of machinery and working hours per operation as well as the number of operation in the rice planted area. The energy equivalents of the specific type of machinery from the literature were used to convert the factor unit into the energy unit.
Mechanical energy (MJ/ha) (ha) area Planted
EqEn. Wh FC ××××=
daysNo 3.2
Where,
FC = Fuel consumption
Wh = Total working hours of machinery
No = Number of the farm machinery
En. Eq = Energy equivalent of fuel (MJ/L). 48.23 MJ/L for gasoline and 56.3MJ/L for diesel
3.6 Fertilizer energy
The fertilizer energy inputs was calculated by multiplying the respective energy equivalents of (N, P and K) to their respective percentage ingredients in the compound fertilizers used per unit area (hectare). The sum of the energy of all the ingredients (N, P K) will give the fertilizers energy use per unit area.
Fertilizer energy input 100
KP,N, % (Kg/ha) Fertilizer ×= 3.3
Energy of N (ha) area PlantedequivalentEnergy N of Share ×
= 3.4
Energy of P2O5 (ha) area Planted
equivalentEnergy OP of Share 52 ×= 3.5
K2O (ha) area Planted
equivalentEnergy OK of Share 2 ×= 3.6
Total energy input of fertilizer (MJ/ha) = N (MJ/ha) + P2O5 (MJ/ha) + K2O (MJ/ha) 3.7

16
3.7 Seed energy
The following equation was followed to convert the physical unit of seed into energy unit. The energy conversion factor of seed is 14.7 MJ/kg.
Seed energy (MJ/ha) area Cultivated
equivalentEnergy (Kg/ha) Seed ×= 3.8
3.8 Pesticides, herbicides and other chemical energy inputs
The energy equivalent of the different chemicals was calculated by multiplying the respective energy equivalents with the quantity of the chemical used (liter or kg/hectare).
Chemical energy input (MJ/ha) arean Applicatio
equivalentEnergy (liter)Quantity ×= 3.9
3.9 Rice production energy equivalent
Paddy output is the main product from the rice farming. Straw and stalk are the by products of the rice production systems. The output of the rice paddy yield and straw (kg/ha) was converted into energy units by multiplying the total biomass produces per hectare with the energy equivalent. The rice straw and the grain have the same energy equivalents i.e. 14.7 MJ/kg. The following equation was followed to calculate the output of the energy of the biomass.
Energy of the biomass produced area Cultivated
equivalentEnergy (Kg/ha) straw andGrain ×= 3.10
3.10 Energy ratio
The energy ratio of the inputs that is the sum of direct and indirect energy and the outputs from the rice production system (grain and straw) was calculated after converting the respective units of the inputs and the outputs into the energy units. The following ratios will be analyzed.
(MJ/ha)input energy Total(MJ/ha)output energy Total ratioEnergy = 3.11
(MJ/ha)input energy Total(Kg) YieldGrain ty ProductiviEnergy = 3.12
(Kg/ha) yieldGrain (MJ/ha)input energy Total Energy Specific = 3.13
3.11 Analysis of energy consumption and energy output
Based on the investigation made from the three groups of the farmers the difference in the energy consumption and output was found by using the Microsoft Excel. To confirm the difference of the energy ratios, specific energy and the energy productivity among the three groups of the farmers, descriptive analysis, analysis of variance and mean comparison were employed. As the sample size is small and to confirm the violation of the normality

17
assumption, a nonparametric procedure, the Kruskal – Wallis method, was also employed with the help of statistical package for social scientists (SPSS) 16.0 for windows. Scheffe and Tukey’s tests were used to confirm the pair wise significant difference between the average energy ratio, specific energy and energy productivity of small, medium and large farmers.

18
Chapter 4
Results and Discussions
Pakh Hai district of Ayutthaya province, the central region of Thailand was selected for the detailed study. This chapter provides the results obtained from the analysis of the different inputs that are used and of operations that are performed in the irrigated rice farming system. Detail discussion and results are given in this chapter. 4.1 General This study aims to analyze the situation of energy consumption in rice farming system as rice is the major crop and export commodity for Thailand, in a context of looming fossil energy crisis and of global environmental concerns. The sub categorization of the rice farmers was done based on the land holding size. Three categories were considered (i.e. small, medium and large farmers) for the assessment of energy consumption at farm level. Primary data were collected through a questionnaire survey. Secondary data were obtained from available literature and existing databases. In the study area farmers were interviewed based on a structured questionnaire. A random sample of 36 farmers was selected from the Pakh Hai district of Ayutthaya province. The farmers were interviewed in order to get information about the mechanization of the rice farms, fuel energy consumption, chemical fertilizers inputs, insecticides, herbicides and fungicide use as well as labour inputs. The data for different inputs from each category of the farmer were gathered based on the most recent crop season. Data analysis was first based on the different farm operations i.e. land preparation, planting, irrigation, crop protection, crop harvesting. For each operation different amount of inputs i.e. machinery, fuel, irrigation water, seed, fertilizers, chemicals for crop protection and labour are used and analyzed separately. Secondary data is analyzed as per farmer group vs. energy use pattern. Percentage share of land holding of each category of the farmers in the Ayutthaya province and the result of different energy inputs to each operation of different categories of the farmers are given under the following sub sections. 4.2 Land holding and rice planted area Majority of the farmers cultivate between 10-40 rai i.e. 1.6 to 6.4 hectares in Ayutthaya province. The farmers having the land holding less then 20 rai were considered as small, between 20-60 rai were considered as medium and 60 and above were considered as large farmer. Three crops are being cultivated in the region; one crop in the wet season and two crops in the dry season. The total rice planted area for the year 2008 in the Ayutthaya province was about 134,188 hectares (Agricultural Statistics, 2008). The percentage share of each category of farm is given in table 4.1.

19
Table 4.1 Categories of farmers considered in the study Categories of the
farmers Small farmers
<20 rai < 3.2 hectare
Medium farmers 20-59 rai
3.2 – 9.5 hectare
Large farmers 60 and above
9.6 hectare and above
%age share 38.89 44.75 16.39
No. of Farmers 10,408 11,977 4,379
Source: OAE, 2008
4.3 Farm mechanization and labour Most of the medium and large farmers own their own machinery; however the small farmers have to rent the machinery for land preparation. The farm machinery used in the study area includes small 4-wheeled tractors, power tillers (10 to 14 hp), irrigation pumps (3.3 to 14 hp) and sprayer. Almost all the machinery is diesel powered except the sprayer powered by petrol. Power tillers are commonly being used for land preparation in the study area. For the application of the seed, fertilizers, insecticides, herbicides, fungicides, most farmers hire the services of external labour, as family labour is not sufficient. 4.4 Land preparation Generally for land preparation, primary tillage, secondary tillage and seedbed preparation are the common practices in the study area. For that purpose mostly the power tillers are being used. However some farmers were also using the 4-wheeled tractors. The numbers of tillage practice vary from 2 to 4 operations depending upon the size of land holding of the farmers and the soil condition. Mouldboard plough and disk plough tools pulled by power tiller and tractors are being used for primary tillage operation. For secondary tillage most of the farmers are using the peddlers attached to power tillers and 4-wheeled tractors. Power tiller is the most common machinery for secondary tillage. In seedbed preparation and leveling of the land, wood plates pulled by power tillers are being used. Energy inputs for the primary tillage and the secondary vary depending upon the time in which machinery is used. The quantity of energy inputs of machinery, fuel and labour in MJ/ hectare by different categories of the farmers is given as under.

20
Table 4.2 Amount of energy (MJ/ha) used in tillage operation by each category of farmers Energy inputs (MJ/ha)
Small farmers (< 3.2 ha)
Medium farmers (3.2 – 9.5 ha)
Large farmers (9.6 ha and above)
Machinery 1672 2370 2343
Human Labour 29 57 52
Total 1701 2427 2395 The difference of the different energy inputs by each category of the farmers mainly because of the number of operations. The number of tillage operations varies in different farm because of the financial status, the ownership of the machinery as well as the size of land holding. Figures show that there is no economy of scale in energy use for tillage in larger farms as compared to smallest ones. On the contrary, larger farms use more machinery for tillage as per area unit. Most of the small farmers do not have their own machinery and they sparingly use hired machinery. Small farmers are more resource-efficient as reported by Ellis (1998). In order reduce the cost incurred by tillage operation; small farmers use resources efficiently. 4.5 Animal draft Generally it is observed that all the farmers are using the machinery for tillage operations in the case study area. None of the respondents reported animal draft. 4.6 Planting Most of the farmers are using the manual direct broadcasting method of the germinated seed, which explain that human labour energy equivalent is similar between groups. Usually the seed is soaked in water one day before broadcasting into the field. Family and hired labour is generally being used for the broadcasting of the pre-germinated seed. Table 4.3 Energy input (MJ/ha) related to planting operations as per farmer type Energy inputs (MJ/ha)
Small farmers (< 3.2 ha)
Medium farmers (3.2 – 9.5 ha)
Large farmers (9.6 ha and above)
Machinery - - -
Human labour 7 6 7
Seed 2798 2796 3011
Total 2805 2802 3018

21
The seed rate per hectare for almost all the farmers is same. Most of the respondents mentioned that the average seed rate is 180-200 kilogram per hectare. However, it is observed that the seed rate of the large farmers is little bit higher then the small and medium farmers. Few large farmers are using up to 215 kilogram hectare. 4.7 Plant protection measures In order to control the unwanted herbs and insects, chemical are used by all farmers. Manual knapsack sprayers and power knapsack sprayers are commonly used by all farmers. Most of the farmers are hiring the labour other than family labour for the application of herbicides and insecticides because of effective timing as well as the human health effects of the chemicals. Generally hired labour come in the form of group of about 4 to 8 persons and finish the whole field within a few hours as it is considered an effective application of the chemicals. The effective timing of the application of the chemicals that is considered by the farmers in the case study area is before 10am or after 3pm. Usually the hired labour apply the chemicals and the duration is not more then 3-4 hours per day because the labour can not stand for long time while applying the chemicals because of its unpleasant odor. The other human health dangers as well as the most effective timing of the day for application of the chemicals are the reasons for hiring the labour. Different quantities of different chemicals are being used by the farmers depending upon the field condition as well as the size of land holding of the farmers. Table 4.4 Energy input (MJ/ha) as per plant protection measures and farmer types Energy inputs (MJ/ha)
Small farmers (< 3.2 ha)
Medium farmers (3.2 – 9.5 ha)
Large farmers (9.6 ha and above)
Machinery 50 169 188
Labour 12 18 23
Insecticides 540 597 1095
Herbicides 30 644 350
Fungicides - 16 12
Total 632 1444 1668
In table 4.4 it is clear that large farmers are using highest quantity of chemicals followed by medium farmers. Small farmers are using the least amount of chemicals. Interestingly, larger farms are markedly using more insecticide than other groups, while smaller farms use far less herbicide than other bigger ones. Small farms are not using fungicides. The quantity of labour and machinery depends on the quantity of chemicals being used by different farmers. Small farmers are using less then the half of the quantity of chemicals being used by large and medium farmers. It is observed that manual weeding is being practiced by the small farmers
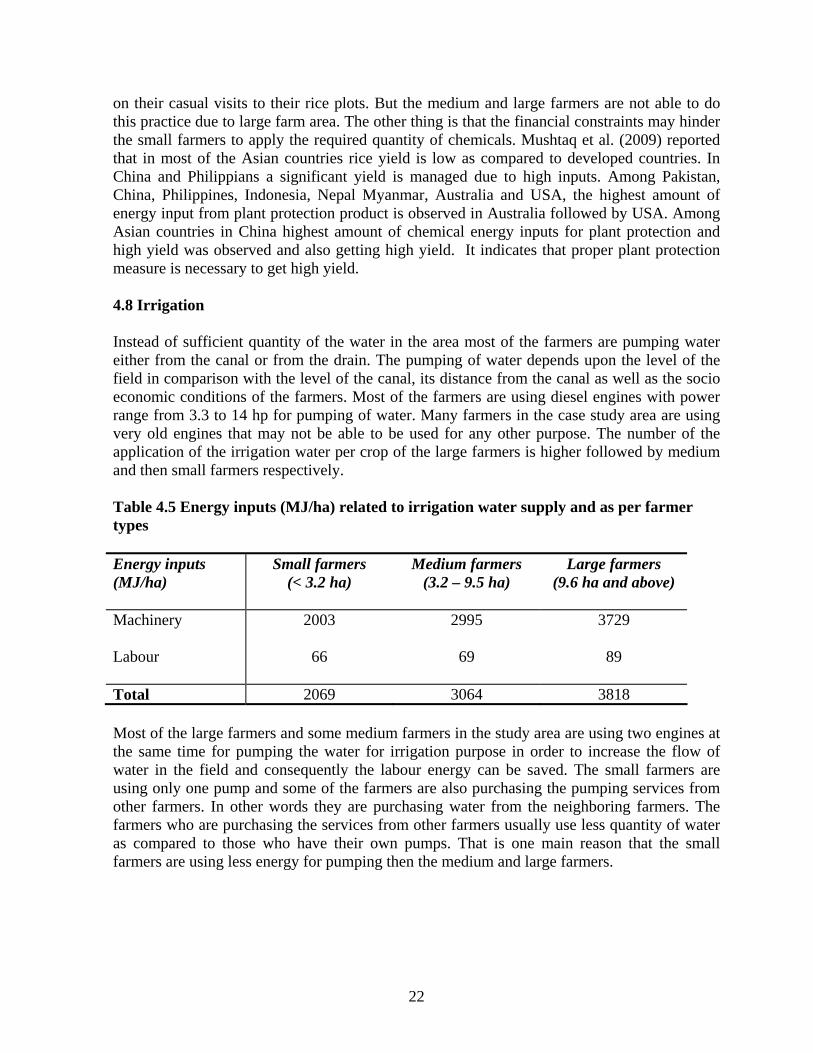
22
on their casual visits to their rice plots. But the medium and large farmers are not able to do this practice due to large farm area. The other thing is that the financial constraints may hinder the small farmers to apply the required quantity of chemicals. Mushtaq et al. (2009) reported that in most of the Asian countries rice yield is low as compared to developed countries. In China and Philippians a significant yield is managed due to high inputs. Among Pakistan, China, Philippines, Indonesia, Nepal Myanmar, Australia and USA, the highest amount of energy input from plant protection product is observed in Australia followed by USA. Among Asian countries in China highest amount of chemical energy inputs for plant protection and high yield was observed and also getting high yield. It indicates that proper plant protection measure is necessary to get high yield. 4.8 Irrigation Instead of sufficient quantity of the water in the area most of the farmers are pumping water either from the canal or from the drain. The pumping of water depends upon the level of the field in comparison with the level of the canal, its distance from the canal as well as the socio economic conditions of the farmers. Most of the farmers are using diesel engines with power range from 3.3 to 14 hp for pumping of water. Many farmers in the case study area are using very old engines that may not be able to be used for any other purpose. The number of the application of the irrigation water per crop of the large farmers is higher followed by medium and then small farmers respectively. Table 4.5 Energy inputs (MJ/ha) related to irrigation water supply and as per farmer types Energy inputs (MJ/ha)
Small farmers (< 3.2 ha)
Medium farmers (3.2 – 9.5 ha)
Large farmers (9.6 ha and above)
Machinery 2003 2995 3729
Labour 66 69 89
Total 2069 3064 3818 Most of the large farmers and some medium farmers in the study area are using two engines at the same time for pumping the water for irrigation purpose in order to increase the flow of water in the field and consequently the labour energy can be saved. The small farmers are using only one pump and some of the farmers are also purchasing the pumping services from other farmers. In other words they are purchasing water from the neighboring farmers. The farmers who are purchasing the services from other farmers usually use less quantity of water as compared to those who have their own pumps. That is one main reason that the small farmers are using less energy for pumping then the medium and large farmers.

23
4.9 Fertilizer application Different types of chemical fertilizers are being used in the study area and most of them are applying chemical fertilizers manually. Family as well as hired labour is being used for the application of the fertilizers depending upon the area of application. Fertilizers of different compositions and combinations of different fertilizers are being used by different farmers. Large farmers are using more quantity of fertilizer (8542.34 MJ/ha) followed by medium farmers (6614.20 MJ/ha) and then small farmers (4141.11 MJ/ha). The labour energy inputs for the application of fertilizer depend upon the amount of fertilizers being used by different categories of farmers. Mushtaq et al. (2009) recorded that among Asian countries rice yield is low except China and Philippines where high yield have managed and a significant yield is being obtained due to considerable use of fertilizers and high-yielding verities. Similarly, Yilmaz et al. (2005) reported that better energy efficiency, energy productivity and economic performance were observed in large farmers as compared to small farmers as the energy cost per unit area is decreased with the increase in farm size and on the other hand in the large farms the energy can also be used in the best possible way to achieve maximum possible output. Thepent. (2009) reported that the landless farmers and small holding farmers are facing the financial constraints as they have no any access to low interest rate loan money from the financial institutes. Therefore they must have to seek loan from other sources with high interest rate. Ultimately small farmers use less fertilizer input per unit area and are getting less yield. Table 4.6 Energy inputs related to fertilizer application and as per farm types Energy inputs (MJ/ha)
Small farmers (< 3.2 ha)
Medium farmers (3.2 – 9.5 ha)
Large farmers (9.6 ha and above)
Labour 11 16 19
N 3351 5727 7503
P2O5 759 844 968
K2O 20 27 52
Total 4141 6614 8542
4.10 Harvesting Combine harvester are reported by all the respondents irrespective of the size of land holding. All farmers are hiring the combine harvesters for harvesting purpose. Different types of the harvesters were reported by the respondents. The fuel consumption per hour was considered

24
the same. Different farmers reported slightly different amount of labour energy inputs and the time of harvest per unit area was considered the only difference. Table 4.7 Energy inputs (MJ/ha) related to harvesting and as per farm types Energy inputs (MJ/ha)
Small farmers (< 3.2 ha)
Medium farmers (3.2 – 9.5 ha)
Large farmers (9.6 ha and above)
Machinery 2774 2618 2644
Labour 14 13 13
Total 2788 2631 2657
In case of harvesting the energy consumption by the small farmers is slightly higher then the medium and large farmers. The reason is that the machine and the labour are not being utilized efficiently because of small area under operation. All in all, results show that each operation which is not under the direct control and choice by farmers (harvesting through the hiring of combined harvester, planting operations) generate similar energy use between size groups. On the contrary, each operation which reflects a choice in level of input by farmers is systematically less energy-consuming in smaller farms than in larger farms. 4.11 Estimation of energy inputs from different sources to irrigated rice farming The analysis of energy was done based on the data that was collected by farmers’ interviews during the field survey. The contribution of physical chemical and biological energy to the irrigated rice is analyzed separately. Among the physical energy inputs to the irrigated rice cultivation in the study area are human labour and the mechanical power of the machinery only, as the animal draft is not being used in the study area. Seed, fertilizer, insecticides, herbicides and fungicides energy inputs, fall under the category of indirect energy inputs. 4.12 Physical, chemical and biological energy consumption in field operation Data analysis it is reveals that the contribution of the chemical energy to the total energy inputs is the highest in case of large farmers. Out of the total inputs 45.17% share is contributed by chemical energy inputs in the form of fertilizer, insecticides, herbicides and fungicides. The energy contribution from physical sources i.e. mechanical energy and human energy as well as biological energy is 41.21% and 13.63% respectively. In case of medium farmers the share of physical energy is the highest i.e. 43.98% and the share of chemical energy and biological energy inputs is 41.38% and 14.73% respectively. However a

25
substantial difference is observed in case of small farmers as the small farmers are using physical, chemical and biological energy with a percentage share of 46.95%, 19.80% and 33.25% respectively. Almost all the small and medium farmers are using same amount of biological energy inputs but it is slightly higher in case of large farmers.
Physical, chemical and biological energy inputs as per farmer types
91068332
6637
9981
7855
4700
301127962798
0
2000
4000
6000
8000
10000
12000
Small farmers Medium farmers Large farmers
Farm size
Energy (MJ/ha)
Physical energyChemical energyBiological energy
Figure 4.1 Physical, chemical and biological energy inputs as per farmer types The difference in the quantity of energy inputs from physical, chemical and biological sources depends upon various factors. The financial status and socioeconomic condition of the farmers are the most prominent reasons for the difference in the energy inputs from difference by different category of the framers. Table 4.8 Total energy inputs (MJ/ha) in farm operations as per farm types Energy inputs (MJ/ha)
Small farmers (< 3.2 ha)
Medium farmers (3.2 – 9.5 ha)
Large farmers (9.6 ha and above)
Physical Energy 6637
(46.95%) 8332
(43.89%) 9106
(41.21%)
Chemical Energy 4700 (33.25%)
7855 (41.38%)
9981 (45.17%)
Biological Energy 2798
(19.80%) 2795
(14.73%) 3011
(13.63%)
Total 14135 18982 22098

26
4.13 Major energy consumption as per farm types Major energy inputs of any farms consist of machinery, chemicals, fertilizer seed and labour. These energy inputs are divided into commercial and non-commercial energy inputs. Seed and human labour fall under the category of non- commercial energy inputs, however machinery, fertilizer and chemicals falls under the category of commercial energy inputs.
Total energy consumption (MJ/ha) of small farmers
Fertilizer29%
Seed20%
Chemicals4%
Machinary46%
Labour1%
MachinaryLabourChemicalsFertilizerSeed
Figure 4.2 Commercial and non-commercial energy consumption of small farmers
Total energy consumption (MJ/ha) of medium farmers
Machinary42%
Fertilizer35%
Seed15%
Chemicals7%
Labour1%
MachinaryLabourChemicalsFertilizerSeed
Figure 4.3 Commercial and non-commercial energy consumption of medium farmer

27
Total energy consumption (MJ/ha) of large farmers
Machinary39%
Fertilizer39%
Seed14%
Labour1%
Chemicals7%
MachinaryLabourChemicalsFertilizerSeed
Figure 4.4 Commercial and non-commercial energy consumption of large farmer The percentage composition of commercial and non-commercial energy inputs per hectare of small, medium and large energy inputs are shown in figure 4.1, 4.2 and 4.3 respectively. The commercial energy inputs in the small farms are about 79%, consisting of machinery 46%, fertilizer 29% and chemicals 4%. The non-commercial energy inputs of the small farmers are 21% consisting of seed 20% and labour 1%. The commercial energy input per hectare of medium farmers is 84%, consisting of mechanical energy 42%, fertilizer energy 35% and chemical energy 7%. The non-commercial energy input of the medium farmers is 16% consisting of seed 15% and labour 1%. In case of large farmers the mechanical energy input is 39%, fertilizer energy input is 39% and chemicals energy inputs is 7%. The seed energy inputs is 14% and human energy inputs is 1%. Thus the commercial energy input of large farm is 85% and the non-commercial energy input of large farms is 15%. It indicates that with the increase in the farm size the commercial energy inputs per hectare increases; however the non-commercial energy inputs decreases. Among the non-commercial energy inputs the percentage share of seed is higher in all categories of the farmers. Human labour energy input is 1%. The economies of scale are the main reason for the same percentage share of human labour energy inputs even if the total of commercial energy input increases. 4.14 Physical energy consumption The farmers in the study area are using machinery for different farm operation purposes. The human labour is also required for operating machinery. Human labour is also being used for some manual operation like irrigation, planting and fertilizers application etc. It is observed in the case study area that most of the farmers are mechanized. The quantity of mechanical energy input as well as human energy inputs per hectare to different farm operation is highest in case of large farmers as compared to medium and small farmers. The small farmers are using least quantity of mechanical energy as well as human labour energy inputs per hectare.
28
Mechanical and human labour energy inputs as per farmer types
89048152
6499
138 180 202
0
1000
20003000
4000
5000
6000
70008000
9000
10000
Small farmers Medium farmers Large farmers
Farm size
Energy (MJ/ha) Mechanical energy
Human labour
Figure 4.5 Mechanical and human energy inputs as per farmer types Table 4.9 Physical energy inputs (MJ/ha) in farm operations as per farm types Energy inputs (MJ/ha)
Small farmers (< 3.2 ha)
Medium farmers (3.2 – 9.5 ha)
Large farmers (9.6 ha and above)
Mechanical Energy Inputs
6499 (97.93%)
8152 (97.84%)
8904 (97.78%)
Human Labour Energy Inputs
138 (2.07%)
180 (2.16%)
202 (2.22%)
Total 6637 8332 9106 In case of large farmers the share of mechanical energy inputs per hectare to different farm operations is 97.78% and the human labour energy input is 2.22%. In case of small farmers the share of mechanical and human labour is 97.84% and 2.16% respectively and for small farmers the mechanical and labour is 97.03 and 2.07% respectively. As there is not a big difference in the percentage share of mechanical and human labour between small and large farmers but the total amount of inputs increases with the increase in the farm size. This seems to contradict the classical peasant economic theory which stats that in larger farms, machinery tends to replace human labour (Ellis, 1998). Actually such theory supposes a shift in capital base and a commercialization trajectory which are not reflected in the sample overall. All three groups are small scale family based rice farming systems, only with different farm sizes.

29
4.15 Chemical energy input composition Fertilizer energy inputs is the main chemical energy inputs in the rice crop production. But the quantity fertilizer input increases with the increase of the farm size. The energy inputs for plant protection measure depend upon the field situation. It is observed that small farmers are using less quantity of chemicals per hectare. But the amount of insecticides by small and medium farmers is almost the same while larger farmers are using more insecticides.
Chemical energy inputs as per farmer types
8524
6598
4130
1095597540 350
64530 12160
0
1000
2000
3000
4000
5000
6000
7000
8000
9000
Small farmers Medium farmers Large farmers
Farm size
Energy (MJ/ha)
Fertilizer Insecticides Herbicides Fungicides
Figure 4.6 Chemical energy inputs as per farmer types Table 4.10 Chemical energy inputs (MJ/ha) as per farm types Energy inputs (MJ/ha)
Small farmers (< 3.2 ha)
Medium farmers (3.2 – 9.5 ha)
Large farmers (9.6 ha and above)
Energy from Fertilizer 4130
(87.88%) 6598
(83.99%) 8524
(85.40%)
Energy From Insecticides 540 (11.49%)
597 (7.60%)
1095 (10.97%)
Energy From Herbicides 30
(0.64%) 644
(8.21%) 350
(3.51%)
Energy From Fungicides - (0%)
16 (0.20%)
12 (0.12%)
Total 4700 7855 9981

30
In very few cases it is observed that the farmers are using fungicides. It indicates that either the farmers in the study area are not facing any serious problem of fungus attack or they have lack of knowledge about the fungus attack. Total amount of chemical per hectare that is being used by small, medium ad large farmers is 4700.10 MJ/ha, 7855.06 MJ/ha and 9981.07 MJ/ha respectively (Table 4.9). The main difference is because of the fertilizer energy input. Large farmers use more fertilizer as compared the medium and small farmers. Large farmers with sound financial condition can invest more for fertilizer. The financial situation of small and medium farmers may hinder to invest more on fertilizer. However the chemicals for plant protection vary regardless the size of the farm. It indicates that the field situation and the knowledge of the farmer about the unwanted situation are the two reasons for the uneven use of chemical inputs. 4.16 Biological energy input The seed is the only biological energy input in the study area. The quantity of seed input varies from farm to farm. However it is observed that the large farmers are using slightly more quantity of seed per hectare The average amount of seed input per hectare for small, medium and large farmers is 2798.47 MJ/ha, 2795.55 MJ/ha and 3011.46 MJ/ha respectively. Table 4.11 Biological energy inputs (MJ/ha) as per farm types Energy inputs (MJ/ha)
Small farmers (< 3.2 ha)
Medium farmers (3.2 – 9.5 ha)
Large farmers (9.6 ha and above)
Seed 2798 2796 3011
4.17 Energy output as per farmer types There are two kinds of energy outputs. The energy from the main product and the energy output from the by products. The main product in this case is the brown rice and the by-product is the straw and the husk. The straw to grain ratio for Thailand is considered as 0.75 (Gadde et al, 2009). The total energy output from total biomass per hectare from small, medium and large farms is 115.86 GJ/ha, 132.80 GJ/ha and 133.09 MJ/ha respectively (Table 4.11). The results reveal that the energy output among different categories of the farmers increases with the increase in the farm size and increased quantity of input energy. Table 4.12 Energy output (MJ/ha) as per farm types Energy Output (GJ/ha)
Small farmers (< 3.2 ha)
Medium farmers (3.2 – 9.5 ha)
Large farmers (9.6 ha and above)
Grain 67.58 77.47 77.63
By Product 48.27 55.33 55.45
Total 115.86 132.80 133.09

31
4.18 Output - Input ratio of rice as per farmer types Energy ratio is the ratio of energy output to energy input. Average energy ratio of small, medium and large farmers is 8.20, 7.00 and 6.02 respectively (Table 4.12). Higher average energy ratio is observed in the small category of farmers i.e. 8.20 followed by medium with average energy ratio 7.00 and large farmer with an average energy ratio of 6.02. Table 4.13 Energy output – input relationship as per farm types Output- Input relationship
Small farmers (< 3.2 ha)
Medium farmers
(3.2 – 9.5 ha)
Large farmers (9.6 ha and
above) Energy ratio (average) 8.20 7.00 6.02
Standard deviation (SD) 1.30 1.28 1.45
Minimum 6.54 4.54 3.32
Maximum 10.12 8.96 7.39
Figure 4.7 Comparison of energy ratio as per farmer types

32
The difference in the average energy ratio the three groups of the farmers was confirmed by the analysis of variance, a parametric procedure, and Kruskal – Wallis test, a nonparametric procedure at 5% level of confidence. Scheffe and Tukey tests confirmed the pair wise significant difference between the average energy ratios of small and large categories of the farmers (Appendix A). The average energy ratios of the small farmers are significantly different then the large farmers at 5% level of confidence. However Scheffe and Tukey tests shows that there is no any significant difference between the energy ratios of the pairs of small and medium as well as medium and large categories of the farmers. Hence it is concluded that in the case study area the energy ratio decreases with the increase the farm area. 4.19 Specific energy and energy productivity of rice as per farmer types Specific energy is the amount of energy used to produce one kilogram of marketable yield, and in this case the marketable yield is the brown rice. The specific energy of small, medium and large categories of the farmers is 3.14 MJ/kg, 3.72 MJ/kg and 4.48 MJ/kg respectively. It means that 3.14 MJ of energy is being used by small farmers to produce one kilogram of rice. However in 3.72 MJ and 4.48 MJ of energy is being used by medium and large farmers respectively to produce one kilogram of rice. It shows that the small farmers are using less amount of energy to produce one kg of rice. In order to confirm the significant difference of the mean specific energy of the three groups of the farmers, analysis of variance, a parametric and Kruskal – Wallis test, a nonparametric procedure was used. The result shows that there is a significant difference in the mean specific energy of the three groups of the farmers (Appendix B). Furthermore Scheffe and Tukey tests are used in order to detect pair wise significance difference among the group at 5% level of confidence. It shows that there is a significance difference between the mean specific energy of small and large groups of the farmers. The energy productivity is the yield of marketable product i.e. grain per unit of energy consumed. The average energy productivity i.e. yields per unit of energy consumed decreases with the increase in the farm size. The small farmers have high energy productivity that is 0.32 kg/MJ. The energy productivity of medium and large farmers is 0.28 kg/MJ and 0.24 kg/MJ respectively. It means that one MJ of energy if used by small, medium and large farmers produce 0.32 kilogram, 0.28 kilogram and 0.24 kilogram of paddy rice. In order to confirm the significant difference of the average energy productivity of small, medium and large farmers, parametric procedure i.e. analysis of variance and nonparametric procedures i.e. Kruskal – Wallis test are used. The result shows that there is a significant difference in the average energy productivity between the three groups of farmers (Appendix C). Furthermore Scheffe and Tukey tests are used in order to detect pair wise significance difference among the three groups at 5% level of confidence. It detects that there is a significance difference between the average energy productivity of small and large groups of the farmers. The energy productivity of small farmers is 25% higher then the energy productivity of large farmers.

33
Table 4.14 Energy output – input relationship as per farm types Specific energy of total output (MJ/kg)
Small farmers (< 3.2 ha)
Medium farmers
(3.2 – 9.5 ha)
Large farmers (9.6 ha and
above)
Specific energy (MJ/kg) 3.14 3.72 4.48
Standard deviation (SD) 0.50 0.72 1.41
Minimum 2.49 2.81 3.41
Maximum 3.85 5.54 7.60 Table 4.15 Energy productivity of farmers as per farm types Energy productivity of total output (kg/MJ)
Small farmers (< 3.2 ha)
Medium farmers
(3.2 – 9.5 ha)
Large farmers (9.6 ha and
above)
Energy productivity (kg/MJ) 0.32 0.28 0.24
Standard deviation (SD) 0.051 0.051 0.057
Minimum 0.26 0.18 0.13
Maximum 0.40 0.35 0.29 4.20 Comparison of energy output – input ratio with international research The results of energy ratio of rice in the case study area is higher then the energy output ratio of rice observed in bullock operated farms that is 6.32 and tractor operated farms that is 4.16 in the west bank of Indus river in Dera Ismail Khan district in North West Frontier Province of Pakistan for the crop year 2005-06 (Khan et al., 2009). It is also higher then the ratios observed in Indo-gangetic plains during the years 2000-01 to 2003-04 for different cropping system that are 2.8, 2.7, 3.1 and 3.1 for rice-wheat, rice-potato-wheat, rice-wheat-greangram and rice-wheat-sesbania respectively (Chaudhary et al., 2009). The energy ratio of the case study area is lower then the energy ratio recorded by (Mushtaq et al., 2009) in his comparison of two developed and three developing countries for canal irrigation system in Philippines, Australia, USA and Indonesia that are 9, 11,11 and 11 respectively (Table 4.16).
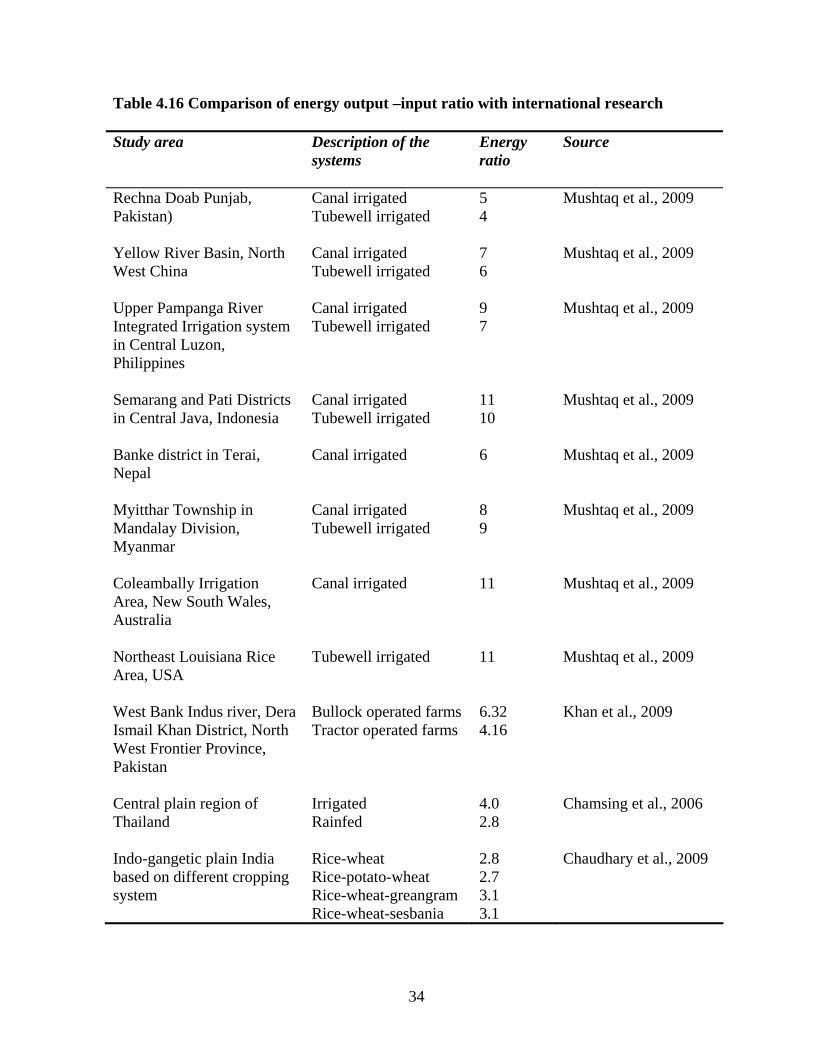
34
Table 4.16 Comparison of energy output –input ratio with international research Study area Description of the
systems
Energy ratio
Source
Rechna Doab Punjab, Pakistan)
Canal irrigated Tubewell irrigated
5 4
Mushtaq et al., 2009
Yellow River Basin, North West China
Canal irrigated Tubewell irrigated
7 6
Mushtaq et al., 2009
Upper Pampanga River Integrated Irrigation system in Central Luzon, Philippines
Canal irrigated Tubewell irrigated
9 7
Mushtaq et al., 2009
Semarang and Pati Districts in Central Java, Indonesia
Canal irrigated Tubewell irrigated
11 10
Mushtaq et al., 2009
Banke district in Terai, Nepal
Canal irrigated 6
Mushtaq et al., 2009
Myitthar Township in Mandalay Division, Myanmar
Canal irrigated Tubewell irrigated
8 9
Mushtaq et al., 2009
Coleambally Irrigation Area, New South Wales, Australia
Canal irrigated 11
Mushtaq et al., 2009
Northeast Louisiana Rice Area, USA
Tubewell irrigated 11 Mushtaq et al., 2009
West Bank Indus river, Dera Ismail Khan District, North West Frontier Province, Pakistan
Bullock operated farms Tractor operated farms
6.32 4.16
Khan et al., 2009
Central plain region of Thailand
Irrigated Rainfed
4.0 2.8
Chamsing et al., 2006
Indo-gangetic plain India based on different cropping system
Rice-wheat Rice-potato-wheat Rice-wheat-greangram Rice-wheat-sesbania
2.8 2.7 3.1 3.1
Chaudhary et al., 2009
35
Chapter 5
Conclusions and Recommendations
5.1 Conclusions In this case study, the energy consumption by small, medium and large farmers were examined in the Pakh Hai district the Ayutthaya province of Thailand. Following conclusions were drawn from the results obtained. 1. Mechanical energy is the main energy source that is being used by all the three categories
of the rice farmers followed by fertilizers inputs and then plant protection products. The share of non commercial energy inputs i.e. seed and human labour ranges 15-20 by all the three categories of the farmers. Animal draft is not being used in the case study area.
2. The results from the analysis of data of different energy inputs and outputs reveal that the energy consumption increases with the increase in the size of farm. The main difference is because the large farmers are using more mechanical and chemical energy inputs per hectare.
3. The farmers of the study area are using the germinated seeds for rice cultivation. They do
not raise nursery and therefore they can save labour energy inputs and time as well. 4. A difference in the consumption of mechanical energy and chemical energy is observed
between small, medium and large farmers. The average amount of mechanical energy inputs by small, medium and large farmers is 6499 MJ/ha, 8152 MJ/ha and 8904 MJ/ha respectively. The average quantity of the fertilizer energy inputs by small, medium and large farmers is 4130.25 MJ/ha, 6597.82 MJ/ha and 8523.77 MJ/ha respectively. The average amount of plant protection chemical used by small, medium and large farmers are 569.85 MJ/ha, 1257.25 MJ/ha and 1457.30 MJ/ha respectively.
5. The output of rice also increases with the increase in the size of the farm. The average
output per hectare of small, medium and large farmers is 116,857 MJ/ha, 132,800 MJ/ha and 133,087 MJ/ha respectively.
6. The mean energy ratio of small, medium and large farmers is 8.20, 7.00 and 6.02
respectively. It was confirmed that there is a significant difference in the mean energy ratio of the small and large categories of the farmers. The mean specific energy and mean energy productivity of the large and small categories of the farmers is also significantly different. The specific energy of small, medium and large farmers is 3.14 MJ/kg, 3.72 MJ/kg and 4.48 MJ/kg respectively. The energy productivity of small, medium and large farmers is 0.32 kg/MJ, 0.28 kg/MJ and 0.24 kg/MJ respectively. It indicates that the small farmers produce more with the same quantity of energy as compared to large farmers and it is 25% higher then the large farmers.

36
5.2. Recommendations Based on the results obtained from the research, a capacity building program is proposed via agricultural extension services that could be helpful for efficient use of the farm inputs as well as to increase the energy productivity. Recommendations for further research A research based on the socio economic aspects of the different groups of the farmers in order to compare the energy use pattern will help to pinpoint the socio-economic factors that compel the farmers to make the differences in energy uses in different agriculture practices and its productivity.
An integrated approach of the amount of energy input in various operations with the time of application during the crop cycle is also recommended for further study that will be helpful to find out the differences in the energy productivity.

37
References
Blengini, G.A., Busto, M. (2009). The life cycle of rice: LCA of alternative agri-food chain management systems in Vercelli, Italy. Journal of Environmental Management, 90, 1512-1522.
Canakci, M., Topakci, M., Akinci, I., & Ozmezri, A. (2005). Energy use pattern of some field
crops and vegetable production: Case study for Antalya region, Turkey. Energy Conversion and Management, 46, 655-666.
Chaichana, T., Chaitep, S., Jompakdee, W., & Dussadee, N. (2008). Energy analysis of wet
season rice production in northern Thailand. International Agricultural Engineering Journal, 17 (1-4), 1-7.
Choudhury, A.T.M.A., & Kennedy, I.R. (2005). Nitrogen fertilizer losses from rice soils and
control of environmental pollution problems. Comminications in Soil Science and Plant Analysis, 36, 1625-1639.
Chaudhary, R.C., Nanda, J.S., & Tran, D.V. (2002). Guidelines for identification of
constraints to rice production. International Rice Commission, Food and Agriculture Organization of United Nations, Rome.
Chaudhary, V.P., Gangwar, D.K., Pandey, D.K., & Gangwar, K. S. (2009). Energy auditing of
diversified cropping systems in Indo-gangetic plains. Energy, 34, 1091-1096. Chamsing, C., Salokhe, V.M., & Singh, G. (2006). Energy Consumption Analysis for Selected
Crops in Different Regions of Thailand. Agricultural Engineering International: the CIGR Ejournal. Manuscript EE 06 013 (VIII), from http://www.energy-based.nrct.go.th.
Deike, S., Pallutt, B., & Christen, O. (2008). Investigations on the energy efficiency of organic
and integrated farming with specific emphasis on pesticide use intensity. European Journal of Agronomy, 28 (3), 461-470.
Ellis, F. (1998). Peasant Economics, Farm households and agrarian economy: Cambridge
university press. FAO, (2004). International Year of Rice 2004. Food and Agriculture Organization of United
Nations, Rome, Italy. http://www.fao.org/rice2004. Gadde. B., Menke. C & Wassmann. R. (2009). Rice straw as a renewable energy source in
India, Thailand, and the Philippines: Overall potential and limitations for energy contribution and greenhouse gas mitigation. Biomass and Energy, 33, 1532-1546.
Gadde. B., Menke. C., & Wassmann. R. (2007). Possible energy utilization of rice straw in
Thailand: seasonal and spatial variations in straw availability as well as potential

38
reduction in greenhouse gas emissions. In: GMSARN international conference on sustainable development: challenges and opportunities for GMS. Pattaya, Thailand.
Hatirli, S. A., Ozkan, B., Fert, C. (2006). Energy inputs and crop yield relationship in
greenhouse tomato production. Renewable Energy, 31, 427-438. Kasmaprapruet, S., Paengjuntuek, W., Saikhwan, P., & Phungrassami, H. (2009). Life cycle
assessment of milled rice production: Case study in Thailand. European Journal of Scientific Research, 30(2), 195-203.
Khan, M.A., Awan, I.U., & Zafar, J. (2009). Energy requirement and economic analysis of
rice production in western part of Pakistan. Soil and Environment, 28(1), 60-67. Kizilaslan, H, (2009). Input-output analysis of cherries production in Tokat province of
Turkey. Applied Energy, 86, 1354-1358. Mandal, K.G., Saha, K.P., Ghosh. P.K., Hati, K.M., & Bandyopadhyay, K.K., (2002).
Bioenergy and economic analysis of soybean-based crop production systems in central India. Biomass and Bioenergy, 23, 337-345.
Matsuno, Y., Nakamura, K., Masumoto, T., & Matsui, H. (2006). Prospects for
multifunctionality of paddy rice cultivation in Japan and other countries in monsoon Asia. Paddy Water Environment, 4, 189-197.
Mushtaq, S., Maraseni, T.N., Maroulis, J., & Hafeez. M. (2009). Energy and water tradeoffs in
enhancing food security: A selective international assessment. Energy Policy, 37, 3635-3644.
Nassiri, S.M., & Singh, S. (2009). Study on energy use efficiency for paddy crop using data
envelopment analysis (DEA) technique. Applied Energy, 86, 1320-1325. NSO. (2006). National Statistical Office, Report of the Labor Force Survey, National
Statistical Office, Ministry of Information and Communication. Available online http://web.nso.go.th/index.htm.
OAE. (2005). Office of Agricultural Economics, Agricultural Statistics of Thailand. Available
online http://www.oae.go.th/statistic/export OAE. (2006). Office of Agricultural Economics, Ministry of agriculture and cooperatives,
agricultural statistics of Thailand. The survey’s report of major rice crop year 2006/07. OAE. (2008). Office of Agricultural Economics, Agricultural Statistics of Thailand, Bangkok.
Available online http://www.oae.go.th/statistic/export. Ozkan, B., Akcaoz, H., & Karadeniz, F. (2004). Energy requirement and economic analysis of
citrus production in Turkey. Energy Conversion and Management, 45, 1821-1830.

39
Pimentel, D., and Pimentel, M.H. (2008). Energy inputs and crop production in developing and developed countries. Food, Energy and Society: CRC Press, Taylor and Francis Group, 137-159.
Pimentel, D. (1980). Handbook of Energy Utilization in Agriculture: CRC Press, Inc. Boca
Raton, Florida Roy, R.N., & Misra, R.V. (2003). Economic and environmental impact of improved nitrogen
management in Asia rice-farming systems. In Sustainable of Rice Production of Food Security, Proceeding of the 20th Session of International Rice Commission, Bangkok, Thailand during 23-26 July 2002. Food and Agriculture Organization of the United Nation. Rome, Italy.
Singh, H., Mishra, D., & Nahar, N.M. (2002). Energy use pattern in production agriculture of
a typical village in arid zone, India – part I. Energy Conversion Management, 3, 2275-2286.
Singh, S & Mittal, J.P. (1992). Energy in production agriculture. Mittal Publications New
Delhi, India. Singh, H., Singh, A.K., Kushwaha, H.L., & Singh. A. (2007). Energy consumption pattern of
wheat production in India. Energy, 32, 1848-1854. Thepent. V. (2009). Country report: Thailand, agricultural mechanization development in
Thailand. Submitted to the fifth session of the technical committee of APCAEM during 14-16 October, 2009, Los Banos, Philippines.
Yilmaz, I., Akcaoz, H., & Ozkan, B. (2005). An analysis of energy use and input costs for
cotton production in Turkey. Renewable Energy, 30, 145-155.

40
Appendices

41
Appendix A
Statistical Analysis of Energy Ratios
Energy ratios Descriptives
95% Confidence Interval
for Mean
N Mean Std. Deviation Std. Error Lower Bound Upper Bound Minimum Maximum
Small 10 8.19868476E0 1.295556123 .409690818 7.27189974 9.12546978 6.537825 1.012093E1
Medium 17 7.00309704E0 1.276065916 .309491445 6.34700449 7.65918960 4.544745 8.962612
Large 9 6.01823201E0 1.448617027 .482872342 4.90472640 7.13173763 3.317319 7.389376
Total 36 7.08898848E0 1.518514092 .253085682 6.57519724 7.60277973 3.317319 1.012093E1
ANOVA
Energy ratios
Sum of Squares df Mean Square F Sig.
Between Groups 22.758 2 11.379 6.480 .004
Within Groups 57.948 33 1.756
Total 80.706 35
Non Parametric Test Descriptive Statistics
N Mean Std. Deviation Minimum Maximum
Energy ratio 36 7.0889884 1.518514092 3.317319 1.012093E1
Farmers group 36 1.97 .736 1 3
Kruskal-Wallis Test
Ranks
Farmers
group N Mean Rank
Small 10 26.50
Medium 17 17.00
Large 9 12.44
Energy ratio
Total 36
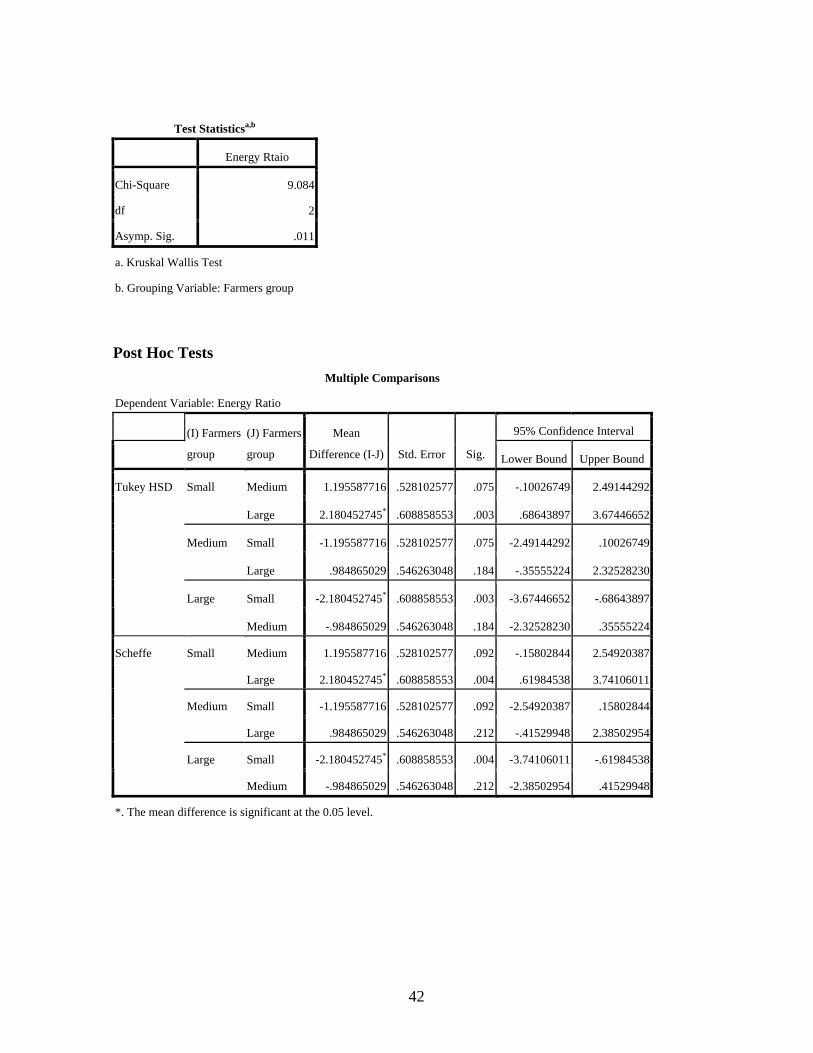
42
Test Statisticsa,b
Energy Rtaio
Chi-Square 9.084
df 2
Asymp. Sig. .011
a. Kruskal Wallis Test
b. Grouping Variable: Farmers group
Post Hoc Tests Multiple Comparisons
Dependent Variable: Energy Ratio
95% Confidence Interval
(I) Farmers
group
(J) Farmers
group
Mean
Difference (I-J) Std. Error Sig. Lower Bound Upper Bound
Medium 1.195587716 .528102577 .075 -.10026749 2.49144292 Small
Large 2.180452745* .608858553 .003 .68643897 3.67446652
Small -1.195587716 .528102577 .075 -2.49144292 .10026749 Medium
Large .984865029 .546263048 .184 -.35555224 2.32528230
Small -2.180452745* .608858553 .003 -3.67446652 -.68643897
Tukey HSD
Large
Medium -.984865029 .546263048 .184 -2.32528230 .35555224
Medium 1.195587716 .528102577 .092 -.15802844 2.54920387 Small
Large 2.180452745* .608858553 .004 .61984538 3.74106011
Small -1.195587716 .528102577 .092 -2.54920387 .15802844 Medium
Large .984865029 .546263048 .212 -.41529948 2.38502954
Small -2.180452745* .608858553 .004 -3.74106011 -.61984538
Scheffe
Large
Medium -.984865029 .546263048 .212 -2.38502954 .41529948
*. The mean difference is significant at the 0.05 level.

43
Appendix B
Statistical Analysis of Specific Energy
Specific Energy Descriptives
95% Confidence Interval
for Mean
N Mean Std. Deviation Std. Error Lower Bound Upper Bound Minimum Maximum
Small 10 3.14443921 .499894570 .15808054 2.78683618 3.50204225 2.489889 3.854493
Medium 17 3.71902170 .719806546 .17457873 3.34893132 4.08911208 2.811680 5.544865
Large 9 4.48237402 1.410153051 .47005101 3.39843443 5.56631361 3.410302 7.596495
Total 36 3.75025353 .999399012 .16656650 3.41210556 4.08840151 2.489889 7.596495
ANOVA
Specific Energy
Sum of Squares df Mean Square F Sig.
Between Groups 8.511 2 4.255 5.310 .010
Within Groups 26.447 33 .801
Total 34.958 35
Non Parametric Test Descriptive Statistics
N Mean Std. Deviation Minimum Maximum
Specific Energy 36 3.75025353 .999399012 2.489889 7.596495
Farmers Group 36 1.97 .736 1 3
Kruskal-Wallis Test
Ranks
Farmers
Group N Mean Rank
Small 10 10.50
Medium 17 20.00
Large 9 24.56
Specific Energy
Total 36

44
Test Statisticsa,b
Specific Energy
Chi-Square 9.084
df 2
Asymp. Sig. .011
a. Kruskal Wallis Test
b. Grouping Variable: Farmers Group
Post Hoc Tests Multiple Comparisons
Dependent Variable: Specific Energy
95% Confidence Interval
(I) Farmers
Group
(J) Farmers
Group
Mean Difference
(I-J) Std. Error Sig. Lower Bound Upper Bound
Medium -.574582487 .356771942 .255 -1.45002752 .30086255Small
Large -1.337934809E0* .411328514 .007 -2.34725046 -.32861916
Small .574582487 .356771942 .255 -.30086255 1.45002752Medium
Large -.763352322 .369040670 .112 -1.66890229 .14219765
Small 1.337934809* .411328514 .007 .32861916 2.34725046
Tukey HSD
Large
Medium .763352322 .369040670 .112 -.14219765 1.66890229
Medium -.574582487 .356771942 .287 -1.48904927 .33988429Small
Large -1.337934809E0* .411328514 .010 -2.39223930 -.28363031
Small .574582487 .356771942 .287 -.33988429 1.48904927Medium
Large -.763352322 .369040670 .134 -1.70926592 .18256128
Small 1.337934809* .411328514 .010 .28363031 2.39223930
Scheffe
Large
Medium .763352322 .369040670 .134 -.18256128 1.70926592
*. The mean difference is significant at the 0.05 level.

45
Appendix B
Statistical Analysis of Energy Productivity
Energy
Productivity
Descriptives
95% Confidence Interval for
Mean
N Mean Std. Deviation Std. Error Lower Bound Upper Bound Minimum Maximum
Small 10 .32534463 .051410957 .016257572 .28856745 .36212182 .259437 .401624
Medium 17 .27790068 .050637536 .012281407 .25186526 .30393610 .180347 .355659
Large 9 .23881873 .057484803 .019161601 .19463200 .28300546 .131640 .293229
Total 36 .28130907 .060258496 .010043083 .26092053 .30169761 .131640 .401624
ANOVA
Energy Productivity
Sum of Squares df Mean Square F Sig.
Between Groups .036 2 .018 6.480 .004
Within Groups .091 33 .003
Total .127 35
Nonparametric Test Descriptive Statistics
N Mean Std. Deviation Minimum Maximum
Energy Productivity 36 .28130907 .060258496 .131640 .401624
Farmers Group 36 1.97 .736 1 3
Kruskal-Wallis Test
Ranks
Farmers
Group N Mean Rank
Small 10 26.50
Medium 17 17.00
Large 9 12.44
Energy Productivity
Total 36

46
Test Statisticsa,b
Energy Productivity
Chi-Square 9.084
df 2
Asymp. Sig. .011
a. Kruskal Wallis Test
b. Grouping Variable: Farmers Group
Post Hoc Tests Multiple Comparisons
Dependent Variable: Energy Productivity
95% Confidence Interval
(I) Farmers
Group
(J) Farmers
Group
Mean
Difference (I-J) Std. Error Sig. Lower Bound Upper Bound
Medium .047443957 .020956451 .075 -.00397887 .09886678Small
Large .086525903* .024161054 .003 .02723964 .14581216
Small -.047443957 .020956451 .075 -.09886678 .00397887Medium
Large .039081946 .021677105 .184 -.01410922 .09227311
Small -.086525903* .024161054 .003 -.14581216 -.02723964
Tukey HSD
Large
Medium -.039081946 .021677105 .184 -.09227311 .01410922
Medium .047443957 .020956451 .092 -.00627097 .10115888Small
Large .086525903* .024161054 .004 .02459704 .14845477
Small -.047443957 .020956451 .092 -.10115888 .00627097Medium
Large .039081946 .021677105 .212 -.01648014 .09464403
Small -.086525903* .024161054 .004 -.14845477 -.02459704
Scheffe
Large
Medium -.039081946 .021677105 .212 -.09464403 .01648014
*. The mean difference is significant at the 0.05 level.