a community conversation is college worth it? college worth it... · is college worth it? a...
TRANSCRIPT

Is College Worth It?
A community conversation
Michael M. Crow
January 21, 2015 / Galvin Playhouse, ASU Tempe campus
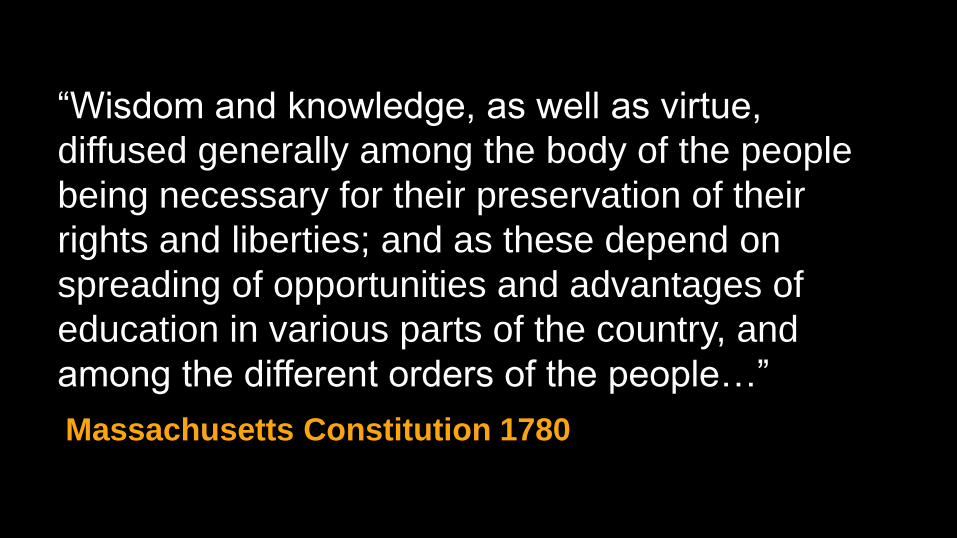
Massachusetts Constitution 1780
“Wisdom and knowledge, as well as virtue,
diffused generally among the body of the people
being necessary for their preservation of their
rights and liberties; and as these depend on
spreading of opportunities and advantages of
education in various parts of the country, and
among the different orders of the people…”

“…it shall be the duty of the legislators and
magistrates in all future periods of this
commonwealth to cherish the interests of the
literature and the sciences, and all seminaries of
them…”
Massachusetts Constitution 1780

“…especially at the university at Cambridge…”
Massachusetts Constitution 1780
CH. 5, SEC. 2

“Maybe it’s time to ask a question that seems almost sacrilegious: is all this investment in
college education really worth it? The answer, I fear, is that it's not. For an increasing
number of kids, the extra time and money spent pursuing a college diploma will leave
them worse off than they were before they set foot on campus.” – Megan McArdle,
Bloomberg View
“If you question the economic value of college, the defenders’ default answer is that it’s
priceless. Before long, spending four years in a lecture hall with a hangover will be
revealed as an antiquated debt-fueled luxury good.” – Peter Thiel, PayPal
“Knowledge is a form of capital that is always unevenly distributed, and people who have
more knowledge, or greater access to knowledge, enjoy advantages over people who
have less.” – Louis Menand, Harvard University
Varied Perspectives

The American Dream


Educational attainment is key to
social mobility.

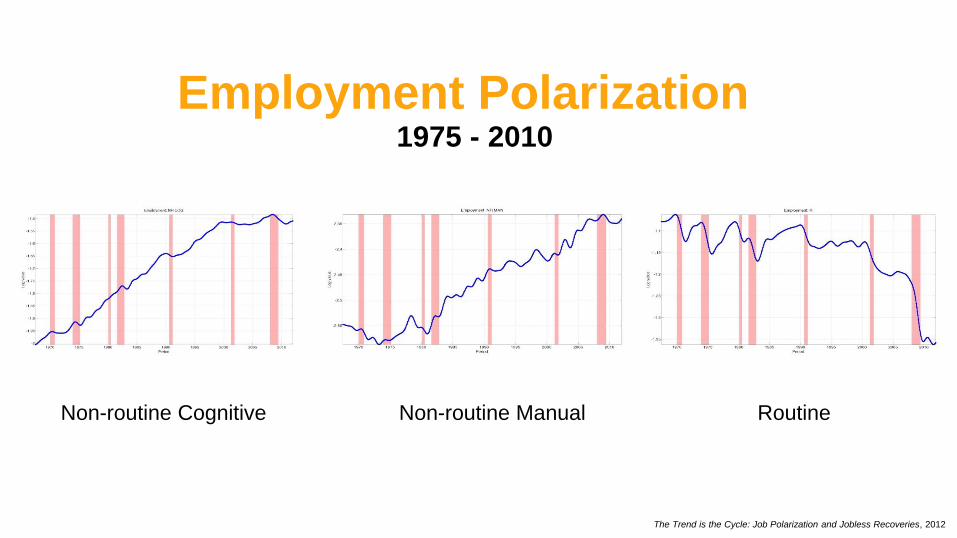
Employment Polarization
Non-routine Cognitive Non-routine Manual Routine
1975 - 2010
The Trend is the Cycle: Job Polarization and Jobless Recoveries, 2012
Value to the Individual

The internal rate of return for a
degree substantially exceeds the
cost of attending college.

Economists put the rate of return of
a degree in 2012 at 15%, far
above the return on stocks and
bonds.

Return to Bachelor’s Degree, by Major 2012
College Graduates
Overall Underemployed College Graduates
Total, all majors 15% 12%
Engineering 21% 17%
Math and computers 18% 14%
Health 18% 13%
Business 17% 14%
Communications 15% 13%
Technologies 15% 12%
Social sciences 15% 12%
Sciences 14% 12%
Architecture 14% 8%
Liberal arts 12% 9%
Agriculture and natural resources 11% 9%
Leisure and hospitality 11% 9%
Education 9% 7%
U.S. Census Bureau, American Community Survey; U.S. Department of Labor, O*NET; U.S. Department of Education, Digest of Education Statistics 2012; The College Board, Trends in College Pricing
2013 and Trends in Student Aid 2013
This is true even for so-called
“underemployed” college graduates.
Age
57 53 49 45 41 37 33 29 25 61
$160,000
$140,000
$120,000
$100,000
$80,000
$60,000
$40,000
$20,000
0
$180,000 E
arn
ing
s
Professional degree
Doctoral degree
Master’s degree
Bachelor’s degree
Associate degree
Some college
High school
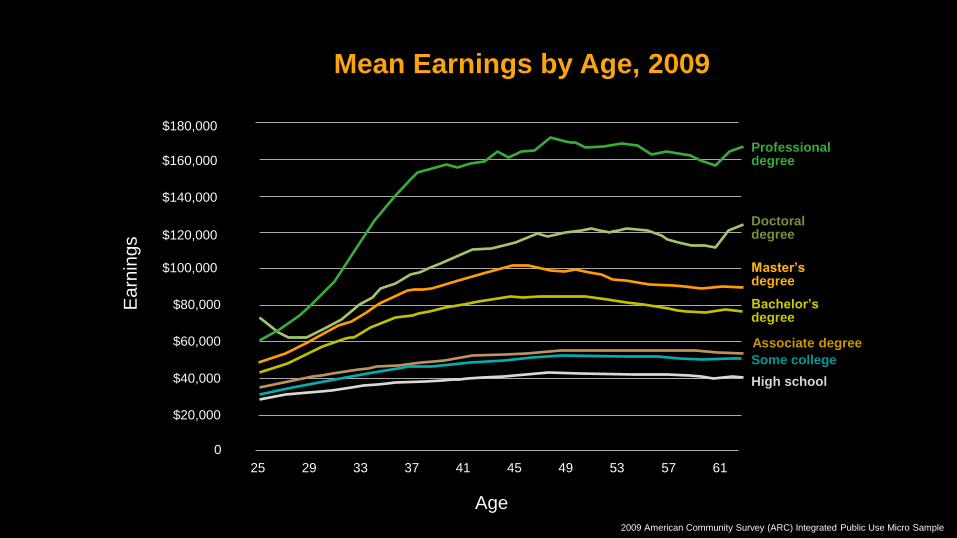
Mean Earnings by Age, 2009
2009 American Community Survey (ARC) Integrated Public Use Micro Sample

People who “learn to learn”
continue to earn over their lifetime
and earn more. Those who do not
see their wages remain flat as
they age.

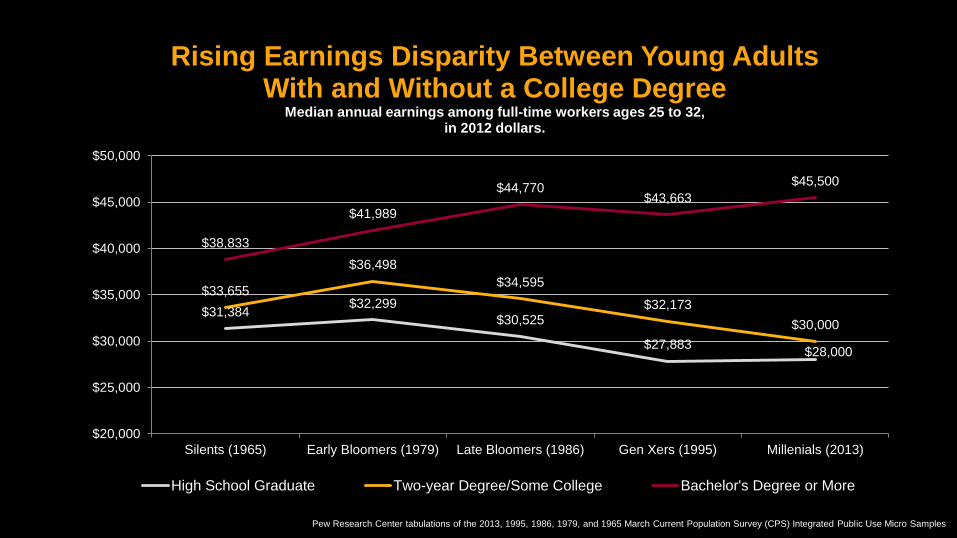
As time passes and more learning
is needed, the earnings gap
widens for younger generations.
$31,384 $32,299
$30,525
$27,883 $28,000
$33,655
$36,498
$34,595
$32,173
$30,000
$38,833
$41,989
$44,770 $43,663
$45,500
$20,000
$25,000
$30,000
$35,000
$40,000
$45,000
$50,000
Silents (1965) Early Bloomers (1979) Late Bloomers (1986) Gen Xers (1995) Millenials (2013)
Rising Earnings Disparity Between Young Adults With and Without a College Degree
Median annual earnings among full-time workers ages 25 to 32, in 2012 dollars.
High School Graduate Two-year Degree/Some College Bachelor's Degree or More
Pew Research Center tabulations of the 2013, 1995, 1986, 1979, and 1965 March Current Population Survey (CPS) Integrated Public Use Micro Samples

Value to Society

10%
5%
0%
-5%
-10%
-15%
-20%
15%
0%
9.1%
-9%
-14.1%
Ma
r-2
01
3
Dec-
2007
Dec-2
012
Ma
r-2
00
8
Sept-
20
12
Jun-2
012
Ma
r-2
01
2
Dec-2
011
Jun-2
008
Sept-
20
08
Dec-2
008
Ma
r-2
00
9
Jun-2
009
Sept-
20
09
Dec-2
009
Sept-
20
11
Jun-2
011
Ma
r-2
01
1
Dec-2
011
Sept-
20
10
Jun-2
010
Mar-
2010
Some graduates/no B.A. High school graduates
(no college)
College graduates Less than high school
Percent Change in Employment Since Start of Recession,
Sorted by Educational Attainment
Bureau of Labor Statistics, via Haver Analytics

The discrepancy between graduates from college and high school has grown far worse in recent years.
2010 2008 2006 2004 2002 2000 1998 1996 1994 1992
14%
12%
10%
8%
6%
4%
2%
0%
16%
2014
Year
Un
em
plo
ym
en
t R
ate
Less than a High School Diploma
Bachelor’s Degree or Higher
High School Diploma
Some College, No Degree
Associate Degree
Unemployment Rates Among Individuals Ages 25 and Older
Education Pays 2013: The Benefits of Higher Education for Individuals and Society, College Board

Recovery from the Great Recession
has not occurred for workers
without a college degree.
Employment has fallen for high
school graduates while it has grown
for degree holders.

ASU Analysis: Economic impact of ASU graduates in Arizona
Approx. 207,000 ASU
graduates worked in AZ in
2012.

Their aggregate earnings was
an estimated $11.4 billion.
ASU Analysis: Economic impact of ASU graduates in Arizona

They directly contribute an
estimated $819 million in state
taxes.
ASU Analysis: Economic impact of ASU graduates in Arizona

A two percentage point increase in the
share of university graduates in the
workplace would equal an estimated $1.2
billion gain in income and an additional
$87 million in state tax payments.
ASU Analysis: Economic impact of ASU graduates in Arizona

ASU Analysis: Economic impact of ASU graduates in Arizona
If ASU contributed to a 6 percentage point increase –
from 23.7% to 29.7% – of 25-to-34 year olds with a
bachelor’s degree who are absorbed into the AZ labor
market, the projected result would (in the steady state):

ASU Analysis: Economic impact of ASU graduates in Arizona
Raise AZ GSP by 3.5%

Generate a $623 million increase
in State taxes and fees combined
ASU Analysis: Economic impact of ASU graduates in Arizona

Increase combined State & Local
taxes by $777 million
ASU Analysis: Economic impact of ASU graduates in Arizona

Increase combined State & Local
taxes and fees by $1.12 billion
respectively
ASU Analysis: Economic impact of ASU graduates in Arizona

College graduates are more
likely to…
Have access to and participate
in employer-provided pension
plans

Have access to employer-
provided healthcare
College graduates are more
likely to…

Lead a physically active
lifestyle
College graduates are more
likely to…

Participate in both vigorous and
moderate exercise
College graduates are more
likely to…

Spend more time per day with
their children
College graduates are more
likely to…

Participate in volunteer
activities
College graduates are more
likely to…

Demonstrate a greater
understanding of political
issues and are more likely to
vote
College graduates are more
likely to…

College graduates are less
likely to…
Smoke

Suffer from obesity
College graduates are less
likely to…
College graduates are less
likely to…
Have children who suffer from
obesity

College graduates are less
likely to…
Live in households below the
poverty threshold

College graduates are less
likely to…
Participate in public
assistance programs
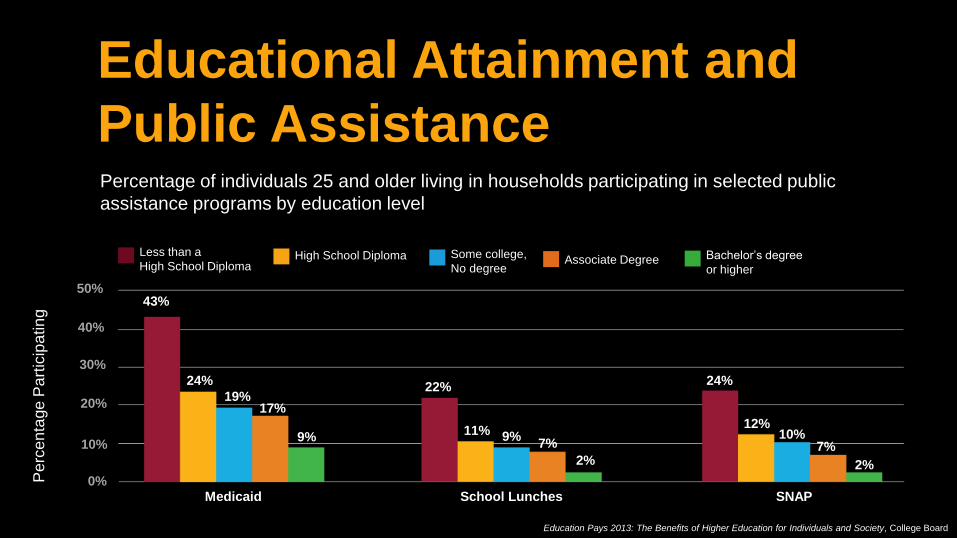
Educational Attainment and
Public Assistance
Pe
rcen
tage P
art
icip
atin
g
0%
10%
20%
30%
40%
50% 43%
24%
19% 17%
9%
22%
11% 9% 7%
2%
24%
12% 10%
7%
2%
Medicaid School Lunches SNAP
Less than a
High School Diploma High School Diploma Some college,
No degree Associate Degree Bachelor’s degree
or higher
Percentage of individuals 25 and older living in households participating in selected public
assistance programs by education level
Education Pays 2013: The Benefits of Higher Education for Individuals and Society, College Board

The Challenge
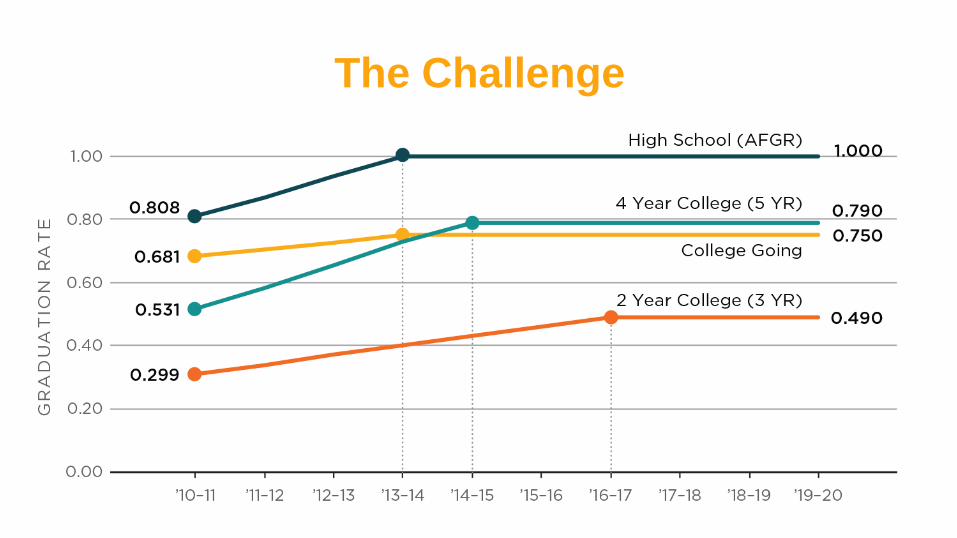
The Challenge

Scale

Progress to Date

Current Trajectories without Innovation

What about Arizona?

"Our economy … is growing, but it’s time to up our game. Our people have put their faith in Arizona’s future. They bring their families here, start businesses here, seek jobs here and build new lives here – believing in the promise of this state. Yet, as opportunity goes, in the rankings of states, Arizona is still too far down the list. We have what it takes to be at the top.” − Arizona Governor Doug Ducey
January 5, 2015

0
10
20
30
40
50
60
70
MA
SD
NJ
MN
ND
CT IA NE
NH
WI
PA
VA
NY
KS RI
MA
OH
MS
MO IN NC
AR
DE
US HI
CO
CA IL
TN
AL
MI
WV
GA
KY
NM
ME
WY
OK
SC
UT
VT
MT
TX
LA
FL ID
WA
AZ
OR
AK
DC
NV
Percentage of All Youths Enrolling in Postsecondary Education

Arizona is falling further behind.

60%
70%
80%
90%
100%
110%
120%
1997 1999 2001 2003 2005 2007 2009 2011 2013
Per Capita GDP Relative to US Average
Arizona
Colorado
Nevada
New Mexico
Oregon
Utah
Washington

-20%
-10%
0%
10%
20%
30%
40%
50%
4% 8% 12% 16% 20% 24% 28% 32%
Pe
rce
nt
Inc
rea
se
in
Pe
r
Ca
pit
a G
DP, 2
00
0-1
0
Change in Percent of 25 Year or Older Having Attained a Bachelors Degree or Higher, 2000-10
Relationship between Change in Educational Attainment and Economic Development in US States, 2000-2010
Data Sources: US Census Bureau,
North Dakota
Arizona
Utah
South Dakota

$0
$20,000
$40,000
$60,000
$80,000
$100,000
$120,000
1000 1200 1400 1600 1800
Pe
r C
ap
ita
GD
P
Sum of PISA Math, Reading and Science Scores
Education and Economic Growth in OECD Countries
Data Sources: OECD, PISA 2012;
Singapore
Arizona
United States

A New Economy
Requires a New Kind of
University

ASU Charter
ASU is a comprehensive public research university, measured not by whom it excludes, but by whom it includes and how they succeed; advancing research and discovery of public value; and assuming fundamental responsibility for the economic, social, cultural, and overall health of the communities it serves.

Demonstrate leadership in
academic excellence and
accessibility
ASU Goals

ASU Goals
Enhance our local impact and
social embeddedness

ASU Goals
Establish ASU as a global center
for interdisciplinary research,
discovery and development by
2020

ASU Goals
Enhance our local impact and
social embeddedness

Critical Thinking and Problem
Solving

Master Learner
Critical
Thinking
General
Education Breadth of
knowledge
Courses in
Major Deep subject
area expertise
Electives

72.8
64.4 64.7 64.3 64.1
58
60
62
64
66
68
70
72
74
ASU Gallup Study National GPI Public Universities Large, Public Universities(>10,000)
Private Universities
ASU Gallup Study % Employed Full-Time

Is there value in earning a college degree to
the individual?
Is there value in earning a college degree to
the economy and to society?
If Arizona is going to progress, do we need
to produce more master-learners?
YES.
YES.
YES.

Why do people still ask if college is
worth it?

