a common feature of theoretical models of firm capital ... · do banks strategically time public...
TRANSCRIPT

- 1 -
Do Banks Strategically Time Public Bond Issuance Because of the Accompanying
Disclosure, Due Diligence, and Investor Scrutiny?
Daniel M. CovitzBoard of Governors of the Federal Reserve System
Washington, DC 20551 U.S.A.
Paul HarrisonBoard of Governors of the Federal Reserve System
Washington, DC 20551 U.S.A.
This paper reflects the views of the authors only and not necessarily those of the Board ofGovernors, other members of its staff, or the Federal Reserve System. We thank an anonymousreferee and the editor for their detailed and comprehensive suggestions and Mark Carey, ChrisDowning, Nellie Liang, and David Smith and participants at the 2002 Conference on BankStructure and Competition for helpful comments. We also thank Susan Yeh for excellentresearch assistance.
Please address correspondence to Daniel Covitz, Mail Stop 89, Federal Reserve Board, 20th andC Sts. NW, Washington, DC 20551, phone (202)-452-5267, fax (202)-452-5295, [email protected]

- 2 -
Abstract
This paper tests a new hypothesis that bank managers issue bonds, at least in part, to convey
positive, private information and refrain from issuance to hide negative, private information.
We find evidence for this hypothesis, using ratings migrations, equity returns, bond issuance,
and balance sheet data for US bank holding companies. The results add to our understanding of
the role of “market discipline” in monitoring bank holding companies and also inform upon
how proposed regulatory requirements that banking organizations frequently issue public bonds
might augment “market discipline.”
JEL Codes: G21, G28, G32, G31.
Key Words: Bond Issuance, Disclosure, Due Diligence, Financial Institutions

- 3 -
1 Morgan (2002) and Mercer (1992) discuss the opaqueness of banks. Berger and Davies (1998),Berger, Davies, and Flannery (2000), and DeYoung, Flannery, Lang, and Sorescu (2001) showthat regulatory bank examinations contain private information.
2 Lang and Lundholm (1993) and Healy, Hutton and Palepu (1999), and Healy and Palepu(2001) find evidence for greater disclosure around public security issuance. SEC registrationrules require the disclosure of previously private “material” information. Blackwell, Marr, andSpivey (1990), Bloch (1989), Eccles and Crane (1988), and Auerbach and Hayes (1986) discussthe importance of underwriter due diligence. Sherman (1999) and Blackwell, Marr, and Spivey(1990) show that due diligence proxies are priced by the market. Ederington and Yawitz (1987)and Moody’s (2000) discuss how bond issuance focuses the attention of ratings agencies.
Banking research indicates that bank managers have substantial private information
about their firm’s credit quality, presumably because banks have assets and off-balance-sheet
exposures that are difficult to value.1 Other research has shown that firms tend to convey
private information to the market during the issuance of public securities, as a result of
disclosures by the firm and scrutiny by underwriters, investors, and rating agencies.2 Taken
together, these findings suggest a new hypothesis that bank managers with favorable private
information could issue public debt, in part, to convey that information to the market, while
managers with negative private information could hide from the market by delaying or forgoing
issuance. This paper tests this hypothesis on a sample of top-tier U.S. bank holding companies.
The main testable implication of this hypothesis is that the sample of debt issuers should
be skewed towards those with positive, private information. We test for this positive selection
by examining whether banks are more likely to be upgraded and less likely to be downgraded
after they issue bonds than non-issuing banks. To attribute links between debt issuance
decisions and subsequent ratings migrations to the revelation of private information, our tests
contain firm-level and macro-level controls for publicly available information. For robustness
along this dimension, we also run our tests of positive selection (measured with ratings changes)

- 4 -
3 See Smith (1986) for a summary of early research, and Shyam-Sunder (1991) for a morerecent empirical investigation. On the other hand, some recent studies of long-run performanceafter debt issuance find some evidence consistent with adverse selection, such as Spiess andAffleck-Graves (1999) using equity returns and Covitz and Harrison (2000) using ratingsmigrations.
using the component of debt issuance decisions that is orthogonal to public information. For
additional robustness, we measure positive selection with abnormal equity returns. Overall, our
empirical investigation yields substantial evidence consistent with positive selection.
We also find that positive selection manifests in ratings migrations in the quarter of and
the quarter after bond issuance. This helps discern the mechanism behind positive selection by
suggesting that substantial private information is revealed around the time when banks issue
public debt. The finding also suggests that the information revealed is more than a signal sent
by security choice (as in Noe, 1988, and Choe, Masulis, and Nanda, 1993), since one would not
expect credit ratings to respond to such signals.
Other results also help characterize the mechanism for positive selection. We find that
positive selection is strongest around subordinated debt issuance, relatively large debt issuance,
and debt issuance by relatively risky firms. This may reflect the greater disclosure/due-
diligence that one would expect around these types of debt issues.
Our findings run counter to the idea that public security issuance is characterized by
adverse (negative) selection, as in Myers and Majluf (1984). However, while there is
substantial evidence of adverse selection in public equity issuance, there is little empirical
evidence of, or theoretical support for, adverse selection in public debt issuance. Indeed, studies
of short-run equity returns after announcements of public debt issuance find mostly insignificant
effects, suggesting no selection process.3 Regardless, previous papers only consider

- 5 -
4 “Fed Funds and RP” liabilities plus “other borrowed” liabilities, which include term Fed Funds(non-overnight), totaled over $1 trillion in 2001
5 No doubt, there are other penalties associated with a ratings downgrade, such as a decline instock price. Goh and Ederington, 1993, and Hand, Holthausen, and Leftwich, 1992, show thatrating downgrades are associated with stock price declines.
nonfinancial firms, and the incentives behind positive selection may be particularly strong for
banks.
The primary incentive for bank managers to act strategically is that their overall funding
costs may depend materially on information revealed in the disclosure/due-diligence process.
Banks raise a substantial amount of funds in the short-term debt markets. On any given day
during the past year banks had over $50 billion in outstanding commercial paper, and probably
an order of magnitude more in short-term Fed Funds and LIBOR/Eurodollar borrowing.4 Short-
term debt issuance by itself is not likely to trigger a high degree of market scrutiny, since
default risk is low over short horizons. However, the cost of short-term debt issuance is likely
to be sensitive to an observable credit quality change, particularly if the debt is unsecured. In
addition, hedging costs and counter-party transactions may also depend materially on credit
ratings. Swap agreements and derivative contracts, commonly used by banks to manage
portfolio risk, typically contain triggers that are tied to credit ratings (see Moody’s, 2002).5
Moreover, banks may be relatively opaque, leaving scope for disclosure/due-diligence to
reveal material information. Morgan (2002) provides evidence of bank opacity and also shows
that the degree of opacity may be larger at banks with greater portfolio concentration in loans
and, in particular, trading assets. Regulation may also make banks more likely to use bond
issuance to manage private information. Supervision by bank regulators, as well as the
production of publicly available risk-based capital ratios, may induce the market to monitor

- 6 -
banks infrequently between bond issues. With less continuous monitoring, private information
may build up, creating greater scope for disclosure/due-diligence to reveal information.
Overall, our analysis supports the possibility that bank managers use bond issuance to
manage the flow of private information between banks and the market. Our findings, therefore,
break new ground in understanding the bond-issuance decision among banks by focusing on the
information-revelation motive. Covitz, Hancock, and Kwast (2001) show that relatively risky
bank holding companies tend to refrain from issuing subordinated debt during periods of
banking and financial turbulence. Billett, Garfinkel, and O=Neal (1998) find that banks tend to
shift funding away from risk-sensitive securities and into deposits when they become relatively
risky. Those papers establish that the financing of banks, presumably through the cost-of-funds,
depends on observable risk. Our results indicate that it is not only observable risk, but also
unobservable risk that shapes the bond issuance decision. Furthermore, our results suggest that
the revelation of changes in risk is, at least in part, endogenous.
Our results also have potential implications for elucidating the role of “market
discipline” in monitoring banking organizations. A number of a papers (see, for instance,
Billett, Garfinkel, and O’Neal, 1998, Flannery and Sorescu, 1996, Evanoff and Wall, 2001,
Jagtiani, Kaufman, and Lemieux, 2002, and Covitz, Hancock, and Kwast, 2001) find that the
bond market, particularly over the 1990s, has been sensitive to the credit risk of banks. Our
findings suggest that disclosure, investor scrutiny, and information revelation are an additional
mechanism of market discipline. Our results also suggest that regulations requiring banks to
frequently issue subordinated debt (see Kwast, et al., 1999, for a summary of proposed
regulations involving debt issuance requirements) would increase the transparency of bank
holding companies by limiting the extent to which they could hide negative private information.

- 7 -
The remainder of this paper proceeds as follows. In section II, we discuss how private
information can be revealed during the public debt issuance process. Section III presents our
primary empirical methodology, which uses ratings migrations to measure positive selection.
The data are described in section IV, and the main empirical results are presented in section V.
The robustness of our findings to additional controls for alternative hypotheses and to
alternative methodologies (including our analysis of abnormal equity returns) is considered in
section VI. We conclude briefly in section VII.
II. Information Revelation during Public Debt Issuance
Information revelation is likely to be associated with public debt issuance, in general,
because of voluntary and involuntary disclosures by the firm and heightened scrutiny by market
participants. Given the relative opacity of banks and the supervision of bank regulators, the
scope for information revelation at banks, as argued in the introduction, may also be greater
than at other firms. The accounting literature (see, for instance, Lang and Lundholm, 1993) has
established that firms tend to increase voluntary disclosures, such as earnings announcements,
in advance of issuance. Involuntary disclosure is mandated by SEC registration rules.
The Securities Act of 1933 requires the disclosure of material business and financial
information including up-to-date balance-sheet and profit-and-loss information and, particularly
relevant for banks, detailed information “to the latest practicable date” on charges against
reserves, on the “practice of the issuer” regarding charges, and on nonrecurring income items.
The Act also requires the disclosure of other previously-undisclosed information regarding
recent sales of unregistered securities, new undertakings, material contracts, acquisitions, and
the use of proceeds. Because the Act prohibits “deceit, misrepresentations, and other fraud in

- 8 -
6 See the “Securities Act of 1933” at http://www.sec.gov/about/laws.shtml and SEC Form 8-K.
7 Section 11 of the Securities Act of 1933.
the sale of securities” it opens the issuer to liability for failing to provide adequate disclosure of
any “material events or corporate changes.”6 This means that items that otherwise might go
undisclosed should be revealed, such as the existence of a preliminary investigation by bank
regulators, securities regulators, or prosecutors, the hiring of bankruptcy lawyers, a pending
acquisition or significant sale of assets or liabilities, and, almost certainly, the booking of
reserves for losses known at the time of the registration.
More important than these disclosures, no doubt, are the scrutiny of underwriters, rating
agencies, and investors. The underwriter has a fiduciary responsibility and concomitant
liability, as well as substantial reputational capital at risk, to investigate the issuer to ensure that
bond investors are not immediately subjected to a foreseeable adverse credit shock. Section 11
of the Securities Act holds underwriters liable for material misstatements in and omissions from
the registration statement, unless they can establish having conducted a “reasonable” inquiry
such as would be performed by a “prudent man in the management of his own property.”7 This
so-called “due diligence investigation” increases disclosure by pitting the underwriter against
the issuer. “Underwriters gather information about the firm through personal interviews,
inquiries of independent sources, and other means. In brief, the due diligence investigation
represents the investment bankers’ effort to discover any potentially adverse inside information
about the issuing firm.” (Blackwell, Marr, and Spivey, 1990, 247; see also Bloch, 1989, Eccles
and Crane, 1988, and Auerbach and Hayes, 1986). The actual extent of due diligence is, of
course, unobserved. Nonetheless, lawsuits under Section 11 have established that underwriters,

- 9 -
8 By assuming that the private information is about changes in credit quality, we are allowing theprivate information to effectively be either about firm value or firm volatility.
9 Bond prices would reflect market expectations, but are noisy measures of credit risk due tomarket factors and may also respond to a signal sent by security choice, while rating changes are
to avoid liability, must go beyond merely accepting the statements of corporate officers as
accurate and truthful (Blackwell, Marr, and Spivey, 1990, 248).
Rating agencies are also likely to pay more attention to firms at issuance (see, for
instance, Ederington and Yawitz, 1987, and Moody’s, 2000). Not only could this closer
scrutiny provide a more recent and thorough reading of the credit worthiness of the issuer from
available public information, but rating agencies can receive private information from the
issuer, such as acquisition plans and business strategies, detailed forward-looking projections
including financial and operational variables broken down by unit, as well as information about
litigation and investigations underway. Investors, many of whom have extensive expertise in
credit analysis, are also likely to perform their own due diligence by conducting an independent
credit investigation before adding the security to their portfolio.
III. Empirical Methodology
In order to test the main implication of our hypothesis, positive selection, we measure
good news with ratings upgrades and bad news with ratings downgrades. Rating migrations
reflect changes in credit quality and changes in credit quality are what bondholders care about.8
Rating migrations are also the logical outcome measure because they indicate credit quality
changes that are likely to be substantial enough to move short-term financing costs, especially if
those markets rely on credit ratings. An alternative (but analogous) strategy would be to
examine changes in bond prices around bond issuance.9

- 10 -
only likely to respond to actual concrete, discrete, changes in credit quality. Rating migrationshave been shown to be informative for market prices in a number of studies (see, for instance,Goh and Ederington, 1993, or Hand, Holthausen, and Leftwich, 1992) and have been used asoutcome measures (see, for instance, Simkins, 1999, and Covitz and Harrison, 2000).
Our primary methodology – alternative methodologies are discussed and implemented in
the robustness section – is to test whether the probability of a firm being upgraded, downgraded,
or having no change in rating is related to recent bond issuance. The basic model specification
is presented in equation (1) and estimated as an ordered-logit model at a quarterly frequency.
Pr(Down/No/Up)t=� +�1Bondlag + �2Ratingt-2 + �3 �Ratingt-4 less t-1 + �4ROAt + �5ROAt-1
+ �6Conditionst + �7Conditionst-1 + �t (1)
“Bondlag” is the key explanatory variable indicating whether a firm has issued a public bond in
some prior quarter, usually the previous one. The other independent variables are
straightforward. “Ratingt-2” is Moody’s rating of the firm’s senior debt, lagged twice to avoid
constructing a correlation with the dependent variable, where an “Aaa”-rating is coded as a 1,
“Aa1” as 2, and so forth to “C” as 21. Robustness to a richer specification using a series of
dummy variables for each rating category is discussed later. “ROA” is the bank holding
company’s return on assets. We include it to control for the impact of easily observable
information on ratings migrations since it would be difficult to believe that a bank would need
to issue debt to make investors pay attention to its profitability. “Conditions” denotes a variable
that controls for macroeconomic conditions. Contemporaneous measures of this variable
control for aggregate migration patterns over time, while lagged measures control for the
confounding hypothesis that both bond issuance and upgrades are responding to past macro

- 11 -
10 This is not a case where we would want to control for sample selection since we are, in fact,testing a hypothesis of sample selection on an unobservable – issuers self-select to reveal privateinformation – versus a null of no conditional effect.
conditions. We consider three alternative proxies for macroeconomic conditions, using either
the Merrill Lynch BBB-rated corporate bond index yield, an NBER dummy variable that equals
one if the quarter is part of a recession, and a full set of year dummies. The twice lagged
“Rating” variable controls for differences in migration tendencies between higher- and lower-
rated bank-holding companies. “�Rating”, constructed so that an upgrade is positive, controls
for potential serial correlation in ratings (e.g., downward ratings spirals).
Keep in mind that, conditional upon our hypothesized mechanism, the estimated
equation omits the true variable of interest and so bond issuance lumps together the effect of the
bond issuance itself with the unobservable information revelation that occurs with bond
issuance. We are testing the joint hypothesis that bond issuance causes information to be
revealed and that firms react strategically.10 This also must be distinguished from any unrelated
positive correlation between issuance and migrations. Our strategy is therefore to control for
observable firm (and macroeconomic) characteristics that might link bond issuance with
migrations and attribute the remaining effect to the unobservable information revelation (also
see the two-step procedure below). The estimation is not the sample equivalent of the effect
from a random assignment of bond issuance. Rather, it is the effect of strategic issuance,
meaning that the �1 coefficient is, of course, a biased estimate of the random issuance effect, but
not of what we want – the strategic issuance effect.
The error term, �t, is assumed to be independently and logistically distributed across
observations. The extensive control variables support the independence assumption. Across-

- 12 -
11 Despite Moody’s practice of rating bond issues, the fundamental credit quality analysis istypically done at the issuer level. See Moody’s (1999a and 1999b).
firm correlations in migration tendencies are controlled for by the level and lagged change in
the firm’s ratings, as well as the firm’s return on assets. Fixed effects are not useful in this
context because the mean migration probabilities are close to zero (between 4 and 5 percent for
both upgrades and downgrades). Including them, therefore, has little effect on the estimated
subordinated-debt coefficient and their inclusion is strongly rejected. Across-year correlations
in migration tendencies are controlled for by the macroeconomic conditions variable.
IV. Data
Rating migrations and bond issuance data are from Moody’s Credit Risk Management
Services database, which includes ratings from 1980 to 1998 inclusive. Ratings changes were
measured at the firm level using Moody’s estimated senior unsecured debt ratings.11 This rating
is a summary measure of the firm’s credit quality, rather than of any one bond, and is
constructed to be comparable across firms. Although this rating will be above the bank’s
subordinated-debt rating, given Moody’s practice of notching subordinated debt below senior
debt, the cross-sectional differences are equivalent. Moreover, changes in this rating, which we
use as our outcome measure, will reflect changes in the firm’s credit quality and show up as
rating changes for both their senior and subordinated debt and thus in their cost of funds.
The Moody’s ratings database provided ratings for 171 bank holding companies. The
bond issuance variables were constructed only from bonds issued in the U.S., excluding bonds
for which there were indications that the bond’s value was not closely tied to the issuer’s credit

- 13 -
quality. That is, we excluded bonds with third-party credit enhancements and limited our
sample to straight debt issues – the main effect of which is to eliminate asset-backed issuance.
Balance sheet data were obtained from Federal Reserve Y-9 reports (FR Y-9C, FR Y-
9LP, and FR Y-9SP) and are available on the Chicago Federal Reserve’s website. Linking the
Y-9 data with the migrations and bond issuance data required matching each holding company
in the Moody’s database with a call report identifier number. We could link up Moody’s and Y-
9 data for 136 bank holding companies, keeping only top-level holding companies. Banks were
dropped from the sample when acquired. We also restricted our sample to observations from
1990-1998 (our ratings database ended in 1998), as research has shown that prior to the 1990s,
implicit government guarantees made bank bonds insensitive to bank risk (see Flannery and
Sorescu, 1996), yielding 2494 quarterly observations.
The ratings and issuance data are summarized by year in Table 1. The first column
shows the number of quarterly, bank observations. The sample contains 300 observations in
1990, but due to the consolidation of the industry, declines to 245 by 1998. Upgrades and
downgrades were fairly cyclical, as shown in the second and third columns, with downgrades
dominating in 1990 and 1991 and upgrades more prominent in the rest of the sample. Public
debt issuance by banks was also somewhat cyclical, weak in 1990 and stronger from 1991 to
1996, before falling by about half in the last two years of our sample, even as economic
expansion continued. About 4/5 of the public bond issues in our sample are subordinated.
Daily equity price data used in our analysis of abnormal returns were obtained from
CRSP. We merged the stock data with straight-bond issuance dates, obtained from Securities
Data Company, for bank holding companies from 1993-2000. Returns are calculated around the
issue date and compared to returns over the same time period for the Dow Jones Bank Index.

- 14 -
12 For the remainder of the specifications, we use the BBB bond yield as our macroeconomiccontrol variable, although the results are robust to this choice.
13 When the model is estimated with quarter dummies, the likelihood function does notconverge.
V. Empirical Results
Positive Selection After Subordinated Debt Issuance
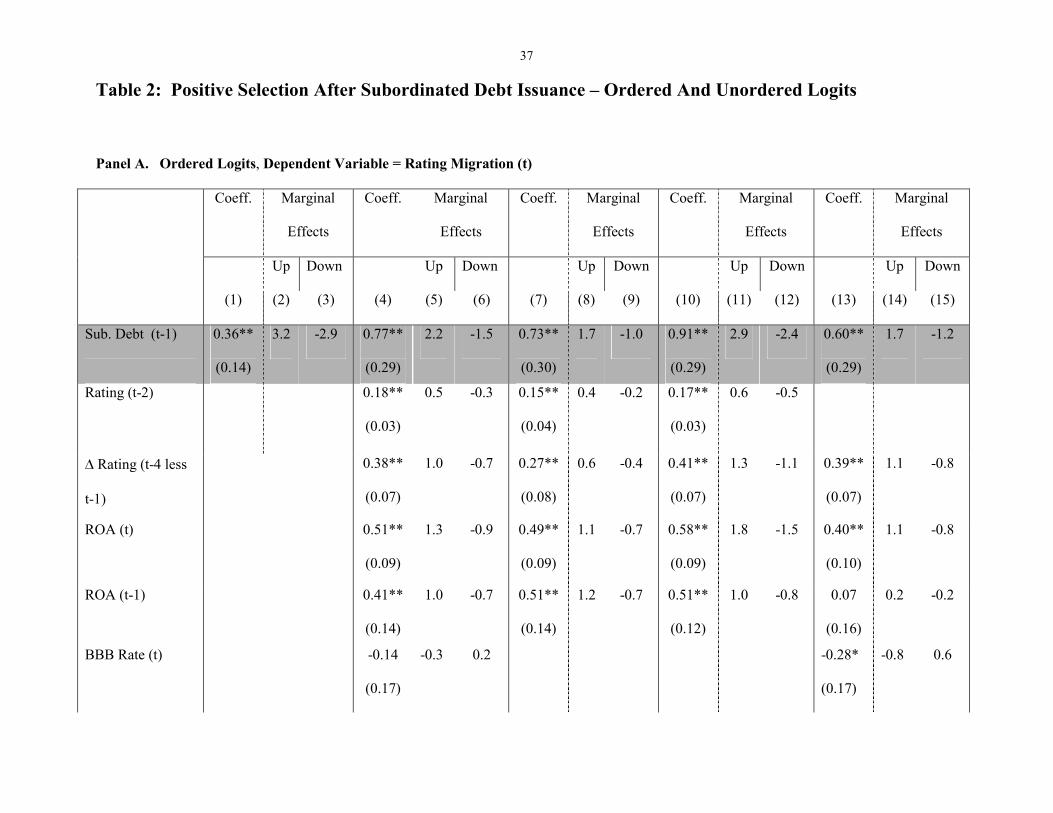
Panel A of Table 2 displays results for three specifications of our basic model, estimated
as an ordered Logit. The results for the stripped-down, unconditional, specification (columns 1-
3) show that the coefficient on the variable indicating whether subordinated debt was issued in
the previous quarter is significantly greater than zero at the 5% error level. The marginal effects
(columns 2 and 3) indicate that bank holding companies that issued subordinated debt in the
prior quarter were 3.2 percent more likely to be upgraded and 2.9 percent less likely to be
downgraded than other bank holding companies.
The second set of results (shown in columns 4-6) establish the robustness of the
unconditional results to controls for lagged rating level, lagged change in rating, lagged and
contemporaneous return on assets, and lagged and contemporaneous Merrill Lynch index of
BBB corporate bond yields. The coefficients on the control variables, discussed in detail below,
are almost all significant. The estimation result for the key subordinated debt issuance variable
shows that the marginal effects are reduced a bit. When we use year dummies in place of the
BBB (columns 7-9), the issuance effects are again a bit weaker, but still significant, and the
results are a bit stronger when we replace the BBB with an NBER recession indicator (columns
10-12).12, 13 Replacing the linear ratings control variable with dummy variables for each rating

- 15 -
14 This is consistent with the non-linear specification too.
group (“Aaa,” “Aa,” “A,” “Baa” and so on) also reduces the marginal effects from subordinated
debt issuance a bit, but they are still significant (columns 13-15).
Overall, we take this as strong evidence that a “positive selection” effect is discernible,
since even conditioning upon firm and economic conditions does not eliminate the effect.
Positive selection appears to be an important economic effect. The marginal effect of
subordinated debt issuance on an upgrade, for instance, is 2.2 percent (column 5). The
unconditional effect in the population is about 4.3 percent. This implies that the marginal effect
is important – over 50 percent of the unconditional. The total effect, however, is small since
subordinated debt issuance is relatively infrequent – only about 7 percent of observations.
The marginal effects for the lagged ratings variable and the change in ratings variable
provide interesting insights into the migration tendencies for bank holding companies in the
1990s. The marginal effects for the lagged rating variable indicate that riskier (higher ratings
notch in our ordering) holding companies are more likely to be upgraded and less likely to be
downgraded.14 Examination of the actual ratings distribution over time reveals that the result
reflects mostly risky bank holding companies being upgraded. As a result, the ratings
distribution of bank holding companies narrowed over the 1990s, with the standard deviation of
ratings falling steadily from its peak of 3.4 in 1991 to 1.8 in 1998.
One possible explanation for the narrowing of the ratings distribution over the 1990s is
that prompt corrective action, instituted in 1991, induced relatively risky holding companies to
move away from the 8% risk-based capital ratio threshold that triggers the first round of

- 16 -
15 Another explanation is that the generally favorable economic environment of the 1990sbenefitted risky bank holding companies more than safe ones (Berger, Bonime, Covitz, andHancock, 2000, provide evidence that risky banks tended to perform consistently in the upper-end of the performance distribution in the 1990s).
16 For example, downgrades may lead to higher funding costs and possibly limit a bank’s abilityto participate as a counter-party in derivatives transactions.
regulatory punishments.15 This could muddle the interpretation of our results if banks both
issued a lot of subordinated debt and simultaneously cleaned up their balance sheets in the early
1990s to please the regulators. We split our sample in half and find (but do not report) that the
evidence for our effect is consistent across the two time periods but stronger in the second time
period which is evidence that this “regulator” explanation for issuance and migrations is not the
driving factor (later we directly assess the role of subordinated debt as a regulatory cushion).
The marginal effects for the lagged ratings change variable (which is constructed so that
a one-notch upgrade equals +1) indicate that recently upgraded firms are more likely to be
upgraded, while recently downgraded firms are more likely to be downgraded. Thus, rating
migrations occur in strings, probably because performance is serial correlated, but possibly
because ratings migrations cause changes in credit quality.16 Another possible explanation is
that rating agencies are slow to fully adjust to substantial changes in credit quality, perhaps
because they do not wish to signal that they made a big mistake.
Panel B of Table 2 presents marginal effects for the probability of a downgrade, the
probability of no migration, and the probability of an upgrade when the equations are estimated
as unordered Logits. Ratings migrations are a natural choice for an ordered model, which
should be more efficiently estimated. Nonetheless, we run the unordered Logits to test the
restrictiveness of these assumptions on the estimated effects. The results (shown in columns 1-

- 17 -
17 The results in Table 2 are similar when estimated as a Probit.
3) for the stripped-down, unconditional, specification including the one-quarter lag of the
subordinated debt issuance dummy as the only independent variable, indicate that bank holding
companies are 4.3 percent less likely to be downgraded and 2.7 percent more likely to be
upgraded in the quarter after they issue subordinated debt. These results are statistically
significant at the 10 and 5 percent error levels, respectively.
After adding the control variables (columns 4-6) the results still completely support the
findings from the ordered model in Panel A – in fact, the marginal effects are surprisingly
similar – but differ in that the marginal impact of debt issuance on the likelihood of a
downgrade is now not estimated to be statistically significant. Again, our basic conclusion from
Table 2 is that bond issuance by bank holding companies is associated with positive selection.17
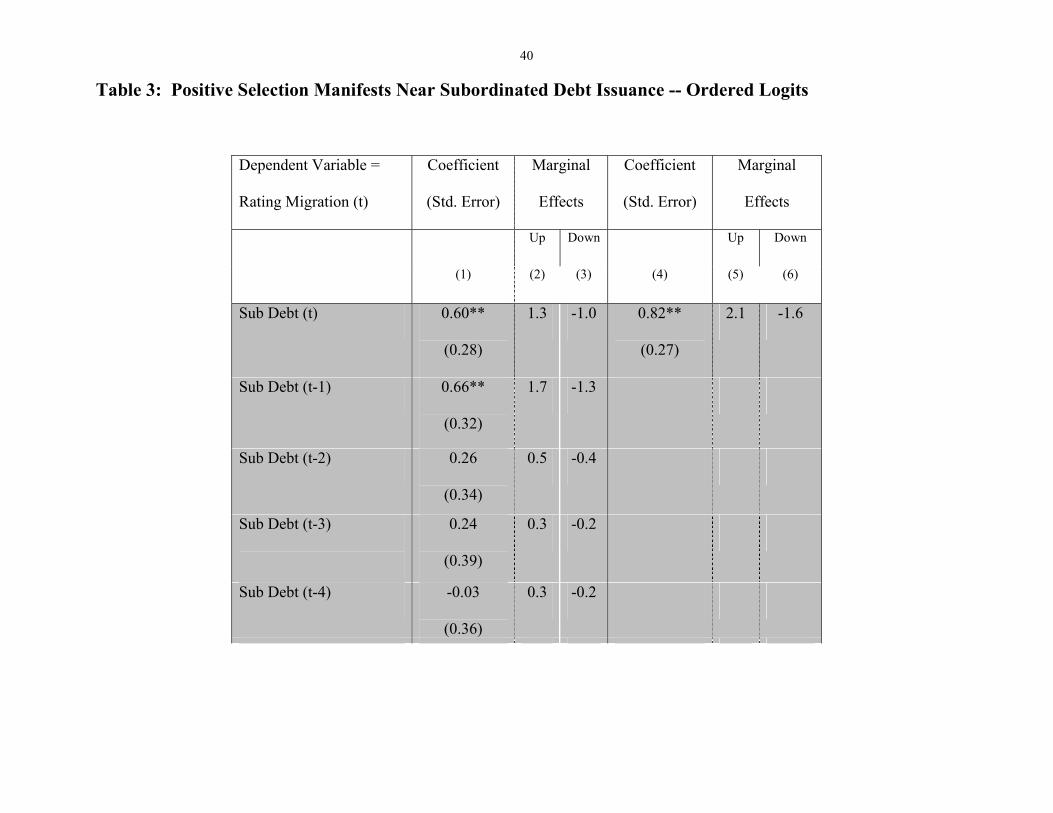
Positive Selection Manifests Near Subordinated Debt Issuance
The first set of results presented in Table 3 is from a specification that includes, in
addition to the usual control variables, five different issuance dummy variables, each indicating
subordinated debt issuance in a different quarter, ranging from the current quarter to 4 quarters
prior to the current quarter. The results (columns 1-3) indicate that the coefficients on the one-
quarter lag and current quarter of the issuance dummy are the only significant issuance
coefficients. As can be seen in the specification using only the current-quarter issuance dummy
(columns 4-6), that coefficient is highly significant and yields marginal effects very similar to
those from the specification with only the lagged issuance variable reported in Table 2.
These results are important because they indicate that information is being generated
around the time when firms issue subordinated debt and not later. This lends credence to the

- 18 -
18 We consider this alternative explanation for positive selection again later.
idea that information about credit-quality is being revealed at issuance and makes a signaling
alternative less likely than the information-based explanation since ratings are likely to respond
to concrete new information but not to a signal. In addition, because we control for firm- and
market-level information that is public prior to issuance, as well as for observable performance
between the issuance date and rating change, the significant findings suggest that issuance
reveals new private information, rather than simply follows past performance.18 It is important
to note that the finding of positive selection does not appear to be driven by the fact that the
outcome is measured with rating changes but rather by the fact that the issuers are banks. Using
a similar methodology, Covitz and Harrison (2000) show that debt issuance by investment-
grade nonfinancial firms is characterized by negative selection and subsequent downgrades.
Although rating changes appear to often lag the bond issue, this does not suggest that the
market is inefficient or that investors are “fooled.” Rather, we assume that the market uncovers
the issuer’s information at issuance and rating agencies are simply lagging. This is consistent
with the limited empirical research on the reaction of rating agencies. Holthausen and Leftwich
(1985) find that rating changes lag the stock market by at least 60 days and Ederington and Goh
(1998) find that rating changes lag analyst revisions by at least a quarter. This lag could be
explained by a number of factors. It may be that rating agencies wait to “validate” the new
information learned at issuance. Thus, the lag could reflect that the type of information being
revealed is diffuse or ambiguous since a significant and unambiguous information event such as
a merger or exogenous demand shock (for instance the effect of the 9/11 terrorist attack on the

- 19 -
airlines) results in a rating lag often numbered in days rather than weeks. It may simply be that
the rating process itself takes time and so naturally occurs with a lag.
The significant contemporaneous quarter results are also consistent with the hypothesis
of information revelation at issuance. However, to avoid the possibility of reverse causality, we
conservatively focus on the lagged-quarter results since, in that case, we can be sure that the
information revelation precedes the rating change given that the timing of the two events within
the current quarter is unknown. Of course, the current-quarter findings are completely
complementary, all the more so because the information revelation presumably leads the actual
issuance date. Regardless, our use of only the one-quarter lagged issuance dummy should only
make it more difficult to observe the predicted effect.
Bond Size and Positive Selection After Subordinated Debt Issuance
To test whether positive selection is stronger for larger issues, we add a variable that
measures the size of the subordinated debt issue in the prior quarter. This is effectively an
interaction variable between issue size with whether subordinated debt was issued. The results
are presented in the first three columns of Table 4. Since issuance equals zero for the large
majority of observations, the size interaction is very highly correlated (rho = 0.89) with the
issuance dummy variable. This inflates the standard errors on the two coefficient point
estimates. However, as expected, they are jointly significant. Interpreting the point estimates
implies that about half of the effect from issuance on migrations comes through the act of
issuing and about half through the size of the issue. For every extra $100 million of issue size
(the variable is in units of $10 million) the probability of an upgrade increases by 0.5 percent –
meaning that large bonds are almost 2 percent more likely to be upgraded than small bonds.

- 20 -
Another way to examine this issue is to estimate the effect of size on the upgrade
probability, conditional on issuance. This is shown in column 4, indicating that big bonds
(bonds greater than median issue size) are significantly more likely to be upgraded than small
bonds. The marginal effect estimated here implies that large bonds are 9 percent more likely to
be upgraded than small bonds. One might be concerned that the relationship between the size
variable and the tendency towards upgrades spuriously reflects the fact that the average size of
subordinated debt issues and the frequency of upgrades both increase over the 1990s. For this
reason the dummy variable is constructed relative to issue sizes for each year, and not for the
entire sample. Nonetheless, if we replace the BBB interest rate with year dummies, the
coefficient on the size variable is still significant at the 5 percent level (not shown).
Column 5 shows the results when the issue size dummy is replaced with a dummy for
firm size, as proxied by total assets, again constructed relative to each year. Firm size is less
significant, but indicates that large issuers are still 6 percent more likely to be upgraded than
small. Of course large issuers are those most likely to issue the larger bonds. The final column
shows that, when both are included, the effect appears to come through issue and not issuer size.
Bank Risk and Positive Selection After Subordinated Debt Issuance
It is plausible that positive selection is more prevalent among riskier banks because they
may have more scope for information revelation. To test this we interact risk measures with
bond issuance. Specifically, in Table 5, we introduce three new variables: “securities” which
measures the share of total assets in securities, “trading assets” which measures the share of
assets in trading activities, and “rating dummy” which is a dummy variable for whether the
bank is risky (defined relative to the median rating each year) or safe. Each variable is

- 21 -
19 Moreover, testing the implications of our hypothesis on subordinated debt by itself allows usto directly comment on proposals for augmenting “market discipline” that would require bankholding companies to frequently issue subordinated debt.
estimated to have a negative effect on upgrades, although the effect from securities is weak.
Due to the high degree of collinearity between the interaction terms and the issuance variable, it
is difficult to assess the effects independently. However, taken together the two variables are
jointly significant and the coefficients on the interaction terms are positive, indicating positive
selection is stronger for riskier firms. This appears to bolster our proposed mechanism.
Positive Selection Around Senior Debt Issuance
We also test for positive selection after senior debt issuance, though the investigation is
hampered by the high degree of correlation between the senior debt issuance variable and the
constant. Only 1.5 percent of the observations in our sample contain a senior debt issue. We
report results in Table 6 using our standard control variables and a variable for senior debt
issuance in period t or t-1. The issuance variable is positive in both models but only significant
in the first, suggesting that senior debt issuance is a weak trigger of positive selection. This
weaker effect may owe to less market scrutiny of senior debt issuance, since it is less credit
sensitive than junior debt (as in Flannery and Sorescu, 1996). If true, our hypothesis is more
valid for subordinated debt issuance, which triggers more scrutiny.19 Or, it might be that we
simply do not have enough data to estimate the positive selection effect precisely.
VI. Robustness
Controlling for “Capital Cushion” Effects

- 22 -
20 This last variable could proxy for non-regulatory cushion effects too. For instance, if newlyissued subordinated debt replaces senior debt in the capital structure it could, by nature of itsjunior priority status in bankruptcy, reduce expected losses to senior debt claimants. Ratingagencies might upgrade firms that modified their capital structure in this way since the issuerrating is defined as a firm’s ability to meet the obligations of its senior unsecured debt holders.
One alternative explanation for the positive selection found around subordinated debt
issuance is that it reflects a “capital cushion” effect. Since subordinated debt counts as tier 2
regulatory capital (up to 50 percent of the holding company’s tier 1 level) its issuance may be
viewed positively by regulators, rating agencies, and the market, inducing a direct mechanical
relation between issuance and upgrades. We control for this possibility by adding measures of
regulatory capital changes to the model. We first add the change in the bank holding company’s
tier 2 regulatory capital ratio from period t-2 to t-1, and then include the similar change in their
tier 1 ratio. A related measure – the amount of subordinated debt issued in period t-1 relative to
the bank holding company’s total assets in period t-1 – is also included as a proxy for the
potential relative cushion size (a large relative debt issue could have a large cushioning effect).20
Due to the limited availability of regulatory capital information, the sample used in the
analysis of the capital cushion effect contains only 1811 observations, instead of 2494 for the
other models (the data does not exist for 1990 and 1991, and is unavailable for some firms at
other times). Columns 1-3 of Table 7 therefore present results from our “basic” specification
estimated on the smaller sample. Despite the smaller sample size, subordinated debt issuance in
the prior quarter is still significantly, at the 5 percent error level, related to a tendency towards
upgrades and away from downgrades – with issuing firms 3.7 percent more likely to be
upgraded and 0.6 percent less likely to be downgraded. Including the change in tier 2 capital
over the same period has scant effect on the coefficients (columns 4-6) and the tier 2 variable is

- 23 -
21 Recall that banks that are acquired are dropped out of the sample.
insignificant. This finding is perhaps surprising given the regulatory focus on capital, but could
be due to the greater apparent role played by tier 1 capital.
Results from the next specification (shown in columns 7-9) demonstrate that positive
selection is robust to controls for both changes in the bank’s tier 1 and tier 2 capital ratios. The
coefficient on the tier 1 capital ratio change is, as expected, significant, while the coefficient on
the tier 2 capital ratio change remains insignificant. Taken together, these results indicate quite
strongly that changes in regulatory capital due to sub-debt issuance do not drive our results,
although changes in tier 1 capital do matter importantly for credit quality. Results from the last
specification (columns 10-12) further demonstrate the robustness of positive selection to
controls for changes in the relative quantity of subordinated debt issued by the bank holding
company in the prior quarter. The coefficient on this measure is not significant.
Controlling for The Effects of Merger Activity and Bank Size
Table 8 includes results for our “basic” specification augmented by a control for merger
activity. It is difficult to imagine how merger activity could confound our relation, especially
since bank takeovers typically use equity and so are unlikely to correlate with subordinated debt
issuance. Furthermore, the ex ante expectation for credit quality from a takeover is that the
better credit acquires the lower credit, suggesting that mergers should, on average, worsen the
acquirer’s credit quality. Regardless, merger activity is an important feature of the banking
landscape during the 1990s and might be correlated with some unobserved performance
variable. The merger control is an indicator taking the value of 1 if the bank holding company
acquired another bank during the quarter and 0 otherwise.21 As can be seen in columns 1 to 3,

- 24 -
the coefficient on the merger variable has a nearly significant positive effect on migrations, but
does not alter the coefficient on the subordinated debt issuance variable. This provides some
evidence that improving banks do engage in acquisitions, but is not an explanation for our
finding of positive selection around subordinated debt issuance.
Firm size might be another proxy for unobservable bank characteristics which correlate
with success, although it too is difficult to argue that size should correlate with the timing
relationship we find between issuance and migrations. Nonetheless, bank size, as shown in
columns 4 to 6, is a significant factor for rating migrations – large banks are more likely to be
upgraded – and does indeed weaken the issuance effect a bit (now significant at the 6 percent
level). Part of this weakening could be attributable to the issuance size effect, which is
correlated with bank size, as documented in Table 4.
Using the Orthogonal Component of the Bond Issuance Decision
We also test our hypothesis with the part of the bond issuance variable that is orthogonal
to prior performance and macro conditions. We do so by first estimating a logistic model of
lagged bond issuance with performance and macro conditions as explanatory variables, and then
substitute the residuals from this model for the bond issuance variable in our usual model of
ratings migrations. This procedure purges from the bond issuance variable all of its correlation
with the performance and conditions variables. One way to view the estimation is that bond
issuance is a proxy variable for information revelation; this proxy may be more reasonable if it
is uncorrelated with the other right-hand side variables, as in this two-step construction. The
basic specification for this two-step model is presented in equations 2a and 2b.

- 25 -
Pr(Bond)t-1 = �0 + �01Rating t-2 + �0
2 �Ratingt-4 less t-1 + �03 �ROAt-1
+ �04Conditionst-1 + �t-1 (2a)
Pr(Down/No/Up)t = �1 + �11�t-1 + �1
2Ratingt-2 + �13 �Ratingt-4 less t-1 + �1
4ROAt
+ �15 �ROAt-1 + �1
6Conditionst + �17Conditionst-1 + �t (2b)
We report two specifications of this two-step model. The first specification includes
essentially the same set of performance and macro variables in the first and second steps (in the
first step we drop the contemporaneous BBB yield and ROA). The results are identical in a
second specification which, in the first step, replaces the ratings change from t-4 to t-1 with a
dummy variable for whether the firm has been upgraded over that time period. By construction,
the control variables in the second step are uncorrelated with the expected issuance variable and
are only left in the equation because they affect the migration probability and improve the
estimated standard errors – excluding them does not alter the findings.
The results indicate that our finding of positive selection is robust to this two-step
approach. Note that this is only another control for past performance, we are not using
instruments. But, it gets at the question of expected versus unexpected issuance. Issuance that
is unexpected based on past performance is associated with more upgrades, while unexpected
non-issuance is associated with more downgrades. This is consistent with the idea of the
unexpected issuance being a proxy variable for the unobserved omitted variable.
As shown in Table 9, columns 3-4 and 7-8, the marginal effects on the first-stage
residuals are similar to the issuance effects in our basic specification. Moreover the coefficients
on the residuals, displayed in columns 2 and 5, are significant at the 5 percent level. Since these

- 26 -
residuals are “generated regressors” the standard errors should be interpreted with caution, but
the t-test that the coefficient on the residual equals zero is fine (see Wooldridge, 2002).
Augmenting the first stage regression with the bank size (log of total assets) improves the first-
stage fit, but does not much change the second stage regression.
Robustness to Using Abnormal Equity Returns to Measure Selection
We also test for positive selection with abnormal equity returns after bond issuance.
While equity returns are not ideal measures of credit quality, they are less likely than ratings to
reflect news prior to debt issuance and thus any positive selection that we observe is less likely
to be confounded by alternatives that assert the positive selection reflects past information.
Table 10 displays abnormal equity returns (defined relative to the Dow Jones Bank
Index) for the window from 1 day before to 90 days after the issuance date (to correspond to the
first quarter after issuance as in the migrations analysis) as well as for the window from 2 days
before to 2 days after issuance (since equity returns should respond rapidly to new information).
Subordinated debt issuance tends to be followed by positive excess returns and senior debt by
negative excess returns. However, the results are not very strong. The median excess return
following a subordinated debt issue (column two of the upper panel) is +0.56 percent (or, +2.24
percent on an annual basis) for the 90 day window and +0.15 percent for the 4 day window, but
neither is statistically significant. The dichotomy between issue types, as measured by the
difference between the two sample proportions, is significant for the longer window.
In order to analyze abnormal returns by size of issue, we define “large” debt issues as
those in the top quartile (greater than $250 million), and “small” as those in the bottom quartile
(less than $100 million). While, the median abnormal returns after small issues is negative and

- 27 -
22 The qualitative results are robust to extending the window used to compute the excess returns– neither starting from 30 days before nor ending 150 days after the issue alters the conclusions. The results are very similar (not reported) if only done for the 1993-1998 time period.
after large issues is positive, none are significantly different from zero. The differential
response for these two types is significant at the 5 percent level only for the longer window.
These results are consistent with, but much weaker than, our rating migration analysis.
One explanation is that equity returns may not always benefit from a reduction in risk. So, if
firms issue debt to convey a decline in risk, the equity market may not respond positively.
Given that the risk-reduction would eventually become public regardless, issuance could still be
an optimal decision for managers acting in the interest of shareholders because the bank lowers
its cost of funds immediately, increasing potential future pay-outs to equity and generating a
positive effect to offset the “negative” decline in option value due to reduced risk. The equity
return analysis might also be confounded by the diffuse nature of the bond issuance event. Even
though the issuance date is known with certainty, the information revelation varies and could
occur weeks before the issuance.22
That we observe greater abnormal equity returns after subordinated debt issuance than
after senior debt issuance, and greater abnormal equity returns after large debt issuance than
after small debt issuance, provides additional marginal evidence that positive selection may be
related to scrutiny and risk. While any issue could reveal information, it may be that investors
provide significantly more scrutiny for riskier issues (such as larger and subordinated bonds).

- 28 -
VII. Conclusion
This paper finds evidence consistent with a new hypothesis that bank managers time
their firm’s public bond issuance in part to control the revelation of private information to
investors. The evidence presented suggests that bond issuance by bank holding companies is
characterized by positive selection, that positive selection manifests near issuance, and that
positive selection may be stronger after larger, subordinated, and riskier issues. The results
have implications for understanding the role of “market discipline” in monitoring bank holding
companies and also add to our understanding of how potential regulatory requirements that such
organizations frequently issue public bonds might augment “market discipline.”

- 29 -
References:
Auerbach, Joseph and Samuel L. Hayes, III (1986), Investment Banking and Diligence: What
Price Deregulation? Boston: Harvard Business School Press.
Berger, Allen N., and Sally M. Davies (1998), “The Information Content of Bank Exams,”
Journal of Financial Services Research, 14(2), 117-145.
Berger, Allen N., Davies, Sally, M., and Mark J. Flannery (2000) “Comparing Market and
Regulatory Assessments of Bank Performance: Who Knows What When?” Journal of Money,
Credit and Banking, 32, 641-667.
Berger, Allen N., Bonime, Seth D., Covitz, Daniel M. and Diana Hancock (2000), “Why Are
Bank Profits So Persistent? The Roles of Product Market Competition, Informational Opacity,
and Regional/Macroeconomic Shocks,” Journal of Banking & Finance, 24, 1203-1235.
Billett, Matthew T., Garfinkel, Jon A. and Edward O’Neal (1998), “The Cost of Market versus
Regulatory Discipline in Banking,” Journal of Financial Economics, 48, Iss. 3, 333-358.
Blackwell, David W., Marr, M. Wayne, and Michael F. Spivey (1990), “Shelf Registration and
the Reduced Due Diligence Argument: Implications of the Underwriter Certification and the
Implicit Insurance Hypotheses,” Journal of Financial and Quantitative Analysis, 25, 245-259.

- 30 -
Bloch, Ernst (1989), Inside Investment Banking. Second edition. New York: Dow Jones-Irwin.
Choe H., Ronald W. Masulis, and Vikram Nanda (1993), “Common Stock Offerings Across the
Business Cycle,” Journal of Empirical Finance 1, 3-31.
Covitz, Daniel M., Hancock, Diana, and Myron L. Kwast (2001), “Market Discipline and the
Decision to Issue Subordinated Debt: Is Required Issuance Really Necessary,” Mimeo, Federal
Reserve System.
Covitz, Daniel M., and Paul Harrison (2000), “Public Debt Issuance and Ratings Migrations:
Are Firms timing Their Debt Issuance Around Temporary Private Information,” Federal
Reserve Board Finance and Economic Discussion Working Paper Series 2000-10.
DeYoung, Robert., Flannery, Mark J., Lang, William W., and Sorin M. Sorescu (2001), “The
Information Content of Bank Exam Ratings and Subordinated Debt Prices,” Journal of Money,
Credit , and Banking, forthcoming.
Eccles, Robert G. and Dwight B. Crane (1988), Doing Deals: Investment Banks at Work.
Boston: Harvard Business School Press.
Ederington, Louis H. and Jeremy C. Goh (1998), “Bond Rating Agencies and Stock Analysts:
Who Knows What When?,” Journal of Financial and Quantitative Analysis 33, 569-585.

- 31 -
Ederington, Louis H. and Jess B. Yawitz (1987), “The Bond Rating Process,” Chapter 23,
Handbook of Financial Markets and Institutions, 6th Edition, Altman editor, (John Wiley and
Sons, NY).
Evanoff, Douglas E., and Larry D. Wall (2001), “Sub-Debt Yield Spreads as Bank Risk
Measures” Federal Reserve Bank of Atlanta, Working Paper 2001-11.
Flannery, Mark J. and Sorin M. Sorescu (1996), “Evidence of Bank Market Discipline in
Subordinated Debenture Yields: 1983 - 1991.” Journal of Finance 51, 1347-1377.
Goh, Jeremy C. and Louis H. Ederington (1993), “Is a Bond Rating Downgrade Bad news,
Good news, or No News for Stockholders?” Journal of Finance 48, 2001-2008.
Hand, John R. M., Holthausen, Robert W., and Richard W. Leftwich (1992), “The Effect of
Bond Rating Agency Announcements on Bond and Stock Prices,” Journal of Finance 47, 733-
752.
Healy, Paul M., and Krishna G. Palepu (2001), “Information Asymmetry, Corporate Disclosure
and the Capita Markets: A Review of the Empirical Disclosure Literature,” Journal of
Accounting & Economics, 31, Nos. 1-3, 405-440.

- 32 -
Healy, P., Hutton, A., and K. Palepu (1999), “Stock Performance and Intermediation Changes
Surrounding Sustained Increases in Disclosure,” Contemporary Accounting Research 16, 485-520.
Holthausen, Robert W. and Richard W. Leftwich (1985), “The Effect of Bond Rating Changes
on Common Stock Prices,” Journal of Financial Economics 17, 57-89.
Jagtiani, Julapa, Kaufman, George, and Catherine Lemieux (2002), “The Effect of Credit Risk
on Bank and Bank Holding Company Bond Yields; Evidence from the Post-FDICIA,” Journal
of Financial Research, 25, Iss. 4, 559-575.
Kwast, Myron L., Covitz, Daniel M., Hancock, Diana, Houpts, James V., Adkins, David P.,
Barger, Norah., Bouchard, Barbara., Connolly, John F., Brady, Thomas F., English, William B.,
Evanoff, Douglas D. and Larry D. Wall (1999), “Using Subordinated Debt as an Instrument of
Market Discipline,” Board of Governors of the Federal Reserve System (M. Kwast, chair) Staff
Study, No. 172.
Lang, Mark and Russell Lundholm (1993), “Cross-sectional determinants of analysts ratings of
corporate disclosures,” Journal of Accounting Research 31, 246-271.
Mercer, Z. Christopher (1992), Valuing Financial Institutions. Homewood, IL: Business One
Irwin.
Moody’s Investor Service (1999a), “Rating Methodology,” August.

- 33 -
Moody’s Investor Service (1999b), “Special Comment: Y2K - Potential Impact on Moody’s
Ratings and Analysis,” September.
Moody’s Investor Service (2000), “Financial Ratio Medians for Investment Grade Corporates,”
January.
Moody’s Investor Service (2002), “Moody’s Analysis of US Corporate Rating Triggers
Heightens Need For Increased Disclosure,” July.
Morgan, Donald P. (2002), “Rating Banks: Risk and Uncertainty in an Opaque Industry”
American Economic Review, 92, 874-888.
Myers, Stewart C. and Nicholas S. Majluf (1984), “Corporate Financing Investment Decisions
When Firms Have Information Investors Do Not Have,” Journal of Financial Economics, 13,
187-221.
Noe, Thomas (1988), “Capital Structure and Signaling Game Equilibria,” Review of Financial
Studies 1, 331-356.
Sherman, Ann E. (1999), “Underwriter Certification and the Effect of Shelf Registration on Due
Diligence,” Financial Management 28, 5-19.

- 34 -
Shyam-Sunder, Laskshmi (1991), “The Stock Price Effect of Risky versus Safe Debt,” Journal
of Financial and Quantitative Analysis 26, 549-558.
Simkins, Betty J. (1999), “Asymmetric Information, Credit Quality and the Use of Interest Rate
Derivatives,” working paper, Oklahoma State University.
Smith, Clifford W. (1986), “Investment Banking and the Capital Acquisition Process,” Journal
of Financial Economics, 15, 3-29.
Spiess, D. Katherine and John Affleck-Graves (1999), “The Long-Run Performance of Stock
Returns Following Debt Offerings,” Journal of Financial Economics 54, 45-73.
Wooldridge, Jeffrey M. (2002), Econometric Analysis of Cross Section and Panel Data.
Cambridge, MA: MIT Press.

35 Table 1: Upgrades, Downgrades, And Debt Issuance By Year
Year Number of Firm-
Quarter
Observations
Number Of
Firm-Quarters
With Upgrades
Number Of
Firm-Quarters
With
Downgrades
Number Of
Firm-Quarters
With
Subordinated
Debt Issue(s)
Number Of
Firm-Quarters
With Senior Debt
Issue(s)
1990 300 3 60 6 3
1991 304 3 24 15 5
1992 295 17 5 26 10
1993 279 25 2 24 8
1994 292 25 0 22 2
1995 287 8 4 22 4
1996 251 9 0 31 6

36 1997 241 9 2 16 3
1998 245 10 4 8 2
37 Table 2: Positive Selection After Subordinated Debt Issuance – Ordered And Unordered Logits
Panel A. Ordered Logits, Dependent Variable = Rating Migration (t)
Coeff.
Marginal
Effects
Coeff.
Marginal
Effects
Coeff.
Marginal
Effects
Coeff.
Marginal
Effects
Coeff.
Marginal
Effects
Up Down Up Down Up Down Up Down Up Down
(1) (2) (3) (4) (5) (6) (7) (8) (9) (10) (11) (12) (13) (14) (15)
Sub. Debt (t-1)
0.36**
(0.14)
3.2 -2.9 0.77**
(0.29)
2.2 -1.5 0.73**
(0.30)
1.7 -1.0 0.91**
(0.29)
2.9 -2.4 0.60**
(0.29)
1.7 -1.2
Rating (t-2)
0.18**
(0.03)
0.5 -0.3 0.15**
(0.04)
0.4 -0.2 0.17**
(0.03)
0.6 -0.5
� Rating (t-4 less
t-1)
0.38**
(0.07)
1.0 -0.7 0.27**
(0.08)
0.6 -0.4 0.41**
(0.07)
1.3 -1.1 0.39**
(0.07)
1.1 -0.8
ROA (t) 0.51**
(0.09)
1.3 -0.9 0.49**
(0.09)
1.1 -0.7 0.58**
(0.09)
1.8 -1.5 0.40**
(0.10)
1.1 -0.8
ROA (t-1)
0.41**
(0.14)
1.0 -0.7 0.51**
(0.14)
1.2 -0.7 0.51**
(0.12)
1.0 -0.8 0.07
(0.16)
0.2 -0.2
BBB Rate (t) -0.14
(0.17)
-0.3 0.2
-0.28*
(0.17)
-0.8 0.6

38
BBB Rate (t-1) -0.53**
(0.18)
-1.3 0.9 -0.40**
(0.18)
-1.1 0.8
Year Dummies **
NBER Dummy
-1.36**
(0.24)
-4.0 3.3
Rating Dummies **
Log Likelihood
Significance Level
-830.71
0.01
-710.93
0.00
-690.65
0.00
-731.31
0.00
-751.32
0.00
# Obs 2494 2494 2494 2494 2494
Notes. The dependent variable is rating migrations ordered as downgrade (-1), no change (0), upgrade (+1). The sample period is from 1990
to1998. “Sub. Debt” indicates subordinated debt issuance. “Rating” is Moody’s issuer rating, with “Aaa” coded as 1, “Aa1” as 2, and so forth to
“C” = 21. “ROA” is the bank’s return on assets. “BBB” is the Merrill Lynch BBB corporate bond index yield. “NBER dummy” equals one if the
quarter is part of a recession. “Rating Dummies” are indicators for “Aaa,” “Aa,” “Baa,” and so forth. Joint significance for the year and rating
dummies use a likelihood ratio test with only the significance reported. A constant term is significant, but not reported. Significance at the 5 (10)
percent error level is indicated with ** (*). Marginal effects are in percent. Standard errors are below coefficient estimate in parentheses.

39 Panel B: Unordered Logits (Marginal Effects)
Dependent Variable =
Rating Migration (t)
Marginal Effects
Marginal Effects
Down No Up Down No Up
(1) (2) (3) (4) (5) (6)
Sub. Debt (t-1) -4.3* 1.6 2.7** -1.0 -1.7 2.6**
Rating (t-2) -0.2** -0.3** 0.6**
� Rating (t-4 less t-1) -0.5** -0.0 0.5
ROA (t) -0.8** 0.1 0.9
ROA (t-1) -0.8** 0.9 -0.2
BBB (t) 0.5 -1.2** 0.8
BBB (t-1) 0.6* 1.6* -2.2**
Log Likelihood
Significance Level
-830.47
0.00
-697.69
0.00
# Obs 2494 2494
40 Table 3: Positive Selection Manifests Near Subordinated Debt Issuance -- Ordered Logits
Dependent Variable =
Rating Migration (t)
Coefficient
(Std. Error)
Marginal
Effects
Coefficient
(Std. Error)
Marginal
Effects
Up Down Up Down
(1) (2) (3) (4) (5) (6)
Sub Debt (t) 0.60**
(0.28)
1.3 -1.0 0.82**
(0.27)
2.1 -1.6
Sub Debt (t-1) 0.66**
(0.32)
1.7 -1.3
Sub Debt (t-2) 0.26
(0.34)
0.5 -0.4
Sub Debt (t-3)
0.24
(0.39)
0.3 -0.2
Sub Debt (t-4) -0.03
(0.36)
0.3 -0.2

41
Other Control Variables,
As In Table 2
Jointly
significant at
the 5 percent
level
Jointly
significant at
the 5 percent
level
Log Likelihood
Significance Level
-707.75
0.00
-739.38
0.00
# Obs 2494 2494
Notes. The dependent variable is rating migrations ordered as downgrade (-1), no change (0), upgrade (+1). The sample period is quarterly from
1990 to 1998. “Sub. Debt” indicates subordinated debt issuance. Significance at the 5 (10) percent error level is indicated with ** (*).
Significance levels reported below the log likelihood values are that for a Wald test of the hypothesis that all coefficients other than the constant
are zero. Marginal effects are in percent. Constant term and other control variables from Table 1 are individually and jointly significant in the
estimation but are not reported.

42 Table 4: Bond Size And Positive Selection After Subordinated Debt Issuance
Ordered Logit – Full Sample Binomial Logit – Issuers Only Sample
Dependent Variable =
Rating Migration (t)
Coefficient
(Std. Error)
Marginal
Effects
Marginal
Effects
Up Down Up Up Up
(1) (2) (3) (4) (5) (6)
Sub Debt Size (t-1)
0.02^
(0.02)
0.05 -0.04
Sub Debt Issuance (t-1) 0.41^
(0.59)
1.0 -0.7
Big Issue (t-1) 9.0**
7.7**
Upper Quartile (t-1) 6.3* 3.0
Rating (t-2) 0.18**
(0.03)
0.5 -0.3 1.4**
1.7**
1.5**

43
Notes. The dependent variable is rating migrations ordered as downgrade (-1), no change (0), upgrade (+1). The sample period is from 1990 to
1998. “Sub Debt Size” indicates the dollar value of the subordinated debt issue (measured in units of $10 million), “Big Issue” is a dummy
variable that equals 1 if the sub debt issue is above the median for that year, and “Upper Quartile” is a dummy variable that equals 1 if the firm ‘s
total assets are in the upper quartile of the size distribution for that year. Other variables defined as previous. Significance at the 5 (10) percent
error level is indicated with ** (*). “^” indicates jointly significant at the 5 percent error level. Significance levels reported below the log
likelihood values are that for a Wald test of the hypothesis that all coefficients other than the constant are zero. Marginal effects are in percent.
Other Control Variables,
As In Table 1
Jointly
significant at
the 5 percent
level
Log Likelihood
Significance Level
-710.53
0.00
-39.08
0.00
-40.58
0.00
-38.50
0.00 # Obs 2494 167 167 167

44
Table 5: Bank Risk And Positive Selection After Subordinated Debt Issuance
Dependent Variable =
Rating Migration (t)
Coefficient
(Std.
Error)
Marginal
Effects
Coefficient
(Std. Error)
Marginal
Effects
Coefficient
(Std. Error)
Marginal
Effects
Up Down Up Down Up Down
(1) (2) (3) (4) (5) (6) (7) (8) (9)
Sub. Debt (t-1)
0.58^
(0.99)
2.1 -0.4 1.07^
(0.50)
3.8 -0.7 0.82^
(0.34)
2.1 -2.6
Sub. Debt * Securities (t-1) 1.10^
(6.28)
4.0 -0.8
Securities (t-1)
-2.10
(1.75)
-7.6 1.5
Sub. Debt * Trading Assets
(t-1)
0.99^
(2.92)
3.5 -0.7
Trading Assets (t-1) -4.93**
(1.71)
-17.5 3.2

45
Sub. Debt * Rating
Dummy (t-1)
Other Controls,
As In Table 1
Jointly
significant
at the 5
percent
level
Jointly
significant
at the 5
percent
level
0.22^
(0.60)
Jointly
significant
at the 5
percent
level
0.6 -0.4
Log Likelihood
Significance Level
-266.27
0.00
-263.99
0.00
-738.80
0.00
# Obs 1243 1243 2494
Notes. The dependent variable is rating migrations ordered as downgrade (-1), no change (0), upgrade (+1). The sample period is quarterly from
1990 to 1998. “Sub Debt” indicates subordinated debt issuance. “Securities” is the bank’s investment in securities, “Trading Assets” is the bank’s
trading assets, and “Rating Dummy” is an indicator that takes on the value of 1 if the bank’s t-1 rating is below the mean. The standard control
variables are included but not reported to simplify the presentation. The constant term is significant but not reported. Significance at the 5 (10)
percent error level is indicated with ** (*). Significance levels reported below the log likelihood values are that for a Wald test of the hypothesis
that all coefficients other than the constant are zero. Marginal effects are in percent.

46 Table 6: Positive Selection Around Senior Debt Issuance
Dependent Variable =
Rating Migration (t)
Coefficient
(Std. Error)
Marginal
Effects
Coefficient
(Std. Error)
Marginal
Effects
Up Down Up Down
(1) (2) (3) (4) (5) (6)
Senior Debt (t)
1.28**
(0.51)
3.2 -2.3
Senior Debt (t-1)
0.74
(0.54)
1.9 -1.3
Rating (t-2)
0.17**
(0.03)
0.4 -0.3 0.17**
(0.03)
0.4 -0.3
� Rating (t-4 less t-1)
0.39**
(0.07)
1.0 -0.7 0.38**
(0.07)
1.0 -0.7
ROA (t) 0.50**
(0.10)
1.3 -0.9 0.49**
(0.10)
1.2 -0.9
ROA (t-1) 0.41*
(0.14)
1.0 -0.7 0.41**
(0.14)
1.0 -0.7

47
BBB (t)
-0.10
(0.17)
-0.3 0.2 -0.11
(0.18)
-0.3 0.2
BBB (t-1)
-0.57**
(0.18)
-1.4 1.0 -0.55**
(0.18)
-1.4 1.0
Log Likelihood
Significance Level
-712.27
0.00
-714.15
0.00
# Obs 2494 2494
Notes. Ordered Logit regressions where the dependent variable is rating migrations ordered as downgrade (-1), no change (0), upgrade (+1).
Sample period is quarterly from 1990-1998. “Senior Debt” indicates senior debt issuance. Other variables as defined previously. Significance at
the 5 (10) percent error level is indicated with ** (*). Significance levels reported below the log likelihood values are that for a Wald test of the
hypothesis that all coefficients other than the constant are zero. Marginal effects are in percent.

48 Table 7: Robustness To Controls For “Capital Cushion” Effect – Ordered Logits
Dependent Variable =
Rating Migration (t)
Coefficient
(Std. Error)
Marginal
Effects
Coefficient
(Std. Error)
Marginal
Effects
Coefficient
(Std. Error)
Marginal
Effects
Up Down Up Down Up Down
(1) (2) (3) (4) (5) (6) (7) (8) (9)
Sub. Debt (t-1)
0.82**
(0.31)
3.8 -0.6 0.82**
(0.32)
3.7 -0.6 0.68**
(0.33)
3.0 -0.5
�Tier2 (t-2 to t-1) 0.02
(0.43)
0.1 -0.0 0.07
(0.46)
-0.3 0.1
�Tier1 (t-2 to t-1)
0.32**
(0.10)
1.4 -0.2
Total Sub /TA (t-1) 4.89
(3.36)
21.8 -3.5
Rating (t-2) 0.17**
(0.04)
0.8 -0.1 0.17**
(0.04)
0.8 -0.1 0.15**
(0.04)
0.7 -0.1
� Rating (t-4 less t-1) 0.09
(0.14)
0.4 -0.1 0.09
(0.14)
0.4 -0.1 0.10
(0.15)
0.4 -0.1

49
ROA (t) 0.54**
(0.21)
2.5 -0.4 0.54**
(0.22)
2.5 -0.4 0.58**
(0.22)
2.6 -0.4
ROA (t-1)
0.00
(0.26)
0.0 -0.0 0.00
(0.26)
-0.0 0.0 -0.02
(0.27)
-0.1 -0.0
BBB (t)
0.39*
(0.23)
1.8 -0.3 0.39*
(0.23)
1.8 -0.3 0.40*
(0.23)
1.8 -0.3
BBB (t-1) -0.50**
(0.22)
-2.3 0.4 -0.50**
(0.22)
-2.3 0.4 -0.52**
(0.23)
-2.3 0.4
Log Likelihood
Significance Level
-451.63
0.00
-451.62
0.00
-447.72
0.00
# Obs 1811 1811 1811
Notes. The dependent variable is rating migrations ordered as downgrade (-1), no change (0), upgrade (+1). The sample period is quarterly from
1992 to 1998. “Sub Debt” indicates subordinated debt issuance. “Tier1” and “Tier2” refer to the bank’s tier1 and tier2 risk-based capital ratios.
“Total Sub/TA” is the total subordinated debt issued relative to total assets. The other variables are defined as before. The constant term is
significant but not reported. Significance at the 5 (10) percent error level is indicated with ** (*). Significance levels reported below the log
likelihood values are that for a Wald test of the hypothesis that all coefficients other than the constant are zero. Marginal effects are in percent.

50 Table 8: Robustness To Controls For Bank Mergers And Firm Size
Dependent Variable =
Rating Migration (t)
Coefficient
(Std. Error)
Marginal
Effects
Coefficient
(Std. Error)
Marginal
Effects
Up Down Up Down
(1) (2) (3) (4) (5) (6)
Subordinated Debt (t-1) 0.86**
(0.29)
2.1 -1.5 0.68**
(0.29)
1.6 -1.2
Rating (t-2)
0.18**
(0.03)
0.5 -0.3 0.23**
(0.03)
0.6 -0.4
� Rating (t-4 less t-1)
0.38**
(0.07)
1.0 -0.7 0.39**
(0.07)
1.0 -0.7
ROA (t) 0.51**
(0.09)
1.3 -0.9 0.52**
(0.09)
1.3 -0.9
ROA (t-1) 0.41**
(0.14)
1.0 -0.7 0.44**
(0.13)
1.1 -0.8
BBB (t)
-0.14
(0.18)
-0.4 0.3 -0.12**
(0.17)
-0.3 0.2

51
BBB (t-1) -0.51**
(0.18)
-1.3 0.9 -0.53**
(0.18)
-1.3 0.9
Merger (t) 0.32
(0.30)
0.8 -0.6
Log (Total Assets) (t) 0.20**
(0.06)
0.5 -0.3
Log Likelihood
Significance Level
-710.27
0.00
-906.61
0.00
# Obs 2494 2494
Notes. Ordered Logit regressions where the dependent variable is rating migrations ordered as downgrade (-1), no change (0), upgrade (+1).
Sample period is quarterly from 1990-1998. “Merger” is a dummy variable that takes the value of one if the bank acquired another bank during
the quarter. “Log (Total Assets)” is the log of the bank’s total assets and is a proxy for bank size. Other variables as defined previously.
Significance at the 5 (10) percent error level is indicated with ** (*). Significance levels reported below the log likelihood values are that for a
Wald test of the hypothesis that all coefficients other than the constant are zero. Marginal effects are in percent.

52 Table 9: Robustness To Using The Orthogonal Component Of Bond Issuance – Two-Stage Ordered Logits
Step-1 Step-2 Step-1 Step-2
Dependent
Variable �
Sub. Debt
(t-1)
Migration
(t)
Sub. Debt
(t-1)
Migration
(t)
Coefficient
(Std. Error)
Coefficient
(Std. Error)
Marginal
Effects
Coefficient
(Std. Error)
Coefficient
(Std. Error)
Marginal
Effects
Up Down Up Down
(1) (2) (3) (4) (5) (6) (7) (8)
Residual From
Step 1 (t-1)
0.96**
(0.29)
2.4 -1.9 0.95**
(0.29)
2.4 -1.9
Rating (t-2)
-0.34**
(0.05)
0.17**
(0.03)
0.4 -0.3 0.34**
(0.05)
0.17**
(0.03)
0.4 -0.3
�Rating (t-4 less t-
1)
0.29**
(0.14)
0.39**
(0.07)
1.0 -0.8
0.39**
(0.07)
1.0 -0.7
Upgrade in (t-4
through t-1)
0.47**
(0.21)

53
ROA (t) 0.59**
(0.10)
1.5 -1.2 0.59**
(0.10)
1.5 -1.2
ROA (t-1)
-0.24
(0.19)
0.25*
(0.15)
0.6 -0.5 -0.23
(0.19)
0.25*
(0.15)
0.6 -0.5
-0.28**
(0.16)
-0.7 0.6 -0.28**
(0.16)
-0.7 0.6 BBB (t)
BBB (t-1) -0.25**
(0.08)
-0.40**
(0.17)
-1.0 0.8 -0.27**
(0.08)
-0.40**
(0.17)
-1.0 0.8
Log Likelihood
Significance Level
-578.23
0.00
-738.02
0.00
-578.07
0.00
-738.08
0.00
# Obs 2494 2494 2494 2494
Notes. The step-1 dependent variable “Sub. Debt” is whether a firm issued subordinated debt. The step-2 dependent variable
“Migration” is rating migrations ordered as downgrade (-1), no change (0), upgrade (+1). The sample period is quarterly from 1990 to
1998. “Rating” is Moody’s issuer rating, where “Aaa” is coded as 1, “Aa1” as 2, and so forth to “C” = 21. “Upgrade” is a dummy variable for a
ratings upgrade. “ROA” is the bank’s return on assets. “BBB” is the Merrill lynch index for BBB rated corporate bonds. Significance at the 5
(10) percent error level is indicated with ** (*). The constant term is included and significant but not reported. Significance levels reported below

54 the log likelihood values are that for a Wald test of the hypothesis that all coefficients other than the constant are zero. Marginal effects are in
percent.

55 Table 10: Robustness To Using Abnormal Equity Returns To Measure Selection (1993-2000)
Excess returns around debt issuance From t-1 Days to t+90 Days From t-2 Days to t+2 Days
Senior Issue
(# = 80)
Subordinated Issue
(# = 155)
Senior Issue
(# = 80)
Subordinated Issue
(# = 155)
Number Outperforming: 32 (40.0%) 81 (52.3%) 38 (47.5%) 83 (53.5%)
Number Under-performing: 48 (60.0%) 74 (47.7%) 42 (52.5%) 72 (46.5%)
Median Excess Return (%):
(Sign t-Test For Median ≠ 0)
-0.83*
(1.83)
+0.56
(0.57)
-0.23
(0.45)
+0.15
(0.88)
Difference In Two Sample
Proportions (t-test):
1.83*
0.89
Small Issue
(# = 51)
Large Issue
(# = 58)
Small Issue
(# = 51)
Large Issue
(# = 58)
Number Outperforming: 21 (41.2%) 34 (58.6%) 24 (47.1%) 33 (56.9%)
Number Under-performing: 30 (58.8%) 24 (41.4%) 27 (52.9%) 25 (43.1%)

56
Median Excess Return (%):
(Sign t-Test For Median ≠ 0)
-2.85
(1.28)
+1.02
(1.43)
-0.17
(0.41)
+0.05
(1.06)
Difference In Two Sample
Proportions (t-test):
1.87*
1.03
Notes. Straight-debt issuance by bank holding companies from 1993-2000 from SDC are merged with CRSP stock price data around the issuance
event. Multiple issues in the same quarter are excluded. Returns are calculated from the time just before the issue to 90 days after the issue – the
median return is 3.52 percent. The benchmark return is calculated over the same period using the Dow Jones Bank Index. (The results using the
S&P Bank Index are qualitatively similar.) Excess returns are then computed relative to the benchmark return. The median excess return and the
number of issues for which the excess return exceeds the benchmark are reported below. “Large” debt issues are those in the top quartile (greater
than $250 million), “small” are those in the bottom quartile (less than $100 million). Significance at the 5 (10) percent error level is indicated with
** (*).