a colorimetric method for rapid and selective ... · pdf filequantification of mixtures...
TRANSCRIPT

1
A colorimetric method for rapid and selective
quantification of mixtures comprising
peroxodisulfate, peroxomonosulfate and hydrogen
peroxide
Benjamin. J. Deadman,a Klaus Hellgardtb and King Kuok (Mimi) Hiia*
a Department of Chemistry, Imperial College London, South Kensington, London SW7 2AZ,
UK. E-mail: [email protected]
b Department of Chemical Engineering, Imperial College London, South Kensington, London
SW7 2AZ, UK. E-mail: [email protected]
KEYWORDS: oxidants, colorimetric analysis, selective, quantification
General .................................................................................................................................................... 2
Preparation of Solutions ......................................................................................................................... 2
Peroxomonosulfate Determination by Redox Titration ......................................................................... 6
Measurement of Total Oxidant Concentration of Peroxosulfate and Hydrogen Peroxide Solutions by
Iodometric Titration ................................................................................................................................ 7
Oxidant Determination by Redox Colorimetry ....................................................................................... 7
General Comments about setup of HPLC for analysis ........................................................................ 7
Instrument Calibration ........................................................................................................................ 8
Determination of Peroxodisulfate by Redox Colorimetry ................................................................ 13
Sample Preparation and Analysis ..................................................................................................... 14
Electronic Supplementary Material (ESI) for Reaction Chemistry & Engineering.This journal is © The Royal Society of Chemistry 2017

2
Validation of the Redox Colorimetry Tests Against Peroxosulfate Solutions of Known Composition
.......................................................................................................................................................... 14
Estimation of the Uncertainty Levels in the Redox Colorimetric Tests ............................................ 17
Limits of Detection and Quantitation for the Redox Colorimetry Tests ........................................... 18
Analysis of the Decomposition of Peroxodisulfate into Peroxomonosulfate and Hydrogen Peroxide
.......................................................................................................................................................... 19
References ............................................................................................................................................ 21
General Potassium permanganate (>99%), titanium oxysulfate (technical grade), potassium iodide (99%),
starch were purchased from Sigma-Aldrich. Sulfuric acid, sodium sulfite and hydrogen peroxide (30%)
were purchased from VWR. Ammonium metavanadate (99.5%), ammonium iron(II) sulfate (>99%) and
ammonium persulfate (98%) were purchased from Acros. Potassium monopersulfate triple salt was
purchased from Merck and sodium thiosulfate was purchased from Fisher Scientific. All chemicals and
solvents were used without further purification unless otherwise stated.
Reference Half-Cell Equations VO2
+ + 2H+ + e- VO2+ + H2O
MnO4- + 8H+ + 5e- Mn2+ + 4H2O
O2 + 2H+ + 2e- H2O2
H2O2+ 2H+ + 2e- 2H2O
H2TiO4 + 4H+ + 2e- TiO2+ + 3H2O
S2O82- + 2e- 2SO4
2-
SO52- + 2H+ + 2e- SO4
2- + H2O
Fe3++ e- Fe2+
Preparation of Solutions 0.0196 M KMnO4 Solution for Redox Titrations Potassium permanganate (3.1511 g, 19.9 mmol) was made up to 1 L with distilled water. The solution
was sonicated for 30 min and then filtered to remove any solid residues. The filtered solution was
stored at room temperature in a sealed bottle covered in foil to exclude light.
The potassium permanganate solution was standardized in triplicate. Measured quantities of
disodium oxalate (0.1 g) were dissolved in distilled water (50 mL). 2 M sulfuric acid (15 mL) was then
added and the solution heated to 70 °C on a hot plate. The hot disodium oxalate solution was titrated
against the potassium permanganate solution until the end-point was indicated by persistence of a
pale pink color for 1 min. The concentration of potassium permanganate was measured to be 0.0196
M ± 0.0001 M.

3
Note that the redox reaction can be slow during the early stages of the titration (particularly if the
disodium oxalate solution is not sufficiently warm) and it may appear that permanganate ion is not
being reduced by the disodium oxalate. Standing the sample on a 70 °C hot plate for up to a minute
will result in the solution returning to its colorless state. As the titration progresses the transition from
pink/purple to colorless will accelerate until the end-point is reached and an excess of permanganate
ion is present in the solution.
An example calculation is:
Mass of disodium oxalate = 0.0994 g ± 0.0004 g (0.4%)
noxalate = m
M =
0.0994 g
133.999 g/mol = 0.0007417 mol ± 0.4%
The redox half cell reactions are
MnO4- + 8H+ + 5e- Mn2+ + 4H2O
C2O42- 2CO2 + 2e-
therefore
npermanganate = 2
5 x noxalate = 0.0002966 mol ± 0.4%
Volume of KMnO4 solution titrated was 15.18 mL ± 0.05 mL (0.3%)
Cpermanganate = n
V =
0.2966 mmol
15.18 mL = 0.0195 mol/L ± 0.0001 mol/L (0.7%)
0.09 M VOSO4 Solution for Redox Titrations Based on the method reported by Berry.1
Concentrated sulfuric acid (100 mL) was added to water (300 mL) to form a 25% v/v solution of sulfuric
acid. Ammonium metavanadate (10 g, 85 mmol) was added to the diluted sulfuric acid to form an
orange solution. After dissolution was complete the solution was diluted by the addition of water
(600 mL). The vanadate was reduced by the addition of sodium sulfite (12.9 g, 102 mmol) to form a
deep blue solution of VOSO4. The solution was refluxed for a minimum of 30 min to expel SO2 gas.
The VOSO4 was stored at room temperature in a sealed bottle and was found to be stable over several
months of use.
The concentration of VOSO4 was determined by titration of triplicate samples (20 mL) against a
standardized solution of potassium permanganate (0.0196 M ± 0.0002 M). A color transition from
pale yellow to pale pink indicated the end-point of the titration. The concentration of VOSO4 was
measured to be 0.0922 M ± 0.0009 M.
An example calculation is:
Volume of KMnO4 solution titrated was 18.82 mL ± 0.05 mL (0.3%)
npermanganate = Cpermanganate x Vpermanganate = 0.0196 mol/L x 0.01882 L = 0.3688 mmol ± 1%
The redox half cell reactions are

4
MnO4- + 8H+ + 5e- Mn2+ + 4H2O
VO2+ + H2O VO2+ + 2H+ + e-
therefore
nvanadyl = 5 x npermanganate = 1.844 mmol ± 1%
Volume of VOSO4 solution analysed was 20.00 mL ± 0.08 mL (0.4%)
Cvanadyl = n
V =
1.844 mmol
20.00 mL = 0.0922 mol/L ± 0.0009 mol/L (1%)
0.2 M VOSO4 Solution for Redox Colorimetry Adapted from the method reported by Berry.1 This higher concentration solution was prepared for
use in redox colorimetry.
Concentrated sulfuric acid (25 mL) was added to water (75 mL) to form a 25% v/v solution of sulfuric
acid. Ammonium metavanadate (5.8 g, 50 mmol) was added to the diluted sulfuric acid to form an
orange solution. After dissolution was complete the solution was diluted by the addition of water
(150 mL). Vanadate was reduced by the addition of sodium sulfite (6.6 g, 52.5 mmol) to form a deep
blue solution of VOSO4. The solution was refluxed for a minimum of 30 min to expel SO2 gas. The
VOSO4 was stored at room temperature in a sealed bottle and was observed to be stable over several
months of use.
The prepared solution can be used for redox colorimetric analysis without accurate determination of
the concentration of VOSO4 .
2 M H2SO4 Solution Concentrated sulfuric acid (109 mL) was added to a stirring bottle of distilled water (891 mL) which
was immersed in an ice bath. The diluted sulfuric acid was allowed to cool to room temperature
before use.
0.1 M TiOSO4 Solution for Redox Colorimetry 2 M Sulfuric acid solution (250 mL) was added to titanium oxysulfate (25 mmol, 3.998 g) and
ultrasound was applied until the suspended white solid had dissolved completely. The resulting
solution was used in redox colorimetric tests without further treatment or analysis. The colorless
TiOSO4 solution was stored at room temperature in a sealed bottle and was observed to be stable over
several months of use.
0.3 M Fe(NH4)2(SO4)2 Solution for Redox Colorimetry 2M Sulfuric acid solution (200 mL) was added to Mohr’s salt (ammonium iron(II) sulfate) (75 mmol,
29.4 g). After the salt had dissolved completely the solution was made up to 250 mL by the addition
of 2M Sulfuric acid solution. The resulting solution was used in redox colorimetric tests without
further treatment or analysis. The pale green Fe(II) solution was stored at 4 °C in a sealed bottle and
was observed to be stable for up to one week.
Starch Solution for Iodometric Titration Based on the method described in Vogel’s Textbook of Quantitative Chemical Analysis.2

5
Distilled water (100 mL) was added to soluble starch (0.1 g). The starch solution was then heated with
stirring until it had boiled for at least 1 min. The solution was then allowed to cool before potassium
iodide (2.0 g) was added.
The resulting solution was stored at room temperature and used in iodometric titrations over a period
of 3 days.
0.1 M Na2S2O3 Solution for Iodometric Titration Based on the method described in Vogel’s Textbook of Quantitative Chemical Analysis.2
Sodium thiosulfate (24.88 g) was made up to 1 L with distilled water using volumetric glassware.
Chloroform (3 drops) and sodium carbonate (0.13 g) were added to the solution to prolong the shelf
life of the solution. The solution was stored at room temperature in a sealed bottle covered in foil to
exclude light.
The thiosulfate solution was standardized in triplicate. Potassium iodate (0.14 - 0.15 g) was weighed
accurately then dissolved in cold distilled water (25 mL). Potassium iodide (2.0 g) was then added
followed by 2 M sulfuric acid (2.5 mL). The liberated iodine was then titrated with the thiosulfate
solution, with the flask being constantly shaken. When the solution had become pale yellow it was
then diluted by the addition of distilled water (170 mL) and starch solution (2 mL). The thiosulfate
titration was then continued until the color changed from blue to colorless.
The concentration of Na2S2O3 was measured to be 0.1011 M ± 0.0005 M.
An example calculation is:
Mass of potassium iodate = 0.1462 g ± 0.0004 g (0.3%)
niodate = m
M =
0.1462 g
214.00 g/mol = 0.00068317 mol ± 0.3%
The iodate and iodide react to liberate iodine
IO3- + 5I- + 6H+ 3I2 + 3H2O
therefore
niodine = 3 x niodate = 0.0020495 mol ± 0.3%
For the reaction of iodine with thiosulfate the redox half cell reactions are
I2 + 2e- I-
2S2O32- S4O6
2- + 2e-
Therefore
nthiosulfate = 2 x niodine = 0.0040990 mol ± 0.3%
Volume of Na2S2O3 solution titrated was 40.50 mL ± 0.08 mL (0.2%)
Cthiosulfate = n
V =
4.0990 mmol
40.50 mL = 0.1012 mol/L ± 0.0005 mol/L (0.5%)
6
0.4 M FeCl3 Solution for Iodometric Titration Based on the method reported by Wahba, Asmar and Sadr.3 This solution was used as a catalyst for
iodometric titrations of peroxosulfate solutions.
Dissolved water (50 mL) and 2 M sulfuric acid (50 mL) was added to Iron(III) chloride hexahydrate (10
g, 37 mmol) to form an orange solution. The resulting solution was used to catalyze iodometric
titrations without further treatment or analysis. The orange Fe(III) solution was stored at room
temperature in a sealed bottle and was observed to be stable over one month of use.
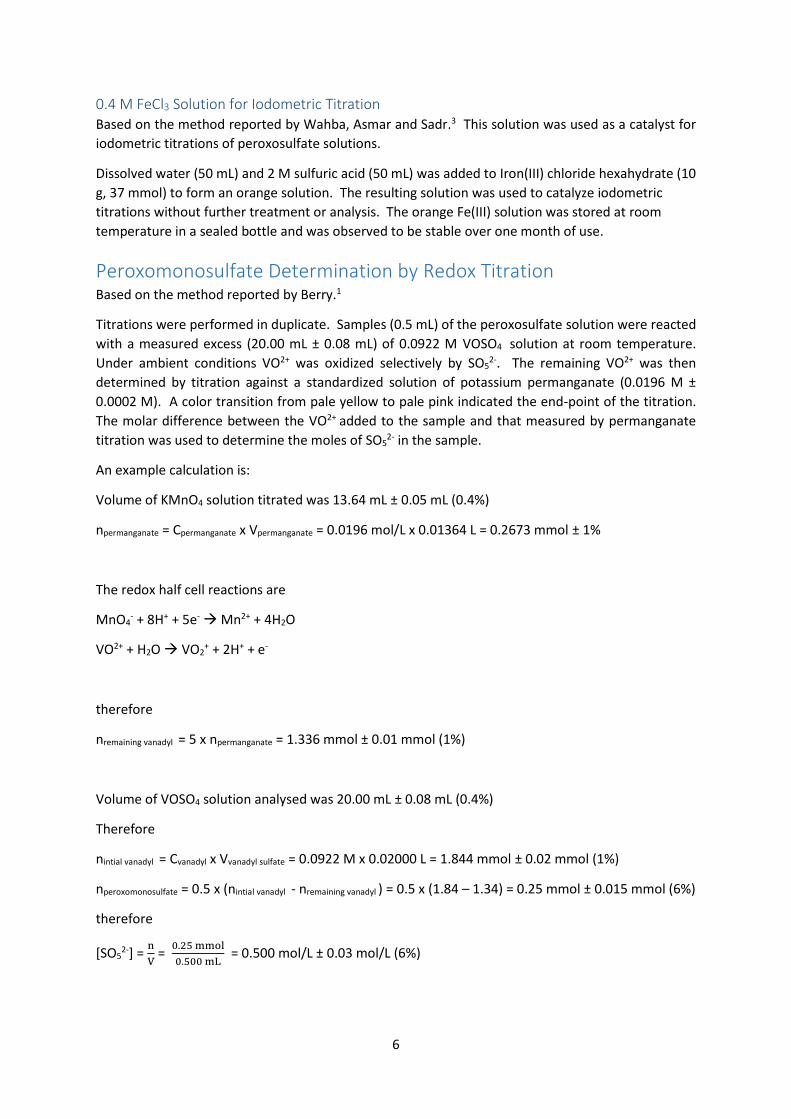
Peroxomonosulfate Determination by Redox Titration Based on the method reported by Berry.1
Titrations were performed in duplicate. Samples (0.5 mL) of the peroxosulfate solution were reacted
with a measured excess (20.00 mL ± 0.08 mL) of 0.0922 M VOSO4 solution at room temperature.
Under ambient conditions VO2+ was oxidized selectively by SO52-. The remaining VO2+ was then
determined by titration against a standardized solution of potassium permanganate (0.0196 M ±
0.0002 M). A color transition from pale yellow to pale pink indicated the end-point of the titration.
The molar difference between the VO2+ added to the sample and that measured by permanganate
titration was used to determine the moles of SO52- in the sample.
An example calculation is:
Volume of KMnO4 solution titrated was 13.64 mL ± 0.05 mL (0.4%)
npermanganate = Cpermanganate x Vpermanganate = 0.0196 mol/L x 0.01364 L = 0.2673 mmol ± 1%
The redox half cell reactions are
MnO4- + 8H+ + 5e- Mn2+ + 4H2O
VO2+ + H2O VO2+ + 2H+ + e-
therefore
nremaining vanadyl = 5 x npermanganate = 1.336 mmol ± 0.01 mmol (1%)
Volume of VOSO4 solution analysed was 20.00 mL ± 0.08 mL (0.4%)
Therefore
nintial vanadyl = Cvanadyl x Vvanadyl sulfate = 0.0922 M x 0.02000 L = 1.844 mmol ± 0.02 mmol (1%)
nperoxomonosulfate = 0.5 x (nintial vanadyl - nremaining vanadyl ) = 0.5 x (1.84 – 1.34) = 0.25 mmol ± 0.015 mmol (6%)
therefore
[SO52-] =
n
V =
0.25 mmol
0.500 mL = 0.500 mol/L ± 0.03 mol/L (6%)

7
Measurement of Total Oxidant Concentration of Peroxosulfate and
Hydrogen Peroxide Solutions by Iodometric Titration Based on the method described in Vogel’s Textbook of Quantitative Chemical Analysis2 with the
addition of FeCl3 catalysis as described by. Wahba, Asmar and Sadr.3
Iodometric titrations were performed in triplicate. 1 M sulfuric acid (100 mL) was added to a sample
(1.00 mL) of the oxidant solution. Potassium iodide (2 g) and 0.4 M FeCl3 catalyst solution (1 mL) were
added and then the solution was covered and allowed to stand at room temperature for 15 min.
During this time the solution turned brown as iodine formed. The solution of liberated iodine was
then uncovered and rapidly titrated with standardized 0.1011 M Na2S2O3 solution. When the solution
had become pale yellow it was then diluted by the addition of distilled water (170 mL) and starch
solution (2 mL). The thiosulfate titration was then continued until the color changed from blue to
colorless.
An example calculation is:
Volume of Na2S2O3 solution titrated was 20.13 mL ± 0.05 mL (0.2%)
nthiosulfate = Cthiosulfate x Vthiosulfate = 0.1011 mol/L x 0.02013 L = 2.0351 mmol ± 0.7%
For the reaction of iodine with thiosulfate the redox half cell reactions are
I2 + 2e- 2I-
2S2O32- S4O6
2- + 2e-
Therefore
niodine = 0.5 x nthiosulfate = 1.0175 mmol ± 0.7%
For the reaction of iodide with peroxomonosulfate the redox half cell reactions are
SO52- + 2H+ + 2e- SO4
2- + H2O
2I- I2 + 2e-
Therefore
nperoxomonosulfate = niodine = 1.0175 mmol ± 0.7%
Volume of oxidant solution analysed was 1.000 mL ± 0.008 mL (0.8%)
Therefore
[SO52-] =
n
V =
1.0175 mmol
1.000 mL = 1.02 mol/L ± 0.02 mol/L (1.5%)
Oxidant Determination by Redox Colorimetry
General Comments about setup of HPLC for analysis High throughput UV/visible spectrophotometric analysis was performed using an Agilent 1100 series
HPLC system consisting of a pump, autosampler and photodiode array detector. To setup the HPLC
for spectrophotometry the autosampler unit was connected to the detector using a straight union
where the HPLC column would typically be installed. The mobile phase was 0.2 mL/min of water (HPLC
grade), the injection volume was 1 µL and the run time was 1 min. In all redox colorimetry tests the

8
sample eluted as a peak between 0.1 and 0.5 min. The peak areas at 360, 380 and 407 nm were used
to calculate specific oxidant concentrations.
It was observed in our laboratory that the diode array detector generated significant amounts of heat
during operation, causing the sample tray to be at temperatures between 30 to 40 °C during warm
days (room temperature > 25 °C). Thus, the use of a dedicated Peltier-based sample cooler is
recommended. In the absence of an available sample cooler, effects of this heating were minimized
by installing an insulating air space between the diode array detector and the autosampler unit. A 6-
inch fan was also deployed to actively cool the detector, autosampler and the insulating gap.
Instrument Calibration
VOSO4 Redox Colorimetry Test for Peroxomonosulfate Concentration The UV-visible spectrophotometric measurement of monopersulfate was calibrated using standard
solutions of VO2+ which were prepared by treatment of the VOSO4 solution with known quantities of
potassium permanganate. Potassium permanganate was selected as the oxidant due to its ability to
cleanly oxidize the vanadyl anion, and because it is commercially available in analytically pure (> 99%)
material. Potassium monopersulfate triple salt (Oxone) was briefly considered as a potential oxidant
but its limited purity meant that the monopersulfate standardized would need to be standardized by
iodometric titration.
Three 0.1 M VO2+ stock solutions were prepared by reacting potassium permanganate (0.5 mmol, 79
mg) with 0.2 M VOSO4 solution and making up to 25 mL in volumetric glassware. The three 0.1 M VO2+
stock solutions were then diluted with 0.2 M VOSO4 solution to make a series of fifteen standards.
The standard concentrations and the absorption peak area at 360 nm are reported in Table S1 and
Figure S1.
Table S1. Calibration data for the VOSO4 redox colorimetry test for peroxomonosulfate.
[VO2+] (M) Area at 360 nm
0 152.9
0.0010 128.5
0.0050 125.0
0.0102 165.2
0.0203 326.4
0.0299 559.7
0.0407 826.6
0.0507 1051.1
0.0598 1318.8
0.0712 1604.4
0.0811 1851.9
0.0898 2086.0
0.1.08 2369.8
0.1014 2357.5
0.0997 2377.8

9
Figure S1. Calibration curve for the VOSO4 redox colorimetry test for peroxomonosulfate.
From the calibration curve a straight line was obtained for the region between 0.02 M and 0.1 M.
Below 0.02 M VO2+ the concentration could not be quantified due to low level background absorbance
by the VOSO4 solution.
The following calculations were used to convert peak area at 360 nm into a measurement of [SO52-]
for the peroxosulfate solution.
Area(360 nm) = 25474 x [VO2+] – 207.53
[VO2+] =
Area(360 nm) + 2207.53
25474
[SO52-] in the reaction sample is determined by multiplying [VO2
+] by a stoichiometry factor (1:2 SO52-
/ VO2+) and a dilution factor (25 µL diluted to 500 µL).
[SO52-] = [VO2
+] x stoichiometry factor x dilution factor = [VO2+] x 0.5 x 20 = [VO2
+] x 10
This calculation is valid for peroxosulfate solutions which have 0.20 < [SO52-] < 1.00 M.
Note: for determining [SO52-] at levels below 0.2 M it is necessary to prepare more concentrated
sample solutions. Samples (100 µL) treated with VOSO4 solution (400 µL) would use the equation:
[SO52-] = [VO2
+] x 0.5 x 5 = [VO2+] x 2.5
The VOSO4 redox colorimetry test gave different colored solutions depending on the [SO52-] of the
sample (Figure S2). Over the calibrated range the redox tests appeared blue with a green tint at high
end of the calibration. Samples with [SO52-] outside the calibration range (> 1.0 M) turned the solution

10
progressively more green and then yellow. This color change can be used as a qualitative test that the
samples are high in SO52- and may require a different dilution factor for quantitation.
Figure S2. The color changes of the VOSO4 redox colorimetry test for peroxomonosulfate. The numbers indicate the [SO52-]
of the sample (at a 20x dilution factor).
TiOSO4 Redox Colorimetry Test for Hydrogen Peroxide Concentration This method is a modification of the spectrophotometric method reported by David Graves.4
The redox colorimetric test for H2O2 was calibrated by treatment of a series of hydrogen peroxide
solutions (concentrations ranging from 0.01 to 1.00 M) with 0.1 M TiOSO4 solution. A 0.1 M solution
of H2O2 was prepared by dilution of 30% v/v H2O2 (280.8 µL) with distilled water to make a 25 mL
solution. The accurate concentration of our 30% v/v H2O2 was previously determined to be 8.9 M ±
0.2 M by titration with standardized potassium permanganate solution. Further dilution of the 0.10
M solution of H2O2 with distilled water provided 6 standards with [H2O2] ranging from 0.01 to 0.10 M.
A 1.00 M solution of H2O2 was also prepared by dilution of 30% v/v H2O2 (2.808 mL) with distilled water
to make a 25 mL solution. Further dilution of the 1.00 M solution of H2O2 with distilled water provided
7 standards with [H2O2] ranging from 0.10 to 1.00 M.
Samples (25 µL) of the H2O2 standards were treated with 0.1 M TiOSO4 solution (475 µL) to create a
series of H2TiO4 standards for calibration. A sample of distilled water was subjected to the same
treatment to create a 0 M H2TiO4 standard. The H2TiO4
standards were subjected to
spectrophotometric analysis at 407 nm using the automated HPLC method.
The standard concentrations and the absorption peak area at 407 nm are reported in Table S2 and
Figure S3.
0 M 0.5 M 1.0 M 1.5 M 2.0 M

11
Table S2. Calibration data for the TiOSO4 redox colorimetry test for hydrogen peroxide.
[H2O2] (M) Area at 407 nm
0 29.8
0.010 61.3
0.020 136.4
0.040 288.0
0.060 440.9
0.080 589.3
0.10 714.5
0.10 742.1
0.20 1458.9
0.30 2170.3
0.40 2959.5
0.60 4251.2
0.80 5291.4
1.00 6325.8
Figure S3. Calibration curve for the TiOSO4 redox colorimetry test for hydrogen peroxide.
From the calibration curve a straight line was obtained for [H2O2] between 0.01 M and 0.80 M.
Area(407 nm) = 6809.6 x [H2O2] + 52.279
[H2O2] = Area(407 nm)− 52.279
6809.6
These calculations are valid for peroxosulfate solutions which have 0.01 < [H2O2] < 0.80 M.
The TiOSO4 redox colorimetry test gave different colored solutions depending on the [H2O2] of the
sample (Figure S4). Over the calibrated range the redox tests resulted in a distinctive colour change
with the clear TiOSO4 solution changing to yellow or orange depending on the [H2O2].

12
Figure S4. The color changes of the TiOSO4 redox colorimetry test for hydrogen peroxide. The numbers indicate the [H2O2] of the sample.
Fe(II) Redox Colorimetry Test for Total Oxidant Concentration The redox colorimetric test for total oxidant concentration was calibrated by treatment of a series of
(NH4)2S2O8 solutions (concentrations ranging from 0.09 to 1.99 M) with 0.3 M Fe(NH4)2(SO4)2 solution.
A 1.99 M solution of (NH4)2S2O8 was prepared by dissolving (NH4)2S2O8 (11.6082 g, 50.87 mmol) with
distilled water to make a 25 mL solution. Further dilution of the 1.99 M solution of (NH4)2S2O8 with
distilled water provided 8 standards with [S2O82-] ranging from 0.09 to 1.99 M
Samples (25 µL) of the (NH4)2S2O8 standards were treated with 0.3 M Fe(NH4)2(SO4)2 solution (475
µL) to create a series of Fe(III) standards for calibration. A sample of distilled water was subjected to
the same treatment to create a 0 M Fe(III) standard. The Fe(III) standards were subjected to
spectrophotometric analysis at 380 nm using the automated HPLC method.
The standard concentrations and the absorption peak area at 380 nm are reported in Table S3 and
Figure S5.
Table S3. Calibration data for the Fe(II) redox colorimetry test for total oxidant concentration.
[S2O82-] (M) Area at 380 nm
0 215.9
0.0997 627.4
0.1994 1131.4
0.4985 2565.3
0.7976 4043.9
0.9970 4961.6
1.1964 5676.5
1.3958 6635.9
1.9940 8580.6
0 M 0.05 M 0.10 M 0.50 M 1.00 M

13
Figure S5. Calibration curve for the Fe(II) redox colorimetry test for total oxidant concentration.
From the calibration curve a straight line was obtained for the region between 0.10 M and 2.00 M.
Area(380 nm) = 4337.3 x [S2O82-] + 367.09
therefore
[Ox]tot = Area(380 nm)− 367.09
4337.3
These calculations are valid for reactions which have 0.1 < [Ox]tot < 2.0 M
The color change in the Fe(II) redox colorimetry test was less visually distinct than the other two redox
colorimetry tests (Figure S6). The presence of an oxidant in the sample was indicated by a colour
change from pale green to pale yellow.
Figure S6. The color changes of the Fe(II) redox colorimetry test for total oxidant concentration. The numbers indicate the [Ox]tot of the sample.
Determination of Peroxodisulfate by Redox Colorimetry The concentration of peroxodisulfate in solution was determined by a calculation using the results of
the three redox colorimetric tests.
[S2O82-] = [Ox]tot – [SO5
2-] – [H2O2]
0 M 0.5 M 1.0 M 1.5 M 2.0 M

14
Sample Preparation and Analysis Samples (25 µL) of peroxosulfate solutions were added to HPLC vials containing the redox colorimetry
reagent solution (475 µL). Each of the three redox colorimetry tests (Table S4) were performed in
triplicate for each sample. After the HPLC vials had been capped and inverted to mix the reagents,
they were transferred to a fridge (4 °C) for storage prior to analysis using the automated HPLC method.
Samples were analysed in batches within 4 h of their preparation.
Table S4. Summary of the redox colorimetric assays.
Spectrophotometric Reagent Wavelength for Analysis Species Measured
VOSO4 360 nm SO52-
TiOSO4 407 nm H2O2
Fe(II) 380 nm SO52-, H2O2, S2O8
2-
During the development of this assay it was observed that the first HPLC measurement of [SO52-] in
any analysis batch was typically larger than subsequent measurements. Batches were ran on the HPLC
in sets of 9 with the 3 [SO52-] tests being analysed first, followed by the [H2O2] tests, and then the
[Ox]tot tests. The first of the [SO52-] analyses was typically larger than the subsequent measurements
and repeated analyses of the same [SO52-] test sample would show the same behavior. To investigate
this further a mixed peroxosulfate solution was subjected to the three redox colorimetry tests. In
each test, a single treated sample was analysed ten times on the HPLC (Table S5). In the repeated
determination of [SO52-] a value of 0.974 M was obtained from the first measurement. This first
measurement was outside the range of the subsequent 9 measurements (0.860 to 0.925 M) and was
suspected to be an outlier. The Grubbs’ outlier test was applied to the measurements at a significance
level of 5% and it was found that the Grubbs’ test value (Z) for the first measurement (Z = 2.39) was
larger than the critical value of 2.29 for a sample size of 10.5 Outliers were not detected in the
repeated analyses of the [H2O2] and [Ox]tot samples (Table S5).
The inflation of the first [SO52-] measurement appears to be an artifact in the absorbance
measurement by the HPLC. To correct for this the effect, the first redox colorimetry test sample in
each batch was analysed twice on the HPLC, with the first measurement being discarded.

15
Table S5. Grubbs’ outlier test showing that the first [SO52-] test measurement in a batch of sample analyses is an outlier.
analysis [SO5(2-)] (M) Z [H2O2] (M) Z [Ox]tot (M) Z
1 0.974 2.39 0.021 0.97 0.832 1.77
2 0.902 0.33 0.019 1.54 0.845 1.26
3 0.884 0.17 0.021 1.08 0.863 0.54
4 0.867 0.64 0.022 0.67 0.906 1.18
5 0.873 0.47 0.026 0.23 0.906 1.21
6 0.925 0.98 0.026 0.44 0.863 0.51
7 0.872 0.52 0.029 1.11 0.885 0.37
8 0.868 0.63 0.030 1.38 0.884 0.31
9 0.875 0.42 0.026 0.31 0.882 0.23
10 0.860 0.85 0.028 0.78 0.895 0.77
mean 0.890 0.025 0.876
standard
deviation 0.035 0.004 0.025
Validation of the Redox Colorimetry Tests Against Peroxosulfate Solutions of Known
Composition Aqueous oxidant solutions were prepared as follows, and standardized by iodometric titration for
validation of the redox colorimetry tests. The comparison of the redox colorimetric and the
iodometric titration results are reported in Table S6, and also Figure 2A of the article.
[KHSO5.0.5KHSO4.0.5K2SO4] (8.95 g, 25 mmol) was made up to 25 mL with distilled water. The salt was
not completely soluble at this concentration (note: the K2SO4 and KHSO4 salts precipitate before the
KHSO5). The excess solid material was removed by filtration. The oxidant concentration of the
solution was found to be 1.02 M by iodometric titration (Table S6, entry 2).
30% v/v H2O2 (1.966 mL, 17.5 mmol) was made up to 25 mL with distilled water. The oxidant
concentration of the solution was found to be 0.70 M by iodometric titration (Table S6, entry 4).
(NH4)2S2O8 (5.72 g, 25 mmol) was made up to 25 mL with distilled water. The oxidant concentration
of the solution was found to be 0.99 M by iodometric titration (Table S6, entry 3).
Mixed oxidant solutions were created by the combination of the standardized oxidant solutions above,
along with water, in different volume proportions. The compositions reported in table S6 were
calculated based on the dilutions used to prepare the mixed oxidant solutions. The redox colorimetric
analyses of these mixed solutions are reported in Table S7, and also in Figure 2B-D of the article.

16
Table S6. Validation of redox colorimetry tests against aqueous oxidant solutions which were also analysed by iodometric titration.
1 2 3 mean 1 2 3 mean 1 2 3 mean 1 2 3 mean
1 distilled water <0.2 <0.2 <0.2 <0.2 <0.01 <0.01 <0.01 <0.01 <0.1 <0.1 <0.1 <0.1
2
potassium
peroxymonosulfate 1.018 1.045 0.994 1.019 1.078 1.065 1.067 1.070 <0.01 <0.01 <0.01 <0.01 1.022 1.026 1.053 1.034
3
ammonium
peroxydisulfate 0.985 0.995 0.979 0.986 <0.2 <0.2 <0.2 <0.2 <0.01 <0.01 <0.01 <0.01 0.969 1.006 1.012 0.996
4 hydrogen peroxide 0.678 0.724 0.701 0.701 0.286 0.260 0.243 0.263 0.656 0.661 0.680 0.666 0.668 0.670 0.681 0.673
[Ox]tot (M)
oxidantentry
iodometric titration
[oxidant] (M) [SO5(2-)] (M) [H2O2] (M)
redox colorimetry
Table S7. Validation of redox colorimetry tests against aqueous oxidant mixtures of known composition.
1 2 3 mean 1 2 3 mean 1 2 3 mean
1 0.36 0.07 0.35 0.78 0.419 0.397 0.396 0.404 0.055 0.067 0.069 0.064 0.745 0.751 0.766 0.754 0.286
2 0.10 0.07 0.40 0.57 0.073 0.072 0.071 0.072 0.065 0.068 0.072 0.068 0.539 0.549 0.566 0.551 0.411
3 0.41 0.07 0.10 0.58 0.452 0.452 0.454 0.453 0.060 0.072 0.075 0.069 0.606 0.637 0.648 0.630 0.109
4 0.36 0.14 0.35 0.85 0.364 0.347 0.352 0.354 0.130 0.149 0.149 0.143 0.798 0.813 0.821 0.811 0.314
5 0.10 0.14 0.40 0.64 0.0682 0.0638 0.0659 0.066 0.1342 0.1486 0.1461 0.143 0.66 0.6714 0.681 0.671 0.462
6 0.41 0.14 0.10 0.65 0.4181 0.3892 0.386 0.398 0.1279 0.1474 0.1524 0.143 0.6554 0.6769 0.6834 0.672 0.132
7 0.36 0.21 0.35 0.92 0.31 0.294 0.284 0.296 0.206 0.228 0.232 0.222 0.88 0.902 0.906 0.896 0.378
8 0.10 0.21 0.35 0.66 0.0795 0.0755 0.0749 0.077 0.1966 0.2145 0.2267 0.213 0.6636 0.6796 0.6859 0.676 0.387
9 0.36 0.21 0.10 0.67 0.3046 0.2868 0.2836 0.292 0.2009 0.2163 0.2279 0.215 0.6646 0.6836 0.6952 0.681 0.174
[Ox]tot (M)
solution
[SO5(2-)] (M) [H2O2] (M)
redox colorimetryoxidant composition (M)
[SO5(2-)] [H2O2] [S2O8(2-)] [Ox]tot
[S2O8(2-)]
(M)
17
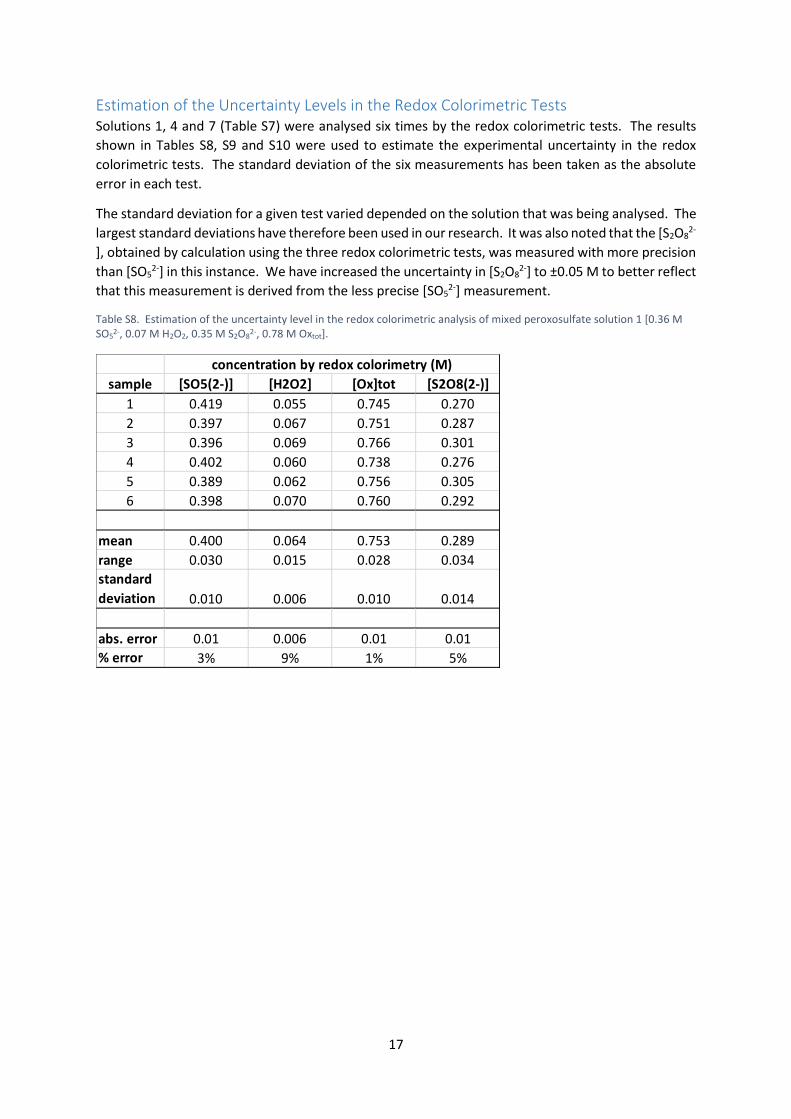
Estimation of the Uncertainty Levels in the Redox Colorimetric Tests Solutions 1, 4 and 7 (Table S7) were analysed six times by the redox colorimetric tests. The results
shown in Tables S8, S9 and S10 were used to estimate the experimental uncertainty in the redox
colorimetric tests. The standard deviation of the six measurements has been taken as the absolute
error in each test.
The standard deviation for a given test varied depended on the solution that was being analysed. The
largest standard deviations have therefore been used in our research. It was also noted that the [S2O82-
], obtained by calculation using the three redox colorimetric tests, was measured with more precision
than [SO52-] in this instance. We have increased the uncertainty in [S2O8
2-] to ±0.05 M to better reflect
that this measurement is derived from the less precise [SO52-] measurement.
Table S8. Estimation of the uncertainty level in the redox colorimetric analysis of mixed peroxosulfate solution 1 [0.36 M SO5
2-, 0.07 M H2O2, 0.35 M S2O82-, 0.78 M Oxtot].
sample [SO5(2-)] [H2O2] [Ox]tot [S2O8(2-)]
1 0.419 0.055 0.745 0.270
2 0.397 0.067 0.751 0.287
3 0.396 0.069 0.766 0.301
4 0.402 0.060 0.738 0.276
5 0.389 0.062 0.756 0.305
6 0.398 0.070 0.760 0.292
mean 0.400 0.064 0.753 0.289
range 0.030 0.015 0.028 0.034
standard
deviation 0.010 0.006 0.010 0.014
abs. error 0.01 0.006 0.01 0.01
% error 3% 9% 1% 5%
concentration by redox colorimetry (M)
18
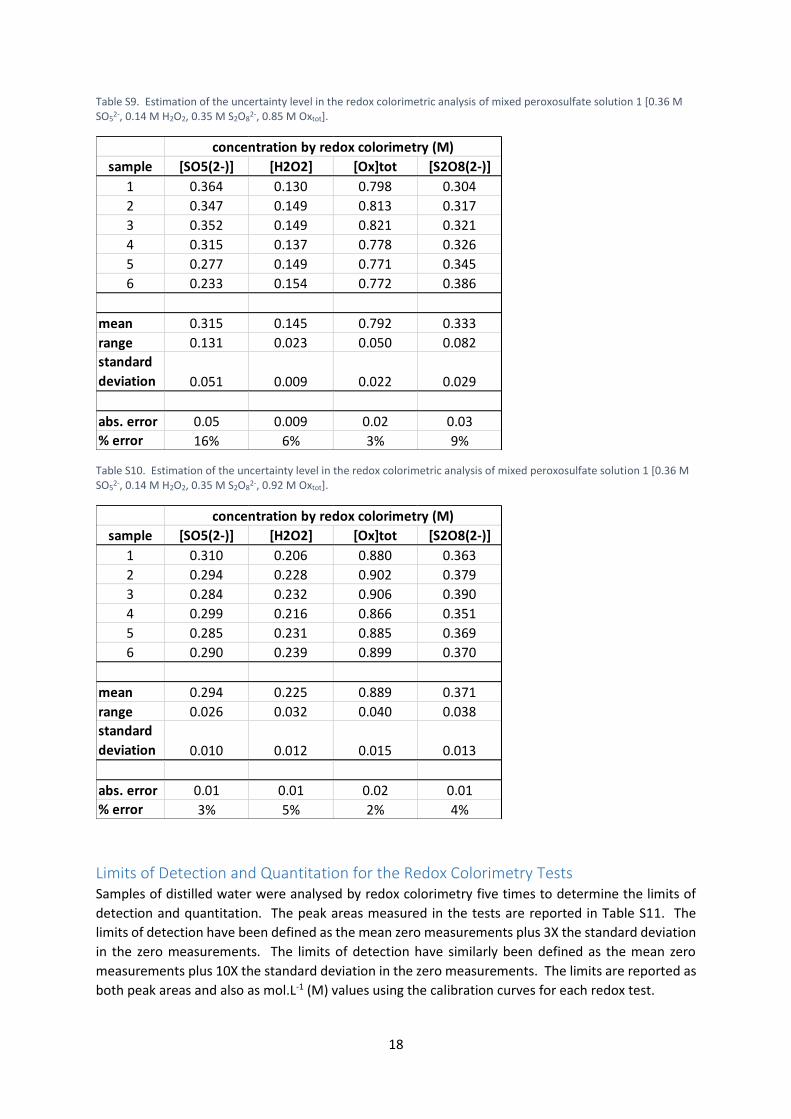
Table S9. Estimation of the uncertainty level in the redox colorimetric analysis of mixed peroxosulfate solution 1 [0.36 M SO5
2-, 0.14 M H2O2, 0.35 M S2O82-, 0.85 M Oxtot].
sample [SO5(2-)] [H2O2] [Ox]tot [S2O8(2-)]
1 0.364 0.130 0.798 0.304
2 0.347 0.149 0.813 0.317
3 0.352 0.149 0.821 0.321
4 0.315 0.137 0.778 0.326
5 0.277 0.149 0.771 0.345
6 0.233 0.154 0.772 0.386
mean 0.315 0.145 0.792 0.333
range 0.131 0.023 0.050 0.082
standard
deviation 0.051 0.009 0.022 0.029
abs. error 0.05 0.009 0.02 0.03
% error 16% 6% 3% 9%
concentration by redox colorimetry (M)
Table S10. Estimation of the uncertainty level in the redox colorimetric analysis of mixed peroxosulfate solution 1 [0.36 M SO5
2-, 0.14 M H2O2, 0.35 M S2O82-, 0.92 M Oxtot].
sample [SO5(2-)] [H2O2] [Ox]tot [S2O8(2-)]
1 0.310 0.206 0.880 0.363
2 0.294 0.228 0.902 0.379
3 0.284 0.232 0.906 0.390
4 0.299 0.216 0.866 0.351
5 0.285 0.231 0.885 0.369
6 0.290 0.239 0.899 0.370
mean 0.294 0.225 0.889 0.371
range 0.026 0.032 0.040 0.038
standard
deviation 0.010 0.012 0.015 0.013
abs. error 0.01 0.01 0.02 0.01
% error 3% 5% 2% 4%
concentration by redox colorimetry (M)
Limits of Detection and Quantitation for the Redox Colorimetry Tests Samples of distilled water were analysed by redox colorimetry five times to determine the limits of
detection and quantitation. The peak areas measured in the tests are reported in Table S11. The
limits of detection have been defined as the mean zero measurements plus 3X the standard deviation
in the zero measurements. The limits of detection have similarly been defined as the mean zero
measurements plus 10X the standard deviation in the zero measurements. The limits are reported as
both peak areas and also as mol.L-1 (M) values using the calibration curves for each redox test.

19
The limits of detection for the TiOSO4 and Fe(II) tests in mol.L-1 (M) values were both determined to
be negative values. This is due to the calibration curves not passing through zero. The limit of
quantitation for the Fe(II) test in mol.L-1 (M) was also negative due to this effect. It is therefore
recommended that the only peak areas of the redox colorimetry assays should be considered when
determining if results are above the limits of detection or quantitation. The limits of quantitation
determined in this was equivalent to, or less than the lower limits of the calibrations ranges used in
our research.
Table S11. Measurement of the limits of detection and quantitation for the redox colorimetry tests.
TiSO4 Fe(II)
(20x dilution) (5x dilution) at 407 nm at 380 nm
166 129 27 292
151 136 18 294
141 131 17 296
114 156 18 293
120 109 18 289
138 132 19 293
52 47 9 7
22 17 4 3
LOD (peak area) 203 183 31 301
LOD (M) 0.16 0.04 -0.003 -0.02
LOQ (peak area) 354 301 59 319
LOQ (M) 0.22 0.05 0.001 -0.01
mean
range
standard deviation
sample
2
3
4
5
redox colorimetry peak area
VOSO4 at 360 nm
1
It should be noted that the Fe(II) reagent solution becomes oxidized by atmospheric oxygen over time.
In our research we have used the reagent over a period of one week (with storage at 4 °C) with a small
but measurable increase in the zero measurement of the reagent being observed. In our research the
effect of this background oxidation has not been problematic as it is below the limits of our calibration
range. For applications were the total oxidant concentration must be determined accurately at low
levels it is recommended that freshly prepared and calibrated Fe(II) reagent solution be used.
Quenching H2O2 in Peroxosulfate Solutions with MnO2 An (NH4)2SO5 solution was prepared by the addition of an excess of (NH4)2SO4 (0.6 mol) to a saturated
solution (75 mL) of [KHSO5.0.5KHSO4.0.5K2SO4] (0.2 mol) in water. After filtration to remove the excess
sulfate salts, the (NH4)2SO5 was diluted with water (25 m) and stored in the refrigerator. The oxidant
composition was determined to be 1.24 M SO52- with less than 0.01 M of H2O2, by redox colorimetry.
A mixed oxidant solution of known composition was prepared by combining aqueous solutions of H2O2
(0.93 M, 3 mL), (NH4)2SO5 (1.24 M, 5 mL) and (NH4)2S2O8 (1.25 M, 2 mL) in measured volumes. The
expected composition of the mixed oxidant solution was 0.62 M SO52-, 0.28 M H2O2 and 0.25 M S2O8
2-
(Table S12).

20
The mixed oxidant solution was analysed by redox colorimetry before a sample (0.5 mL) was added to
MnO2 (10 mg) and left to react at room temperature for 1 h. After the sample stopped effervescing it
was analysed by redox colorimetry to determine the oxidant composition without the interference
effects of H2O2 (Table S12).
The redox colorimetric analysis before MnO2 treatment provided a measurement of [H2O2] which
agreed with the expected value within the uncertainty limits of ± 0.01 M (Table S12). The [SO52-] and
[S2O82-] measured before MnO2 treatment differed from the expected values due to the interference
effects of H2O2 in the VOSO4 assay. After treatment of the sample with MnO2 the redox colorimetric
assays provided measurements of [SO52-] and [S2O8
2-] which agreed with the expected values within
the uncertainty limits of ± 0.05 M.
Table S12 Redox colorimetric analysis of a peroxosulfate and H2O2 solution before, and after quenching of the H2O2 by MnO2.
sample [SO5(2-)] [H2O2] [Ox]tot [S2O8(2-)] [SO5(2-)] [H2O2] [Ox]tot [S2O8(2-)]
1 0.40 0.24 1.14 0.49 0.69 0.02 0.88 0.18
2 0.42 0.28 1.14 0.44 0.66 0.02 0.89 0.21
3 0.43 0.30 1.18 0.46 0.63 0.02 0.90 0.25
mean 0.42 0.27 1.15 0.46 0.66 0.02 0.89 0.21
expected 0.62 0.28 1.15 0.25 0.62 0.00 0.87 0.25
before MnO2 treatment after MnO2 treatment
concentration by redox colorimetry (M)
Analysis of the Decomposition of Peroxodisulfate into Peroxomonosulfate and
Hydrogen Peroxide 2 M sulfuric acid (50 mL) was added to (NH4)2S2O8 (11.4 g, 50 mmol) in a magnetically stirred EasyMax
102 reactor (supplied by Mettler-Toledo). The reactor was stirred at room temperature until all the
solid had dissolved, and then a sample of the solution was analysed by redox colorimetry. The reactor
temperature was then increased to 50 °C over 2 min. Samples (0.5 mL) were taken from the reactor
at intervals, rapidly cooled by immersion in a cold water bath, and then analysed by redox colorimetry
using our standard method. The redox colorimetry results are reported in Table S13 and Figure S7.
Table S13. Redox colorimetric reaction analysis of the decomposition of peroxodisulfate in an acidic solution at 50 °C.
time (h) [SO5(2-)] [H2O2] [Ox]tot [S2O8(2-)]
0 <0.05 <0.01 0.87 0.87
0.6 0.43 <0.01 0.86 0.43
1 0.56 <0.01 0.94 0.38
1.5 0.69 0.01 0.92 0.22
2.1 0.77 0.02 0.91 0.12
4.5 0.77 0.08 0.90 0.05
7 0.72 0.13 0.89 0.04
concentration by redox colorimetry (M)

21
Figure S7 Changes in the oxidant composition of a 1 M (NH4)2S2O8 solution in 2 M H2SO4 heated at 50 °C were followed using the colorimetric redox assays. Key to chart: [SO5
2-], [H2O2], [Ox]tot, [S2O82-].
Analysis of the Decomposition of an Electrochemically Generated Peroxosulfate
Solution Peroxosulfate solutions were generated electrochemically using a method we have reported
previously.6
A 2 M solution (100 mL) of (NH4)2SO4 (11.4 g, 50 mmol) in 2 M sulfuric acid was recirculated (200
mL/min) through the anodic cell in batch recycle mode. The electrochemical reactor was operated
under galvanostatic conditions (150 mA/cm2 current density) for 10 h. The electrolytic flow cell was
cooled by circulation of an ice water bath. After the peroxosulfate solution was electrochemically
generated it was stored in a sealed bottle inside a refrigerator (3-4 °C).
A portion of the peroxosulfate solution (50 mL) was magnetically stirred in a EasyMax 102 reactor
(supplied by Mettler-Toledo). A sample of the solution was analysed by redox colorimetry. The
reactor temperature was then increased to 50 °C over 2 min. Samples (0.5 mL) were taken from the
reactor at intervals, rapidly cooled by immersion in a cold water bath, and then analysed by redox
colorimetry using our standard method. The sample collected after 25 h was analysed by redox
colorimetry before and after quenching the H2O2 by addition of MnO2 to the sample. The redox
colorimetry results are reported in Table S14 and Figure 3.
0
0.2
0.4
0.6
0.8
1
0 1 2 3 4 5 6 7
C (
M)
Time (h)

22
Table S14. Redox colorimetric reaction analysis of the decomposition of an electrochemically generated peroxosulfate solution at 50 °C.
time (h) [SO5(2-)] [H2O2] [Ox]tot [S2O8(2-)]
0 0.55 <0.01 0.97 0.42
0.5 0.66 0.01 1.10 0.43
1.1 0.76 0.01 1.03 0.26
2.1 0.84 0.02 0.99 0.13
3.2 0.94 0.03 1.07 0.10
4.3 0.93 0.05 1.05 0.07
6.2 0.86 0.07 1.05 0.12
25 0.59 0.38 0.98 0.01
concentration by redox colorimetry (M)
Design of an Automated Sampling System In this work we have employed manual sampling using an autopipette to dilute aliquots with the redox
colorimetric reagents. In future applications, we envisage that an liquid handling and analysis system
might be constructed to enable the fully automated and continuous analysis of reactions by redox
colorimetry. The HPLC photodiode array detector could feasibly be replaced with low cost LED based
absorbance detectors.7–9 Figure S8 and S9 detail how such a platform might be constructed for the
continuous monitoring of flow and batch processes employing peroxosulfate oxidants.
Figure S8 Design of an automated sampling and analysis platform for the continuous redox colorimetric analysis of a electrochemical flow reactor system for the generation of peroxosulfate oxidants.

23
Figure S9 Design of an automated sampling and analysis platform for the continuous redox colorimetric analysis of a batch reaction involving peroxosulfate oxidants.
References 1 A. J. Berry, Analyst, 1933, 58, 464–467.
2 G. H. Jeffery, J. Bassett, J. Mendham and R. C. Denney, Vogel’s textbook of quantitative chemical analysis, Longman Scientific & Technical, London, 5th edn., 1989.
3 N. Wahba, M. F. El Asmar and M. M. El Sadr, Anal. Chem., 1959, 31, 1870–1871.
4 D. B. Graves, Peroxide (H2O2) quantification, http://www.graveslab.org/lab-resources/procedures/peroxide-h2o2-quantification, (accessed August 2016).
5 R. Boddy and G. Smith, Effective Experimentation, John Wiley & Sons, Ltd, Chichester, UK, 2010.
6 J. Zhu, K. K. Hii and K. Hellgardt, ACS Sustain. Chem. Eng., 2016, 4, 2027–2036.
7 T.-S. Yeh and S.-S. Tseng, J. Chinese Chem. Soc., 2006, 53, 1067–1072.
8 M. O’Toole and D. Diamond, Sensors, 2008, 8, 2453–2479.
9 Z. M. da Rocha, C. S. Martinez-Cisneros, A. C. Seabra, F. Valdés, M. R. Gongora-Rubio, J. Alonso-Chamarro, A. Dybko, Z. Brzozka and D. Stadnik, Lab Chip, 2012, 12, 109–117.