a collaborative filtering approach to mitigate the new user cold start problem
TRANSCRIPT
Knowledge-Based Systems 26 (2012) 225–238
Contents lists available at SciVerse ScienceDirect
Knowledge-Based Systems
journal homepage: www.elsevier .com/ locate /knosys
A collaborative filtering approach to mitigate the new user cold start problem
Jesús Bobadilla ⇑, Fernando Ortega, Antonio Hernando, Jesús BernalUniversidad Politecnica de Madrid, FilmAffinity.com Research Team, Spain
a r t i c l e i n f o
Article history:Received 23 November 2010Received in revised form 29 July 2011Accepted 29 July 2011Available online 30 August 2011
Keywords:Cold startRecommender systemsCollaborative filteringNeural learningSimilarity measuresLeave-one-out-cross validation
0950-7051/$ - see front matter � 2011 Elsevier B.V. Adoi:10.1016/j.knosys.2011.07.021
⇑ Corresponding author. Tel.: +34 670711147; fax:E-mail address: [email protected] (J. Bobadi
a b s t r a c t
The new user cold start issue represents a serious problem in recommender systems as it can lead to theloss of new users who decide to stop using the system due to the lack of accuracy in the recommenda-tions received in that first stage in which they have not yet cast a significant number of votes with whichto feed the recommender system’s collaborative filtering core. For this reason it is particularly importantto design new similarity metrics which provide greater precision in the results offered to users who havecast few votes. This paper presents a new similarity measure perfected using optimization based on neu-ral learning, which exceeds the best results obtained with current metrics. The metric has been tested onthe Netflix and Movielens databases, obtaining important improvements in the measures of accuracy,precision and recall when applied to new user cold start situations. The paper includes the mathematicalformalization describing how to obtain the main quality measures of a recommender system using leave-one-out cross validation.
� 2011 Elsevier B.V. All rights reserved.
1. Introduction
Recommender systems (RS) [48] enable recommendations to bemade to users of a system in reference to the items or elements onwhich this system is based (books, electrical appliances, films, e-learning material, etc.). The core of a RS lie in its filtering algo-rithms: demographic filtering [26] and content-based filtering[28,47] are two well known filtering techniques. Content-basedRS base the recommendations made to a user on the choices thisuser has made in the past (e.g. in a web-based e-commerce RS, ifthe user purchased computer science books in the past, the RS willprobably recommend a recent computer science book that he hasnot yet purchased on this website); demographic filtering basedRS are based on the assumption that individuals sharing certaincommon personal features (sex, age, country, etc.) will also sharecommon preferences.
Currently, collaborative filtering (CF) is the most commonlyused and studied technology [1,17]. CF RS are based on the wayin which humans have made decisions throughout history: in addi-tion to our own personal experience, we also base our decisions onthe experiences and knowledge coming from a relatively largegroup of acquaintances. We take this set of knowledge and we con-sider it ‘‘in a critical way’’, to obtain the decision we think will bestsuit our goal. ‘‘In a critical way’’ means that we are more inclined totake into consideration those suggestions made by people withwhom we have more in common regarding the pursued goal; for
ll rights reserved.
+34 913367522.lla).
instance, before throwing ourselves down a steep slope on a smallsnowboard, we listen to all of our friends’ opinions, but we regardmuch highly those that we consider to have more in common withour level in that sport, with our liking for risk, etc.
There are also some so-called hybrid RS: they are systemswhich combine different filtering approaches to exploit merits ofeach one of these techniques, such as a combination of CF withdemographic filtering or CF with content based filtering [2]. Amongthe natural fields of action of these hybrid models we can highlightsome bio-inspired models which are used in the filtering stage[14].
CF based RS allow users to give ratings about a set of elements(e.g. hotels, restaurants, tourist destinations, etc. in a CF basedwebsite), in such a way that when enough information is storedon the system we can make recommendations to each user basedon information provided by those users we consider to have themost in common with them. Movie recommendation websitesare probably the best-known cases to users and are without adoubt the most thoroughly studied by researchers [25,2], althoughthere are many other fields in which RS have great and increasingimportance, such as e-commerce [23,57,52,36], e-learning[12,4,21], music [15,31], digital libraries [40], playing games [32],social networks based collaborative filtering [13,35], etc.
A key factor in the quality of the recommendations obtained ina CF based RS lies in its capacity to determine which users have themost in common (are the most similar) to a given user. A series ofalgorithms [19] and metrics [1,5,55,7–9] of similarity betweenusers are currently available, enabling this important function tobe performed in the CF core of this type of RS.

226 J. Bobadilla et al. / Knowledge-Based Systems 26 (2012) 225–238
In order to measure the quality of the results of a RS, there is awide range of metrics which are used to evaluate both the predic-tion and recommendation quality of these systems [17,1,18,6].
CF based RS estimate the value of an item not voted by a uservia the ratings made on that item by a set of similar users. Theoverall quality in the prediction is called accuracy [3] and the meanabsolute error (MAE) is normally used to obtain it [17]. The sys-tem’s ability to make estimations is called coverage and it indicatesthe percentage of prediction which we can make using the set ofsimilar users selected (usually, the more similar users we selectand the more votes the selected users have cast, the better the cov-erage we achieve). In RS, besides aiming to improve the qualitymeasures of the predictions (accuracy and coverage), there areother issues that need be taken into account [56,41,51]: avoidingoverspecialization phenomena, finding good items, credibility ofrecommendations, precision and recall measures, etc.
The rest of the paper is divided into the following sections (withthe same numbering shown here):
2. State of the art, in which a review is made of the most relevantcontributions that exist in the CF aspects covered in the paper:cold-start and application of neural networks to the RS.
3. General hypothesis and motivations: what we aim to contributeand the indications that lead us to believe that carrying outresearch into this subject will provide satisfactory results thatsupport the hypothesis set out.
4. Design of the user cold-start similarity measure: explanationand formalization of the design of the similarity measure pro-posed as a linear combination of simple similarity measures,by adjusting the weights using optimization techniques basedon neural networks.
5. Collaborative filtering specifications: formalization of the CFmethodology which specifies the way to predict and recom-mend, as well as to obtain the quality values of the predictionsand recommendations. This is the formalization that supportsthe design of experiments carried out in the paper. The method-ology is provided which describes the use of leave-one-outcross validation applied to obtaining the MAE, coverage, preci-sion and recall.
6. Design of the experiments with which the quality results areobtained provided by the user cold-star similarity measure pro-posed and by a set of current similarity measures for which weaim to improve the results. We use the Netflix (http://www.netflixprize.com) and Movielens (http://www.movie-lens.org) databases.
7. Graphical results obtained in the experiments, complementedwith explanations of the behavior of each quality measure.
8. Most relevant conclusions obtained.
2. State of the art
2.1. The cold-start issue
The cold-start problem [48,1] occurs when it is not possible tomake reliable recommendations due to an initial lack of ratings.We can distinguish three kinds of cold-start problems: new com-munity, new item and new user. The last kind is the most impor-tant in RS that are already in operation and it is the one coveredin this paper.
The new community problem [49,27] refers to the difficulty inobtaining, when starting up a RS, a sufficient amount of data (rat-ings) which enable reliable recommendations to be made. Whenthere are not enough users in particular and votes in general, itis difficult to maintain new users, which come across a RS withcontents but no precise recommendations. The most commonways of tackling the problem are encouraging votes to be made
via other means or not making CF-based recommendations untilthere are enough users and votes.
The new item problem [38,39] arises due to the fact that thenew items entered in RS do not usually have initial votes, andtherefore, they are not likely to be recommended. In turn, an itemthat is not recommended goes unnoticed by a large part of theusers community, and as they are unaware of it they do not rateit; in this way, we can enter a vicious circle in which a set of itemsof the RS are left out of the votes/recommendations process. Thenew item problem has less of an impact on RS in which the itemscan be discovered via other means (e.g. movies) than in RS wherethis is not the case (e.g. e-commerce, blogs, photos, videos, etc.). Acommon solution to this problem is to have a set of motivatedusers who are responsible for rating each new item in the system.
The new user problem [42,43,46] is among the great difficultiesfaced by the RS in operation. When users register they have notcast any votes yet and, therefore, they cannot receive any person-alized recommendations based on CF; when the users enter theirfirsts ratings they expect the RS to offer them personalized recom-mendations, but the number of votes entered is usually not suffi-cient yet to provide reliable CF-based recommendations, and,therefore, new users may feel that the RS does not offer the servicethey expected and they may stop using it.
The common strategy to tackle the new user problem consistsof turning to additional information to the set of votes in orderto be able to make recommendations based on the data availablefor each user; this approach has provided a line of research papersbased on hybrid systems (usually CF-content based RS and CF-demographic based RS). Next we analyze some hybrid approaches;[30] propose a new content-based hybrid approach that makes useof cross-level association rules to integrate content informationabout domains items. Kim et al. [24] use collaborative tagging em-ployed as an approach in order to grasp and filter users’ prefer-ences for items and they explore the advantages of thecollaborative tagging for data sparseness and a cold-start user(they collected the dataset by crawling the collaborative taggingdel.icio.us site). Weng et al. [53] combine the implicit relations be-tween users’ items preferences and the additional taxonomic pref-erences so as to make better quality recommendations as well asalleviate the cold-start problem. Loh et al. [33] represent user’sprofiles with information extracted from their scientific publica-tions. Martinez et al. [34] present a hybrid RS which combines aCF algorithm with a knowledge-based one. [10] propose a numberof common terms/term frequency (NCT/TF) CF algorithm based ondemographic vector. Saranya and Atsuhiro [50] propose a hybridRS that makes use of latent features extracted from items repre-sented by a multi-attributed record using a probabilistic model.Park et al. [37] propose a new approach: they use filterbots, andsurrogate users that rate items based only on user or itemattributes.
All the former approaches base their strategies on the presenceof additional data to the actual votes (user’s profiles, user’s tags,user’s publications, etc.). The main problem is that not all RS dat-abases possess this information, or else it is not considered suffi-ciently reliable, complete or representative.
There are so far two research papers which deal with the cold-start problem through the users’ ratings information: Hyung [22]presents a heuristic similarity measure named PIP, that outper-forms the traditional statistical similarity measures (Pearson corre-lation, cosine, etc.); and Heung et al. [16] proposes a method thatfirst predicts actual ratings and subsequently identifies predictionerrors for each user; taking into account this error information,some specific ‘‘error-reflected’’ models are designed.
The strength of the approach presented in this paper (and in theHyung and Heung works) lies in its ability to mitigate the new usercold-start problem from the actual core of the CF stage, providing a

J. Bobadilla et al. / Knowledge-Based Systems 26 (2012) 225–238 227
similarity metric between users specially designed for this purposeand which can be applied to new users of any RS; i.e. it has a uni-versal scope as it does not require additional data to the actualvotes cast. The main problem of this approach is that with it, it ismore complex and risky to carry out an information retrieval fromthe votes than to directly take the additional information providedby the user’s profiles, user’s tags, etc., held by some RS.
2.2. Neural networks applied to recommender systems
Neural networks (NN) is a model inspired by biological neurons.This model, intended to simulate the way the brain processesinformation, enables the computer to ‘‘learn’’ to a certain degree.A neural network typically consists of a number of interconnectednodes. Each node handles a designated sphere of knowledge, andhas several inputs from the network. Based on the inputs it gets,a node can ‘‘learn’’ about the relationships between sets of data,pattern, and, based upon operational feedback, are molded intothe pattern required to generate the required results.
In this paper, we make novel use of NN, by using them to opti-mize the results provided by the similarity measure designed. Thisapproach enables NN techniques to be applied in the same kernelof the CF stage. The most relevant research available in which NNare used in some aspect of the operation of RS usually focuses onhybrid RS in which NN are used for learn users profiles; NN havealso been used in the clustering processes of some RS.
The hybrid approaches enable neural networks to act on theadditional information to the votes. In [44] a hybrid recommenderapproach is proposed using Widrow–Hoff [54] algorithm to learneach user’s profile from the contents of rated items, to improvethe granularity of the user profiling. In [11] a combination of con-tent-based and CF is used in order to construct a system providingmore precise recommendations concerning movies. In [29] first, allusers are segmented by demographic characteristics and users ineach segment are clustered according to the preference of itemsusing the Self-Organizing Map (SOM) NN. Kohonon’s SOMs are atype of unsupervised learning; their goal is to discover someunderlying structure of the data.
Two alternative NN uses are presented in [20,45]. In the firstcase the strategy is based on training a back-propagation NN withassociation rules that are mined from a transactional database; inthe second case they propose a model that combines a CF algo-rithm with two machine learning processes: SOM and Case BasedReasoning (CBR) by changing an unsupervised clustering probleminto a supervised user preference reasoning problem.
3. Hypothesis and motivation
The paper’s hypothesis deals with the possibility of establishinga similarity measure especially adapted to mitigate the new usercold-start problem which occurs in CF-based RS; furthermore, dur-ing the recommendation process, the similarity measure designedmust only use the local information available: the votes cast byeach pair of users to be compared.
The main idea of our paper considers that it is possible to obtainadditional information to that used by the traditional similaritymeasures of statistical origin (Pearson correlation, cosine, Spear-man rank correlation, etc.). Whilst the traditional similarity mea-sures only use the numerical information of the votes, we willmake use of both the numerical information of the votes and infor-mation based on the distribution and on the number of votes castby each pair of users to be compared.
As regards the number of votes of the users compared by thesimilarity measure that we want to design, the key aspect is thatit is more reasonable to assign greater similarity to users who have
voted for a similar number of items than users for whom the num-ber of items voted is very different. By way of example, it is moreconvincing to determine as similar users two people who have onlyvoted for between 8 and 14 movies, all of which are science fiction,than to determine as similar users a user who has only voted for 10movies, all of which are science fiction, and another who has votedfor 2400 movies of all genres. Whilst in the first case, the recom-mendations will tend to be restricted to the movies of commongenre, in the second, the new cold-start user will be able to receivethousands of recommendations of all types of movies of genres inwhich they are not interested and which are very unsuitable forrecommending based only on a maximum of 10 recommendationsin common.
In the previous example, and under the restriction of recom-mendations made to new cold-start users, we can see the positiveaspect of being recommended by a person who has cast a similarnumber of votes to yours: it is quite probable that the items thatthey have voted for and that you have not, will be related to thoseyou have rated, and, therefore, it is very possible that you areinterested in them. We can also see the negative aspect: the capac-ity for recommendation (coverage) of the other user will not be ashigh.
As regards the distribution (or structure) of the votes of theusers compared with the similarity measure we wish to design,there are two significant aspects for determining their similarity:
� It is positive a large number of common items that they haveboth voted for.� It is negative a large number of uncommon items that they have
both voted for.
If a user u1 has voted for 10 movies, a user u2 has voted for 14and a user u3 has voted for 70, it will be more convincing to classifyu1 and u2 as similar if they have 6 movies in common than if theyhave only one. It will also be more convincing to classify u1 and u2as similar with 6 movies in common than u1 and u3 with 7 moviesin common. In this case, we must also be cautious with the cover-age reached by the similarity measure designed.
The assumptions on which the paper’s motivation is based willbe confirmed or refuted to a great extent depending on whetherthe non-numerical information of the votes used (proportions inthe number of votes and their structure) is a suitable indicator ofsimilarity between each pair of users compared. In order to clarifythis situation we have applied basic statistical functions to all votesthat are usually cast by the users.
Fig. 1 displays the arithmetic average and standard deviationdistributions of the votes cast by users of Movielens 1 M and Netf-lix [5]. As we can see, most of the users’ votes are between 3 and 4stars (arithmetic average), with a variation of approximately 1 star(standard deviation).
By analyzing Fig. 1, we can assume that the 3–4 star intervalmarks the division between the votes that positively rate the itemsfrom those that rate them in a non-positive way. In general, a po-sitive vote will be placed at value 4 and in exceptional cases at 5,whilst a non-positive vote will be placed at value 3 and in excep-tional cases at 2 or 1.
Taking into account the very low number of especially negativevotes (2 and 1 stars) shown in Graphs 1a and 1b, we can assumethat the users have a tendency to not rate items they consider ina non-positive way, whilst to a lesser extent the opposite alsooccurs: when they cast a vote there is a great probability that itimplies a positive rating (above 3.5 stars in Graphs 1a and 1b).
Therefore, it seems that the users tend to simplify their ratingsinto positive/non-positive and then transfer their psychologicalchoice to the numerical plane. In order to check this hypothesisthe following experiment has been carried out [5] on the

Fig. 1. Arithmetic average and standard deviation on the MovieLens 1 M and NetFlix ratings of the items. (A) Movielens arithmetic average, (B) Netflix arithmetic average, (C)Movielens standard deviation, (D) Netflix standard deviation [5].
Fig. 2. Precision/Recall obtained by transforming all 4 and 5 votes into P votes(Positive) and all 1, 2 and 3 votes into N votes (Non-positive), compared to theresults obtained using the numerical values. 20% of test users, 20% of test items,K = 150, Pearson correlation, relevant threshold = 4. MovieLens 1 M (Bobadilla et al.,2010).
Table 1Parameters.
Name Parameters descriptions
L # UsersM # Itemsmin # Min rating valuemax # Max rating valuek # NeighborhoodsN # Recommendationsh Recommendation threshold
228 J. Bobadilla et al. / Knowledge-Based Systems 26 (2012) 225–238
Movielens 1 M database: we transformed all 4 and 5 votes into Pvotes (Positive) and all of 1, 2 and 3 votes into N votes (Non-posi-tive), in such a way that we aim to measure the impact made onthe recommendations by doing without the detailed informationprovided by the numerical values of the votes.
In the experiment we compare the precision/recall obtained in aregular way (using the numerical values of the votes) with that ob-tained using only the discretized values P and N. Fig. 2 displays theresults, which show how the ‘‘positive/non-positive’’ discretizationnot only does not worsen the precision/recall measurements, butrather it improves them both, particularly the precision when thenumber of recommendations (N) is high.
The reasoning shown and the experimental results obtainedencourage the use of the non-numerical information of the users’votes as a means of attempting to obtain a cold-start similaritymeasure which, by making use of this additional information, pro-vides better results than the traditional metrics.
4. Design of the proposed user cold-start similarity measure
The cold-start similarity measure proposed is formed by carry-ing out a linear combination of a group of simple similarity mea-sures. The scalar values with which each individual similaritymeasure is weighted are obtained in a process of optimizationbased on neural learning; this way, after a stage to determine theweights of the linear combination, the cold-start similarity mea-sure can be used to obtain the k-neighbors of each cold-start userwho request recommendations.
One of the simple similarity measures is Jaccard, which pro-cesses the non-numerical information of the votes; the rest basetheir operation on the simplest information with which two votescan be compared: their difference.
4.1. Formalization
Given an RS with a database of L users and M items rated in therange [min..max], where the absence of ratings will be representedby the symbol �.
U ¼ u 2 NaturalNumberju 2 f1::Lgf g; set of users ð1ÞI ¼ i 2 NaturalNumberji 2 f1::Mgf g; set of items ð2ÞV ¼ v 2 NaturalNumberjmin 6 v 6maxf g [ f�g; set of possible votes ð3ÞRu ¼ ði; vÞji 2 I; v 2 Vf g; ratings of user u ð4ÞWe define vote v of user u on item i as ru;i ¼ v ð5ÞWe define the average of the valid votes of user u as �ru ð6Þ

J. Bobadilla et al. / Knowledge-Based Systems 26 (2012) 225–238 229
We define the cardinality of a set C as its number of validelements
#C ¼ #fx 2 Cjx – �g ð7Þ
In this way:
#Ru ¼ #fi 2 Ijru;i – �g ð8Þ
Below we present the tables of parameters (Table 1), measures(Table 2) and sets (Table 3) used in the formalizations made in thepaper.
Table 2Measures.
Name Measures descriptions
v0x;y # Items with the same value in user x and user y (normalized)
v1x;y # Items with a difference of 1 stars in user x and user y
(normalized)v3
x;y # Items with a difference of 3 stars in user x and user y(normalized)
v4x;y # Items with a difference of 4 stars in user x and user y
(normalized)lx,y Mean squared differences (user x, user y)rx,y Standard deviationJaccardx,y Jaccard similarity measure{w1, . . . ,w6} Similarity measure weightspu,i Prediction to the user on the itemmu,i Prediction error on user u, item imu User u mean absolute errorm RS mean absolute errorcu,i User u, item i, coveragecu User u coveragec RS coveragequ,i Is i recommended to the user u?tu,i Is i recommended relevant to the user u?tu Precision of the user ut Precision of the RSnu,i Is i not recommended relevant to the user u?xu Recall of the user ux Recall of the RS
Table 3Sets.
Name Sets descriptions Parameters
U Users LI Items MV Rating values min, maxRu User ratings user
Vdx;y
Items rated with a difference of d stars user x, usery, d
Gx,y Items rated simultaneously by users x and y user x, user yR�u Items voted by user u userKu Neighborhoods of the user user, kPu Predictions to the user user, kHu,i User’s neighborhoods which have rated the item user, i, kXu Top recommended items to the user user, k, hZu Top N recommended items to the user user, k, N, hUt Training usersUv Validation usersIt Training itemsIv Validation itemsMu Items rated by user u where a prediction can be
determineduser
O Validation users with assigned MAECu Items not rated by user u where a prediction can be
determineduser
O⁄ Validation users with assigned coverage valueS Validation users with assigned precision valueYu Set of recommended relevant items (true-positives) userNu set of not recommended relevant items userS⁄ Validation users with assigned recall value
4.2. Set of basic similarity measures
In order to find the similitude between two users x and y, wefirst take all of the information regarding the value of the vote(or lack of vote) from these users in each of the items of the RS.We will assess the following basic similarity measures betweentwo users x and y:
� Measures based on the numerical values of the votes1. v0, v1, v2, v3, v4 (Eqs. (9)–(11)).2. Mean squared differences (l), (Eqs. (12) and (13)).3. Standard deviation of the squared differences (r), (Eqs. (12)
and (14)).� Measure based on the arrangement of the votes
4. Jaccard, (Eqs. (15) and (16)).
v0 represents the number of cases in which the two users havevoted with exactly the same score, indicating a high degree of sim-ilarity between them; it contributes to increasing the number ofcases of particularly accurate predictions.
v4 represents the opposite case: the number of times that theyhave voted in a completely opposite way; the aim is to minimizethe importance given to the fact that they have voted for the sameitem, as they have done so by indicating very different preferences.It also contributes to reducing the number of cases of particularlyincorrect predictions.
v1, v2 and v3 represents the intermediate cases (v1 the numberof cases in which users have voted with a difference of one score,v2 with a difference of two scores, . . . ).
l provides the simplest and most intuitive measure of simili-tude between users, but it could be a good idea to complement itwith the importance held by the extreme cases in this measure,using r.
The Jaccard measure rewards situations in which the two usershave voted for similar sets of items, taking into account the propor-tion regarding the total number of voted items by both.
Let Vdx;y ¼ i 2 Ijrx;i – � ^ry;i – � ^jrx;i � ry;ij ¼ d where
�d 2 f0; . . . ;max�mingg ð9Þ
We define8d 2 f0; . . . ;max�ming; bdx;y ¼ #Vd
x;y ð10Þ
finally, we perform the normalization:
vdx;y ¼
bdx;yPmax�min
d¼0bd
x;y
; vdx;y 2 ½0;1� ð11Þ
Let Gx;y ¼ i 2 Ijrx;i – � ^ry;i – �� �
; the set of items voted simultaneously by both usersð12Þ
lx;y ¼ 1� 1#Gx;y
Xi2Gx;y
rx;i � ry;i
max�min
� �2() Gx;y – ;; lx;y 2 ½0;1� ð13Þ
rx;y ¼
ffiffiffiffiffiffiffiffiffiffiffiffiffiffiffiffiffiffiffiffiffiffiffiffiffiffiffiffiffiffiffiffiffiffiffiffiffiffiffiffiffiffiffiffiffiffiffiffiffiffiffiffiffiffiffiffiffiffiffiffiffiffiffiffiffiffiffiffiffiffiffiffiffiffiffiffiffiffiffiffiffiffiffiffiffiffiffiffiffi1
#Gx;y
Xi2Gx;y
rx;i � ry;i
max�min
� �2� ð1� lx;yÞ
� �2vuut () Gx;y – ;; rx;y 2 ½0;1� ð14Þ
Lets R�u ¼ i 2 Ijru;i – �� �
; the set of items voted by user u ð15Þ
Jaccardx;y ¼#ðR�x \ R�yÞ#ðR�x [ R�yÞ
; Jaccardx;y 2 ½0;1� ð16Þ
4.3. Similarity measures selected
The total set of basic similarity measures to be applied to theproposed metric is as follows:
fv0; v1;v2; v3;v4;r;l; Jaccardg ð17Þ
With the aim of reducing the number of basic similarity mea-sures, using Netflix and Movielens we have calculated variousquality results (MAE, coverage, precision and recall) using the full

230 J. Bobadilla et al. / Knowledge-Based Systems 26 (2012) 225–238
set of basic similarity measures; subsequently, we repeated theprocess eight times, eliminating one of the eight basic similaritymeasures in each repetition (and conserving the other seven). Afterconcluding these experiments, we have rejected the similaritymeasures which on elimination caused a very slight worsening inthe quality results.
Finally, we have seen that the quality results offered by all ofthe similarity measures selected are only slightly worse than theoriginal ones, and therefore, the significant information is pro-vided by the set of similarity measures which have not beenrejected. The empirical results have led us to select the followingsubset of (17):
fv0;v1;v3;v4;l; Jaccardg ð18Þ
4.4. Formulating the metric
The MJD proposed metric (Mean-Jaccard-Differences) is basedon the hypothesis that by combining the six individual similaritymeasures presented in (18), we will be able to obtain a global sim-ilarity measure between pairs of users. As each individual similar-ity measure presents its relative degrees of importance, it isnecessary to assign a weighting (wi) to each of them. This way,the proposed metric is formulated as:
MJDx;y ¼16
w1v0x;y þw2v1
x;y þw3v3x;y þw4v4
x;y þw5lx;y þw6Jaccardx;y
� �ð19Þ
At this point, it is necessary to determine the weights wi
which enable us to obtain a metric that improves the results ofthose commonly used; for this purpose we look for a potentialsolution to an optimization problem based on neural learning.
As an illustration, using Netflix database, the final weights afterthe adjustment are those shown in Table 4. The values obtainedindicate the importance of each individual measure metric in thefinal result of the NN measure metric. Note how w4v4 (number ofcases in which the votes of the two users are totally different)has a very negative impact on the similarity result between theusers considered.
By analyzing the weights (wi) obtained in the neural learningprocess, we can determine that the proposed similarity measuremainly uses the votes’ numerical information, and that this infor-mation is complemented and modulated by the arrangement ofthe votes provided by Jaccard. The numerical information is basedon the measure of l; furthermore, the similarity between users isreinforced with the results of v0 and v1 and is reduced with the re-sults of v3 and v4.
4.5. Neural network learning
Eq. (19) has a very similar form to the input (NET) of an arti-ficial neural network, and more specifically to an ADALINEnetwork. As it is a problem of adjustment, and not of classifica-tion, we can use a continuous activation function, e.g. linear acti-vation, instead of the sigmoid function used in the traditionalperceptron. A system of this sort would technically be a percep-tron with linear activation function. This parallelism between ourmetric and the propagation of the signal in a perceptron enablesthe Widrow–Hoff method [54] to be used, adapted to our
Table 4Weights obtained using the gradient descent method (Netflix RS).
w1 w2 w3 w4 w5 w6
0.66 0.35 �0.21 �0.43 1.07 0.31
problem, to make the adjustment of the weights using the gradi-ent descent method:
wiðt þ 1Þ ¼ wiðtÞ þ a � xiðMAEðtÞMJDðtÞ �MAEJMSDÞ i 2 f1; . . . ;6gwhere x1 ¼ v0
u1;u2; x2 ¼ v1u1;u2; x3 ¼ v3
u1;u2; x4 ¼ v4u1;u2;
x5 ¼ lu1;u2; x6 ¼ Jaccardu1;u2
ð20Þ
The learning of the neuronal network is carried out using a setof pairs of users (u1,u2) where u1 represents a cold-start user (whohas rated between 2 and 20 items) and u2 represents any user inthe database. This pair of users are taken into account for updatingthe weights wi.
MAE(t)MJD(t) stands for the MAE of the recommender system,which is calculated using the proposed metric MJD based on theset of weights wi(t). This measure considers that only the cold-startusers are test users, and measures the accuracy of the recom-mender system based on the MJD in the instant t.
MAEJMSD stands for the MAE of the recommender systemcalculated taking into account all test users (not only cold-startusers) and the similarity measure JMSD. This measure representsthe accuracy of the recommender system which we try toreach.
The measure MAEJMSD is an upper bound of the accuracy ob-tained in each instant t (MAE(t)MJD(t)) since we can reach betteraccuracy using all users as test users than using only cold-startusers. The metric JMSD has been selected as a reference since itprovides good results [5].
For the adjustment of the weights it is necessary to develop atraining set in which the following are specified:
� The input data to the system for every pair of users, in our casethe values presented in (18).� The desired output for each pair of users of the system. To
implement the error measure, we use the system MAEJMSD,making use of a very small set of test users with the aim ofachieving reasonable execution times. These calculations areobtained using parallel processing through a cluster ofcomputers.
Fig. 3 shows the main modules involved in the whole neurallearning process, where the time t + 1 weights are adjusted inaccordance with the MAE(t)MJD(t) obtained.
5. Collaborative filtering specifications
In this section we specify the CF methods proposed to make rec-ommendations. We also formalize the CF methodology used in theexperiments; through this methodology, we calculate the qualityresults of the predictions and recommendations for the similaritymeasures studied.
Due to the scarce number of items voted for by the cold-startusers (which we have determined in the interval {2, . . . ,20}), wehave decided to use leave-one-out cross validation to ensure thegreatest possible number of training items in each validation pro-cess. The proposed methodology includes the formalization of theprocesses to obtain the MAE, coverage, precision and recall usingleave-one-out cross validation.
5.1. Obtaining prediction and recommendations
5.1.1. Users’s k-neighborsWe define Ku as the set of k neighbors of the user u and we use
the desired user similarity measure: simx,y, where x and y are users.The following must hold:

Fig. 3. Neural learning process.
Table 5RS running example (users, items and ratings).
ru,i i1 i2 i3 i4 i5 i6 i7 i8 i9 i10 i11 i12
u1 � 2 � � 3 5 � � 3 � � �u2 1 � � 2 5 � � � 4 � 5 �u3 � � 3 � � 4 � 5 1 � 2 5u4 2 3 � � 4 � 5 4 � 2 3 1u5 � 3 4 3 � 5 4 � 2 2 3 4u6 5 4 2 3 � 3 2 3 5 3 � 3
Table 6Similarity measures between users using MJD.
MJD u2 u3 u4 u5 u6
u1 1.166 1.155 1.415 1.572 0.887
J. Bobadilla et al. / Knowledge-Based Systems 26 (2012) 225–238 231
Ku � U ^ #Ku ¼ k ^ u R Ku ð21Þ8x 2 Ku;8y 2 ðU � KuÞ; simu;x P simu;y ð22Þ
Table 7Predictions that u1 can receive using MJD, k = 2 and arithmetic average as aggregationapproach.
Pu1,i i1 i3 i4 i7 i8 i10 i11 i12
u1 2 4 3 4,5 4 2 3 2,5
5.1.2. Prediction of the value of an itemBased on the information provided by the k-neighbors of a user
u, the CF process enables the value of an item to be predicted asfollows:
Let Pu ¼ ði;pÞji 2 I; p 2 RealNumberf g;set of prediction to the user u ð23Þ
We will assign the value of the prediction pmade to user u on item i as pu;i ¼ p ð24Þ
Once the set of k users (neighbors) similar to active u has beencalculated (Ku), in order to obtain the prediction of item i on user u(24), we use the aggregation approach deviation-from-mean (Eqs.(25)–(27)).
Lets Hu;i ¼ fn 2 Kujrn;i – �g ð25Þ
pu;i ¼ �ru þ1P
n2Hu;isimu;n
Xn2Hu;i
simu;nðrn;i � �rnÞ () Hu;i – ; ð26Þ
pu;i ¼ � () Hu;i ¼ ; ð27Þ
5.1.3. Top N recommendationsWe define Xu as the set of predictions to user u, and Zu as the set
of N recommendations to user u.The following must hold:
Xu � I 8i 2 Xu; ru;i ¼ �; pu;i – �; ð28ÞZu # Xu;#Zu ¼ N; 8x 2 Zu; 8y 2 Xu pu;x P pu;y ð29Þ
If we want to impose a minimum recommendation value: h 2 Real-Number, we add pu,i P h
5.1.4. Running exampleWe define a micro RS example with 6 users, 12 items and a
range of votes from 1 to 5:
U ¼ fu1;u2;u3;u4;u5;u6g;I ¼ fi1; i2; i3; i4; i5; i6; i7; i8; i9; i10; i11; i12g; V ¼ f1;2;3;4;5; �g
Table 5 shows the votes (ru,i) cast by each user.In order to make recommendations for user 1 (by way of exam-
ple), using MJD and the weights of Table 4, we calculate their sim-ilarity with the rest of the users (Table 6).
Taking k = 2 neighbors, we obtain the set of neighbors ofu1 : Ku1 ¼ fu5;u4g.
To calculate the possible predictions that can be made to u1, weuse the arithmetic average as an aggregation approach instead ofthe equation proposed in (27). The predictions obtained are sum-marized in Table 7.
If we want to make N = 3 recommendations: Zu = {i7, i3, i8}.
5.2. Obtaining the collaborative filtering quality measures
In this section we specify the way in which we will obtain the re-sults of the quality offered by the proposed similarity measure. Weprovide equations which formalize the process of obtaining theselected prediction quality measures: MAE and coverage, and theselected recommendation quality measures: precision and recall.
We have determined that a user will be considered as a cold-start user when they have between 2 and 20 items voted. This verylimited number of items involves that the use of the most commoncross validation (random sub-sampling and k-fold cross validation)is not appropriated either in the prediction quality measures or inthe recommendation quality measures; there are not enough itemsto feed suitably the training and validation stages.
The cross validation method chosen to carry out the experi-ments is leave-one-out cross validation; this method involvesusing a single observation from the original sample as the valida-tion data, and the remaining observations as the training data. Eachobservation in the sample is used once as the validation data. Thismethod is computationally expensive, but it allows us to use largersets of training data.
Starting from the sets of users and items defined in RS (Eqs. (1)and (2)), we establish the sets of training and validation users andtraining and validation items which will be used in each individualvalidation process of an item using leave-one-out cross validation.
Ut � U; set of training users ð30ÞUv � U; set of validation users ð31ÞIt � I; set of training items ð32ÞIv � I; set containing the validation item ð33Þ
Using leave-one-out cross validation, the following holds:
Uv [ Ut ¼ U; Uv \ Ut ¼ ;; #Iv ¼ 1; Iv [ It ¼ I; Iv \ It ¼ ;ð34Þ
In the process to obtain the RS quality measures we use valida-tion items, reserving the training items to determine the k-neigh-bors. Therefore, the similarity measures make their calculations

232 J. Bobadilla et al. / Knowledge-Based Systems 26 (2012) 225–238
using training items; Eq. (35) replaces Eq. (12). In the same way,Eq. (22) must reflect that the predictions are made on the valida-tion items (Eq. (36)).
Gx;y ¼ i 2 Itjrx;i – � ^ry;i – �� �
ð35ÞPu ¼ ði;pÞji 2 Iv ; p 2 RealNumber
� �u 2 Uv ð36Þ
We modify the equations to obtain k-neighborhoods (21) and(22), obtaining Eqs. (37) and (38).
u 2 Uv Ku � Ut #Ku ¼ k u R Ku ð37Þ8x 2 Ku; 8y 2 ðUt � KuÞ; simu;x P simu;y ð38Þ
5.2.1. Quality of the prediction: mean absolute error/accuracyIn order to measure the accuracy of the results of a RS, it is usual
to use the calculation of some of the most common error metrics,amongst which the mean absolute error (MAE) and its related met-rics: mean squared error, root mean squared error, and normalizedmean absolute error stand out. The MAE indicates the average er-ror made in the predictions; therefore, the lower this value, thebetter the accuracy of the system.
Using leave-one-out cross validation, we carry out a validationprocess for each item of each validation user:
Let u 2 Uv ^ i 2 Ij#Ru 2 f2; . . . ;20g ^ ru;i – � ð39ÞIv ¼ fig; It ¼ fj 2 Ijru;i – � ^j – ig ð40Þ
Through It we can calculate the k-neighbors (Ku). Through Ku and Iv,the prediction pu,i can be calculated.
We define the absolute error of a user u on an item i(mu,i) as:
mu;i ¼ jpu;i � ru;ij () u 2 Uv ; i 2 Iv ; pu;i – � ^ru;i – �;mu;i 2 ½0;max�min� ð41Þ
mu;i ¼ � () u 2 Uv ; i 2 Iv ; pu;i ¼ � _ ru;i ¼ � ð42Þ
The MAE of the user u(mu) is obtained as the average of its mu,i:
Let Mu ¼ i 2 Ijmu;i – �� �
; u 2 Uv ð43Þ
mu ¼1
#Mu
Xi2Mu
mu;i; mu 2 ½0;max�min� ð44Þ
The MAE of the RS: (m) is obtained as the average of the user’s MAE:
Let O ¼ fu 2 Uv jmu – �g ð45Þ
We define the system’s MAE as:
m ¼ 1#O
Xu2O
mu () O – ;; m 2 ½0;max�min� ð46Þ
m ¼ � () O ¼ ; ð47Þ
The accuracy is defined as:
accuracy ¼ 1� mmax�min
; accuracy 2 ½0;1� ð48Þ
5.2.2. Quality of the prediction: coverageThe coverage could be defined as the capacity of predicting from
a metric applied to a specific RS. In short, it calculates the percent-age of situations in which at least one k-neighbors of each activeuser can rate an item that has not been rated by that active user.Once again, using leave-one-out cross validation we carry out avalidation process for each item of each validation user:
Lets u 2 Uv ^ i 2 Ij#Ru 2 {2, . . . ,20} ^ ru,i – �
Iv ¼ fig; It ¼ fj 2 Ijru;i – � ^j – ig ð49Þ
With It we obtain k-neighbors (Ku) and with Ku and Iv we makethe prediction pu,i.
We define the coverage of a user u on an item i as cu,i; this valueindicates that we can make a prediction of item i to user u.
cu;i – � () u 2 Uv ; i 2 Iv ; pu;i – � ^ru;i ¼ �cu;i ¼ � () u 2 Uv ; i 2 Iv ; pu;i ¼ � _ ru;i – �
)ð50Þ
Let Cu be the set of items on which a prediction can be made touser u:
Cu ¼ fi 2 Ijcu;i – � where u 2 Uvg ð51Þ
The coverage of the user u (cu) is obtained as the proportion be-tween the number of items not voted for by the user which can bepredicted and the total items not voted for by the user.
cu ¼ 100� #Cu
#I �#Ru() Ru – I; cu 2 ½0;100� ð52Þ
cu ¼ � () Ru ¼ I ð53Þ
The coverage of the RS: (c) is obtained as the average of theuser’s coverage:
Lets O� ¼ fu 2 Uv jcu – �g ð54Þ
We define the system’s coverage as:
c ¼ 1#O�
Xu2O�
cu () O� – ;; c 2 ½0;100� ð55Þ
c ¼ � () O� ¼ ; ð56Þ
5.2.3. Quality of the recommendation: precisionThe precision refers to the capacity to obtain relevant recom-
mendations regarding the total number of recommendationsmade. We define h as the minimum value of a vote to be consideredrelevant.
Let u 2 Uv ^ i 2 Ij#Ru 2 {2, . . . ,20} ^ ru,i – �
Iv ¼ fig; It ¼ fj 2 Ijru;i – � ^j – ig ð57Þ
Through It we obtain k-neighbors (Ku), and through Ku and Iv wemake the prediction pu,i.
Each qu,i term indicates whether item i has been recommendedto user u.
qu;i – � () u 2 Uv ; i 2 Iv ðpu;i – � ^pu;i P hÞ ^ ru;i – �; recommended itemqu;i ¼ � () u 2 Uv ; i 2 Iv ðpu;i ¼ � _ pu;i < hÞ ^ ru;i – �; not recommended item
)
ð58Þ
Each tu,i term indicates whether item i recommended to user u hasbeen relevant.
tu;i – � () u 2 Uv ; i 2 Iv qu;i – � ^ru;i P h; recommended and relevanttu;i ¼ � () u 2 Uv ; i 2 Iv qu;i – � ^ru;i < h; recommended and not relevant
)
ð59Þ
The precision of the user u(tu) is obtained as the proportion be-tween the number of recommended relevant items to the user andthe total items recommended to the user.
tu ¼#fi 2 Ijtu;i – �g#fi 2 Ijqu;i – �g () fi 2 Ijqu;i – �g– ;; tu 2 ½0;1� ð60Þ
tu ¼ � () fi 2 Ijqu;i – �g ¼ ; ð61Þ
The precision of the RS: (t) is obtained as the average of theuser’s precision:
Let S ¼ fu 2 Uv jtu – �g ð62Þ
J. Bobadilla et al. / Knowledge-Based Systems 26 (2012) 225–238 233
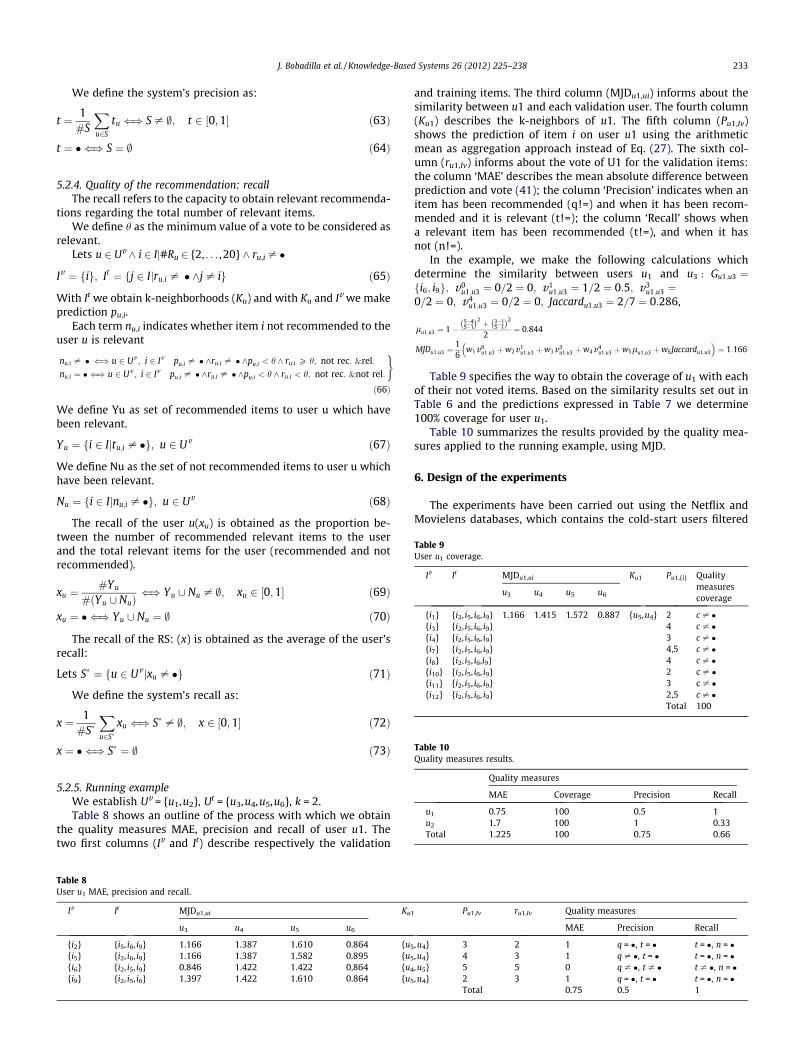
We define the system’s precision as:
t ¼ 1#S
Xu2S
tu () S – ;; t 2 ½0;1� ð63Þ
t ¼ � () S ¼ ; ð64Þ
Table 9User u1 coverage.
Iv It MJDu1,ui Ku1 Pu1,{i} Qualitymeasurescoverage
u3 u4 u5 u6
{i1} {i2, i5, i6, i9} 1.166 1.415 1.572 0.887 {u5,u4} 2 c – �{i3} {i2, i5, i6, i9} 4 c – �{i4} {i2, i5, i6, i9} 3 c – �{i7} {i2, i5, i6, i9} 4,5 c – �{i8} {i2, i5, i6,i9} 4 c – �{i10} {i2, i5, i6, i9} 2 c – �{i11} {i2, i5, i6, i9} 3 c – �{i12} {i2, i5, i6, i9} 2,5 c – �
Total 100
Table 10Quality measures results.
5.2.4. Quality of the recommendation: recallThe recall refers to the capacity to obtain relevant recommenda-
tions regarding the total number of relevant items.We define h as the minimum value of a vote to be considered as
relevant.Lets u 2 Uv ^ i 2 Ij#Ru 2 {2, . . . ,20} ^ ru,i – �
Iv ¼ fig; It ¼ fj 2 Ijru;i – � ^j – ig ð65Þ
With It we obtain k-neighborhoods (Ku) and with Ku and Iv we makeprediction pu,i.
Each term nu,i indicates whether item i not recommended to theuser u is relevant
nu;i – � () u 2 Uv ; i 2 Iv pu;i – � ^ru;i – � ^pu;i < h ^ ru;i P h; not rec: &rel:nu;i ¼ � () u 2 Uv ; i 2 Iv pu;i – � ^ru;i – � ^pu;i < h ^ ru;i < h; not rec: ¬ rel:
)
ð66Þ
We define Yu as set of recommended items to user u which havebeen relevant.
Yu ¼ fi 2 Ijtu;i – �g; u 2 Uv ð67Þ
We define Nu as the set of not recommended items to user u whichhave been relevant.
Nu ¼ fi 2 Ijnu;i – �g; u 2 Uv ð68Þ
The recall of the user u(xu) is obtained as the proportion be-tween the number of recommended relevant items to the userand the total relevant items for the user (recommended and notrecommended).
xu ¼#Yu
#ðYu [ NuÞ() Yu [ Nu – ;; xu 2 ½0;1� ð69Þ
xu ¼ � () Yu [ Nu ¼ ; ð70Þ
The recall of the RS: (x) is obtained as the average of the user’srecall:
Lets S� ¼ fu 2 Uv jxu – �g ð71Þ
We define the system’s recall as:
x ¼ 1#S�
Xu2S�
xu () S� – ;; x 2 ½0;1� ð72Þ
x ¼ � () S� ¼ ; ð73Þ
Quality measures
MAE Coverage Precision Recall
u1 0.75 100 0.5 1u2 1.7 100 1 0.33Total 1.225 100 0.75 0.66
5.2.5. Running exampleWe establish Uv = {u1,u2}, Ut = {u3,u4,u5,u6}, k = 2.Table 8 shows an outline of the process with which we obtain
the quality measures MAE, precision and recall of user u1. Thetwo first columns (Iv and It) describe respectively the validation
Table 8User u1 MAE, precision and recall.
Iv It MJDu1,ui Ku1
u3 u4 u5 u6
{i2} {i5, i6, i9} 1.166 1.387 1.610 0.864 {u5
{i5} {i2, i6, i9} 1.166 1.387 1.582 0.895 {u5
{i6} {i2, i5, i9} 0.846 1.422 1.422 0,864 {u4
{i9} {i2, i5, i6} 1.397 1.422 1.610 0.864 {u5
and training items. The third column (MJDu1,ui) informs about thesimilarity between u1 and each validation user. The fourth column(Ku1) describes the k-neighbors of u1. The fifth column (Pu1,Iv)shows the prediction of item i on user u1 using the arithmeticmean as aggregation approach instead of Eq. (27). The sixth col-umn (ru1,Iv) informs about the vote of U1 for the validation items:the column ‘MAE’ describes the mean absolute difference betweenprediction and vote (41); the column ‘Precision’ indicates when anitem has been recommended (q!=) and when it has been recom-mended and it is relevant (t!=); the column ‘Recall’ shows whena relevant item has been recommended (t!=), and when it hasnot (n!=).
In the example, we make the following calculations whichdetermine the similarity between users u1 and u3 : Gu1;u3 ¼fi6; i9g; v0
u1;u3 ¼ 0=2 ¼ 0; v1u1;u3 ¼ 1=2 ¼ 0:5; v3
u1;u3 ¼0=2 ¼ 0; v4
u1;u3 ¼ 0=2 ¼ 0; Jaccardu1;u3 ¼ 2=7 ¼ 0:286,
lu1;u3 ¼ 1�5�45�1
�2 þ 3�15�1
�2
2¼ 0:844
MJDu1;u3 ¼16
w1v0u1;u3 þw2v1
u1;u3 þw3v3u1;u3 þw4v4
u1;u3 þw5lu1;u3 þw6Jaccardu1;u3
� �¼ 1:166
Table 9 specifies the way to obtain the coverage of u1 with eachof their not voted items. Based on the similarity results set out inTable 6 and the predictions expressed in Table 7 we determine100% coverage for user u1.
Table 10 summarizes the results provided by the quality mea-sures applied to the running example, using MJD.
6. Design of the experiments
The experiments have been carried out using the Netflix andMovielens databases, which contains the cold-start users filtered
Pu1,Iv ru1,Iv Quality measures
MAE Precision Recall
,u4} 3 2 1 q = �, t = � t = �, n = �,u4} 4 3 1 q – �, t = � t = �, n = �,u5} 5 5 0 q – �, t – � t – �, n = �,u4} 2 3 1 q = �, t = � t = �, n = �
Total 0.75 0.5 1

Table 11Experiments performed.
Databases # Neighbors on x axis
Test users K (MAE, coverage) Precision, recall
Range step K N h Figures
Movielens 1 M 20% {100, . . . ,2000} 100 700 {2, . . . ,20} 5 Fig. 4Netflix 20% {100, . . . ,2000} 100 700 {2, . . . ,20} 5 Fig. 6
Databases # Ratings on x axis
Test users (MAE, coverage, precision, recall)#Ratings K N h Figures
Movielens 1 M 20% {2, . . . ,20} step 1 700 10 5 Fig. 5Netflix 20% {2, . . . ,20} step 1 700 10 5 Fig. 7
234 J. Bobadilla et al. / Knowledge-Based Systems 26 (2012) 225–238
in other databases (users with less than 20 votes). Movielens is theRS research database reference and Netflix offers us a large data-base on which metrics, algorithms, programming and systemsare put to the test. The main parameters of Netflix are: 480189users, 17770 items, 100,480,507 ratings, 1–5 stars; the mainparameters of Movielens are: 6040 users, 3706 items, 1,480,507ratings, 1 to 5 stars.
Since the database Movielens does not take into account cold-start users (users with less than 20 votes), we have removed votesof this database in order to achieve cold-start users. Indeed, wehave removed randomly between 5 and 20 votes of those userswho have rated between 20 and 30 items. In this way, those userswho now result to rate between 2 and 20 items are regarded ascold-start users. We recover the removing votes of those users withgreater than 20 votes despite of removing some their votes (in thisway, these users keep immutable in the database).
With the aim of checking the correct operation of the cold-start similarity measure proposed in the paper, it is comparedwith part of the traditional similarity measures most commonlyused in the field of CF: Pearson correlation, cosine and con-strained Pearson correlation; with the new metric JMSD [5] andwith current user cold-start metrics working just on the users’ratings matrix: PIP [22] and UError [16]. The quality measuresto which all of the metrics will be subjected are MAE, coverage,
Fig. 4. (a) MAE, (b) coverage, (c) precision and (d) recall obtained using: Movielens databusers, leave-one-out cross validation applied to the items, precision and recall threshold
precision and recall, using leave-one-out cross validation for theitems, 20% of validation users, 80% of training users (only thosewho have voted for a maximum of 20 items are processed intothe validation users set). Section 5.2 sets out the formalizationwhich gives a detailed description of how to obtain each qualitymeasure result.
Each quality measure (MAE, coverage, precision and recall) willbe calculated, using Movielens and Netflix, in two experiments:
Experiment 1. Evolution of the results of MJD, PIP, UError,correlation, constrained correlation, cosine and JMSD. Experiment1.1: MAE and coverage throughout the range of neighborhoodsk 2 {100, . . . ,2000}, step 100. Experiment 1.2: precision and recallthroughout the range of number of recommendationsN 2 {2, . . . ,20}. In this experiment we make use of all the cold-start users (no more than 20 votes) belonging to the usersvalidation set (Uv).
Experiment 2. Evolution of the results of MJD, PIP, UError, corre-lation, constrained correlation, cosine and JMSD throughout therange of votes cast by the cold-start users #Ru 2 {2, . . . ,20}. Weuse the fixed value of k-neighbors k = 700 and number of recom-mendations N = 10.
ase. Individual experiments (x-axis): k 2 {100, . . . ,2000}, step 100, 20% of validationh = 5, all the validation cold-start users: #Ru 2 {2, . . . ,20}.

Fig. 5. (a) MAE, (b) coverage, (c) precision and (d) recall obtained using: Movielens database. Individual experiments (x-axis): #Ru 2 {2, . . . ,20}, 20% of validation users, leave-one-out cross validation applied to the items, precision and recall threshold h = 5, k = 700, N = 10.
Fig. 6. (a) MAE, (b) coverage, (c) precision and (d) recall obtained using: Netflix database. Individual experiments (x-axis): k 2 {100, . . . ,2000}, step 100, 20% of validationusers, leave-one-out cross validation applied to the items, precision and recall threshold h = 5, all the validation cold-start users: #Ru 2 {2, . . . ,20}.
J. Bobadilla et al. / Knowledge-Based Systems 26 (2012) 225–238 235
Table 11 summarizes the experiments performed (used dat-abases, selected parameters values and figures where the resultsare shown).
7. Results
Fig. 4 shows the results corresponding to Experiment 1 usingMovielens. Graph 1a confirms the paper’s hypothesis in the sense
that the similarity measure designed (MJD) improves the predic-tion quality of the traditional similarity measures when they areapplied to cold-start users as well as it improves the new usercold-start error-reflected (UError) metric. The PIP metric worksbetter only for a number of neighbors fewer than 500.
Fig. 4(b) displays the negative aspect of the similarity measureproposed which had been highlighted in section 2 (motivation): byselecting neighbors who have a similar number of votes to the ac-tive user (using Jaccard), the coverage is weakened. As we can see

Fig. 7. (a) MAE, (b) coverage, (c) precision and (d) recall obtained using: Netflix database. Individual experiments (x-axis): #Ru 2 {2, . . . ,20}, 20% of validation users, leave-one-out cross validation applied to the items, precision and recall threshold h = 5, k = 700, N = 10.
236 J. Bobadilla et al. / Knowledge-Based Systems 26 (2012) 225–238
in Graph 4b, the MJD coverage is worse than the obtained using theother metrics (except JMSD). Graphs 4a and 4b, together, enablethe administrator of the RS to make a decision based on the num-ber of neighbors (k) to be used depending on the desired balancebetween the quality and the variety of the predictions that we wishto offer the cold-start users.
The quality of the recommendations, measured with precisionquality measure (proportion of relevant recommendations as re-gards the total number of recommendations made), improvesusing the similarity measure proposed (MJD) as regards traditionaland cold-start similarity measures (Fig. 4(c)). The improvement isobtained through the whole range of neighbors, which means thatthe improvement achieved in the predictions is transferred to therecommendations (using k = 700).
By analyzing Graph 4d we can determine that the quality of therecommendations measured with the recall quality measure (pro-portion of relevant recommendations as regards the total numberof relevant items) improves, using MJD, for the entire number ofneighbors considered.
Fig. 5 (Experiment 2) enables us to discover the quality of thepredictions and the recommendations made to the cold-start usersaccording to the number of items they have voted for. In Fig. 5(a)we can see a generalized improvement in the accuracy obtainedusing the similarity measure proposed (MJD) as regards the tradi-tional and the cold-start ones.
As is to be expected, the cold-start users who have voted forvery few items (two or three items) generate greater prediction er-rors. These cold-start users, which we could call extreme cold-startusers, do not present significant improvements in the MAE usingMJD; the basic problem with these users is that, in their case, thenumber of items with which the similarity measures can work isso small that the improvement margin is practically zero. The restof the cold-start users considered present a reduction in the MAEusing MJD as regards the other similarity measures used.
Fig. 5(b) shows that MJD predicts worse than most metrics(especially PIP); using MJD, the parameter that determines theadjustment in the coverage is k (number of neighbors).
Fig. 5(c) shows us precision values obtained with MJD which, asin the MAE, are moderate for the extreme cold-start users and bet-ter for the rest of the cold-start users. Fig. 4(d) shows recall positivemargins of improvement similar to those obtained when dealingwith precision measures; this indicates a good capacity of MJD toreduce the number of false-negatives (not recommended relevantitems). Both measures show an improvement in the proposedmetric.
Fig. 6 shows the results corresponding to Experiment 1 usingNetflix. As may be seen, these results confirm the conclusions de-rived from the results obtained from the database Movilens. InFig. 6(a) we can see how MJD provides much better results in rela-tion to PIP when working with Netflix than when working withMovielens. As may be seen in Fig. 4(b) and Fig. 6(b), the coverageresults obtained for Netflix are very similar to the ones obtainedfor Movielens. Figs. 6(c) and (d) show outstanding results in therecommendation quality measures for the database Netflix in anal-ogous way as those obtained for the database Movielens (Figs. 4(c)and (d)).
Fig. 7 (Experiment 2) shows the excellent general behavior ofthe proposed metric for the database Netflix, in a similar way tothe results we obtained for Movielens.
Besides, we have compared the time required to process for theproposed metric MJD and for the metric PIP. Since the calculationof our metric is very simple, it provides much faster recommenda-tions. Using Movielens as recommender system, we have taken allof the cold-start users and we have calculated their similarity withthe rest of users in the database. We have repeated this experiment100 times and we have obtained that the process time of a cold-start user for the MJD similarity metric is 9.11 ms, while for thePIP similarity metric is 66.42 ms (which means a performanceimprovement of 729%).
8. Conclusions
The new user cold start issue represents a serious problem in RSas it can lead to loss of new users due to the lack of accuracy in

J. Bobadilla et al. / Knowledge-Based Systems 26 (2012) 225–238 237
their recommendations because of having not made enough votesin the RS. For this reason, it is particularly important to design newsimilarity metrics which give greater precision to the results of-fered to users who have cast few votes.
The combination of Jaccard’s similarity measure, the arithmeticaverage of the squared differences in votes and the values of thedifferences in the votes provide us with the basic elements withwhich to design a metric that obtains good results in new user coldstart situations. These basic elements have been weighted via a lin-ear combination for which the weights are obtained in a process ofoptimization based on neural learning.
The Jaccard similarity measure makes use of information basedon the distribution and on the number of votes cast by each pair ofusers to be compared. Its use has been a determining factor inachieving the quality of the results obtained, which confirms thatit is appropriate to combine this information with traditional infor-mation, based on numerical values of the votes, when we wish todesign a cold-start similarity measure.
The proposed metric and a complete set of similarity measureshave been tested on the Netflix and Movielens databases. The pro-posed cold-start similarity measure provides results that improvethe prediction quality measure MAE and the recommendationquality measures precision & recall. The coverage is the only qual-ity measure that displays inferior result as it is evaluated with theproposed measure; this is due to the fact that the Jaccard compo-nent gives priority as neighbors to users with a similar numberof votes to the active user.
The proposed similarity measure runs seven times faster thanthe PIP one, and it also improves the MAE, precision and recallquality results.
In RS, in general, it is feasible to use different metrics on differ-ent users, and, in particular, it is possible to use one similarity mea-sure with those users who have cast few votes and a different oneon the rest of the users, which enables an improvement in the newusers’ recommendations without affecting the correct global oper-ation of the RS.
Acknowledgement
Our acknowledgement to the FilmAffinity.com & Netflix compa-nies, to the Movielens group and to the Elsevier Knowledge BasedSystems journal.
References
[1] E. Adomavicius, A. Tuzhilin, Toward the next generation of recommendersystems: a survey of the state-of-the-art and possible extensions, IEEETransactions on Knowledge and Data Engineering 17 (6) (2005) 734–749.
[2] N. Antonopoulus, J. Salter, CinemaScreen recommender agent: combiningcollaborative and content-based filtering, IEEE Intelligent Systems (2006) 35–41.
[3] J.S. Breese, D. Heckerman, C. Kadie, Empirical analysis of predictive algorithmsfor collaborative filtering, in: Proceedings of the 14th Conference onUncertainty in Artificial Intelligence, Morgan Kaufmann, 1998, pp. 43–52.
[4] J. Bobadilla, F. Serradilla, A. Hernando, Collaborative filtering adapted torecommender systems of e-learning, Knowledge Based Systems 22 (2009)261–265, doi:10.1016/j.knosys.2009.01.008.
[5] J. Bobadilla, F. Serradilla, J. Bernal, A new collaborative filtering metric thatimproves the behavior of recommender Systems, Knowledge Based Systems 23(6) (2010) 520–528, doi:10.1016/j.knosys.2010.03.009.
[6] J. Bobadilla, A. Hernando, F. Ortega, J. Bernal, A framework for collaborativefiltering recommender systems. Expert Systems with Applications, in press,doi:10.1016/j.eswa.2011.05.021.
[7] J. Bobadilla, F. Ortega, A. Hernando, A Collaborative Filtering SimilarityMeasure Based on Singularities, Inf. Proc. and Manag., in press, doi:10.1016/j.ipm.2011.03.007.
[8] J. Bobadilla, F. Ortega, A. Hernando, J. Alcalá, Improving collaborative filteringrecommender systems results and performance using genetic algorithms,Knowledge-Based Systems 24 (8) (2011) 1310–1316.
[9] J. Bobadilla, F. Ortega, A. Hernando, J. Bernal, Generalization of RecommenderSystems: Collaborative Filtering Extended to Group of Users and Restricted to
Group of Items, Expert Systems with Applications, in press, doi:10.1016/j.eswa.2011.07.005.
[10] T. Chen, L. He, Collaborative filtering based on demographic attribute vector,in: Proceedings of the International Conference on Future Computer andCommunication, 2009, pp. 225–229, doi:10.1109/FCC.2009.68.
[11] C. Christakou, A. Stafylopatis, A hybrid movie recommender system based onneural networks, in: International Conference on Intelligent Systems Designand Applications, 2005, pp. 500–505, doi:10.1109/ISDA.2005.9.
[12] H. Denis, Managing collaborative learning processes, e-learning applications,in: 29th International Conference on Information Technology Interfaces, 2007,pp. 345–350.
[13] L. Ding, D. Steil, B. Dixon, A. Parrish, D. Brown, A relation context orientedapproach to identify strong ties in social networks, Knowledge-Based Systems24 (8) (2011) 1187–1195.
[14] L.Q. Gao, C. Li, Hybrid personalized recommended model based on geneticalgorithm, in: International Conference on Wireless Communications,Networking and Mobile Computing, 2008, pp. 9215–9218.
[15] C. Hayes, P. Cunningham, Context boosting collaborative recommendations,Knowledge Based Systems 17 (2–4) (2004) 131–138.
[16] N.M. Heung, E.S. Abdulmotaleb, S.J. Geun, Collaborative error-reflected modelsfor cold-start recommender systems, Decision Support Systems, in press,doi:10.1016/j.dss.2011.02.015.
[17] J.L. Herlocker, J.A. Konstan, J.T. Riedl, L.G. Terveen, Evaluating collaborativefiltering recommender systems, ACM Transactions on Information Systems 22(1) (2004) 5–53.
[18] F. Hernandez, E. Gaudioso, Evaluation of recommender systems: a newapproach, Expert Systems with Applications (2007) 790–804, doi:10.1016/j.eswa.2007.07.047.
[19] Z. Huang, D. Zeng, H. Chen, A comparison of collaborative-filteringrecommendation algorithms for e-commerce, IEEE Intelligent Systems(2007) 68–78.
[20] Y.P. Huang, W.P. Chuang, Y.H. Ke, F.E. Sandnes, Using back-propagation tolearn association rules for service personalization, Expert Systems withApplications 35 (2008) 245–253, doi:10.1016/j.eswa.2007.06.035.
[21] M.H. Hsu, Proposing an ESL recommender teaching and learning system,Expert Systems with Applications 34 (3) (2008) 2102–2110.
[22] J.A. Hyung, A new similarity measure for collaborative filtering to alleviate thenew user cold-starting problem, Information Sciences 178 (2008) 37–51,doi:10.1016/j.ins.2007.07.024.
[23] H. Jinghua, W. Kangning, F. Shaohong, A survey of e-commerce recommenderSystems, in: International Conference on Service Systems and ServiceManagement, 2007, pp. 1–5, doi:10.1109/ICSSSM.2007.4280214.
[24] H.N. Kim, A.T. Ji, I. Ha, G.S. Jo, Collaborative filtering based on collaborativetagging for enhancing the quality of recommendations, Electronic CommerceResearch and Applications 9 (1) (2010) 73–83, doi:10.1016/j.elerap.2009.08.004.
[25] J.A. Konstan, B.N. Miller, J. Riedl, PocketLens: toward a personal recommendersystem, ACM Transactions on Information Systems 22 (3) (2004) 437–476.
[26] B. Krulwich, Lifestyle finder: intelligent user profiling using large-scaledemographic data, Artificial Intelligence Magazine 18 (2) (1997) 37–45.
[27] X.N. Lam, T. Vu, T.D. Le, A.D. Duong, Addressing cold-start problem inrecommendation systems, in; Conference On Ubiquitous InformationManagement And Communication, 2008, pp. 208–211, doi:10.1145/1352793.1352837.
[28] K. Lang, NewsWeeder: learning to filter netnews, in: Proceedings of the 12thInternational Conference on Machine Learning, 1995, pp. 331–339.
[29] M. Lee, Y. Woo, A hybrid recommender system combining collaborativefiltering with neural network, Lecture Notes on Computer Sciences 2347(2002) 531–534.
[30] C.W. Leung, S.C. Chan, F.L. Chung, An empirical study of a cross-levelassociation rule mining approach to cold-start recommendations, KnowledgeBased Systems 21 (7) (2008) 515–529. Autumn.
[31] Q. Li, S.H. Myaeng, B.M. Kim, A probabilistic music recommender consideringuser opinions and audio features, Information Processing & Management 43(2) (2007) 473–487.
[32] S.G. Li, L. Shi, L. Wang, The agile improvement of MMORPGs based on theenhanced chaotic neural network, Knowledge Based Systems 24 (5) (2011)642–651.
[33] S. Loh, F. Lorenzi, R. Granada, D. Lichtnow, L.K. Wives, J.P. Oliveira, Identifyingsimilar users by their scientific publications to reduce cold start inrecommender systems, in: Proceedings of the 5th International Conferenceon Web Information Systems and Technologies (WEBIST2009), 2009, pp. 593–600.
[34] L. Martinez, L.G. Perez, M.J. Barranco, Incomplete preference relations tosmooth out the cold-start in collaborative recommender systems, in:Proceedings of the 28th North American Fuzzy Information ProcessingSociety Annual Conference (NAFIPS2009), 2009, pp. 1–6, doi:10.1109/NAFIPS.2009.5156454.
[35] A. Nocera, D. Ursino, An Approach to Providing a User of a ‘‘Social Folksonomy’’with Recommendations of Similar Users and Potentially Interesting Resources,Knowledge Based Systems 24 (8) (2011) 1277–1296.
[36] M.P. O’Mahony, B. Smyth, A classification-based review recommender,Knowledge Based Systems 23 (4) (2010) 323–329.
[37] S.T. Park, D.M. Pennock, O. Madani, N. Good, D. Coste, Naı̈ve filterbots forrobust cold-start recommendations, in: Proceedings of Knowledge Discoveryand Data Mining (KDD2006), 2006, pp. 699–705.

238 J. Bobadilla et al. / Knowledge-Based Systems 26 (2012) 225–238
[38] Y.J. Park, A. Tuzhilin, The long tail of recommender systems and how toleverage it, in: ACM Conference on Recommender Systems, 2008, pp. 11–18,doi:10.1145/1454008.1454012.
[39] S.T. Park, W. Chu, Pairwise Preference Regression for Cold-startRecommendation, in: ACM Conference on Recommender Systems, 2009, pp.21–28, doi:10.1145/1639714.1639720.
[40] C. Porcel, E. Herrera-Viedma, Dealing with incomplete information in a fuzzylinguistic recommender system to disseminate information in universitydigital libraries, Knowledge Based Systems 23 (1) (2010) 32–39.
[41] P. Pu, L. Chen, Trust-inspiring explanation interfaces for recommendersystems, Knowledge Based Systems 20 (6) (2007) 542–556.
[42] A.M. Rashid, I. Albert, D. Cosley, S.K. Lam, S.M. McNee, J.A. Konstan, J. Riedl,Getting to know you: learning new users preferences in recommendersystems, in: International Conference on Intelligent Users Interfaces(IUI2002), 2002, pp. 127–134.
[43] A.M. Rashid, G. Karypis, J. Riedl, Learning preferences of new users inrecommender systems: an information theoretic approach, KnowledgeDiscovery and Data Mining (KDD2008) 10 (2) (2008) 90–100.
[44] L. Ren, L. He, J. Gu, W. Xia, F. Wu, A hybrid recommender approach based onWidrow–Hoff learning, in: International Conference on Future GenerationCommunication and Networking, 2008, pp. 40–45, doi:10.1109/FGCN.2008.48.
[45] T.H. Roh, K.J. Oh, I. Han, The collaborative filtering recommendation based onSOM cluster-indexing CBR, Expert Systems with Applications 25 (2003) 413–423, doi:10.1016/SO957-4174(03)00067-8.
[46] P.B. Ryan, D. Bridge, Collaborative recommending using formal conceptanalysis, Knowledge Based Systems 19 (5) (2006) 309–315.
[47] J. Salter, N. Antonopoulus, CinemaScreen recommender agent: combiningcollaborative and content-based filtering, IEEE Intelligent Systems 21 (2006)35–41.
[48] J.B. Schafer, D. Frankowski, J. Herlocker, S. Sen, Collaborative filteringrecommender systems, The Adaptive Web, LNCS 4321 (2007) 291–324.
[49] A.I. Schein, A. Popescul, L.H. Ungar, D.M. Pennock, Methods and metrics forcold-start recommendations, SIGIR (2002) 253–260.
[50] M. Saranya, T. Atsuhiro, Hybrid recommender systems using latent features,in: Proceedings of the International Conference on Advanced InformationNetworking and Applications Workshops, 2009, pp. 661–666, doi:10.1109/WAINA.2009.122.
[51] P. Symeonidis, A. Nanopoulos, Y. Manolopoulos, Providing justifications inrecommender systems, IEEE Transactions on Systems, Man and Cybernetics 38(6) (2008) 1262–1272.
[52] H.F. Wang, Ch.T. Wu, A strategy-oriented operation module for recommenderSystems in e-commerce, E-commerce Computers & Operations Research, inpress, doi:10.1016/j.cor.2010.03.011.
[53] L.T. Weng, Y. Xu, Y. Li, R. Nayak, Exploiting item taxonomy for solving cold-start problem in recommendation making, in: Proceedings of the 20th IEEEInternational Conference on Tools with Artificial Intelligence (ICTAI2008),Dayton, USA, 2008, pp. 113–120.
[54] B. Widrow, M.E. Hoff, Adaptive switching circuits, New York. ConventionRecord, IRE WESCON, 1960, pp. 96–104.
[55] J.M. Yang, K.F. Li, Recommendation based on rational inferences incollaborative filtering, Knowledge Based Systems 22 (1) (2009) 105–114.
[56] W. Yuan, D. Guan, Y.K. Lee, S. Lee, S.J. Hur, Improved trust-aware recommendersystem using small-worldness of trust Networks, Knowledge-Based Systems23 (3) (2010) 232–238.
[57] M.L. Yung, P.K. Chien, TREPPS: a trust-based recommender system for peerproduction services, Expert Systems with Applications 36 (2) (2009) 3263–3277.