a classification approach for power distribution systems fault cause identification
TRANSCRIPT
8/8/2019 A Classification Approach for Power Distribution Systems Fault Cause Identification
http://slidepdf.com/reader/full/a-classification-approach-for-power-distribution-systems-fault-cause-identification 1/8
IEEE TRANSACTIONS ON POWER SYSTEMS, VOL. 21, NO. 1, FEBRUARY 2006 53
A Classification Approach for Power DistributionSystems Fault Cause IdentificationLe Xu , Student Member, IEEE, and Mo-Yuen Chow , Senior Member, IEEE
Abstract—Power distribution systems play an important role inmodern society. When distribution system outages occur, fast andproper restorations are crucial to improve the quality of servicesand customer satisfaction. Proper usages of outage root cause iden-tification tools are often essential for effective outage restorations.This paper reports on the investigation and results of two popularclassification methods: logistic regression (LR)and artificial neuralnetwork (ANN) applied on power distribution fault cause identi-fication. LR is seldom used in power distribution fault diagnosis,while ANN has been extensively used in power system reliabilityresearches. This paper discusses the practical application prob-lems, including data insufficiency, imbalanced data constitution,
and threshold setting that are often faced in power distributionfault cause identification problems. Two major distribution faulttypes, tree and animal contact, are used to illustrate the character-istics and effectiveness of the investigated techniques.
Index Terms—Artificial neural network (ANN), classification,data insufficiency, fault cause identification, imbalanced data,logistic regression (LR), power distribution systems, thresholdsetting.
I. INTRODUCTION
AS THE RETAIL part of utilities, power distribution sys-
temsaim at providing reliable,economical, and safesupply
of electricity to the users. However, power distribution systemsare geographically dispersed, and under various dynamic oper-
ating environments, they can be significantly affected by various
faults in terms of power reliability and quality of services, such
as equipment failure, animal contacts, trees, lightning, etc.
In order to improve system safety and reliability, power
distribution management systems should have fast and proper
response to power outages. Currently, when a power outage is
reported to the control center by customers, a typical response
is that the operators estimate the probable outage location
based on available information and call up their operation
and maintenance (O&M) crews to fix the problem. For safety
reasons, many utilities do not restore the distribution system
until they have found the outage cause. Sometimes, the outagecause cannot be found in the fault location. For example, a
squirrel jumped into a distribution transformer and shorted the
phase to ground wires. However, a bird took away the dead
squirrel body; thus, the fault cause evidence could not be found
anymore. The lineman needs to walk down the line, which can
Manuscript received March 16, 2005; revised September 3, 2005. This work was supported by the National Science Foundation under Grant ECS-0245383.Paper no. TPWRS-00161-2005.
The authors are with Department of Electrical and Computer Engi-neering, North Carolina State University, Raleigh, NC 27695 USA (e-mail:[email protected]; [email protected]).
Digital Object Identifier 10.1109/TPWRS.2005.861981
be miles, in an attempt to find the outage evidence (e.g., burn
marks on the pole for possible lightning faults, dead animal
bodies for possible animal faults) and to ensure everything is
safe (e.g., no down distribution lines) before they re-energize
the system. For some of the outage causes (e.g., tree fault), they
may need to call in the control center to dispatch appropriate
crews (e.g., tree crew) to remove the fallen trees in order to
restore the system. The whole process may take tens of min-
utes to hours. Utilities have been making substantial effort to
expedite the restoration procedure; for example, sectionalizing
the feeders to quickly restore as many customers as possible onpower by putting every subsection back once workers assure
its proper working instead of restoring the whole section at
the same time [1]. Many different methods, such as Bayesian
network [2], support vector machine [3], and current pattern
matching [4], have been investigated to locate the fault.
This paper focuses on theoutage root cause identification; rea-
sonable fault cause estimation can provide workers with useful
information to narrow down the searching areas so as to help to
expedite the restorationprocedure. With goodfault causeestima-
tion, the control center can inform the lineman to focus on what
evidencetolookfor.Forexample,ifthefaultislikelytobecaused
by animals, then the control center will ask the lineman to focus
on dead animal bodies on the top of distribution transformer orthe ground close to the distribution poles, with less emphasis on
burn marks on the distribution equipment that can be caused by
lightning. The control center can also dispatch appropriate crew
earlier to restore the system. For example, if the fault cause is
estimated to be a tree cause fault, then the control center will pre-
pare and be ready to dispatch the tree crew to restore the system.
Thus, a good estimate on the fault cause can significantly reduce
the “trouble shooting” time, thus reducing the restoration time
and consequently improving the system reliability.
Power distribution fault cause identification can be viewed as
a classification problem in that operators try to categorize the
reported outage into one of the existing fault cause classes care-fully arranged by domain experts, while a typical classification
problem aims to extract models from training data with known
class labels to predict the categories of the test data of which
the class labels are unknown. Many methods use current and
voltage for fault classification [5], [6]. With the development of
data mining techniques, some research has investigated fault di-
agnosis using the extracted patterns from historical outage data:
An approach using rough set theory to mine the historical fault
data has been proposed in [7].
In this paper, a power distribution fault cause classifier
(PDFCC) has been developed to address the fault cause iden-
tification problem in the power distribution systems. The
0885-8950/$20.00 © 2006 IEEE

8/8/2019 A Classification Approach for Power Distribution Systems Fault Cause Identification
http://slidepdf.com/reader/full/a-classification-approach-for-power-distribution-systems-fault-cause-identification 2/8
54 IEEE TRANSACTIONS ON POWER SYSTEMS, VOL. 21, NO. 1, FEBRUARY 2006
investigation and results of two classification methods, logistic
regression (LR) and artificial neural network (ANN) applied
to mine the historical outage data for power distribution fault
cause classification, are presented. A regular LR is a para-
metric model used to analyze the problems with dichotomous
dependent variables; it has been widely applied in medicine
and biology areas but not in power system fault diagnosis. Onthe other hand, ANN is a nonparametric method that has been
extensively used in various research and application areas,
including power systems [8], [9]. Evaluation criteria of the
goodness of the PDFCC include: correct classification rate
(CCR); true positive rate; true negative rate; and geometric
mean. This paper discusses the practical application prob-
lems like data insuf ficiency, imbalanced data constitution, and
threshold setting that are often faced in power distribution
fault cause identification problems. Tree and animal contact,
which are two of the top customer interruption causes for most
utilities, are used in this paper to illustrate the characteristics
and effectiveness of the investigated techniques.
II. POWER DISTRIBUTION FAULT DATA PREPROCESSING
This paper uses Duke Energy power distribution outage
data to illustrate the proposed outage root cause identification
scheme. Duke Energy has a detailed power distribution fault
data collection system. Every time a fault current is detected in
the distribution system as a result of the activation of protective
devices (e.g., a circuit breaker, a fuse), the information related
to that distribution fault is recorded into this database as one
record entry. Each fault record has 33 information fields; based
on Duke Energy senior distribution engineers’ suggestions,
six of them are considered as containing most essential and
influential information for tree-caused faults and animal-caused
faults [10], [11] and are selected to be used in this paper. These
six factors have been tested to be statistically significant influ-
ential factors [10]. These factors are circuit ID number (CI),
weather condition (WE), season (SE), time of day (TD), number
of phases affected (NP), and protective devices activated (PD).
Each factor and its contents are represented in set notations;
one example is
WE fair cold rain wind wind lightning
lightning hail snow ice hot storm
Like the factor of weather condition, most of these six
input factors are nonnumerical variables; they are transformed
into numerical nominal variables so that they can be easily
represented in the training set. For instance, fair weather is
represented by number 0; cold is denoted as 1; and so on. The
numerical data here are used as nominal values rather than
continuous values to simply serve as a “tag” to represent the
weather condition.
In addition, the attribute cause that records the root cause of
the outage is also used. It is entered by the crew after finding the
actual outage cause during the restoration process. This paper
uses tree-caused faults and animal-caused faults as prototypes;
so we categorize the root causes into three classes: {tree-causedfault (T), animal-caused fault (A), other causes (O)}. The
PDFCC proposed in this paper will classify an outage into one
of these three classes.
The Duke Energy outage data consist of outage records from
its 32 service regions in North Carolina and South Carolina
ranging from 1994 to 2002. Based on domain experts’ sugges-
tions, we take different geographical features and system status
into account and select seven regions as reasonable represen-tations of Duke Energy’s service areas: Chapel Hill (CHPL),
Clemson (CLEM), Durham (DURH), Greenville (GREE),
Hickory (HICK), Lancaster (LANC), and Winston-Salem
(WINS). These seven regions cover metropolitan areas, cities,
towns, rural areas, and wooded areas and also embody both old
systems and new systems.
III. CLASSIFICATION METHODS
There are many well-established classification methods;
empirical studies show that many algorithms have suf ficiently
similar accuracies such that the differences between those
algorithms are statistically insignificant [12]. It is importantfor PDFCC, which aims at solving practical power distribu-
tion fault cause identification, to select a proper classification
method considering the practical application issues like ease of
implementation and computational requirements in addition to
accuracy. LR and ANN are two classification methods widely
used in numerous applications; they can be easily and quickly
implemented using several existing software or toolboxes
such as SAS and MATLAB. In this paper, we employ these
two methods to mine the historical outage data and extract
distribution fault cause classification models from the data.
A. LR
LR is a well-known statistic method to analyze problems with
a dichotomous (binary) dependent variable. The dichotomous
classification problems were commonly analyzed by ordinary
least-squares linear regression, which, in fact, often did a
reasonably good job. However, a dichotomous dependent vari-
able violates the normality assumption and homoscedasticity
assumption of the linear regression model [13]. Consequently,
researchers seek to develop alternative methods by trying
to predict the probability of a case being classified into one
category of the dependent variable as opposed to the other; for
example, if we only consider the animal-caused fault, we want
to estimate the probability of an outage being caused by animal
contact as opposed to the probability of not being caused by
animal. Assuming that we use 1 and 0 to represent the two
possible values of the dependent variable, the problem can be
formulated as
(1)
where is the dependent variable (e.g., animal-caused fault)
, is a n independent variable ( e.g., CI, W E, N P,
PD, SE, T D), and are parameters t o be identified
based on the training data.
Probability value must be between 0 and 1, but the predicted
value from the independent variables in the right-hand side of (1) may be less than 0 or greater than 1. In order

8/8/2019 A Classification Approach for Power Distribution Systems Fault Cause Identification
http://slidepdf.com/reader/full/a-classification-approach-for-power-distribution-systems-fault-cause-identification 3/8
XU AND CHOW: CLASSIFICATION APPROACH FOR POWER DISTRIBUTION SYSTEMS 55
to resolve this problem, the probability is transformed to odds,
which refers to the ratio of the probability that the event will
occur to the probability that the event will not occur
odds (2)
The odds does not have a maximum value; however, it has aminimum value bounded by zero. The odds is always nonneg-
ative because it is the ratio of two probability values. A further
transformation using the natural logarithm of the odds is per-
formed. The natural logarithm of the odds is called logit, which
can be any number between plus and minus infinity
odds
(3)
where and are parameters to be identified by
the training data.
The model specified in (3) is the LR model; its unknown coef-ficients and are estimated with maximum like-
lihood [13] parameter estimation method using the training data.
Equation (3) can be easily solved for the probability of the
observed case being in the category of interest as shown in
(4)
When LR is applied as a classification method to separate
patterns between two classes, the unknown parameters and
of the LR model are estimated from the training
data first; then the probability of a test case is calcu-
lated using (4); in the end, the class label is assigned to that testcase by comparing the calculated probability with a predefined
threshold.
B. ANN
A neural network is a set of interconnected simple processing
elements called nodes or neurons, where each connection has
an associated weight. A neural network can exhibit certain be-
havior or achieve desired input–output mapping with specified
set of weights stored in the connections between nodes; there-
fore, we can train the neural network to do a particular job by
adjusting the weights on each connection [14].
The processing element neurons are usually organized intoseries of layers. A neural network typically consists of three or
more layers. The data are presented to the input layer by which
the data are passed into the network. The data from the input
layer arrive at the intermediate layer or the hidden layer with
the associated connection weights. The hidden layer takes in
the weighted inputs and calculates the outputs by the hidden
neurons’ transfer functions. The calculated outputs are fed to
the next hidden layer in turn (if there are more than one) or the
output layer. The output layer then generates the results repre-
senting the mapping from the given input data. There is no clear
rule to determine the number of neurons in each layer, which is
generally done by educated trial and error. The network of which
none of the weights are fed backward is called a feed-forwardneural network.
Once the network structure has been determined, the weight
of each connection in the network is to be learned from the
training data. The most popular learning algorithms is back-
propagation. The network connection weights are initialized to
small random numbers, and then the inputs are propagated for-
ward by activating the neuron transfer functions and calculating
the outputs of each layer in turn to calculate the network output;afterwards, the error between the actual network output and de-
sired response is propagated backward to update the network
parameters in order to minimize the error of the network predic-
tion. Back-propagation iteratively processes the training sam-
ples through the input forward propagation and error backward
propagation until a specified accuracy or specific terminating
conditions are satisfied.
ANN technique has been applied to many different areas,
such as pattern recognition and classification. When a neural
network is used as a classification technique, its operation in-
volves two steps: learning and recall. In the learning phase, all
the weights in the network are adjusted to adapt to the patterns
of the training data in accordance with the learning algorithm; inthe recall phase, the network produces responses of the inputted
test data based on learned network parameters.
IV. PDFCC
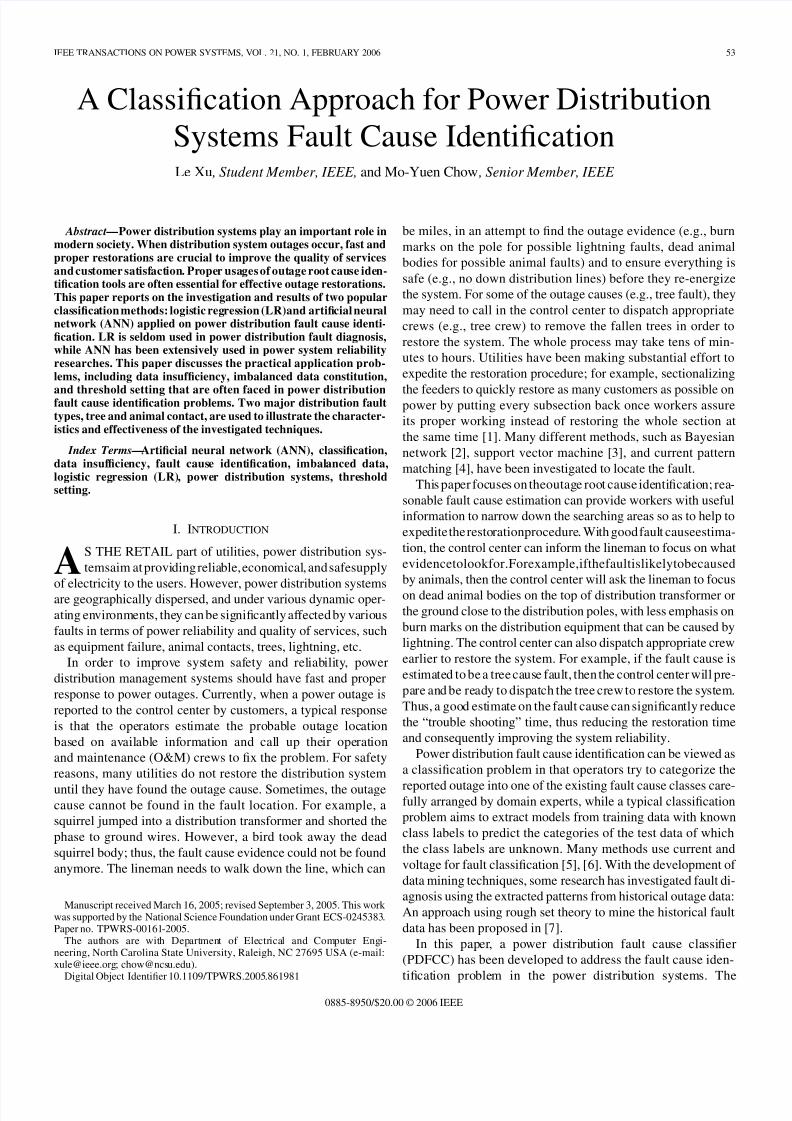
The flowchart of the PDFCC developed in this paper for
power distribution fault cause identification is shown in Fig. 1.
Since we consider two fault causes in this paper, the PDFCC
consists of two parallel branches. These two branches are iden-
tical in terms of structure and operating mechanism, but they
work on different fault causes. Branch A classifies the input fault
as either an animal or nonanimal fault, while branch T simul-
taneously works on tree faults. If we consider N fault causes,then we will have N parallel branches. The outputs from two in-
dividual branches are mediated by the decision fusion module
when conflict happens; it will be discussed in a later section.
A. System Inputs
The input data to PDFCC consist of the six selected informa-
tion factors introduced in Section II
B. Data Preprocessor (Animal/Tree)
Four statistical measures have been proposed in [11] to ex-
amine the outage data from different perspectives. Likelihood
measure, one of the developed measures, indicates the proba-
bility that an outage is caused by a specific fault under a speci-
fied condition. This measure can be expressed as
(5)
where is the likelihood measure of fault given event ,
is the number of outages caused by fault under event ,and is the total number of outages under event .
8/8/2019 A Classification Approach for Power Distribution Systems Fault Cause Identification
http://slidepdf.com/reader/full/a-classification-approach-for-power-distribution-systems-fault-cause-identification 4/8
56 IEEE TRANSACTIONS ON POWER SYSTEMS, VOL. 21, NO. 1, FEBRUARY 2006
Fig. 1. Flow chart of PDFCC.
For example, if indicates a tree-caused fault and indicates
icy weather conditions, then the likelihood measure shows
the conditional probability of the observed outage being caused
by a tree given icy weather conditions. Likelihood measure can
provide useful information for fault cause identification, so it
is logically used as the inputs to the classification methods for
outage cause identification. Equation (5) indicates that likeli-
hood measure is related to both fault type and event; the likeli-
hood measure for tree-caused faults and that for animal-caused
faults are different, even given the same event. Thus, we need to
utilize two branches to deal with two fault types, respectively.The data preprocessor modules in both branches take in the
input , calculate the corresponding likelihood measures
with respect to different fault causes, and then pass to the
classification modules.
C. Classification Module (Animal/Tree)
We use LR and ANN in this module in order to compare these
two popular classification techniques for power distribution
fault cause identification under the same environments. Both
methods implement a mapping from the likelihood measures
as defined in (5) to a probability value
(6)
1) LR: For the branch of fault , animal,tree , the
likelihood measures from the corresponding classification
module are the independent variables of the LR model, and the
probability is the dependent variable.
2) ANN: The inputs and output are in correspondence with
the independent variables and dependent variable of LR model.
A three-layer feed-forward network with one hidden layer of 40nodes is used in this paper (which has been chosen through ex-
tensive simulation of different numbers of hidden nodes.) Five-
fold cross-validation is used to prevent overfitting.
D. Optimal Threshold Value Calculation (Animal/Tree)
The output of the classification module is the probability
of the observed input data being caused by fault ; in order
to categorize the observed outage into one class or the other, a
threshold is needed. With the selected threshold and calcu-
lated probability from the classification module, a class label
can be generated: animal-caused fault or nonanimal-caused for
branch A, tree-caused fault or nontree-caused for branch T, and
mathematically represented as
(7)
where is the class label and “1” stands for the outage caused
by fault , while “0” stands for the outage not caused by fault .
Usually the threshold is set as 0.5 (for ) for an
ideal case (e.g., plenty of data and they are all independent and
identically distributed). However, the outage data used are im-
balanced. The average proportion of tree-caused faults is only
23.6% and animal-caused faults is 13.2%, while other faults ac-
count as much as 63.2%; therefore, we adjusted to an optimalvalue rather than use the fixed value of 0.5 to compensate the
asymmetry of the sample composition in the data in order to
maximize the correct classification rate, as shown in Fig. 2.
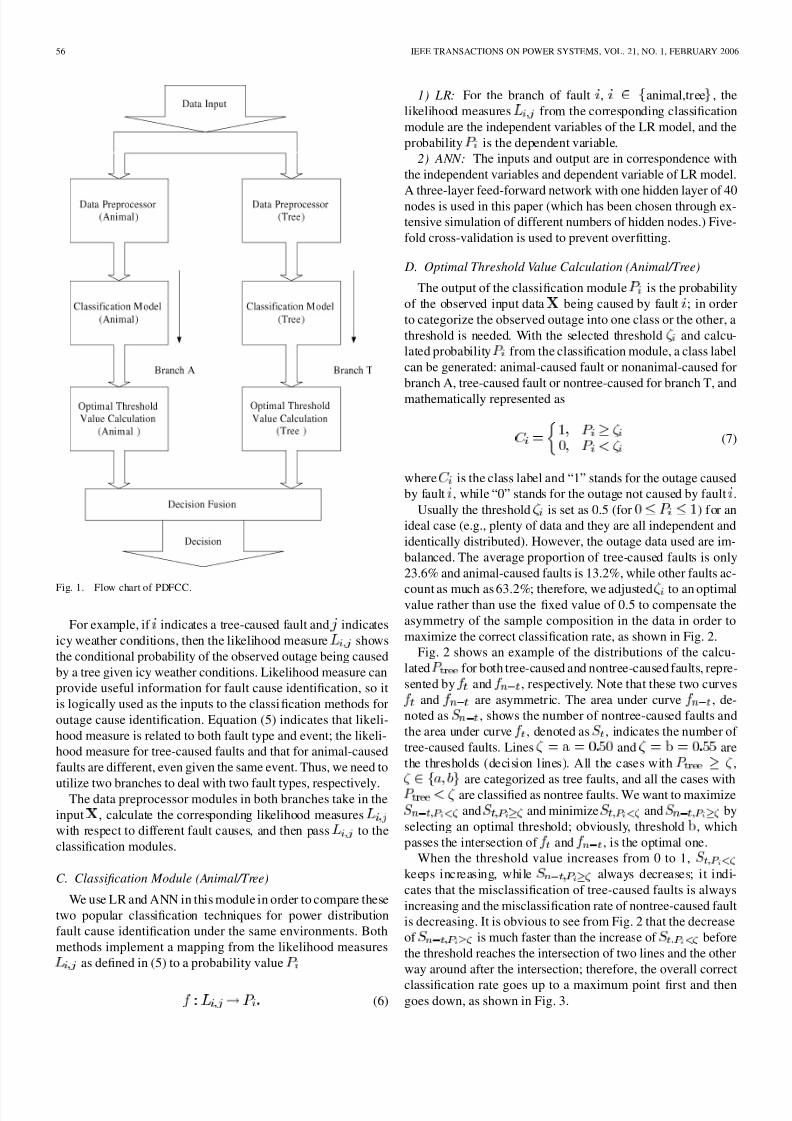
Fig. 2 shows an example of the distributions of the calcu-
lated for both tree-caused and nontree-caused faults, repre-
sented by and , respectively. Note that these two curves
and are asymmetric. The area under curve , de-
noted as , shows the number of nontree-caused faults and
the area under curve , denoted as , indicates the number of
tree-caused faults. Lines and are
the thresholds (decision lines). All the cases with ,
are categorized as tree faults, and all the cases withare classified as nontree faults. We want to maximize
and and minimize and by
selecting an optimal threshold; obviously, threshold , which
passes the intersection of and , is the optimal one.
When the threshold value increases from 0 to 1,
keeps increasing, while always decreases; it indi-
cates that the misclassification of tree-caused faults is always
increasing and the misclassification rate of nontree-caused fault
is decreasing. It is obvious to see from Fig. 2 that the decrease
of is much faster than the increase of before
the threshold reaches the intersection of two lines and the other
way around after the intersection; therefore, the overall correct
classification rate goes up to a maximum point first and thengoes down, as shown in Fig. 3.
8/8/2019 A Classification Approach for Power Distribution Systems Fault Cause Identification
http://slidepdf.com/reader/full/a-classification-approach-for-power-distribution-systems-fault-cause-identification 5/8
XU AND CHOW: CLASSIFICATION APPROACH FOR POWER DISTRIBUTION SYSTEMS 57
Fig. 2. Threshold selection for imbalanced data.
Fig. 3. Correct classification rate curve with different threshold settings.
Fig. 3 shows the CCR of tree-caused fault data in the Lan-
caster region. The peak value of CCR is 0.7887 achieved by a
thresholdvalue of about 0.55. When thethreshold is 0.5, theCCR
is 0.7869. When the threshold is 0, all outages are classified as
tree-caused faults, which account for about 30% of the total out-
ages, sothe CCR isonlyabout0.3.When the threshold is1, every
single outage is classified as a nontree-caused fault, accounting
for about 70% of the total outages, so the CCR is about 0.7.
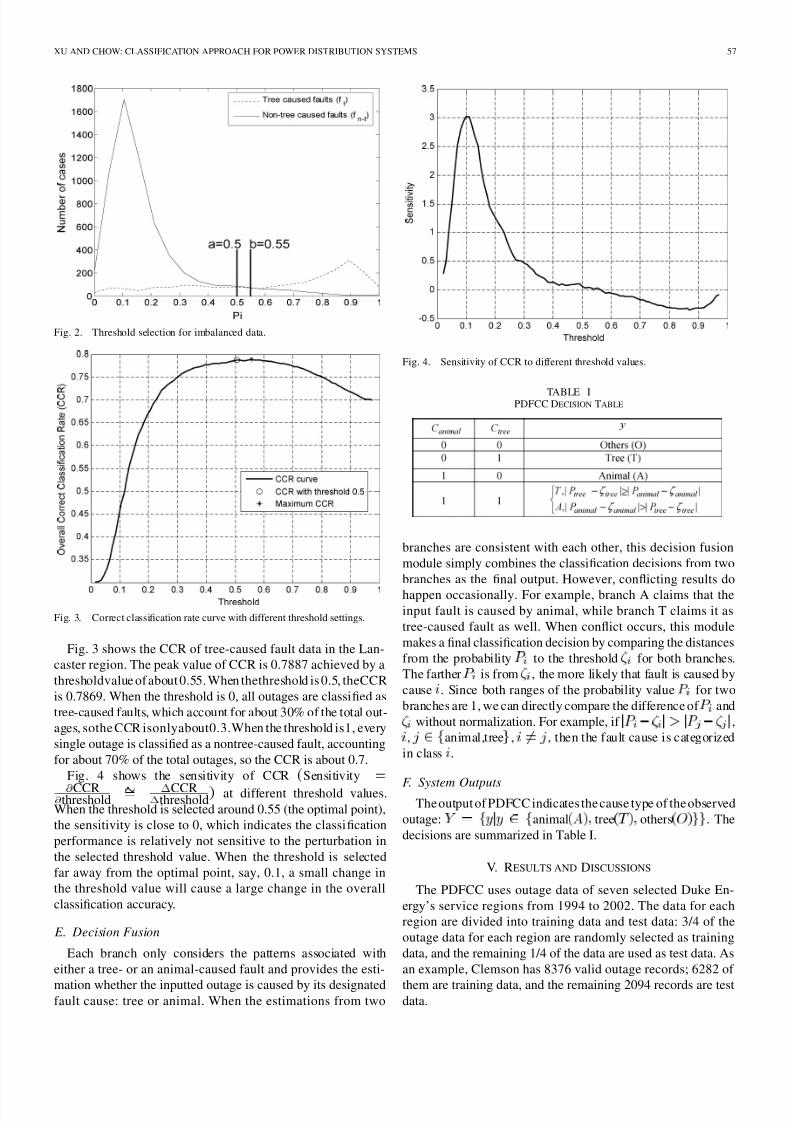
Fig. 4 shows the sensitivity of CCR Sensitivity
CCRthreshold
CCRthreshold
at different threshold values.
When the threshold is selected around 0.55 (the optimal point),
the sensitivity is close to 0, which indicates the classification
performance is relatively not sensitive to the perturbation in
the selected threshold value. When the threshold is selected
far away from the optimal point, say, 0.1, a small change in
the threshold value will cause a large change in the overall
classification accuracy.
E. Decision Fusion
Each branch only considers the patterns associated with
either a tree- or an animal-caused fault and provides the esti-
mation whether the inputted outage is caused by its designatedfault cause: tree or animal. When the estimations from two
Fig. 4. Sensitivity of CCR to different threshold values.
TABLE IPDFCC DECISION TABLE
branches are consistent with each other, this decision fusion
module simply combines the classification decisions from two
branches as the final output. However, conflicting results do
happen occasionally. For example, branch A claims that the
input fault is caused by animal, while branch T claims it as
tree-caused fault as well. When conflict occurs, this module
makes a final classification decision by comparing the distances
from the probability to the threshold for both branches.
The farther is from , the more likely that fault is caused by
cause . Since both ranges of the probability value for two
branches are 1, we can directly compare the difference of and
without normalization. For example, if ,
, animal,tree , , then the fault cause is categorized
in class .
F. System OutputsThe output of PDFCC indicates the cause type of the observed
outage: animal tree others . The
decisions are summarized in Table I.
V. RESULTS AND DISCUSSIONS
The PDFCC uses outage data of seven selected Duke En-
ergy’s service regions from 1994 to 2002. The data for each
region are divided into training data and test data: 3/4 of the
outage data for each region are randomly selected as training
data, and the remaining 1/4 of the data are used as test data. As
an example, Clemson has 8376 valid outage records; 6282 of
them are training data, and the remaining 2094 records are testdata.

8/8/2019 A Classification Approach for Power Distribution Systems Fault Cause Identification
http://slidepdf.com/reader/full/a-classification-approach-for-power-distribution-systems-fault-cause-identification 6/8
58 IEEE TRANSACTIONS ON POWER SYSTEMS, VOL. 21, NO. 1, FEBRUARY 2006
TABLE IICONFUSION MATRIX
A. Performance Measures
A straightforward way to measure the overall accuracy of a
classifier is to test how many of the inputs are correctly classi-
fied into the corresponding categories, denoted by CCR. How-
ever, it is usually insuf ficient by simply observing CCR, espe-
cially when the data are imbalanced. For example, if a data set
is composed of two classes, class M constitutes 95% of the data,
while only 5% of the data are from class N; then a classi fier that
predicts every case as the majority class M can still achieve a
very high overall accuracy (95%). As mentioned in Section IV,
the power distribution outage data used are imbalanced in terms
of both tree-caused faults and animal-caused faults. Therefore,true positive rate , true negative rate , and geometric
mean g-mean are further used to evaluate the performance of the
techniques on the imbalanced data. These metrics are developed
from the confusion matrix, as shown in Table II (assuming the
animal/tree-caused faults are positive class and nonanimal/non-
tree faults as negative class).
True positive rate indicates how
many of the animal/tree-caused faults are correctly classified;
true negative rate shows how many
of the nonanimal/nontree-caused faults are correctly classified.
Kubat et al. propose the geometric mean of accuracies
in [15] for imbalanced data sets.
The basic idea behind g-mean is to maximize the accuracy on
both classes; it is high when both and are large
and the difference between and is small. Geometric
mean punishes big disparities between accuracies of classifying
animal/tree-caused faults and nonanimal/nontree-caused faults.
B. Results
As discussed in Section IV-E, the decision fusion module is to
handle conflicting cases between two branches; in practice, only
few conflicts occur (less than 0.1% of all the data encountered).
We compare the performance for two individual branches in-
stead of the overall PDFCC performance in order to provide de-tailed interpretation of the results, which are shown in Tables III
and IV.
Both Table III and Table IV show that LR and ANN have
similar performance in terms of the overall accuracy (CCR) for
both animal-caused fault and tree-caused fault in all of seven
selected service regions; ANN has slightly higher accuracy,
though. From Table III, the largest difference between the
performance of ANN and LR on animal-caused faults identifi-
cation is 0.0131 for training data and only 0.0076 for test data.
From Table IV, the largest difference between the performance
of these two methods on tree-caused faults is 0.015 for training
data and only 0.0089 for test data. The difference between these
two techniques is so tiny that they are statistically insignificant.Besides, the difference of CCR between training data and test
TABLE IIICCR FOR ANIMAL FAULT CLASSIFIER WITH LR AND ANN
TABLE IVCCR FOR TREE FAULT CLASSIFIER WITH LR AND ANN
data is also very small, which indicates that neither of the
methods overfits the training data. The largest difference that
LR gets on animal faults is just 0.0059 and on tree faults is
0.127, while the largest difference that ANN gets on animal
faults is only 0.0086 and on tree faults is 0.0174.
We further use the animal fault classifier to illustrate true pos-
itive rate, true negative rate, and geometric mean, as shown in
Figs. 5–7, respectively.
The true positive rate indicates the performance of two tech-
niques on classifying the tree/animal faults. As shown in Fig. 5,ANN has better performance on this task; it outperforms the LR
in all of the regions for training data and in five out of seven re-
gions on test data. The largest difference between the two tech-
niques is as large as 14.4% on training data and 11.8% on test
data. Fig. 6 shows the true negative rate achieved by LR and
ANN. Different from the case shown in Fig. 5 where ANN gen-
erally has higher true positive rate on both training data and
test data, neither of these two methods shows obvious predom-
inance; the largest difference between them is only 1.6% on
training data and 2.1% on test data. Both advantages are gained
by LR in the region of CLEM.
The imbalanced data typically cause the classifier to be bi-ased toward the majority class (nontree/nonanimal fault), so as
to have a low error rate for the majority class and get an un-
acceptable error rate for the minority class (tree/animal fault).
Thus, we want to maximize the g-mean, which indicates the
performance of PDFCC on classifying both fault causes. Fig. 7
indicates that ANN outperforms LR in most of the regions, the
advantage is as large as 0.114 on training data and 0.091 on test
data, and both occur in the region of DURH.
With the comparisons, ANN and LR have close overall clas-
sification accuracies. However, ANN achieves higher accuracy
on classifying animal-caused faults than LR does, and it has a
similar performance on classifying nonanimal-caused faults to
LR’s. Considering the animal fault is the minority class in ourdata and the nonanimal fault is the majority, LR is relatively

8/8/2019 A Classification Approach for Power Distribution Systems Fault Cause Identification
http://slidepdf.com/reader/full/a-classification-approach-for-power-distribution-systems-fault-cause-identification 7/8
XU AND CHOW: CLASSIFICATION APPROACH FOR POWER DISTRIBUTION SYSTEMS 59
Fig. 5. True positive rate comparison.
Fig. 6. True negative rate comparison.
Fig. 7. g-mean comparison.
biased toward the majority data due to the imbalanced data con-
stitution and results in a relatively worse accuracy for the mi-
nority class, which increases the disparities between accuracies
of classifying two classes and then affects the g-mean.
C. Discussions
The Duke Energy outage data are used in this paper; in fact,
the actual distribution outage data in most utilities are verynoisy. The potential data quality problems (caused by the noise)
include inconsistent data entries, inaccurate data entries, incom-
plete data entries, and insuf ficient input factors to distinguish
two different types of faults. In our previous results reported in
[14], we have filtered out all the noises, such as conflicting data,
mis-entry, rare events (e.g., hurricane), etc., in order to focus
on the technology development. As a result, we could achieve
estimation accuracy of about 98% on animal-caused fault inthe Durham region. In order to better reflect the real-world
scenarios, we only filtered out the rare event data in this paper,
while we left all other data (including conflicting data and
inaccurate data) in the database. We achieved 93% estimation
accuracy on animal-caused fault in the Durham region, which
is comparable to an experienced power distribution engineer’s
best estimate on the fault cause identification.
The probability that we are expecting from the clas-
sification module of PDFCC can be actually expressed as
, where denotes
the power distribution fault cause animal,tree , while
, are the influential factors: CI, WE, NP,
PD, SE, and TD. A straightforward way is to calculate this
conditional probability directly from the historical data and
then apply the calculated result on the test data. This approach
will work, provided that enough data are available to calculate
a statistically representative conditional probability given
different event combinations .
In our outage data, (CI) has at least 30 circuit ID num-
bers included, this number differs from one region to another,
(WE) includes 11 weather conditions, (PD) consists of
10 categories, (SE), (TD) and (NP) all have four
possible events, so we need at least 211 200 data samples to
cover every single possible combination of different events, not
to mention statistically representative probabilities calculation.However, the region with most outage records from these seven
selected regions only includes less than 40 000 outage data. So
we will get a lot of zero probabilities and nonrepresentative
conditional probabilities because of data shortage when using
this approach. Alternatives such as approximate reasoning [16]
have been investigated; in this paper, we calculate the likeli-
hood measure , which is the statistically representative con-
ditional probability with respect to individual influential factor
, and then apply classification methods to
implement the mapping from to desired . This method suc-
cessfully overcomes the dif ficulties due to data shortage and
achieves satisfying results.As mentioned in the introduction section, a regular LR is a
parametric model that seldom is used in power system fault di-
agnosis, while ANNis a nonparametric method that hasbeen ex-
tensively used in power systems. LR as a conventional statistical
method has formalized models to exhibit the nonlinear relation-
ship between the independent and dependent variables, while
ANN can increase its flexibility by including hidden layers,
which is often regarded as a substantial advantage of neural
networks [17]. As seen from the results of PDFCC, ANN can
achieve higher balanced accuracy than LR does. Both methods
can be easily implemented by existing software; however, ANN
requires relatively long training time and cross-validation re-
quires even longer computational time, while LR is a muchquicker method.

8/8/2019 A Classification Approach for Power Distribution Systems Fault Cause Identification
http://slidepdf.com/reader/full/a-classification-approach-for-power-distribution-systems-fault-cause-identification 8/8
60 IEEE TRANSACTIONS ON POWER SYSTEMS, VOL. 21, NO. 1, FEBRUARY 2006
VI. CONCLUSION
Power distribution faults significantly affect the reliability
and availability of the services provided by utilities; fast and
proper outage restorations are essential to improve the quality of
services and customer satisfaction. In this paper, we have devel-
oped a PDFCC to demonstrate the application of classification
methods, LR and ANN, on the DukeEnergy outage data for faultcause identification. Two major distribution fault types, tree and
animal contact, are used as prototypes and four metrics, correct
classification rate, true positive rate, true negative rate, and geo-
metric mean, are employed to measure the performance with
two techniques. This paper investigates some practical issues
often faced in power distribution fault cause identification such
as insuf ficient data and imbalanced data constitution as well as
threshold setting. The advantages and disadvantages of the two
techniques under these practical issues are also discussed.
REFERENCES
[1] A. Pahwa, “Role of distribution automation in restoration of distributionsystems after emergencies,” in Proc. IEEE Power Engineering Society
Summer Meeting, vol. 1, 2001 , pp. 737–738.[2] C.-F. Chien, S.-L. Chen, and Y.-S. Lin, “Using Bayesian network for
fault location on distribution feeder,” IEEE Trans. Power Del., vol. 17,no. 3, pp. 785–793, Jul. 2002.
[3] D. Thukaram, H. P. Khincha, andH. P. Vijaynarasimha, “Artificial neuralnetwork and support vector machine approach for locating faults in ra-dial distribution systems,” IEEE Trans. Power Del., vol. 20, no. 2, pp.710–721, Apr. 2005.
[4] S.-J. Lee, M.-S. Choi, S.-H. Kang, B.-G. Jin, D.-S. Lee, B.-S. Ahn,N.-S.
Yoon, H.-Y. Kim, and S.-B. Wee, “An intelligent and ef ficient fault loca-tion and diagnosis scheme for radial distribution systems,” IEEE Trans.
Power Del., vol. 19, no. 2, pp. 524–532, Apr. 2004.[5] O. Dag and C. Ucak, “Fault classification for power distribution sys-
tems via a combined wavelet-neural approach,” in Proc. Int. Conf.Power
System Technology, vol. 2, 2004 , pp. 1309–1314.[6] K. L. Butler and J. A. Momoh, “A neural network based approach for
fault diagnosis in distribution networks,” in Proc. IEEE Power Engi-
neering Society Winter Meeting, vol. 2, 2000, pp. 1275–1278.[7] J.-T. Peng, C. F. Chien, and T. L. B. Tseng, “Rough set theory for data
mining for fault diagnosis on distribution feeder,” Proc. Inst. Elect. Eng.,
Gener., Transm., Distrib., vol. 151, no. 6, pp. 689–697, Nov. 2004.[8] D. Niebur and A. J. Germond, “Power flow classification for static secu-
rity assessment,” in Proc. 1st Int. Forum Applications Neural Networks
Power Systems, 1991, pp. 83–88.[9] Y. Hayashi, S. Iwamoto, S. Furuya, and C.-C. Liu, “Ef ficient determi-
nation of optimal radial power system structure using Hopfield neuralnetwork with constrained noise,” IEEE Trans. Power Del., vol. 11, no.3, pp. 1529–1535, Jul. 1996.
[10] L. Xu, M.-Y. Chow, and L. S. Taylor, “Analysis of tree-caused faults inpower distribution systems,” in Proc 35th North American Power Symp.,
Oct. 20–21, 2003.[11] M.-Y. Chow andL. S. Taylor, “Analysis and preventionof animal-caused
faults in power distribution systems,” IEEE Trans. Power Del., vol. 10,no. 2, pp. 995–1001, Apr. 1995.
[12] J. Han and M. Kamber, Data Mining: Concepts and Techniques. SanMateo, CA: Morgan Kaufmann, 2001.
[13] P. D. Allison, Logistic Regression Using the SAS System. Cary, NC:SAS Institute, 2000.[14] M.-Y. Chow, S. O. Yee, and L. S. Tayler, “Recognizing animal-caused
faults in power distribution systems using artificial neural networks,” IEEE Trans. Power Del., vol. 8, no. 3, pp. 1268–1274, Jul. 1993.
[15] M. Kubat, R. Holte, and S. Matwin, “Machine learning for the detectionof oil spills in radar images,” Mach. Learn., vol. 30, pp. 195–215, 1998.
[16] K. Tomsovic andB. Baer, “Methodsof approximate reasoning forpowersystem equipment condition and reliability analysis,” in Proc. Intelligent
Systems Applications Power Systems, 1996, pp. 310–315.[17] M. Schumacher, R. Robner, and W. Vach, “Neural networks and logistic
regression,” Comput. Stat. Data Anal., vol. 21, pp. 661–701, 1996.[18] S. Santoso and J. D. Lamoree, “Power quality data analysis: From raw
data to knowledge using knowledge discovery approach,” in Proc. IEEE
Power Engineering Society Summer Meeting, vol. 1, 2000, pp. 172–177.
Le Xu (S’01) received the B.Eng. degree in automa-
tion from Tsinghua University, Beijing, China, in2001 and the M.S. degree in electrical engineering
from North Carolina State University (NCSU),Raleigh, in 2003. He is currently working towardthe Ph.D. degree from the Advanced DiagnosisAutomation and Control Laboratory, NCSU.
His research interests include intelligent healthmonitoring of power distribution systems.
Mo-Yuen Chow (S’81–M’82–SM’93) received theB.S. degree in electrical and computer engineeringfrom the University of Wisconsin, Madison, in 1982and the M.Eng. and Ph.D. degrees from Cornell Uni-versity, Ithaca, NY, in 1983 and 1987, respectively.
Upon completion of the Ph.D. degree, he joinedthe Department of Electrical and Computer Engi-neering, North Carolina State University (NCSU),Raleigh, and has held the rank of Professor since
1999. His core technology is diagnosis and control,artificial neural networks, and fuzzy logic with
applications to areas including motors, process control, power systems, andcommunication systems. He established the Advanced Diagnosis Automationand Control Laboratory at NCSU.