a century of cities by professor nicholas crafts
TRANSCRIPT


Cities and the UK Economy: 19th Century vs. 21st Century
Nicholas Crafts

Globalization
• Integration of markets based on falling transport and communications costs and/or trade liberalization
• Economic activity relocates but geography still matters; proximity to markets is an advantage
• 2 big episodes: 19th-century and late-20th century
• These have important differences: 1st Unbundling vs. 2nd Unbundling

2 Unbundlings (Baldwin 2012)
• 1st Unbundling: production and consumption of manufactures in very different locations
• Classic example: Lancashire cotton in the steam age
• 2nd Unbundling: stages of production of manufactures in very different places; more complex value chains
• Classic example: ‘German car’ in the ICT era

Shares of World Industrial Production (%)
China India UK Rest of Europe
USA
1750 33 24 2 15 0.1
1830 30 18 10 18 2
1880 12 3 23 30 15
1913 4 1 14 34 32
1953 2 2 8 18 45
2010 15 2 3 21 25
Sources: Bairoch (1982), UNIDO (2012)

Death of Distance?
• Would have truly dramatic effect on world distribution of economic activity and income
• But “greatly exaggerated”
• ICT enables some things to go to the periphery (‘the 2nd unbundling’) but enhances the strengths of the core at the same time
• Like steam, ICT rearranges geography but doesn’t abolish it

Competitive Advantage
• In internationally-traded sectors, countries specialize in activities where they have a cost advantage
• Factor endowments, technological leads, and agglomerations can deliver this
• Changes over time: for UK has moved from manufactures to services and is now more knowledge-based
• Spatial adjustment is part of this

Shares of Manufactured Exports (%)
1913 1955 1973 2013
China 0.6 0.7 17.5
Japan 2.4 3.9 10.0 5.3
UK 26.9 17.9 7.1 3.0
USA 11.1 26.1 16.1 9.5

Agglomeration Externalities
• Marshallian (localization) based on specialization
• Jacobean (urbanization) based on diversity
• Raise productivity and explain why cities exist
• Accrue through learning, matching and sharing

Optimal Size of City
• Productivity increases with city size initially
• Gains from externalities but losses from congestion; optimal size is at top of net wage curve
• City size may be sub-optimal if restricted by regulation or inadequate transport
• CBA should try to quantify ‘wider economic benefits’ well

Welfare Loss
NW3
NW2
NW1
NANB N
New Net Wage Curve
Welfare Loss
Old Net WageCurve
A
B
A1
NW

De-Industrialization• Common experience of advanced
economies and has been continuous in Britain since the late 1960s
• Reflects demand growth, productivity performance and comparative advantage
• Accelerated with move away from protectionism
• Structure of employment has changed greatly over the long run

Employment Shares (%)
1911 1951 1979 2014
Agriculture 11.8 6.4 2.8 1.3
Industry 44.1 44.5 37.0 15.3
Services 44.1 49.1 60.2 83.4

Detailed Employment Shares (1) (%)
1911 1951 1979 2014
Textiles & Clothing 12.4 7.1 2.9 0.3
Engineering 6.7 11.2 8.6 2.1
Metal Manufactures 4.1 4.6 4.9 1.5

Detailed Employment Shares (2) (%)
1911 1951 1979 2014
Financial & Business Services
1.1 3.5 9.2 24.2
Education 1.5 1.5 5.8 8.6
Health 0.7 1.7 5.6 7.2

UK Comparative Advantage
• Has changed markedly over time
• Victorian staples were neither high-tech nor human-capital intensive but today’s manufactured exports are often both
• World market share in services is now twice that in manufactures
• Responding to these changes requires both sectoral and spatial adjustment
• Agglomeration plays a key role

Revealed Comparative Advantage in Manufacturing: Top 3 Sectors
1913 1937 1979 2008
Rail & ShipAlcohol & Tobacco Aerospace Pharmaceuticals
Textiles Textiles Pharmaceuticals Aerospace
Iron & Steel Rail & Ship Office Machinery Stone & Glass

Revealed Comparative Advantage, 2008: Top 6
Financial Services 1
Insurance 2
Communication Services 3
Personal, Cultural & Recreational Services
4
Other Business Services 5
Pharmaceuticals 6
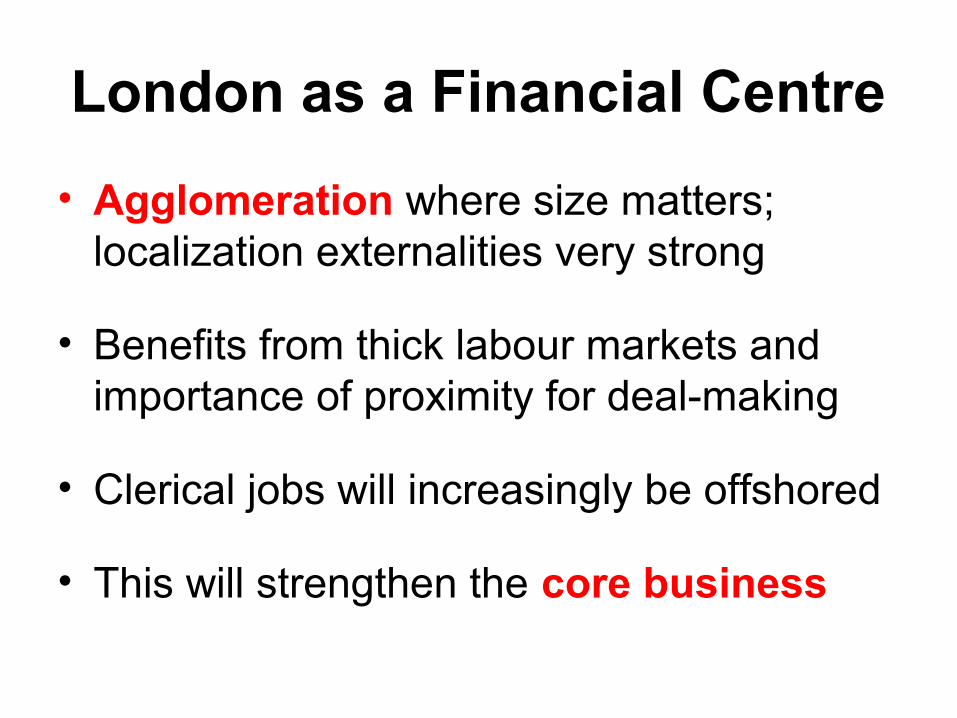
London as a Financial Centre
• Agglomeration where size matters; localization externalities very strong
• Benefits from thick labour markets and importance of proximity for deal-making
• Clerical jobs will increasingly be offshored
• This will strengthen the core business

19th-Century Industrial Location Decisions (Crafts & Mulatu, 2006)
• Proximity to sources of power (water, coal/steam) in world without electricity
• Proximity to the steam-age transport network in era prior to industrial combustion engine
• Market access (both domestic and foreign) mattered for the ‘workshop of the world’
• High spatial concentration in many industries and regional specialization in ‘Outer Britain’

Location of 19th- Century Cotton Textiles (Crafts & Wolf, 2014)
• In 1850, UK had 69% world spindles (58% in 1900)
• In 1850 Lancashire had 66% of UK spindles (79% in 1903) and about 46% of world spindles (same in 1903)
• Cotton is classic example of core-periphery in the ‘1st Unbundling’
• Lancashire dominated on the basis of ‘second-nature’ geography

22

Why Lancashire?: Traditional
• “The original advantages of Lancashire comprised its poverty, its climate, its water supply, its textile tradition and its mechanical inventions. The acquired advantages included its supply of coal, machinery and labour, its access to the markets of Liverpool and Manchester, its low transport cost, and its auxiliary industries” (Farnie, 1979)
• Modern analysis confirms most of these points
23

24

25

26

Why Lancashire?: Econometrics
• Celtic fringes have better 1st-nature attributes apart from cheap coal; it’s definitely not humidity
• Adequate cheap source of power is ‘necessary condition’ but market access has powerful effect
• Cotton industry concentrates on a subset of its original locations to which it becomes ‘locked in’

Lancashire Textiles and Globalization (Leunig, 2005)
• Lancashire a high wage industry: 6 x India and Japan in 1910
• But continued to dominate world trade (60% world market share in cottons in 1910)
• Unit costs lower than India or Japan even before adjusting for output quality
• Lancashire flourished because of agglomeration externalities which ROW could not replicate ... its productivity exceeded other British locations by 33%

Why Lancashire?: Policy
• Growth of Lancashire agglomeration not constrained by land-use planning regulations; successful towns grew very fast
• Growth was supported by private-sector major transport investment facilitated by parliament
• (Somewhat belated) provision of local public goods reduced health risks and supply price of labour

Agglomeration Externalities pre-World War I
• Were almost entirely Marshallian
• Increased specialization in American cities raised labour productivity by over 20% between 1890-1920 (Klein & Crafts, 2015)
• Transport innovations underpinned this
• Increased diversity reduced labour productivity in American cities of fewer than 800,000 people at this time

Legacy of the First Industrialization
• An industrial geography that created a major adjustment challenge
• Cities that need to develop new specializations; better chance of success with strong human capital
• Too much urban population in the North as market potential changed

Division of Germany after WWII: City Growth (Redding and Sturm, 2008)
• Natural experiment: market access changed by prohibition of trade across border
• Population growth in border cities 33% lower than other West German cities during 1950-88
• Entirely explained by decline in market potential
• Less dramatic natural experiment is UK entry into EEC which favours SE (Overman & Winters, 2011)
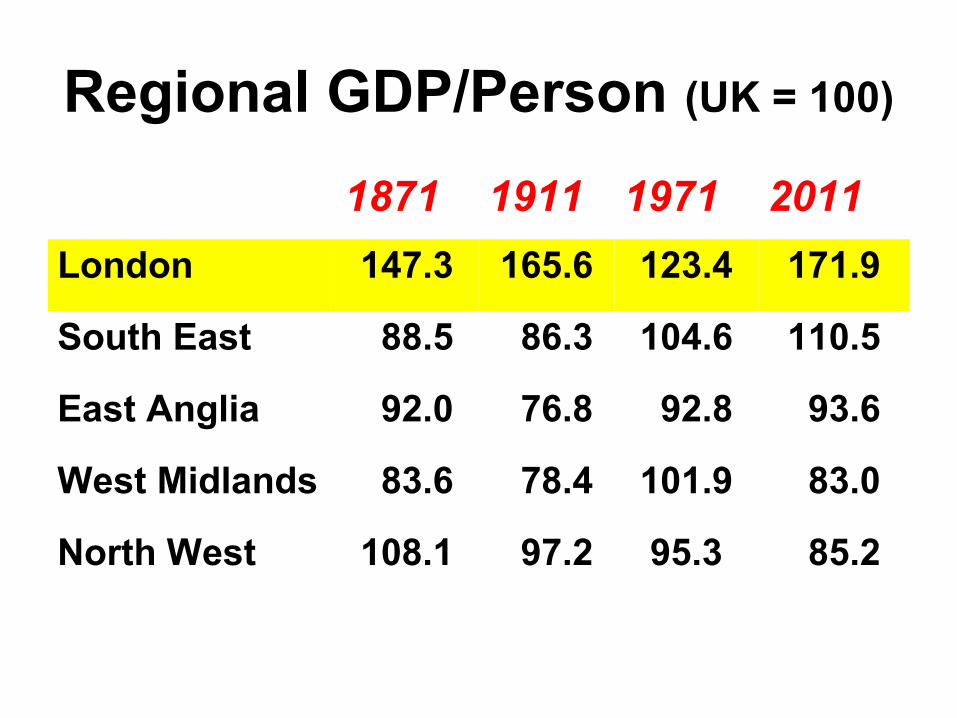
Regional GDP/Person (UK = 100)
1871 1911 1971 2011
London 147.3 165.6 123.4 171.9
South East 88.5 86.3 104.6 110.5
East Anglia 92.0 76.8 92.8 93.6
West Midlands 83.6 78.4 101.9 83.0
North West 108.1 97.2 95.3 85.2

Regional Disparities
• Big differences in regional GDP/head partly explained by demography, employment, prices
• To a large extent, productivity reflects people (sorting) rather than place
• Nevertheless, the South East does have a productivity advantage
• Increased by globalization which favours London (then and now)

Wage Differences across Labour Market Areas (%)
Min-Max P90-P10 P75-P25
Raw Data 61.7 22.0 10.6
Controlled for Sorting
17.3 7.3 3.8
Source: Gibbons et al. (2014)

TFP in Cities and Regions Today (Harris & Moffat, 2012)
• All other regions lower than South East
• Cities have higher TFP than their regions
• In a services-based economy, specialization still by far the most important source of agglomeration externalities
• Hi-Tech manufacturing does have significant Jacobean externalities (in Nursery Cities?)

Externality Elasticities, 1997-2006 (%)
Specialization Diversity
Hi-Tech Manufacturing -3.4 19.3**
Hi-Tech KI Services 5.8* -16.7
Medium Hi-Tech Manufacturing 6.5*** -9.4***
KI Market Services 6.8** -16.8***
Medium Low-Tech Manufacturing -3.6** -18.5**
Low KI Services 0.3 0.2
Source: Harris and Moffat (2012)

Agglomeration Externalities in Core Cities
(%)
Manufacturing Services
Birmingham 5.5 2.9
Coventry 5.4
Edinburgh 3.6
Glasgow 2.9
Source: Harris and Moffat (2012); cities included only if big enough to make TFP significantly higher than in SE.

Implications
• Policies that restrict the South East have a significant productivity penalty
• Successful cities will be flexible enough to develop successive specializations and big enough to exploit external economies of scale
• Clusters (but not too many in the same place) should be facilitated

Sub-Optimal Size of British Cities
• Successful cities expanded dramatically in 19th century but not post WWII; (Blackburn and Preston vs. Oxford and Cambridge)
• Both expansion and contraction distorted by inappropriate policy interventions
• Key symptom of city that is too small; high urban land values

Full Relaxation of Planning Controls on Housebuilding
• In new equilibrium, average real English house price would fall by 35% and housing stock rise by 17% (Hilber & Vermeulen, 2012; NHPAU, 2007)
• Around southern cities, value of land for housing is 300-400 times its value for agriculture so efficiency gains substantial (Nickell, 2009)
• The main costs of housing-market distortions from land-use planning rules accrue in the SE

Value Chains
• Now more complex and more globalized
• Big ‘manufacturers’, e.g., Rolls-Royce, make a lot of their money from services
• Need much better metrics to understand how these input-output connections and co-location decisions
• ‘Rebalancing’ should not be conceptualized simply in terms of ‘manufacturing’ – business services is where ‘real engineering’ will be

2012 value chain
1970s value chain
Product concept, Design, R&D
Manufacturing stages
Sales, marketing and after sales services
Stage
Share of value added
Smile-Curve Economics:• Fabrication stages become commoditized• Value shifts to pre- and post-fabrication services

% Breakdown of Nokia Phone Price, 2007 (Ali-Yrkko et al., 2011)
Nokia’s Intangibles 47
Physical Components 33
Distribution 14
Licenses and Software 4
Final Assembly 2

Successful Cities
• Likely to be fundamental to competitive advantage in the ICT world
• Portfolio might comprise mainly ‘talent towns’, a few ‘cosmopolitan centres’, and London (cf. The Netherlands of 2040)
• Have agglomeration advantages that are hard to replicate
• Underpinned by good horizontal industrial policies in human capital, planning and transport

Planning Rules Matter
• An important horizontal ‘industrial policy’
• Planning restrictions impose massive distortions in land use – regulatory tax rate of around 300% makes office space in Manchester more expensive than Manhattan (Cheshire & Hilber, 2008)
• Successful British cities are too small and constraints on growth threaten to undermine competitive advantage
• Spatial adjustment to globalization is inhibited

The Industrial Policy Challenge
• Context has changed: value chains and greater capital mobility; think about stages as well as sectors of production – who wants to do what, where, and why?
• Aim is to capture high-value added parts of the value chain and make these activities ‘sticky’ by accruing agglomeration externalities
• Urban policy is key: human capital, infrastructure and regulation should be focal points

Conclusions
• Cities today raise productivity much as they did in the past…mainly through Marshallian externalities
• Today’s optimal portfolio of cities and the activities in which they specialize is very different from that of a century ago
• Flexible adjustment to globalization was important to 19 th-century British economic success and should be facilitated in the 21st century
• The land-use planning system undermines productivity and needs serious reform
