a case study on the use of social electricity by cypriot...
TRANSCRIPT

A Case Study on the Use of SocialElectricity by Cypriot Residents
Technical Report No. TR-13-1
Andreas Kamilaris, Marios Michael, Andreas Pitsillides and
Christos Fidas{kami, mmicha17, cspitsil, christos.fidas}@cs.ucy.ac.cy
NETworks Research Laboratory
Department of Computer ScienceUniversity of Cyprus
September 2013

Abstract
This technical report describes the analysis of results gathered through a large questionnaire-based survey combined with mini focus group studies, focusing on the investigation of userperceptions related to several aspects of Social Electricity, six months after its official release.This study provides interesting insights about the usefulness and acceptance of large-scale,green ICT social applications, as well as their potential for affecting energy awareness andencouraging users to become more sensitive about the environment.

Table of contents
1 Introduction 2
2 Method of Study 52.1 Procedure . . . . . . . . . . . . . . . . . . . . . . . . . . . . . . . . . . . . . . . 52.2 Demographics of Participants . . . . . . . . . . . . . . . . . . . . . . . . . . . . . 6
3 Analysis of Online Questionnaires 73.1 Usefulness and Effectiveness . . . . . . . . . . . . . . . . . . . . . . . . . . . . . . 73.2 Motivations . . . . . . . . . . . . . . . . . . . . . . . . . . . . . . . . . . . . . . 93.3 Privacy . . . . . . . . . . . . . . . . . . . . . . . . . . . . . . . . . . . . . . . . . 103.4 Potential . . . . . . . . . . . . . . . . . . . . . . . . . . . . . . . . . . . . . . . . 123.5 Summary of Findings . . . . . . . . . . . . . . . . . . . . . . . . . . . . . . . . . 13
4 Analysis of Focus Groups 154.1 Phase A: Current Status of Social Electricity . . . . . . . . . . . . . . . . . . . . . 154.2 Phase B: Requirements Elicitation for Future Releases . . . . . . . . . . . . . . . . 16
5 Conclusion 18
Bibliography 18
List of Figures
1.1 Snapshot of Social Electricity showing user’s friends/their consumptions on themap. . . . . . . . . . . . . . . . . . . . . . . . . . . . . . . . . . . . . . . . . . . 3
1.2 Comparison of the personal electrical consumption of the user with his neigbor-hood, city and with the whole of Cyprus. . . . . . . . . . . . . . . . . . . . . . . 4
1.3 Comparison of electrical consumption with previous months or the same monthin previous years, including also the energy figures of the online friends of the user. 4
2.1 Age distribution of participants. . . . . . . . . . . . . . . . . . . . . . . . . . . . 6
3.1 Distribution of the answers of the participants in the question whether theyfound Social Electricity useful as an application. . . . . . . . . . . . . . . . . . . 7
3.2 Distribution of the answers of the participants in the question whether theyunderstood their energy behaviour after comparing with others. . . . . . . . . . 8
3.3 Distribution of the answers of the participants in the question whether the energyfigures of their street have been improved since the launch of Social Electricity. . 9
3.4 Distribution of the answers of the participants in the question how often theyuse Social Electricity. . . . . . . . . . . . . . . . . . . . . . . . . . . . . . . . . . 10
3.5 Distribution of the answers of the participants in the question whether SocialElectricity respects their privacy. . . . . . . . . . . . . . . . . . . . . . . . . . . 11
3.6 Privacy concerns of users in regard to with whom to share their consumption datain neighborhood level (left-top), house level (right-top) and detailed consumptionof their appliances (bottom). . . . . . . . . . . . . . . . . . . . . . . . . . . . . . 12
3.7 Distribution of the answers of the participants in the statement whether utilitieshave a duty to offer comparative feedback services to their customers. . . . . . . 13

Chapter 1Introduction
According to various scientific studies, such as [3], energy awareness through timely electricalconsumption feedback can influence residents to reduce their electrical consumption by a frac-tion of 5-15%. However, still, people may not clearly consider quantitatively how much energythey consume. They do not possess the proper metrics to define whether their total consump-tion is low, average or high. Besides, in most countries around the world, people receive anelectricity bill only once every month, and they cannot realize the semantics of their electricityfootprint. Feedback alone is not enough, since people tend to lose their interest after someweeks [2].
A promising way for consumers to perceive their consumed energy is to compare it withthe amount consumed by relatives, friends and neighbors. Comparative feedback is an effectiveapproach for engaging people in sustainable actions and practices [4]. Comparative feedbackexploits the phenomenon of social norms, and in particular normative social influence, accordingto which people have a tendency to agree on the values, beliefs, attitudes or behaviors of others[1]. Applying social norms in the energy use behavior of consumers, they may affect them toreduce their consumption in case they understand that it is ”not normal”.
For developing green online applications, social networking sites are suitable platforms foroffering comparative feedback, as they maintain a highly accurate graph of users’ social networksand friends. Online social networks are easy to access, widely used and largely accepted byusers.
Having these in mind, we have developed Social Electricity, which is a Facebook application1
that allows people to perform comparisons of their electrical consumption. By effective andrealistic comparisons with friends and neighbors, consumers may perceive their energy behaviorand take steps to reduce their electricity and carbon footprint.
We collaborated with the Electricity Authority of Cyprus2 (EAC), which is the only electricutility in Cyprus. EAC gave us access to the consumption data of around 300,000 domesticpremises of the country, collected every two months. More frequent updates are not yet possible,because EAC has still not upgraded its electrical meters to smart meters. Respecting the privacyof Cypriot citizens, the electricity measurements were aggregated at street level (address, postalcode, city). Thus, it could not possible to derive the analytic consumption of some residence.Of course, residents are encouraged to add by themselves their exact monthly consumption,and compare it with their local neighborhood or their friends.
In detail, Social Electricity supports the following features:
1https://apps.facebook.com/socialelectricity/2http://www.eac.com.cy/
3
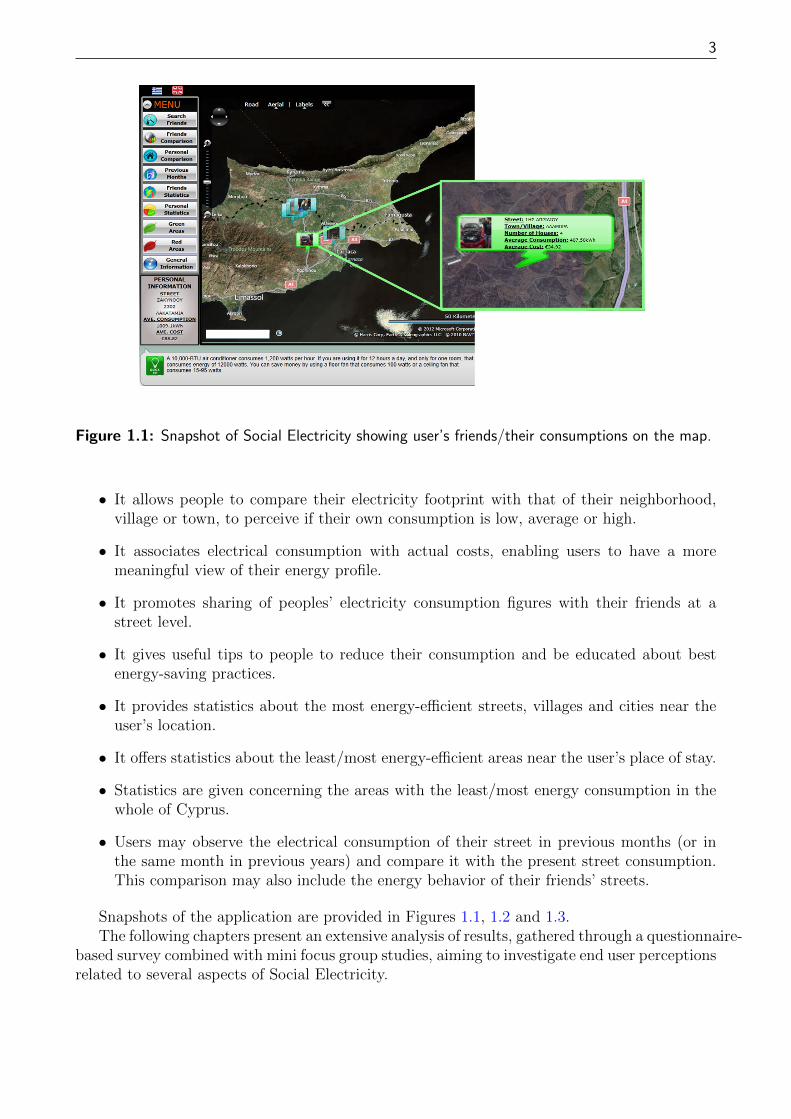
Figure 1.1: Snapshot of Social Electricity showing user’s friends/their consumptions on the map.
• It allows people to compare their electricity footprint with that of their neighborhood,village or town, to perceive if their own consumption is low, average or high.
• It associates electrical consumption with actual costs, enabling users to have a moremeaningful view of their energy profile.
• It promotes sharing of peoples’ electricity consumption figures with their friends at astreet level.
• It gives useful tips to people to reduce their consumption and be educated about bestenergy-saving practices.
• It provides statistics about the most energy-efficient streets, villages and cities near theuser’s location.
• It offers statistics about the least/most energy-efficient areas near the user’s place of stay.
• Statistics are given concerning the areas with the least/most energy consumption in thewhole of Cyprus.
• Users may observe the electrical consumption of their street in previous months (or inthe same month in previous years) and compare it with the present street consumption.This comparison may also include the energy behavior of their friends’ streets.
Snapshots of the application are provided in Figures 1.1, 1.2 and 1.3.The following chapters present an extensive analysis of results, gathered through a questionnaire-
based survey combined with mini focus group studies, aiming to investigate end user perceptionsrelated to several aspects of Social Electricity.

4
Figure 1.2: Comparison of the personal electrical consumption of the user with his neigborhood,city and with the whole of Cyprus.
Figure 1.3: Comparison of electrical consumption with previous months or the same month inprevious years, including also the energy figures of the online friends of the user.
Chapter 2Method of Study
In this chapter, we present a user study aiming to investigate users’ perceptions relating to var-ious aspects of Social Electricity, along with the effects of performing comparative feedback toaffect citizens towards energy conservation. Our study aimed to address the following researchquestions:
• How effective and useful is the concept of Social Electricity for raising energy awareness?
• What are the motivations influencing people to reduce their consumption?
• Which are the privacy concerns and the limits for sharing electricity consumption datain a large-scale social application?
• What is the potential of ICT applications that employ normative social influence?
2.1 Procedure
A survey was conducted to collect empirical evidence on the importance of quality factorsrelating to the usage of the application. We formed an online questionnaire consisting of 65questions. The research questions were grouped in five categories: demographics (sex, age,education, income), usefulness and influence, motivations, privacy and potential. A five-pointLikert scale was used to rank the level of importance from ”Not Important (1)” up to ”MostImportant (5)”.
Furthermore, semi-structured mini focus group sessions [5] were conducted with the par-ticipants’ subjective preferences and perceptions of the provided features, and their influencetowards energy awareness. The sessions have been directed by one objective interviewer andminutes were recorded by one observer. The focus group sessions have been organized in twophases. The first phase consisted of a discussion around the research questions of the evalua-tion. The second phase involved free brainstorming, in which the groups were encouraged tosuggest enhancements for further engaging users towards energy savings.
The participants were recruited by sending an invitation through email to users who wereusing the application for more then two months. To increase the overall participation, weoffered six energy meters to some of our subjects after a lottery.
2.2. Demographics of Participants 6
Male Female 18-24 25-34 35-49 50-64N 125 72 62 98 32 5% 63.4 36.6 31.4 49.7 16.2 2.5
Table 2.1: Demographics of the sample.
2.2 Demographics of Participants
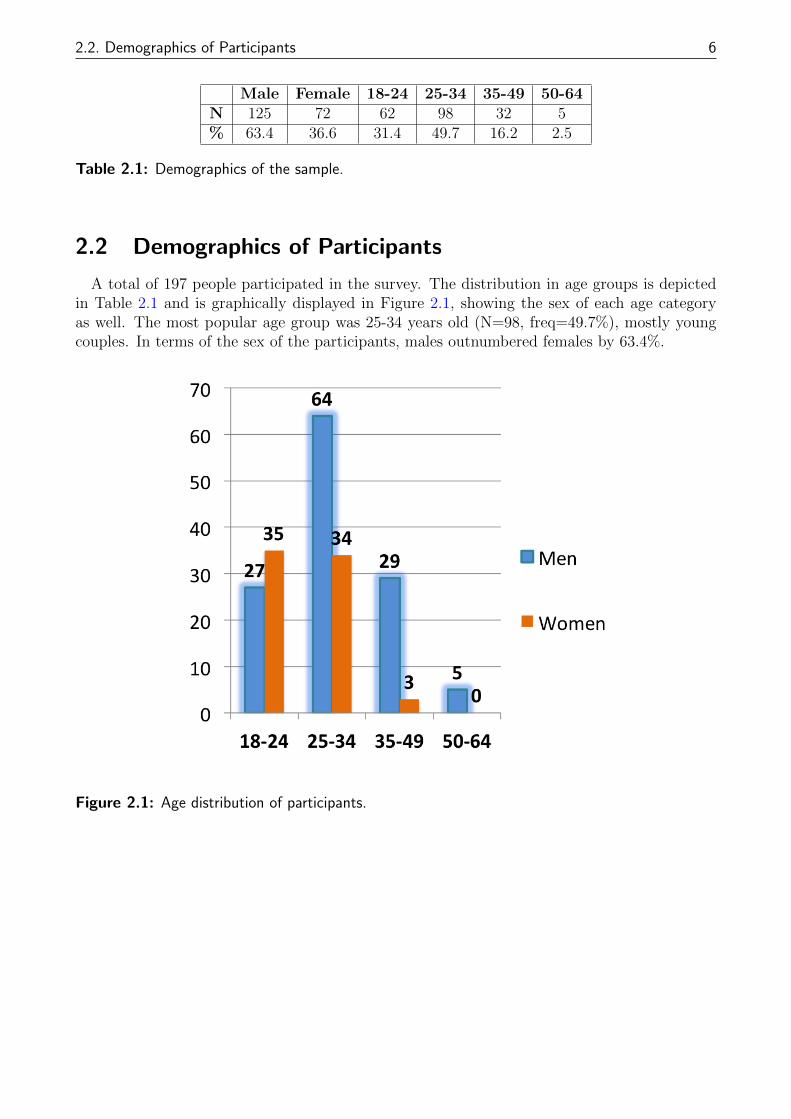
A total of 197 people participated in the survey. The distribution in age groups is depictedin Table 2.1 and is graphically displayed in Figure 2.1, showing the sex of each age categoryas well. The most popular age group was 25-34 years old (N=98, freq=49.7%), mostly youngcouples. In terms of the sex of the participants, males outnumbered females by 63.4%.
Figure 2.1: Age distribution of participants.

Chapter 3Analysis of Online Questionnaires
The findings derived from the online questionnaires are discussed in the following sections,categorized according to the main research questions as listed in the previous chapter. Thestatistical significant results obtained after an analysis of the responses, are listed at the endof the chapter in Section 3.5, Table 3.2.
3.1 Usefulness and Effectiveness
From our 198 subjects, 82% found Social Electricity useful as a green ICT application(M=4.22, SD=0.83 on a 5-point scale, 5 being ”Very Useful”), as presented in Figure 3.1.A statistical analysis proved that male found it significantly more useful in relation to female(Mann-Whitney Test, U=5.658, Z=3.12, p=0.02). More than half of the users (57%) claimedthey were positively affected to become more energy-aware (M=3.59, SD=1.10).
Figure 3.1: Distribution of the answers of the participants in the question whether they foundSocial Electricity useful as an application.
Moreover, 79% of the users declared they perceived their energy behavior and understoodwhether they consume low, medium or high amounts of electrical energy (M=4.0, SD=0.90 on a

3.1. Usefulness and Effectiveness 8
5-point scale, 5 being ”Understood Very Well”), as shown in Figure 3.2. A significant percentageof 63% claimed their consumption was reduced in regard to the same period last year. Thisis another positive fact indicating a possible initial success of Social Electricity, however, weneed to take into account that there is an overall decrease in electrical consumption aroundthe country, due to different weather conditions, the financial crisis and the increasing cost ofelectricity.
Figure 3.2: Distribution of the answers of the participants in the question whether they understoodtheir energy behaviour after comparing with others.
A percentage of 18% believed their energy consumption is high, in comparison to their neigh-bors and friends. This is apparently the main target group that needs to become more awareabout energy consumption. The remaining, 59% believed they had an average consumptionwhile 23% a low consumption. The percentage of users with low consumption was larger thanthose with high (23%), possibly because users of such applications are more environmentally-aware, as this finding was observed as well in [6].
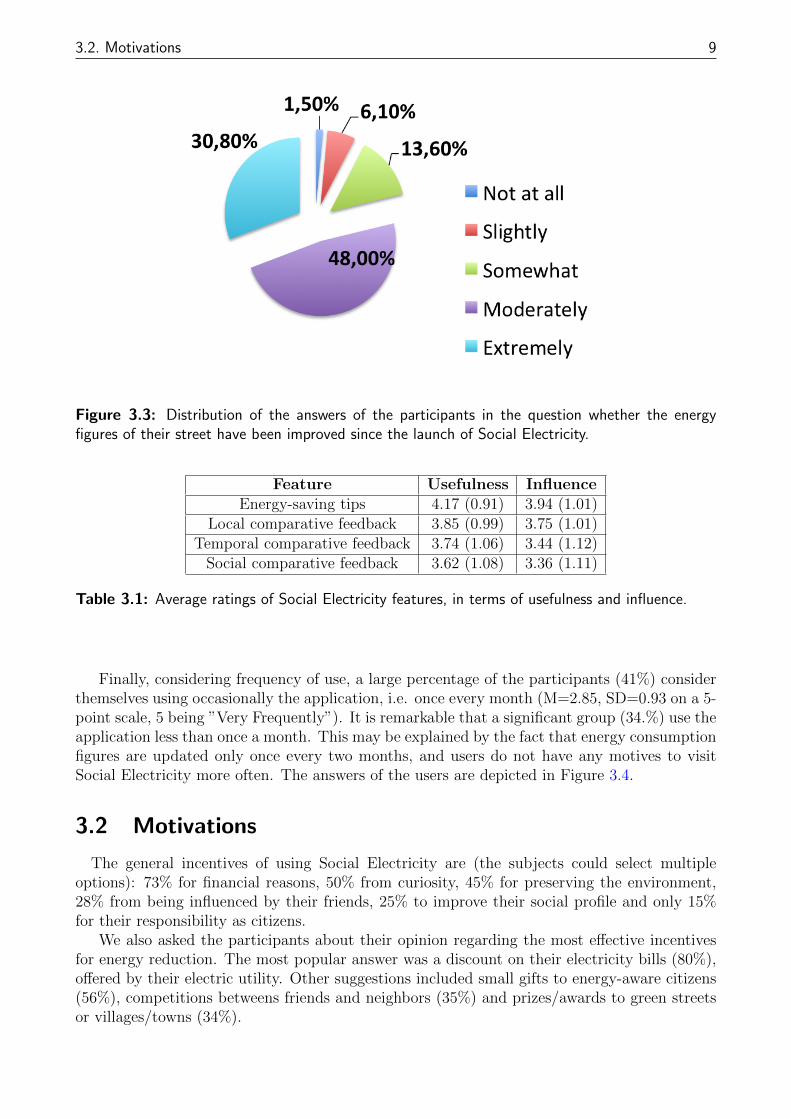
We also asked the participants whether the energy consumption of their street, as observedthrough the historical comparison feature of the application, was improved since the start ofthe application. A rather small percentage of 30% found the figures of their area to improve,and this is rational, if we consider that the contribution of each user to the consumption of hisneighborhood is only small. The detailed answers of the users can be observed in Figure 3.3.
Table 3.1 shows the usefulness and influence of each of the features of Social Electricity tothe users (average ratings and standard deviations on a 5-point scale, 5 being ”Very Useful”or ”Very Influential”). The findings indicate that users prefer simple and easy to understandmeasures such as tips for saving energy and comparisons with their neighbors. Interestingly,social comparisons come last in their preferences. Moreover, different age groups are affected bydifferent features. As our analysis showed, the age group 18-24 was significantly affected by theenergy-saving tips (r(60)=403 , p=0.001), while the age group 35-49 by temporal comparativefeedback (r(30)=-386 , p=0.029).
More than half of the users (57%) are aware of their green and red friends. Around 37%claimed they discussed with three or more of these friends about topics related to energy and/orelectricity. This is a sign that a fruitful discussion for energy conservation has been triggered.
3.2. Motivations 9
Figure 3.3: Distribution of the answers of the participants in the question whether the energyfigures of their street have been improved since the launch of Social Electricity.
Feature Usefulness InfluenceEnergy-saving tips 4.17 (0.91) 3.94 (1.01)
Local comparative feedback 3.85 (0.99) 3.75 (1.01)Temporal comparative feedback 3.74 (1.06) 3.44 (1.12)
Social comparative feedback 3.62 (1.08) 3.36 (1.11)
Table 3.1: Average ratings of Social Electricity features, in terms of usefulness and influence.
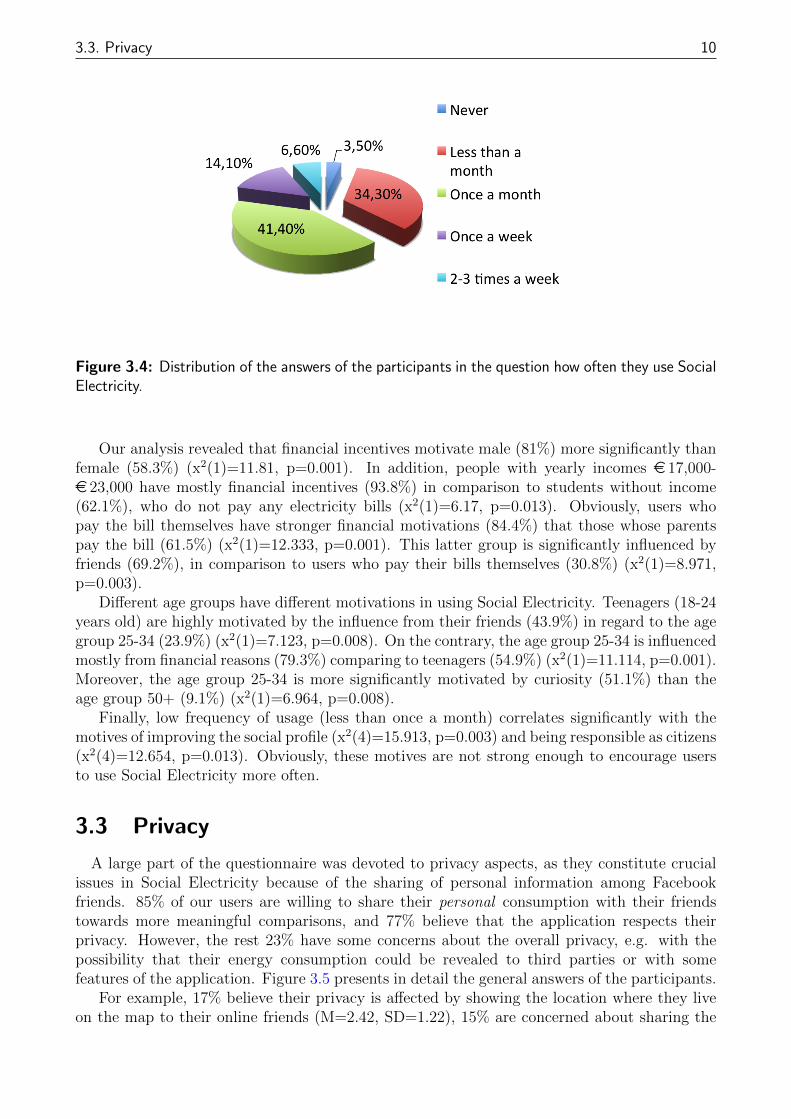
Finally, considering frequency of use, a large percentage of the participants (41%) considerthemselves using occasionally the application, i.e. once every month (M=2.85, SD=0.93 on a 5-point scale, 5 being ”Very Frequently”). It is remarkable that a significant group (34.%) use theapplication less than once a month. This may be explained by the fact that energy consumptionfigures are updated only once every two months, and users do not have any motives to visitSocial Electricity more often. The answers of the users are depicted in Figure 3.4.
3.2 Motivations
The general incentives of using Social Electricity are (the subjects could select multipleoptions): 73% for financial reasons, 50% from curiosity, 45% for preserving the environment,28% from being influenced by their friends, 25% to improve their social profile and only 15%for their responsibility as citizens.
We also asked the participants about their opinion regarding the most effective incentivesfor energy reduction. The most popular answer was a discount on their electricity bills (80%),offered by their electric utility. Other suggestions included small gifts to energy-aware citizens(56%), competitions betweens friends and neighbors (35%) and prizes/awards to green streetsor villages/towns (34%).
3.3. Privacy 10
Figure 3.4: Distribution of the answers of the participants in the question how often they use SocialElectricity.
Our analysis revealed that financial incentives motivate male (81%) more significantly thanfemale (58.3%) (x2(1)=11.81, p=0.001). In addition, people with yearly incomes e 17,000-e 23,000 have mostly financial incentives (93.8%) in comparison to students without income(62.1%), who do not pay any electricity bills (x2(1)=6.17, p=0.013). Obviously, users whopay the bill themselves have stronger financial motivations (84.4%) that those whose parentspay the bill (61.5%) (x2(1)=12.333, p=0.001). This latter group is significantly influenced byfriends (69.2%), in comparison to users who pay their bills themselves (30.8%) (x2(1)=8.971,p=0.003).
Different age groups have different motivations in using Social Electricity. Teenagers (18-24years old) are highly motivated by the influence from their friends (43.9%) in regard to the agegroup 25-34 (23.9%) (x2(1)=7.123, p=0.008). On the contrary, the age group 25-34 is influencedmostly from financial reasons (79.3%) comparing to teenagers (54.9%) (x2(1)=11.114, p=0.001).Moreover, the age group 25-34 is more significantly motivated by curiosity (51.1%) than theage group 50+ (9.1%) (x2(1)=6.964, p=0.008).
Finally, low frequency of usage (less than once a month) correlates significantly with themotives of improving the social profile (x2(4)=15.913, p=0.003) and being responsible as citizens(x2(4)=12.654, p=0.013). Obviously, these motives are not strong enough to encourage usersto use Social Electricity more often.
3.3 Privacy
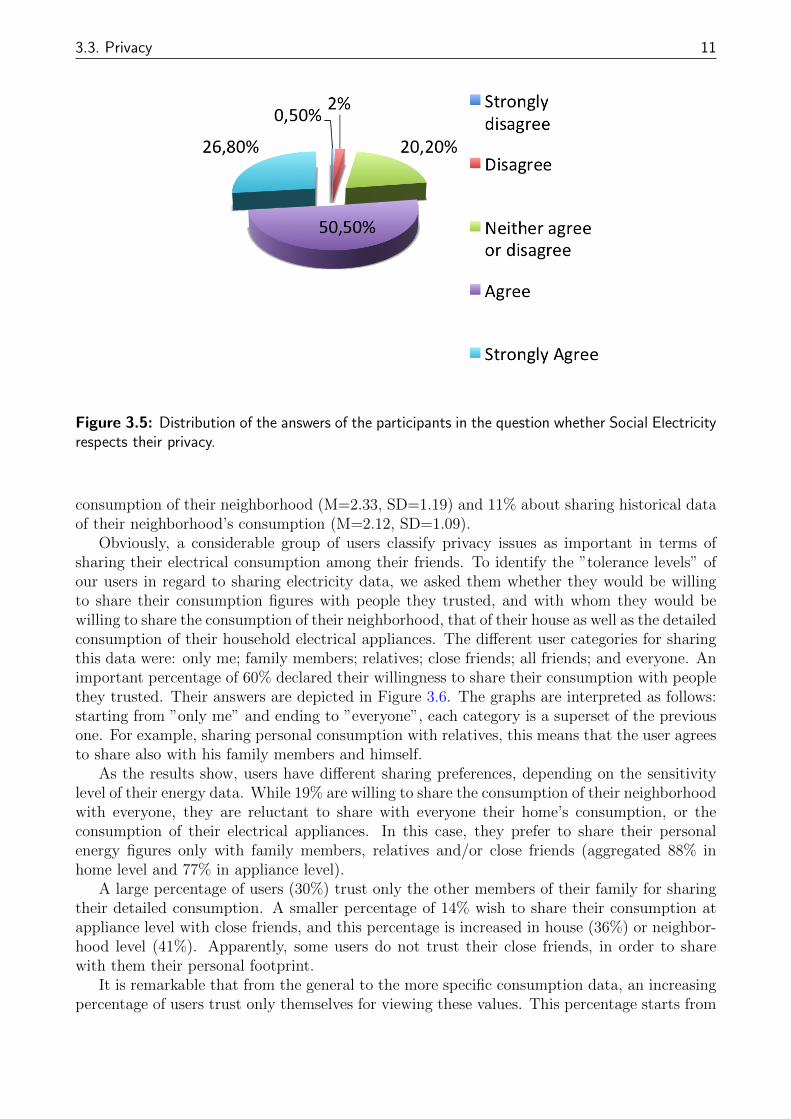
A large part of the questionnaire was devoted to privacy aspects, as they constitute crucialissues in Social Electricity because of the sharing of personal information among Facebookfriends. 85% of our users are willing to share their personal consumption with their friendstowards more meaningful comparisons, and 77% believe that the application respects theirprivacy. However, the rest 23% have some concerns about the overall privacy, e.g. with thepossibility that their energy consumption could be revealed to third parties or with somefeatures of the application. Figure 3.5 presents in detail the general answers of the participants.
For example, 17% believe their privacy is affected by showing the location where they liveon the map to their online friends (M=2.42, SD=1.22), 15% are concerned about sharing the
3.3. Privacy 11
Figure 3.5: Distribution of the answers of the participants in the question whether Social Electricityrespects their privacy.
consumption of their neighborhood (M=2.33, SD=1.19) and 11% about sharing historical dataof their neighborhood’s consumption (M=2.12, SD=1.09).
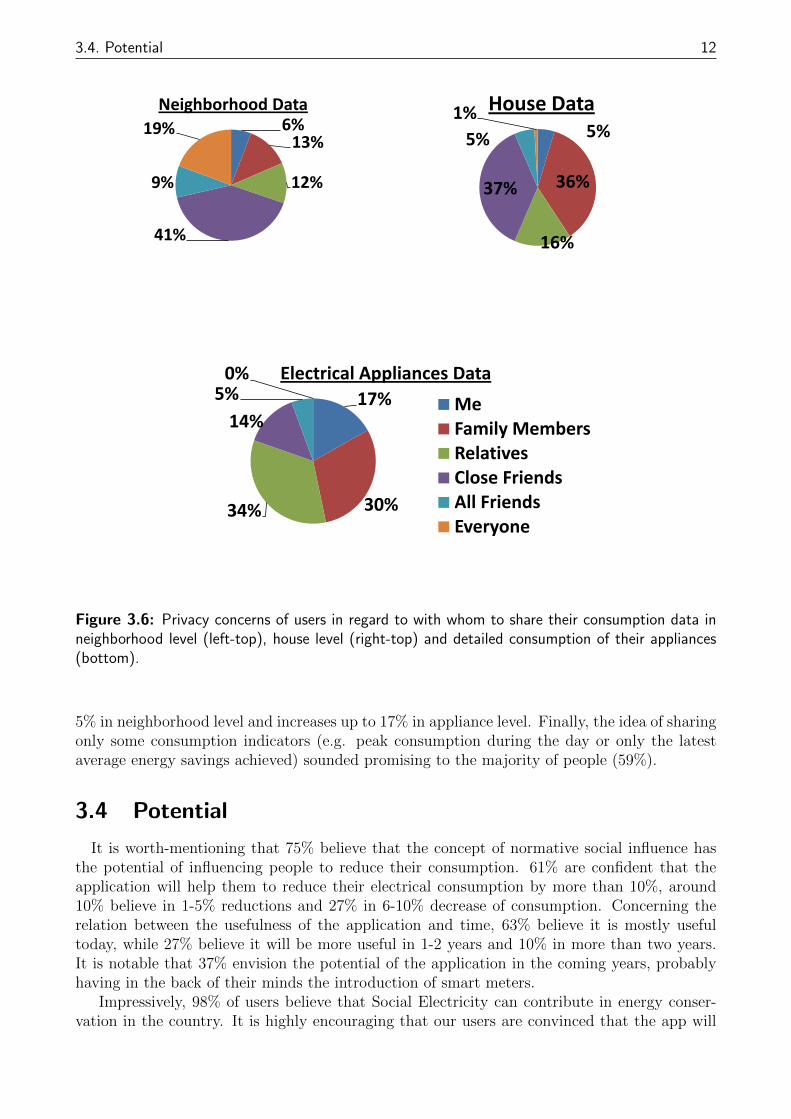
Obviously, a considerable group of users classify privacy issues as important in terms ofsharing their electrical consumption among their friends. To identify the ”tolerance levels” ofour users in regard to sharing electricity data, we asked them whether they would be willingto share their consumption figures with people they trusted, and with whom they would bewilling to share the consumption of their neighborhood, that of their house as well as the detailedconsumption of their household electrical appliances. The different user categories for sharingthis data were: only me; family members; relatives; close friends; all friends; and everyone. Animportant percentage of 60% declared their willingness to share their consumption with peoplethey trusted. Their answers are depicted in Figure 3.6. The graphs are interpreted as follows:starting from ”only me” and ending to ”everyone”, each category is a superset of the previousone. For example, sharing personal consumption with relatives, this means that the user agreesto share also with his family members and himself.
As the results show, users have different sharing preferences, depending on the sensitivitylevel of their energy data. While 19% are willing to share the consumption of their neighborhoodwith everyone, they are reluctant to share with everyone their home’s consumption, or theconsumption of their electrical appliances. In this case, they prefer to share their personalenergy figures only with family members, relatives and/or close friends (aggregated 88% inhome level and 77% in appliance level).
A large percentage of users (30%) trust only the other members of their family for sharingtheir detailed consumption. A smaller percentage of 14% wish to share their consumption atappliance level with close friends, and this percentage is increased in house (36%) or neighbor-hood level (41%). Apparently, some users do not trust their close friends, in order to sharewith them their personal footprint.
It is remarkable that from the general to the more specific consumption data, an increasingpercentage of users trust only themselves for viewing these values. This percentage starts from
3.4. Potential 12
6%13%
12%
41%
9%
19%
Neighborhood Data
5%
36%
16%
37%
5%
1% House Data
17%
30%34%
14%
5%0% Electrical Appliances Data
MeFamily MembersRelativesClose FriendsAll FriendsEveryone
Figure 3.6: Privacy concerns of users in regard to with whom to share their consumption data inneighborhood level (left-top), house level (right-top) and detailed consumption of their appliances(bottom).
5% in neighborhood level and increases up to 17% in appliance level. Finally, the idea of sharingonly some consumption indicators (e.g. peak consumption during the day or only the latestaverage energy savings achieved) sounded promising to the majority of people (59%).
3.4 Potential
It is worth-mentioning that 75% believe that the concept of normative social influence hasthe potential of influencing people to reduce their consumption. 61% are confident that theapplication will help them to reduce their electrical consumption by more than 10%, around10% believe in 1-5% reductions and 27% in 6-10% decrease of consumption. Concerning therelation between the usefulness of the application and time, 63% believe it is mostly usefultoday, while 27% believe it will be more useful in 1-2 years and 10% in more than two years.It is notable that 37% envision the potential of the application in the coming years, probablyhaving in the back of their minds the introduction of smart meters.
Impressively, 98% of users believe that Social Electricity can contribute in energy conser-vation in the country. It is highly encouraging that our users are convinced that the app will
3.5. Summary of Findings 13
contribute to their strategies for conserving electricity in the future.Interestingly, 69% agree that Social Electricity could be extended for comparisons in inter-
country level, between citizens of different countries. Related to this, 63% are interested tocompare their footprint with their Facebook friends who reside in another country. Such com-parisons could reveal behavioral patterns and attitudes of people from different cultures.
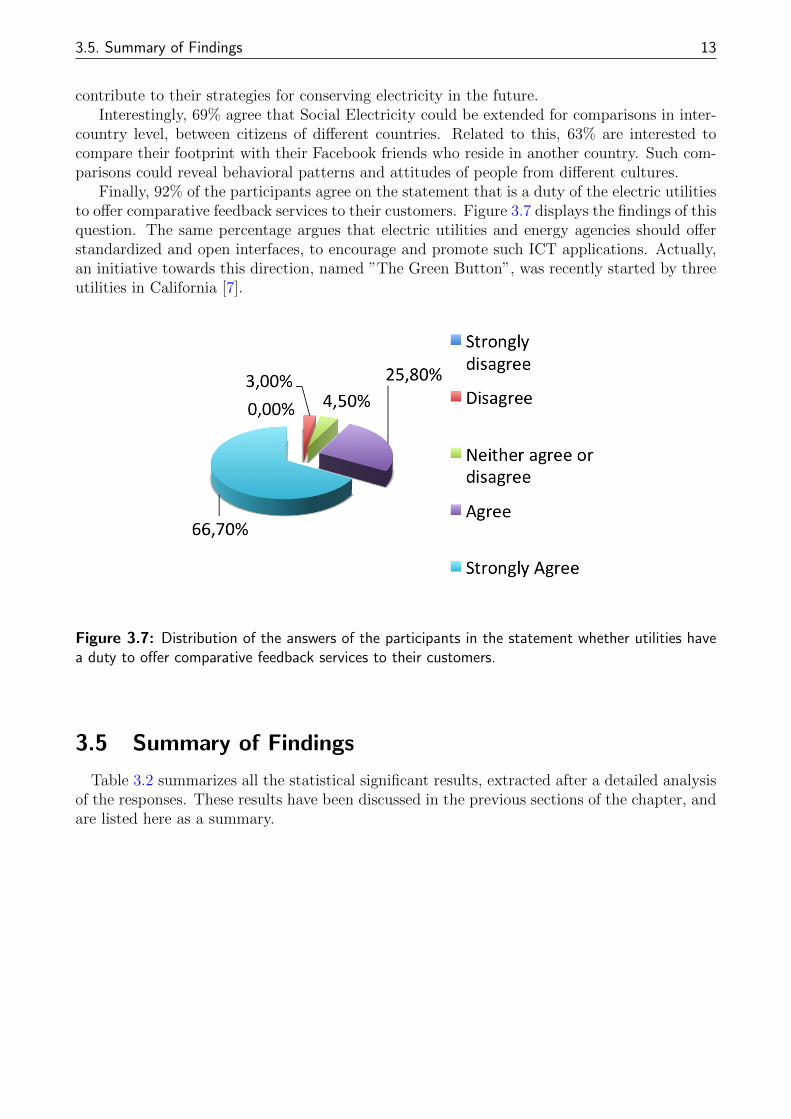
Finally, 92% of the participants agree on the statement that is a duty of the electric utilitiesto offer comparative feedback services to their customers. Figure 3.7 displays the findings of thisquestion. The same percentage argues that electric utilities and energy agencies should offerstandardized and open interfaces, to encourage and promote such ICT applications. Actually,an initiative towards this direction, named ”The Green Button”, was recently started by threeutilities in California [7].
Figure 3.7: Distribution of the answers of the participants in the statement whether utilities havea duty to offer comparative feedback services to their customers.
3.5 Summary of Findings
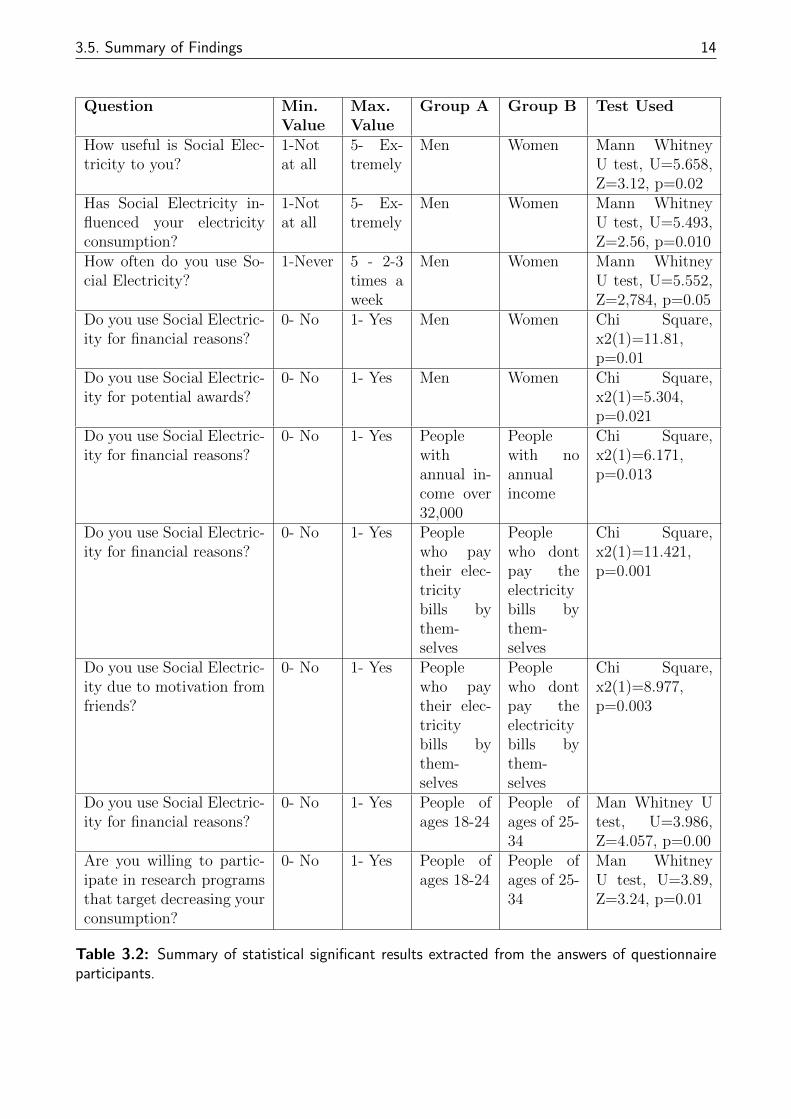
Table 3.2 summarizes all the statistical significant results, extracted after a detailed analysisof the responses. These results have been discussed in the previous sections of the chapter, andare listed here as a summary.
3.5. Summary of Findings 14
Question Min.Value
Max.Value
Group A Group B Test Used
How useful is Social Elec-tricity to you?
1-Notat all
5- Ex-tremely
Men Women Mann WhitneyU test, U=5.658,Z=3.12, p=0.02
Has Social Electricity in-fluenced your electricityconsumption?
1-Notat all
5- Ex-tremely
Men Women Mann WhitneyU test, U=5.493,Z=2.56, p=0.010
How often do you use So-cial Electricity?
1-Never 5 - 2-3times aweek
Men Women Mann WhitneyU test, U=5.552,Z=2,784, p=0.05
Do you use Social Electric-ity for financial reasons?
0- No 1- Yes Men Women Chi Square,x2(1)=11.81,p=0.01
Do you use Social Electric-ity for potential awards?
0- No 1- Yes Men Women Chi Square,x2(1)=5.304,p=0.021
Do you use Social Electric-ity for financial reasons?
0- No 1- Yes Peoplewithannual in-come over32,000
Peoplewith noannualincome
Chi Square,x2(1)=6.171,p=0.013
Do you use Social Electric-ity for financial reasons?
0- No 1- Yes Peoplewho paytheir elec-tricitybills bythem-selves
Peoplewho dontpay theelectricitybills bythem-selves
Chi Square,x2(1)=11.421,p=0.001
Do you use Social Electric-ity due to motivation fromfriends?
0- No 1- Yes Peoplewho paytheir elec-tricitybills bythem-selves
Peoplewho dontpay theelectricitybills bythem-selves
Chi Square,x2(1)=8.977,p=0.003
Do you use Social Electric-ity for financial reasons?
0- No 1- Yes People ofages 18-24
People ofages of 25-34
Man Whitney Utest, U=3.986,Z=4.057, p=0.00
Are you willing to partic-ipate in research programsthat target decreasing yourconsumption?
0- No 1- Yes People ofages 18-24
People ofages of 25-34
Man WhitneyU test, U=3.89,Z=3.24, p=0.01
Table 3.2: Summary of statistical significant results extracted from the answers of questionnaireparticipants.
Chapter 4Analysis of Focus Groups
The focus groups were divided in two categories, each consisting of seven people (4 male - 3 female):
• Students (18-24 years old) who live in the country with their parents and do not pay anyelectricity bills and
• Citizens who live and work in the country (26-32 years old).
From now on, we refer to the former group as students and to the latter as citizens. These categoriesrepresent the majority of our users (75%). Each session lasted 50 minutes and was audio-recorded.To better structure the groups, we initially performed a pilot focus group, consisting of universitystudents.
4.1 Phase A: Current Status of Social Electricity
Concerning usefulness, all agreed that the application is very useful. It helped them to perceive theircategory of electrical consumption. Two people from each group admitted they had high consumption,and this motivated them to take measures to reduce it. In particular, a student ”started turning offthe lights”, ”switching off the laptop during night” while a citizen ”stopped turning on the heater forheating the water” in days of sunshine.
From all participants, only two did not decrease their consumption in relation to the previous year.From the various features, students preferred temporal comparative feedback, while citizens foundcomparative feedback with their neighbors more useful. A student mentioned that ”the adoption ofthe application has been promoted by being available on Facebook. This made it more reachable, easy touse and interesting”. Citizens had similar opinions and believed that the application became popularbecause of its social character.
Both students and citizens agreed that they used the application only once every month, mainlywhen they received their electricity bill and they did not have incentives to use it more frequently. Halfof them remember their green/red friends, although this feature impressed them initially. However,only two students and two citizens initiated a discussion with their friends about energy conservation.In particular, a citizen asked one of his red friends about his increased consumption, and this was”due to having a swimming pool”.
In regard to motivations for using Social Electricity, students were mainly affected by the socialinfluence of their friends and because of curiosity. As they did not pay electricity bills themselves, thefinancial motive was not strong to them. On the other hand, citizens claimed they had environmentaland financial reasons for using the application. While we expected that students would be more awareabout the environment, as they are generally more educated, this was not the case. Citizens seem tobe more mature in environmental aspects.
4.2. Phase B: Requirements Elicitation for Future Releases 16
About the potential of Social Electricity, three students believed it is more useful today, due to thefinancial crisis. Citizens did not have a clear opinion, though one mentioned that ”it would be moreuseful in a future scenario when multiple electric utilities would operate in the country, offering differenttariffs/services”. All students and citizens agreed that the application can contribute in reducing thetotal energy demands. The citizens were more optimistic, discussing about 20-30% reductions (!),while the students predicted 5-10% savings. Students were interested in the opportunity of comparingtheir consumption with people from other countries, while only a 50% of citizens found this useful.One student and two citizens were skeptical, since different conditions hold at each country.
An interesting aspect is that both students and citizens consider their electric utility responsiblefor raising the awareness of consumers about the environment. Citizens strongly believed that theelectric utilities should have a social responsibility and that electricity is a basic need for people. Inparticular, a citizen mentioned that ”the management of electricity reflects our civilization”.
In both groups, privacy issues created much discussion. Students discussed that the applicationrespects their privacy, but they asked for more control over the sharing of their consumption andlocation. They were positive in sharing their personal consumption with their online friends, sincethis would happen for a good purpose. Citizens were less reluctant about privacy issues, since ”thegovernment and many companies know already a lot about us”. They agreed on sharing their personalconsumption, and one even declared that ”it is our duty to share our consumption, because our energy-related habits affect the physical environment and the society”. This is definitely an interesting pointof view.
Students are partly afraid that exposing their personal consumption could encourage thieves ”toattempt to steal while the owner is absent”. Citizens were not afraid that their consumption patternscould reveal their lifestyles and one claimed that ”common benefits overcome the risks”. Anothercitizen noted that ”banks constitute more serious privacy risks as they know much about our personallives”.
4.2 Phase B: Requirements Elicitation for Future Releases
In the second part of the focus group sessions, we explained to the participants that one of ourserious concerns is that people use the application occasionally. Then, we encouraged them to discussways to engage the users to Social Electricity more frequently. Citizens were more actively involvedin this discussion, probably because electricity for them has more direct financial implications.
Some of the ideas discussed are:
• Use of mobile applications (students and citizens)1,
• More frequent feedback (students and citizens),
• Adding statistics to the electricity bills of consumers (students and citizens),
• Access to people without a Facebook account (students),
• Engagement with the electric utility e.g. to provide useful information about latest tariffs orimportant announcements (students) and
• Offering personalized tips for energy savings (citizens).
Finally, we asked them about extra features they would like to see in future updates of the appli-cation. Their answers are as follows:
• Notifications/alerts for increased consumption (students and citizens),
• Detailed cost per electrical appliance (students),
1The category in parentheses indicates who offered the idea.

4.2. Phase B: Requirements Elicitation for Future Releases 17
• Allowing to define a threshold of maximum consumption, triggering an alarm when this thresholdis approaching (citizens),
• Translating consumption figures into more meaningful information such as direct impact on theenvironment (citizens) and
• Predictions on future consumption based on previous consumptions and weather forecasts (cit-izens).
Chapter 5Conclusion
The purpose of this technical report is to present results derived from user studies aiming to exploitthe phenomenon of normative social influence towards energy awareness and conservation. Such aneffort is important for designing more effective persuasive applications that affect user behavior withregards to energy consumption and sustainability, through credible comparisons with the energy figuresof friends, relatives and neighbors.
A subjective evaluation by means of online questionnaires and focus groups, showed that thepresented approach is perceived as useful and effective to the users, since it helped them to be moresensitive about energy management and reduce their consumption. Both the participants at thequestionnaires and the focus groups had a general consensus about the value of the application. Thisconsensus between the different user groups is also reflected by the fact that the inferential analysisof the questionnaire did not reveal many statistical significant results.
However, the analysis revealed the need for more personalized feedback strategies, taking intoaccount different user profiles and motivations. It is important to study whether normative socialinfluence can contribute in averting the effect of losing interest after some time. Moreover, the socialresponsibility of electric utilities in offering online services of comparative feedback was stressed bythe participants.
Finally, an important finding is related to the privacy concerns of users in such large-scale per-suasive environments. The participants stated the requirement of sharing personal consumption datathrough a privacy policy that satisfies the ability of revealing energy consumption on a street andhome level to different user categories inside social networking applications. Therefore, privacy is acrucial parameter when designing green ICT social applications.
Overall, this report provides useful insights for the perceptions of users in using green ICT socialapplications. The feedback received from Cypriot citizens is valuable for electric utilities, organizationsand companies, which aim to design and develop in the future more usable and effective persuasiveapplications in the scope of sustainability.
Bibliography
[1] Robert B. Cialdini. Influence: science and practice. Allyn and Bacon, 2001.
[2] Sarah Darby. Making it Obvious: Designing Feedback into Energy Consumption, pages 685–696.Springer Berlin Heidelberg, 2001.
[3] Sarah Darby. The effectiveness of feedback on energy consumption A review for defra of theliterature on metering, billing and direct displays. Environmental Change Institute, University ofOxford, 2006.
[4] Thomas D. Jensen. Comparison processes in energy conservation feedback effects. Advances inConsumer Research, 13:486–491, 1986.
[5] J. Kitzinger. Qualitative research: Introducing focus groups. British Medical Journal, 311:299–302,1995.
[6] Yolande A.A. Strengers. Designing eco-feedback systems for everyday life. In Proceedings ofthe SIGCHI Conference on Human Factors in Computing Systems, CHI ’11, pages 2135–2144,Vancouver, BC, Canada, 2011. ACM.
[7] White House, Office of Science and Technology Policy. Empowering Customers With a GreenButton, 2011. http://www.whitehouse.gov/blog/2011/11/21/empowering-customers-green-button(accessed in June, 2013).