a case study of the impact of the dplc model of
TRANSCRIPT
University of Central Florida University of Central Florida
STARS STARS
Electronic Theses and Dissertations, 2020-
2020
A Case Study of the Impact of the DPLC Model of Professional A Case Study of the Impact of the DPLC Model of Professional
Learning on Collective Teacher Efficacy and Organizational Trust Learning on Collective Teacher Efficacy and Organizational Trust
in a Middle School in a Middle School
Maria Gaspar University of Central Florida
Part of the Educational Assessment, Evaluation, and Research Commons, and the Junior High,
Intermediate, Middle School Education and Teaching Commons
Find similar works at: https://stars.library.ucf.edu/etd2020
University of Central Florida Libraries http://library.ucf.edu
This Doctoral Dissertation (Open Access) is brought to you for free and open access by STARS. It has been accepted
for inclusion in Electronic Theses and Dissertations, 2020- by an authorized administrator of STARS. For more
information, please contact [email protected].
STARS Citation STARS Citation Gaspar, Maria, "A Case Study of the Impact of the DPLC Model of Professional Learning on Collective Teacher Efficacy and Organizational Trust in a Middle School" (2020). Electronic Theses and Dissertations, 2020-. 49. https://stars.library.ucf.edu/etd2020/49
A CASE STUDY OF THE IMPACT OF THE DPLC MODEL OF PROFESSIONAL LEARNING ON COLLECTIVE TEACHER EFFICACY AND ORGANIZATIONAL TRUST
IN A MIDDLE SCHOOL
by
MARIA GASPAR B.A. Flagler College, 2002
M.Ed. University of Central Florida, 2007
A dissertation submitted in partial fulfillment of the requirements for the degree of Doctor of Education
in the Department of Educational Leadership and Higher Education, in the College of Community Innovation and Education
at the University of Central Florida Orlando, Florida
Spring Term 2020
Major Professor: RoSusan Bartee

ii
2020 Maria Gaspar
iii
ABSTRACT
The purpose of this case study was to investigate the relationship between the
implementation of the District Professional Learning Community (DPLC) model of professional
development and collective teacher efficacy and organizational trust at one middle school in a
large urban school district. Data were collected from the following sources: Goddard & Hoy's
(2003) CE Scale Form L, Hoy & Tschannen-Moran's (2003) Omnibus-T scale, six additional
survey items used to explore teachers’ perceptions of the DPLC model’s influence on improving
student literacy, and semi-structured focus group interviews. A series of analysis of variance
(ANOVA) and chi-square tests were performed to analyze the survey data. Focus group
interview data were examined using a priori codes, open codes, in vivo codes, and logic model
analytics. The findings of this study revealed that the DPLC model has a positive impact on
collective teacher efficacy and organizational trust at Central Florida Middle School. Additional
statistically significant findings include: (a) increase in faculty trust in principal over time; (b)
increase in faculty trust in colleagues over time; (c) greater increase in collegial trust among
English Language Arts/Reading teachers as compared to other content area peers; (d) members
of the DPLC Site Team report greater knowledge and utilization of learned literacy strategies as
compared to non-members. Through this investigation of teacher perceptions, truths about
organizational culture were revealed. The results of this study confirm and expand the research
supporting the positive impact of distributed leadership practices and effective professional
development on collective teacher efficacy and organizational trust.

iv
To my children, Willow and Hazel. Your dreams are yours to make. Your lives are yours to
shape. Pursue what fills your heart and stimulates your mind.

v
ACKNOWLEDGMENTS
I want to take the opportunity to thank my dedicated committee members. To my chair,
Dr. RoSusan Bartee, thank you for your willingness to take on a candidate mid-dissertation. I
appreciate your commitment to my success. Dr. Jerry Johnson, thank you for your mentorship
and encouragement to pursue a research topic that I am passionate about. Dr. Lee Baldwin,
throughout my three years in the program, you have been a steady support. Dr. Shelia Moore, I
appreciate your commitment to supporting my research. Dr. James Larsen, thank you for your
interest in my research and the implications for supporting the work of our school district.
To my esteemed colleagues of Cohort 8, I am a better person after going through this
journey with you. I especially want to thank the library crew: Mary, Guy, Krissy, and Dave.
Thank you for being my support system though all of our Saturday adventures on the 2nd floor.
To the dedicated teachers who contributed to my research, without your engagement and
transparency throughout this two year project, this study would not have been possible.
Mom and Dad, thank you for being role models for hard work and perseverance. Striving
for personal and professional growth are values you have instilled in me since childhood. Nanny
and Poppy, you have shown me the meaning of leadership in the ways you have lovingly led our
family. John and Peter, my brothers and my best friends, thank you for your constant
encouragement. Helena and Rachel, thank you for being there whether I need words of wisdom
or simply to borrow a book. Brian, my family, my steady support, thank you for everything.
To my wife, Liza, without your unwavering support, my pursuit of this educational
journey would not have been possible. Thank you for encouraging me to take this step. I am
especially grateful for your sacrifice in taking on more than your share as I pursue my goals.
vi
TABLE OF CONTENTS
LIST OF FIGURES ....................................................................................................................... ix
LIST OF TABLES .......................................................................................................................... x
CHAPTER 1 INTRODUCTION .................................................................................................... 1 Background of the Study .................................................................................................... 1 Statement of the Problem .................................................................................................... 2 Purpose of the Study ........................................................................................................... 5 Significance of the Study .................................................................................................... 6 Definition of Terms............................................................................................................. 7 Theoretical Framework ....................................................................................................... 9 Research Questions ........................................................................................................... 10 Limitations in the Research Study .................................................................................... 11 Delimitations of the Research Study................................................................................. 12 Assumptions of the Research Study ................................................................................. 13 Organization of the Study ................................................................................................. 13
CHAPTER 2 LITERATURE REVIEW ....................................................................................... 15 Introduction ....................................................................................................................... 15
Search Procedure .................................................................................................. 16 Chapter Organization ............................................................................................ 17
Collective Teacher Efficacy .............................................................................................. 18 Conceptual Perspectives ....................................................................................... 18 Barriers to Collective Teacher Efficacy ................................................................ 20 Student Achievement ............................................................................................ 22 Faculty Trust ......................................................................................................... 24 Opportunities to Increase Collective Teacher Efficacy ........................................ 25
Organizational Trust ......................................................................................................... 28 Conceptual Perspectives ....................................................................................... 28 Three Dimensions of Faculty Trust ...................................................................... 30 Student Achievement ............................................................................................ 32 Overcoming Barriers to Trust ............................................................................... 34
Distributed Leadership ...................................................................................................... 38 Conceptual Perspectives ....................................................................................... 38 Barriers to Distributed Leadership ........................................................................ 40 Student Achievement and School Reform ............................................................ 41 Professional Learning ........................................................................................... 43 Organizational Trust and Collective Teacher Efficacy ......................................... 45
Summary of the Literature Review ................................................................................... 47
CHAPTER 3 RESEARCH METHODS ....................................................................................... 48 Introduction ....................................................................................................................... 48

vii
Chapter Organization ............................................................................................ 49 Research Design.................................................................................................... 50
Participants ........................................................................................................................ 51 School District ...................................................................................................... 51 Central Florida Middle School.............................................................................. 52 Research Sampling................................................................................................ 53
Instrumentation ................................................................................................................. 56 Quantitative Phase ................................................................................................ 56 Qualitative Phase .................................................................................................. 65
Data Collection ................................................................................................................. 67 Quantitative Phase ................................................................................................ 67 Qualitative Phase .................................................................................................. 68
Data Analysis .................................................................................................................... 71 Quantitative Phase ................................................................................................ 73 Qualitative Phase .................................................................................................. 75 Synthesis Phase ..................................................................................................... 77
Summary of the Research Methods .................................................................................. 78
CHAPTER 4 PRESENTATION AND ANALYSIS OF DATA .................................................. 79 Introduction ....................................................................................................................... 79
Chapter Organization ............................................................................................ 80 Quantitative Phase ............................................................................................................ 81
Research Question 1 ............................................................................................. 83 Research Question 2 ............................................................................................. 91 Research Question 3 ........................................................................................... 111
Qualitative Phase ............................................................................................................ 148 Coding Process.................................................................................................... 149 Research Question 1 ........................................................................................... 157 Research Question 2 ........................................................................................... 165 Research Question 3 ........................................................................................... 169 Credibility Techniques ........................................................................................ 178 Logic Model Analytics ....................................................................................... 181
Synthesis Phase ............................................................................................................... 183 Research Question 1 ........................................................................................... 184 Research Question 2 ........................................................................................... 188 Research Question 3 ........................................................................................... 198 Credibility Techniques ........................................................................................ 215
Summary of Presentation of Data and Analysis ............................................................. 218
CHAPTER 5 SUMMARY, DISCUSSION, AND CONCLUSIONS ........................................ 220 Introduction ..................................................................................................................... 220 Summary of the Study .................................................................................................... 221 Discussion of the Findings .............................................................................................. 224
Research Question 1 ........................................................................................... 224

viii
Research Question 2 ........................................................................................... 226 Research Question 3 ........................................................................................... 230
Implications for Practice ................................................................................................. 233 Recommendations for Further Research ......................................................................... 234 Conclusions in the Study ................................................................................................ 235
APPENDIX A COLLECTIVE EFFICACY SCALE .............................................................. 237
APPENDIX B A SIMPLIFIED MODEL OF COLLECTIVE EFFICACY ............................ 239
APPENDIX C OMNIBUS TRUST SCALE ........................................................................... 241
APPENDIX D ADDITIONAL EXPERIMENTAL SURVEY ITEMS .................................. 243
APPENDIX E FOCUS GROUP INTERVIEW QUESTIONS ............................................... 245
APPENDIX F CONSENT FORM ON PAGE ONE OF SURVEY ........................................ 247
APPENDIX G EMAIL INVITATIONS FOR SURVEY ADMINISTRATION 1-3 .............. 249
APPENDIX H EMAIL INVITATIONS FOR FOCUS GROUPS .......................................... 252
APPENDIX I UNIVERSITY OF CENTRAL FLORIDA RESEARCH NOTICE APPROVAL..................................................................................................................................................... 258
APPENDIX J SCHOOL DISTRICT RESEARCH NOTICE APPROVAL YEAR 1 ............. 260
APPENDIX K SCHOOL DISTRICT RESEARCH NOTICE APPROVAL YEAR 2 ........... 262
APPENDIX L FIGURE 1 INFLUENCE OF THE DPLC MODEL OF PROFESSIONAL LEARNING AT CENTRAL FLORIDA MIDDLE SCHOOL .................................................. 264
ix
TABLE OF FIGURES
Figure 1. Influence of the DPLC Model of Professional Learning at Central Florida Middle School ......................................................................................................................................... 182

x
LIST OF TABLES
Table 1 Case Study Methods of Data Collection and Analysis .................................................. 72
Table 2 Participant Survey Completion by Administration Period ............................................ 82
Table 3 Demographic Data Collected From Total Submissions Over the Course of Three Survey Administrations ................................................................................................................ 82
Table 4 Means and Standard Deviations of Collective Teacher Efficacy Over the Course of Three Survey Administrations ...................................................................................................... 84
Table 5 Means of CE-Scale Categorized by Years of Teaching Experience Over the Course of Three Survey Administrations ...................................................................................................... 85
Table 6 Means of CE-Scale Categorized by Gender Over the Course of Three Survey Administrations ............................................................................................................................. 86
Table 7 Means of CE-Scale Categorized by subject Area Taught Over the Course of Three Survey Administrations ................................................................................................................ 87
Table 8 Means of CE-Scale Categorized by DPLC Site Team Membership Over the Course of Three Survey Administrations ...................................................................................................... 88
Table 9 Statistical Significance of Collective Teacher Efficacy Over the Course of Three survey Administrations (Tukey Post Hoc) ............................................................................................... 89
Table 10 Results of Two-way ANOVA: Tests of Between Subjects Effects for Collective Teacher Efficacy ........................................................................................................................... 90
Table 11 Means and Standard Deviations of the Three Facets of Faculty Trust Over the Course of three Survey Administrations ................................................................................................... 92
Table 12 Means of Faculty Trust in Principal Categorized by Years of Teaching Experience Over the Course of Three Survey Administrations....................................................................... 93
Table 13 Means of Faculty Trust in Colleagues Categorized by Years of Teaching Experience Over the Course of Three Survey Administrations....................................................................... 94
Table 14 Means of Faculty Trust in Clients Categorized by Years of Teaching Experience Over the Course of Three Survey Administrations................................................................................ 95
Table 15 Means of Faculty Trust in Principal Categorized by Gender Over the Course of Three Survey Administrations ................................................................................................................ 96
Table 16 Means of Faculty Trust in Colleagues Categorized by Gender Over the Course of Three Survey Administrations ...................................................................................................... 96
Table 17 Means of Faculty Trust in Clients Categorized by Gender Over the Course of Three Survey Administrations ................................................................................................................ 97
Table 18 Means of Faculty Trust in Principal Categorized by Subject Area Taught Over the Course of Three Survey Administrations ..................................................................................... 98

xi
Table 19 Means of Faculty Trust in Colleagues Categorized by Subject Area Taught Over the Course of Three Survey Administrations ..................................................................................... 99
Table 20 Means of Faculty Trust in Clients Categorized by Subject Area Taught Over the Course of Three Survey Administrations ................................................................................... 100
Table 21 Means of Faculty Trust in Principal Categorized by DPLC Site Team Membership Over the Course of Three Survey Administrations..................................................................... 101
Table 22 Means of Faculty Trust in Colleagues Categorized by DPLC Site Team Membership Over the Course of Three Survey Administrations..................................................................... 102
Table 23 Means of Faculty Trust in Clients Categorized by DPLC Site Team Membership Over the Course of Three Survey Administrations.............................................................................. 103
Table 24 Statistical Significance of Faculty Trust in Principal Over the Course of Three Survey Administrations (Tukey Post Hoc) ............................................................................................. 104
Table 25 Statistical Significance of Faculty Trust in Colleagues Over the Course of Three Survey Administrations (Tukey Post Hoc) ................................................................................. 105
Table 26 Statistical Significance of Faculty Trust in Clients Over the Course of Three Survey Administrations (Tukey Post Hoc) ............................................................................................. 106
Table 27 Results of Two-way ANOVA Tests of Between Subjects Effects for Faculty Trust in Principal ...................................................................................................................................... 107
Table 28 Results of Two-way ANOV A Tests of Between Subjects Effects for Faculty Trust in Colleagues ................................................................................................................................... 108
Table 29 Statistical Significance of Faculty Trust in Colleagues by Subject Area Taught (Tukey Post Hoc) ..................................................................................................................................... 109
Table 30 Results of Two-way ANOVA Tests of Between Subjects Effects for Faculty Trust in Clients ......................................................................................................................................... 110
Table 31 Chi-square Violations of Adequacy of Sample size for DPLC Survey Items 48-53 . 112
Table 32 Crosstabulation over the Course of Three Survey Administration for Survey Item Q48: Teachers in this school receive quality professional development that impacts instructional practices ...................................................................................................................................... 113
Table 33 Crosstabulation Over the Course of Three Survey Administrations for Survey Item Q49: Teachers in this school have the strategies to support literacy in the content area that they teach ............................................................................................................................................ 114
Table 34 Crosstabulation Over the Course of Three survey Administrations for Survey Item Q50: This school fosters a culture of collaboration .................................................................... 115
Table 35 Crosstabulation Over the Course of Three Survey Administrations for Survey Item Q51: Teachers in this school are given opportunities to be instructional leaders for their peers..................................................................................................................................................... 116

xii
Table 36 Crosstabulation Over the Course of Three survey Administration for Survey Item Q52: To what extent has content from the DPLC sessions impacted your thinking about instruction? .................................................................................................................................. 117
Table 37 Crosstabulation Over the Course of Three survey Administrations for Survey Item Q53: To what extent has content from the DPLC sessions impacted your instructional practice?..................................................................................................................................................... 118
Table 38 Crosstabulation by Years of Teaching Experience for Survey Item Q48: Teachers in this school receive quality professional development that impacts instructional practices ........ 119
Table 39 Crosstabulation by Years of Teaching Experience for Survey Item Q49: Teachers in this school have the strategies to support literacy in the content area that they teach ................ 120
Table 40 Crosstabulation by Years of Teaching Experience for Survey Item Q50: This school fosters a culture of collaboration ................................................................................................. 121
Table 41 Crosstabulation by Years of Teaching Experience for Survey Item Q51: Teachers in this school are given opportunities to be instructional leaders for their peers ............................ 122
Table 42 Crosstabulation by Years of Teaching Experience for Survey Item Q52: To what extent has the content from DPLC sessions impacted your thinking about instruction? ............ 123
Table 43 Crosstabulation by Years of Teaching Experience for Survey Item Q53: To what extent has the content from DPLC sessions impacted your instructional practice? ................... 124
Table 44 Crosstabulation by Gender for Survey Item Q48: Teachers in this school receive quality professional development that impacts instructional practices ....................................... 125
Table 45 Crosstabulation by Gender for Survey Item Q49: Teachers in this school have the strategies to support literacy in the content area that they teach. ................................................ 125
Table 46 Crosstabulation by Gender for Survey Item Q50: This school fosters a culture of collaboration ............................................................................................................................... 126
Table 47 Crosstabulation by Gender for Survey Item Q51: Teachers in this school are given opportunities to be instructional leaders for their peers .............................................................. 127
Table 48 Crosstabulation by Gender for Survey Item Q52: To what extent has content from the DPLC sessions impacted your thinking about instruction? ........................................................ 128
Table 49 Crosstabulation by Gender for Survey Item Q53: To what extent has content from the DPLC sessions impacted your instructional practice? ................................................................ 129
Table 50 Crosstabulation by Subject Area taught for Survey Item Q48: Teachers in this school receive quality professional development that impacts instructional practices .......................... 130
Table 51 Crosstabulation by Subject Area Taught for Survey Item Q49: Teachers in this school have the strategies to support literacy in the content area that they teach .................................. 131
Table 52 Crosstabulation by Subject Area Taught for Survey Item Q50: This school fosters a culture of collaboration ............................................................................................................... 132
xiii
Table 53 Crosstabulation by Subject Area Taught for Survey Item Q51: Teachers in this school are given opportunities to be instructional leaders for their peers .............................................. 133
Table 54 Crosstabulation by Subject Area Taught for Survey Item Q52: To what extent has content from the DPLC sessions impacted your thinking about instruction .............................. 134
Table 55 Crosstabulation by Subject Area Taught for Survey Item Q53: To what extent has content from the DPLC sessions impacted your instructional practice? .................................... 135
Table 56 Crosstabulation by DPLC Site Team Membership for Survey Item Q48: Teachers in this school receive quality professional development that impacts instructional practices ........ 136
Table 57 Crosstabulation by DPLC Site Team Membership for Survey Item Q49: Teachers in this school have the strategies to support literacy in the content area that they teach ................ 137
Table 58 Crosstabulation by DPLC Site Team Membership for Survey Item Q50: This school fosters a culture of collaboration ................................................................................................. 138
Table 59 Crosstabulation by DPLC Site Team Membership for Survey Item Q51: Teachers in this school are given opportunities to be instructional leaders for their peers ............................ 139
Table 60 Crosstabulation by DPLC Site Team Membership for Survey Item Q52: To what extent has the content from DPLC sessions impacted your thinking about instruction? ............ 140
Table 61 Crosstabulation by DPLC Site Team Membership for Survey Item Q53: To what extent has the content from DPLC sessions impacted your instructional practice? ................... 141
Table 62 Chi-square Test of Independence Over the Course of Three Survey Administrations for all DPLC Survey Items ......................................................................................................... 142
Table 63 Chi-square Test of Independence by Years of Teaching Experience for all DPLC Survey Items ............................................................................................................................... 143
Table 64 Chi-square Test of Independence by Gender for all DPLC Survey Items ................. 144
Table 65 Chi-square Test of Independence by Subject Area Taught for all DPLC Survey Items..................................................................................................................................................... 145
Table 66 Chi-square Test of Independence by DPLC Site Team Membership for all DPLC Survey Items ............................................................................................................................... 146
Table 67 A Priori Codes Established by Research Question .................................................... 150
Table 68 Frequencies, Descriptions, and Examples of all Established Codes Used for Focus Group Data Analysis ................................................................................................................... 152
Table 69 Initial Theme Categorized into Final Themes Used to Describe the Analysis of focus Group Interview Data ................................................................................................................. 156
Table 70 Focus Group Participant Responses Supporting the Theme: Opportunities for Professional Growth.................................................................................................................... 158
Table 71 Focus Group Participant Responses Supporting the Theme: Teachers Support Each Other ........................................................................................................................................... 161
xiv
Table 72 Focus Group Participant Responses Supporting the Theme: Beliefs About Students..................................................................................................................................................... 164
Table 73 Focus Group Participant Responses Supporting the Theme: Positive Feelings About DPLC Implementation ................................................................................................................ 170
Table 74 Focus Group Participant Responses Supporting the Theme: Inconsistencies in Implementation ........................................................................................................................... 174
Table 75 Revision of Themes Based on Negative Case Analysis .............................................. 180
Table 76 Joint Data Display of CE-Scale and Focus Group Interviews Resulting in a Synthesis of Data ......................................................................................................................................... 185
Table 77 Joint Data Display of Omnibus T-Scale and focus Group Interviews Resulting in a Synthesis of Data ........................................................................................................................ 191
Table 78 Joint Data Display of DPLC Survey Items and Qualitative Focus Group Interviews Resulting in a Synthesis of Data ................................................................................................. 201
Table 79 Revision of Synthesis Based on Negative Case Analysis.......................................... 217
1
CHAPTER 1 INTRODUCTION
Background of the Study
Educational leaders have been faced with the complex task of providing a quality and
equitable education for all students (Gallagher, Goodyear, Brewer, & Rueda, 2012), and
educational reform has been constantly at the forefront of research discussions (Darling-
Hammond, 1994). Subsequently, school leadership practice has also been a prevalent topic of
debate, especially as it relates to educational improvement (Spillane, 2003). The majority of
educational reforms directly involve teachers and are driven by the need for improvement of
instructional practices (Darling-Hammond, 1994). This trend directly connects to the positive
impact that teachers have on student achievement (Hattie, 2009). Regrettably, teacher attrition
has evolved into a crisis for the American education system (Sutcher, Darling-Hammond, &
Carver-Thomas, 2016). This decrease in the workforce impedes educational goals of quality and
equity for all students.
Several factors have surfaced from research on teacher attrition including: the quality of
school leadership, professional learning opportunities, instructional leadership, time for
collaboration and planning, collegial relationships, and decision-making input (Sutcher et al.,
2016). Consequently, within recent years, a notable shift to an increase in teacher leadership has
gained momentum. The concept of distributed leadership implies the need for shared
responsibility among members of a faculty in areas such as decision making and professional
learning (Spillane, 2003). This shift from a traditional “hierarchical” approach to principal
2
leadership has highlighted the importance of teacher leadership in successful educational reform
leading to organizational trust, a collaborative culture, and student academic success.
One of the most prevalent topics of school reform efforts involves the need for
improvements in student literacy. Literacy is one of the most critical components of academic
success, affecting students’ opportunities when they transition from the K-12 school system and
enter adulthood. According to the National Center for Education Statistics, 14% of adult
Americans demonstrated a “below basic” literacy level in 2003, and 29% exhibited a “basic”
reading level (Kutner et al., 2007). With the rigorous demands of the Common Core Standards
and the expectations for college and career readiness, educators have been charged with
equipping students with literacy skills across all content areas through their K-12 schooling.
Effective professional development is vital for teachers to acquire and utilize the tools they need
to teach these skills to students (Darling-Hammond, Hyler & Gardner, 2017). Even after
professional development opportunities, research-based practices are not always owned and
implemented by classroom teachers (Darling-Hammond et al., 2017). In order for students to
acquire these necessary literacy skills, teachers must be equipped with the knowledge and skills
to lead their students to success in reading and writing in response to complex text.
Statement of the Problem
Researchers have revealed that teachers often do not implement research-based practices
acquired through professional development [PD] (Darling-Hammond et al., 2017; Joyce &
Showers, 2002). As noted by Darling-Hammond et al. (2017), “Conditions for teaching and
learning both within schools and at the broader systems level can inhibit the effectiveness of
teacher PD” (p. 30). Joyce and Showers (2002) discovered that even relevant well-crafted staff

3
development including presentation of theory, modeling and practice opportunities resulted in
only 5-10% implementation. Putting PD to practice through classroom implementation has
proven to be a topic worthy of exploration; and researchers and practitioners have continued to
investigate the “why” behind the barriers that impede that utilization of acquired professional
learning.
Lack of organizational trust and collective teacher efficacy are likely barriers for
ownership of research-based literacy practices (Brewster & Railsbeck, 2003; Brinson & Steiner,
2007; Goddard, Hoy, & Woolfolk Hoy, 2004; Supovitz & Christman, 2003). A connection
between distributed leadership practices regarding professional learning and the concepts of
collective efficacy and organizational trust has been found and investigated (Angelle, 2010;
Brinson & Steiner, 2007; Bryk & Schneider, 2003; National Staff Development Council, 2000).
The DPLC (District Professional Learning Community) model used in the target school district
in this study has called for a distributed leadership approach to faculty development which has
the potential to improve collective teacher efficacy and organizational trust through quality
professional learning experiences and shared responsibility for leadership decisions (Nelson &
Cudeiro, 2009). At the time of the present study, literature searches revealed no existing
literature on the influence that the DPLC model has on collective teacher efficacy and
organizational trust.
The DPLC model is based on the Targeted Leadership Consulting [TLC] (n.d.)
framework for developing leadership practices in order to improve student achievement. TLC’s
Context for Powerful Learning framework is grounded in research on effective schools, the
experience of successful educational practitioners, and the Boston Public School model (TLC,
4
n.d.). Targeted Leadership Consulting (TLC) promises that its established framework builds the
capacity of instructional leaders to guide and implement professional learning within their school
systems and achieve powerful results. The framework includes the following components: (a)
develop shared leadership to build a culture of collaboration, (b) target an area of the
instructional program to improved learning for all students, (c) examine student work and data to
guide instructional practices and professional learning, (d) build instructional expertise through
targeted professional learning in the use of effective, research-based practices, (e) align resources
to support instructional practice and improve learning for all students, and (f) partner with
families and communities to sustain learning for all students (TLC, n.d.). These six framework
components have served as a guide for the leadership learning goals of the DPLC model.
The intent of the DPLC model has been to create a professional learning plan that builds
expertise in all staff through repeated cycles of high-quality learning, followed by opportunities
for practicing, receiving feedback, observing colleagues, ongoing professional reading, and peer
discussion about the practices, including examining the impact of the practices on student
learning by looking at student work and reviewing student performance data (Nelson & Cudeiro,
2009). Nelsen and Cudeiro have claimed that “these actions have the potential to move a school
a giant step forward toward coherence and tighter coupling, where what and how students are
learning is a matter of common knowledge” (p. 33). Consequently, this model proceeds towards
a culture where “adult learning becomes as common as student learning” (Nelsen & Cudeiro,
2009, p. 33). This professional learning model has the potential to cultivate a growth mindset of
the faculty, leading to a school climate of continuous improvement for all.

5
According to Nelsen and Cudeiro (2009), the DPLC model of professional learning can
be a catalyst for school cultural change. In comparison to Schein’s (1988) framework of
organizational culture, this professional learning model promises to build a bridge between
espoused beliefs and underlying assumptions. When launching a district initiative, relational and
organizational trust are vital to successful implementation (Chhuon, Gilkey, Gonzalez, Daly, &
Chrispeels, 2008). Actions taken from organizational levels of leadership must address
openness, communication, risk, and integrity (Chhuon et al., 2008). Moran and Larwin’s (2017)
research revealed that “current educational leaders need to engage in conversation with teachers
on a collaborative level so that they can best gauge the current beliefs and culture of their
working environment” (p. 24). Professional development experiences that help the faculty make
connections between their collective actions and student outcomes establish a culture which
fosters collective efficacy (Donohoo, 2017). Through the DPLC model, school principals and
instructional staff collectively engage in professional learning and work together to achieve
common goals for school improvement. This level of collaboration and collective responsibility
is most successful when a culture of trust and vulnerability has been established within the
group.
Purpose of the Study
The purpose of this study is to investigate the District Professional Learning Community
(DPLC) model of professional development during years one and two of implementation in a
large urban school district. DPLC uses a distributed leadership approach to deliver cross-content
area literacy strategies to all teachers across the school district. This case study describes and

6
characterizes the relationship between the implementation of the DPLC model and collective
teacher efficacy and organizational trust at one middle school in a large urban school district.
A single case study research design was selected to best address the research questions.
As explained by Fraenkel, Wallen, and Hyun (2015), case studies allow for varied data to be
collected and used to formulate interpretations applicable to the specific case or to provide useful
generalizations. The researcher utilized a mixed-methods case study approach, recommended by
Fraenkel et al. (2015) in order to explore quantitative and qualitative data that were useful in
responding to the three research questions which guided the study. Furthermore, the quantitative
and qualitative data collection, results, and integration were used to provide in-depth evidence
for the case being studied (Creswell & Plano Clark, 2018). Ultimately, data collected from the
quantitative phases and the qualitative phase were merged in order to formulate an overall
interpretation of results.
Significance of the Study
This study provides a significant contribution to the research fields regarding professional
learning and distributed leadership approaches and their impact on collective teacher efficacy
and organizational trust. Though the DPLC model of professional learning was constructed on
the foundations of research-based practices about professional learning, there is no record of
empirical research on the model’s impact on collective teacher efficacy and organizational trust.
Furthermore, this study was the first to explore the influence of the DPLC model in this specific
large urban school district.
At the time of the present study, there was a need for continued exploration of the
relationship of collective efficacy to various factors. Further research, according to Kennedy and
7
Smith (2013) should continue to explore ways that organizational behaviors and structures can
influence teacher efficacy. Moreover, it has been recommended as recently as 2018 that future
research look at the relationships among collective efficacy and multiple variables. Donohoo
(2018) observed that it would be advantageous for future researchers to examine the relationship
between leadership and collective teacher efficacy. This study explored factors associated with
collective teacher efficacy which have not been addressed in this specific context.
In addition, the research on organizational trust leaves room for the exploration of trust
conducted through this study. Adams and Forsyth (2013) proposed that more research was
needed on policies designed to build capacity, strengthen collective trust, and support sustainable
school reform. Daly and Finnigan (2012) also suggested that further exploration was needed on
the relationship between trust and organizational performance outcomes, stating that empirical
research analyzing the relationship between organizational trust and teacher practice would
enhance the existing literature.
Definition of Terms
To provide context and clarity to the various components of this study, the following
definitions are offered. Key terms have been defined operationally.
Case Study: The extensive study of a single individual, group, or important example, during
which varied data are collected and used to formulate interpretations applicable to the specific
case or used to provide useful generalization (Fraenkel et al., 2015).
Collective teacher efficacy: The shared perceptions of teachers in a school that the efforts of the
faculty as a whole will have positive effects on students (Goddard, Hoy & Woolfolk Hoy, 2000).
8
Distributed leadership: To recognize that the principal is not the only leader in a given school.
By sharing authority with a variety of stakeholders, school leaders create an environment that
considers the ideas, styles, and beliefs of all interested parties. Certain responsibilities are
dispersed, and shared decision making remains the highest priority (Spillane, 2005).
District Professional Learning Community (DPLC): A model that creates a professional learning
plan that builds expertise in all staff through repeated cycles of high-quality learning, followed
by opportunities for practicing, receiving feedback, observing colleagues, ongoing professional
reading, and peer discussion about the practices, including examining the impact of the practices
on student learning by looking at student work and reviewing student performance data (Nelson
& Cudeiro, 2009).
Faculty trust: The extent to which the faculty as the group is willing to risk vulnerability (Hoy &
Tschannen-Moran, 2003).
Organizational culture: A pattern of basic assumptions, invented, discovered, or developed by a
given group, as it learns to cope with its problems of external adaptation and internal integration,
that has worked well enough to be considered valid and, therefore is to be taught to new
members as the correct way to perceive, think, and feel in relation to those problems (Schein,
1988).
Organizational trust: An individual’s or group’s willingness to be vulnerable to another party
based on the confidence that the latter party is benevolent, reliable, competent, honest, and open
(Hoy & Tschannen-Moran, 2003).

9
Theoretical Framework
The theoretical framework for this investigation was grounded in Schein’s (1988) levels
of organizational culture. Schein defined organizational culture as “a pattern of basic
assumptions, invented, discovered, or developed by a given group, as it learns to cope with its
problems of external adaptation and internal integration, that has worked well enough to be
considered valid and, therefore is to be taught to new members as the correct way to perceive,
think, and feel in relation to those problems” (p. 7). The concept of organizational culture has
evolved over the past three decades, though Schein’s framework continues to be a foundation for
theory on organizational culture.
Schein (1988) described three levels of organizational culture: artifacts, values, and
underlying assumptions. According to Schein, artifacts are the visual organizational structures
and processes that represent the organization to those on the outside. Schein explained that
artifacts may be easily observable items that can be seen and heard within the organization.
However, artifacts can be difficult to decipher as they are only a surface level view of the
organization. In a school culture, this could include the physical school building, classroom set-
up, how the student and faculty dress, mascot, technology, artwork, etc.
The next level of an organization’s culture, “values,” reaches a deeper layer. Values
represent the organization’s philosophies, espoused goals, ideals, and norms (Schein, 1988).
Values are what the organization claims to represent. In most cases, an organization’s values are
developed and established by the leaders of the organization (Schein, 1988). Some example of
values in a school culture include the school mission statement, schoolwide goals for student
achievement, school district goals, and collaborative team norms.

10
The deepest level of organizational culture, according to Schein (1988), is underlying
assumptions. Underlying assumptions are the truths told by the established members of the
organization. They represent the beliefs of members about each other and the organization as a
whole (Schein, 1988). For example, when a new school district initiative is introduced and
disseminated to each school, the underlying assumptions of each school and individual faculty
members may be different, which will in turn affect the success of the initiative.
Schein’s theoretical framework of organizational culture provided a context for the
design and approach in the present research. Culture is a powerful phenomenon that has the
power to change or sustain an organization (Barth. 2002; Schein, 1988). This study was
conducted to investigate cultural aspects of an organization: collective efficacy and
organizational trust. The data acquired through this study were intended to test the relationship
between the values and underlying assumptions of a school. The researcher sought to determine,
during the implementation of the DPLC model over a two-year period, how the school’s culture
was being influenced. In this study, she attempted to disclose whether the espoused beliefs of
the DPLC model impacted collective teacher efficacy, organizational trust, and teacher
perception of increased knowledge and skills of research-based literacy practices.
Research Questions
In order to investigate the influence of the District Professional Learning Community
(DPLC) model of professional learning on teacher perceptions, the following three research
questions were developed:
1. In what ways and to what extent is collective teacher efficacy influenced by
participation in DPLC model of professional learning?
11
2. In what ways and to what extent is teacher organizational trust influenced by
participation in DPLC model of professional learning?
3. In what ways and to what extent do teachers perceive that DPLC is accomplishing its
goals of improving literacy?
This case study describes and characterizes the relationship between the implementation of the
DPLC model and collective teacher efficacy and organizational trust at one middle school in a
large urban school district. These research questions provided direction in reviewing relevant
literature, collecting and analyzing data, and interpreting results.
Limitations in the Research Study
Limitations were expected to exist within this mixed methods, single case study,
sequential explanatory design. Studying a single school means that results are not immediately
generalizable to Florida or other states. The research was conducted at one middle school in a
large urban school district in Florida where the DPLC model of professional learning was being
implemented. Therefore, transferability of findings was limited to similar contexts and similar
middle schools experiencing implementation of the DPLC model. The study design included the
use of thick rich description as a credibility technique to promote trustworthiness of the findings.
This technique was especially applicable here in that it helped to clarify the contextual factors
that support transferability.
Because participation in this case study was voluntary, the data gathered were limited by
the perspectives of those who were willing to complete surveys and participate in focus group
interviews. Further threats to internal validity of subjects could include: subject mortality and
attitude of subjects such as observed in the Hawthorne Effect (Fraenkel et al., 2015, p. 180).

12
Additionally, the current educational climate as well as other school and district initiatives
occurring concurrently with the present study may have affected the generalizability of the
results. Furthermore, there is typically an abundance of data to be analyzed and synthesized
within a case study. Creswell and Plano Clark (2018) noted that this can lead to not all data
being equally considered when reaching conclusions. The researcher utilized credibility
techniques such as member checking, triangulation, and negative case analysis, as recommended
by Creswell and Plano Clark to mitigate this limitation (Creswell & Plano Clark, 2018).
An additional limitation, albeit a strength, of this study design was the researcher’s role in
the organization and implementation of DPLC. At the time of the study, the researcher served as
a member of the design team for the content creation and implementation of DPLC within the
large urban school district of the school being studied. The researcher’s role can be considered a
strength because she understood the inner workings of the organization. Moreover, the researcher
was an expert in the DPLC content and was capable of recognizing signs of successful
implementation and acquisition of content expertise. The researcher’s role was a limitation due
to the impossibility to guarantee that there was absolutely no bias about the DPLC content,
implementation, and impact on schools in the district. However, the credibility techniques
previously discussed were used by the researcher to unpack and bracket subjectivity.
Delimitations of the Research Study
This case study was constrained by certain delimitations. The delimitations utilized by
the researcher were established in order to gain a deeper understanding of the impact of DPLC
implementation at one school. Thus, the research was conducted at one middle school in a large
urban school district in Florida. Central Florida Middle School (CFMS) was not ranked among
13
the highest achieving schools or the lowest achieving schools in the district. The researcher
purposely chose CFMS because it was representative of a school with average student
achievement. The researcher made this decision to minimize other possible factors that could
affect organizational trust, collective teacher efficacy, and DPLC implementation at the school
site.
Assumptions of the Research Study
This study was conducted under the following assumptions: (a) participants responded to
the survey honestly regarding their perceptions of collective teacher efficacy, organizational
trust, and DPLC implementation at their school; (b) selected focus group participants responded
honestly regarding their perceptions of collective teacher efficacy, organizational trust, and
DPLC implementation at their school; (c) participants understood the topics and concepts
associated with the survey questions; (d) selected focus group participants understood the topics
and concepts associated with the interview questions and subsequent discussions; (e) instruments
utilized for the survey accurately measured teachers’ perceptions of collective teacher efficacy,
organizational trust, and DPLC implementation; (f) focus group interview questions accurately
captured teachers’ beliefs regarding school culture and DPLC implementation. These
assumptions formed a foundation for the research methods and data interpretation resulting from
this study.
Organization of the Study
This research study has been organized into five chapters. Chapter 1 includes the
background of the study, statement of the problem, purpose of the study, significance of the
14
study, definition of terms, theoretical framework, research questions, limitations, delimitations,
and assumptions of the study. Chapter 2 presents a review of literature, organized in three major
sections, exploring the concepts of collective teacher efficacy, organizational trust, and
distributed leadership. The methodology of the study is explored in Chapter 3, which details the
selection of participants, instrumentation, data collection, and data analysis procedures. Chapter
4 is a presentation of the findings of this study. Each research question is fully addressed
through the analysis of the quantitative and qualitative data collected. Chapter 5 provides a
summary of the study, discussion of findings, recommendations for future research, and
conclusions.

15
CHAPTER 2 LITERATURE REVIEW
Introduction
This study was designed to investigate the District Professional Learning Community
(DPLC) model of professional development during years one and two of implementation in a
large urban school district. DPLC has used a distributed leadership approach to deliver cross-
content area literacy strategies to all teachers across the school district. The literacy goals of the
DPLC initiative specifically stated that all students will: (a) use close reading strategies to
comprehend and persevere through content specific complex text, (b) use complex texts as the
basis for participating in rigorous discussions and responding to text-dependent questions, (c) use
strategies and tools to organize thinking to prepare for writing in response to complex texts
across all content areas, and (d) use literacy strategies to write with evidence in response to
complex texts across all content areas. In addition to the improvement of literacy instruction, the
DPLC model offers potential for impacting organizational trust and collective teacher efficacy in
schools.
To that end, the leadership goals of the DPLC initiative specifically state that school
teams will: (a) use strategies for building and sustaining high performing teams in order to
support a culture of continuous improvement, (b) utilize distributed leadership strategies to build
sustainable teacher leadership, (c) use strategies that increase collective efficacy and pedagogical
expertise through processes around opening up classroom practice, (d) plan, implement, monitor,
and modify cycles of professional learning, and (e) use principles of responsive facilitation to
support implementation of cycles of professional learning. These leadership goals support the
work of DPLC by providing the structure for the professional learning.

16
Literature searches revealed no existing literature on the influence of the DPLC model on
collective teacher efficacy and organizational trust. In order to investigate the influence of the
District Professional Learning Community (DPLC) model of professional learning on teacher
perceptions, the following three research questions were developed.
1. In what ways and to what extent is collective teacher efficacy influenced by
participation in DPLC model of professional learning?
2. In what ways and to what extent is teacher organizational trust influenced by
participation in DPLC model of professional learning?
3. In what ways and to what extent do teachers perceive that DPLC is accomplishing its
goals of improving literacy?
This case study describes and characterizes the relationship between the implementation
of the DPLC model and collective teacher efficacy and organizational trust at one middle school
in a large urban school district. These research questions provided direction in reviewing
literature regarding the critical components of this case study.
Search Procedure
Relevant research was selected for inclusion in this literature review according to the
following procedures. A database search was conducted through a university library portal. The
following search terms were established by the researcher and university research specialist:
(“teacher leadership” OR “distributed leadership”) AND (“professional development”) AND
(“collective teacher efficacy” OR trust OR collegiality) AND (“middle schools” OR “elementary
schools” OR “high schools” OR “secondary schools”). The following databases were explored

17
using the established search terms: Educational Resources Information Center (ERIC) through
EBSCO, ProQuest, Science Direct, and Web of Science.
Each database was searched for peer reviewed publications written in English. The
results for each database search were examined for relevance to this research study. Each
publication generated from the search was screened by title, abstract, and review of content.
Studies that were unrelated to this topic of research were excluded. Furthermore, due to the
amount of relevant research generated from the four databases, studies conducted outside of the
United States were excluded. This exclusion was also made in an effort to increase
transferability of findings.
Of the 20 ERIC/EBSCO hits, two were eligible for use in this study. Of the 477 ProQuest
hits, 25 were eligible for use in this study. Of the 73 Science Direct hits, two were eligible for
use in this study. Of the 21 Web of Science hits, four were eligible for use in this study.
Additionally, reference lists from relevant, well-cited sources were further explored in order to
ensure that all relevant, foundational, and seminal studies have been included in this literature
review.
Chapter Organization
This literature review presented in this chapter has been organized in three major sections
represented by the key research topics driving this study: (a) collective teacher efficacy, (b)
organizational trust, and (c) distributed leadership. The three major sections include subsections
discussing the conceptual perspectives of each topic, the connection to student achievement, and
identified barriers and how to overcome them.
18
Additionally, the collective teacher efficacy section includes a subsection on the
connection between collective teacher efficacy and faculty trust. This subsection illustrates the
relationship between these two concepts before transitioning into the organizational trust section,
describing ways to increase collective efficacy through subsections of leadership practices and
professional learning. This structure was used to outline the connectivity of the research of
collective efficacy, professional learning, and distributed leadership.
The distributed leadership section includes subsections on the connection between
distributed leadership and following concepts: professional learning, organizational trust, and
collective teacher efficacy. These additional subsections link distributed leadership behaviors to
the DPLC model and the leadership goals of this reform effort.
Collective Teacher Efficacy
Conceptual Perspectives
Goddard et al. (2000) defined collective teacher efficacy as “the shared perceptions of
teachers in a school that the efforts of the faculty as a whole will have positive effects on
students” (p. 480). The concept of collective efficacy was operationalized utilizing Bandura’s
(1997) foundational research on self-efficacy and Tschannen-Moran and Hoy’s (1998) teacher
efficacy model (Goddard et al., 2000). Bandura’s social learning theory (1977) specifically, the
concept of an individual’s motivation, links self-motivation as a key factor in behavior. Bandura
(1977) built his self-efficacy research on his theories of motivation. “Self-efficacy refers to an
individual's belief in his or her capacity to execute behaviors necessary to produce specific
performance attainments” (Bandura, 1977, p. 192). Bandura (1977) explained, “Self-efficacy
reflects confidence in the ability to exert control over one's own motivation, behavior, and social

19
environment” (p. 211). The concept of collective teacher efficacy applies this theory of belief in
one’s self to belief in the collective group’s efforts (Goddard et al., 2000). Bandura (1993)
introduced the idea of collective teacher efficacy as an opportunity to expand on his self-efficacy
research. Bandura (1993) was the first to link perceived collective efficacy to student
achievement. Consequently, Bandura (1993) opened the door for the operationalization and
measurement of collective teacher efficacy.
Goddard et al. (2000) utilized quantitative methods to design and test a 21-item Likert
scale Collective Efficacy Questionnaire (The CE Scale). The developed instrument (see
Appendix A) was subjected to the appropriate and necessary measures to ensure its validity and
reliability (Goddard et al., 2000). The CE Scale has been a widely recognized instrument
utilized by many researchers of collective efficacy (Donohoo, 2017), taking into consideration
the teacher self-efficacy principles utilized in the Bandura and Tschannen-Moran et al. (Goddard
et al., 2000) model: mastery experience, physiological arousal, vicarious experience, and verbal
persuasion. Additionally, according to Goddard et al. (2000), perceptions of group competence
contribute to the CE Scale, addressing the domains “analysis of the teaching task” (p. 485) and
“assessment of teaching competence.” (p. 485). Goddard, et al. (2000) explained that “analysis
of the teaching task” (p. 485) refers to “teachers analyze what constitutes successful teaching in
their school, what barriers or limitations must be overcome, and what resources are available to
achieve success” (p. 485). “Assessment of teaching competence” (Goddard et al., 2000, p. 485)
produces inferences about the faculty's teaching skills, methods, training, and expertise as well as
students’ ability to learn. These two domains are used to simultaneously assess whether the
organization has the capacities to succeed in teaching students. As shown in Appendix B, the

20
interactions of these factors and domains lead to the shaping of collective teacher efficacy in a
school (Goddard et al., 2000). Through the operationalization and instrumentation of Goddard et
al. (2000), a clearly defined instrument has been established, allowing for empirical research to
be conducted on the concept of collective teacher efficacy.
Barriers to Collective Teacher Efficacy
Though the research has been consistent in findings that collective teacher efficacy has a
positive impact on school culture and student achievement, there are barriers that educators must
face as they strive for collective efficacy (Sutcher et al., 2016). According to Sutcher et al.’s
2016 teacher supply and demand report, the emerging teacher shortage in the United States was
being driven by four main factors: (a) a decline in teacher preparation enrollments; (b) district
efforts to return to pre-recession pupil-teacher ratios; (c) increasing student enrollment; and (d)
high teacher attrition. Sutcher et al. reported that between 2009 and 2014, teacher education
college enrollments dropped from 691,000 to 451,000, a 35% reduction. These researchers also
observed that for those teachers entering the field, induction had proven to be unsuccessful and
that teachers with little preparation tended to leave at rates two to three times as high as those
who had completed a comprehensive preparation before they enter the profession. These factors
have continued to contribute to a national teacher shortage, consequently, impeding collective
efficacy.
Sutcher et al. (2016) cited the main factor contributing to teacher attrition has been
dissatisfaction with the conditions surrounding the profession. Areas of dissatisfaction include
concerns with the administration, ranging from lack of support to lack of input and control over
teaching decisions; testing and accountability pressures; dissatisfaction with the teaching career;

21
or unhappiness with various working conditions (Sutcher et al., 2016). Administrative support
was found to be the factor most consistently associated with teachers’ decisions to stay or leave a
school. Teachers who found their administrators to be unsupportive were more than twice as
likely to leave as those who feel well-supported, according to Sutcher et al. Several additional
factors surfaced from Sutcher et al.’s research on attrition, including: the quality of school
leadership, professional learning opportunities, instructional leadership, time for collaboration
and planning, collegial relationships, and decision-making input. These conditions surrounding
dissatisfaction with the teaching profession have repercussions for teacher retention and school
culture.
Teacher attrition is not the only problem; administrator mobility and retention are issues
as well. In a 2014 report, The Hanover Research Council (THRC) discussed school climate,
turnover, and academic achievement. According to the report, the average length of a principal’s
tenure was three to four years, even fewer years for low-performing schools and schools in areas
of poverty. Additionally, annual turnover rates ranged between 15 and 30%, while large urban
school districts tended to see even higher turnover rates. Furthermore, the Council found that the
probability of principals leaving their position increased each year for the first five years, then
decreased once principals reached six years in service at a particular school. Because turnover
negatively impacts school climate and teacher retention, these findings highlight the importance
of giving effective principals the opportunity to shape a school climate and culture for at least six
years. The 2014 report explained that simply replacing a principal in a failing school may
actually do more harm than good; but replacing an ineffective principal with a highly effective
22
principal, while providing incentives for the new principal to remain at the school for more than
five years, could have a dramatic impact on the school’s achievement and other outcomes.
Urban schools, especially, have faced barriers such as unequal funding, unqualified
teachers, low expectations, and high turnover in leadership and instructional staff, students in
high-poverty and high-minority schools have suffered the consequences of teacher shortages
(Gallagher et al., 2012). Sutcher et al., in their 2016 report on the impending supply and
demand/shortage crisis revealed, “Considerable evidence shows that shortages historically have
disproportionately impacted our most disadvantaged students and that those patterns persist
today” (p. 5). These researchers reported that high-minority schools had four times as many
uncertified teachers as low-minority schools, but that the same inequities existed between high-
poverty and low-poverty schools. In the midst of a teacher shortage, the schools with the fewest
resources and least desirable working conditions were left with the vacancies (Sutcher et al.,
2016). Consistent vacancies within high needs schools create additional barriers to establishing
and sustaining a culture of collective efficacy.
Student Achievement
Researchers have concluded that collective teacher efficacy has a strong measurable
effect on student performance (Goddard et al., 2000, 2004; Eels, 2011; Hattie, 2017; Moolenaar,
Sleegers, & Daly, 2012). Goddard et al. (2000) conducted a study of 452 urban elementary
teachers in 47 schools. The results of this study established that a one-point increase in a
school’s collective efficacy score (on a six-point scale) was associated with an 8.5-point increase
in student achievement scores. Their correlational analysis indicated that scores on the collective
efficacy scale were significant predictors of mathematics and reading achievement.
23
Additionally, in this study, the researchers concluded that perceptions of collective efficacy were
even stronger predictors of academic performance than student demographic socioeconomic
status, gender and race. Researchers have continued to explore the connections between
collective teacher efficacy and environmental factors such as socioeconomic status.
In another study involving 1,981 K–8 teachers, Goddard and Skrla (2006) found that
contextual and demographic factors such as a school’s socioeconomic status, the experience
level of the faculty, and students’ prior academic performance accounted for less than half (46%)
of the differences in collective efficacy between schools. In a later study, Moolenaar et al.
(2012) examined the relationship between teacher networks and student achievement and
influence of these teachers’ collective efficacy beliefs. Data were collected from 53 elementary
schools. Findings indicated that well-connected teacher networks were associated with strong
teacher collective efficacy which, in turn, supported student achievement. Moolenaar et al. also
noted that perceived collective efficacy was positively associated with increased language
achievement, more than was the influence of socioeconomic status. This suggests that there are
several other factors involved in building collective efficacy that schools can influence.
Many researchers have documented the greater impact of collective efficacy on student
achievement than socioeconomic status (Goddard et al., 2000; Goddard & Skrla, 2006; Eels,
2011; Hattie, 2015; Moolenaar et al., 2012). Hattie’s (2017) effect size for collective efficacy
(1.57) was triple the effect size of socioeconomic status. These findings dispute the claims of
Coleman in his 1966 report that the factors outside of the school, including socioeconomic status,
have the greatest impact on student achievement.
24
Faculty Trust
Researchers have also found a strong, positive relationship between faculty trust in
colleagues and collective teacher efficacy (Goddard et al., 2000). Trust is “an individual’s or
group’s willingness to be vulnerable to another party based on the confidence that the latter party
is benevolent, reliable, competent, honest, and open.” (Hoy & Tschannen-Moran, 2003, p. 186).
In their research, Tschannen-Moran et al. (1998) concluded there were three dimensions of
faculty trust: (a) trust in the principal, (b) trust in colleagues, and (c) trust in clients--students and
parents. In 2002, Hoy explored the complexity of the concept of faculty trust. He examined the
impact of faculty and parental trust in students, finding that faculty trust was an important factor
of student achievement. Further research has expanded Tschannen-Moran and Hoy’s
findings. Adams, Ware, Miskell, & Forsyth (2015) studied the development of a positive
framework for effective urban public schools. They found that the school climate is comprised
of three generative norms: collective faculty trust in students, collective student trust in teachers,
and student-perceived academic achievement. Their study results support the theory that
collective faculty trust in students, collective student trust in teachers, and student-perceived
academic emphasis combine to form a climate that has positive outcomes for urban school
performance. (Adams et al., 2015). The findings of Adams et al. support the interconnectedness
of collective efficacy and trust and their relationship to student achievement.
The concepts of collective teacher efficacy and collective faculty trust were codependent
entities in Hoy, Tarter, and Woolfolk Hoy’s (2006) study on academic optimism. The
combination of collective efficacy, collective faculty trust, and the components of a professional
learning community, (i.e., collaborative work practice, commitment to improving teaching and

25
learning, and high expectations and high academic standards), create the school conditions
necessary for student achievement (Hoy, Tarter, & Woolfolk Hoy, 2006). This reinforces the
relationship among collective efficacy and professional learning and will be further discussed in
the next section involving opportunities to increase collective teacher efficacy.
Opportunities to Increase Collective Teacher Efficacy
Leadership Practices
Because collective efficacy beliefs are an important aspect of organizational culture, 21st
century researchers began to look at specific actions that school or district leaders can take to
improve collective efficacy among teachers (Goddard et al., 2004). Goddard suggested that a
strong sense of collective efficacy enhances teachers' self-efficacy beliefs, but weak collective
efficacy beliefs undermine teachers' sense of efficacy. This symbiotic relationship helps explain
the consistent finding that perceived collective efficacy is a significant factor in the
accomplishment of organizational goals (Goddard et al., 2004).
Supovitz and Christman (2003) found that the connection between greater teacher
collective efficacy and improved student achievement was related to specific school behavioral
factors. Schools which demonstrated better student academic performance had leaders who
provided opportunities for “structured, sustained, and supported instructional discussions” (p. 5)
and “investigated the relationships between instructional practices and student work” (p. 5).
Essentially, Supovitz and Christman found that when leaders provided regular structured
opportunities for teachers to focus on instructional practices, teachers applied this new learning
and produced more effective teaching. Similarly, Goddard et al. (2004) found that when teachers
were empowered to influence instructionally relevant school decisions, they were likely to report
26
more confidence in the capability of their faculty colleagues to educate students. Consequently,
affording faculty members some control over school decisions may be one approach to
strengthening collective efficacy beliefs in schools (Goddard et al., 2004). Leadership practices
and decisions continue to have an effect on school culture and collective efficacy.
Supporting factors have emerged from further research on what fosters collective teacher
efficacy (Brinson & Steiner, 2007). Building instructional knowledge and skills, creating
opportunities for teachers to collaboratively share skills and experience, interpreting results and
providing actionable feedback on teachers’ performance, and involving teachers in school
decision making create a culture of collective efficacy (Brinson & Steiner, 2007). These factors
connect to components of a research-based professional learning.
Professional Learning
Donohoo (2017), in her study of collective efficacy, reiterated the importance of effective
professional development practices as it relates to a culture of collective efficacy and student
achievement. She identified the following seven characteristics of effective professional
development that foster collective teacher efficacy: (a) ongoing; (b) reinforces meaningful
collaboration; (c) grounded in educator’s practice; (d) involves reflection based on evidence of
student outcomes; (e) increases teacher influence; (f) builds capacity for leadership; (g) taps into
sources of efficacy (mastery experiences, vicarious experiences, social persuasion, and affective
states). Each of these characteristics have been supported by a plethora of additional research
(Cantrell & Callaway, 2008; Donohoo, 2018, Dufour, 2006; Kennedy & Smith, 2013; Zambo &
Zambo, 2008).
27
Schools that utilize organizational structures that support teachers’ sources of efficacy
can have a positive relationship on organizational behaviors (Kennedy & Smith, 2013). One
example of a structure that supports the characteristics of effective professional learning is the
professional learning community (PLC) model (Kennedy & Smith, 2013). Kennedy and Smith’s
2013 nationwide study revealed that shared leadership involving teacher instructional leadership
practice had a direct relationship to a strong professional learning community. Furthermore, the
PLC model supported authentic teacher collaboration and opportunity to share expertise (Dufour,
2006; Kennedy & Smith 2013). Organizational structures such as this foster an environment
conducive to effective professional learning.
Zambo and Zambo (2008) examined the impact of professional development on teacher
individual and collective efficacy, resulting in two significant findings. First, the paired sample t
test revealed that teachers in the lower performing urban school district and the higher
performing affluent district both showed significant gains in personal competence (a subsection
of individual efficacy) from pretest to post test (Zambo & Zambo, 2008). The second finding
was that only teachers from the lower performing urban school district showed significant gains
in group competence (a subsection of collective efficacy). These findings provided further
support for Donohoo’s (2017) observation that effective professional development “taps into
sources of efficacy” (p. 52). The link between professional development and collective teacher
efficacy is further strengthened through Donohoo’s research.
In her comprehensive study of the extant research regarding behaviors linking collective
teacher efficacy to student achievement, Donohoo (2018) found that several productive
behaviors, including positive attitudes toward professional development, were linked to
28
collective teacher efficacy. She posited that this openness toward professional development can
lead to deeper implementation of school improvement strategies. In one study, Cantrell and
Callaway (2008) investigated the relationship between the collective efficacy beliefs of junior
high school teachers and a professional development program focused on the implementation of
cross content area literacy strategies. Their findings indicated that teachers with higher levels of
collective efficacy were more successful with owning literacy strategies, applying the strategies
to the content area they teach, and were more persistent with implementation when barriers
arose. These findings linking collective efficacy to professional development are particularly
relevant to the present study, as they support the philosophy of the District Professional Learning
Community model.
Organizational Trust
Conceptual Perspectives
Though many researchers have explored the topic of trust, it is not easy to define.
Tschannen-Moran and Hoy (1998) described the complex nature of studying trust by comparing
it to a moving target because “it changes over the course of a relationship, and the nature of a
trusting relationship can be altered instantaneously…by a betrayal of confidence” (p. 2).
However, a commonality in the definitions of trust over the span of the past 60 years is its
connection to vulnerability (Tschannen-Moran & Hoy, 1998). If there is no vulnerability, there
is no need for trust (Baier, 1985; Hoy & Tschannen-Moran, 1999). Though the broader topic of
trust has remained a historical topic of research, the exploration of trust in schools was limited
until the beginning of the 21st century.
29
In their initial exploration into faculty trust, Tschannen-Moran and Hoy (1998)
established a need for a more concentrated effort to study trust in schools. The implications for
further research called for a more precise operationalization of faculty trust and an instrument to
measure it (Tschannen-Moran & Hoy, 1998). After synthesizing 150 pieces of literature
spanning over 40 years of research, Hoy and Tschannen-Moran (1999) fulfilled the established
gap in the research by defining faculty trust. Hoy and Tschannen-Moran’s interest in the concept
of faculty trust became a springboard for discovery.
Tschannen-Moran and Hoy (1998) have pursued the concept of trust, building on two
decades of research. Their following operationalized definition of trust served as an anchor for
this literature review: “Trust is an individual’s or group’s willingness to be vulnerable to another
party based on the confidence that the latter party is benevolent, reliable, competent, honest, and
open” (Hoy & Tschannen-Moran, 2003, p. 186). More specifically, faculty trust is “the extent to
which the faculty as the group is willing to risk vulnerability” (Hoy & Tschannen-Moran, 2003,
p. 186). After operationalizing the concept of faculty trust, Hoy and Tschannen-Moran began
building an instrument to measure it.
Hoy and Tschannen-Moran (2003) established, the Omnibus T-Scale (see Appendix C), a
valid and reliable instrument used to measure trust in schools. The Omnibus T-Scale consists of
26 Likert scale items that measure three aspects of faculty trust: trust in colleagues (fellow
teachers), trust in the principal, and trust in clients (students and parents). This instrument has
been used in a multitude of studies measuring the impact of trust in schools (Adams & Forsyth,
2013; Forsyth, Adams, & Hoy, 2011; Goddard et al., 2001, 2009; Hoy et al., 2006.). Through
30
Hoy and Tschannen-Moran’s research of faculty trust using their instrument, the literature on the
topic has become richer over the past two decades.
The concept of relational trust is also referenced throughout the literature. Bryk and
Schneider (2003) explained the conditions for relational trust, “Each party in a relationship
maintains an understanding of his or her role's obligations and holds some expectations about the
obligations of the other parties” (p. 41). In order for a school community to have a successful
relationship, all stakeholders must understand their roles and have clear expectations about their
obligations as well as the responsibilities of others (Bryk & Schneider, 2003). Similar to the
components of trust discussed by Tschannen-Moran and Hoy (2003), Bryk and Schneider, 2003
discussed four specific considerations of a trusting relationship: respect; personal regard;
competence in core role responsibilities; and personal integrity.
Three Dimensions of Faculty Trust
Trust in Principal
In Tschannen-Moran and Hoy’s (1998) conceptualization and measurement of faculty
trust, their directional hypothesis was supported by empirical evidence. Faculty trust in all three
dimensions were moderately related to each other. Though all three dimensions were found to
influence each other, the dimensions still required unique behaviors that influence trust in each
dimension. These researchers found that when teachers trusted their principal, they were more
likely to trust their colleagues and clients. Essentially, trust breeds trust; however, it is not
exactly that simple.
The relationship between faculty trust in colleagues and faculty trust in principal is not
automatically bidirectional, according to Tschannen-Moran and Hoy (1998), but principal

31
behaviors are directly responsible for producing trust in principal. Trust in principal has been
defined as “the faculty has confidence that the principal will keep his or her work and act in the
best interest of the teachers” (Tschannen-Moran and Hoy, 1998, p. 6). Ultimately, principals are
responsible for the level of trust their faculty has in them.
Trust in Colleagues
Teacher trust in colleagues has a close relationship with how teachers treat each other in a
school and has been defined as “the faculty believes that teachers can depend on each other in
difficult situations and that teachers can rely on the integrity of their colleagues” (Tschannen-
Moran and Hoy, 1998, p. 6). Weiner and Higgins (2016), in their study of how teacher
professional learning culture impacts faculty trust in colleagues, examined elements such as
teacher collaboration, psychological safety, and internal accountability. These elements
contributed to teachers’ trust in one another and the culture they created as a faculty.
Additionally, one of the key findings from this study revealed “teacher reported aspects of school
culture are positively related to student learning culture” (p. 41). These findings suggest that
teachers’ relationships with each other impact students’ learning environment.
Trust in Clients
Trust has always been vital from the standpoint of families (Tschannen-Moran, 2014).
When parents send their child to school they are entrusting school officials with their most
valuable entity (Tschannen-Moran, 2014). In order for parents to trust school personnel, they
must believe that faculty members are benevolent, reliable, competent, honest, and open (Hoy &
Tschannen-Moran, 2003). Goddard, Tschannen-Moran, and Hoy (2001) also found that teacher
trust in students and parents was critical to school success. They observed that teacher trust in
32
students and parents fosters a context that supports student achievement, even in the face of
poverty (Goddard et al., 2001). In fact, teacher trust in students and parents was so
interconnected that in the development of the Omnibus Trust Scale, the strong trust relationship
in the two groups was indistinguishable (Hoy & Tschannen-Moran, 2003). This resulted in Hoy
and Tschannen-Moran’s (2003) decision to group them together under the category of teacher
trust in clients.
Improving the quality of communication between home and school has been noted as the
best way to build trust between families and school, and fostering high-quality, respectful
communication, at regular intervals, has historically been a critical task of school leadership
(Tschannen-Moran, 2014). Epstein (1995) stressed the importance of effective communication
strategies in multiple forms and modes (e.g., face to face conferences, written correspondence,
phone calls, language translation options, alternate scheduling). Adams and Forsyth (2013)
noted that family-school partnerships enhance student success when the goals of those
partnerships are centered directly on improving educational outcomes for students. Tschannen-
Moran were succinct in their observation that it is vital for partners to operate with the belief that
parents and teachers have a shared responsibility for student educational outcomes. A trusting
partnership between teachers and parents creates the conditions that foster student success.
Student Achievement
Empirical evidence reveals a positive relationship between trust and student achievement
(Adams, 2013; Adams & Forsyth, 2013; Bryk & Schneider, 2003; Goddard et al., 2001; Romero,
2015). Goddard et al. (2001) conducted a foundational study based on data collected from 452
teachers and the corresponding student achievement data in reading and mathematics of 2,536
33
fourth-grade students from 47 urban elementary schools. The research revealed teacher trust in
students and parents as a significant positive predictor of student achievement. The empirical
links between trust and student achievement continued to be explored.
Bryk and Schneider (2003) conducted a 10-year longitudinal study in over 400 Chicago
elementary schools. The study revealed a significant relationship between student achievement
and levels of trust in schools. Schools with high trust cultures were connected with a strong
sense of collective efficacy. Collective efficacy, the collective belief of teachers in their ability
to positively affect students, was the most influential factor on student achievement with a 1.57
effect size (Hattie, 2017). Also, relational trust and collective efficacy had a coexisting
relationship (Bryk & Schneider, 2003). This evidence suggests an even tighter coupling between
trust and student academic outcomes.
Adams (2013) explored the concept of collective trust in his study of 85 elementary,
middle, and high schools in a large urban school district. The construct of collective trust
includes: faculty trust in colleagues, faculty trust in principal, faculty trust in students, and
principal trust in teachers. Adams concluded that a culture of collective trust has a large effect
on school performance, also confirming that low trust in any form has harmful consequences for
instructional capacity, which negatively impacts classroom instruction.
Adams & Forsyth (2013) revisited the trust effect established by Goddard et al.’s (2001)
earlier study. They tested the main effect of collective faculty trust on student achievement after
controlling for free and reduced-price lunch and prior achievement. Data were collected from
1,039 teachers and 1,648 students in 56 urban elementary schools. Results confirmed Goddard
et al.’s 2001 findings. Mean mathematics and reading achievement scores were higher in

34
schools with a stronger culture of collective faculty trust (Adams & Forsyth, 2013). This adds to
the research proving that factors such as trust and collective efficacy have a higher effect on
student achievement than socioeconomic status.
With a minimal amount of trust research having been conducted in secondary schools,
Romero (2015) added a valuable study to the existing literature, using a nationally representative
sample of students attending public high schools in the United States. She accessed data from the
Educational Longitudinal Study and examined the relationship between student trust, behavior
and high school outcomes, controlling for socioeconomic status (SES), school size and prior
achievement. Romero (2015) found a significant relationship between student trust, behavior,
and high school outcomes. Students who exhibited trust behaviors had fewer negative behavioral
incidents and better academic outcomes. The results were consistent regardless of socioeconomic
status, school size, or prior achievement. Romero (2015) explained, “School leaders cannot
change parental income or education, but can build trust. Developing and attending to student
trust may not only mean that students are better behaved but, more importantly, are more
successful academically” (p. 233). The results of this study further illustrate the high impact of
trust in schools, and its significance over demographic factors.
Overcoming Barriers to Trust
“We inhabit a climate of trust as we inhabit an atmosphere and notice it as we notice air,
only when it becomes scarce or polluted” (Baier, 1985, p. 234). Tschannen-Moran and Hoy
(1998) explained that distrust tends to breed distrust; “Broken trust is likely to ripple through the
system” (p. 344). Though the literature has illustrated consistent findings that trust has a positive
impact on school climate, school-community relationships, and student achievement, there are

35
barriers that educational leaders must face as they strive to foster a culture of trust within the
school and the community. The following sections discuss obstacles to trust within schools and
the community as well as research-based methods to build, repair, and foster relational trust.
Principal-Teacher Trust
Brewster and Railsbeck (2003) examined the obstacles and research-based practices
involved in maintaining trust in schools, specifically focused on teacher trust in each other and
reciprocal principal-teacher trust. They highlighted the following barriers to fostering trusting
relationships among teachers, principals, and other school staff members: (a) top-down decision
making that is perceived as arbitrary, misinformed, or not in the best interest of the school; (b)
ineffective communication; (c) frequent turnover of school leadership and teachers; (d) a culture
of isolation. When a faculty is constantly questioning principal decision making, distrust can
arise. Communication breakdowns within a hierarchical approach to leadership can result in the
faculty not trusting principal choices and actions. This may lead to low teacher retention and a
lack of collaboration among the staff.
Brewster and Railsbeck (2003) recommended that principals overcome these barriers by
demonstrating personal integrity through honesty and commitment to follow-though with all
stakeholders. Furthermore, the researchers advised principals to show that they care by taking a
personal interest in the well-being of teachers, students, families and the community and by
making themselves accessible to stakeholders. As part of making themselves available to speak
with staff members, Brewster and Railsbeck suggested that principals must be open to listening
to dissenting views with a non-judgmental ear and that school leaders can also facilitate authentic
participation of faculty by including teachers in decision making. Goddard et al. (2004) found

36
that when teachers were empowered to influence instructionally relevant school decisions, they
were likely to report more confidence in the capability of the faculty to educate students. Thus,
as advocated by Goddard et al. (2004), affording faculty members some control over school
decisions may be one approach to strengthening collective efficacy beliefs in schools. These
principal behaviors foster a school culture of open communication, vulnerability, and collective
trust.
Teacher-Colleague Trust
Trust between teachers and principal is not enough to foster a trusting school community
(Tschannen-Moran & Hoy, 1998). Adams (2013) viewed teacher-colleague trust as vital to
collective trust. Dufour, in his 1998 and 2006 research on the impact of professional learning
communities, suggested that collaboration was the key to a successful school. In his 2006 work,
he focused on collective commitment, explaining that it occurs through a progression of key
actions including: working with faculty using data to agree on a common goal(s), identifying
competencies that are critical in helping staff achieve goal(s), designing purposeful, goal-
oriented strategies and programs to develop those competencies; and sustaining commitment to
those strategies and programs until staff display ownership of intended knowledge and skills.
Brewster and Railsbeck (2003) expressed the view that teachers can overcome barriers to
trusting relationships by engaging in full faculty activities centered on the schools, mission,
vision, and core values and that when teachers have meaningful opportunities to collaborate with
one another, faculty trust increases.

37
Faculty-Client Trust
Trust is a key element in collaboration with parents on important aspects of school
decision making (Hoy & Tschannen-Moran, 2003). Developing trust between teachers and
families who share different cultural backgrounds can be challenging (Tschannen-Moran, 2014).
Parents in most urban school communities remain highly dependent on the teacher’s approach to
communication (Bryk & Schneider, 2003). Epstein (1995) found that schools in more
economically depressed communities were more likely to only contact families about the
problems their children were having. Some six years later, Epstein suggested developing
balanced partnership programs as one way to include communication about positive
accomplishments of students (Epstein, 2011). These positive communications between teachers
and families are one way to increase faculty-client trust.
To promote relational trust, teachers must also be cognizant of parents' vulnerabilities and
reach out actively (Tschannen-Moran, 2014). Teachers of diverse populations must not only
know their students well. Consequently, they must develop the interpersonal skills and
empathetic demeanor needed to effectively engage families (Bryk & Schneider, 2003).
Furthermore, principals can help set the tone for trusting relationships with parents by engaging
in proactive strategies to support student success and by making positive connections with
parents (Tschannen-Moran, 2014).
Additionally, the stability of the student body directly impacts teacher-parent trust (Bryk
& Schneider, 2003). Building and maintaining trust depends on repeated social exchanges (Bryk
& Schneider, 2003, Epstein, 2011). Teachers find it hard to develop and sustain direct positive
engagement with all parents when the student population changes frequently. Furthermore, in
38
migrant neighborhoods, parents lack such personal communication with teachers, and may be
hesitant to reach out for various social and cultural reasons (Bryk & Schneider, 2003). This
makes the teacher’s role in initiating contact with families even more vital to build a relationship
that will foster positive student outcomes.
Once genuine relationships are built between the school and families, more opportunities
for connection through school sponsored events can occur. Epstein (1995) recommended parent
involvement through volunteering by encouraging parental interaction with their children in their
learning environment such as classroom assistance or field trip attendance. Additionally, parents
feel valued when they are part of school decision making. Organizations such as Parent-Teacher
Association (PTA) and special project committees can give parents a voice regarding their
child’s educational experiences (Epstein, 2011). Authentic engagement opportunities for parents
continue to build relationships between home and school.
Distributed Leadership
Conceptual Perspectives
Many 21st century educational researchers have taken on the topic of distributed
leadership. Though the model of distributed leadership has been a focus of study, its definition
has remained unclear (Fasso, Knight, & Purnell, 2016). The concept of distributed leadership
takes on many forms and structures; however, the existing literature does show strong
connections to the concepts of shared, team, collaborative, democratic, and participative
leadership (Harris, 2008; The Hanover Research Council [THRC], 2010). Moreover, the
research in this area has consistently centered on the theme that even the most effective
principals cannot transform a school without the support of their faculty (National Staff
39
Development Council [NSDC], 2000). According to Spillane (2005), the foundational principle
of distributed leadership has been to recognize that the principal is not the only leader in a given
school. By sharing authority with a variety of stakeholders, school leaders can create an
environment that considers the ideas, styles, and beliefs of all interested parties (Spillane, 2005).
Most importantly, distributed leadership involves the idea that certain responsibilities are
dispersed, and shared decision making remains the highest priority (Spillane, 2005). “If
expertise is distributed, then the school rather than the individual leader, may be the most
appropriate unit for thinking about the development of leadership expertise” (Spillane,
Halverson, & Diamond, 2001, p. 27). The concept of shared authority and collaborative culture
continues to serve as an anchor for current distributed leadership research.
As noted by Elmore (2000), to create a culture that promotes distributed leadership,
principals must foster the practice of teacher leadership. They need leadership opportunities to
serve on decision making committees, mentor less experienced staff, coach peers, and support
colleagues in professional learning. Distributed leadership allows for a school culture of
collective responsibility. (Elmore, 2000; THRC, 2010). This means that the job of
administrative leaders is primarily about enhancing the skills and knowledge of people in the
organization, creating a common culture around the use of those skills and knowledge, fostering
a productive relationship with each other, and holding all individuals accountable for their
contributions to the collective result (Elmore, 2000). Mutual accountability among principal and
faculty is key to a distributed leadership approach.
Distributed leadership, as discussed by Spillane et al. (2001), encompasses essential
qualities of other effective leadership approaches. For example, a distributive leader exudes the
40
ability to empower others; this trait defines a transformational leader. Hattie (2009) synthesized
800 meta-analyses focusing his study of leadership on achievement. Transformational leaders
(effect size of .40) were found to work with faculty to overcome challenges and solve problems
to attain group goals.
Furthermore, distributed leadership also requires key components of instructional
leadership including: building norms of trust, collaboration, supporting teacher development, and
monitoring instruction and innovation (Spillane et al., 2001). In his meta-analyses, Hattie (2009)
discovered that principals who subscribe to instructional leadership had a statistically significant
effect of student outcomes (effect size .66). Instructional leadership refers to those principals
who have their major focus on creating a learning climate, free of disruptions, with clear
objectives and high expectations (Hattie, 2009). The connections between instructional
leadership quality and distributed leadership values surfaces throughout the extant literature.
Barriers to Distributed Leadership
Though findings have been consistent in determining that distributed leadership has a
positive impact on professional learning, school culture and student achievement, there are
barriers that educational leaders must face as they strive to implement this approach to
leadership.
Spillane (2003) described the negative impact of turnover of key leadership combined
with limited preparation for this turnover as a threat to the sustainability of improvement
initiatives. According to a report by The Hanover Research Council [THRC] (2014), the average
length of a principal’s tenure was three to four years, even fewer years for low-performing
schools and schools in areas of poverty. Furthermore, the probability of principals leaving their
41
position increased each year for the first five years, then decreased once principals reached six
years in service at a particular school (THRC, 2014). Because turnover negatively impacts
school climate and teacher retention, this research finding highlights the importance of giving
principals the opportunity to shape a school climate and culture for at least six years in order to
effectively implement an organizational change.
Additional barriers may impede a distributed leadership approach. One further challenge
is presented as some leadership functions have been strongly tied to the school principal and do
not allow for shared decision making (Spillane, 2003). The Hanover Research Council (2010)
found that community and district office expectations may reflect that the principal should be in
charge of every leadership activity at the school. When certain top-down approaches exist within
an education system, opportunities for teacher leadership may be limited (Kurt, 2016). Also,
union resistance can be another factor impeding a culture of distributive leadership. Teacher
performance of duties that may be discouraged because they are perceived to be administrative in
nature or because they occur outside teachers’ required duties (THRC, 2010). Thus, district and
school culture dictate conditions in which distributed leadership would thrive.
Student Achievement and School Reform
Empirical evidence has documented the positive relationship between distributed
leadership and student achievement (Copland, 2003; Gordon, 2005; Harris, 2008; Leithwood &
Mascall, 2008; Louis, Leithwood, & Wahlstrom, 2010; Spillane, Camburn, & Stitziel Pareja,
2007). Furthermore, the link between distributed leadership and student achievement has
remained consistently positive across studies involving elementary and secondary schools
(Spillane et al., 2007). Spillane, Halverson, and Diamond’s (2001) four-year longitudinal study
42
established a foundation for future research, exploring the impact of distributed leadership on
student achievement. Spillane et al. (2001) posited that school leadership should be thought of
as “distributed practice, stretched over the school social and situational contexts” (p. 23).
Spillane et al. (2001) also expressed the belief that the organizational structure and various
members of a school community play an intricate role in school reform.
Copland’s (2003) study focused on the reform efforts in 86 schools engaging in a shared
leadership model. The results of the three-year study revealed positive trends in performance
results of the schools involved in a distributed leadership. Several years later, Leithwood and
Mascall (2008) conducted a study of 90 elementary and secondary schools. They concluded that
distributed leadership explained a significant proportion of variation in student achievement
across schools. Higher-achieving schools provided a model of distributed influence to all school
members and other stakeholders to a greater degree than that of lower-achieving schools
(Leithwood & Mascall, 2008). Gordon’s (2005) investigation involving 1,257 K-12 educational
practitioners in Connecticut, yielded similar results. Gordon concluded there was a significant
difference between the leadership dimensions in high performing schools as compared to low
performing schools. The findings from a host of studies supports the positive relationship
between student success and distributed leadership practices.
Louis et al. (2010) conducted a six-year study of student learning, synthesizing school
improvement research. Key findings included:
1. When principals and teachers share leadership, teachers’ working relationships are
stronger and student achievement is higher.

43
2. Collective leadership has a stronger influence on student achievement than individual
leadership.
3. Almost all people associated with high-performing schools have greater influence on
school decisions than is the case with people in low-performing schools.
Spillane et al. (2007) viewed school leadership as critical to the impact of school reform
efforts. Trombly (2014) addressed issues related to complex systems facilitating sustainable
change, saying that (a) there was a need for stakeholders at all levels of the organization to
communicate and (b) control in decision making needed to be distributed so that all voices were
heard and valued. Lambert (2006) described a principal with high leadership capacity and ability
to impact long lasting school improvement as having a deliberate and vulnerable persona, strong
beliefs and values, knowledge of the work of teaching and learning, and the ability to develop the
capacity of others within the organization. Spillane et al. (2007) emphasized that a principal’s
ability to utilize the knowledge and skills of his or her staff to the fullest potential created the
conditions for innovation. Empirical evidence suggests that principals’ practice of sharing of
leadership with others is a worthwhile method to use in taking on the challenge of improvement
in student learning (Louis et al., 2010). The literature reviewed supported the impact that school
leaders can have on student performance outcomes and school improvement.
Professional Learning
Researchers have established that there is a significant relationship between distributed
leadership and professional learning (Bashir, Akram, & Lodhi, 2017; Dufour, 1998, 2006; Kurt
2016; Louis et al., 2010; York-Barr & Duke, 2004). Dufour’s (1998, 2006) research on the
impact of professional learning communities supported the collaborative nature of learning.
44
Dufour (2006) explained, “When principals recognize how critical school context is to the
effectiveness of professional development, important shifts begin” (p. 5). He expanded on this
premise, emphasizing that the principal’s most significant impact on developing the faculty
involved providing the proper context for adult learning. In his view, shared leadership and
collective commitment occur through actions involving teacher input on goal-oriented, data-
based decision making and professional learning to support the skills and knowledge necessary
to achieve those collective goals.
Louis et al. (2010) findings in their 2010 report supported Dufour’s conclusion. These
researchers found that leadership effects on student achievement occurred largely because
effective leadership utilizes a professional learning community model, (i.e., a school functioning
as a professional learning community is a strong predictor of instructional practices that are
highly associated with student achievement (Louis et al., 2010). Furthermore, the connection
between a professional learning community and student achievement is linked to a school
climate that supports students in reaching their full potential (Louis et al, 2010). Frey and Fisher
(2013) found that leadership through professional development in conjunction with pedagogical
and content rich resources resulted in students’ academic improvement. They also determined
that building school level expertise through a “train the trainer” model allowed for school level
ownership of the content and authentic distributed leadership opportunities.
The National Staff Development Council (NSDC, 2000) suggested shared leadership
activities that provide teachers with authentic opportunities for professional growth. For
example, teachers can collaboratively participate in lesson study, where a group of teachers
collectively develop and test the lessons that each will use individually (NSDC, 2000).

45
Experienced teacher leaders can both formally and informally share their skills with new
teachers (NSDC, 2000). They also can participate in action research that continuously improves
classroom and schoolwide practice. NSDC (2000), in discussing professional development for
teacher leadership, advocated for PD to go beyond simply training teachers in content knowledge
and pedagogical skills, stating, “Our vision of effective professional development for teachers
and school leaders calls for a daily, job-embedded, team learning approach that focuses on
planning lessons, critiquing student work, and group problem solving” (NSDC, 2000, p. 8).
Supovitz and Christman (2003) supported this approach, expressing that when leaders provide
regular structured opportunities for teachers to focus on instructional practices, teachers apply
this new learning and produce more effective teaching. Professional learning and distributed
leadership practices have proven to be positively connected. Through a nurturing professional
learning community, effective teacher practice can increase, and a culture of trust can be
cultivated.
Organizational Trust and Collective Teacher Efficacy
Behaviors associated with distributed leadership have also been linked to increased
organizational trust (Bryk & Schneider, 2003; NSDC, 2000). As illustrated in the literature, the
utilization of professional learning communities has become a vehicle for engagement in
distributed leadership (York-Barr & Duke, 2004). Teacher collaboration and sharing of
knowledge of skills are factors that increase faculty trust. When facilitating professional
development or learning from colleagues, teachers feel the highest sense of efficacy at work
(Mullen & Jones, 2008). Furthermore, when principals are willing to be open to listening to the
ideas of staff members and value those ideas in decision making, vulnerability is occurring and a

46
trusting environment is being built (Brewster & Railsbeck, 2003; Mullen & Jones, 2008).
Principal behaviors associated with distributed leadership have the potential for increasing trust
in a school (Goddard et al., 2004). Angelle (2010), conducted a case study on the impact of
distributed leadership practices on organizational trust in a middle school. Her findings revealed
the following organizational outcomes as a result of involvement in distributed leadership
practices: teacher efficacy, trust, job satisfaction, and teacher retention (Angelle, 2010). Mullen
and Jones’ (2008) supported these findings. Their research revealed that teachers’ input in
decision making contributes to faculty satisfaction with the school’s climate.
Goddard et al. (2004) found that when teachers were empowered to influence
instructionally relevant school decisions, they were likely to report more confidence in the
capability of the faculty to educate students. Consequently, affording faculty members some
control over school decisions may be one approach to strengthening collective efficacy beliefs in
schools (Goddard et al., 2004). With collective teacher efficacy ranking as having the highest
impact (effect size = 1.57) on student achievement, the connection to leadership practice is worth
noting (Hattie, 2017). Supporting factors have emerged from further research on leadership
actions that foster collective teacher efficacy (Brinson & Steiner, 2007). Building instructional
knowledge and skills, creating opportunities for teachers to collaboratively share skills and
experience, interpreting results and providing actionable feedback on teachers’ performance, and
involving teachers in school decision making create a culture of collective efficacy (Brinson &
Steiner, 2007). These factors reinforce key components of distributed leadership illustrated in
the literature.

47
Summary of the Literature Review
The topics of collective teacher efficacy, organizational trust, and distributed leadership
comprised the three major sections of this literature review and provided the foundation for the
present study. All major sections included subsections in which conceptual perspectives,
connections to student achievement, and identified barriers and how to overcome them were
discussed. The research of Goddard, Hoy, and Wolfolk Hoy provided a foundation for the
operationalization and measurement of collective teacher efficacy. Likewise, Tschannen-Moran
and Hoy’s investigation of organizational trust served as a conduit for the further exploration of
trust in schools. Moreover, the exploration of distributed leadership was led through the work of
Spillane. Contributions from Elmore, Leithwood, and Mascall also made strong connections
between leadership practice and student achievement. Additional connections were established
among the subsections of each key concept to feature the interconnectivity of the research of
these topics. For example, the meta-analyses of Hattie were used to make connections among
the research topics and their relationship to student achievement. The various studies of key
researchers in the fields of study provided a comprehensive look at the relevant literature
necessary to move forward with this study.
The extant literature was foundational to this investigation, as it provided clearly defined
research on the dependent variables tested in this study: collective efficacy, organizational trust,
and various aspects of distributed leadership (featured in the additional survey items). Through
the quantitative and qualitative measures utilized through this case study, the DPLC model of
professional development was explored and the research on collective teacher efficacy,
organizational trust, and distributed leadership practices was further investigated.

48
CHAPTER 3 RESEARCH METHODS
Introduction
This study was designed to investigate the District Professional Learning Community
(DPLC) model of professional development during years one and two of implementation in a
large urban school district. DPLC uses a distributed leadership approach to deliver cross-content
area literacy strategies to all teachers across the school district. In addition to the improvement
of literacy instruction, the DPLC model offers potential for impacting organizational trust and
collective teacher efficacy in schools.
In order to investigate the influence of the DPLC model of professional learning on
teacher perceptions, the following three research questions were developed.
1. In what ways and to what extent is collective teacher efficacy influenced by
participation in DPLC model of professional learning?
2. In what ways and to what extent is teacher organizational trust influenced by
participation in DPLC model of professional learning?
3. In what ways and to what extent do teachers perceive that DPLC is accomplishing its
goals of improving literacy?
Literature searches revealed no existing literature on the influence of the DPLC model on
collective teacher efficacy and organizational trust. This case study describes and characterizes
the relationship between the implementation of DPLC model and collective teacher efficacy and
organizational trust at one middle school in a large urban school district. These research
questions provided direction in reviewing relevant literature, collecting and analyzing data, and
interpreting results.
49
Chapter Organization
This research methods chapter is organized in five major sections: Research Design,
Selection of Participants, Instrumentation, Data Collection, and Data Analysis. Each major
section discussed the quantitative and qualitative components through separate subheadings.
The Research Design Section explains how the Quantitative and Qualitative phases of this
mixed-methods study work together to ultimately provide a synthesis of analysis. Each data
source is previewed, including each tool’s purpose and connection to the research questions.
The Selection of Participants section provides background data about the school district
and Central Florida Middle School. The Selection of Participants section also provides details
about the sampling procedures utilized in both the Quantitative and Qualitative phases of this
study. The third section, Instrumentation, includes subsections discussing the instruments used
in the quantitative and qualitative phases of this study. The Quantitative subsection describes
each instrument, its purpose, and development, including details about validity and reliability.
The Qualitative subsection includes details about the purpose and structure of the focus group
interviews.
The Data Collection section includes subsections describing the methods of data
collection for the quantitative and qualitative phases of the study. These sections include details
on correspondence with participants, response rates, and methods of data collection. The fifth
major section, Data Analysis, provides details about how data were analyzed for each phase of
the study: Quantitative, Qualitative, and Synthesis. The Quantitative subsection also provides
details about statistical tests utilized to analyze the survey results. Finally, methods of analysis
and credibility techniques are detailed for both the Qualitative and Synthesis phases.

50
Research Design
A single case study research design was identified as the best approach to address the
three research questions. As explained by Fraenkel, Wallen, and Hyun (2015), case studies
allow for varied data to be collected and used to express interpretations applicable to the specific
case or to provide useful generalization. The researcher utilized a mixed-methods case study
approach in order to explore quantitative and qualitative data that would be useful in responding
to the three research questions which guided the study (Fraenkel et al., 2015). Furthermore, the
quantitative and qualitative data collection, results, and integration were used to provide in-depth
evidence for the case being studied (Creswell & Plano Clark, 2018). Specifically, a sequential-
explanatory design has been utilized to allow for data collected from the first quantitative phase
of the study to inform the qualitative phase (Creswell & Plano Clark, 2018). The primary intent
of the sequential-explanatory design was to explain the initial quantitative results and glean a
deeper understanding of the findings, using qualitative data analyses (Creswell & Plano Clark,
2018). Ultimately, data collected from the quantitative phases and the qualitative phase have
been synthesized in order to formulate an overall interpretation of results.
This study relies on five data sources: Goddard & Hoy's (2003) CE Scale Form L (see
Appendix A), Hoy & Tschannen-Moran's (2003) Omnibus-T scale (see Appendix C), six DPLC
survey items (see Appendix D), and focus group interview questions (see Appendix E). During
the Quantitative phase of this study three instruments were utilized to answer the three research
questions. Goddard & Hoy's (2003) CE Scale Form was used to measure collective teacher
efficacy over time. Organizational trust was measured through Hoy & Tschannen-Moran's
(2003) Omnibus-T scale (see Appendix C). Additionally, six DPLC survey items (see Appendix
51
D) have been included to explore teachers’ perceptions of the DPLC model’s influence on
improving student literacy. In the Qualitative phase of the study, focus group interview
questions (see Appendix E) have been utilized during two separate focus group interviews.
These questions guided teacher discussions in order to capture their perceptions about
professional development opportunities, literacy support, collaborative culture, instructional
leadership opportunities, and impact of DPLC sessions. Furthermore, themes and patterns were
surfaced from the focus group interview data, connecting the discussions to collective teacher
efficacy and organizational trust. Through the use of the quantitative and qualitative data
collection tools leveraged in this study, a rich data analysis and synthesis of findings was
possible.
Participants
School District
This study was conducted in a large urban school district in Florida. The school district is
divided into seven learning communities: five geographic learning communities for elementary
and middle schools supervised by area superintendents, the high school division, supervised by
the Chief of High Schools, and the School Transformation Office, supervised by an area
superintendent. The school board consists of eight members, seven of whom are elected from
single-member districts, and a chair who is elected districtwide. All school board members serve
four-year terms. The superintendent is appointed by the school board and has administrative
authority for the operation of the school district under policies established and approved by the
school board. (School District website, 2019).
52
This large urban school district serves 211,685 students attending a total of 196 schools:
124 elementary, 75 middle, seven K-8s, 20 high schools, and eight alternative schools (School
District website, 2019). The diverse student body is comprised of the following racial
demographics: 42% Hispanic, 26% white, 25% black, 5% Asian, and 2% multicultural (School
District website, 2019). Students in this school district come from 165 countries and speak 157
different languages and dialects. English Language Learners make up 16% of the student
population (School District website, 2019). The school district is the second largest employer in
the metropolitan area with 25,145 professionals comprising the school district’s workforce
(School District website, 2019). The diverse student body requires a highly qualified staff of
professionals to meet their various needs.
Ongoing professional development continues to be an important part of the school
district’s plan to meet the needs of their students. Beginning in the 2017-2018 school year, this
large urban school district embarked on a new three-year cross-curricular literacy professional
development initiative utilizing the DPLC model. This new initiative promises to fill in the gaps
of literacy instruction and meet the needs of teachers and students in ways that former literacy
professional development has not been successful.
Central Florida Middle School
This case study has been conducted at one middle school in a large urban school district
in Florida. Central Florida Middle School (CFMS) population is comprised of approximately
816 students and 66 staff members (CFMS Report Card, 2018). Student demographics consist
majorly of a Hispanic population (69.9%) which surpasses the whole school district average of
42% Hispanic (CFMS Report Card, 2018). CFMS’s racial breakdown consists of 24%

53
white/non-Hispanic, 11.4% black, 4.5% Asian, and 1.5% multi-racial (CFMS Report Card,
2018). Although, the school has a high Hispanic population, the percentage of students
identified as English language learners (ELL) is 13.6%, 2% less than the district average (CFMS
Report Card, 2018). Additionally, CFMS supports a growing Exceptional Student Education
(ESE) population at 18.6%, 3% higher than the previous school year and almost double the
district Exceptional Student Education (ESE) average of 11% (CFMS Report Card, 2018).
Historically, Central Florida Middle School has one of the highest student mobility rates
in the school district. During the 2017-2018 school year, student mobility reached 48.4%
(Educational Database Warehouse, 2018). CFMS is categorized as a Title I school, serving
99.7% of students qualifying for free and reduced lunch (CFMS Report Card, 2018). Mobility is
not unique to the student population; of the 54 current teachers, 22 were new to CFMS for the
2018-1019 school year. Additionally, during the duration of this study, there was a principal
change. The principal during year one of the study moved to another school at the completion of
the 2017-2018 school year. The new principal to CFMS, shifted from an elementary
principalship to a middle school position at CFMS in July 2018. He remained the principal at
CFMS for the duration of the study (2018-2019). At the time of the present study, he was
continuing his work as the principal for the 2019-2020 school year.
Research Sampling
Quantitative Phase
The entire population of instructional personnel at Central Florida Middle School was
sampled for data collection during the quantitative phase of the study. All instructional faculty
members of CFMS were invited to participate in the survey. This population of 54 participants

54
includes classroom teachers, instructional coaches, deans, staffing specialist, and guidance
counselors. This study sought to investigate teachers’ perceptions on DPLC effectiveness and
the influence of DPLC on collective teacher efficacy and organizational trust overtime.
Therefore, administrative personnel (principal and assistant principals) and classified personnel
(paraprofessionals, office clerks, cafeteria staff, etc.) were not included in this sample.
During the quantitative phase of the study, a 53-item Likert survey was electronically
administered to all instructional employees at one middle school using Qualtrics. The
anonymous survey was administered three times over the course of two years (May 2018,
December 2018, and May 2019.) This survey included: the 21 items from Goddard and Hoy's
(2003) CE Scale Form L (see Appendix A), the 26 items from Hoy and Tschannen-Moran's
(2003) Omnibus T- scale (see Appendix C), and six DPLC items (see Appendix D). DPLC items
are experimental items designed to capture teachers’ perceptions about professional development
opportunities, literacy support, collaborative culture, instructional leadership opportunities, and
impact of DPLC sessions. Teachers who chose to participate in the first survey administration of
the quantitative phase were under no obligation to participate in the second and third survey
administrations.
Qualitative Phase
After the first two rounds of quantitative data collection, in May 2018 and December
2018, the qualitative phase of the study began. Two semi-structured focus group interviews were
conducted in April 2019. The results of the first two survey administrations informed the
direction of the focus group questions. The topics of discussion included: DPLC
implementation, literacy practices, and instruction at CFMS.

55
Criterion-based purposive sampling was used to identify participants for the qualitative
phase of the study. The focus group interviews included instructional personnel at the school,
(e.g., classroom teachers and instructional coaches) who were directly involved in and impacted
by DPLC implementation. Additional instructional support positions such as speech therapists
and guidance counselors were not included in the sample population due to their minimal role in
DPLC content implementation.
Focus Group Interview 1
The first focus group consisted of seven instructional faculty members including teachers
and instructional coaches who are DPLC site team members. These teachers are leaders on their
campus. They attend the DPLC content sessions and are responsible for bringing the learning
back to the remaining teachers at their school. There were a total of 10 members of the DPLC
site team at Central Florida Middle School. The group is representative of a variety of subject
areas (English/Language Arts, Reading, Science, Math, Social Studies) and grade levels (6th-8th)
at the school. Furthermore, two of the 10 DPLC site team members are administrators (principal
and assistant principal); therefore, they were not considered for the focus group interviews.
Another member of the DPLC site team was on temporary leave; therefore, she was not available
during the focus group interview timeframe. Thus, exactly seven members of the DPLC site
team were eligible to participate in the focus group interview. All seven members chose to
participate.
Focus Group Interview 2
The second focus group consisted of five to seven teachers representing a variety of
content areas and grade levels at the school. Participants were selected using stratified random

56
sampling, categorizing for subject area taught. The subject area categories included:
English/language arts, reading, science, mathematics, social studies, exceptional student
education, and electives. Teachers who were randomly selected to participate in the focus group
interviews had the option to decline the offer to participate. In the cases when a teacher declined
the invitation to participate in the focus group interview, another teacher from the same subject
area was randomly selected and invited to take his/her place in the study.
Instrumentation
Quantitative Phase
During the quantitative phase of the study, a 53 item Likert survey was electronically
administered to all instructional employees at one middle school using Qualtrics, a web-based
software program. Qualtrics supports the creation of surveys and generates reports based on
survey response data. The anonymous survey was administered three times over the course of
two years (May 2018, December 2018, and May 2019.) This survey includes: the 21 items from
Goddard and Hoy's (2003) CE Scale Form L (see Appendix A), the 26 items from Hoy and
Tschannen-Moran's (2003) Omnibus T- scale (see Appendix C), and six DPLC items (see
Appendix D).
Collective Efficacy (CE) Scale
Purpose and Description
According to Goddard and Hoy (2003), the CE Scale Form L measures the collective
efficacy of a school. Goddard, Hoy and Woolfolk Hoy (2000) defined collective teacher efficacy
as “the shared perceptions of teachers in a school that the efforts of the faculty as a whole will
have positive effects on students” (p. 480). Goddard et al. (2000) utilized quantitative methods

57
to design and test the 21-item Likert Scale Collective Efficacy Questionnaire (CE Scale Form L).
Participants respond to each item with a 6-point Likert Scale ranging from “strongly disagree” to
“strongly agree.” The CE Scale is currently a widely recognized instrument utilized by many
researchers of collective efficacy (Donohoo, 2017; Goddard et al., 2000).
The CE Scale takes into consideration the teacher self-efficacy principles utilized in
Bandura’s (1993) and Tschannen-Moran et al.’s (1998) model: mastery experience, vicarious
experience, a physiological arousal, and verbal persuasion. Mastery experiences refer to
situations when individuals are successful in showing their capabilities to master a task or
activity (Bandura, 1993). Vicarious experiences present opportunities for individuals to observe
peers who are experiencing success. When individuals see other teachers being successful with
specific teaching practices, this can cause them to become confident in their abilities to
experience success with their own practices (Bandura, 1993). Additionally, physiological
arousal involves the impact the emotions have on individuals, which could affect their thoughts
and behaviors in positive and negative ways. Verbal persuasion involves being coached by
others. Words of encouragement and affirmation can increase one’s self-efficacy (Bandura,
1993). These four principals present the foundation model of self-efficacy utilized as a baseline
for the CE Scale.
Additionally, perceptions of group competence contribute to the CE Scale, addressing the
domains, “analyzing teaching task,” and “assessment of teaching competence.” (Goddard et al.,
2000). Goddard et al. (2000) explained that analyzing the teaching task refers to “teachers
reflecting on what constitutes successful teaching in their school, what barriers or limitations
must be overcome, and what resources are available to achieve success” (p. 485). Assessment of

58
teaching competence produces inferences about the faculty's teaching skills, methods, training,
and expertise as well as students’ ability to learn (Goddard et al., 2000). These two domains are
used to simultaneously assess whether the organization has the capacities to succeed in teaching
students (Goddard et al., 2000). The interactions of these factors and domains lead to the
shaping of collective teacher efficacy in a school (Goddard et al., 2000).
Development of the Collective Efficacy Scale
The developed instrument (see Appendix A) was subjected to the appropriate and
necessary measures to ensure its validity and reliability (Goddard et al., 2000). As part of the
creation of the Collective Efficacy Scale, Goddard, Hoy, and Wolfolk Hoy (2000) conducted a
study to test the validity and reliability of their instrument. The development of the instrument
involved four phases. First, a panel of experts provided feedback on the items. Next, a
preliminary survey was field tested with teachers. Then, a pilot study was completed using a
small group of schools to test the factor structure of the instrument its reliability, and its validity.
Lastly, a large-scale study was conducted in which the psychometric properties of the final
instrument were assessed (Goddard, Hoy, & Wolfolk Hoy, 2000). A panel of experts from Ohio
State University reviewed and evaluated the survey items to ensure content validity (Goddard et
al., 2000). The revised instrument was further subjected to a field test with six teachers who
provided feedback on the clarity of instructions, length of the instrument, and appropriateness of
the questions.
The results of the pilot study and large-scale study, taken together, illustrate the validity
of the CE-Scale. Validity was addressed through an examination of the relationship between
collective teacher efficacy and conflict, sense of powerlessness, trust in colleagues, and
59
individual efficacy. As predicted, conflict and sense of powerlessness were negatively related to
collective efficacy. The correlation between collective efficacy and trust among colleagues was
positive and significant as was the correlation between collective efficacy and individual
efficacy. These results provide evidence that the collective teacher efficacy scale utilized in this
study was valid. After the alpha coefficients of reliability were computed for the final
instrument, the Collective Efficacy Scale reported a high internal reliability (alpha = .96).
Scoring
In order to obtain the composite score for each survey administration of the dependent
variable, collective teacher efficacy, the tested formula must be used for the CE Scale Long
Form (Hoy, n.d.). The Collective Efficacy Ten of the items in this scale are reversed scored, that
is, "1" is scored "6," "2" is scored "5," etc. To score the scale, the scores were reversed on the
following items: 3, 4, 8, 10, 11, 12, 16, 18, 19, 20 (Hoy, n.d.). The scores were added for all 21
items: the greater the sum, the higher the collective efficacy. Finally, all the individual teacher
scores were averaged to find a collective efficacy score of the school (Hoy, n.d.).
Omnibus T-Scale
Purpose and Description
Hoy and Tschannen-Moran (2003) established The Omnibus T-Scale (see Appendix C),
used to measure trust in schools. The Omnibus T-Scale consists of 26 Likert scale items that
measure three aspects of faculty trust: trust in colleagues (fellow teachers), trust in the principal,
and trust in clients (students and parent). Participants respond to each item with a 6-point Likert
Scale ranging from “strongly disagree” to “strongly agree.” This instrument has been used in
many studies measuring the impact of trust in schools (Adams & Forsyth, 2013; Forsyth et al.,
60
2011; Goddard et al., 2001, 2009; Hoy et al., 2006.). According to Hoy and Tschannen-Moran
(2003), trust is operationalized as “an individual’s or group’s willingness to be vulnerable to
another party based on the confidence that the latter party is benevolent, reliable, competent,
honest, and open” (p. 186). Furthermore, faculty trust is “the extent to which the faculty as the
group is willing to risk vulnerability” (Hoy & Tschannen-Moran, 2003, p. 186). The Omnibus
T-Scale is focused on measuring facets of faculty trust grounded in Hoy and Tschannen-Moran’s
operationalization of the concept.
Development of the Omnibus T-Scale
As part of the creation of the Omnibus T-Scale, Hoy and Tschannen-Moran (1999)
conducted a study to test the validity and reliability of their instrument, following a similar
pattern to that used in the development of the CE Scale. The development of the instrument
involved four phases. First, a panel of experts provided feedback on the items. Next, a
preliminary survey was field tested with teachers. Then, a pilot study was completed with a
small group of schools to test the factor structure of the instrument, its reliability, and its validity.
Lastly, a large-scale study was conducted in which the psychometric properties of the final
instrument were assessed (Hoy & Tschannen-Moran, 1999).
To check the content validity of the items, the Omnibus T-Scale was submitted to a panel
of experts including all professors at Ohio State University (Hoy & Tschannen-Moran, 1999).
Each member of the panel was asked to evaluate which facet of trust each item measured.
Additionally, a field test was conducted to test the clarity of instructions, appropriateness of the
response set, length, and face validity of the items. Six veteran teachers were asked to respond to

61
the instruments and to give feedback (Hoy & Tschannen-Moran, 1999). These steps concluded
the panel review and field test portion of content validity measures.
After the panel review and field test, 48 items remained on the survey and were used in
the pilot test (Hoy & Tschannen-Moran, 2003). The pilot study was conducted to explore the
factor structure, reliability, and validity of the trust measures (Hoy & Tschannen-Moran, 2003).
Along with the Omnibus T-Scale, teachers responded to a self-estrangement scale, a sense of
powerless scale, a teacher efficacy scale, and one Likert item measuring the perception of
conflict in the school (Hoy & Tschannen-Moran, 1999). Construct validity of the measures
proved to be strong (Hoy & Tschannen-Moran, 2003). As anticipated, self-estrangement,
powerlessness, and conflict were all negatively related to the dimensions of trust (Hoy &
Tschannen-Moran, 2003). Conversely, teacher sense of efficacy was positively related to trust
(Hoy & Tschannen-Moran, 2003). The pilot study explored a variety of concept relationships as
part of validity and reliability measures.
The relationship between the dimensions of faculty trust and collaboration with parents
was also explored (Hoy & Tschannen-Moran, 2003). The multiple regression analysis showed a
strong relationship between the degree of parental collaboration and trust in clients (Hoy &
Tschannen-Moran, 1999). Faculty trust in clients showed a significant independent relationship
with parental collaboration in decision-making (Hoy & Tschannen-Moran, 2003). The results of
this analysis indicated the predictive validity of the items that measure trust (Hoy & Tschannen-
Moran, 2003). Comprehensively, after the pilot study and large-scale study, the norms for the
instrument are based on a sample of 97 high schools in Ohio, 66 middle schools in Virginia, and

62
146 elementary schools in Ohio (Hoy, n.d.). The analytics of these studies support the construct
validity of the measure.
The reliabilities of the three subscales typically range from .90 to .98 (Wayne Hoy
Official Website, 2017). The initial pilot study of the instrument resulted in a 35-item survey
that reliably measured three kinds of trust: trust in principal (alpha=.95), trust in colleagues
(alpha= .94), and trust in clients (alpha=.92). Additionally, the revised 35-item survey was
piloted with a larger population. During the test of the revised trust scale, an elementary sample
and a secondary sample were tested separately (Hoy & Tschannen-Moran, 1999). After
eliminating items with low factor and redundant items, the result was an Omnibus Trust Scale of
26 items that measured three aspects of faculty trust: faculty trust in colleagues, in the principal,
and in clients (Hoy & Tschannen-Moran, 2003). The alpha coefficients of reliability were
computed for the final instrument. Reliability proved to be high in all three dimensions of
faculty trust in schools: trust in principal (.98), trust in colleagues (.93), and trust in clients (.94).
Scoring
In order to obtain the composite score for each survey administration of the dependent
variable, organizational trust, the tested formula must be used for the Omnibus T-Scale (Hoy,
n.d.). The Omnibus T-Scale measures three subscales: trust in the principal, trust in colleagues,
and trust in clients. Composite scores were calculated for each subscale. The score key proves
the following codes: faculty trust in the principal – items 1, 4, 7, 9, 11, 15, 18, 23; faculty trust in
colleagues – items 2, 5, 8, 12, 13, 16, 19, 21; faculty trust in the clients – items 3, 6, 10, 14, 17,
20, 22, 24, 25, 26. The following items were reverse scored: items 4, 8, 11, 23, 26 [1=6, 2=5,
3=4, 4=3, 5=2, 6=1].
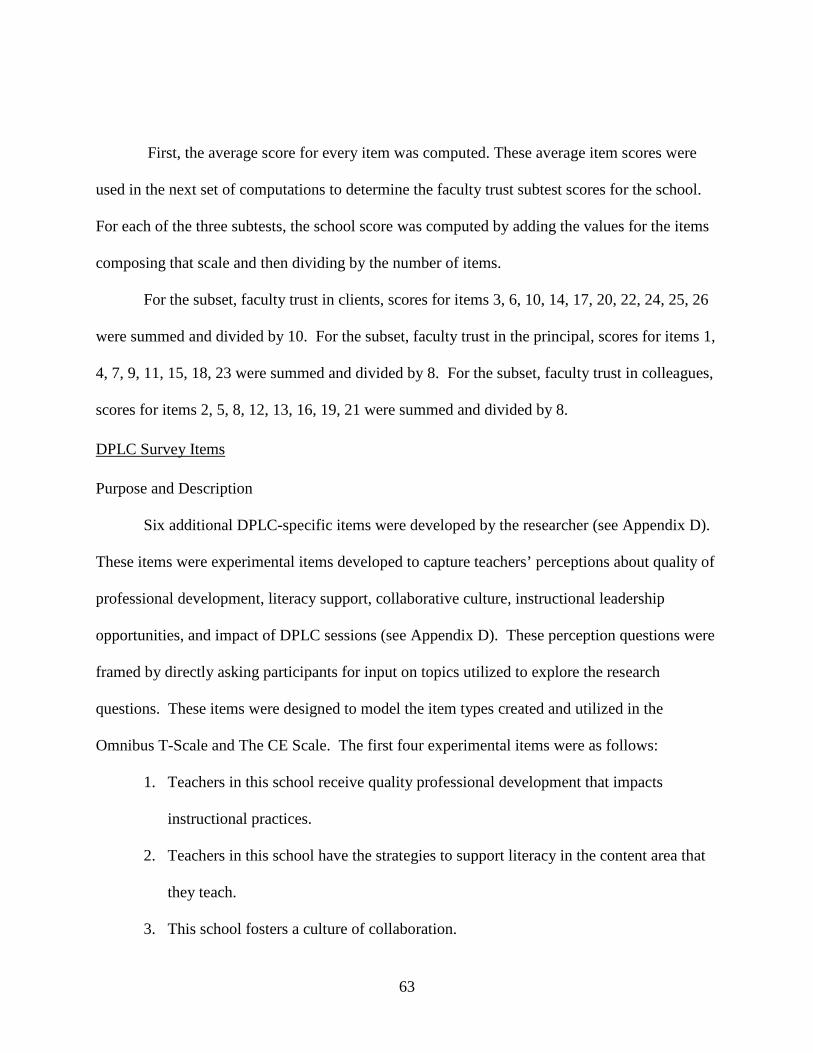
63
First, the average score for every item was computed. These average item scores were
used in the next set of computations to determine the faculty trust subtest scores for the school.
For each of the three subtests, the school score was computed by adding the values for the items
composing that scale and then dividing by the number of items.
For the subset, faculty trust in clients, scores for items 3, 6, 10, 14, 17, 20, 22, 24, 25, 26
were summed and divided by 10. For the subset, faculty trust in the principal, scores for items 1,
4, 7, 9, 11, 15, 18, 23 were summed and divided by 8. For the subset, faculty trust in colleagues,
scores for items 2, 5, 8, 12, 13, 16, 19, 21 were summed and divided by 8.
DPLC Survey Items
Purpose and Description
Six additional DPLC-specific items were developed by the researcher (see Appendix D).
These items were experimental items developed to capture teachers’ perceptions about quality of
professional development, literacy support, collaborative culture, instructional leadership
opportunities, and impact of DPLC sessions (see Appendix D). These perception questions were
framed by directly asking participants for input on topics utilized to explore the research
questions. These items were designed to model the item types created and utilized in the
Omnibus T-Scale and The CE Scale. The first four experimental items were as follows:
1. Teachers in this school receive quality professional development that impacts
instructional practices.
2. Teachers in this school have the strategies to support literacy in the content area that
they teach.
3. This school fosters a culture of collaboration.

64
4. Teachers in this school are given opportunities to be instructional leaders for their
peers.
These four experimental items use the same 6-point Likert scale ranging from “strongly
disagree” to “strongly agree.”
The last two experimental items were as follows:
1. To what extent has content from DPLC sessions impacted your thinking about
instruction.
2. To what extent has content from the DPLC sessions impacted your instructional
practice.
These two experimental items were built on a 5-point Likert scale ranging from “no impact at
all” to “extreme impact.”
Development of the DPLC items
As part of the creation of the DPLC survey items, a panel of experts provided feedback
on the items. To check the reliability and content validity of the items, the six DPLC items were
submitted to a panel of experts including seven members of the DPLC Design Team. Each
member of the panel was asked to evaluate whether or not each item reflected the leadership and
literacy goals of the DPLC model of professional learning. All seven members concluded that
the six survey items reflected the following topics reflected in the overarching goals of the DPLC
model: quality professional development, literacy support, collaborative culture, instructional
leadership opportunities (distributed leadership), and impact of DPLC sessions on teacher
thinking and classroom practice. Survey items were not altered after the panel review. All

65
members agree that each of the six items were inclusive of the necessary components to explore
teachers’ perceptions of the DPLC model.
Scoring
Each DPLC survey item serves as a stand-alone item for the purpose of data analysis. A
composite score has not been calculated.
Qualitative Phase
After the first two quantitative data collections (May 2018 and December 2018), the
qualitative phase of the study began. Two semi-structured focus group interviews were
conducted in April 2019. Yin (2018) defined focus group interviews as situations in which “the
researcher moderates a discussion with a small group of persons about aspects of a case study,
trying to deliberately surface views of each person in the group” (p. 120). Focus group
interviews are beneficial in a case study approach as they allow the researcher to uncover trends
and themes about feelings and perceptions of the group (Yin, 2018). The semi-structured
interview approach, according to Creswell and Plano Clark (2018) allows the researcher to adapt
questions and follow-up questions in the moment, based on participants’ responses, providing an
atmosphere for participants to elaborate on one another’s responses. The results of the first two
survey administrations informed the direction of the focus group questions. This approach led to
the connected results and synthesis of quantitative and qualitative data (Creswell & Plano Clark,
2018).
66
Focus Group Interview 1
As part of explanatory sequential design, the researcher utilized the quantitative results
from the survey to inform the interview questions developed for the qualitative phase (Creswell
& Plano Clark, 2018). Composite scores on each subset of the survey and the change in score
from the first and second survey administrations (May 2018 and December 2018, respectively)
were considered when developing interview questions. Survey subsets include: collective
efficacy, faculty trust in principal, faculty trust in colleagues, and faculty trust in clients.
Furthermore, participants’ responses on each DPLC survey item were considered when crafting
interview questions. A bank of possible focus group interview questions were created and were
subject to alteration based on results acquired from the quantitative phase (see Appendix E).
Focus group participant responses from the first interview group also informed the
direction of questioning in the second focus group interview. Topics discussed during the first
focus group interview required deeper inquiry during the second interview; therefore, preplanned
questions were subject to fluidity.
Focus Group Interview 2
Similar to the first focus group interview, the second focus group interview followed an
explanatory sequential design. The researcher utilized the quantitative results from the survey to
inform the interview questions developed for the qualitative phase (Creswell & Plano Clark,
2018). Composite scores on each subset of the survey and the change in score from the first and
second survey administrations (May 2018 and December 2018) respectively were considered
when developing focus interview questions. Additionally, data uncovered during the first focus
group interview also influenced the questions asked during the second focus group interview.
67
The bank of possible focus group interview questions were subject to alteration based on results
acquired from the survey and focus group interview one (see Appendix E).
Data Collection
This study utilized a quantitative and qualitative approach to data collection and analysis.
These two approaches are explained separately.
Quantitative Phase
The first step of data collection involved entering the 53 survey items into Qualtrics. The
survey included a built-in consent form as the cover page of the survey (see Appendix F). The
consent form includes language regarding the purpose of the study, the researcher, the logistics
(number of items, amount of administrations, etc.), and participant protections and rights.
The first survey administration was released to all Central Florida Middle School
instructional personnel through the school email server on May 15, 2018. The survey link was
included in an email inviting all instructional personnel to participate (see Appendix G).
Reminder emails were sent weekly until the end of the survey window on May 31, 2018. A total
of 25 of 54 instructional personnel completed the first survey, resulting in a response rate of
46.3%.
The second survey administration was released to all CFMS instructional personnel
through the school email server on November 28, 2018. The survey link was included in an
email inviting all instructional personnel to participate (see Appendix G). Reminder emails were
sent weekly until the end of the survey window on December 31, 2018. A total of 21 of 54
instructional personnel completed the second survey, resulting in a response rate of 38.9%.
68
Additionally, the researcher was invited by the principal of CFMS to speak to the instructional
personnel during department meetings about the purpose of the survey and research study. The
researcher visited CFMS and briefly spoke at department meetings on the date of the survey
release, November 28, 2018
The third survey administration was released to all CPMS instructional personnel through
the school email server on May 13, 2019. The survey link was included in an email inviting all
instructional personnel to participate (see Appendix G). Reminder emails were sent weekly until
the end of the survey window on May 31, 2019. A total of 26 of 54 instructional personnel
completed the third survey, resulting in a response rate of 48.1%.
Qualitative Phase
Focus Group Interview 1
The first focus group interview consisted of seven instructional faculty members
including teachers and instructional coaches who were DPLC site team members. There were a
total of 10 members of the DPLC site team at Central Florida Middle School. The group is
representative of a variety of subject areas (English/language arts, reading, science, mathematics,
social studies) and grade levels (6-8) at the school. Two of the 10 DPLC site team members
were administrators (principal and assistant principal) and were not considered for the focus
group interviews. Another member of the DPLC site team was on temporary leave and was not
available during the focus group interview timeframe. Thus, exactly seven members of the
DPLC site team were eligible for the focus group interview. The researcher invited the seven
eligible participants through the school district email server on April 7, 2019. The email
69
explained the purpose of the focus group interview, logistics, and guaranteed anonymity and
confidentiality (see Appendix H). All seven chose to participate.
Data collection occurred on an agreed-upon date, time, and location. The participants
agreed to meet directly after a half-day DPLC content session on April 23, 2019 at the
designated professional development center at 1 pm. The focus group interview began with a
recording device check. All participants responded to the question “What is your favorite
vacation spot?” The researcher played back the recording to make sure all participant voices
were clearly heard. The researcher began the focus group interview by explaining the purpose of
the focus group interview, the participant anonymity, and the method of data analysis (analyzing
for trends, not identifying individual responses). The focus group interview lasted a total of 44
minutes and 38 seconds. The researcher asked questions related to classroom instruction, DPLC
content implementation, and school culture. Participants responded at will. The researcher
sometimes asked follow-up questions, building on the participants’ prior responses.
Focus Group Interview 2
The second focus group interview consisted of five teachers representing a variety of
content areas and grade levels at the school. Participants were selected using stratified random
sampling, categorizing for subject area taught. The subject area categories represented included:
English/language arts, reading, science, mathematics, social studies, exceptional student
education, and electives. Teachers who were randomly selected to participate in the focus group
interviews had the option to decline the offer. In the instances when a teacher declined the
invitation to participate in the focus group interview or did not respond to the invitation, another
teacher from the same subject area was randomly selected and invited to take his/her place in the

70
study. Teachers were sent an invitation to participate in the focus group interview through
school district email (see Appendix H). After one week of no response, a follow-up email was
sent before the next round of prospective participants were invited (see Appendix H).
The first round of invitations, sent on April 7, 2019, utilized the school district email
server and resulted in two of seven teachers agreeing to participate in the focus group interview.
After one week, invitees were sent a follow-up email which did not yield any additional
participants. The second round of invitations sent on April 15, 2019 by school district email
server resulted in none of seven agreeing to participate in the focus group interview. After one
week, invitees were sent a follow-up email which did not yield any additional participants. The
third round of invitations sent on April 21, 2019 by school district email server resulted in one of
seven agreeing to participate in the focus group interview. After one week, invitees were sent a
follow-up email which yielded one additional participant. The fourth round of invitations sent
on April 28, 2019 by school district email server resulted in two of seven agreeing to participate
in the focus group interview. Thus, by May 3, 2019 a total of six teachers had agreed to
participant in the second focus group interview. On the day of the interview, one participant was
absent from work; therefore, a total of five instructional personnel participated in the second
focus group interview.
Data collection occurred on an agreed upon date, time, and location. The participants
agreed to meet before first period at 8:30 am on May 3, 2019 at CFMS in a teacher planning
room. The interview procedures employed in the first focus group interview were replicated in
the second focus group interview. The focus group interview began with a recording device
check. All participants responded to the question “What is your favorite vacation spot?” The
71
researcher played back the recording to ensure all participant voices were clearly heard. The
researcher began the focus group interview by explaining the purpose of the focus group
interview, the participant anonymity, and the method of data analysis (analyzing for trends, not
identifying individual responses). The focus group interview lasted for 32 minutes and 42
seconds. The researcher asked questions related to classroom instruction, DPLC content
implementation, and school culture. Participants responded at will. The researcher sometimes
asked follow-up questions, building on the participants’ prior responses.
Data Analysis
This case study utilized quantitative and qualitative methodologies for data collection and
analysis. This section contains separate explanations of the quantitative and qualitative phases of
the study and includes a discussion of the synthesis phase of the data analysis. Table 1 presents
all dependent and independent variables in the context of the study, organized by each research
question. The quantitative and qualitative components of this mixed methods design are briefly
explained for each exploratory question. The synthesis of the data collection analytical methods
has been used to answer each research question

72
Table 1 Case Study Methods of Data Collection and Analysis
Research Questions Synthesis of Results Used to Answer Research Questions
1. In what ways and to what extent is teacher organizational trust influenced by participation in DPLC model of professional learning?
Changes in organizational trust (measured by Omnibus T-Scale) over the course of two years of DPLC implementation Disaggregated Omnibus T-Scale results by teacher characteristics (gender, subject taught, years of teaching experience, and DPLC school site team membership) Results from qualitative analysis of data collected via focus groups (questions/protocol informed by above results)
2. In what ways and to what extent is collective teacher efficacy influenced by participation in DPLC model of professional learning?
Changes in collective teacher efficacy (measured by CE Scale) over the course of two years of DPLC implementation Disaggregated CE Scale results by teacher characteristics (gender, subject taught, years of teaching experience, and DPLC school site team membership) Results from qualitative analysis of data collected via focus groups (questions/protocol informed by above results)
3. In what ways and to what extent do teachers perceive that DPLC is accomplishing its goals of improving literacy?
Changes in perceptions about DPLC effectiveness over the course of two years of DPLC implementation (measured by DPLC survey items) Disaggregated perceptions about DPLC effectiveness (measured by DPLC survey items) by teacher characteristics (gender, subject taught, years of teaching experience, and DPLC school site team membership) Results from qualitative analysis of data collected via focus groups (questions/protocol informed by above results)

73
Quantitative Phase
For the quantitative phase of the study, multiple methods of analysis were employed to
measure the different variables. The presentation of the methods of analysis has been organized
around each of the three research questions which guided the study.
Research Question 1: In what ways and to what extent is collective teacher efficacy influenced by participation in DPLC model of professional learning?
An Analysis of Variance (ANOVA) has been used to measure the composite score of the
dependent variable, collective teacher efficacy, over a period of time. The independent variables
for this analysis were the three separate survey administrations occurring in May 2018,
December 2018, and May 2019. This analysis has been designed to measure the extent of
change of collective teacher efficacy over time.
Results obtained from two-way ANOVA have been used to compare the dependent
variable of collective teacher efficacy among categories of respondents based on teacher
characteristics: years of teaching experience, gender, subject taught, and DPLC Site Team
membership. This analysis has been designed to show the ways and extent to which the changes
in collective teacher efficacy composite score differ by characteristic.

74
Research Question 2: In what ways and to what extent is organizational trust influenced by participation in DPLC model of professional learning?
An ANOVA was used to measure the dependent variable organizational trust for three
separate composite scores under the categories: trust in principal, trust in colleagues, and trust in
clients. The independent variables for this analysis were the three separate survey
administrations occurring in May 2018, December 2018, and May 2019. This analysis was
designed to measure the extent of change of organizational trust over time.
Results obtained series of two-way ANOVAs have been used to compare the dependent
variables within organizational trust (trust in principal, trust in colleagues, and trust in clients)
with the independent variables of teacher characteristics: years of teaching experience, gender,
subject taught, and DPLC Site Team membership. This analysis shows the ways and extent to
which the changes in the three categories of organizational trust composite scores differ by
characteristic.
Research Question 3: In what ways and to what extent do teachers perceive that DPLC is accomplishing its goals of improving literacy?
A Chi-square test was used to measure the dependent variables of each DPLC survey
item score (see Appendix D) over a period of time. The independent variables for this analysis
were the three separate survey administrations occurring in May 2018, December 2018, and May
2019. This analysis was designed to measure the extent of change of perceptions of DPLC
effectiveness over time.
Results obtained from the Chi-square test have been used to compare the dependent
variables of each DPLC survey item score (see Appendix D) with the independent variables of
teacher characteristics: years of teaching experience, gender, subject taught, and DPLC Site

75
Team membership. This analysis shows the ways and extent to which the changes in teacher
response to each item differ by characteristic.
Qualitative Phase
Focus group interview data was examined using a priori codes derived from the research
questions and underlying literature. Additional open codes and in vivo codes were created based
on patterns and themes discovered while examining the data.
Logic model analytics have been used to develop a conceptual framework for the analysis
of the qualitative data. The logic model stipulates and operationalizes a complex chain of
occurrences or events over a period of time, and attempts to show how complex activity, such as
implementation a program, takes place (Yin, 2018). Yin (2018) further defined this analytic
technique as “matching empirically observed events to theoretically predicted events” (p. 186).
The logic model technique was utilized in this study as a form of pattern matching with more
complex chains of events (Yin, 2018).
Credibility Techniques
In order to promote trustworthiness in the qualitative phase of the analysis, the researcher
utilized the following credibility techniques: member-checking, triangulation, negative case
analysis, and thick rich description (Creswell & Plano Clark, 2018). When employing member
checking, the researcher contacted one key participant from each focus group to review
summaries of key findings. The key participants provided feedback on the accuracy of the
findings. All participant reviews have been reported in Chapter 4, as part of the findings and
analysis.

76
Additionally, the researcher utilized triangulation, a credibility technique designed to
seek convergence and corroboration by comparing findings from qualitative data with
quantitative data (Creswell & Plano Clark, 2018, p.290). In the context of this study, findings
have been compared among the quantitative survey subsets to the findings in the focus group
interviews. Analyzing the results of multiple measures, addressing the same construct in
different ways, increases the validity of the study measure as well as the researcher’s
understanding of the construct (Fitzpatrick, Sanders, & Worthen, 2011).
The researcher also increased credibility of the data analysis by engaging in negative case
analysis. This involves searching for and discussing elements of the data that do not support or
appear to contradict patterns or explanations that are emerging from data analysis (Patton, 1999).
Analysis of deviant cases may revise, broaden and confirm the patterns emerging from data
analysis. In the context of this study, the researcher sought to identify data attained from the
focus group interviews that may not fit into the patterns and themes that framed the analysis.
Moreover, the researcher limited external threats to validity by applying thick description
(Creswell & Plano Clark, 2018). By describing a phenomenon in sufficient detail, the researcher
can evaluate the degree to which the conclusions drawn are transferable to other times, settings,
situations, and people (Lincoln & Guba, 1985). As this case study was conducted to explore the
culture of one middle school, it was vital to delimitate and describe the aspects of participants’
underlying assumptions that could be isolated to their environment compared to the patterns and
themes that were transferable to others outside the organization.
77
Synthesis Phase
After all data collection was complete, the researcher synthesized the results of the
quantitative and qualitative phases in order to complete the analysis and interpretation of the data
collected. In this mixed methods case study design, the researcher has represented the connected
integration of the quantitative and qualitative phases through a joint display (Creswell & Plano
Clark, 2018). The purpose of this type of data display is to make specific links between the two
connected databases and help visualize how the qualitative findings enhance the understanding
of the quantitative results (Creswell & Plano Clark, 2018).
Credibility Techniques
It is acknowledged that explanatory sequential design is associated with certain validity
threats (Creswell & Plano Clark, 2018). In order to promote trustworthiness of the study and
minimize threats in the synthesis phase of the analysis, the researcher utilized two credibility
techniques: cross-data triangulation and negative case analysis (Creswell & Plano Clark, 2018).
The researcher used triangulation, a credibility technique designed to seek convergence and
corroboration by comparing findings from qualitative data with quantitative data (Creswell &
Plano Clark, 2018). In the context of this study, the researcher compared findings from the
quantitative survey subsets to the focus group interviews.
A common threat to validity could include the lack of explanation of surprising,
contradictory quantitative results with qualitative results (Creswell & Plano Clark, 2018). The
researcher minimized this threat by engaging in negative case analysis. This involves searching
for and discussing elements of the data that do not support or appear to contradict patterns or
explanations that are emerging from data analysis (Patton, 1999). Analysis of deviant cases may

78
revise, broaden and confirm the patterns emerging from data analysis (Patton, 1999). In the
context of this study, the researcher sought data attained from the focus group interviews in the
qualitative phase that did not concur with the survey results acquired during the quantitative
phase.
Summary of the Research Methods
In this chapter, the researcher restated the purpose of this research, including the research
questions explored through this study. Details about research design, selection of participants,
instrumentation, data collection, and data analysis were also provided. A single case study,
mixed-methods research design was identified as the best approach to address the three research
questions. Sequential-explanatory design has been utilized to allow for data collected from the
first quantitative phase of the study to inform the qualitative phase. The entire population of
instructional personnel of one middle school in a large urban school district was sampled for data
collection during the quantitative phase of the study. Additionally, in the qualitative phase, two
focus group interviews were conducted with selected members of the instructional population.
Validity and reliability of instruments utilized in the quantitative phase were also discussed, and
data collection methods and response rates for both the quantitative and qualitative phases were
detailed. Finally, data analysis procedures were outlined and described for the quantitative,
qualitative, and synthesis phases of the research. Procedures included statistical tests utilized for
the quantitative data, and multiple credibility techniques used in the qualitative and synthesis
phases of this mixed methods study.

79
CHAPTER 4 PRESENTATION AND ANALYSIS OF DATA
Introduction
This study was designed to investigate the District Professional Learning Community
(DPLC) model of professional development during years one and two of implementation in a
large urban school district. DPLC uses a distributed leadership approach to deliver cross-content
area literacy strategies to all teachers across the school district. In addition to the improvement
of literacy instruction, the DPLC model offers potential for impacting organizational trust and
collective teacher efficacy in schools.
In order to investigate the influence of the DPLC model of professional learning on
teacher perceptions, the following three research questions were developed.
1. In what ways and to what extent is collective teacher efficacy influenced by
participation in DPLC model of professional learning?
2. In what ways and to what extent is teacher organizational trust influenced by
participation in DPLC model of professional learning?
3. In what ways and to what extent do teachers perceive that DPLC is accomplishing its
goals of improving literacy?
Literature searches revealed no existing literature on the influence of the DPLC model on
collective teacher efficacy and organizational trust. This case study describes and characterizes
the relationship between the implementation of DPLC model and collective teacher efficacy and
organizational trust at one middle school in a large urban school district. These research
questions provided direction in reviewing relevant literature, collecting and analyzing data, and
interpreting results.

80
Chapter Organization
This results chapter has been organized in three major sections: quantitative phase,
qualitative phase, and synthesis phase. Each major section contains a discussion of the analysis
of results through separate subheadings related to variables and themes.
The quantitative phase provides a presentation and analysis of data based on statistical
testing utilizing multiple analysis of variance (ANOVA) to measure the dependent variables:
collective teacher efficacy and organizational trust. The ANOVA results also include the use of
the moderator variables: years of teaching experience, subject area taught, gender and DPLC Site
Team membership to explore the different ways in which the dependents variables are influenced
by the DPLC model. Additionally, the quantitative phase investigated Research Question 3 by
using the results from multiple chi-square tests. A series of chi-square tests were performed to
investigate participant responses to each DPLC Likert item. Additional chi-square tests were
used to compare the differences in perceptions among groups using the moderator variables:
years of teaching experience, subject area taught, gender, and DPLC Site Team membership.
The section, qualitative phase, includes subsections discussing the results obtained from
the focus group interviews. Coding methods, patterns, and themes discovered within and among
the interviews have been explored and reported. The qualitative phase subsection also describes
credibility techniques utilized to increase the validity and reliability of results. The qualitative
phase concludes with the use of logic model analytics to present a conceptual framework of the
qualitative findings.
The synthesis section includes subsections combining data collected from the quantitative
phases and the qualitative phase through a joint data display in order to formulate an overall

81
interpretation of results. Furthermore, the synthesis describes credibility techniques utilized to
increase the validity and reliability of results. This phase synthesizes all findings and concludes
the analysis of the results of this case study.
Quantitative Phase
In the quantitative phase of this study, descriptive and inferential statistics were used to
investigate the three research questions. An analysis of variance (ANOVA) was utilized for
research questions one and two to compare the amount of variance of the dependent variables
over the course of three survey administrations. Additional two-way ANOVAs were used to
compare the amount of variance between groups using the moderator variables: years of teaching
experience, subject area taught, gender, and DPLC Site Team membership. Specifically, the
interaction effects are reported for each moderator variable with time as the corresponding factor.
Research Question 3 was investigated by using the results from multiple chi-square tests. A
series of chi-square tests were performed to investigate participant responses to each DPLC
Likert item. Additional chi-square tests were used compare the differences in perceptions among
groups using the moderator variables: years of teaching experience, subject area taught, gender,
and DPLC Site Team membership. Initially, the crosstabulations are reported as descriptive
statistics for each DPLC survey item and moderator variable in a separate subsection. In the
following section, chi-squared results are reported as the statistical analysis for each DPLC
survey item and moderator variable.
Table 2 focuses on participant survey completion by survey subsection and
administration period. The completion results are presented in Table 2.
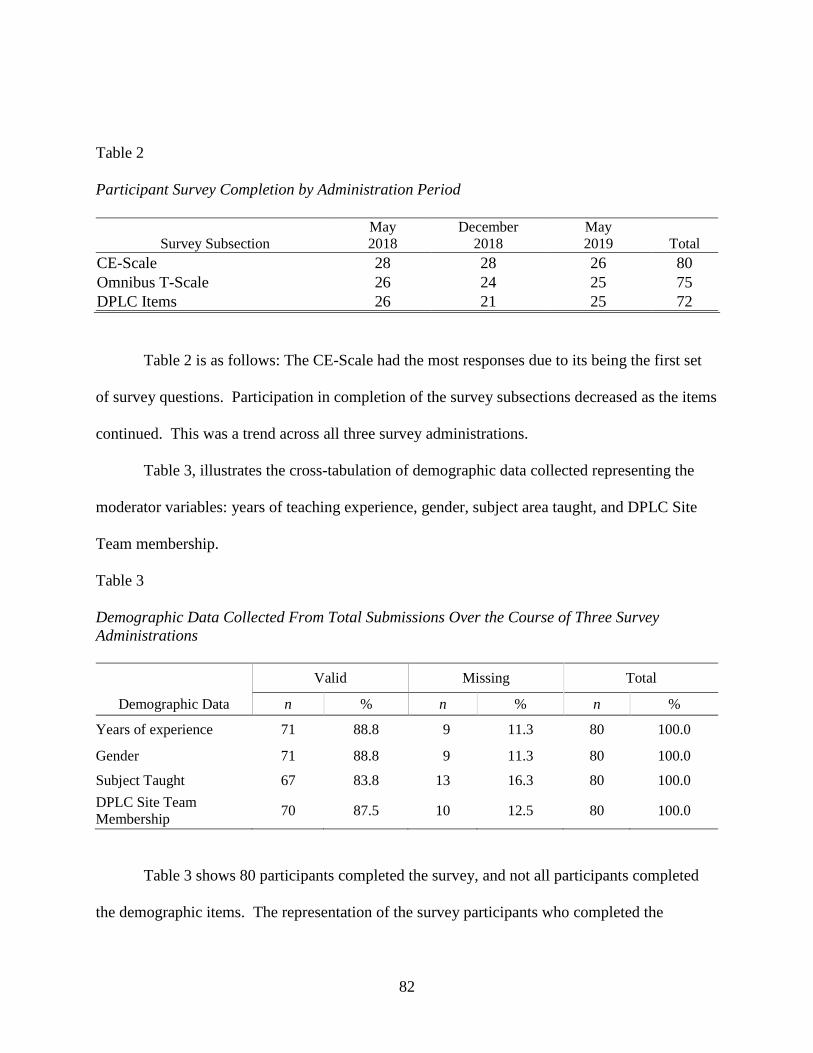
82
Table 2 Participant Survey Completion by Administration Period
Survey Subsection May 2018
December 2018
May 2019 Total
CE-Scale 28 28 26 80 Omnibus T-Scale 26 24 25 75 DPLC Items 26 21 25 72
Table 2 is as follows: The CE-Scale had the most responses due to its being the first set
of survey questions. Participation in completion of the survey subsections decreased as the items
continued. This was a trend across all three survey administrations.
Table 3, illustrates the cross-tabulation of demographic data collected representing the
moderator variables: years of teaching experience, gender, subject area taught, and DPLC Site
Team membership.
Table 3 Demographic Data Collected From Total Submissions Over the Course of Three Survey Administrations
Valid Missing Total
Demographic Data n % n % n %
Years of experience 71 88.8 9 11.3 80 100.0
Gender 71 88.8 9 11.3 80 100.0
Subject Taught 67 83.8 13 16.3 80 100.0 DPLC Site Team Membership 70 87.5 10 12.5 80 100.0
Table 3 shows 80 participants completed the survey, and not all participants completed
the demographic items. The representation of the survey participants who completed the
83
demographic items is shown as well as the number of missing cases. The data reported in Table
3 is meant to explain the number of cases for each moderator variable as the following
subsections report the statistical analyses for each of these categories.
Research Question 1
In what ways and to what extent is collective teacher efficacy influenced by participation in DPLC model of professional learning? There were different assumptions that needed to be considered. Descriptive and
statistical analyses have been conducted to understand more closely the extent of collective
teacher efficacy on the DPLC model of professional learning.
Assumptions
At the initial stage of data analysis, it is vital to explore the assumptions of the statistical
test being utilized. The analysis of variance (ANOVA) must meet six assumptions in order to
qualify as the appropriate statistical test. The first three assumptions relate to the study design:
(a) there is a continuous dependent variable (collective teacher efficacy); (b) the independent
variable is categorical with two or more independent groups (survey administrations 1, 2, and 3);
(c) there is independence of observations. All three of these assumptions were met with the use
of this study design.
The following three assumptions relate to how the data fit into their particular statistical
test and the SPSS statistical results. The next assumption of an ANOVA is that there are no
significant outliers in the group. An additional assumption discusses the normality of
distribution. All variables revealed normal distributions. The final assumption of an ANOVA is
homogeneity of variance. Levene’s test of equality of variances was run for each ANOVA to

84
ensure homogeneity of variance. The results showed that all criteria were met for this
assumption.
Descriptive Statistics
CE-Scale Over Time
The means of the CE-Scale results were run for each of the three survey administrations.
The results are presented in Table 4.
Table 4 Means and Standard Deviations of Collective Teacher Efficacy Over the Course of Three Survey Administrations
Survey Administration n Mean SD May 2018 28 79.07 10.66 December 2018 26 81.42 14.44 May 2019 26 84.58 10.85 Total 80 81.63 12.13 Table 4 shows that the mean score of collective teacher efficacy increased over all three
survey administrations. Table 4 illustrates this increase in mean ranging from May 2018 (M =
79.07) to December 2019 (M = 81.42) to May 2019 (M = 84.58).
CE-Scale by Years of Experience
Collective teacher efficacy, as measured by the CE-Scale, was characterized by years of
teaching experience for each of the three survey administrations. The results of the analysis are
presented in Table 5.

85
Table 5 Means of CE-Scale Categorized by Years of Teaching Experience Over the Course of Three Survey Administrations
Years of Teaching Experience
May 2018 December 2018 May 2019 n Mean SD n Mean SD n Mean SD
0 - 5 8 76.75 9.56 8 79.13 10.73 7 83.43 8.46 6 - 15 10 75.50 12.15 9 77.78 17.25 8 84.63 11.62 More than 15 7 85.14 10.16 4 91.00 17.21 10 87.10 11.47 Total 25 78.60 11.20 21 80.81 15.16 25 85.28 10.45
Table 5 is as follows: Participants with 0-5 year of teaching experience reported a steady
increase in mean from survey administration one (M = 76.75), two (M = 79.13) and three (M =
83.43). Likewise, participants with 6-15 year of teaching experience reported a steady increase
in mean from survey administration one (M = 75.50), two (M = 77.78) and three (M = 84.63,
SD). On the other hand, participants with over 15 years of year of teaching experience reported
an increase in mean from survey administration one (M = 85.14) to administration two (M =
91.00). However, by survey administration three, the mean decreased (M = 87.10). Though the
most experienced group of teachers showed a slight decrease in collective teacher efficacy, this
group also began and ended the study with the highest mean.
CE-Scale by Gender
The CE-Scale results were characterized by gender for each of the three survey
administrations. The results are presented in Table 6.

86
Table 6 Means of CE-Scale Categorized by Gender Over the Course of Three Survey Administrations
Gender May 2018 December 2018 May 2019 n Mean SD n Mean SD n Mean SD
Male 5 83.20 4.44 7 77.14 16.04 8 86.00 10.35 Female 20 77.45 12.14 14 82.64 14.96 17 84.94 10.80 Total 25 78.60 11.20 21 80.81 15.16 25 85.28 10.45
As shown in Table 6, between survey administrations one and two, males reported a
decrease in Collective Teacher Efficacy. This decrease ranged from (M = 83.20) to (M = 77.14).
By survey administration three, males (M = 86.00) reported an increase Collective Teacher
Efficacy which surpassed survey administration one. On the other hand, females reported a
steady increase in Collective Teacher Efficacy from survey administration one (M = 77.45),
survey administration two (M = 82.64), and survey administration three (M = 84.95).
CE-Scale by Subject Area Taught
Collective teacher efficacy, as measured by the CE-Scale, was characterized by subject
area taught for each of the three survey administrations. The results of the analysis are displayed
in Table 7.
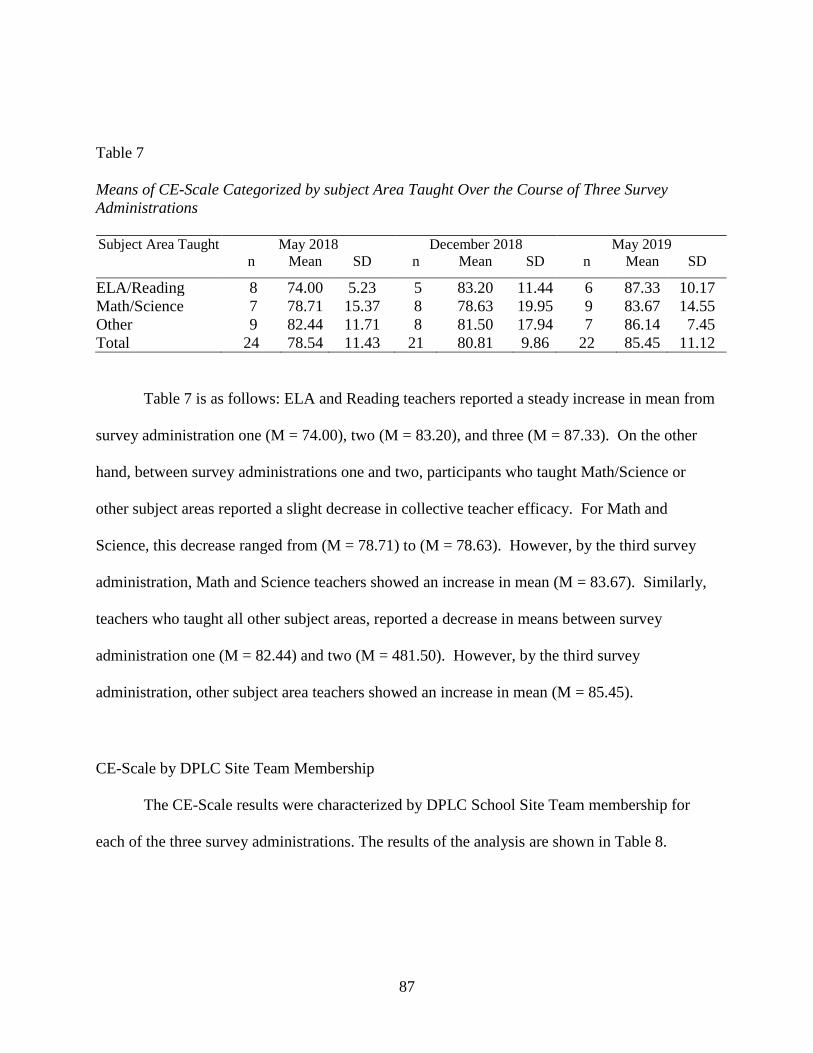
87
Table 7 Means of CE-Scale Categorized by subject Area Taught Over the Course of Three Survey Administrations Subject Area Taught May 2018 December 2018 May 2019
n Mean SD n Mean SD n Mean SD
ELA/Reading 8 74.00 5.23 5 83.20 11.44 6 87.33 10.17 Math/Science 7 78.71 15.37 8 78.63 19.95 9 83.67 14.55 Other 9 82.44 11.71 8 81.50 17.94 7 86.14 7.45 Total 24 78.54 11.43 21 80.81 9.86 22 85.45 11.12
Table 7 is as follows: ELA and Reading teachers reported a steady increase in mean from
survey administration one (M = 74.00), two (M = 83.20), and three (M = 87.33). On the other
hand, between survey administrations one and two, participants who taught Math/Science or
other subject areas reported a slight decrease in collective teacher efficacy. For Math and
Science, this decrease ranged from (M = 78.71) to (M = 78.63). However, by the third survey
administration, Math and Science teachers showed an increase in mean (M = 83.67). Similarly,
teachers who taught all other subject areas, reported a decrease in means between survey
administration one (M = 82.44) and two (M = 481.50). However, by the third survey
administration, other subject area teachers showed an increase in mean (M = 85.45).
CE-Scale by DPLC Site Team Membership
The CE-Scale results were characterized by DPLC School Site Team membership for
each of the three survey administrations. The results of the analysis are shown in Table 8.

88
Table 8 Means of CE-Scale Categorized by DPLC Site Team Membership Over the Course of Three Survey Administrations
DPLC Site Team Member
May 2018 December 2018 May 2019 n Mean SD n Mean SD n Mean SD
Yes 7 77.00 12.53 9 80.67 11.02 10 82.90 11.47 No 18 79.22 10.96 12 80.92 18.15 14 87.07 10.13 Total 25 78.60 11.20 21 80.81 15.16 24 85.33 10.67 Table 8 is as follows: DPLC School Site Team members and non-members both showed
a steady increase in collective teacher efficacy over the course of three survey administrations.
Members reported a steady increase in collective teacher efficacy from survey administration one
(M = 77.00), survey administration two (M = 80.67), and survey administration three (M =
82.90). Non-members also reported a steady increase from survey administration one (M =
79.22), survey administration two (M = 80.92), and survey administration three (M = 87.07).
Statistical Analysis
Collective Teacher Efficacy Over Time
A one-way ANOVA was conducted to determine if collective teacher efficacy changed
over the course of the study at Central Florida Middle School (CFMS). As shown in Table 9,
participants completed the CE-Scale over three survey administrations: May 2018 (n = 28),
December 2018 (n = 26), May 2019 (n = 26).

89
Table 9 Statistical Significance of Collective Teacher Efficacy Over the Course of Three survey Administrations (Tukey Post Hoc)
(I) Survey
Administration
(J) Survey
Administration
Mean Difference
(I-J)
Sig.
95% Confidence Interval
Lower Bound Upper Bound May 2018 December 2018
May 2019 -2.35165 -5.50549
.755
.221 -10.2088 -13.3627
5.5055 2.3517
December 2018 May 2018 May 2019
2.35165 -3.15385
.755
.616 -5.5055
-11.1552 10.2088 4.8475
May 2019 May 2018 December 2018
5.50549 3.15385
.221
.616 -2.3517 -4.8475
13.3627 11.1552
Table 9 is as follows: CE-Scale scores increased from May 2018 (M = 79.07, SD =
10.66) to December 2019 (M = 81.42, SD = 14.44) to May 2019 (M = 84.58, SD = 10.85);
however, the differences between scores by survey administration was not statistically
significant, F(2, 77) = 1.407, p = .251. Therefore, the null hypothesis could not be rejected.
Additionally, Tukey post hoc analysis revealed that no combination of the mean score increases
was statistically significant.
Collective Teacher Efficacy by Categorical Variable
A two-way ANOVA was conducted to test the interaction effects between CE-Scale
survey administration and each of the following categorical variables: years of teaching
experience, gender, subject area taught, and DPLC Site Membership. The interaction effects are
reported in Table 10.

90
Table 10 Results of Two-way ANOVA: Tests of Between Subjects Effects for Collective Teacher Efficacy
Subject Pairs df F Sig. Survey administration * Years of Teaching Experience 4 .293 .881 Survey administration * Subject Area Taught 4 .534 .711 Survey administration * Gender 2 .556 .577 Survey administration * DPLC Site Team Membership 2 .181 .835 Error 46 Total 67
a. R Squared = .255 (Adjusted R Squared = -.069)
b. Computed using alpha = .05
Table 10 is as follows: Though, in all cases the means of each categorical variable
increased by survey administration three, the results show no statistically significant interaction
between survey administration and any of the categorical variables. There was no statistically
significant interaction between survey administration and years of teaching experience, F(4, 46)
= .293, p = .881. There was no statistically significant interaction between survey administration
and gender, F(2, 46) = .556, p = .577. There was no statistically significant interaction between
survey administration and subject area taught, F(4, 46) = .534, p = .711. There was no
statistically significant interaction between survey administration and DPLC Site
Membership, F(2, 46) = .181, p = .835.

91
Research Question 2
In what ways and to what extent is organizational trust influenced by participation in DPLC model of professional learning? There were different assumptions that needed to be considered. Descriptive and
statistical analyses have been conducted to understand more clearly the extent of organizational
trust and participation in the DPLC model of professional learning.
Assumptions
At the initial stage of data analysis, it is vital to explore the assumptions of the statistical
test being utilized. The one-way ANOVA must meet six assumptions in order to qualify as the
appropriate statistical test. The first three assumptions relate to the study design: (a) there is a
continuous dependent variable (collective teacher efficacy); (b) the independent variable is
categorical with two or more independent groups (survey administrations 1, 2, and 3); (c) there is
independence of observations. All three of these assumptions were met with the use of this study
design.
The following three assumptions relate to how the data fit into each particular statistical
test and the SPSS statistical results. The next assumption of an ANOVA describes that there are
no significant outliers in the group. An additional assumption discusses the normality of
distributions. All variables revealed normal distributions. The final assumption of an ANOVA
is homogeneity of variance. Levene’s test of equality of variances was run for each ANOVA to
ensure homogeneity of variance. The results showed that all criteria were met for this
assumption.
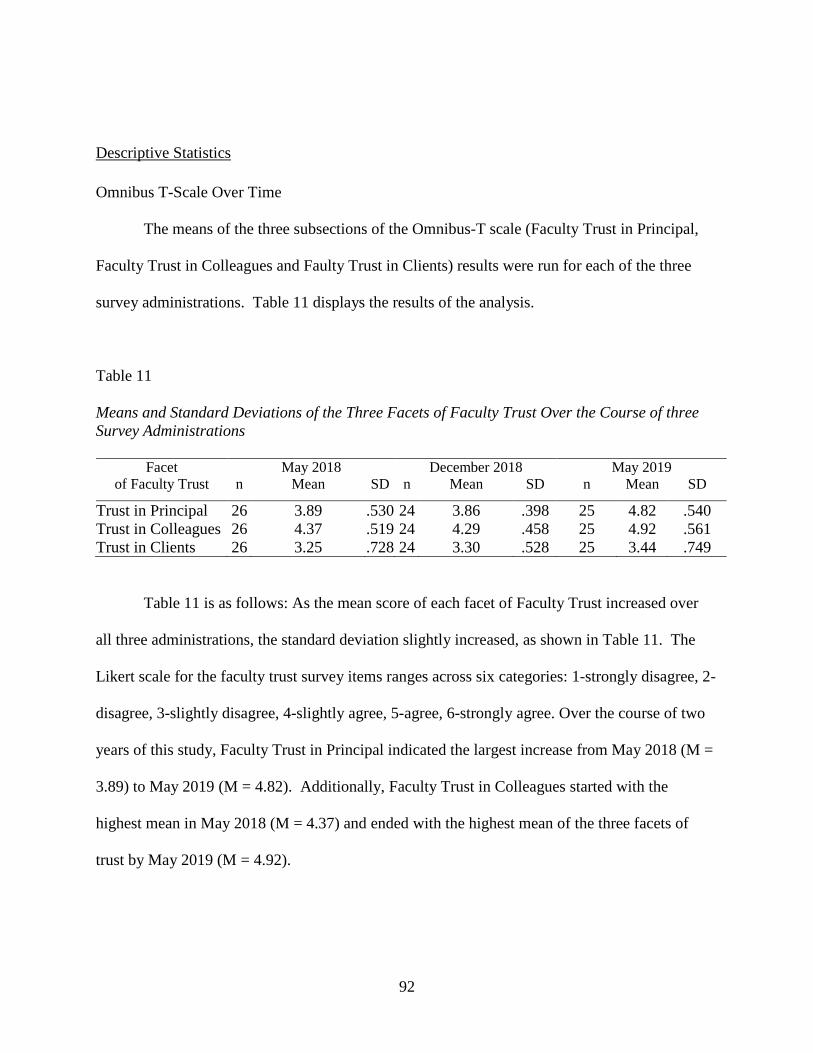
92
Descriptive Statistics
Omnibus T-Scale Over Time
The means of the three subsections of the Omnibus-T scale (Faculty Trust in Principal,
Faculty Trust in Colleagues and Faulty Trust in Clients) results were run for each of the three
survey administrations. Table 11 displays the results of the analysis.
Table 11 Means and Standard Deviations of the Three Facets of Faculty Trust Over the Course of three Survey Administrations
Facet of Faculty Trust
May 2018 December 2018 May 2019 n Mean SD n Mean SD n Mean SD
Trust in Principal 26 3.89 .530 24 3.86 .398 25 4.82 .540 Trust in Colleagues 26 4.37 .519 24 4.29 .458 25 4.92 .561 Trust in Clients 26 3.25 .728 24 3.30 .528 25 3.44 .749
Table 11 is as follows: As the mean score of each facet of Faculty Trust increased over
all three administrations, the standard deviation slightly increased, as shown in Table 11. The
Likert scale for the faculty trust survey items ranges across six categories: 1-strongly disagree, 2-
disagree, 3-slightly disagree, 4-slightly agree, 5-agree, 6-strongly agree. Over the course of two
years of this study, Faculty Trust in Principal indicated the largest increase from May 2018 (M =
3.89) to May 2019 (M = 4.82). Additionally, Faculty Trust in Colleagues started with the
highest mean in May 2018 (M = 4.37) and ended with the highest mean of the three facets of
trust by May 2019 (M = 4.92).
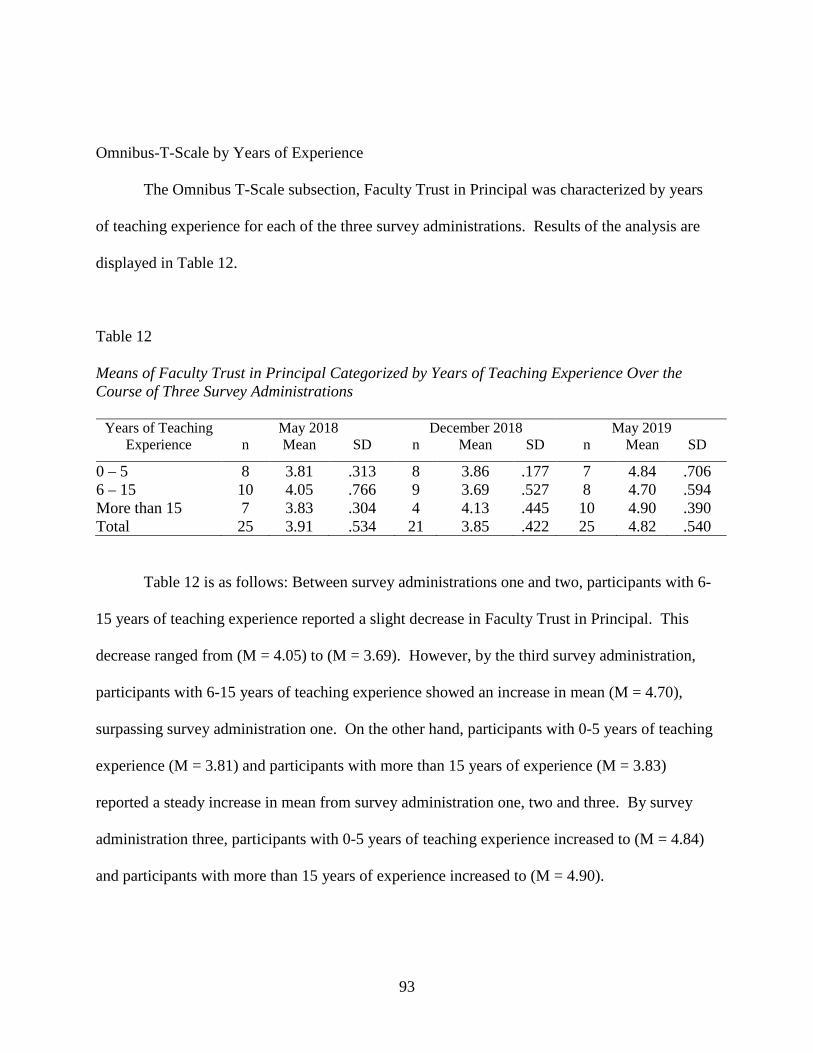
93
Omnibus-T-Scale by Years of Experience
The Omnibus T-Scale subsection, Faculty Trust in Principal was characterized by years
of teaching experience for each of the three survey administrations. Results of the analysis are
displayed in Table 12.
Table 12 Means of Faculty Trust in Principal Categorized by Years of Teaching Experience Over the Course of Three Survey Administrations
Years of Teaching Experience
May 2018 December 2018 May 2019 n Mean SD n Mean SD n Mean SD
0 – 5 8 3.81 .313 8 3.86 .177 7 4.84 .706 6 – 15 10 4.05 .766 9 3.69 .527 8 4.70 .594 More than 15 7 3.83 .304 4 4.13 .445 10 4.90 .390 Total 25 3.91 .534 21 3.85 .422 25 4.82 .540
Table 12 is as follows: Between survey administrations one and two, participants with 6-
15 years of teaching experience reported a slight decrease in Faculty Trust in Principal. This
decrease ranged from (M = 4.05) to (M = 3.69). However, by the third survey administration,
participants with 6-15 years of teaching experience showed an increase in mean (M = 4.70),
surpassing survey administration one. On the other hand, participants with 0-5 years of teaching
experience (M = 3.81) and participants with more than 15 years of experience (M = 3.83)
reported a steady increase in mean from survey administration one, two and three. By survey
administration three, participants with 0-5 years of teaching experience increased to (M = 4.84)
and participants with more than 15 years of experience increased to (M = 4.90).
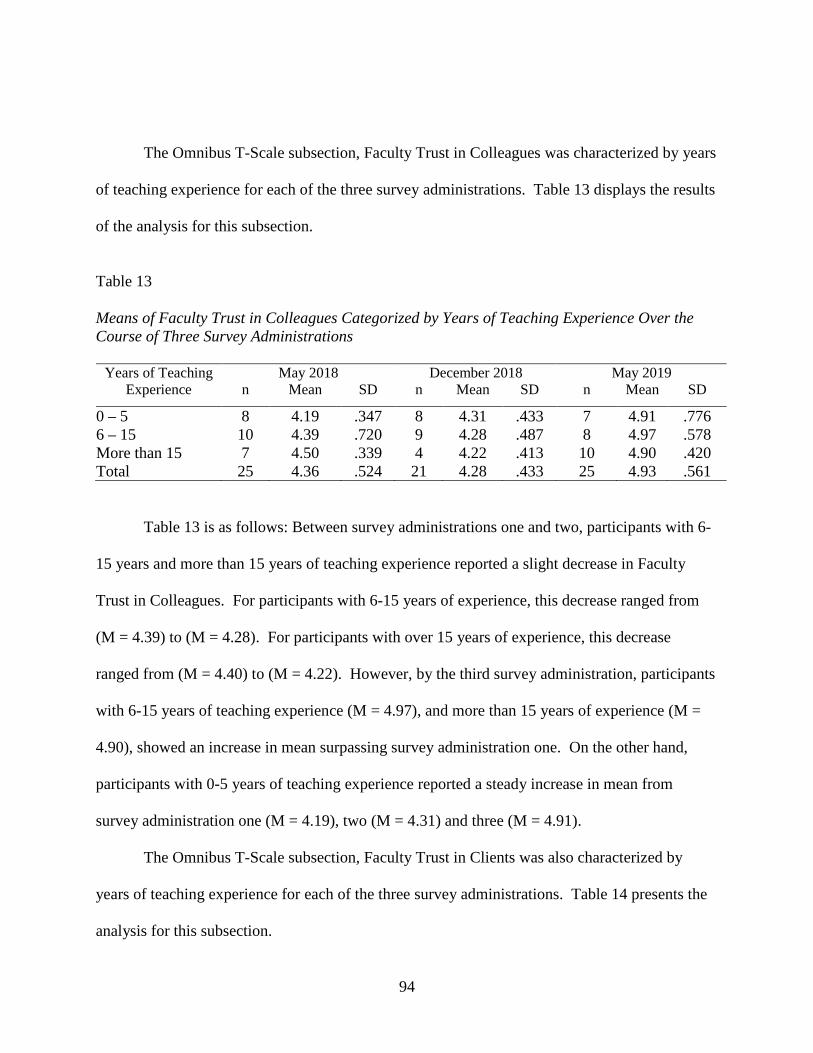
94
The Omnibus T-Scale subsection, Faculty Trust in Colleagues was characterized by years
of teaching experience for each of the three survey administrations. Table 13 displays the results
of the analysis for this subsection.
Table 13 Means of Faculty Trust in Colleagues Categorized by Years of Teaching Experience Over the Course of Three Survey Administrations
Years of Teaching Experience
May 2018 December 2018 May 2019 n Mean SD n Mean SD n Mean SD
0 – 5 8 4.19 .347 8 4.31 .433 7 4.91 .776 6 – 15 10 4.39 .720 9 4.28 .487 8 4.97 .578 More than 15 7 4.50 .339 4 4.22 .413 10 4.90 .420 Total 25 4.36 .524 21 4.28 .433 25 4.93 .561
Table 13 is as follows: Between survey administrations one and two, participants with 6-
15 years and more than 15 years of teaching experience reported a slight decrease in Faculty
Trust in Colleagues. For participants with 6-15 years of experience, this decrease ranged from
(M = 4.39) to (M = 4.28). For participants with over 15 years of experience, this decrease
ranged from (M = 4.40) to (M = 4.22). However, by the third survey administration, participants
with 6-15 years of teaching experience (M = 4.97), and more than 15 years of experience (M =
4.90), showed an increase in mean surpassing survey administration one. On the other hand,
participants with 0-5 years of teaching experience reported a steady increase in mean from
survey administration one (M = 4.19), two (M = 4.31) and three (M = 4.91).
The Omnibus T-Scale subsection, Faculty Trust in Clients was also characterized by
years of teaching experience for each of the three survey administrations. Table 14 presents the
analysis for this subsection.

95
Table 14 Means of Faculty Trust in Clients Categorized by Years of Teaching Experience Over the Course of Three Survey Administrations
Years of Teaching Experience
May 2018 December 2018 May 2019 n Mean SD n Mean SD n Mean SD
0 – 5 8 3.00 .441 8 3.27 .560 7 3.09 .767 6 – 15 10 3.46 .901 9 3.33 .676 8 3.60 .838 More than 15 7 3.26 .779 4 3.20 .141 10 3.56 .650 Total 25 3.26 .743 21 3.28 .546 25 4.44 .749
Table 14 is as follows: Between survey administrations one and two, participants with 6-
15 years and more than 15 years of teaching experience reported a slight decrease in Faculty
Trust in Clients. For participants with 6-15 years of experience, this decrease ranged from (M =
4.46) to (M = 3.33). For participants with over 15 years of experience, this decrease ranged from
(M = 3.26) to (M = 3.20). However, by the third survey administration, participants with 6-15
years of teaching experience (M = 3.60), and more than 15 years of experience (M = 3.56),
showed an increase in mean surpassing survey administration one. On the other hand,
participants with 0-5 year of teaching experience reported an increase in mean from survey
administration one (M = 3.00) to administration two (M = 3.27). However, by survey
administration three, the mean decreased (M = 3.09).
Omnibus T-Scale by Gender
The Omnibus T-Scale subsection, Faculty Trust in Principal was characterized by gender
for each of the three survey administrations. The analysis for Omnibus T-Scale is shown in
Table 15.
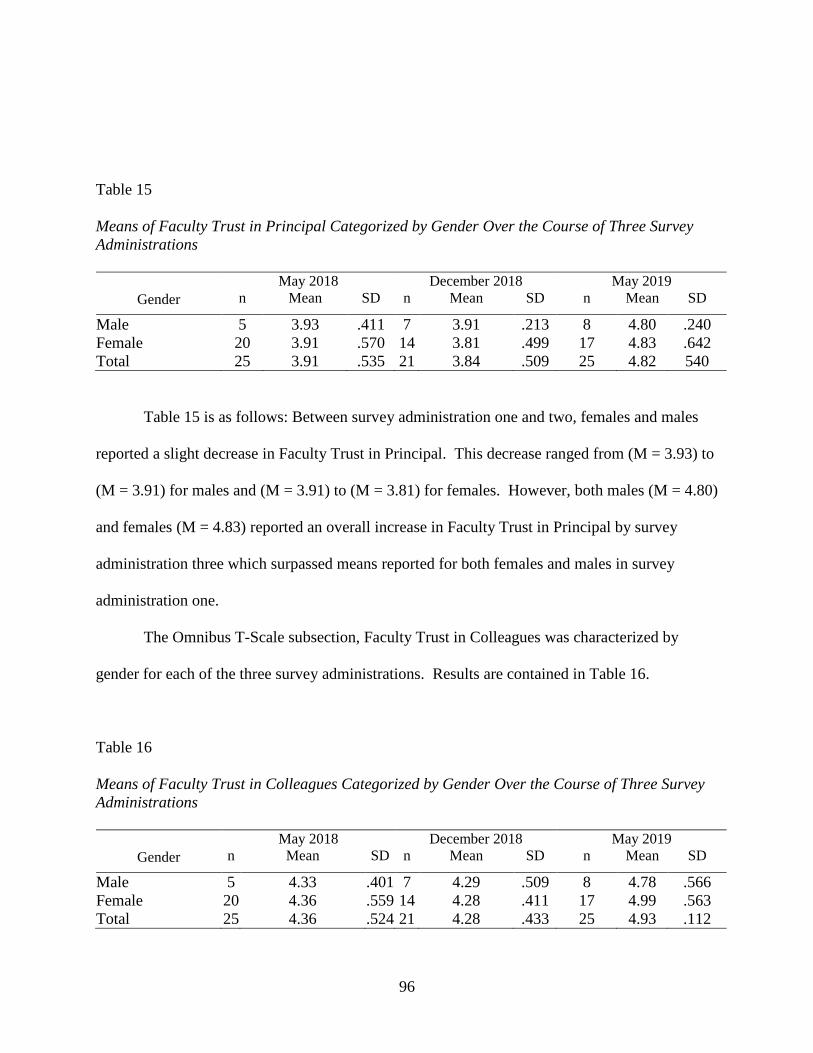
96
Table 15 Means of Faculty Trust in Principal Categorized by Gender Over the Course of Three Survey Administrations
Gender
May 2018 December 2018 May 2019 n Mean SD n Mean SD n Mean SD
Male 5 3.93 .411 7 3.91 .213 8 4.80 .240 Female 20 3.91 .570 14 3.81 .499 17 4.83 .642 Total 25 3.91 .535 21 3.84 .509 25 4.82 540
Table 15 is as follows: Between survey administration one and two, females and males
reported a slight decrease in Faculty Trust in Principal. This decrease ranged from (M = 3.93) to
(M = 3.91) for males and (M = 3.91) to (M = 3.81) for females. However, both males (M = 4.80)
and females (M = 4.83) reported an overall increase in Faculty Trust in Principal by survey
administration three which surpassed means reported for both females and males in survey
administration one.
The Omnibus T-Scale subsection, Faculty Trust in Colleagues was characterized by
gender for each of the three survey administrations. Results are contained in Table 16.
Table 16 Means of Faculty Trust in Colleagues Categorized by Gender Over the Course of Three Survey Administrations
Gender
May 2018 December 2018 May 2019 n Mean SD n Mean SD n Mean SD
Male 5 4.33 .401 7 4.29 .509 8 4.78 .566 Female 20 4.36 .559 14 4.28 .411 17 4.99 .563 Total 25 4.36 .524 21 4.28 .433 25 4.93 .112
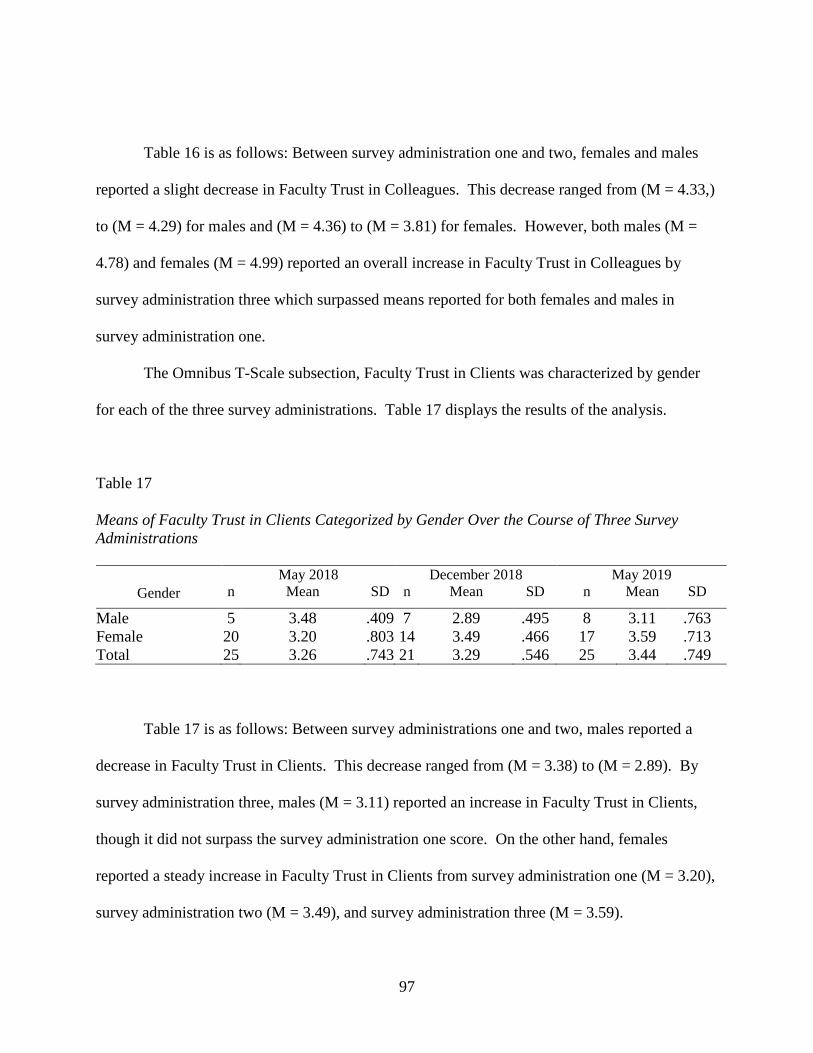
97
Table 16 is as follows: Between survey administration one and two, females and males
reported a slight decrease in Faculty Trust in Colleagues. This decrease ranged from (M = 4.33,)
to (M = 4.29) for males and (M = 4.36) to (M = 3.81) for females. However, both males (M =
4.78) and females (M = 4.99) reported an overall increase in Faculty Trust in Colleagues by
survey administration three which surpassed means reported for both females and males in
survey administration one.
The Omnibus T-Scale subsection, Faculty Trust in Clients was characterized by gender
for each of the three survey administrations. Table 17 displays the results of the analysis.
Table 17 Means of Faculty Trust in Clients Categorized by Gender Over the Course of Three Survey Administrations
Gender
May 2018 December 2018 May 2019 n Mean SD n Mean SD n Mean SD
Male 5 3.48 .409 7 2.89 .495 8 3.11 .763 Female 20 3.20 .803 14 3.49 .466 17 3.59 .713 Total 25 3.26 .743 21 3.29 .546 25 3.44 .749 Table 17 is as follows: Between survey administrations one and two, males reported a
decrease in Faculty Trust in Clients. This decrease ranged from (M = 3.38) to (M = 2.89). By
survey administration three, males (M = 3.11) reported an increase in Faculty Trust in Clients,
though it did not surpass the survey administration one score. On the other hand, females
reported a steady increase in Faculty Trust in Clients from survey administration one (M = 3.20),
survey administration two (M = 3.49), and survey administration three (M = 3.59).

98
Omnibus T-Scale by Subject Area Taught
The Omnibus T-Scale subsection, Faculty Trust in Principal was characterized by subject
area taught for each of the three survey administrations. The results of the analysis are displayed
in Table 18.
Table 18 Means of Faculty Trust in Principal Categorized by Subject Area Taught Over the Course of Three Survey Administrations
Subject Area Taught
May 2018 December 2018 May 2019 n Mean SD n Mean SD n Mean SD
ELA/Reading 8 4.09 .873 5 3.82 .903 6 5.04 .757 Math/Science 7 3.82 .227 8 3.85 .155 9 4.78 .369 Other 9 3.82 .319 8 3.84 .129 7 4.68 .657 Total 24 3.91 .546 21 3.84 .421 22 4.82 .577 Table 18 is as follows: Math and Science teachers reported a steady increase in mean
from survey administration one (M = 3.82), two (M = 3.87), and three (M = 4.78). Likewise,
teachers of all other content areas (Social Studies, Elective classes, and Exceptional Student
Education) reported a steady increase in mean from survey administration one (M = 3.82), two
(M = 3.84) and three (M = 4.68). On the other hand, between survey administrations one and
two, participants who taught English/Language Arts (ELA) or Reading reported a slight decrease
in Faculty Trust in Principal. This decrease ranged from (M = 4.09) to (M = 3.82). However, by
the third survey administration, ELA/Reading teachers showed an increase in mean (M = 5.04),
surpassing survey administration one and the means all other subject area teacher.
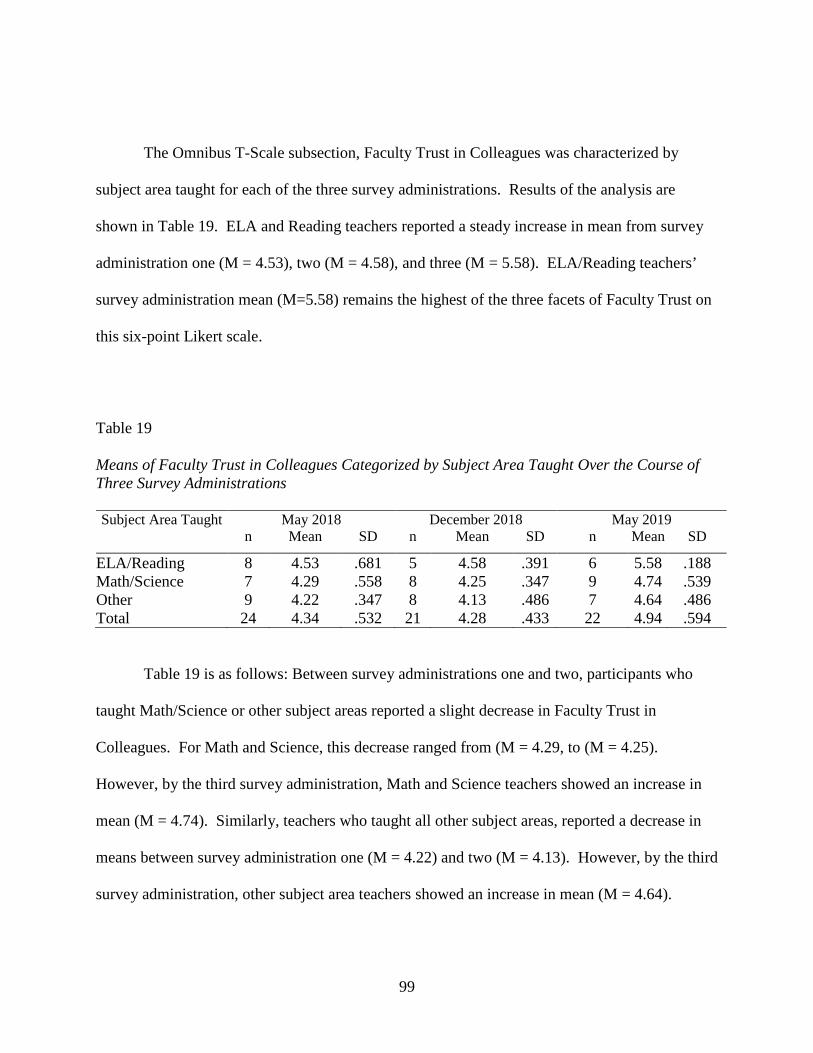
99
The Omnibus T-Scale subsection, Faculty Trust in Colleagues was characterized by
subject area taught for each of the three survey administrations. Results of the analysis are
shown in Table 19. ELA and Reading teachers reported a steady increase in mean from survey
administration one (M = 4.53), two (M = 4.58), and three (M = 5.58). ELA/Reading teachers’
survey administration mean (M=5.58) remains the highest of the three facets of Faculty Trust on
this six-point Likert scale.
Table 19 Means of Faculty Trust in Colleagues Categorized by Subject Area Taught Over the Course of Three Survey Administrations Subject Area Taught May 2018 December 2018 May 2019
n Mean SD n Mean SD n Mean SD
ELA/Reading 8 4.53 .681 5 4.58 .391 6 5.58 .188 Math/Science 7 4.29 .558 8 4.25 .347 9 4.74 .539 Other 9 4.22 .347 8 4.13 .486 7 4.64 .486 Total 24 4.34 .532 21 4.28 .433 22 4.94 .594
Table 19 is as follows: Between survey administrations one and two, participants who
taught Math/Science or other subject areas reported a slight decrease in Faculty Trust in
Colleagues. For Math and Science, this decrease ranged from (M = 4.29, to (M = 4.25).
However, by the third survey administration, Math and Science teachers showed an increase in
mean (M = 4.74). Similarly, teachers who taught all other subject areas, reported a decrease in
means between survey administration one (M = 4.22) and two (M = 4.13). However, by the third
survey administration, other subject area teachers showed an increase in mean (M = 4.64).
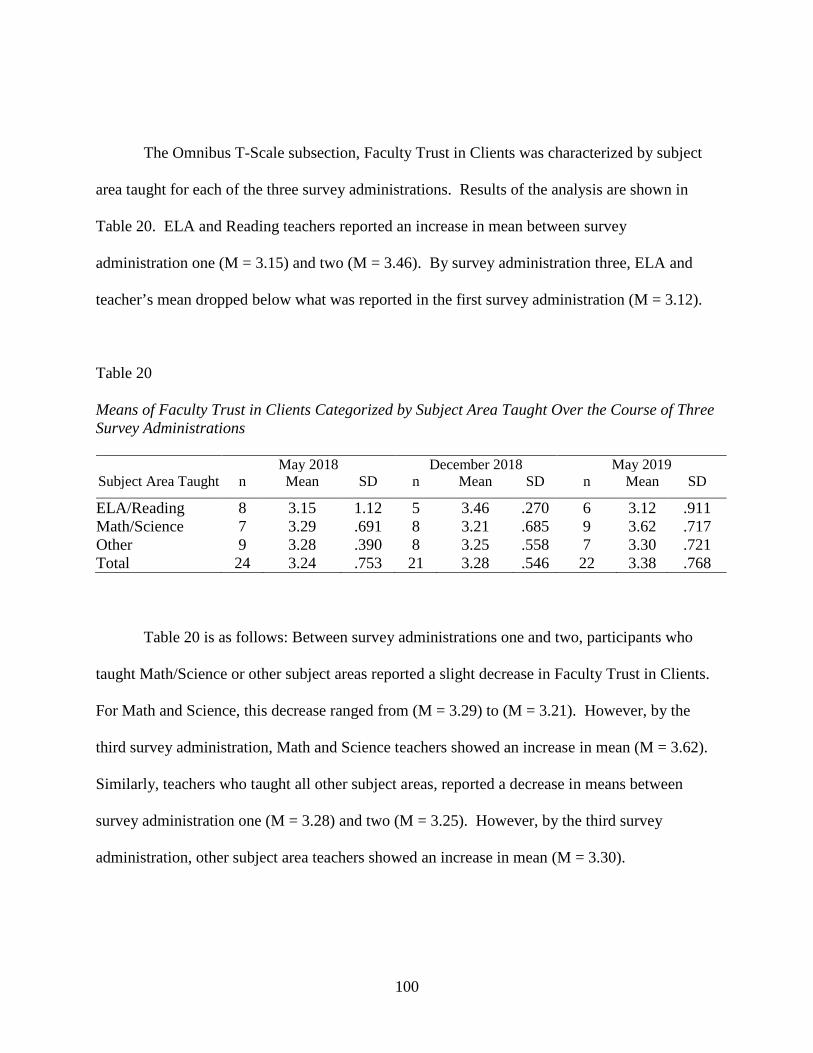
100
The Omnibus T-Scale subsection, Faculty Trust in Clients was characterized by subject
area taught for each of the three survey administrations. Results of the analysis are shown in
Table 20. ELA and Reading teachers reported an increase in mean between survey
administration one (M = 3.15) and two (M = 3.46). By survey administration three, ELA and
teacher’s mean dropped below what was reported in the first survey administration (M = 3.12).
Table 20 Means of Faculty Trust in Clients Categorized by Subject Area Taught Over the Course of Three Survey Administrations
Subject Area Taught
May 2018 December 2018 May 2019 n Mean SD n Mean SD n Mean SD
ELA/Reading 8 3.15 1.12 5 3.46 .270 6 3.12 .911 Math/Science 7 3.29 .691 8 3.21 .685 9 3.62 .717 Other 9 3.28 .390 8 3.25 .558 7 3.30 .721 Total 24 3.24 .753 21 3.28 .546 22 3.38 .768 Table 20 is as follows: Between survey administrations one and two, participants who
taught Math/Science or other subject areas reported a slight decrease in Faculty Trust in Clients.
For Math and Science, this decrease ranged from (M = 3.29) to (M = 3.21). However, by the
third survey administration, Math and Science teachers showed an increase in mean (M = 3.62).
Similarly, teachers who taught all other subject areas, reported a decrease in means between
survey administration one (M = 3.28) and two (M = 3.25). However, by the third survey
administration, other subject area teachers showed an increase in mean (M = 3.30).

101
Omnibus T-Scale by DPLC Site Team Membership
The Omnibus T-Scale subsection, Faculty Trust in Principal was characterized by DPLC
Site Team membership for each of the three survey administrations.
Table 21 Means of Faculty Trust in Principal Categorized by DPLC Site Team Membership Over the Course of Three Survey Administrations
DLC Site Team Member
May 2018 December 2018 May 2019 n Mean SD n Mean SD n Mean SD
Yes 7 4.20 .829 9 3.86 .171 10 4.60 .571 No 18 3.80 .338 12 3.83 .550 14 4.98 .497 Total 25 3.91 .535 21 3.85 .422 24 4.82 .551
As shown in Table 21, between survey administrations one and two, members reported a
slight decrease in Faculty Trust in Principal, dropping from (M = 4.20) to (M = 3.86). By
survey administration three, members (M = 4.60) reported an overall increase in Faculty Trust in
Principal. Non-members showed a steady increase across the three survey administrations.
There was a slight increase from survey administration one (M = 3.80) to survey administration
two (M = 3.83). By survey administration three, non-members (M = 4.98) reported an overall
increase in Faculty Trust in Principal which surpassed means reported for both members and
non-members across all three administrations.
The Omnibus T-Scale subsection, Faculty Trust in Colleagues was characterized by
DPLC Site Team membership for each of the three survey administrations. Members showed a
steady increase across the three survey administrations. Table 22 contains the results of the
analysis.
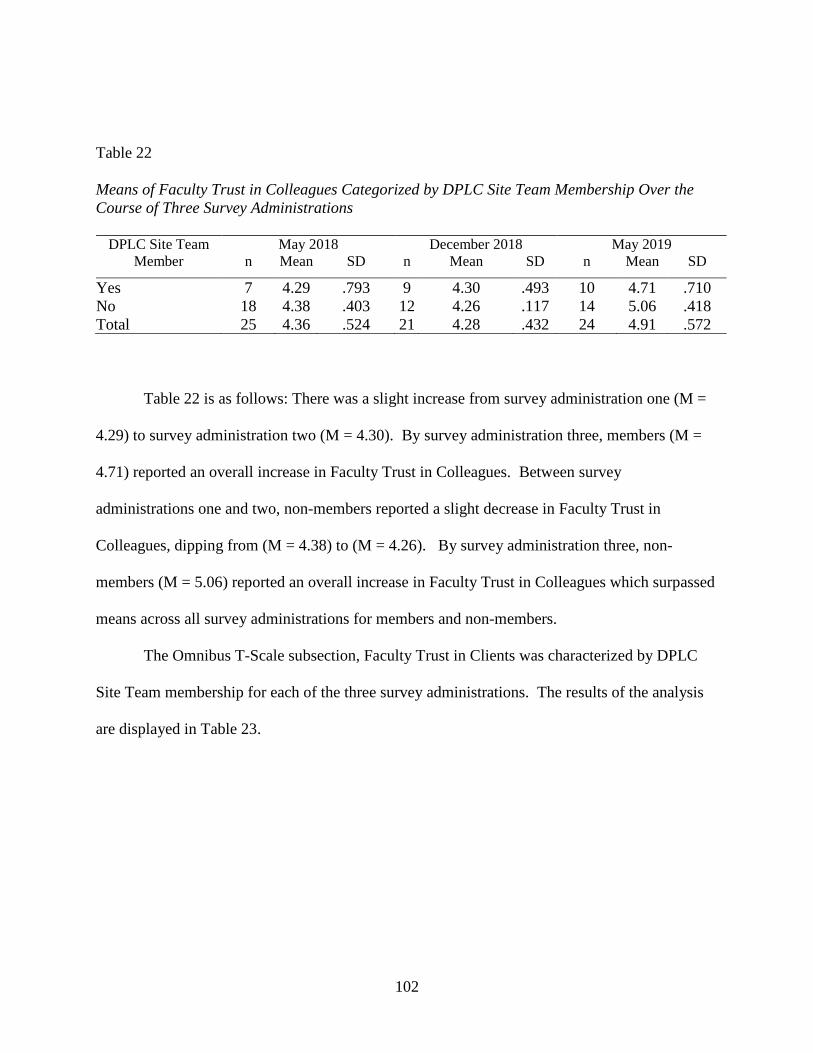
102
Table 22 Means of Faculty Trust in Colleagues Categorized by DPLC Site Team Membership Over the Course of Three Survey Administrations
DPLC Site Team Member
May 2018 December 2018 May 2019 n Mean SD n Mean SD n Mean SD
Yes 7 4.29 .793 9 4.30 .493 10 4.71 .710 No 18 4.38 .403 12 4.26 .117 14 5.06 .418 Total 25 4.36 .524 21 4.28 .432 24 4.91 .572 Table 22 is as follows: There was a slight increase from survey administration one (M =
4.29) to survey administration two (M = 4.30). By survey administration three, members (M =
4.71) reported an overall increase in Faculty Trust in Colleagues. Between survey
administrations one and two, non-members reported a slight decrease in Faculty Trust in
Colleagues, dipping from (M = 4.38) to (M = 4.26). By survey administration three, non-
members (M = 5.06) reported an overall increase in Faculty Trust in Colleagues which surpassed
means across all survey administrations for members and non-members.
The Omnibus T-Scale subsection, Faculty Trust in Clients was characterized by DPLC
Site Team membership for each of the three survey administrations. The results of the analysis
are displayed in Table 23.
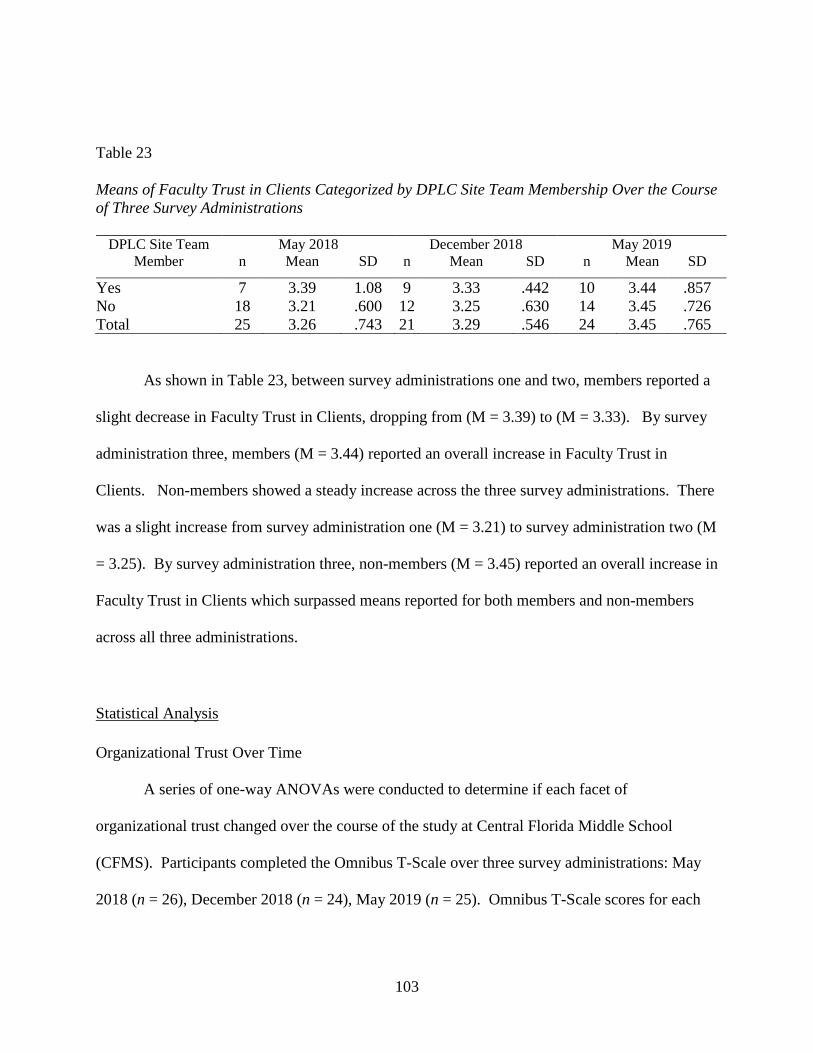
103
Table 23 Means of Faculty Trust in Clients Categorized by DPLC Site Team Membership Over the Course of Three Survey Administrations
DPLC Site Team Member
May 2018 December 2018 May 2019 n Mean SD n Mean SD n Mean SD
Yes 7 3.39 1.08 9 3.33 .442 10 3.44 .857 No 18 3.21 .600 12 3.25 .630 14 3.45 .726 Total 25 3.26 .743 21 3.29 .546 24 3.45 .765
As shown in Table 23, between survey administrations one and two, members reported a
slight decrease in Faculty Trust in Clients, dropping from (M = 3.39) to (M = 3.33). By survey
administration three, members (M = 3.44) reported an overall increase in Faculty Trust in
Clients. Non-members showed a steady increase across the three survey administrations. There
was a slight increase from survey administration one (M = 3.21) to survey administration two (M
= 3.25). By survey administration three, non-members (M = 3.45) reported an overall increase in
Faculty Trust in Clients which surpassed means reported for both members and non-members
across all three administrations.
Statistical Analysis
Organizational Trust Over Time
A series of one-way ANOVAs were conducted to determine if each facet of
organizational trust changed over the course of the study at Central Florida Middle School
(CFMS). Participants completed the Omnibus T-Scale over three survey administrations: May
2018 (n = 26), December 2018 (n = 24), May 2019 (n = 25). Omnibus T-Scale scores for each

104
subsection (Faculty Trust in Principal, Faculty Trust in Colleagues, and Faculty Trust in Clients)
increased over the three survey administrations.
Of the three facets of trust, Faculty Trust in Principal experienced the largest increase in
mean from May 2018 (M = 3.89) to May 2019 (M = 4.82). The results of the ANOVA show that
the differences between scores by survey administration was statistically significant, F(2, 72) =
30.21, p < .0005. Therefore, the null hypothesis can be rejected and the alternative hypothesis
can be accepted. Additional Tukey post hoc are represented in Table 24.
Table 24 Statistical Significance of Faculty Trust in Principal Over the Course of Three Survey Administrations (Tukey Post Hoc) (I) Survey Administration
(J) Survey Administration
Mean Difference
(I-J)
Sig.
95% Confidence Interval
Lower Bound Upper Bound
May 2018 Dec. 2018 May 2019
.03486 -.92577*
.967
.000 -.3006
-1.2577 .3703 -.5938
December 2018
May 2018 May 2019
-.03486 -.96063*
.967
.000 -.3703
-1.2993 .3006 -.6219
May 2019 May 2018 Dec. 2018
.92577*
.96063*
.000
.000 .5938 .6219
1.2577 1.2993
As displayed in Table 24, additional Tukey post hoc analysis revealed that the mean
increase from May 2018 to May 2019 (.926, 95% CI [0.594, 1.26]) was statistically significant
(p < .0005), as well as the increase from December 2018 to May 2019 (.961, 95% CI
[1.30, .621], p < .0005), but May 2018 to December 2018 difference was not statistically
significant (p = .967).
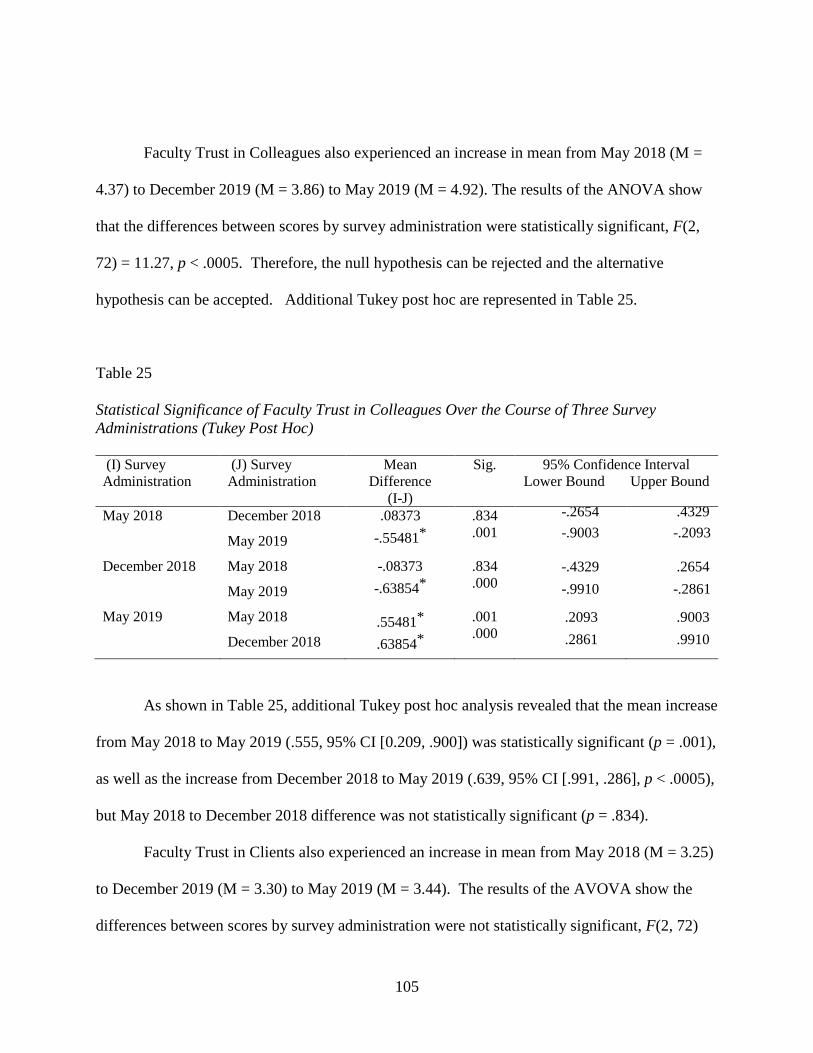
105
Faculty Trust in Colleagues also experienced an increase in mean from May 2018 (M =
4.37) to December 2019 (M = 3.86) to May 2019 (M = 4.92). The results of the ANOVA show
that the differences between scores by survey administration were statistically significant, F(2,
72) = 11.27, p < .0005. Therefore, the null hypothesis can be rejected and the alternative
hypothesis can be accepted. Additional Tukey post hoc are represented in Table 25.
Table 25 Statistical Significance of Faculty Trust in Colleagues Over the Course of Three Survey Administrations (Tukey Post Hoc) (I) Survey Administration
(J) Survey Administration
Mean Difference
(I-J)
Sig. 95% Confidence Interval Lower Bound Upper Bound
May 2018 December 2018
May 2019
.08373 -.55481*
.834
.001 -.2654 -.9003
.4329 -.2093
December 2018 May 2018
May 2019
-.08373 -.63854*
.834
.000 -.4329 -.9910
.2654 -.2861
May 2019 May 2018
December 2018 .55481* .63854*
.001
.000 .2093 .2861
.9003
.9910
As shown in Table 25, additional Tukey post hoc analysis revealed that the mean increase
from May 2018 to May 2019 (.555, 95% CI [0.209, .900]) was statistically significant (p = .001),
as well as the increase from December 2018 to May 2019 (.639, 95% CI [.991, .286], p < .0005),
but May 2018 to December 2018 difference was not statistically significant (p = .834).
Faculty Trust in Clients also experienced an increase in mean from May 2018 (M = 3.25)
to December 2019 (M = 3.30) to May 2019 (M = 3.44). The results of the AVOVA show the
differences between scores by survey administration were not statistically significant, F(2, 72)

106
= .499, p =.609. The group means were not statistically significantly different; (p > .05),
therefore, the null hypothesis must be accepted. Additional Tukey post hoc are represented in
Table 26.
Table 26 Statistical Significance of Faculty Trust in Clients Over the Course of Three Survey Administrations (Tukey Post Hoc) (I) Survey Administration
(J) Survey Administration
Mean Difference
(I-J)
Sig. 95% Confidence Interval Lower Bound Upper Bound
May 2018 December 2018
May 2019 -.04231 -.18231
.974
.605 -.5019 -.6371
.4173
.2725
December 2018 May 2018
May 2019 .04231 -.14000
.974
.751 -.4173 -.6040
.5019
.3240
May 2019 May 2018
December 2018 .18231 .14000
.605
.751 -.2725 -.3240
.6371
.6040
Table 26 is as follows: Additional Tukey post hoc analysis revealed that no combinations
of the mean score increases were statistically significant.
Organizational Trust by Categorical Variable
A two-way ANOVA was conducted to determine if Faculty Trust in Principal changed
over the course of the study at Central Florida Middle School (CFMS). A two-way ANOVA
was conducted to test the interaction effects between survey administration and each of the
following categorical variables: years of teaching experience, gender, subject area taught, and
DPLC Site Membership. The interaction effects are reported in Table 27.

107
Table 27 Results of Two-way ANOVA Tests of Between Subjects Effects for Faculty Trust in Principal
Subject Pairs df F Sig. Survey administration * Years of Teaching Experience 4 .897 .474 Survey administration * Subject Area Taught 4 .248 .909 Survey administration * Gender 2 .013 .987 Survey administration * DPLC Site Team Membership 2 1.99 .149 Error 46 Total 67
a. R Squared = .255 (Adjusted R Squared = -.069)
b. Computed using alpha = .05
Table 27 is as follows: Though, the results of the one-way ANOVA show that the
differences between scores by survey administration were statistically significant, the results of
the two-way ANOVA (Table 27) show no statistically significant interaction between survey
administration and any of the categorical variables. There was no statistically significant
interaction between survey administration and years of teaching experience, F(4, 46)
= .897, p = .474. There was no statistically significant interaction between survey administration
and gender, F(2, 46) = .013, p = .987. There was no statistically significant interaction between
survey administration and subject area taught, F(4, 46) = .248, p = .909. There was no
statistically significant interaction between survey administration and DPLC Site
Membership, F(2, 46) = 1.99, p = .149.
A two-way ANOVA was conducted to determine if Faculty Trust in Colleagues changed
over the course of the study at Central Florida Middle School (CFMS). A two-way ANOVA
was conducted to test the interaction effects between survey administration and each of the
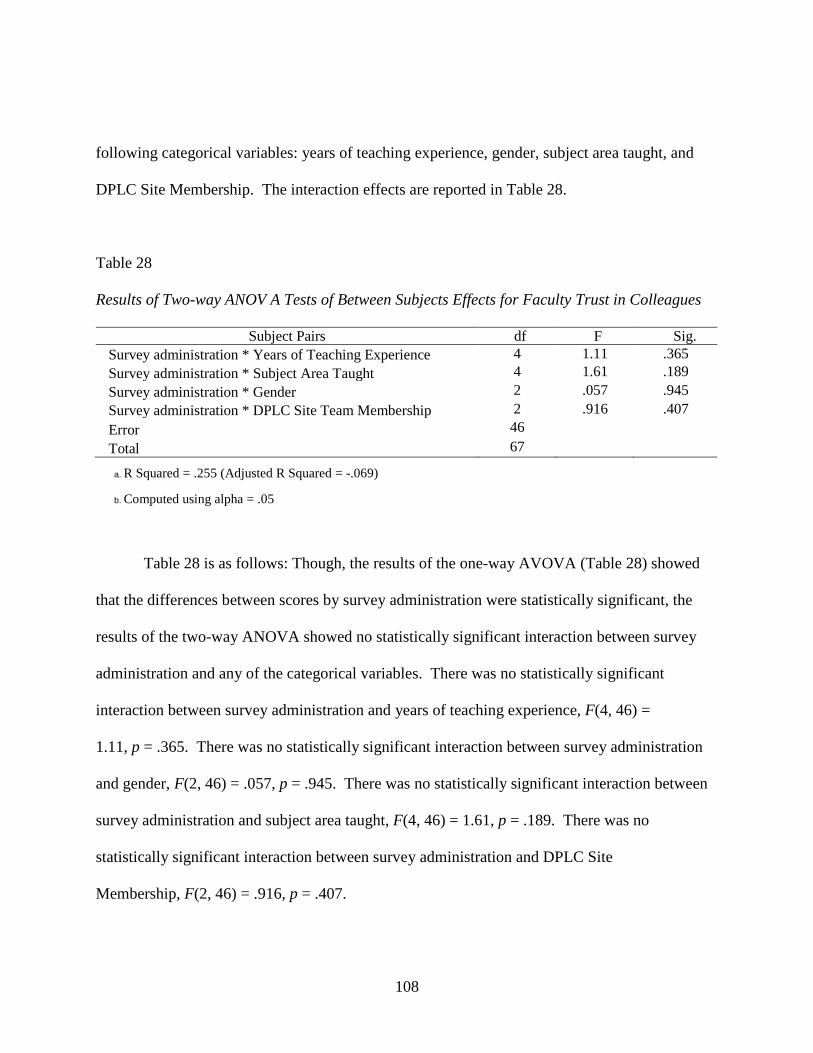
108
following categorical variables: years of teaching experience, gender, subject area taught, and
DPLC Site Membership. The interaction effects are reported in Table 28.
Table 28 Results of Two-way ANOV A Tests of Between Subjects Effects for Faculty Trust in Colleagues
Subject Pairs df F Sig. Survey administration * Years of Teaching Experience 4 1.11 .365 Survey administration * Subject Area Taught 4 1.61 .189 Survey administration * Gender 2 .057 .945 Survey administration * DPLC Site Team Membership 2 .916 .407 Error 46 Total 67
a. R Squared = .255 (Adjusted R Squared = -.069)
b. Computed using alpha = .05
Table 28 is as follows: Though, the results of the one-way AVOVA (Table 28) showed
that the differences between scores by survey administration were statistically significant, the
results of the two-way ANOVA showed no statistically significant interaction between survey
administration and any of the categorical variables. There was no statistically significant
interaction between survey administration and years of teaching experience, F(4, 46) =
1.11, p = .365. There was no statistically significant interaction between survey administration
and gender, F(2, 46) = .057, p = .945. There was no statistically significant interaction between
survey administration and subject area taught, F(4, 46) = 1.61, p = .189. There was no
statistically significant interaction between survey administration and DPLC Site
Membership, F(2, 46) = .916, p = .407.

109
Additionally, Tukey post hoc analysis revealed that through multiple comparisons of
subject area taught, statistical significance was found. Table 29 presents the post hoc results.
Table 29 Statistical Significance of Faculty Trust in Colleagues by Subject Area Taught (Tukey Post Hoc)
(I) Survey Administration
(J) Survey Administration
Mean Difference (I-
J)
Sig.
95% Confidence Interval Lower Bound Upper Bound
ELA/Reading Math/Science Other
.4323*
.5625* .015 .001
.0726
.2028 .7920 .9222
Math/Science ELA/Reading Other
-.4323* .1302
.015
.623 -.7920 -.2080
-.0726 .4684
Other ELA/Reading Math/Science
-.5625* -.1302
.001
.623 -.9222 -.4684
-.2028 .2080
Based on observed means. The error term is Mean Square (Error) = .234. * The mean difference is significant at the .05 level.
Table 29 is as follows: The mean difference between ELA/Reading and Math/Science
(.926, 95% CI [0.594, 1.26]) was statistically significant (p = .015), as well as the difference
between ELA/Reading and all other subject areas (Social Studies, Electives, and Exceptional
Student Education) (.961, 95% CI [1.30, .621], p = .001). However, the difference between
Math/Science and other subject areas (Social Studies, Electives, and Exceptional Student
Education) was not statistically significant (p = .623).
A two-way ANOVA was conducted to determine if Faculty Trust in Clients changed over
the course of the study at Central Florida Middle School (CFMS). A two-way ANOVA was
conducted to test the interaction effects between survey administration and each of the following

110
categorical variables: years of teaching experience, gender, subject area taught, and DPLC Site
Membership. The interaction effects are reported in Table 30.
Table 30 Results of Two-way ANOVA Tests of Between Subjects Effects for Faculty Trust in Clients
Subject Pairs df F Sig. Survey administration * Years of Teaching Experience 4 .256 .904 Survey administration * Subject Area Taught 4 .349 .843 Survey administration * Gender 2 3.12 .054 Survey administration * DPLC Site Team Membership 2 .029 .972 Error 46 Total 67
a. R Squared = .255 (Adjusted R Squared = -.069)
b. Computed using alpha = .05
Table 30 is as follows: Though, in all cases the means of each categorical variable
increased by survey administration three, the results showed no statistically significant
interaction between survey administration and any of the categorical variables. As shown in
Table 30, there was no statistically significant interaction between survey administration and
years of teaching experience, F(4, 46) = .256, p = .904. There was no statistically significant
interaction between survey administration and gender, F(2, 46) = 3.12, p = .054. There was no
statistically significant interaction between survey administration and subject area taught, F(4,
46) = .349, p = .843. There was no statistically significant interaction between survey
administration and DPLC Site Membership, F(2, 46) = .025, p = .972.
111
Research Question 3
In what ways and to what extent do teachers perceive that DPLC is accomplishing its goals of improving literacy? There were different assumptions that needed to be considered. Descriptive and
statistical analyses have been conducted to understand more clearly the extent of teachers’
perceptions of DPLC in accomplishing its goals of improving student literacy.
Assumptions
At the initial stage of data analysis, it is vital to explore the assumptions of the statistical
test being utilized. The chi-square test requires five assumptions in order to qualify as the
appropriate statistical test. The first four assumptions relate to the study design: (a) there is one
dependent variable that has three or more independent categories; (b) the independent variable
has two or more independent groups; (c) there is independence of observations; (d) the data in
the cells are frequencies, or counts of cases. All four assumptions were met with the use of this
study design.
The fifth assumption relates to how the data fit into their particular statistical tests and the
SPSS statistical results. This assumption involves adequate sample size. No cells in a chi-square
test should have expected frequencies less than one (Laerd Statistics, 2018). The data for this
study design met these criteria. Additionally, recommended adequacy of sample size involves
a minimum sample size of no more than 20% of the cells of table having frequencies of five or
less (Laerd Statistics, 2018). In order to meet these criteria, the categories of the Likert scale
items were collapsed for data analysis. The results of the analysis are presented in Table 31.
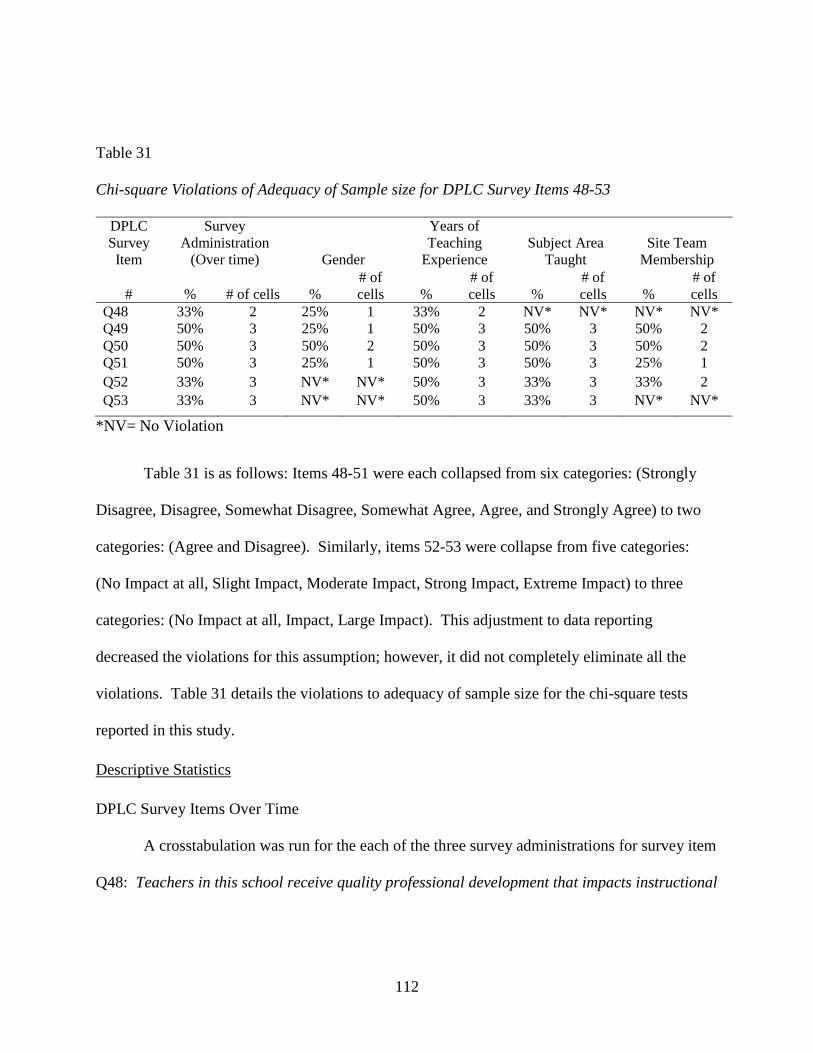
112
Table 31 Chi-square Violations of Adequacy of Sample size for DPLC Survey Items 48-53
DPLC Survey Item
Survey Administration
(Over time)
Gender
Years of Teaching
Experience
Subject Area
Taught
Site Team
Membership
#
%
# of cells
% # of cells
%
# of cells
%
# of cells
%
# of cells
Q48 33% 2 25% 1 33% 2 NV* NV* NV* NV* Q49 50% 3 25% 1 50% 3 50% 3 50% 2 Q50 50% 3 50% 2 50% 3 50% 3 50% 2 Q51 50% 3 25% 1 50% 3 50% 3 25% 1 Q52 33% 3 NV* NV* 50% 3 33% 3 33% 2 Q53 33% 3 NV* NV* 50% 3 33% 3 NV* NV*
*NV= No Violation
Table 31 is as follows: Items 48-51 were each collapsed from six categories: (Strongly
Disagree, Disagree, Somewhat Disagree, Somewhat Agree, Agree, and Strongly Agree) to two
categories: (Agree and Disagree). Similarly, items 52-53 were collapse from five categories:
(No Impact at all, Slight Impact, Moderate Impact, Strong Impact, Extreme Impact) to three
categories: (No Impact at all, Impact, Large Impact). This adjustment to data reporting
decreased the violations for this assumption; however, it did not completely eliminate all the
violations. Table 31 details the violations to adequacy of sample size for the chi-square tests
reported in this study.
Descriptive Statistics
DPLC Survey Items Over Time
A crosstabulation was run for the each of the three survey administrations for survey item
Q48: Teachers in this school receive quality professional development that impacts instructional
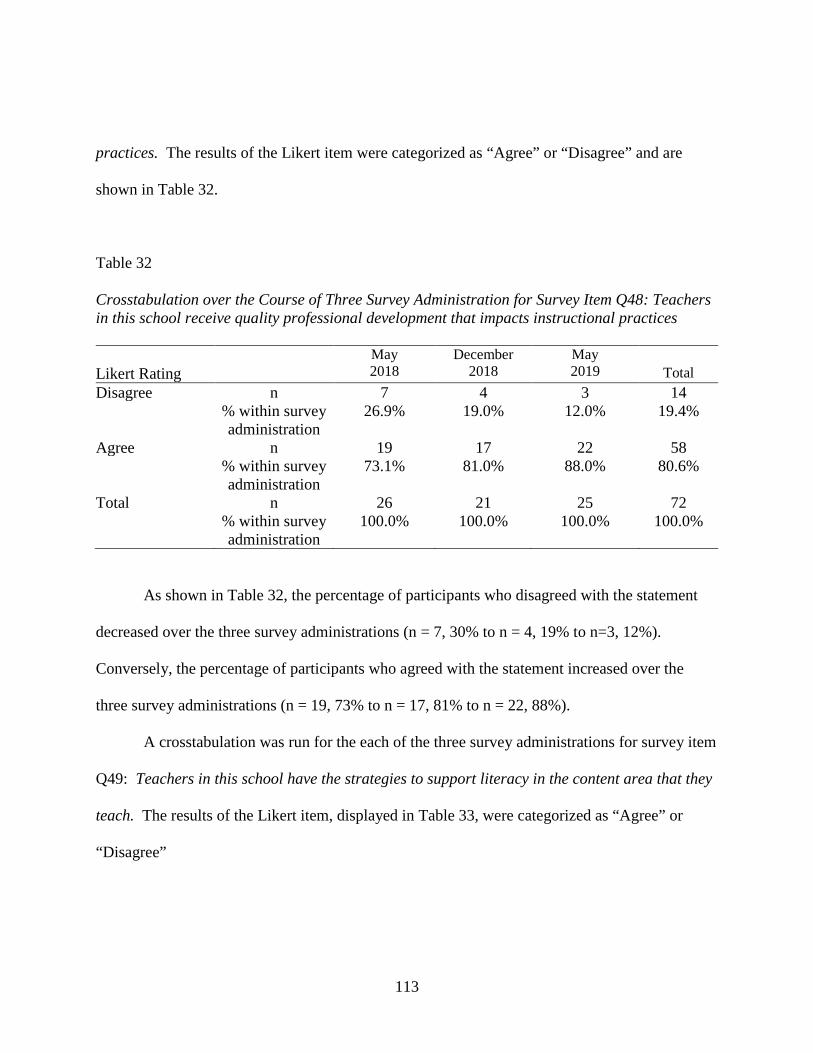
113
practices. The results of the Likert item were categorized as “Agree” or “Disagree” and are
shown in Table 32.
Table 32 Crosstabulation over the Course of Three Survey Administration for Survey Item Q48: Teachers in this school receive quality professional development that impacts instructional practices Likert Rating
May 2018
December 2018
May 2019
Total
Disagree n 7 4 3 14 % within survey
administration 26.9% 19.0% 12.0% 19.4%
Agree n 19 17 22 58 % within survey
administration 73.1% 81.0% 88.0% 80.6%
Total n 26 21 25 72 % within survey
administration 100.0% 100.0% 100.0% 100.0%
As shown in Table 32, the percentage of participants who disagreed with the statement
decreased over the three survey administrations (n = 7, 30% to n = 4, 19% to n=3, 12%).
Conversely, the percentage of participants who agreed with the statement increased over the
three survey administrations (n = 19, 73% to n = 17, 81% to n = 22, 88%).
A crosstabulation was run for the each of the three survey administrations for survey item
Q49: Teachers in this school have the strategies to support literacy in the content area that they
teach. The results of the Likert item, displayed in Table 33, were categorized as “Agree” or
“Disagree”
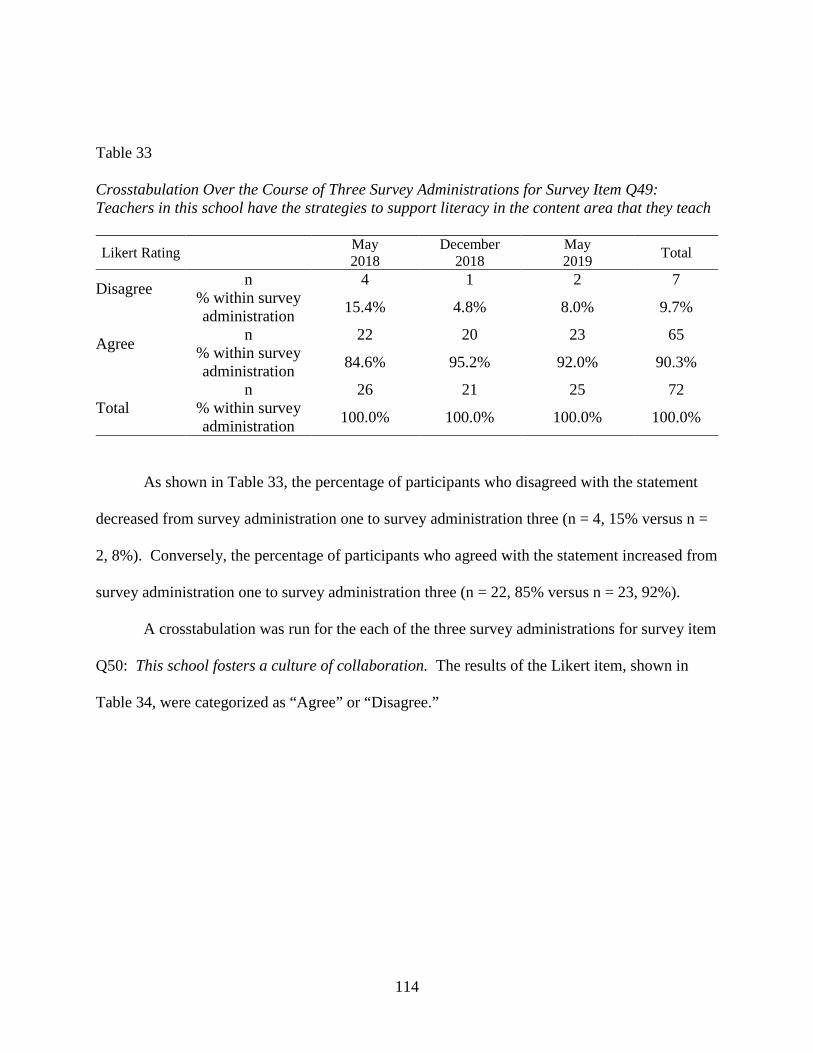
114
Table 33 Crosstabulation Over the Course of Three Survey Administrations for Survey Item Q49: Teachers in this school have the strategies to support literacy in the content area that they teach Likert Rating May
2018 December
2018 May 2019 Total
Disagree
n 4 1 2 7 % within survey administration 15.4% 4.8% 8.0% 9.7%
Agree
n 22 20 23 65 % within survey administration 84.6% 95.2% 92.0% 90.3%
Total n 26 21 25 72
% within survey administration 100.0% 100.0% 100.0% 100.0%
As shown in Table 33, the percentage of participants who disagreed with the statement
decreased from survey administration one to survey administration three (n = 4, 15% versus n =
2, 8%). Conversely, the percentage of participants who agreed with the statement increased from
survey administration one to survey administration three (n = 22, 85% versus n = 23, 92%).
A crosstabulation was run for the each of the three survey administrations for survey item
Q50: This school fosters a culture of collaboration. The results of the Likert item, shown in
Table 34, were categorized as “Agree” or “Disagree.”

115
Table 34 Crosstabulation Over the Course of Three survey Administrations for Survey Item Q50: This school fosters a culture of collaboration Likert Rating May
2018 December
2018 May 2019 Total
Disagree
n 3 3 1 7 % within survey administration 11.5% 14.3% 4.0% 9.7%
Agree
n 23 18 24 65 % within survey administration 88.5% 85.7% 96.0% 90.3%
Total n 26 21 25 72
% within survey administration 100.0% 100.0% 100.0% 100.0%
Table 34 is as follows: The percentage of participants who disagreed with the statement
decreased from survey administration one to survey administration three (n = 3, 12% versus n =
1, 4%). Conversely, the percentage of participants who agreed with the statement increased from
survey administration one to survey administration three (n = 23, 89% versus n = 24, 96%).
A crosstabulation was run for the each of the three survey administrations for survey item
Q51: Teachers in this school are given opportunities to be instructional leaders for their peers.
The results of the Likert item, shown in Table 35, were categorized as “Agree” or “Disagree.”

116
Table 35 Crosstabulation Over the Course of Three Survey Administrations for Survey Item Q51: Teachers in this school are given opportunities to be instructional leaders for their peers Likert Rating May
2018 December
2018 May 2019 Total
Disagree
n 2 5 3 10 % within survey administration 7.7% 23.8% 12.0% 13.9%
Agree
n 24 16 22 62 % within survey administration 92.3% 76.2% 88.0% 86.1%
Total n 26 21 25 72
% within survey administration 100.0% 100.0% 100.0% 100.0%
As shown in Table 35, the percentage of participants who disagreed with the statement
slightly increased from survey administration one to survey administration three (n = 2, 8%
versus n = 3, 12%). Conversely, the percentage of participants who agreed with the statement
slightly decreased from survey administration one to survey administration three (n = 24, 92%
versus n = 22, 88%).
A crosstabulation was run for the each of the three survey administrations for survey item
Q52: To what extent has content from the DPLC sessions impacted your thinking about
instruction? The results of the Likert item were categorized as “No Impact,” “Impact,” and
“Large Impact.” The results of the analysis are presented in Table 36.
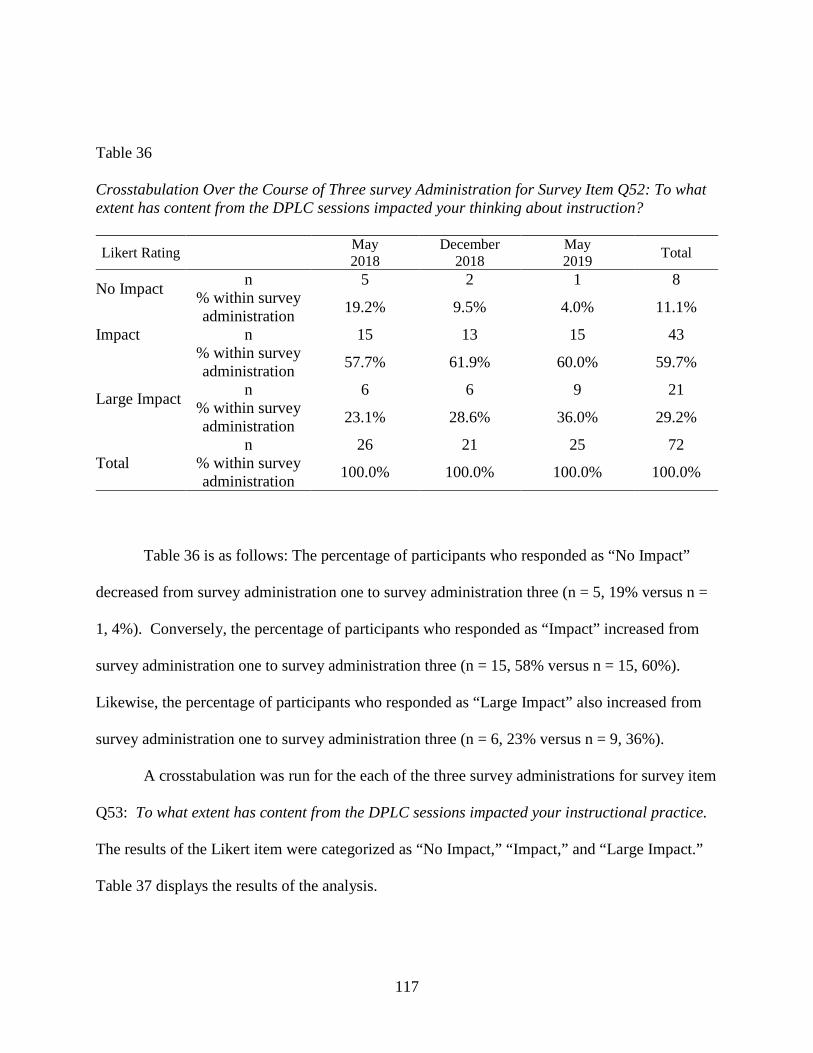
117
Table 36 Crosstabulation Over the Course of Three survey Administration for Survey Item Q52: To what extent has content from the DPLC sessions impacted your thinking about instruction? Likert Rating May
2018 December
2018 May 2019 Total
No Impact
n 5 2 1 8 % within survey administration 19.2% 9.5% 4.0% 11.1%
Impact
n 15 13 15 43 % within survey administration 57.7% 61.9% 60.0% 59.7%
Large Impact
n 6 6 9 21 % within survey administration 23.1% 28.6% 36.0% 29.2%
Total n 26 21 25 72
% within survey administration 100.0% 100.0% 100.0% 100.0%
Table 36 is as follows: The percentage of participants who responded as “No Impact”
decreased from survey administration one to survey administration three (n = 5, 19% versus n =
1, 4%). Conversely, the percentage of participants who responded as “Impact” increased from
survey administration one to survey administration three (n = 15, 58% versus n = 15, 60%).
Likewise, the percentage of participants who responded as “Large Impact” also increased from
survey administration one to survey administration three (n = 6, 23% versus n = 9, 36%).
A crosstabulation was run for the each of the three survey administrations for survey item
Q53: To what extent has content from the DPLC sessions impacted your instructional practice.
The results of the Likert item were categorized as “No Impact,” “Impact,” and “Large Impact.”
Table 37 displays the results of the analysis.

118
Table 37 Crosstabulation Over the Course of Three survey Administrations for Survey Item Q53: To what extent has content from the DPLC sessions impacted your instructional practice? Likert Rating May
2018 December
2018 May 2019 Total
No Impact
n 6 2 3 11 % within survey administration 23.1% 9.5% 12.0% 15.3%
Impact
n 13 13 13 39 % within survey administration 50.0% 61.9% 52.0% 54.2%
Large Impact
n 7 6 9 22 % within survey administration 26.9% 28.6% 36.0% 30.6%
Total n 26 21 25 72
% within survey administration 100.0% 100.0% 100.0% 100.0%
As shown in Table 37, the percentage of participants who responded as “No Impact”
decreased from survey administration one to survey administration three (n = 6, 23% versus n =
3, 12%). Conversely, the percentage of participants who responded as “Impact” increased from
survey administration one to survey administration three (n = 13, 50% versus n = 13, 52%).
Likewise, the percentage of participants who responded as “Large Impact” also increased from
survey administration one to survey administration three (n = 7, 27% versus n = 9, 36%).
DPLC Survey Items by Years of Experience
A crosstabulation was run with years of teaching experience as a moderator variable for
survey item Q48: Teachers in this school receive quality professional development that impacts
instructional practices. The results of the Likert item were categorized as “Agree” or
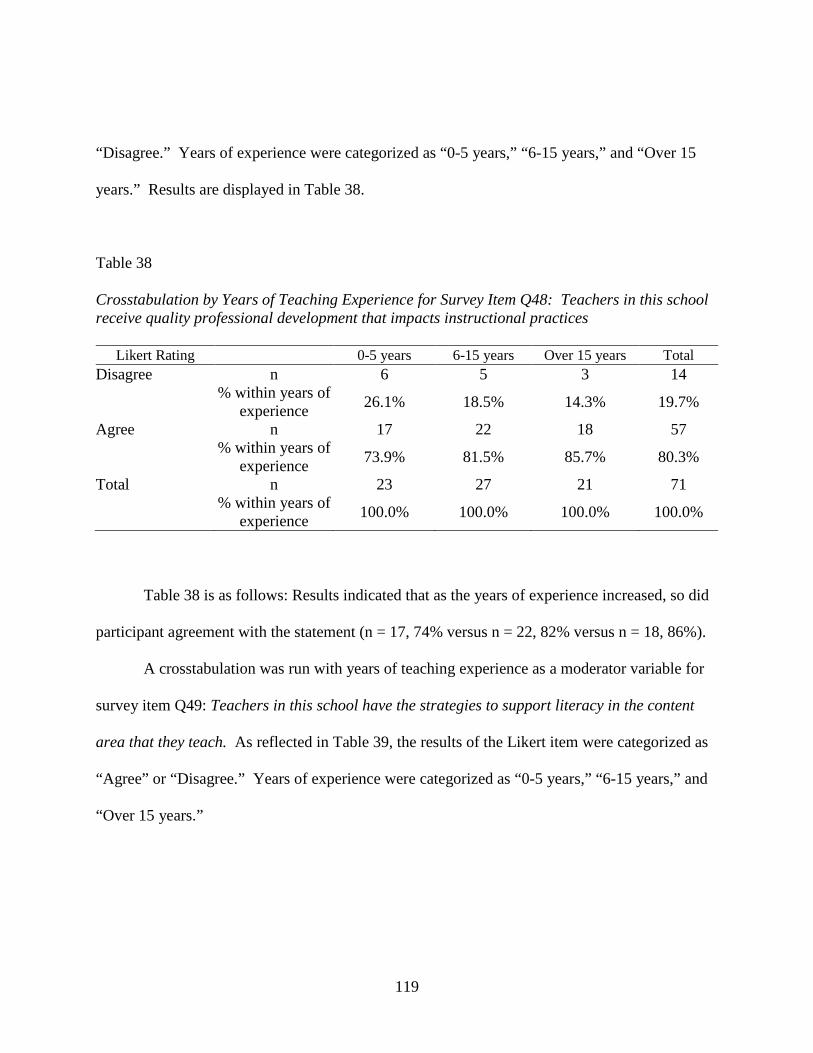
119
“Disagree.” Years of experience were categorized as “0-5 years,” “6-15 years,” and “Over 15
years.” Results are displayed in Table 38.
Table 38 Crosstabulation by Years of Teaching Experience for Survey Item Q48: Teachers in this school receive quality professional development that impacts instructional practices
Likert Rating 0-5 years 6-15 years Over 15 years Total Disagree n 6 5 3 14
% within years of experience 26.1% 18.5% 14.3% 19.7%
Agree n 17 22 18 57
% within years of experience 73.9% 81.5% 85.7% 80.3%
Total n 23 27 21 71
% within years of experience 100.0% 100.0% 100.0% 100.0%
Table 38 is as follows: Results indicated that as the years of experience increased, so did
participant agreement with the statement (n = 17, 74% versus n = 22, 82% versus n = 18, 86%).
A crosstabulation was run with years of teaching experience as a moderator variable for
survey item Q49: Teachers in this school have the strategies to support literacy in the content
area that they teach. As reflected in Table 39, the results of the Likert item were categorized as
“Agree” or “Disagree.” Years of experience were categorized as “0-5 years,” “6-15 years,” and
“Over 15 years.”

120
Table 39 Crosstabulation by Years of Teaching Experience for Survey Item Q49: Teachers in this school have the strategies to support literacy in the content area that they teach
Likert Rating 0-5 years 6-15 years Over 15 years Total Disagree n 4 2 1 7
% within years of experience 17.4% 7.4% 4.8% 9.9%
Agree n 19 25 20 64
% within years of experience 82.6% 92.6% 95.2% 90.1%
Total n 23 27 21 71
% within years of experience 100.0% 100.0% 100.0% 100.0%
Table 39 is as follows: Results show that as the years of experience increased, so did
participant agreement with the statement (n = 19, 83% versus n = 25, 93% versus n = 20, 95%).
A crosstabulation was run with years of teaching experience as a moderator variable for
survey item Q50: This school fosters a culture of collaboration. The results of the Likert item
were categorized as “Agree” or “Disagree.” Years of experience were categorized as “0-5
years,” “6-15 year,” and “Over 15 years.” Results are shown in Table 40.

121
Table 40 Crosstabulation by Years of Teaching Experience for Survey Item Q50: This school fosters a culture of collaboration
Likert Rating 0-5 years 6-15 years Over 15 years Total Disagree n 4 1 1 6
% within years of experience 17.4% 3.7% 4.8% 8.5%
Agree n 19 26 20 65
% within years of experience 82.6% 96.3% 95.2% 91.5%
Total n 23 27 21 71
% within years of experience 100.0% 100.0% 100.0% 100.0%
Table 40 is as follows: Results indicated that teachers with 0-5 years of experience
reported less agreement to the statement (n = 83%) as compared to teachers with 6-15 (n = 26,
96%) and over 15 years of experience (n = 20, 95%).
A crosstabulation was run with years of teaching experience as a moderator variable for
survey item Q51: Teachers in this school are given opportunities to be instructional leaders for
their peers. The results of the Likert item were categorized as “Agree” or “Disagree.” Years of
experience were categorized as “0-5 years,” “6-15 year,” and “Over 15 years.” Results are
displayed in Table 41.
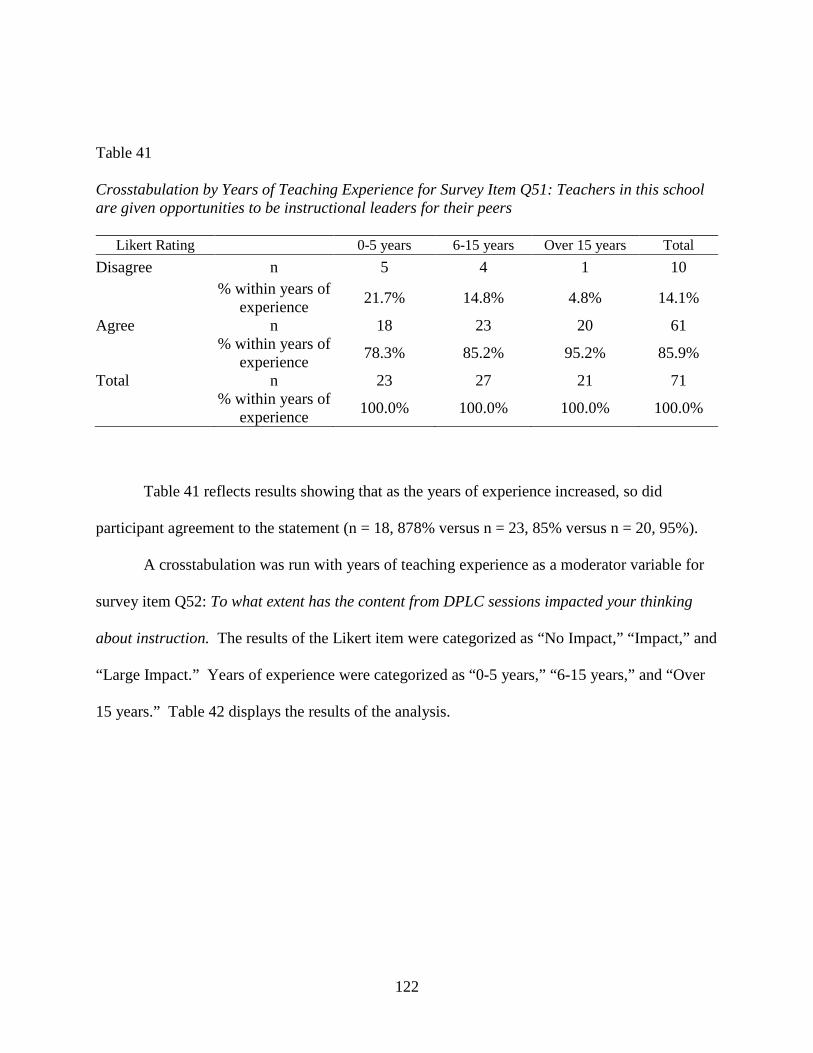
122
Table 41 Crosstabulation by Years of Teaching Experience for Survey Item Q51: Teachers in this school are given opportunities to be instructional leaders for their peers
Likert Rating 0-5 years 6-15 years Over 15 years Total Disagree n 5 4 1 10
% within years of experience 21.7% 14.8% 4.8% 14.1%
Agree n 18 23 20 61
% within years of experience 78.3% 85.2% 95.2% 85.9%
Total n 23 27 21 71
% within years of experience 100.0% 100.0% 100.0% 100.0%
Table 41 reflects results showing that as the years of experience increased, so did
participant agreement to the statement (n = 18, 878% versus n = 23, 85% versus n = 20, 95%).
A crosstabulation was run with years of teaching experience as a moderator variable for
survey item Q52: To what extent has the content from DPLC sessions impacted your thinking
about instruction. The results of the Likert item were categorized as “No Impact,” “Impact,” and
“Large Impact.” Years of experience were categorized as “0-5 years,” “6-15 years,” and “Over
15 years.” Table 42 displays the results of the analysis.
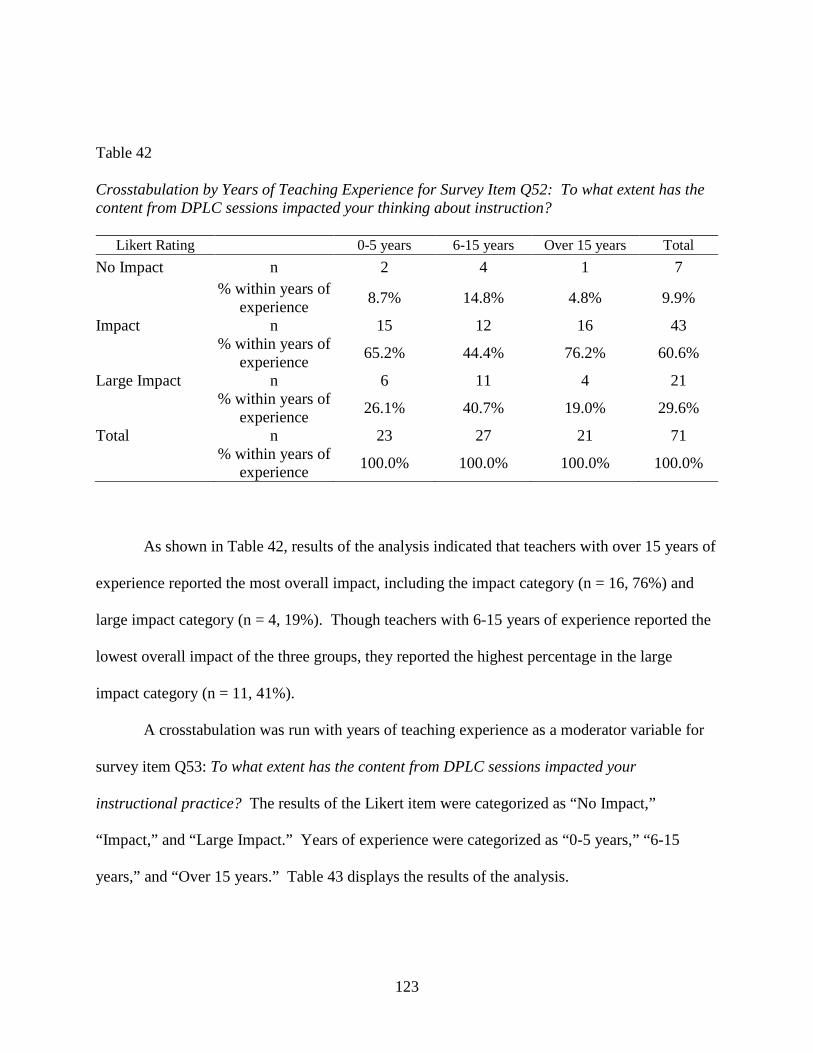
123
Table 42 Crosstabulation by Years of Teaching Experience for Survey Item Q52: To what extent has the content from DPLC sessions impacted your thinking about instruction?
Likert Rating 0-5 years 6-15 years Over 15 years Total No Impact n 2 4 1 7
% within years of experience 8.7% 14.8% 4.8% 9.9%
Impact n 15 12 16 43
% within years of experience 65.2% 44.4% 76.2% 60.6%
Large Impact n 6 11 4 21 % within years of
experience 26.1% 40.7% 19.0% 29.6%
Total n 23 27 21 71
% within years of experience 100.0% 100.0% 100.0% 100.0%
As shown in Table 42, results of the analysis indicated that teachers with over 15 years of
experience reported the most overall impact, including the impact category (n = 16, 76%) and
large impact category (n = 4, 19%). Though teachers with 6-15 years of experience reported the
lowest overall impact of the three groups, they reported the highest percentage in the large
impact category (n = 11, 41%).
A crosstabulation was run with years of teaching experience as a moderator variable for
survey item Q53: To what extent has the content from DPLC sessions impacted your
instructional practice? The results of the Likert item were categorized as “No Impact,”
“Impact,” and “Large Impact.” Years of experience were categorized as “0-5 years,” “6-15
years,” and “Over 15 years.” Table 43 displays the results of the analysis.

124
Table 43 Crosstabulation by Years of Teaching Experience for Survey Item Q53: To what extent has the content from DPLC sessions impacted your instructional practice?
Likert Rating 0-5 years 6-15 years Over 15 years Total No Impact n 3 5 2 10
% within years of experience 13.0% 18.5% 9.5% 14.1%
Impact n 13 12 14 39
% within years of experience 56.5% 44.4% 66.7% 54.9%
Large Impact n 7 10 5 22 % within years of
experience 30.4% 37.0% 23.8% 31.0%
Total n 23 27 21 71
% within years of experience 100.0% 100.0% 100.0% 100.0%
Results of the analysis, shown in Table 43, indicated that teachers with over 15 years of
experience reported the most overall impact, including the impact category (n = 14, 67%) and
large impact category (n = 5, 24%). Though teachers with 6-15 years of experience reported the
lowest overall impact of the three groups, they reported the highest percentage in the large
impact category (n = 10, 37%).
DPLC Survey Items by Gender
A crosstabulation was run with gender as the moderator variable for survey item Q48:
Teachers in this school receive quality professional development that impacts instructional
practices. The results of the Likert item were categorized as “Agree” or “Disagree.” Results are
shown in Table 44.
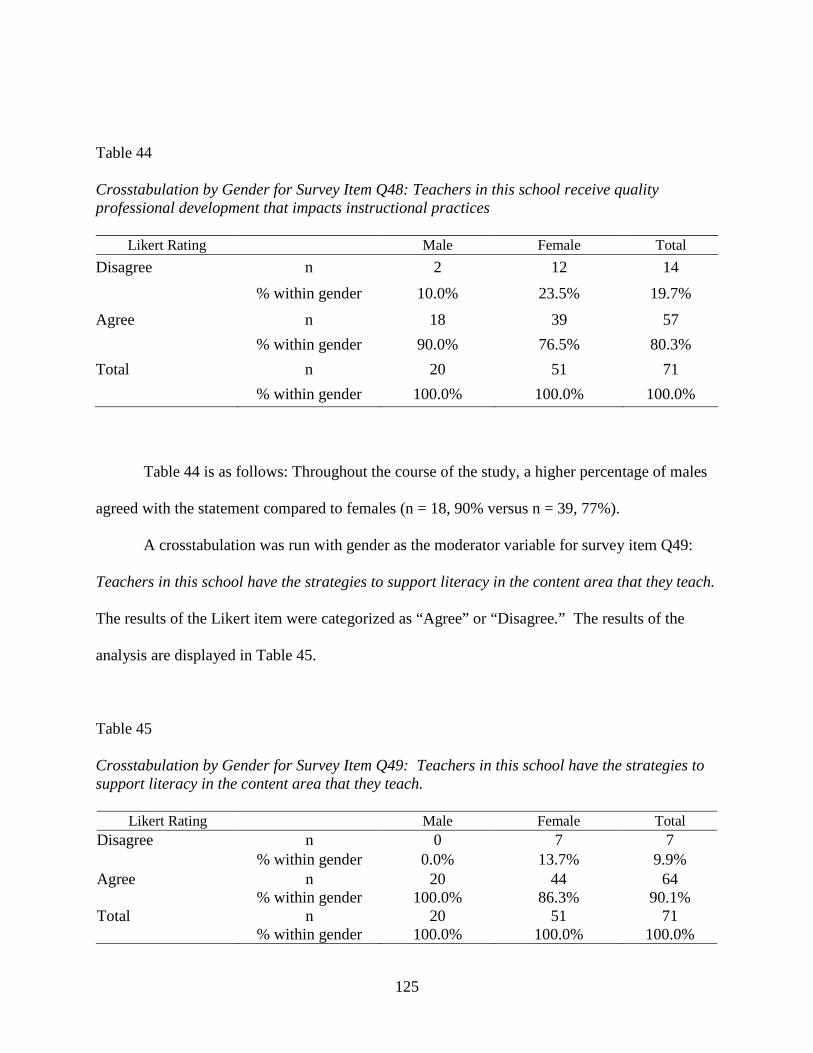
125
Table 44 Crosstabulation by Gender for Survey Item Q48: Teachers in this school receive quality professional development that impacts instructional practices
Likert Rating Male Female Total Disagree n 2 12 14 % within gender 10.0% 23.5% 19.7% Agree n 18 39 57 % within gender 90.0% 76.5% 80.3% Total n 20 51 71 % within gender 100.0% 100.0% 100.0% Table 44 is as follows: Throughout the course of the study, a higher percentage of males
agreed with the statement compared to females (n = 18, 90% versus n = 39, 77%).
A crosstabulation was run with gender as the moderator variable for survey item Q49:
Teachers in this school have the strategies to support literacy in the content area that they teach.
The results of the Likert item were categorized as “Agree” or “Disagree.” The results of the
analysis are displayed in Table 45.
Table 45 Crosstabulation by Gender for Survey Item Q49: Teachers in this school have the strategies to support literacy in the content area that they teach.
Likert Rating Male Female Total Disagree n 0 7 7 % within gender 0.0% 13.7% 9.9% Agree n 20 44 64 % within gender 100.0% 86.3% 90.1% Total n 20 51 71
% within gender 100.0% 100.0% 100.0%
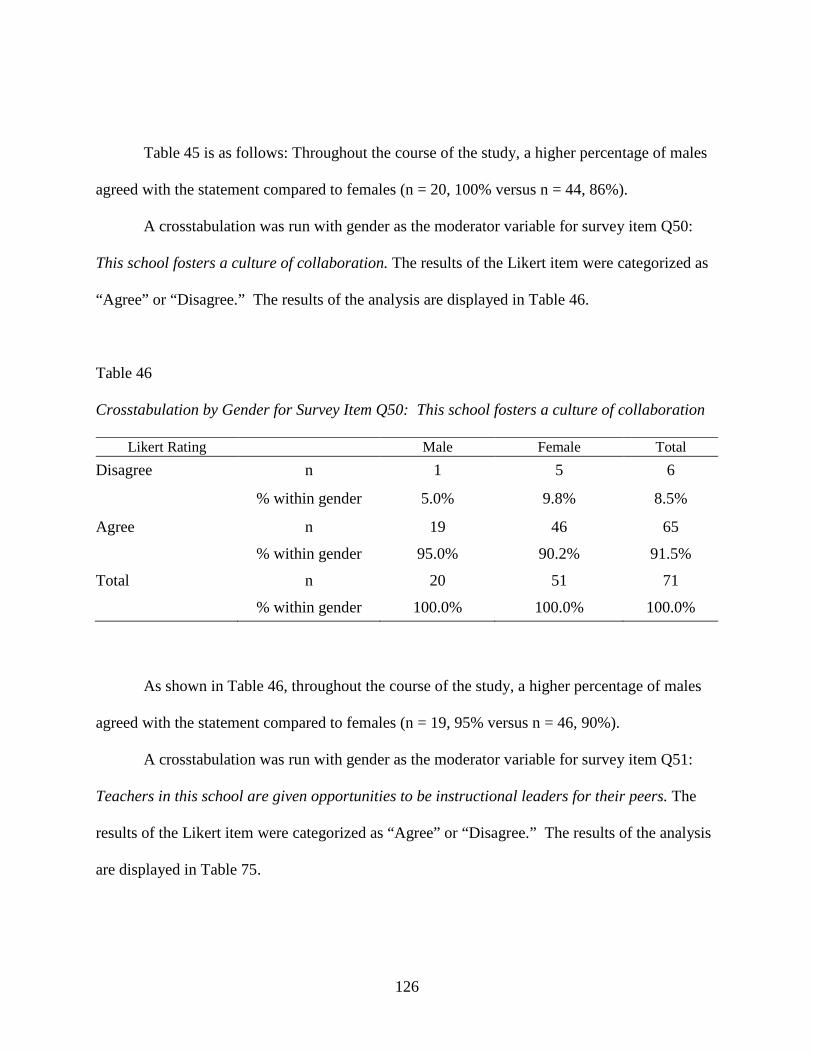
126
Table 45 is as follows: Throughout the course of the study, a higher percentage of males
agreed with the statement compared to females (n = 20, 100% versus n = 44, 86%).
A crosstabulation was run with gender as the moderator variable for survey item Q50:
This school fosters a culture of collaboration. The results of the Likert item were categorized as
“Agree” or “Disagree.” The results of the analysis are displayed in Table 46.
Table 46 Crosstabulation by Gender for Survey Item Q50: This school fosters a culture of collaboration
Likert Rating Male Female Total Disagree n 1 5 6
% within gender 5.0% 9.8% 8.5%
Agree n 19 46 65
% within gender 95.0% 90.2% 91.5%
Total n 20 51 71
% within gender 100.0% 100.0% 100.0% As shown in Table 46, throughout the course of the study, a higher percentage of males
agreed with the statement compared to females (n = 19, 95% versus n = 46, 90%).
A crosstabulation was run with gender as the moderator variable for survey item Q51:
Teachers in this school are given opportunities to be instructional leaders for their peers. The
results of the Likert item were categorized as “Agree” or “Disagree.” The results of the analysis
are displayed in Table 75.
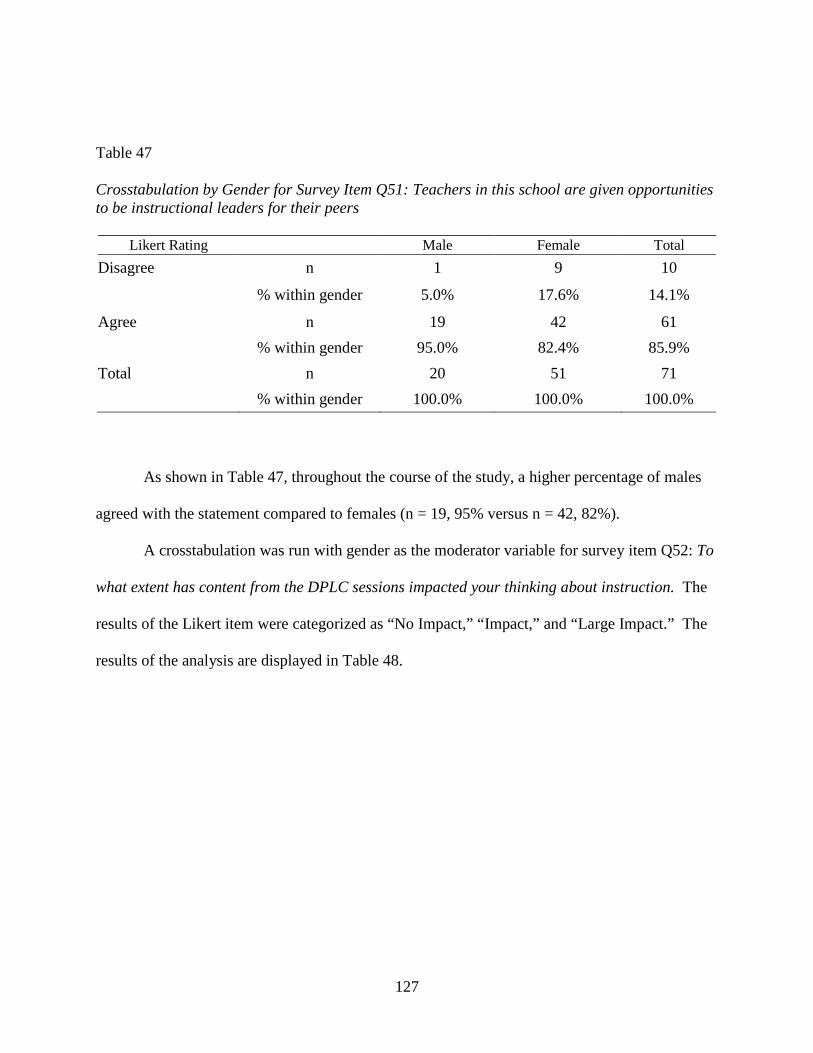
127
Table 47 Crosstabulation by Gender for Survey Item Q51: Teachers in this school are given opportunities to be instructional leaders for their peers
Likert Rating Male Female Total Disagree n 1 9 10
% within gender 5.0% 17.6% 14.1%
Agree n 19 42 61 % within gender 95.0% 82.4% 85.9% Total n 20 51 71
% within gender 100.0% 100.0% 100.0% As shown in Table 47, throughout the course of the study, a higher percentage of males
agreed with the statement compared to females (n = 19, 95% versus n = 42, 82%).
A crosstabulation was run with gender as the moderator variable for survey item Q52: To
what extent has content from the DPLC sessions impacted your thinking about instruction. The
results of the Likert item were categorized as “No Impact,” “Impact,” and “Large Impact.” The
results of the analysis are displayed in Table 48.

128
Table 48 Crosstabulation by Gender for Survey Item Q52: To what extent has content from the DPLC sessions impacted your thinking about instruction?
Likert Rating Male Female Total No Impact n 1 6 7
% within gender 5.0% 11.8% 9.9%
Impact n 12 31 43 % within gender 60.0% 60.8% 60.6% Large Impact n 7 14 21 % within gender 35.0% 27.5% 29.6%
Total n 20 51 71 % within gender 100.0% 100.0% 100.0%
As shown in Table 48, females reported slightly higher in the “Impact” category (n = 31,
61% versus n = 12, 60%). However, overall, the percentage of impact (including impact and
high impact) reported by males was higher than females. Males reported a higher percentage in
the “Large Impact” category (n = 7, 35% versus n = 14, 28%).
A crosstabulation was run with gender as the moderator variable for survey item Q53: To
what extent has content from the DPLC sessions impacted your instructional practice. The
results of the Likert item were categorized as “No Impact,” “Impact,” and “Large Impact.” The
results of the analysis are displayed in Table 49.

129
Table 49 Crosstabulation by Gender for Survey Item Q53: To what extent has content from the DPLC sessions impacted your instructional practice?
Likert Rating Male Female Total No Impact n 3 7 10
% within gender 15.0% 13.7% 14.1%
Impact n 11 28 39
% within gender 55.0% 54.9% 54.9%
Large Impact n 6 16 22
% within gender 30.0% 31.4% 31.0% Total n 20 51 71
% within gender 100.0% 100.0% 100.0%
Table 49 is as follows: Males reported the same percentage in the “Impact” category (n=
11, 55% versus n= 28, 55%). However, overall, the percentage of impact (including impact and
high impact) reported by females was higher than males. Females reported a slightly higher
percentage in the “Large Impact” category (n= 16, 31% versus n= 6, 30%).
DPLC Survey Items by Subject Area Taught
A crosstabulation was run with subject area taught as a moderator variable for survey
item Q48: Teachers in this school receive quality professional development that impacts
instructional practices. The results of the Likert item were categorized as “Agree” or
“Disagree.” Subject area taught was categorized as “ELA/Reading,” “Math/Science,” and “All
other subjects.” The results of the analysis are displayed in Table 50.
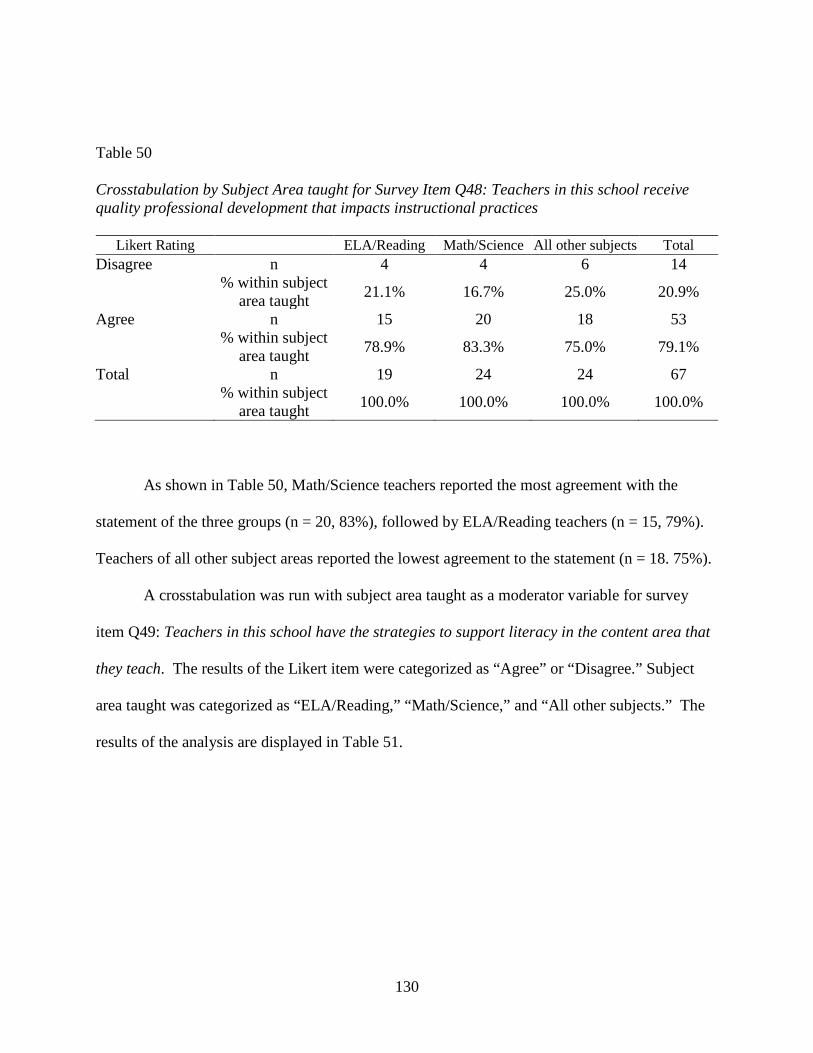
130
Table 50 Crosstabulation by Subject Area taught for Survey Item Q48: Teachers in this school receive quality professional development that impacts instructional practices
Likert Rating ELA/Reading Math/Science All other subjects Total Disagree n 4 4 6 14
% within subject area taught 21.1% 16.7% 25.0% 20.9%
Agree n 15 20 18 53
% within subject area taught 78.9% 83.3% 75.0% 79.1%
Total n 19 24 24 67
% within subject area taught 100.0% 100.0% 100.0% 100.0%
As shown in Table 50, Math/Science teachers reported the most agreement with the
statement of the three groups (n = 20, 83%), followed by ELA/Reading teachers (n = 15, 79%).
Teachers of all other subject areas reported the lowest agreement to the statement (n = 18. 75%).
A crosstabulation was run with subject area taught as a moderator variable for survey
item Q49: Teachers in this school have the strategies to support literacy in the content area that
they teach. The results of the Likert item were categorized as “Agree” or “Disagree.” Subject
area taught was categorized as “ELA/Reading,” “Math/Science,” and “All other subjects.” The
results of the analysis are displayed in Table 51.
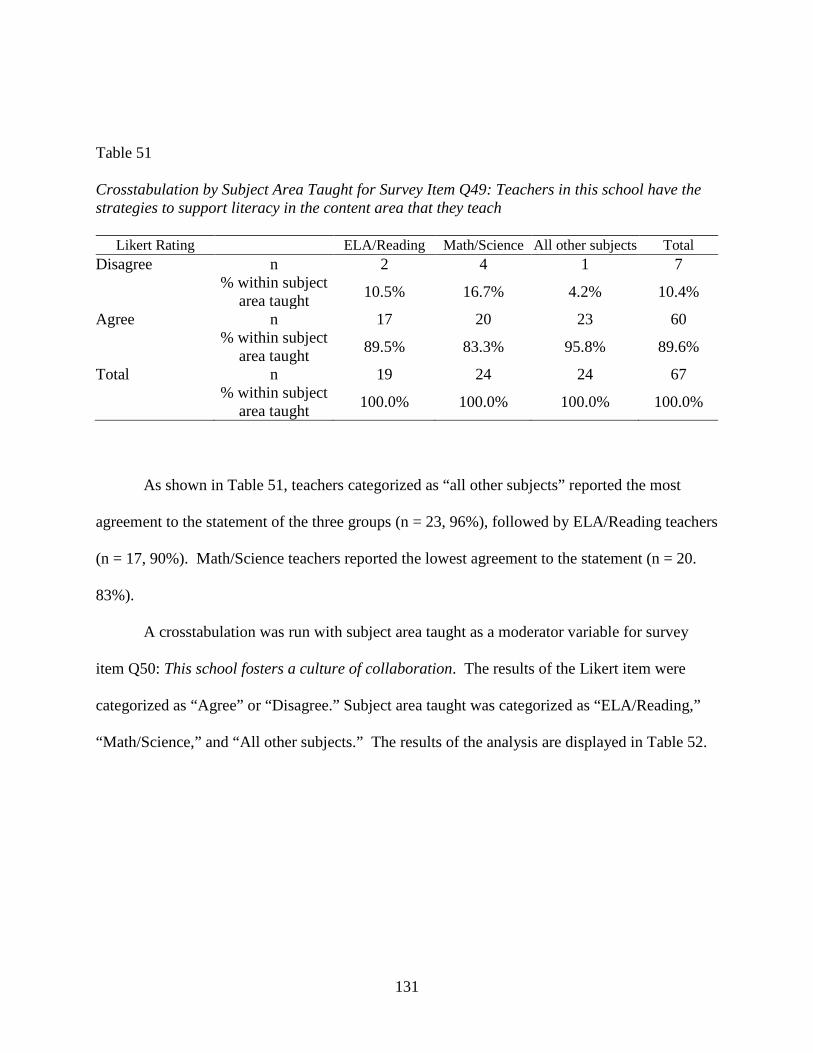
131
Table 51 Crosstabulation by Subject Area Taught for Survey Item Q49: Teachers in this school have the strategies to support literacy in the content area that they teach
Likert Rating ELA/Reading Math/Science All other subjects Total Disagree n 2 4 1 7
% within subject area taught 10.5% 16.7% 4.2% 10.4%
Agree n 17 20 23 60
% within subject area taught 89.5% 83.3% 95.8% 89.6%
Total n 19 24 24 67
% within subject area taught 100.0% 100.0% 100.0% 100.0%
As shown in Table 51, teachers categorized as “all other subjects” reported the most
agreement to the statement of the three groups (n = 23, 96%), followed by ELA/Reading teachers
(n = 17, 90%). Math/Science teachers reported the lowest agreement to the statement (n = 20.
83%).
A crosstabulation was run with subject area taught as a moderator variable for survey
item Q50: This school fosters a culture of collaboration. The results of the Likert item were
categorized as “Agree” or “Disagree.” Subject area taught was categorized as “ELA/Reading,”
“Math/Science,” and “All other subjects.” The results of the analysis are displayed in Table 52.

132
Table 52 Crosstabulation by Subject Area Taught for Survey Item Q50: This school fosters a culture of collaboration
Likert Rating ELA/Reading Math/Science All other subjects Total Disagree n 1 2 3 6
% within subject area taught 5.3% 8.3% 12.5% 9.0%
Agree n 18 22 21 61
% within subject area taught 94.7% 91.7% 87.5% 91.0%
Total n 19 24 24 67
% within subject area taught 100.0% 100.0% 100.0% 100.0%
As shown in Table 52, ELA/Reading teachers reported the most agreement to the
statement of the three groups (n = 18, 95%), followed by Math/Science teachers (n = 22, 92%).
Teachers of all other subject areas reported the lowest agreement to the statement (n = 21. 88%).
A crosstabulation was run with subject area taught as a moderator variable for survey
item Q51: Teachers in this school are given opportunities to be instructional leaders for their
peers. The results of the Likert item were categorized as “Agree” or “Disagree.” Subject area
taught was categorized as “ELA/Reading,” “Math/Science,” and “All other subjects.” The
results of the analysis are displayed in Table 53.
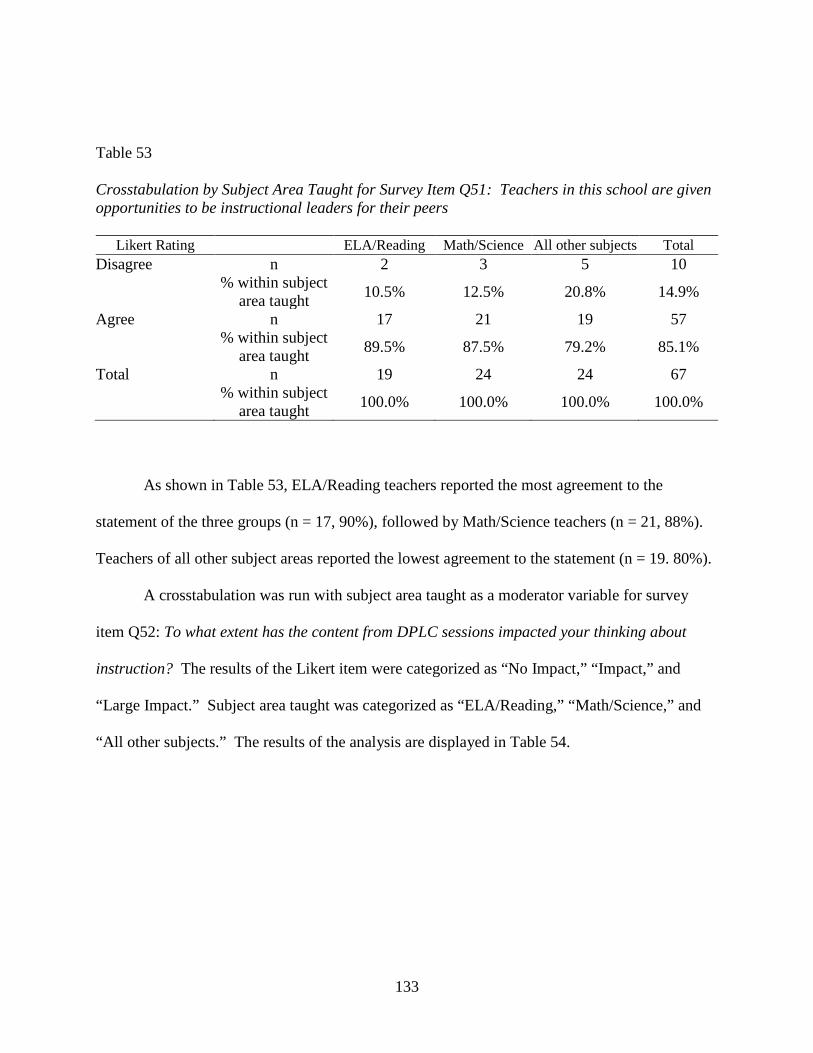
133
Table 53 Crosstabulation by Subject Area Taught for Survey Item Q51: Teachers in this school are given opportunities to be instructional leaders for their peers
Likert Rating ELA/Reading Math/Science All other subjects Total Disagree n 2 3 5 10
% within subject area taught 10.5% 12.5% 20.8% 14.9%
Agree n 17 21 19 57
% within subject area taught 89.5% 87.5% 79.2% 85.1%
Total n 19 24 24 67
% within subject area taught 100.0% 100.0% 100.0% 100.0%
As shown in Table 53, ELA/Reading teachers reported the most agreement to the
statement of the three groups (n = 17, 90%), followed by Math/Science teachers (n = 21, 88%).
Teachers of all other subject areas reported the lowest agreement to the statement (n = 19. 80%).
A crosstabulation was run with subject area taught as a moderator variable for survey
item Q52: To what extent has the content from DPLC sessions impacted your thinking about
instruction? The results of the Likert item were categorized as “No Impact,” “Impact,” and
“Large Impact.” Subject area taught was categorized as “ELA/Reading,” “Math/Science,” and
“All other subjects.” The results of the analysis are displayed in Table 54.
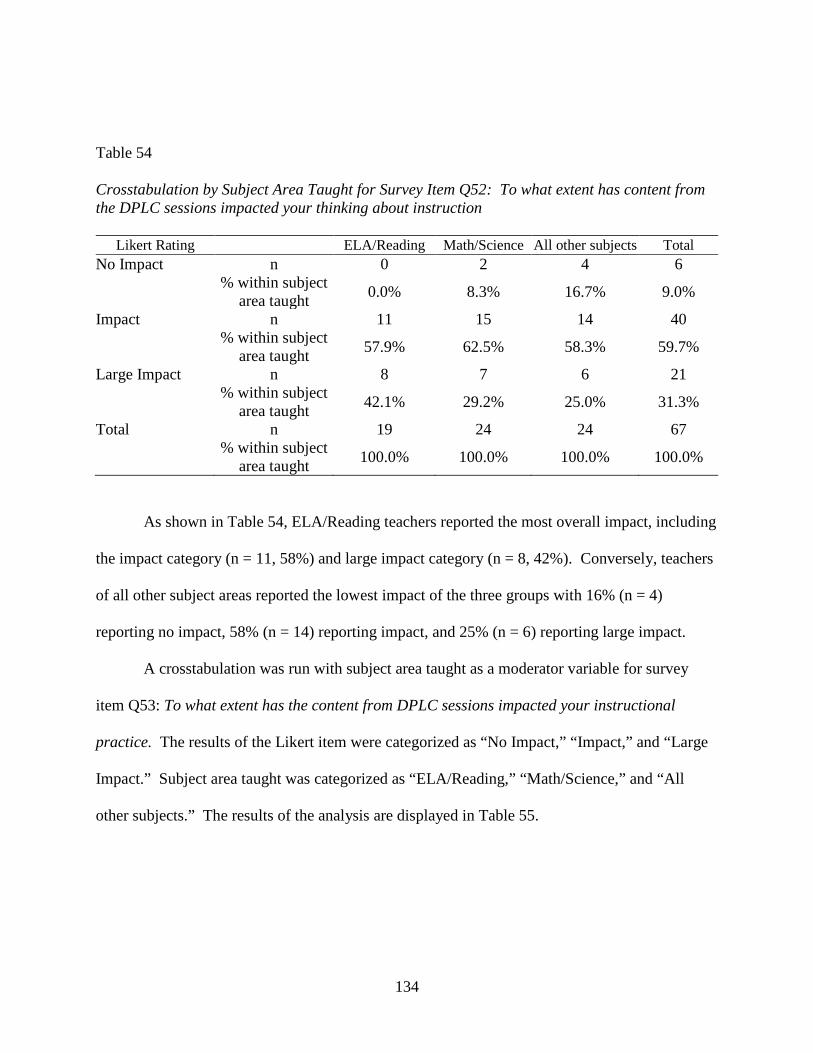
134
Table 54 Crosstabulation by Subject Area Taught for Survey Item Q52: To what extent has content from the DPLC sessions impacted your thinking about instruction
Likert Rating ELA/Reading Math/Science All other subjects Total No Impact n 0 2 4 6
% within subject area taught 0.0% 8.3% 16.7% 9.0%
Impact n 11 15 14 40
% within subject area taught 57.9% 62.5% 58.3% 59.7%
Large Impact n 8 7 6 21
% within subject area taught 42.1% 29.2% 25.0% 31.3%
Total n 19 24 24 67
% within subject area taught 100.0% 100.0% 100.0% 100.0%
As shown in Table 54, ELA/Reading teachers reported the most overall impact, including
the impact category (n = 11, 58%) and large impact category (n = 8, 42%). Conversely, teachers
of all other subject areas reported the lowest impact of the three groups with 16% (n = 4)
reporting no impact, 58% (n = 14) reporting impact, and 25% (n = 6) reporting large impact.
A crosstabulation was run with subject area taught as a moderator variable for survey
item Q53: To what extent has the content from DPLC sessions impacted your instructional
practice. The results of the Likert item were categorized as “No Impact,” “Impact,” and “Large
Impact.” Subject area taught was categorized as “ELA/Reading,” “Math/Science,” and “All
other subjects.” The results of the analysis are displayed in Table 55.
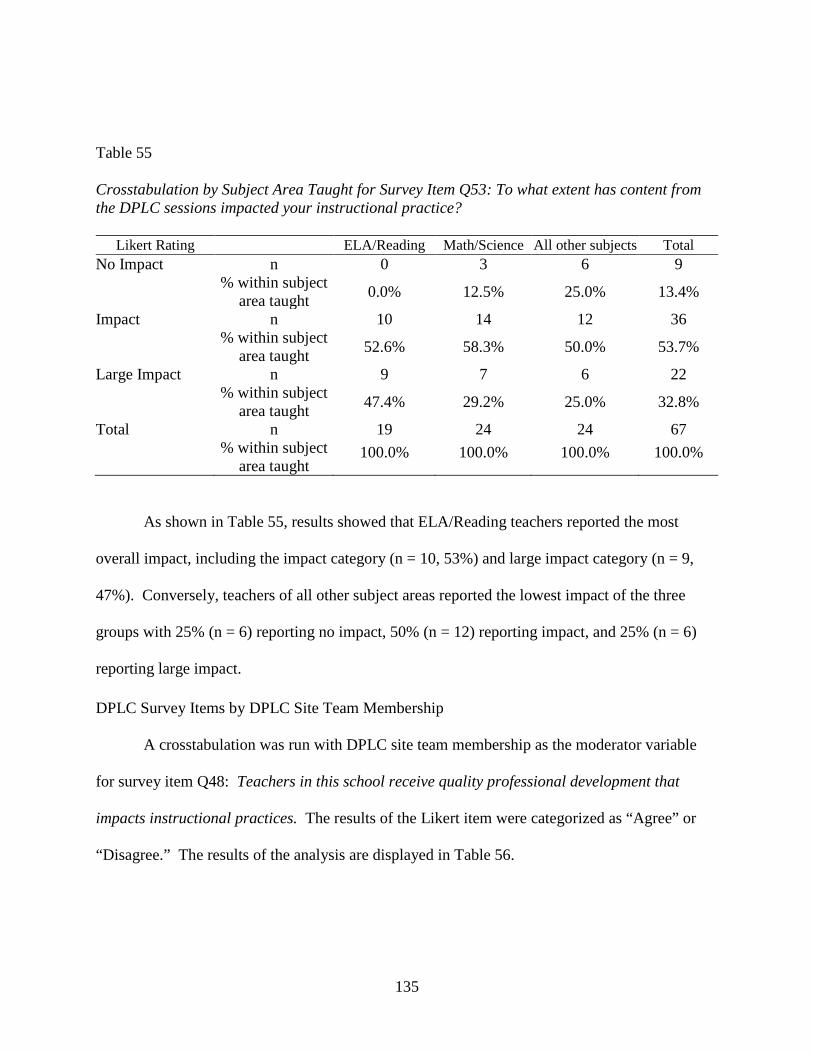
135
Table 55 Crosstabulation by Subject Area Taught for Survey Item Q53: To what extent has content from the DPLC sessions impacted your instructional practice?
Likert Rating ELA/Reading Math/Science All other subjects Total No Impact n 0 3 6 9
% within subject area taught 0.0% 12.5% 25.0% 13.4%
Impact n 10 14 12 36
% within subject area taught 52.6% 58.3% 50.0% 53.7%
Large Impact n 9 7 6 22
% within subject area taught 47.4% 29.2% 25.0% 32.8%
Total n 19 24 24 67
% within subject area taught
100.0% 100.0% 100.0% 100.0%
As shown in Table 55, results showed that ELA/Reading teachers reported the most
overall impact, including the impact category (n = 10, 53%) and large impact category (n = 9,
47%). Conversely, teachers of all other subject areas reported the lowest impact of the three
groups with 25% (n = 6) reporting no impact, 50% (n = 12) reporting impact, and 25% (n = 6)
reporting large impact.
DPLC Survey Items by DPLC Site Team Membership
A crosstabulation was run with DPLC site team membership as the moderator variable
for survey item Q48: Teachers in this school receive quality professional development that
impacts instructional practices. The results of the Likert item were categorized as “Agree” or
“Disagree.” The results of the analysis are displayed in Table 56.

136
Table 56 Crosstabulation by DPLC Site Team Membership for Survey Item Q48: Teachers in this school receive quality professional development that impacts instructional practices
Likert Rating Member Non-member Total Disagree n 6 8 14
% within DPLC site team membership 23.1% 18.2% 20.0%
Agree n 20 36 56
% within DPLC site team membership 76.9% 81.8% 80.0%
Total n 26 44 70
% within DPLC site team membership 100.0% 100.0% 100.0%
As shown in Table 56, throughout the course of the study, a higher percentage of non-
members agreed with the statement compared to DPLC site team members (n = 36, 82% versus n
= 20, 77%).
A crosstabulation was run with DPLC site team membership as the moderator variable
for survey item Q49: Teachers in this school have the strategies to support literacy in the content
area that they teach. The results of the Likert item were categorized as “Agree” or “Disagree.”
The results of the analysis are displayed in Table 57.

137
Table 57 Crosstabulation by DPLC Site Team Membership for Survey Item Q49: Teachers in this school have the strategies to support literacy in the content area that they teach
Likert Rating Member Non-member Total Disagree n 1 6 7
% within DPLC site team membership 3.8% 13.6% 10.0%
Agree n 25 38 63
% within DPLC site team membership 96.2% 86.4% 90.0%
Total n 26 44 70
% within DPLC site team membership 100.0% 100.0% 100.0%
As shown in Table 57, throughout the course of the study, a higher percentage of DPLC
site team members agreed with the statement compared to non-members (n = 25, 96% versus n =
38, 86%).
A crosstabulation was run with DPLC site team membership as the moderator variable
for survey item Q50: This school fosters a culture of collaboration. The results of the Likert
item were categorized as “Agree” or “Disagree.” The results of the analysis are displayed in
Table 58.
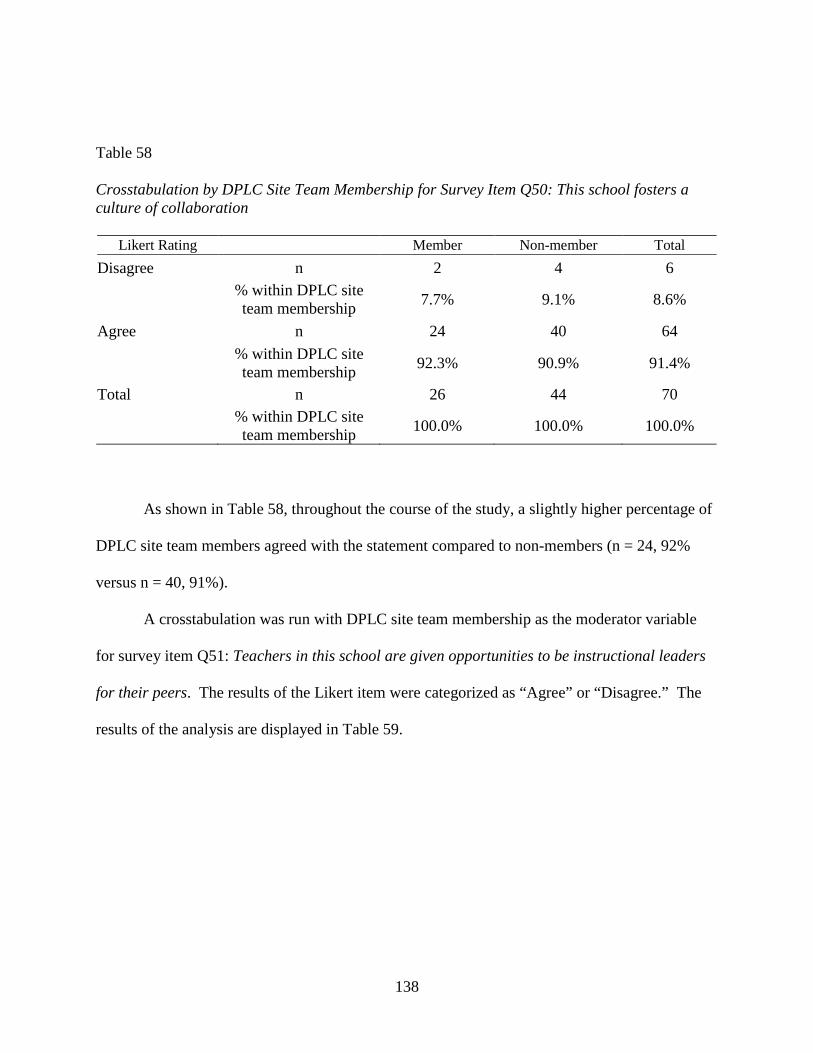
138
Table 58 Crosstabulation by DPLC Site Team Membership for Survey Item Q50: This school fosters a culture of collaboration
Likert Rating Member Non-member Total Disagree n 2 4 6
% within DPLC site team membership 7.7% 9.1% 8.6%
Agree n 24 40 64
% within DPLC site team membership 92.3% 90.9% 91.4%
Total n 26 44 70
% within DPLC site team membership 100.0% 100.0% 100.0%
As shown in Table 58, throughout the course of the study, a slightly higher percentage of
DPLC site team members agreed with the statement compared to non-members (n = 24, 92%
versus n = 40, 91%).
A crosstabulation was run with DPLC site team membership as the moderator variable
for survey item Q51: Teachers in this school are given opportunities to be instructional leaders
for their peers. The results of the Likert item were categorized as “Agree” or “Disagree.” The
results of the analysis are displayed in Table 59.
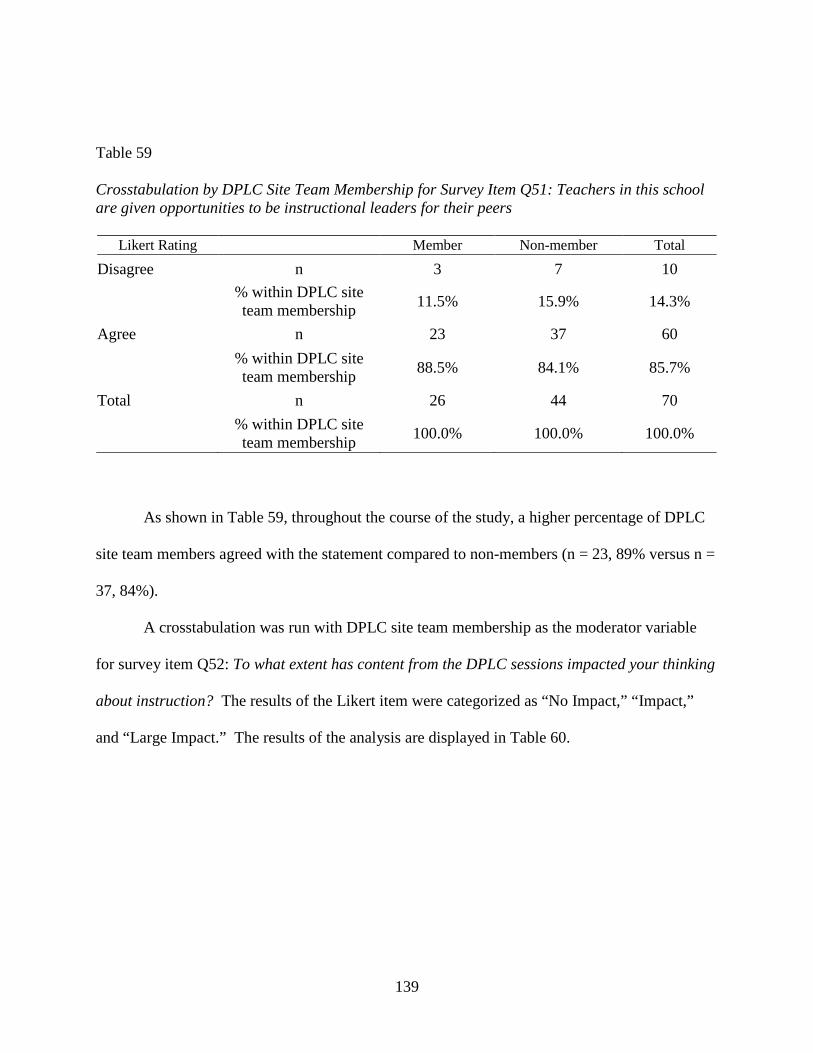
139
Table 59 Crosstabulation by DPLC Site Team Membership for Survey Item Q51: Teachers in this school are given opportunities to be instructional leaders for their peers
Likert Rating Member Non-member Total Disagree n 3 7 10
% within DPLC site team membership 11.5% 15.9% 14.3%
Agree n 23 37 60
% within DPLC site team membership 88.5% 84.1% 85.7%
Total n 26 44 70
% within DPLC site team membership 100.0% 100.0% 100.0%
As shown in Table 59, throughout the course of the study, a higher percentage of DPLC
site team members agreed with the statement compared to non-members (n = 23, 89% versus n =
37, 84%).
A crosstabulation was run with DPLC site team membership as the moderator variable
for survey item Q52: To what extent has content from the DPLC sessions impacted your thinking
about instruction? The results of the Likert item were categorized as “No Impact,” “Impact,”
and “Large Impact.” The results of the analysis are displayed in Table 60.

140
Table 60 Crosstabulation by DPLC Site Team Membership for Survey Item Q52: To what extent has the content from DPLC sessions impacted your thinking about instruction?
Likert Rating Member Non-member Total No Impact n 1 6 7
% within DPLC site team membership 3.8% 13.6% 10.0%
Impact n 9 33 42
% within DPLC site team membership 34.6% 75.0% 60.0%
Large Impact n 16 5 21
% within DPLC site team membership 61.5% 11.4% 30.0%
Total n 26 44 70
% within DPLC site team membership 100.0% 100.0% 100.0%
As shown in Table 60, non-members reported a much higher percentage in the “Impact”
category (n = 33, 75% versus n = 9, 35%). However, DPLC site team members reported a much
higher percentage in the “Large Impact” category (n = 16, 62% versus n = 5, 11%).
A crosstabulation was run with DPLC site team membership as the moderator variable
for survey item Q53: To what extent has content from the DPLC sessions impacted your
instructional practice? The results of the Likert item were categorized as “No Impact,”
“Impact,” and “Large Impact.” The results of the analysis are displayed in Table 61.

141
Table 61 Crosstabulation by DPLC Site Team Membership for Survey Item Q53: To what extent has the content from DPLC sessions impacted your instructional practice?
Likert Rating Member Non-member Total No Impact n 2 8 10
% within DPLC site team membership 7.7% 18.2% 14.3%
Impact n 8 30 38
% within DPLC site team membership 30.8% 68.2% 54.3%
Large Impact n 16 6 22
% within DPLC site team membership 61.5% 13.6% 31.4%
Total n 26 44 70
% within DPLC site team membership 100.0% 100.0% 100.0%
As shown in Table 61, non-members reported a much higher percentage in the “Impact”
category (n = 30, 68% versus n = 8, 31%). However, DPLC site team members reported a much
higher percentage in the “Large Impact” category (n = 16, 62% versus n = 6, 14%).
Statistical Analysis
DPLC Survey Items Over Time
A chi-square test of independence was utilized to determine if a statistically significant
difference exists among the responses to the three survey administrations for each DPLC survey
item. The results of the analysis are displayed in Table 62.

142
Table 62 Chi-square Test of Independence Over the Course of Three Survey Administrations for all DPLC Survey Items
Survey Items
Pearson Chi-Square
df
Asymptotic Significance
(2-sided)
Q48- Teachers in this school receive quality professional development that impacts instructional practices
2 .404
Q49- Teachers in this school have the strategies to support literacy in the content area that they teach
2 .444
Q50- This school fosters a culture of collaboration 2 .466
Q51- Teachers in this school are given opportunities to be instructional leaders for their Peers.
2 .267
Q52- To what extent has content from the DPLC sessions impacted your thinking about instruction.
4 .478
Q53- To what extent has content from the DPLC sessions impacted your thinking about instruction.
4 .665
As shown in Table 62, three independent binomial proportions were not statistically
significantly different (p > .05) for any of the DPLC survey items. Therefore, the null hypothesis
cannot be rejected, and the alternative hypothesis cannot be accepted.
DPLC Survey Items by Years of Experience
A chi-square test of independence was utilized to determine if a statistically significant
difference exists among the responses to the three categories of years of teaching experience for

143
each DPLC survey item. Years of experience were categorized as “0-5 years,” “6-15 years,” and
“Over 15 years.” The results of the analysis are displayed in Table 63.
Table 63 Chi-square Test of Independence by Years of Teaching Experience for all DPLC Survey Items
Survey Items
Pearson Chi-Square
df
Asymptotic Significance
(2-sided) Q48- Teachers in this school receive quality professional development that impacts instructional practices
2 .605
Q49- Teachers in this school have the strategies to support literacy in the content area that they teach
2 .322
Q50- This school fosters a culture of collaboration 2 .171
Q51- Teachers in this school are given opportunities to be instructional leaders for their Peers.
2 .268
Q52- To what extent has content from the DPLC sessions impacted your thinking about instruction.
4 .252
Q53- To what extent has content from the DPLC sessions impacted your thinking about instruction.
4 .653
As shown in Table 63, the three independent binomial proportions were not statistically
significantly different (p > .05) for any of the DPLC survey items. Therefore, the null hypothesis
cannot be rejected, and the alternative hypothesis cannot be accepted.

144
DPLC Survey Items by Gender
A chi-square test of independence was utilized to determine if a statistically significant
difference exists between genders for each DPLC survey item. The results of the analysis are
displayed in Table 64.
Table 64 Chi-square Test of Independence by Gender for all DPLC Survey Items
Survey Items
Pearson Chi-Square
df
Asymptotic Significance
(2-sided) Q48- Teachers in this school receive quality professional development that impacts instructional practices
1 .197
Q49- Teachers in this school have the strategies to support literacy in the content area that they teach
1 .081
Q50- This school fosters a culture of collaboration 1 .513
Q51- Teachers in this school are given opportunities to be instructional leaders for their peers.
1 .168
Q52- To what extent has content from the DPLC sessions impacted your thinking about instruction.
2 .623
Q53- To what extent has content from the DPLC sessions impacted your thinking about instruction.
2 .987
As shown in Table 64, results of the analysis showed that the two independent binomial
proportions were not statistically significantly different (p > .05) for any of the DPLC survey
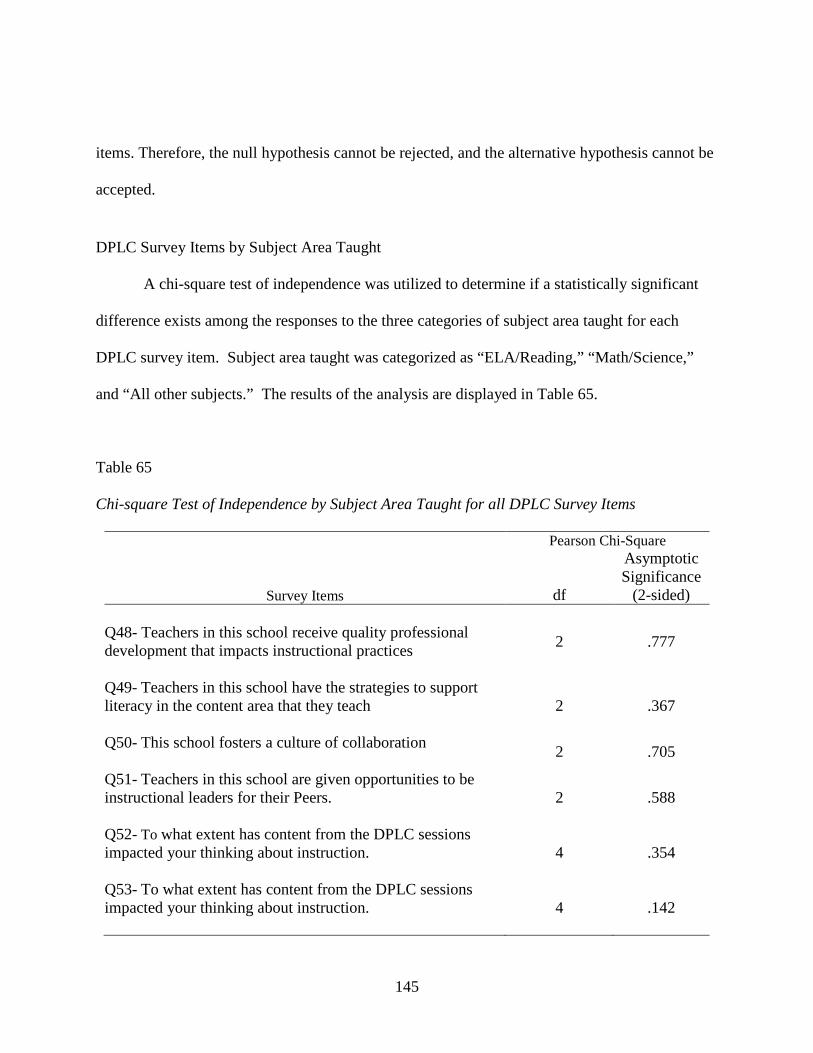
145
items. Therefore, the null hypothesis cannot be rejected, and the alternative hypothesis cannot be
accepted.
DPLC Survey Items by Subject Area Taught
A chi-square test of independence was utilized to determine if a statistically significant
difference exists among the responses to the three categories of subject area taught for each
DPLC survey item. Subject area taught was categorized as “ELA/Reading,” “Math/Science,”
and “All other subjects.” The results of the analysis are displayed in Table 65.
Table 65 Chi-square Test of Independence by Subject Area Taught for all DPLC Survey Items
Survey Items
Pearson Chi-Square
df
Asymptotic Significance
(2-sided) Q48- Teachers in this school receive quality professional development that impacts instructional practices
2 .777
Q49- Teachers in this school have the strategies to support literacy in the content area that they teach
2 .367
Q50- This school fosters a culture of collaboration 2 .705
Q51- Teachers in this school are given opportunities to be instructional leaders for their Peers.
2 .588
Q52- To what extent has content from the DPLC sessions impacted your thinking about instruction.
4 .354
Q53- To what extent has content from the DPLC sessions impacted your thinking about instruction.
4 .142

146
As shown in Table 65, the three independent binomial proportions were not statistically
significantly different (p > .05) for any of the DPLC survey items. Therefore, the null hypothesis
cannot be rejected, and the alternative hypothesis cannot be accepted.
DPLC Survey Items by DPLC Site Team Membership
A chi-square test of independence was utilized to determine if a statistically significant
difference exists between DPLC Site Team member and non-members for each DPLC survey
item. The results of the analysis are displayed in Table 66.
Table 66 Chi-square Test of Independence by DPLC Site Team Membership for all DPLC Survey Items
Survey Items
Pearson Chi-Square
df
Asymptotic Significance
(2-sided) Q48- Teachers in this school receive quality professional development that impacts instructional practices
1 .621
Q49- Teachers in this school have the strategies to support literacy in the content area that they teach
1 .187
Q50- This school fosters a culture of collaboration 1 .840
Q51- Teachers in this school are given opportunities to be instructional leaders for their Peers.
1 .614
Q52- To what extent has content from the DPLC sessions impacted your thinking about instruction.
2 .000
Q53- To what extent has content from the DPLC sessions impacted your thinking about instruction.
2 .000

147
Table 66 is as follows: The two independent binomial proportions were not statistically
significantly different (p > .05) for DPLC survey items Q48, Q49, Q50, and Q51 of the DPLC.
Therefore, the null hypothesis cannot be rejected, and the alternative hypothesis cannot be
accepted.
However, for item Q52- To what extent has content from the DPLC sessions impacted
your thinking about instruction, there was a statistically significant difference in distributions
between the two groups (p = .001). Therefore, the null hypothesis can be rejected and the
alternative hypothesis can be accepted. In the case of this item, non-members reported a much
higher percentage in the “Impact” category (n = 33, 75% versus n = 9, 35%). However, DPLC
site team members reported a much higher percentage in the “Large Impact” category (n = 16,
62% versus n = 5, 11%)
Likewise, there was a statistically significant difference in distributions between the two
groups (p = .001) for item Q53- To what extent has content from the DPLC sessions impacted
your thinking about instruction? Therefore, the null hypothesis can be rejected and the
alternative hypothesis can be accepted. In the case of this item, non-members reported a much
higher percentage in the “Impact” category (n = 30, 68% versus n = 8, 31%). However, DPLC
site team members reported a much higher percentage in the “Large Impact” category (n = 16,
62% versus n = 6, 14%). Table 66 illustrates the statistically significance described for each
DPLC item.
148
Qualitative Phase
In the qualitative phase of this study, the researcher utilized the program ATLAS.ti to
digitally code transcripts from the two focus group interviews. Focus group interview data were
examined using a priori codes derived from the research questions and underlying literature.
Furthermore, additional open codes and in vivo codes were created based on patterns and themes
discovered while examining the data. After the reporting of coding and emergent themes,
findings were utilized to report on the applicability to each research question. Moreover, logic
model analytics were used to develop a conceptual framework for the analysis of the qualitative
data. The logic model stipulates and operationalizes a complex chain of occurrences or events
over a period of time (Yin, 2018). This logic model attempts to show how complex activity takes
place throughout program implementation.
An integral part of the qualitative phase of the analysis was the utilization of the
following credibility techniques: thick rich description, triangulation, member-checking, and
negative case analysis (Creswell & Plano Clark, 2018). By describing a phenomenon in
sufficient detail, the researcher can evaluate the degree to which the conclusions drawn are
transferable to other times, settings, situations, and people (Lincoln & Guba, 1985). Therefore,
thick rich description was employed throughout the reporting of analysis of data included in this
chapter.
Additionally, the researcher utilized triangulation in order to seek convergence and
corroboration by comparing findings from qualitative data with quantitative data (Creswell &
Plano Clark, 2018, p.290). In the context of this study, findings were compared among the
quantitative survey subsets as an integral part of the a priori coding. This technique was utilized
149
to increase the validity of the study measure as well as the researcher’s understanding of the
construct.
Member checking and negative case analysis were reported in the credibility technique
section at the culmination of this chapter. When employing member checking, the researcher
contacted one key participant from each focus group to review summaries of key findings. The
key participants provided feedback on the accuracy of the findings. Participant reviews were
reported in this chapter as part of the findings and analysis. Additionally, the researcher
increased credibility of the data analysis by using negative case analysis. This involves searching
for and discussing elements of the data that do not support or appear to contradict patterns or
explanations that are emerging from data analysis (Patton, 1999). In the context of this study,
the researcher sought to identify data attained from the focus group interviews that did not fit
into the patterns and themes that framed the analysis. Analysis of deviant cases may revise,
broaden, and confirm the patterns emerging from data analysis.
Coding Process
A Priori Codes
The researcher developed seven a priori codes based on the research questions. Table 67
details the pre-established codes developed in order to encompass the key components of each
research question and extant literature.
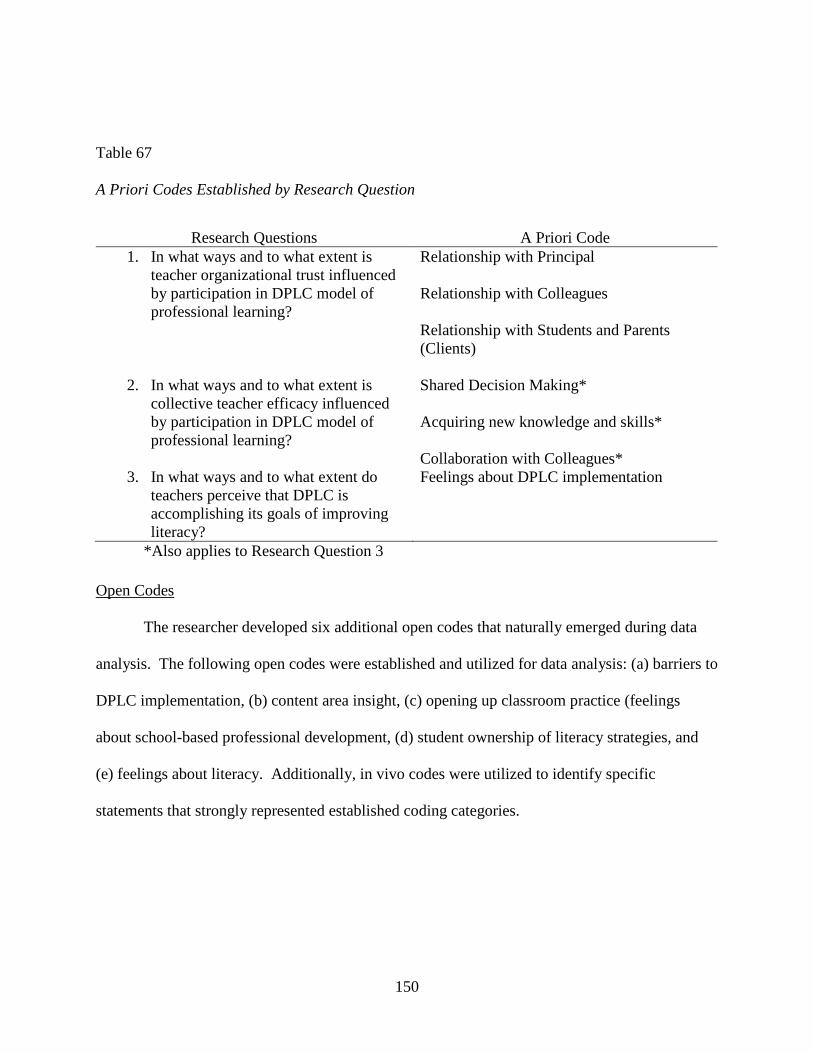
150
Table 67 A Priori Codes Established by Research Question
Research Questions A Priori Code 1. In what ways and to what extent is
teacher organizational trust influenced by participation in DPLC model of professional learning?
Relationship with Principal Relationship with Colleagues Relationship with Students and Parents (Clients)
2. In what ways and to what extent is collective teacher efficacy influenced by participation in DPLC model of professional learning?
Shared Decision Making* Acquiring new knowledge and skills* Collaboration with Colleagues*
3. In what ways and to what extent do teachers perceive that DPLC is accomplishing its goals of improving literacy?
Feelings about DPLC implementation
*Also applies to Research Question 3
Open Codes
The researcher developed six additional open codes that naturally emerged during data
analysis. The following open codes were established and utilized for data analysis: (a) barriers to
DPLC implementation, (b) content area insight, (c) opening up classroom practice (feelings
about school-based professional development, (d) student ownership of literacy strategies, and
(e) feelings about literacy. Additionally, in vivo codes were utilized to identify specific
statements that strongly represented established coding categories.
151
In Vivo Codes
In vivo codes were utilized to highlight specific quotations from the focus group
interview transcripts that exemplified the established a priori and open codes. Furthermore, in
vivo codes, along with a priori and open codes were utilized to identify emergent themes in the
qualitative data. Table 68 describes all a priori and open codes, the frequencies in which they
appeared, and in vivo code examples of each.
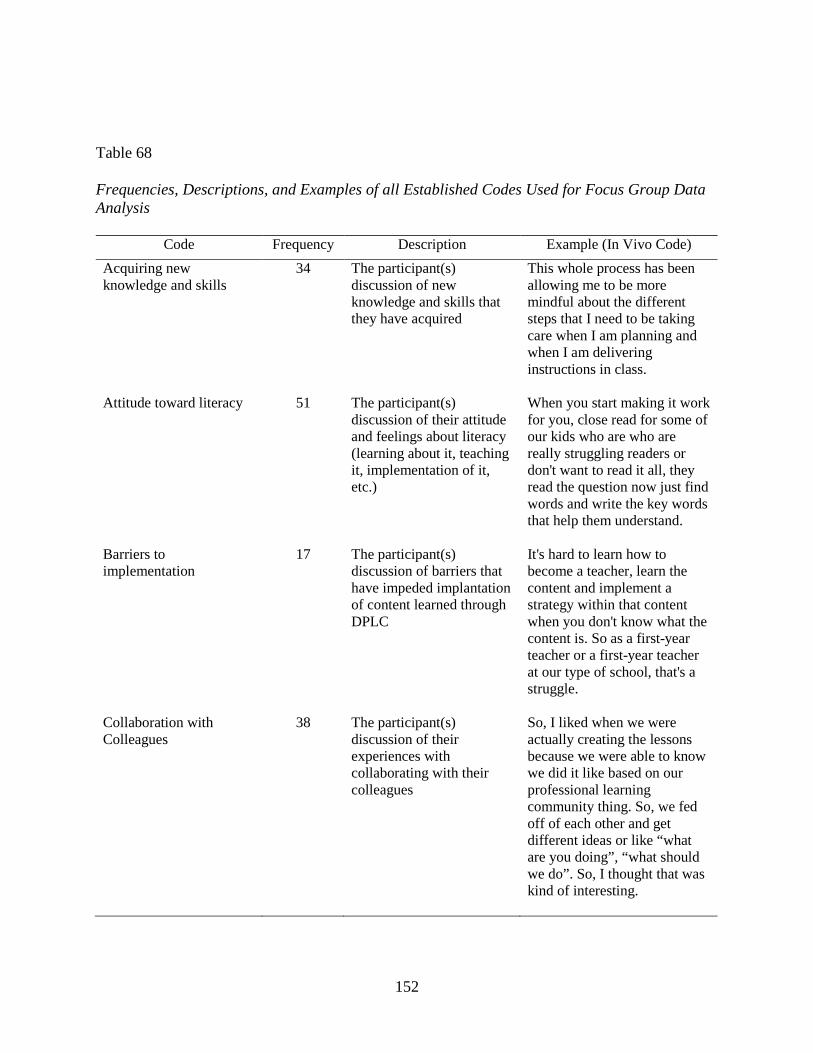
152
Table 68 Frequencies, Descriptions, and Examples of all Established Codes Used for Focus Group Data Analysis
Code Frequency Description Example (In Vivo Code) Acquiring new knowledge and skills
34 The participant(s) discussion of new knowledge and skills that they have acquired
This whole process has been allowing me to be more mindful about the different steps that I need to be taking care when I am planning and when I am delivering instructions in class.
Attitude toward literacy 51 The participant(s) discussion of their attitude and feelings about literacy (learning about it, teaching it, implementation of it, etc.)
When you start making it work for you, close read for some of our kids who are who are really struggling readers or don't want to read it all, they read the question now just find words and write the key words that help them understand.
Barriers to implementation
17 The participant(s) discussion of barriers that have impeded implantation of content learned through DPLC
It's hard to learn how to become a teacher, learn the content and implement a strategy within that content when you don't know what the content is. So as a first-year teacher or a first-year teacher at our type of school, that's a struggle.
Collaboration with Colleagues
38 The participant(s) discussion of their experiences with collaborating with their colleagues
So, I liked when we were actually creating the lessons because we were able to know we did it like based on our professional learning community thing. So, we fed off of each other and get different ideas or like “what are you doing”, “what should we do”. So, I thought that was kind of interesting.
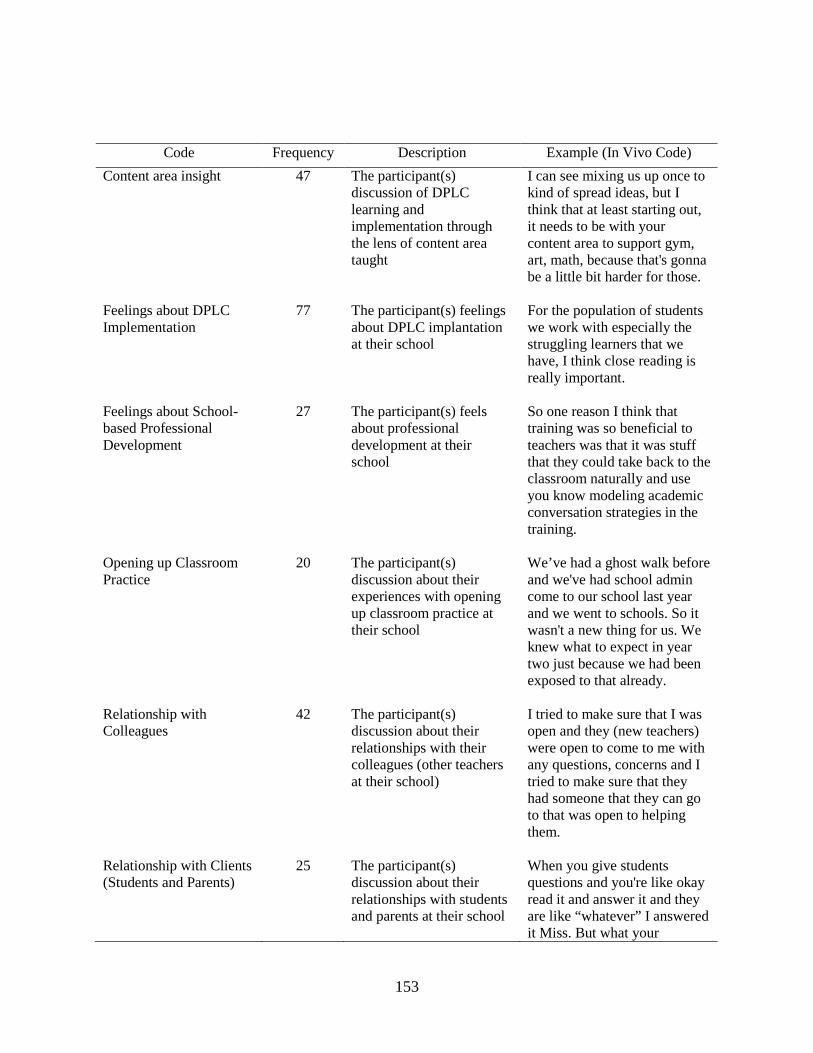
153
Code Frequency Description Example (In Vivo Code) Content area insight 47 The participant(s)
discussion of DPLC learning and implementation through the lens of content area taught
I can see mixing us up once to kind of spread ideas, but I think that at least starting out, it needs to be with your content area to support gym, art, math, because that's gonna be a little bit harder for those.
Feelings about DPLC Implementation
77 The participant(s) feelings about DPLC implantation at their school
For the population of students we work with especially the struggling learners that we have, I think close reading is really important.
Feelings about School-based Professional Development
27 The participant(s) feels about professional development at their school
So one reason I think that training was so beneficial to teachers was that it was stuff that they could take back to the classroom naturally and use you know modeling academic conversation strategies in the training.
Opening up Classroom Practice
20 The participant(s) discussion about their experiences with opening up classroom practice at their school
We’ve had a ghost walk before and we've had school admin come to our school last year and we went to schools. So it wasn't a new thing for us. We knew what to expect in year two just because we had been exposed to that already.
Relationship with Colleagues
42 The participant(s) discussion about their relationships with their colleagues (other teachers at their school)
I tried to make sure that I was open and they (new teachers) were open to come to me with any questions, concerns and I tried to make sure that they had someone that they can go to that was open to helping them.
Relationship with Clients (Students and Parents)
25 The participant(s) discussion about their relationships with students and parents at their school
When you give students questions and you're like okay read it and answer it and they are like “whatever” I answered it Miss. But what your
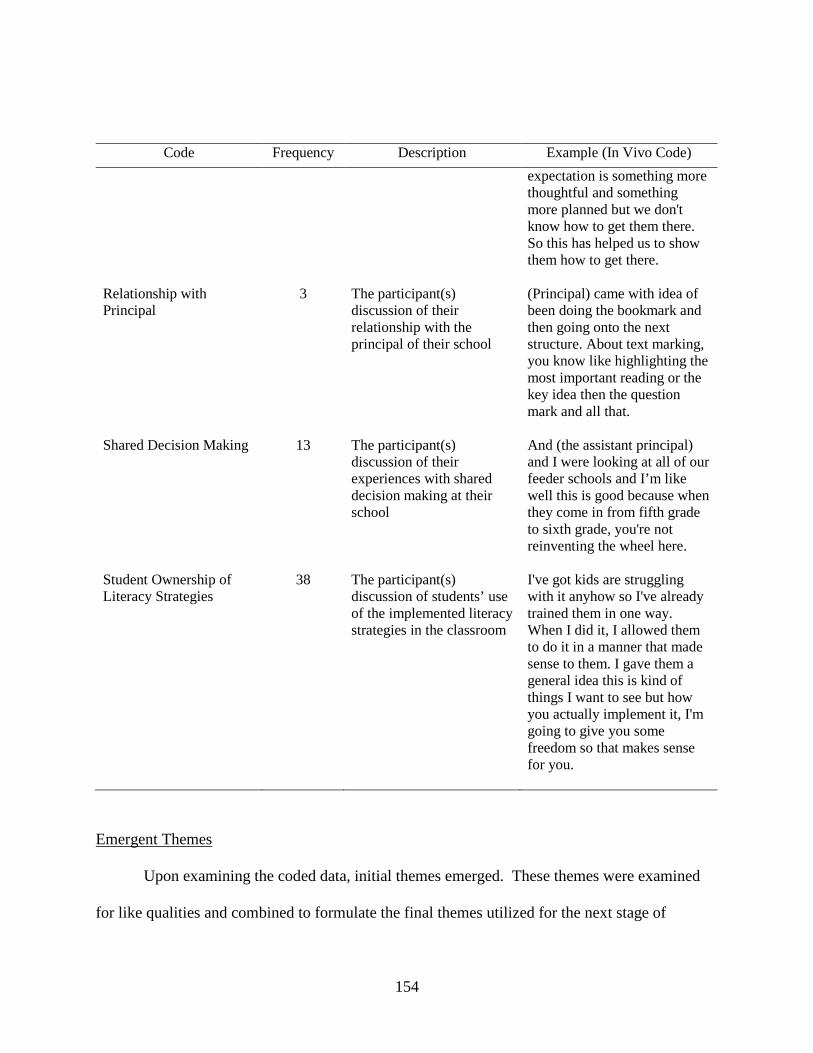
154
Code Frequency Description Example (In Vivo Code) expectation is something more thoughtful and something more planned but we don't know how to get them there. So this has helped us to show them how to get there.
Relationship with Principal
3 The participant(s) discussion of their relationship with the principal of their school
(Principal) came with idea of been doing the bookmark and then going onto the next structure. About text marking, you know like highlighting the most important reading or the key idea then the question mark and all that.
Shared Decision Making 13 The participant(s) discussion of their experiences with shared decision making at their school
And (the assistant principal) and I were looking at all of our feeder schools and I’m like well this is good because when they come in from fifth grade to sixth grade, you're not reinventing the wheel here.
Student Ownership of Literacy Strategies
38 The participant(s) discussion of students’ use of the implemented literacy strategies in the classroom
I've got kids are struggling with it anyhow so I've already trained them in one way. When I did it, I allowed them to do it in a manner that made sense to them. I gave them a general idea this is kind of things I want to see but how you actually implement it, I'm going to give you some freedom so that makes sense for you.
Emergent Themes
Upon examining the coded data, initial themes emerged. These themes were examined
for like qualities and combined to formulate the final themes utilized for the next stage of
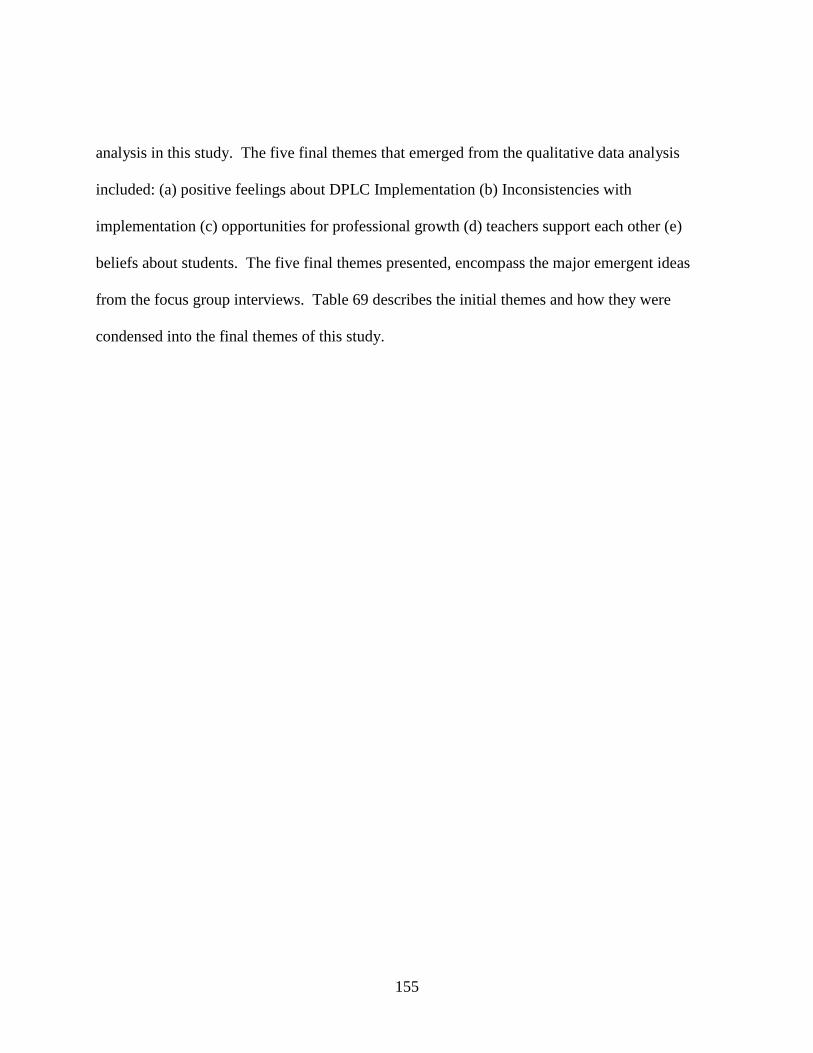
155
analysis in this study. The five final themes that emerged from the qualitative data analysis
included: (a) positive feelings about DPLC Implementation (b) Inconsistencies with
implementation (c) opportunities for professional growth (d) teachers support each other (e)
beliefs about students. The five final themes presented, encompass the major emergent ideas
from the focus group interviews. Table 69 describes the initial themes and how they were
condensed into the final themes of this study.

156
Table 69 Initial Theme Categorized into Final Themes Used to Describe the Analysis of focus Group Interview Data
Initial Themes Final Themes Improved confidence of teaching literacy by the
faculty over time Improved classroom implementation over time Faculty values opportunities for collaboration Faculty values literacy strategies learned through
DPLC
Theme 1: Positive feeling about DPLC implementation
Inconsistences of school-based PD Implementation differs by content area Needs and supports for new teachers Varying expectations
Theme 2: Inconsistencies with implementation
Shared leadership with DPLC Site Team Faculty values opportunities for collaboration Improved confidence of teaching literacy by the faculty over time Faculty values literacy strategies learned through
DPLC
Theme 3: Opportunities for professional growth
Shares leadership with DPLC Site Team Strong relationship with colleagues Value collaboration with each other Needs and supports for new teachers
Theme 4: Teachers support each other
Our students have different needs from other schools Believes literacy strategies are good for students Believes they are meeting students’ needs
Theme 5: Beliefs about students
The emergent themes presented in Table 69 have been applied to each relevant research
question.

157
Research Question 1
In what ways and to what extent is collective teacher efficacy influenced by participation in DPLC model of professional learning? According to the extant literature, certain practices are associated with higher collective
teacher efficacy in schools. These practices include building instructional knowledge and skills,
creating opportunities for teachers to collaboratively share skills and experience, and involving
teachers in school decision making (Brinson & Steiner, 2007). In support of the current research
and in connection to Research Question 1, Themes 3 through 5 have been discussed in the
sections below.
Theme 3: Opportunities for Professional Growth
The commonalities among the responses of focus group interview participants suggest a
theme of opportunities for professional growth. The interviewed faculty members shared similar
feelings about the value of collaboration with peers and the impact it has had on their
professional growth. Additionally, respondents reported that they have experienced improved
confidence in their knowledge and implementation of literacy strategies learned through DPLC.
Teachers described that they valued the literacy practice learned through DPLC professional
learning. Specifically, DPLC Site Team members discussed their shared leadership
opportunities and the positive impact those opportunities had on their knowledge and practice.
Table 70 contains supporting interviewee comments pertaining to the theme.

158
Table 70 Focus Group Participant Responses Supporting the Theme: Opportunities for Professional Growth
Theme Sub-category Example Participant Responses (In Vivo Codes) Improved Confidence with Teaching Literacy Over Time
This is my first year so I can't really compare it to anything. But like I think the more we do it obviously the more they get the hang of it and also I've been getting better at it as well over time. But I guess the next year I'll be better and better. I mean each year it just gets better. Even though I teach reading, it is a little more second nature to me now, I can create a close read lesson quicker and I think I do it with more support for the student. I think I do a better job of creating it than I did two years ago.
Shared Leadership Opportunities
At the end of the day when you're deciding what trainings are most valuable…what can the teachers take and use in their classroom to benefit them. We, the people who are on the DPLC… We are pretty good here working together and we're pretty good and open to helping others. So I think if you have a team that is working together and open to help another like she said it's not hard for them to come to us or ask those questions or take advice from us because we seem to be the veterans and we're open to suggestions and I always tell people I'm still growing and learning too so this is all part of a process. Actually present this stuff has really helped. At first it was like I don't know if I really want to present this stuff and then when I started reading up and realized it's not too bad. And when you start talking about it, everything started coming back to me from the other meetings and I’m like this is not too bad. So I think it's made me a lot more comfortable.
Value Literacy Strategies Learned through DPLC
By the time that I'm planning the text-dependent questions is the most and I feel that this training is a lot of help on the way that you have a very good of structure with the reading one two three and the type of questions that are actually you know incorporated in each step, that's pretty helpful.
159
Theme Sub-category Example Participant Responses (In Vivo Codes) This whole process has been you know allowing me to be more mindful about the different steps that I need to be taking care when I am planning and when I am delivering instructions in class.
Value Collaboration with Colleagues
Meeting with the other teachers is so invaluable because we never ever get to do that. We never get to talk with other people from other schools and find out what they're doing, what's working, what's not working. So I liked when we were actually creating the lessons because we were able to know we did it like based on our professional learning community... So we fed off of each other and get different ideas or like “what are you doing”, “what should we do”. So I thought that was kind of interesting.
Table 70 shows each sub-category within Theme 3: opportunities for professional
growth. Each subcategory is supported by participant statements extracted from the focus group
interviews. For example, improved confidence of teaching literacy over time is supported by
participant responses discussing how implementation improves each year and next year will be
even better. Furthermore, the sub-category related to shared leadership experiences is heavily
focused on how being a member of the DPLC site team has really assisted in understanding and
implementing the literacy content at a deeper level. Additional statements support the value of
the literacy strategies being learned, such as learning to utilize text-dependent questions and the
close reading process. Moreover, collaboration with colleagues is valued, as illustrated through
comments explaining how it is “invaluable” to work with members of one’s professional
learning community and gain new ideas. All of these subcategories and supporting statements
demonstrate the qualities of Theme 3: opportunities for professional growth.
160
Theme 4: Teachers Support Each Other
The commonalities among the responses of focus group interview participants suggest a
theme of teachers support each other. The interviewed faculty members shared similar feelings
about the value of the relationships they have had with their peers and the impact that it has had
on the culture of the school. Furthermore, respondents reported that they value opportunities to
collaborate with one another. Teachers also advocated for the new teachers at their school and
discussed ways that they have and could continue to support them. Specifically, DPLC Site
Team members discussed how they valued the opportunity to be instructional leaders for their
peers. Table 71 illustrates supporting interviewee comments pertaining to this theme.

161
Table 71 Focus Group Participant Responses Supporting the Theme: Teachers Support Each Other
Theme Sub-category Example Participant Responses (In Vivo Codes) Value Relationship with Peers
It's easier to attend a training and listen to the information they're providing because we know that's a trustworthy source who's looking out for the best interest of the teacher and the students. So, I think with that aspect it's kind of just improved our school culture, at least amongst the staff. You know it's just a learning curve for all of us as well you know that we're all in this together, kind of moving forward, moving along in a three-year process.
Shared Leadership Opportunities
We, the people who are on the DPLC… We are pretty good here working together and we're pretty good and open to helping others. So, I think if you have a team that is working together and open to help another like she said it's not hard for them to come to us or ask those questions or take advice from us because we seem to be the veterans and we're open to suggestions and I always tell people I'm still growing and learning too so this is all part of a process. Actually, present this stuff has really helped. At first it was like I don't know if I really want to present this stuff and then when I started reading up and realized it's not too bad. And when you start talking about it, everything started coming back to me from the other meetings and I’m like this is not too bad. So, I think it's made me a lot more comfortable.
Support New Teachers As an instructional coach will use some of the (DPLC) strategies and things that I learned with my new teachers during Friday morning meetings. To show them a strategy or I get to know your skill and our way these things can be implemented and if I could use it with teachers, I'm showing you this and modeling this. So you can use it in your classroom and it will make it a little bit easier for you to understand. We had a lot of new staff, new teachers to the profession. So, at the beginning of the year maybe DPLC wasn't our top priority our top focus with new teachers but then as the years gone on I think new teachers have caught along quicker than we anticipated.
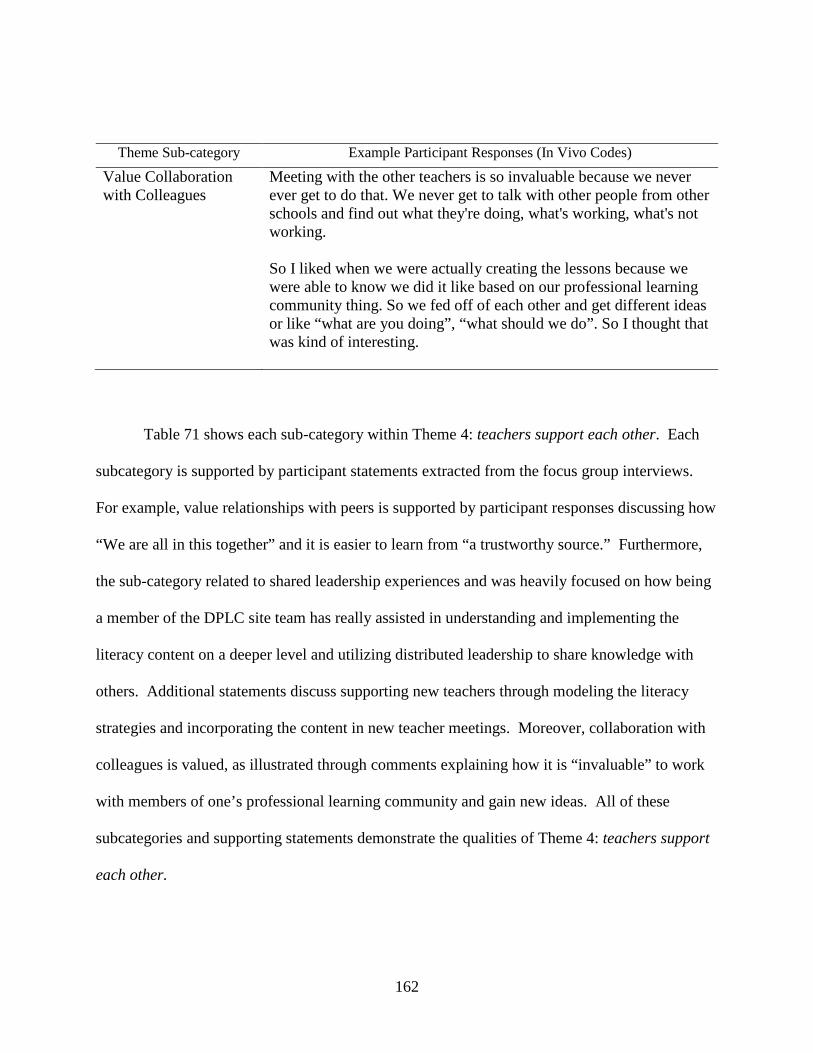
162
Theme Sub-category Example Participant Responses (In Vivo Codes) Value Collaboration with Colleagues
Meeting with the other teachers is so invaluable because we never ever get to do that. We never get to talk with other people from other schools and find out what they're doing, what's working, what's not working. So I liked when we were actually creating the lessons because we were able to know we did it like based on our professional learning community thing. So we fed off of each other and get different ideas or like “what are you doing”, “what should we do”. So I thought that was kind of interesting.
Table 71 shows each sub-category within Theme 4: teachers support each other. Each
subcategory is supported by participant statements extracted from the focus group interviews.
For example, value relationships with peers is supported by participant responses discussing how
“We are all in this together” and it is easier to learn from “a trustworthy source.” Furthermore,
the sub-category related to shared leadership experiences and was heavily focused on how being
a member of the DPLC site team has really assisted in understanding and implementing the
literacy content on a deeper level and utilizing distributed leadership to share knowledge with
others. Additional statements discuss supporting new teachers through modeling the literacy
strategies and incorporating the content in new teacher meetings. Moreover, collaboration with
colleagues is valued, as illustrated through comments explaining how it is “invaluable” to work
with members of one’s professional learning community and gain new ideas. All of these
subcategories and supporting statements demonstrate the qualities of Theme 4: teachers support
each other.
163
Theme 5: Beliefs about Students
The commonalities among the responses of focus group interview participants suggest a
theme: beliefs about students. The interviewed faculty members shared similar feelings about
the importance of meeting their students’ needs. Furthermore, respondents reported that they
believed the literacy strategies being implemented due to DPLC professional learning were good
for their students. Teachers described the value of utilizing literacy practices in their classrooms.
Additionally, teachers also discussed the specific needs of students at their school. Generally,
teachers believed that students at their school were different from students at other schools,
making their needs and challenges unique. Table 72 illustrates interviewee comments which
support the theme.

164
Table 72 Focus Group Participant Responses Supporting the Theme: Beliefs About Students
Theme Sub-category Example Participant Responses (In Vivo Codes) Value meeting students’ needs
But the most part they're all below grade level (Learning Strategies class- Exceptional Student Education support)) so I think it's been a good strategy. I actually incorporated into my ESE goals now that's one of the reading comprehension goals is be you know close reading strategies. So even though you have kids in your classroom that are low readers in my case that I'm a reading teacher so then you need to be teaching them you know along with the differentiated instruction you need to be teaching them at the grade level that they are at, so it's very important.
Value using literacy strategies with students
I've got kids are struggling with it anyhow so I've already trained them in one way. When I did it, I allowed them to do it in a manner that made sense to them. I gave them a general idea this is kind of things I want to see but how you actually implement it, I'm going to give you some freedom so that makes sense for you. I always like to use with the students all the scaffolding techniques. So I got the students to go over summarizing the paragraph or chunking the texts. We're looking for vocabulary, academic vocabulary and of course text-dependent questions. But I felt with this training, I have more structure you know regarding close reading as an instructional tool.
Believe students at their school have unique needs and challenges
In the past selecting text just dealing with the population of students we have, I wanted to make sure it was high interest and that was the most important. It's high interest and I can align questions to it. But now I think I've taken in more into consideration the complexity of the text. For the population of students we work with especially the struggling learners that we have, I think close reading is really important. Because it gives them the confidence to get where we need them to be with their academics… It gives them a better chance at reaching that standard that you were talking about with the content mastery.
165
Table 72 shows each sub-category within Theme 4: beliefs about students. Each
subcategory is supported by participant statements extracted from the focus group interviews.
For example, value meeting students’ needs is supported by participant responses discussing the
importance of using literacy strategies to meet the needs of below grade level readers and
students receiving exceptional education services (ESE). Furthermore, the sub-category related
to the value of using literacy strategies with students focused on how to utilize literacy strategies
to differentiate instruction by providing scaffolds and allowing students to take ownership of
their learning. Additional statements included teachers’ expressions of beliefs about the unique
needs and challenges of students at their school. Teachers explained that students at their school
could especially benefit from carefully planned instruction, not only considering the interest
level of their reading, but also choosing the appropriate complexity level and trajectory to the
standard. All of these subcategories and supporting statements demonstrate the qualities of
Theme 5: beliefs about students.
Research Question 2
In what ways and to what extent is organizational trust influenced by participation in DPLC model of professional learning? According to Hoy and Tschannen-Moran’s (2003) conceptualization and measurement of
faculty trust, there are three facets of faculty trust: trust in the principal, trust in colleagues
(fellow teachers), and trust in clients (students and parents). These aspects of faculty trust have
been utilized to apply the appropriate themes discussed in connection to Research Question 2 in
the following sections.
166
Theme 3: Opportunities for Professional Growth
The commonalities among the responses of focus group interview participants suggest a
theme of opportunities for professional growth. For the purpose of this research question, this
theme was viewed through the lens of Faculty Trust in Principal. Interviewee responses
supported that the principal created a culture at the school that allows teachers’ opportunities for
professional growth. Specifically, DPLC Site Team members discussed the shared leadership
opportunities afforded by the principal and the positive impact those had on their knowledge and
practice. One interviewee explained,
I think if you have a team that is working together and open to help another…it's not hard for them to come to us or ask those questions or take advice from us because we seem to be the veterans and we're open to suggestions and I always tell people I'm still growing and learning too. This is all part of a process. Another DPLC Site Team member shared,
Actually, presenting this stuff (PD on literacy practices) has really helped. At first it was like I don't know if I really want to present this stuff and then when I started reading up and realized it's not too bad. And when you start talking about it, everything started coming back to me...so I think it's made me a lot more comfortable. The interviewed faculty members shared similar feelings about the value of collaboration
with peers and the impact that has on their professional growth. One teacher shared, “Meeting
with the other teachers is so invaluable because we never ever get to do that. We never get to talk
with other people from other schools and find out what they're doing, what's working, what's not
working.” Another teacher discussed the value of collaboration among colleagues, “I liked when
we were actually creating the lessons because we were able to know we did it…based on our
professional learning community... We fed off of each other and got different ideas.” For
addition supporting interviewee comments pertaining to Theme 3: opportunities for professional
growth, see Table 70.

167
Theme 4: Teachers Support Each Other
The commonalities among the responses of focus group interview participants suggest a
theme of teachers support each other. For the purpose of this research question, this theme is
being viewed through the lens of “Faculty Trust in Colleagues”. The interviewed faculty
members shared similar feelings about the value of the relationships they have with their peers
and the impact it has on the culture of the school. One teacher reported, “It's easier to attend a
training and listen to the information they're providing because we know that's a trustworthy
source who's looking out for the best interest of the teacher and the students. So I think with that
aspect it's kind of just improved our school culture, at least amongst the staff.” Another faculty
member reiterated, “You know it's just a learning curve for all of us as well you know that we're
all in this together, kind of moving forward, moving along in a three-year process.”
Furthermore, respondents reported that they value opportunities to collaborate with one
another. Faculty members describe collaborative opportunities as “invaluable” and reinforced
the importance of working together as a professional learning community. Teachers also
advocated for the new teachers at their school and discussed ways that they have and could
continue to support them. The instructional coach shared, “I will use some of the (DPLC)
strategies and things that I learned with my new teachers during Friday morning meetings to
show them a strategy…get to know a skill…ways these things can be implemented…So you can
use it in your classroom and it will make it a little bit easier for you to understand.”
Specifically, DPLC Site Team members discussed how they valued the opportunity to be
instructional leaders for their peers. One DPLC Site Team Member explains, “It's not hard for
them (other teachers) to come to us or ask those questions or take advice from us because we

168
seem to be the veterans and we're open to suggestions and I always tell people I'm still growing
and learning too.” Additional supporting interviewee comments pertaining to Theme 4, teachers
support each other, are presented in Table 71.
Theme 5: Beliefs about Students
The commonalities among the responses of focus group interview participants suggest a
theme, beliefs about students. For the purpose of this research question, this theme was viewed
through the lens of “Faculty Trust in Clients.” The theme centered on students. There was no
discussion of parents. The interviewed faculty members shared similar feelings about the
importance of meeting their students’ needs. One reading teacher explained the importance of
using literacy strategies to meet students’ needs,
So even though you have kids in your classroom that are low readers…you need to be teaching them…along with the differentiated instruction you need to be teaching them at the grade level that they are at, so it's very important (to use literacy strategies). Furthermore, respondents reported that they believe the literacy strategies being implemented
due to DPLC professional learning were good for their students. Teachers described the value of
utilizing literacy practices in their classrooms. One teacher shared,
I always like to use with the students all the scaffolding techniques. So, I got the students to go over summarizing the paragraph or chunking the texts. We're looking for vocabulary, academic vocabulary and of course text-dependent questions. But I felt with this training, I have more structure you know regarding close reading as an instructional tool. Additionally, teachers discussed the specific needs of students at their school. Generally,
teachers believes that students at their school were different from students at other schools;
therefore, they had unique needs and challenges. One teacher discussed,
For the population of students we work with especially the struggling learners that we have, I think close reading is really important. Because it gives them the confidence to get where we need them to be with their academics… It gives them a better chance at reaching that standard…with the content mastery.
169
Additional supporting interviewee comments pertaining to Theme 5: beliefs about students, are
contained in Table 72.
Research Question 3
In what ways and to what extent do teachers perceive that DPLC is accomplishing its goals of improving literacy? Each of the emergent themes applied to Research Question 3. These themes were
reflective of the DPLC survey items (see Appendix D) as well as the research about this
professional learning model. In the following sections, each theme and its relationship to
teachers’ perceptions of DPLC implementation is discussed.
Theme 1: Positive Feelings about DPLC Implementation
The commonalities among the responses of focus group interview participants suggested
a theme, positive feelings about DPLC implementation. The interviewed faculty members shared
similar positive feelings about aspects of DPLC implementation. Teachers described the value
of utilizing the acquired literacy practices in their classrooms. Respondents reported improved
confidence with teaching literacy strategies over time. Furthermore, teachers reported that they
believed the literacy strategies being implemented due to DPLC professional learning were good
for their students. Participants also valued opportunities to collaborate with colleagues about
learning acquired through DPLC structures and recognized the value of opening up practice.
Table 73 contains interviewee comments which support the theme.

170
Table 73 Focus Group Participant Responses Supporting the Theme: Positive Feelings About DPLC Implementation
Theme Sub-category Example Participant Responses (In Vivo Codes) Value of utilizing the acquired literacy practices in their classrooms
I try and use it on a weekly basis (close reading strategies). I try to do reading two or three days a week and I think the repetition is important because my kids do have significant gaps. It does help for them to see that content presented to them over and over and kind of break it down and make notes on the side. I think it helps them build up like a little bit of mental stamina to read the passage. We chunk them like we talked about. But and I think reading it like multiple times helps them get used to the content or at least the sizing of it so when they're reading a test question that might have a quote in it they're not just, you know, skipping over it.
Improved confidence with teaching literacy strategies over time
I can create a close read lesson quicker and I think I do it with more support for the student. I think I do a better job of creating it than I did two years ago. (Implementation of literacy content) Started out rough. I think we're all trying to figure out what we were doing. But once the meetings (school-based PD) started going and we started learning more, I think it was easier for us to kind of implement.
Believe DPLC literacy strategies are good for students
I think it really is helping them (students) with their writing because they're now comfortable and familiar with marking the text, they can go back and go okay so that question address what you've marked They (students) were sitting there writing out their process, writing down notes, important plot parts of the stories and things like that. Some we're using the tools that are on the program for them to highlight without prompting. So they already knew what they needed to do to get the answers so that when they type, it flows out a lot easier
Valued opportunities to collaborate with
So I liked when we were actually creating the lessons because we were able to like at least like I know we did it like based on our professional learning community thing. So we were like feed off of
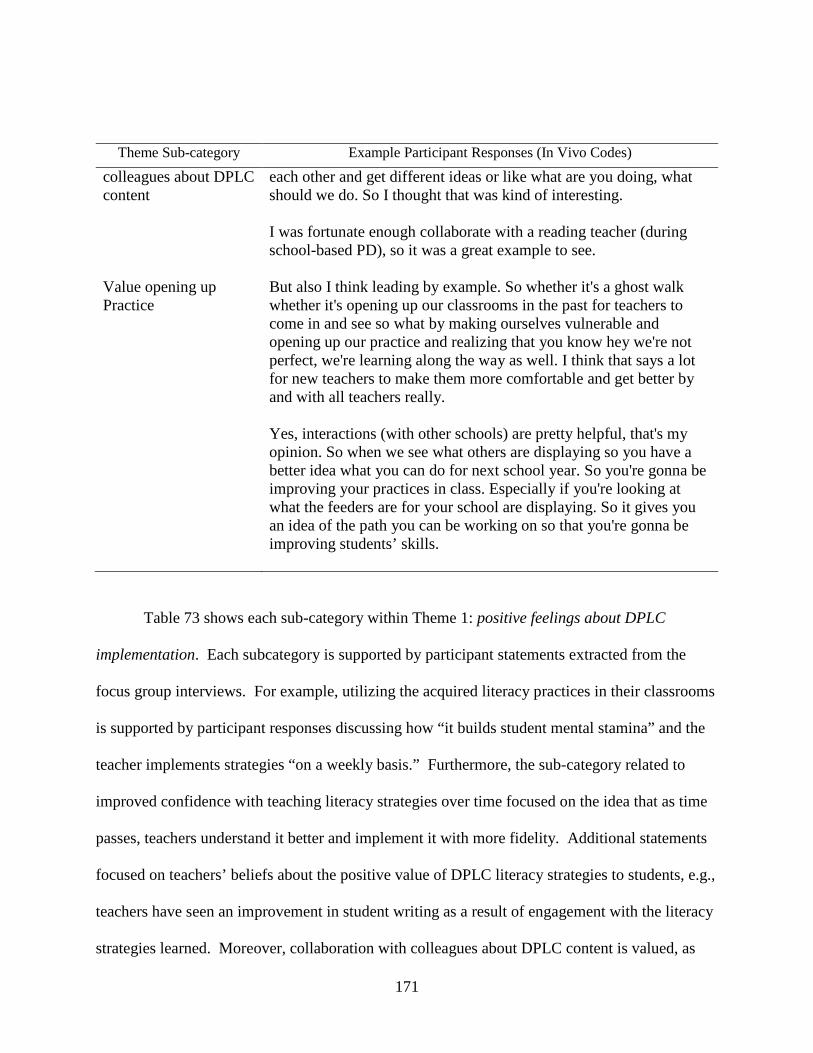
171
Theme Sub-category Example Participant Responses (In Vivo Codes) colleagues about DPLC content
each other and get different ideas or like what are you doing, what should we do. So I thought that was kind of interesting. I was fortunate enough collaborate with a reading teacher (during school-based PD), so it was a great example to see.
Value opening up Practice
But also I think leading by example. So whether it's a ghost walk whether it's opening up our classrooms in the past for teachers to come in and see so what by making ourselves vulnerable and opening up our practice and realizing that you know hey we're not perfect, we're learning along the way as well. I think that says a lot for new teachers to make them more comfortable and get better by and with all teachers really. Yes, interactions (with other schools) are pretty helpful, that's my opinion. So when we see what others are displaying so you have a better idea what you can do for next school year. So you're gonna be improving your practices in class. Especially if you're looking at what the feeders are for your school are displaying. So it gives you an idea of the path you can be working on so that you're gonna be improving students’ skills.
Table 73 shows each sub-category within Theme 1: positive feelings about DPLC
implementation. Each subcategory is supported by participant statements extracted from the
focus group interviews. For example, utilizing the acquired literacy practices in their classrooms
is supported by participant responses discussing how “it builds student mental stamina” and the
teacher implements strategies “on a weekly basis.” Furthermore, the sub-category related to
improved confidence with teaching literacy strategies over time focused on the idea that as time
passes, teachers understand it better and implement it with more fidelity. Additional statements
focused on teachers’ beliefs about the positive value of DPLC literacy strategies to students, e.g.,
teachers have seen an improvement in student writing as a result of engagement with the literacy
strategies learned. Moreover, collaboration with colleagues about DPLC content is valued, as

172
illustrated by comments explaining that teachers appreciated working with colleagues from other
content areas and learning from one another. Finally, participants discussed the value of opening
up practice. Teachers discussed the importance for “all teachers” to make themselves
“vulnerable” and realize that it is okay, that, “We aren’t perfect.” All of these subcategories and
supporting statements demonstrate the qualities of Theme 1: positive feelings about DPLC
implementation.
Theme 2: Inconsistencies with Implementation
The commonalities among the responses of focus group interview participants suggested
a theme, inconsistences with implementation. Through focus group interview discussions,
inconsistences in experiences and expectations emerged. For example, teachers described
differing comfort levels and fidelity of implementation depending on content area taught. Math
teachers and elective teachers were highlighted as subject areas that experienced more struggles
with implementing literacy strategies. Respondents reported differing expectations for method
and frequency of literacy strategy implementation depending on their evaluating administrator.
Furthermore, participants reported that school-based professional development of DPLC content
was inconsistent in frequency and method of delivery. Moreover, differences in literacy content
understanding and implementation based on DPLC Site Team Membership were noted.
Evidence suggested that DPLC Site Team members had a deeper understanding of the literacy
content and an increased comfort level in implementing the new learning in their classrooms.
Participants also discussed the struggles of new teachers and how difficult it is for them to

173
balance all of the new learning they are experiencing. Table 74 contains interviewee comments
which support the theme.
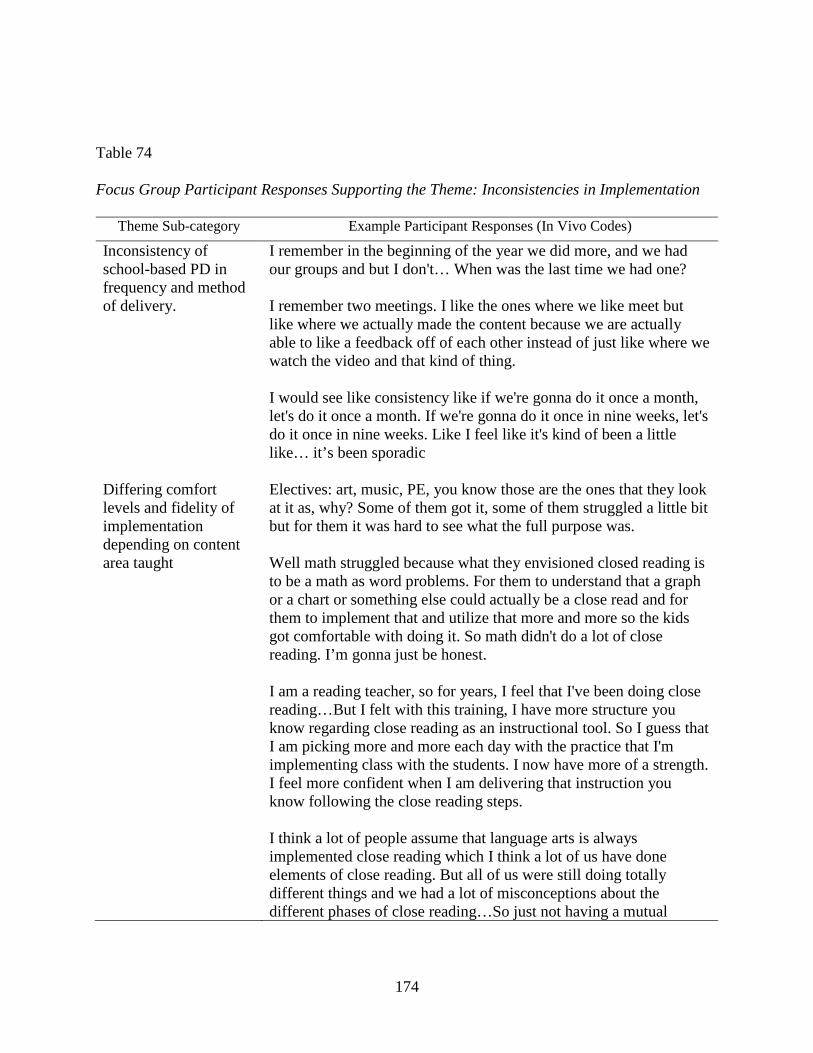
174
Table 74 Focus Group Participant Responses Supporting the Theme: Inconsistencies in Implementation
Theme Sub-category Example Participant Responses (In Vivo Codes) Inconsistency of school-based PD in frequency and method of delivery.
I remember in the beginning of the year we did more, and we had our groups and but I don't… When was the last time we had one? I remember two meetings. I like the ones where we like meet but like where we actually made the content because we are actually able to like a feedback off of each other instead of just like where we watch the video and that kind of thing. I would see like consistency like if we're gonna do it once a month, let's do it once a month. If we're gonna do it once in nine weeks, let's do it once in nine weeks. Like I feel like it's kind of been a little like… it’s been sporadic
Differing comfort levels and fidelity of implementation depending on content area taught
Electives: art, music, PE, you know those are the ones that they look at it as, why? Some of them got it, some of them struggled a little bit but for them it was hard to see what the full purpose was. Well math struggled because what they envisioned closed reading is to be a math as word problems. For them to understand that a graph or a chart or something else could actually be a close read and for them to implement that and utilize that more and more so the kids got comfortable with doing it. So math didn't do a lot of close reading. I’m gonna just be honest. I am a reading teacher, so for years, I feel that I've been doing close reading…But I felt with this training, I have more structure you know regarding close reading as an instructional tool. So I guess that I am picking more and more each day with the practice that I'm implementing class with the students. I now have more of a strength. I feel more confident when I am delivering that instruction you know following the close reading steps. I think a lot of people assume that language arts is always implemented close reading which I think a lot of us have done elements of close reading. But all of us were still doing totally different things and we had a lot of misconceptions about the different phases of close reading…So just not having a mutual
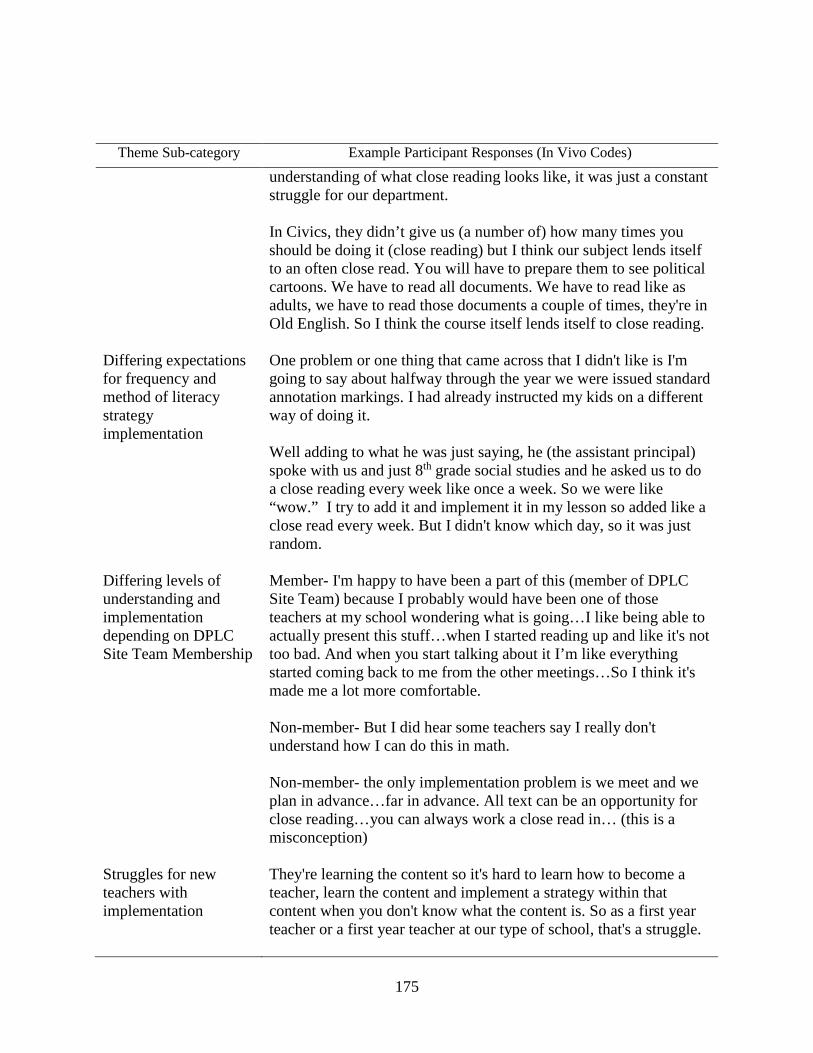
175
Theme Sub-category Example Participant Responses (In Vivo Codes) understanding of what close reading looks like, it was just a constant struggle for our department. In Civics, they didn’t give us (a number of) how many times you should be doing it (close reading) but I think our subject lends itself to an often close read. You will have to prepare them to see political cartoons. We have to read all documents. We have to read like as adults, we have to read those documents a couple of times, they're in Old English. So I think the course itself lends itself to close reading.
Differing expectations for frequency and method of literacy strategy implementation
One problem or one thing that came across that I didn't like is I'm going to say about halfway through the year we were issued standard annotation markings. I had already instructed my kids on a different way of doing it. Well adding to what he was just saying, he (the assistant principal) spoke with us and just 8th grade social studies and he asked us to do a close reading every week like once a week. So we were like “wow.” I try to add it and implement it in my lesson so added like a close read every week. But I didn't know which day, so it was just random.
Differing levels of understanding and implementation depending on DPLC Site Team Membership
Member- I'm happy to have been a part of this (member of DPLC Site Team) because I probably would have been one of those teachers at my school wondering what is going…I like being able to actually present this stuff…when I started reading up and like it's not too bad. And when you start talking about it I’m like everything started coming back to me from the other meetings…So I think it's made me a lot more comfortable. Non-member- But I did hear some teachers say I really don't understand how I can do this in math. Non-member- the only implementation problem is we meet and we plan in advance…far in advance. All text can be an opportunity for close reading…you can always work a close read in… (this is a misconception)
Struggles for new teachers with implementation
They're learning the content so it's hard to learn how to become a teacher, learn the content and implement a strategy within that content when you don't know what the content is. So as a first year teacher or a first year teacher at our type of school, that's a struggle.

176
Theme Sub-category Example Participant Responses (In Vivo Codes) Yeah, the story at our school, as you know, is we had high turnover. We had a lot of new staff, new teachers to the profession. So at the beginning of the year maybe DPLC wasn't our top priority with new teachers but then as the years gone on I think new teachers have caught along quicker than we anticipated.
Table 74 shows each sub-category within Theme 2: inconsistencies with implementation.
Each subcategory is supported by participant statements extracted from the focus group
interviews. For example, inconsistency of school-based PD in frequency and method of delivery
is illustrated by participants discussing their preference for more consistent meetings, possibly
monthly. Some participants could not remember when their last training occurred. Furthermore,
the sub-category related to differing comfort levels and fidelity of implementation depending on
content area taught illustrated the implementation was low in math classes. Furthermore,
recommendations were made to provide more differentiated support to elective teachers.
However, confidence with literacy implementation was high in ELA and reading classes.
Additional statements indicated that teachers in certain content areas were given exact numbers
of close reads that should occur during certain time periods by overseeing administrators; this
was inconsistent with other teachers who had different supervising administrators. Another
inconsistency was in the issuance of school-wide, standard annotation marks for all students in
the middle of the school year. This philosophy did not coincide with all teachers’ beliefs and
practices, eventually fading away. Moreover, levels of understanding and implementation varied
depending on DPLC Site Team membership. DPLC Site Team members demonstrated increased
confidence in understanding and implementing the literacy content learned. On the other hand,
nonmembers experienced more struggles with understanding and implementing the practices

177
learned. Finally, participants discussed the difficulty for new teachers in implementing the new
literacy content. New teachers were trying to acclimate to a new school, learning “how to
become a teacher, and “learn the content.” One participants observed, “For a first-year teacher at
our type of school, that's a struggle.” All of these subcategories and supporting statements
demonstrate the qualities of Theme 2: inconsistencies with implementation.
Theme 3: Opportunities for Professional Growth
The commonalities among the responses of focus group interview participants suggested
a theme of opportunities for professional growth. The interviewed faculty members shared
similar feelings about the value of collaboration with peers on DPLC content and the impact that
had on their professional growth. Teachers discussed the value of literacy practices learned
through DPLC professional learning. Specifically, DPLC Site Team members discussed their
shared leadership opportunities and the positive impact that had on their knowledge and practice.
Additionally, respondents reported that they had experienced improved confidence in their
knowledge and implementation of literacy strategies learned through DPLC. Supporting
interviewee comments pertaining to this theme were presented in Table 70: Focus Group
Participant Responses Supporting the Theme: Opportunities for Professional Growth.
Theme 4: Teachers Support Each Other
The commonalities among the responses of focus group interview participants suggested
a theme, teachers support each other. Teachers reported that they valued opportunities to
collaborate with one another on DPLC content. Teachers also discussed ways to support new

178
teachers in the newly learned literacy strategies. Furthermore, DPLC Site Team members
discussed how they valued the opportunity to be instructional leaders for their peers in school-
based DPLC professional learning sessions. Supporting interviewee comments pertaining to this
theme were presented in Table 71: Focus Group Participant Responses Supporting the Theme:
Teachers Support Each Other.
Theme 5: Beliefs about Students
The commonalities among the responses of focus group interview participants suggested
a theme, beliefs about students. The interviewed faculty members shared similar feelings about
the importance of meeting their students’ needs. Respondents reported that they believed the
literacy strategies being implemented due to DPLC professional learning were helpful to their
students. Additionally, teachers also discussed the specific needs of students at their school.
Generally, teachers believed that students at their school were different from students at other
schools and that they had unique needs and challenges. Supporting interviewee comments
pertaining to the theme are contained in Table 72: Focus Group Participant Responses
Supporting the Theme: Beliefs about Students.
Credibility Techniques
Certain credibility techniques have been utilized throughout qualitative data analysis to
increase validity and reliability of the results. Thick rich description and triangulation have been
addressed within the analysis throughout the Qualitative section. Following is a discussion of the
processes utilized for member checking and negative case analysis.
179
Member checking
When utilizing member checking, the researcher contacted one key participant from each
focus group to review summaries of key findings. The key participants provided feedback on the
accuracy of the findings. The key participant from focus group one responded to the inquiry for
feedback with the following, “Good morning, I believe you captured themes that we as a school
were reflective about regarding the DPLC process. Awesome Job.” The key participant from
focus group one responded, “Yes, I think your identified themes represent our conversation.
Thank you for the opportunity to share my thoughts on your analysis.”
Negative Case Analysis
Moreover, the researcher increased credibility of the data analysis by using negative case
analysis. This involves searching for and discussing elements of the data that do not support or
appear to contradict patterns or explanations that are emerging from data analysis (Patton, 1999).
In the context of this study, the researcher sought to identify data attained from the focus group
interviews that did not fit into the patterns and themes that framed the analysis. Analysis of
deviant cases may revise, broaden and confirm the patterns emerging from data analysis. Table
75 illustrates the revisions that occurred before the application of themes to the analysis of each
research question.

180
Table 75 Revision of Themes Based on Negative Case Analysis
Themes Negative Cases (NC) Explanation of NC Adjusted Themes
Theme 1: Positive Feeling about DPLC Implementation
But even though in our department (ELA) we only had three new teachers out of nine, all of us were still doing totally different things and we had a lot of misconceptions about the different phases of close reading.
Negative cases for this theme fall under the umbrella of Theme 2. No revision needed.
Theme 1: Positive Feeling about DPLC Implementation
Theme 2: Concerns with Implementation
I would see like consistency like if we're gonna do it once a month, let's do it once a month. If we're gonna do it once in nine weeks, let's do it once in nine weeks. Like I feel like it's kind of been a little like… it’s been sporadic
The theme was narrowed to use the term “inconsistencies” as more precise language.
Theme 2: Inconsistencies with Implementation
Theme 3: Opportunities for Professional Growth
None found No negative cases were found. This theme encompasses all opportunities for professional growth.
Theme 3: Opportunities for Professional Growth
Theme 4: Teacher Collaboration
We know that's a trustworthy source (other colleagues) who's looking out for the best interest of the teacher and the students. So I think with that aspect it's kind of just improved our school culture, at least amongst the staff.
This theme was broadened to encompass more than collaboration. Multiple facets of support are evident and included through this expanded theme.
Theme 4: Teachers Support Each Other

181
Themes Negative Cases (NC) Explanation of NC Adjusted Themes
Theme 5: Beliefs about Students
None found No negative cases were found. This theme encompasses all beliefs about students
Theme 5: Beliefs about Students
After reviewing transcripts for negative cases of each theme, two revisions emerged.
Theme 2, which was originally labeled as “concerns with implementation” was renamed
“inconsistencies with implementation.” After reviewing all of the concerns which surfaced
regarding issues with implementation of DPLC content, the theme was able to be narrowed to
use the term “inconsistencies” as more precise language. Additionally, Theme 4 was originally
named teacher collaboration. Through the use of negative case analysis this theme was
broadened to encompass all supports that teachers offer each other. This resulted in the title of
Theme 4 becoming Teachers support each other.
Logic Model Analytics
Logic model analytics were applied to develop a conceptual framework for the analysis
of the qualitative data. Based on the established codes, patterns, and themes, the researcher
developed a conceptual framework that illustrated the relationship among the emergent themes
and the dependent and independent variables explored in this study. Figure 1 illustrates this
conceptual framework.
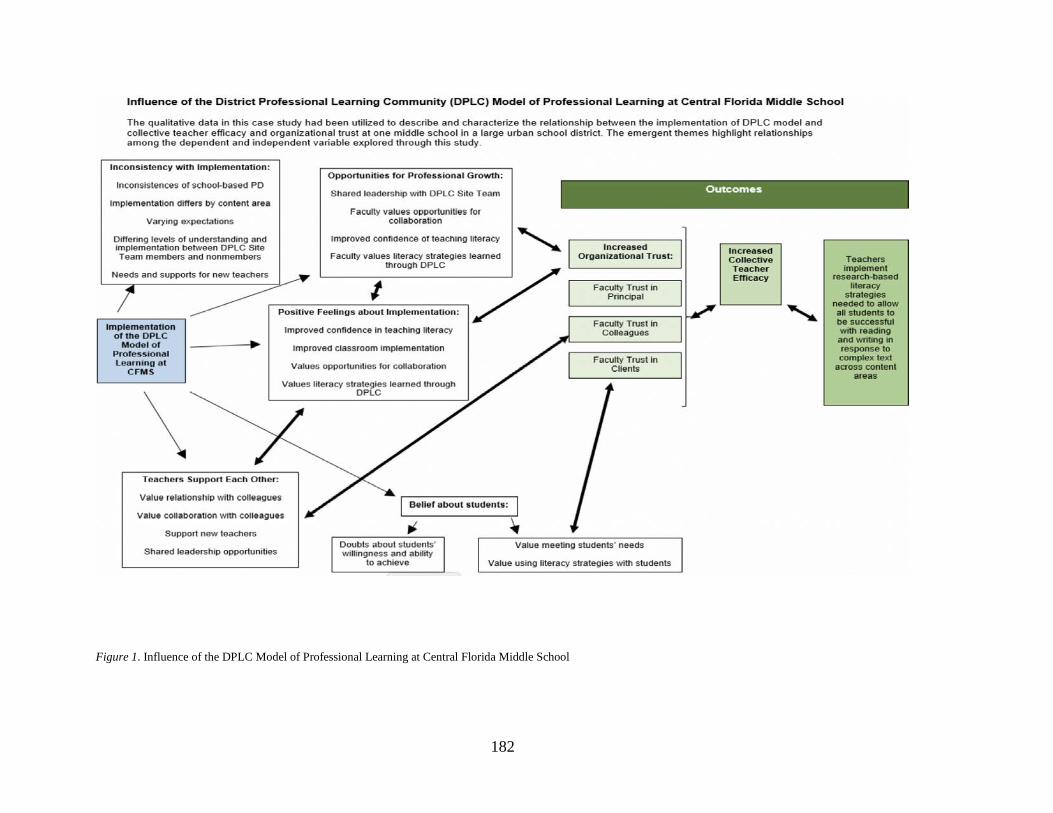
182
Figure 1. Influence of the DPLC Model of Professional Learning at Central Florida Middle School

183
Implementation of the DPLC model of professional learning at Central Florida Middle
School (CFMS) is the entry point of the logic model. The complex chain of influential factors
follow. The five themes identified through the qualitative data by the researcher all stem from
the implementation entry point. Themes that propel implementation show arrows of progression.
Themes and components of themes that are barriers to implementation illustrate a dead end. For
example, Opportunities for Professional Growth continues to move forward, progressing to the
outcomes, as shown by the arrows. However, Inconsistences with Implementation and Doubts
about Students’ Willingness and Ability to Achieve result in a dead end. A series of double-sided
arrows symbolize the symbiotic nature of the connected factors. For example, Improved
Confidence in Teaching Literacy can lead to increased organizational trust. Additionally, the
reverse can be true. This framework also illustrates the reciprocal nature of organizational trust
and collective teacher efficacy. Ultimately, themes surfaced through the qualitative research led
to increased organizational trust, collective teacher efficacy, and implementation of DPLC
learning within classroom instruction.
Synthesis Phase
The synthesis combines data collected from the quantitative phases and the qualitative
phase through a joint data display for each research question. The purpose utilizing joint data
displays was to convey an overall interpretation of results. Credibility techniques utilized were
made transparent, and processes were described to increase the validity and reliability of results.
Each of the following sections links the synthesized data from the quantitative and qualitative
phases in relationship to each research question. Each explanation is accompanied by a related
joint data display.
184
Research Question 1
In what ways and to what extent is collective teacher efficacy influenced by participation in DPLC model of professional learning? Collective teacher efficacy was measured through the use of the CE-Scale, in the
quantitative phase of this study, and descriptive and inferential statistics were used to investigate
Research Question 1. An Analysis of Variance (ANOVA) was utilized to compare the amount of
variance of the dependent variables over the course of three survey administrations. Additional
two-way ANOVAs were used to compare the amount of variance between groups using the
moderator variables: years of teaching experience, subject area taught, gender, and DPLC Site
Team membership. Though the results of these tests did not show statistical significance, there
was an increase of mean for all moderator variables: time, subject area taught, gender, years of
teaching experience, and DPLC Site Team membership.
The qualitative portion of data analysis revealed themes and connected information to
several of the quantitative findings. Specifically, data analyzed from the focus group interview
revealed information that supported the increase of means in the areas of: (a) collective teacher
efficacy increasing over the course of the study; (b) collective teacher efficacy in relationship to
subject area taught; and (c) collective teacher efficacy in relationship to DPLC Site Team
membership.
Findings from the survey and focus group interview analysis were synthesized in order to
present the following conclusions organized by relationship between moderator variable and
collective teacher efficacy. The joint data display presented in Table 76 illustrates this synthesis
of data.

185
Table 76 Joint Data Display of CE-Scale and Focus Group Interviews Resulting in a Synthesis of Data
Dependent Variable
Moderator Variable
Increase in Mean
Supporting Qualitative Data
Synthesis
Collective Teacher Efficacy
Time Increased from May 2018 (n = 28, M = 79.07) to May 2019 (n = 26, M = 84.58).
I think since we're all pretty friendly with each other it's easier to attend a training and listen to the information they're providing because we know that's a trustworthy source who's looking out for the best interest of the teacher and the students. So I think with that aspect it's kind of just improved our school culture, at least amongst the staff. It's not just a one-time training. I think you get better teacher buy-in when you know they're continuously honing in on their practices and getting different trainings and realizing that there are different focuses within each training that they can be used in their classrooms. It's not just something that we expect you to be experts in after one training. You know it's just a learning curve for all of us as well you know that we're all in this together kind of moving forward moving along in a three year process. Yeah, I guess that it's changing the mentality for a lot of teachers [or the expectation] or expectations, yeah. Because it's really working, you know close reading really works.
Teachers reported increase of trust and improved schoolwide culture. Teachers report increase in craft knowledge and skills through DPLC sessions as part of continuous process. Teachers recognize that they are all working towards a common goal. Teachers report appreciation of increased opportunities to collaborate with colleagues.
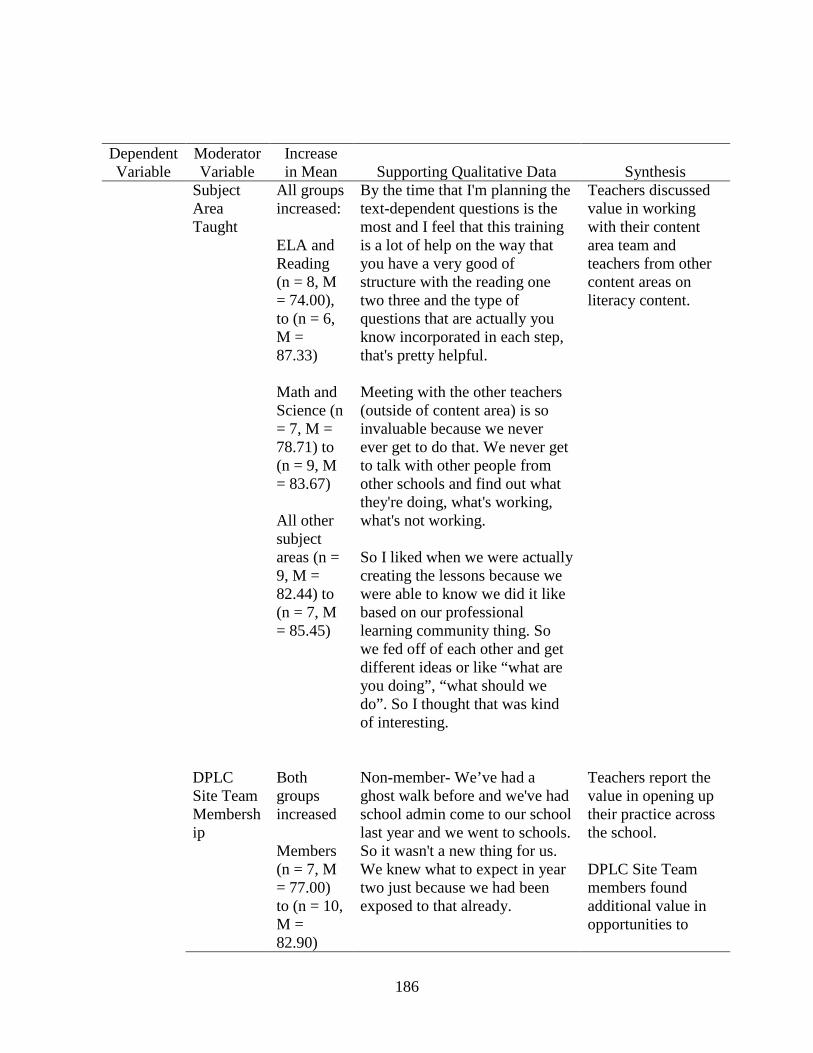
186
Dependent Variable
Moderator Variable
Increase in Mean
Supporting Qualitative Data
Synthesis
Subject Area Taught
All groups increased: ELA and Reading (n = 8, M = 74.00), to (n = 6, M = 87.33) Math and Science (n = 7, M = 78.71) to (n = 9, M = 83.67) All other subject areas (n = 9, M = 82.44) to (n = 7, M = 85.45)
By the time that I'm planning the text-dependent questions is the most and I feel that this training is a lot of help on the way that you have a very good of structure with the reading one two three and the type of questions that are actually you know incorporated in each step, that's pretty helpful. Meeting with the other teachers (outside of content area) is so invaluable because we never ever get to do that. We never get to talk with other people from other schools and find out what they're doing, what's working, what's not working. So I liked when we were actually creating the lessons because we were able to know we did it like based on our professional learning community thing. So we fed off of each other and get different ideas or like “what are you doing”, “what should we do”. So I thought that was kind of interesting.
Teachers discussed value in working with their content area team and teachers from other content areas on literacy content.
DPLC Site Team Membership
Both groups increased Members (n = 7, M = 77.00) to (n = 10, M = 82.90)
Non-member- We’ve had a ghost walk before and we've had school admin come to our school last year and we went to schools. So it wasn't a new thing for us. We knew what to expect in year two just because we had been exposed to that already.
Teachers report the value in opening up their practice across the school. DPLC Site Team members found additional value in opportunities to

187
Dependent Variable
Moderator Variable
Increase in Mean
Supporting Qualitative Data
Synthesis
Non-members one (n = 18, M = 79.22) to (n = 14, M = 87.07)
Member- I think today especially being able to see what other schools have done gave me a lot of ideas for our implementation next year. Just seeing what everyone else has done, what's worked for them, actually talking to some of the people who were at the tables and just seeing what they do, how is it similar, different from us, what could work for us, what would might not work for us.
collaborate with other schools
Table 76 organizes the synthesis of results by dependent variable (collective teacher
efficacy) and moderator variable (time, subject area taught, and DPLC Site Team Membership)
in order to show the connected quantitative and qualitative data that supports the findings of this
study. The following conclusions were made regarding the change of collective teacher efficacy
overtime: (a) teachers reported increase of trust and improved schoolwide culture, (b) teachers
reported increase in craft knowledge and skills through DPLC sessions as part of continuous
process, (c) teachers recognized that they are all working towards a common goal, and (d)
teachers reported appreciation of increased opportunities to collaborate with colleagues.
The following conclusion has been made regarding the relationship between collective
teacher efficacy and subject area taught: Teachers discussed value in working with their content
area team and teachers from other content areas on literacy content.
The following conclusions have been made regarding the relationship between collective
teacher efficacy and DPLC Site Team membership: (a) teachers report the value in opening up
their practice across the school, and (b) DPLC Site Team members found additional value in
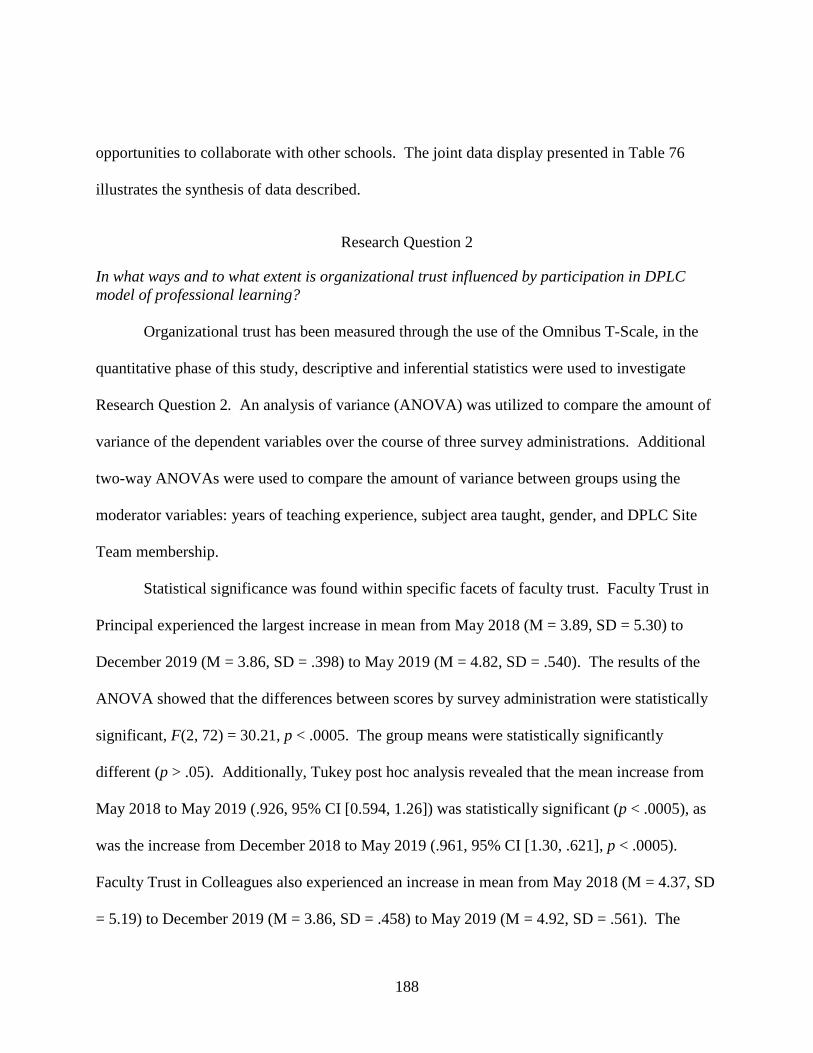
188
opportunities to collaborate with other schools. The joint data display presented in Table 76
illustrates the synthesis of data described.
Research Question 2
In what ways and to what extent is organizational trust influenced by participation in DPLC model of professional learning? Organizational trust has been measured through the use of the Omnibus T-Scale, in the
quantitative phase of this study, descriptive and inferential statistics were used to investigate
Research Question 2. An analysis of variance (ANOVA) was utilized to compare the amount of
variance of the dependent variables over the course of three survey administrations. Additional
two-way ANOVAs were used to compare the amount of variance between groups using the
moderator variables: years of teaching experience, subject area taught, gender, and DPLC Site
Team membership.
Statistical significance was found within specific facets of faculty trust. Faculty Trust in
Principal experienced the largest increase in mean from May 2018 (M = 3.89, SD = 5.30) to
December 2019 (M = 3.86, SD = .398) to May 2019 (M = 4.82, SD = .540). The results of the
ANOVA showed that the differences between scores by survey administration were statistically
significant, F(2, 72) = 30.21, p < .0005. The group means were statistically significantly
different (p > .05). Additionally, Tukey post hoc analysis revealed that the mean increase from
May 2018 to May 2019 (.926, 95% CI [0.594, 1.26]) was statistically significant (p < .0005), as
was the increase from December 2018 to May 2019 (.961, 95% CI [1.30, .621], p < .0005).
Faculty Trust in Colleagues also experienced an increase in mean from May 2018 (M = 4.37, SD
= 5.19) to December 2019 (M = 3.86, SD = .458) to May 2019 (M = 4.92, SD = .561). The

189
results of the AVOVA showed the differences between scores by survey administration were
statistically significant, F(2, 72) = 11.27, p < .0005. The group means were statistically
significantly different (p > .05). Additionally, Tukey post hoc analysis revealed that the mean
increase from May 2018 to May 2019 (.555, 95% CI [0.209, .900]) was statistically significant
(p = .001), as was the increase from December 2018 to May 2019 (.639, 95% CI
[.991, .286], p < .0005). Additionally, there was statistical significance in the area of Faculty
Trust in Colleagues according to subject area taught. Tukey post hoc analysis revealed that
through multiple comparisons of subject area taught, statistical significance was found. The
mean difference between ELA/Reading and Math/Science (.926, 95% CI [0.594, 1.26]) was
statistically significant (p = .015), as was the difference between ELA/Reading and all other
subject areas (Social Studies, Electives, and Exceptional Student Education) (.961, 95% CI
[1.30, .621], p = .001). Though the results of the remaining ANOVA tests did not show
statistical significance, there was an increase of mean for all moderator variables in this study:
time, subject area taught, gender, years of teaching experience, and DPLC Site Team
membership.
The qualitative portion of data analysis revealed themes and connected information to
several of the quantitative findings. Qualitative support was provided for all statistically
significant results as well as select additional areas. Specifically, data analyzed from the focus
group interview revealed information that supported the following quantitative data findings:
Faculty Trust Principal (over time, by subject area taught, by DPLC Site Team membership),
Faculty Trust Colleagues (over time, by subject area taught, by DPLC Site Team membership),
and Faculty Trust Clients (over time).

190
Findings from the survey and focus group interview analysis were synthesized in order to
present the following conclusions organized by facet of faculty trust. The joint data display
presented in Table 77 illustrates this synthesis of data.
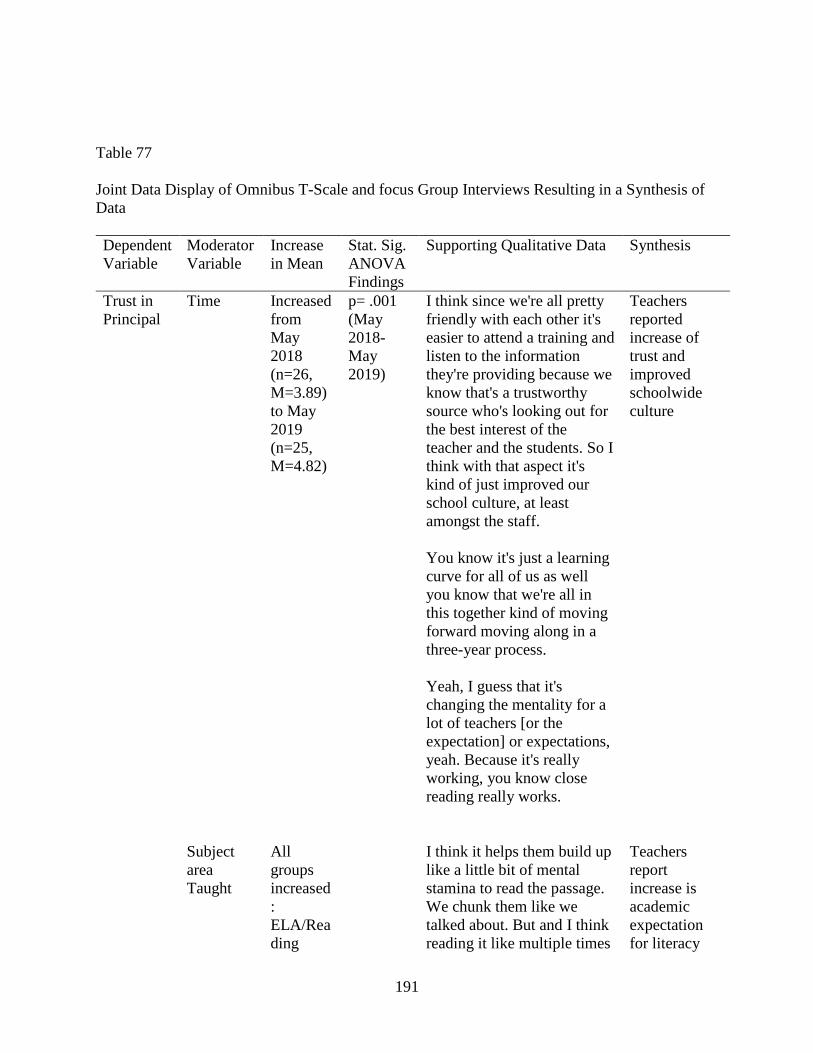
191
Table 77 Joint Data Display of Omnibus T-Scale and focus Group Interviews Resulting in a Synthesis of Data Dependent Variable
Moderator Variable
Increase in Mean
Stat. Sig. ANOVA Findings
Supporting Qualitative Data Synthesis
Trust in Principal
Time Increased from May 2018 (n=26, M=3.89) to May 2019 (n=25, M=4.82)
p= .001 (May 2018- May 2019)
I think since we're all pretty friendly with each other it's easier to attend a training and listen to the information they're providing because we know that's a trustworthy source who's looking out for the best interest of the teacher and the students. So I think with that aspect it's kind of just improved our school culture, at least amongst the staff. You know it's just a learning curve for all of us as well you know that we're all in this together kind of moving forward moving along in a three-year process. Yeah, I guess that it's changing the mentality for a lot of teachers [or the expectation] or expectations, yeah. Because it's really working, you know close reading really works.
Teachers reported increase of trust and improved schoolwide culture
Subject area Taught
All groups increased: ELA/Reading
I think it helps them build up like a little bit of mental stamina to read the passage. We chunk them like we talked about. But and I think reading it like multiple times
Teachers report increase is academic expectation for literacy
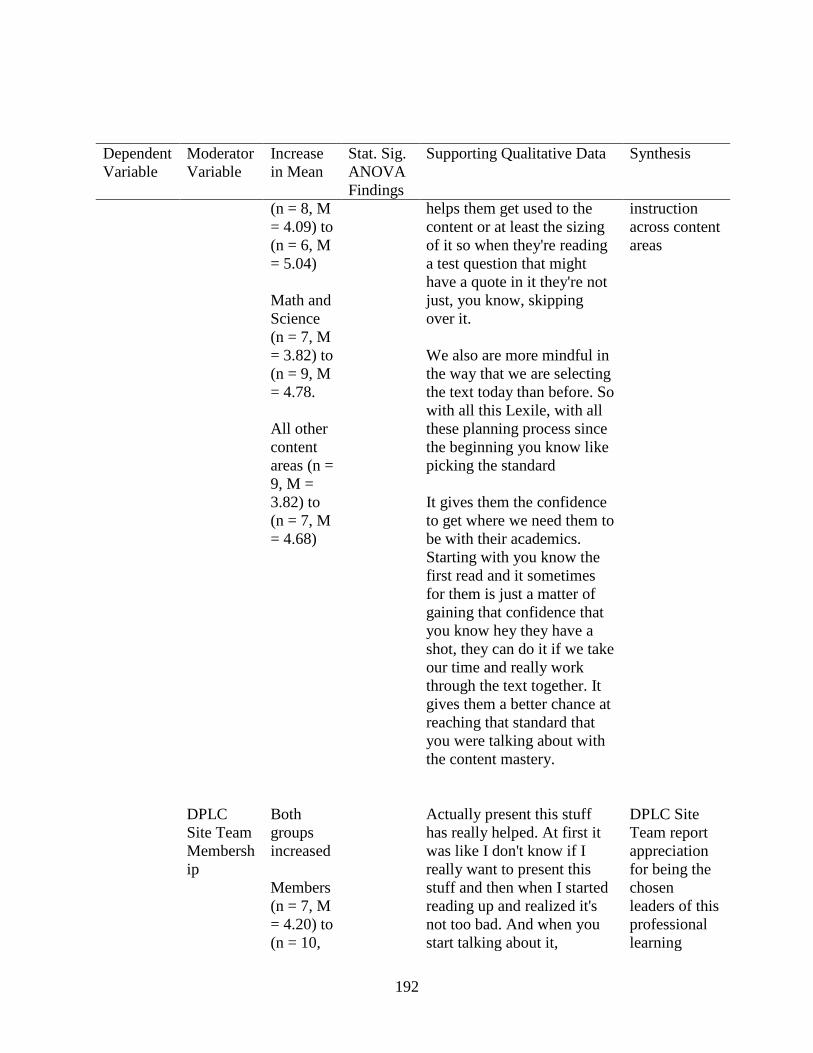
192
Dependent Variable
Moderator Variable
Increase in Mean
Stat. Sig. ANOVA Findings
Supporting Qualitative Data Synthesis
(n = 8, M = 4.09) to (n = 6, M = 5.04) Math and Science (n = 7, M = 3.82) to (n = 9, M = 4.78. All other content areas (n = 9, M = 3.82) to (n = 7, M = 4.68)
helps them get used to the content or at least the sizing of it so when they're reading a test question that might have a quote in it they're not just, you know, skipping over it. We also are more mindful in the way that we are selecting the text today than before. So with all this Lexile, with all these planning process since the beginning you know like picking the standard It gives them the confidence to get where we need them to be with their academics. Starting with you know the first read and it sometimes for them is just a matter of gaining that confidence that you know hey they have a shot, they can do it if we take our time and really work through the text together. It gives them a better chance at reaching that standard that you were talking about with the content mastery.
instruction across content areas
DPLC Site Team Membership
Both groups increased Members (n = 7, M = 4.20) to (n = 10,
Actually present this stuff has really helped. At first it was like I don't know if I really want to present this stuff and then when I started reading up and realized it's not too bad. And when you start talking about it,
DPLC Site Team report appreciation for being the chosen leaders of this professional learning
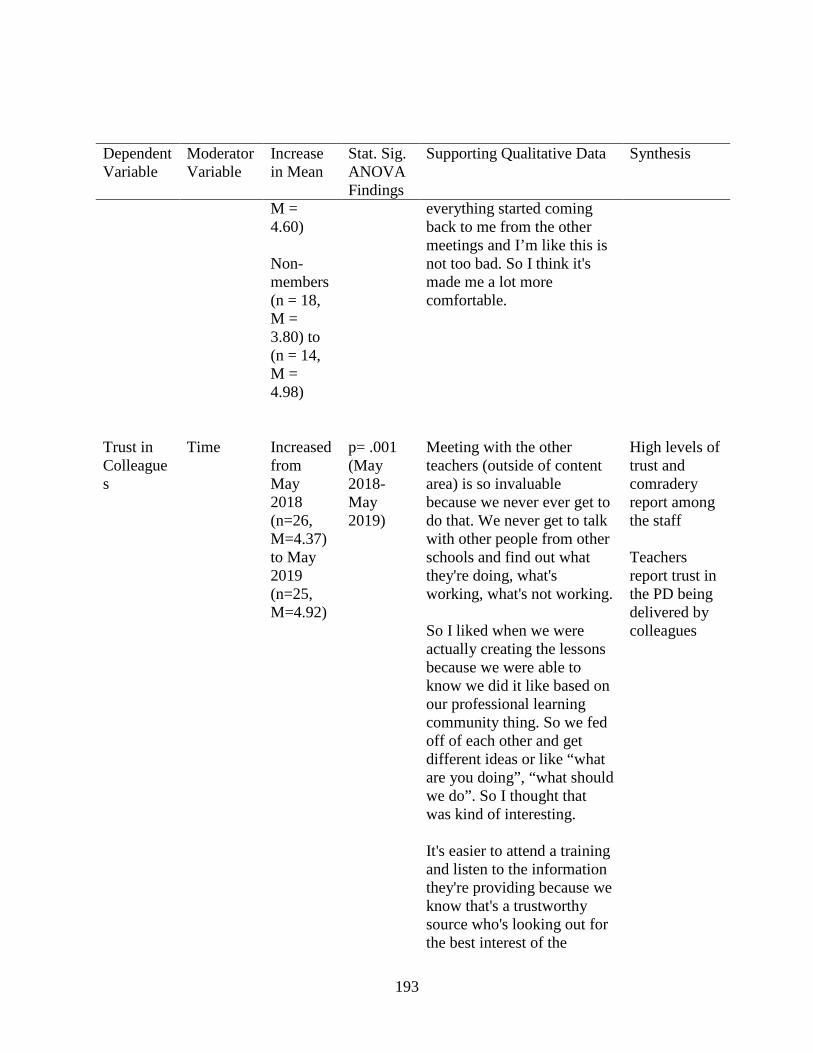
193
Dependent Variable
Moderator Variable
Increase in Mean
Stat. Sig. ANOVA Findings
Supporting Qualitative Data Synthesis
M = 4.60) Non-members (n = 18, M = 3.80) to (n = 14, M = 4.98)
everything started coming back to me from the other meetings and I’m like this is not too bad. So I think it's made me a lot more comfortable.
Trust in Colleagues
Time Increased from May 2018 (n=26, M=4.37) to May 2019 (n=25, M=4.92)
p= .001 (May 2018- May 2019)
Meeting with the other teachers (outside of content area) is so invaluable because we never ever get to do that. We never get to talk with other people from other schools and find out what they're doing, what's working, what's not working. So I liked when we were actually creating the lessons because we were able to know we did it like based on our professional learning community thing. So we fed off of each other and get different ideas or like “what are you doing”, “what should we do”. So I thought that was kind of interesting.
It's easier to attend a training and listen to the information they're providing because we know that's a trustworthy source who's looking out for the best interest of the
High levels of trust and comradery report among the staff Teachers report trust in the PD being delivered by colleagues
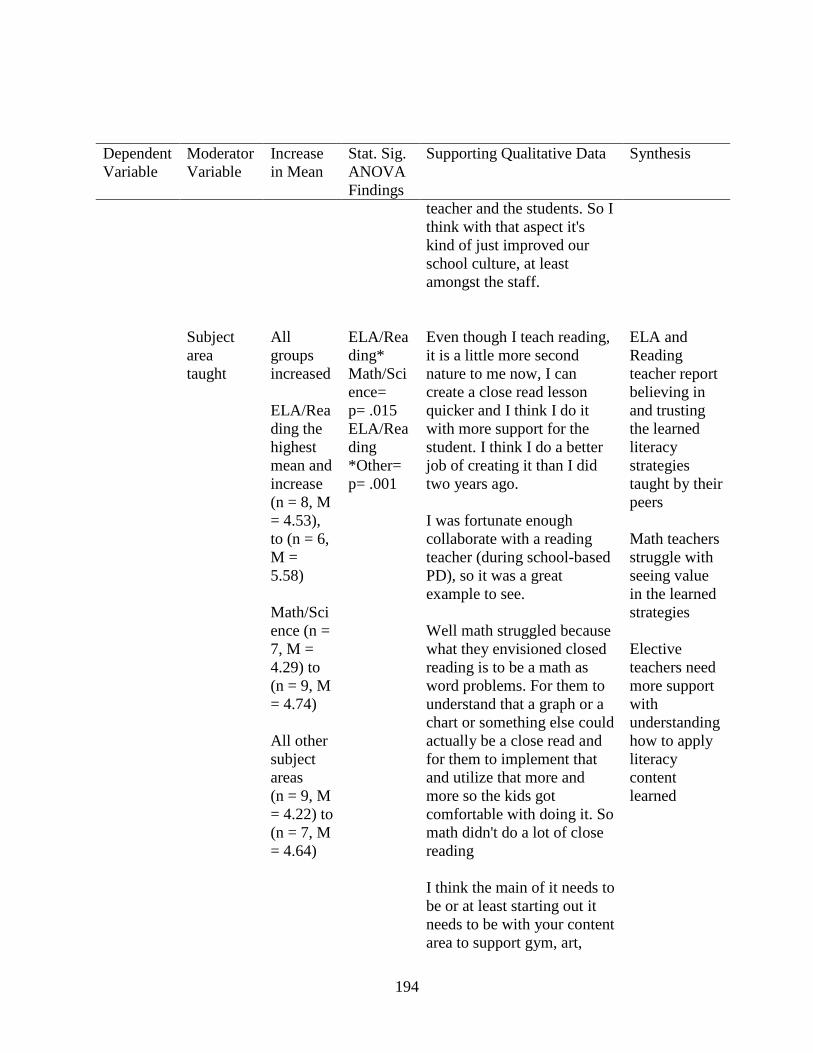
194
Dependent Variable
Moderator Variable
Increase in Mean
Stat. Sig. ANOVA Findings
Supporting Qualitative Data Synthesis
teacher and the students. So I think with that aspect it's kind of just improved our school culture, at least amongst the staff.
Subject area taught
All groups increased ELA/Reading the highest mean and increase (n = 8, M = 4.53), to (n = 6, M = 5.58) Math/Science (n = 7, M = 4.29) to (n = 9, M = 4.74) All other subject areas (n = 9, M = 4.22) to (n = 7, M = 4.64)
ELA/Reading* Math/Science= p= .015 ELA/Reading *Other= p= .001
Even though I teach reading, it is a little more second nature to me now, I can create a close read lesson quicker and I think I do it with more support for the student. I think I do a better job of creating it than I did two years ago. I was fortunate enough collaborate with a reading teacher (during school-based PD), so it was a great example to see. Well math struggled because what they envisioned closed reading is to be a math as word problems. For them to understand that a graph or a chart or something else could actually be a close read and for them to implement that and utilize that more and more so the kids got comfortable with doing it. So math didn't do a lot of close reading I think the main of it needs to be or at least starting out it needs to be with your content area to support gym, art,
ELA and Reading teacher report believing in and trusting the learned literacy strategies taught by their peers Math teachers struggle with seeing value in the learned strategies Elective teachers need more support with understanding how to apply literacy content learned

195
Dependent Variable
Moderator Variable
Increase in Mean
Stat. Sig. ANOVA Findings
Supporting Qualitative Data Synthesis
math, because that's gonna be a little bit harder for those. Yeah, because it's obvious how you do with ELA …So I mean if you're doing a theorem for math, you're writing out each step you know that this you know quantitative, communicative property… So just for meeting the needs of the different content area so what they specifically need in order to be successful.
DPLC Site Team Membership
Both groups increased with high means Members (n = 7, M = 4.29) to (n = 10, M = 4.71) Non-members (n = 18, M = 4.38) to (n = 14, M = 5.06)
We, the people who are on the DPLC… We are pretty good here working together and we're pretty good and open to helping others. So I think if you have a team that is working together and open to help another like she said it's not hard for them to come to us or ask those questions or take advice from us because we seem to be the veterans and we're open to suggestions and I always tell people I'm still growing and learning too so this is all part of a process. Meeting with the other teachers is so invaluable because we never ever get to do that. We never get to talk with other people from other
Teachers in both groups report enjoying collaboration with colleagues DPLC Site team members report trusting each other and working well together Non-members report value in co- creating lessons with each other during PD
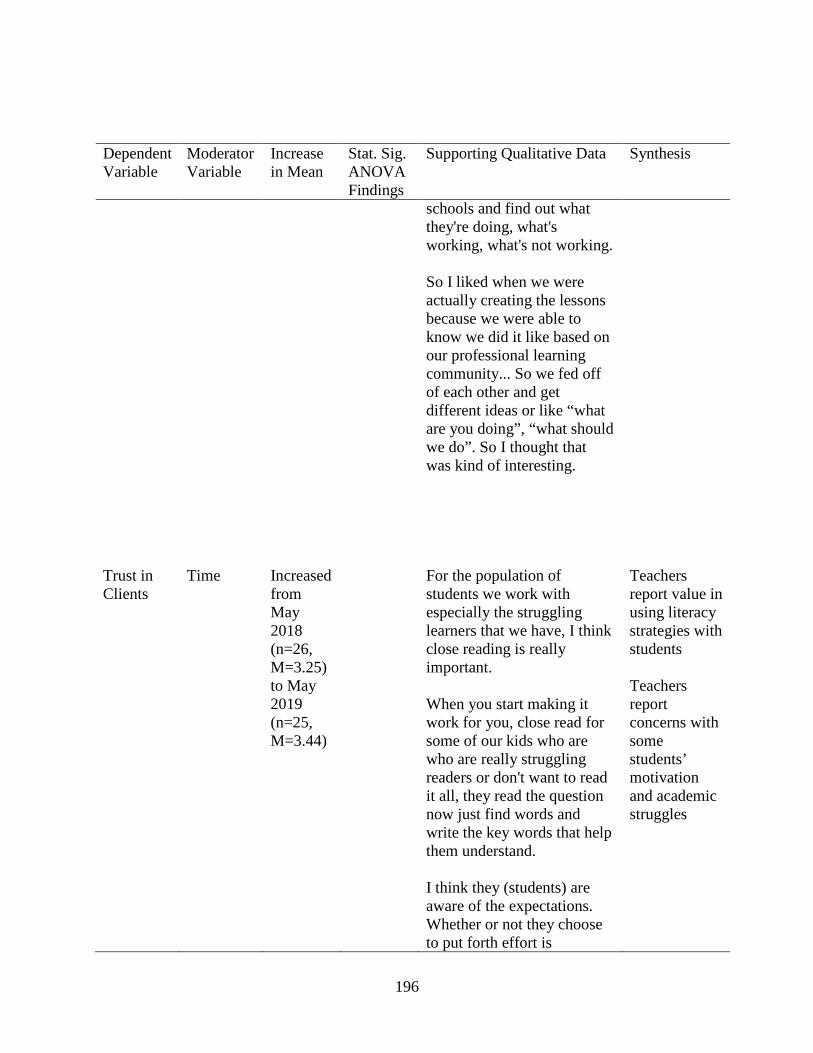
196
Dependent Variable
Moderator Variable
Increase in Mean
Stat. Sig. ANOVA Findings
Supporting Qualitative Data Synthesis
schools and find out what they're doing, what's working, what's not working. So I liked when we were actually creating the lessons because we were able to know we did it like based on our professional learning community... So we fed off of each other and get different ideas or like “what are you doing”, “what should we do”. So I thought that was kind of interesting.
Trust in Clients
Time Increased from May 2018 (n=26, M=3.25) to May 2019 (n=25, M=3.44)
For the population of students we work with especially the struggling learners that we have, I think close reading is really important. When you start making it work for you, close read for some of our kids who are who are really struggling readers or don't want to read it all, they read the question now just find words and write the key words that help them understand. I think they (students) are aware of the expectations. Whether or not they choose to put forth effort is
Teachers report value in using literacy strategies with students Teachers report concerns with some students’ motivation and academic struggles
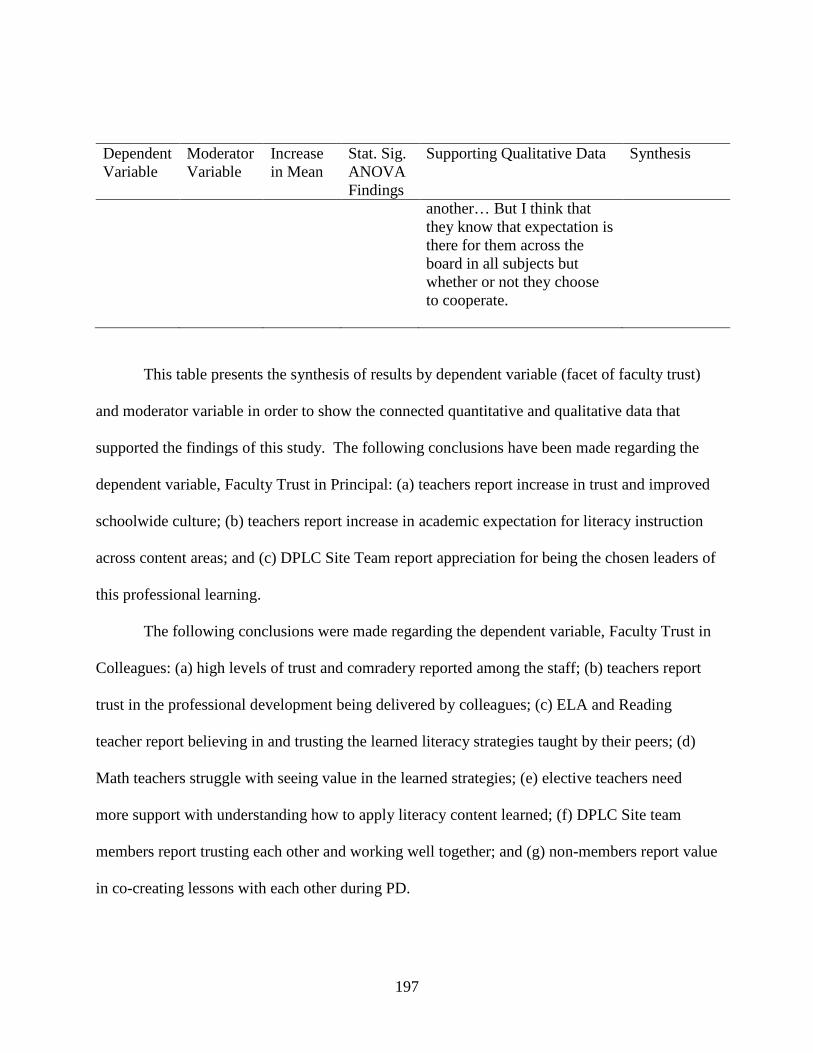
197
Dependent Variable
Moderator Variable
Increase in Mean
Stat. Sig. ANOVA Findings
Supporting Qualitative Data Synthesis
another… But I think that they know that expectation is there for them across the board in all subjects but whether or not they choose to cooperate.
This table presents the synthesis of results by dependent variable (facet of faculty trust)
and moderator variable in order to show the connected quantitative and qualitative data that
supported the findings of this study. The following conclusions have been made regarding the
dependent variable, Faculty Trust in Principal: (a) teachers report increase in trust and improved
schoolwide culture; (b) teachers report increase in academic expectation for literacy instruction
across content areas; and (c) DPLC Site Team report appreciation for being the chosen leaders of
this professional learning.
The following conclusions were made regarding the dependent variable, Faculty Trust in
Colleagues: (a) high levels of trust and comradery reported among the staff; (b) teachers report
trust in the professional development being delivered by colleagues; (c) ELA and Reading
teacher report believing in and trusting the learned literacy strategies taught by their peers; (d)
Math teachers struggle with seeing value in the learned strategies; (e) elective teachers need
more support with understanding how to apply literacy content learned; (f) DPLC Site team
members report trusting each other and working well together; and (g) non-members report value
in co-creating lessons with each other during PD.

198
The following conclusions have been made regarding the dependent variable, Faculty
Trust in Clients: (a) teachers report value in using literacy strategies with students; and (b)
teachers report concerns with some students’ motivation and academic struggles. The joint data
display, presented in Table 77 illustrates the synthesis of data described.
Research Question 3
In what ways and to what extent do teachers perceive that DPLC is accomplishing its goals of improving literacy? Each DPLC item has been measured through the use of Chi-square tests of independence.
In the quantitative phase of this study, descriptive and inferential statistics were used to
investigate Research Question 3 A chi-square test of independence was utilized to determine if a
statistically significant difference existed among the responses to the three survey
administrations for each DPLC survey item. Additional Chi-square tests were utilized to
determine if a statistically significant difference existed for each moderator variable: years of
teaching experience, subject area taught, gender, and DPLC Site Team membership.
Statistical significance was found within specific DPLC items. For item Q52-To what
extent has content from the DPLC sessions impacted your thinking about instruction, there was a
statistically significant difference in distributions between the member and non-members of the
DPLC Site Team (p = .001). In the case of this item, non-members reported a much higher
percentage in the “Impact” category (n = 33, 75% versus n = 9, 35%). However, DPLC site
team members reported a much higher percentage in the “Large Impact” category (n = 16, 62%
versus n = 5, 11%). Likewise, there was a statistically significant difference in distributions
between the two group (p = .001) for item Q53-To what extent has content from the DPLC
199
sessions impacted your thinking about instruction. In the case of this item, non-members
reported a much higher percentage in the “Impact” category (n = 30, 68% versus n = 8, 31%).
However, DPLC site team members reported a much higher percentage in the “Large Impact”
category (n = 16, 62% versus n = 6, 14%). Though the results of the remaining Chi-square tests
did not show statistical significance, there was an increase of frequency and increase of impact
reported for certain moderator variables in this study.
The Qualitative portion of data analysis revealed themes and connected information to
several of the quantitative findings. Qualitative support was provided for all statistically
significant results as well as select additional areas. Specifically, data analyzed from the focus
group interview revealed information that supported the following quantitative data findings:
Q48-Teachers in this school receive quality professional development that impacts instructional
practices (over time, years of teaching experience, DPLC Site Team membership), Q49-
Teachers in this school have the strategies to support literacy in the content area that they teach
(over time, years of teaching experience, DPLC Site Team membership), Q50-This school
fosters a culture of collaboration (over time, DPLC Site Team membership), Q51-Teachers in
this school are given opportunities to be instructional leaders for their peers (DPLC Site Team
membership), Q52-To what extent has content from the DPLC sessions impacted your thinking
about instruction (over time, years of teaching experience, DPLC Site Team membership), and
Q53-To what extent has content from the DPLC sessions impacted instructional practices (over
time, years of teaching experience, subject area taught, DPLC Site Team membership).
200
Findings from the survey and focus group interview analysis have been synthesized in
order to present the following conclusions organized by topic of DPLC survey items. The joint
data display presented in Table 78 illustrates this synthesis of data.

201
Table 78 Joint Data Display of DPLC Survey Items and Qualitative Focus Group Interviews Resulting in a Synthesis of Data
Dependent
Variable
Moderator
Variable
Frequencies
from Crosstabulati
on
Stat. Sig. Chi-
Square Finding
s
Supporting Qualitative Data
Synthesis of Results
Q48- Teachers in this school receive quality professional development that impacts instructional practices
Time Percentage of “agree” increased over the three survey administrations (n = 19, 73% to n = 22, 88%).
So I liked when we were actually creating the lessons because we were able to know we did it like based on our professional learning community... So we fed off of each other and get different ideas or like “what are you doing”, “what should we do”. So I thought that was kind of interesting. One reason I think that training was so beneficial to teachers was that it was stuff that they could take back to the classroom naturally and use you know modeling academic conversation strategies in the training.
Teachers report valuable DPLC related school-based PD including: Co-creating lessons Learning strategies that can be utilized in the classroom immediately Visiting other teachers’ classrooms
Years of teaching experience
As the years of experience increased, so did participant
It's easier to attend a training and listen to the information they're providing because we know that's a
DPLC Site members report PD being well received by veteran teachers.

202
Dependent
Variable
Moderator
Variable
Frequencies
from Crosstabulati
on
Stat. Sig. Chi-
Square Finding
s
Supporting Qualitative Data
Synthesis of Results
agreement to the statement (n = 17, 74% versus n = 22, 82% versus n = 18, 86%).
trustworthy source who's looking out for the best interest of the teacher and the students This whole process has been you know allowing me to be more mindful about the different steps that I need to be taking care when I am planning and when I am delivering instructions in class (veteran teacher)
Veteran teachers report value in content learned during DPLC related PD.
DPLC Site Team Membership
A higher percentage of non-members agreed with the statement (n = 36, 82% versus n = 20, 77%).
I always like to use with the students all the scaffolding techniques. So I got the students to go over summarizing the paragraph or chunking the texts. We're looking for vocabulary, academic vocabulary and of course text-dependent questions. But I felt with this training, I have more structure you know regarding close reading as an instructional tool.
Non-members of the DPLC Site Team report DPLC related PD being valuable and being implemented during instruction
Q49- Teachers in this school have the
Time Percentage of “agree” increased over the three survey
I've got kids are struggling with it anyhow so I've already trained them in one way (to annotate text). When
Teachers report learning and using the following literacy
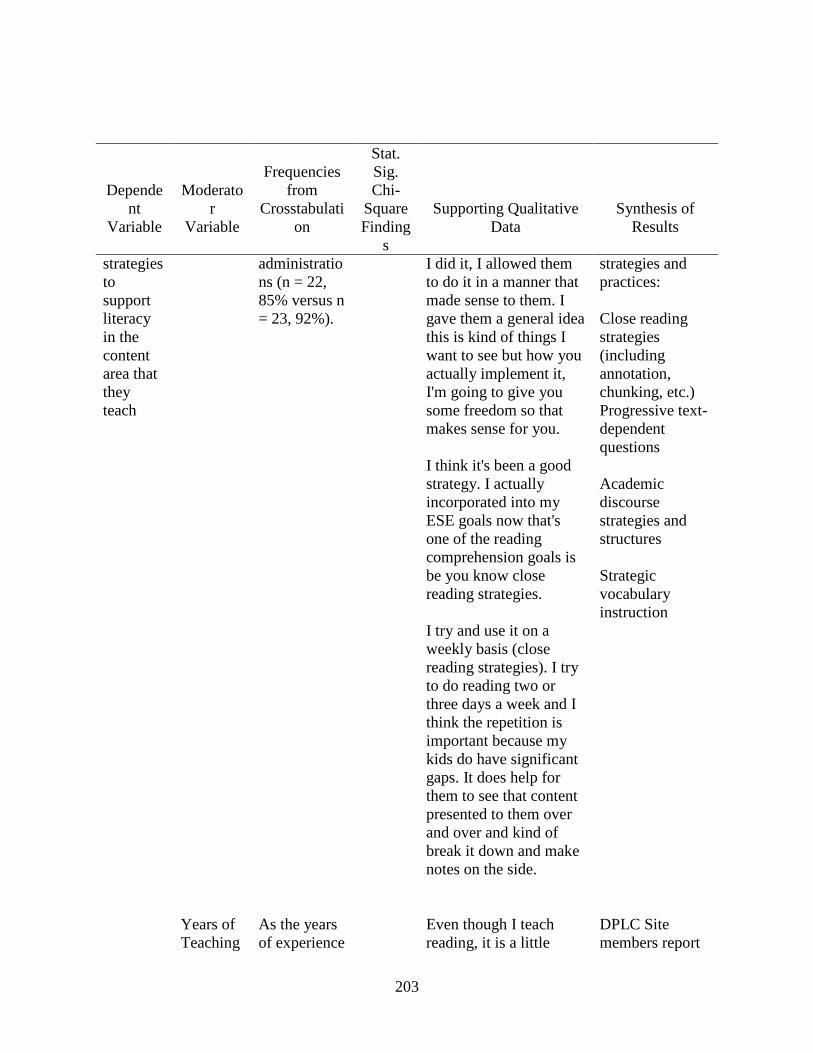
203
Dependent
Variable
Moderator
Variable
Frequencies
from Crosstabulati
on
Stat. Sig. Chi-
Square Finding
s
Supporting Qualitative Data
Synthesis of Results
strategies to support literacy in the content area that they teach
administrations (n = 22, 85% versus n = 23, 92%).
I did it, I allowed them to do it in a manner that made sense to them. I gave them a general idea this is kind of things I want to see but how you actually implement it, I'm going to give you some freedom so that makes sense for you. I think it's been a good strategy. I actually incorporated into my ESE goals now that's one of the reading comprehension goals is be you know close reading strategies. I try and use it on a weekly basis (close reading strategies). I try to do reading two or three days a week and I think the repetition is important because my kids do have significant gaps. It does help for them to see that content presented to them over and over and kind of break it down and make notes on the side.
strategies and practices: Close reading strategies (including annotation, chunking, etc.) Progressive text-dependent questions Academic discourse strategies and structures Strategic vocabulary instruction
Years of Teaching
As the years of experience
Even though I teach reading, it is a little
DPLC Site members report
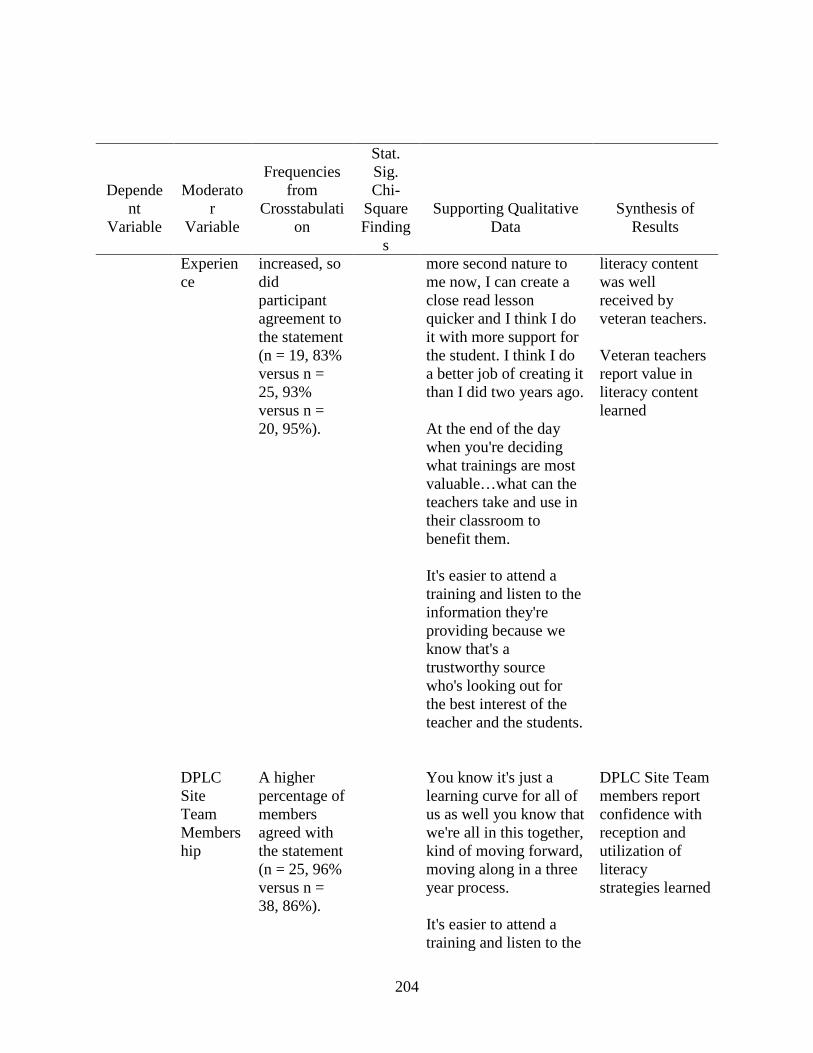
204
Dependent
Variable
Moderator
Variable
Frequencies
from Crosstabulati
on
Stat. Sig. Chi-
Square Finding
s
Supporting Qualitative Data
Synthesis of Results
Experience
increased, so did participant agreement to the statement (n = 19, 83% versus n = 25, 93% versus n = 20, 95%).
more second nature to me now, I can create a close read lesson quicker and I think I do it with more support for the student. I think I do a better job of creating it than I did two years ago. At the end of the day when you're deciding what trainings are most valuable…what can the teachers take and use in their classroom to benefit them. It's easier to attend a training and listen to the information they're providing because we know that's a trustworthy source who's looking out for the best interest of the teacher and the students.
literacy content was well received by veteran teachers. Veteran teachers report value in literacy content learned
DPLC Site Team Membership
A higher percentage of members agreed with the statement (n = 25, 96% versus n = 38, 86%).
You know it's just a learning curve for all of us as well you know that we're all in this together, kind of moving forward, moving along in a three year process. It's easier to attend a training and listen to the
DPLC Site Team members report confidence with reception and utilization of literacy strategies learned
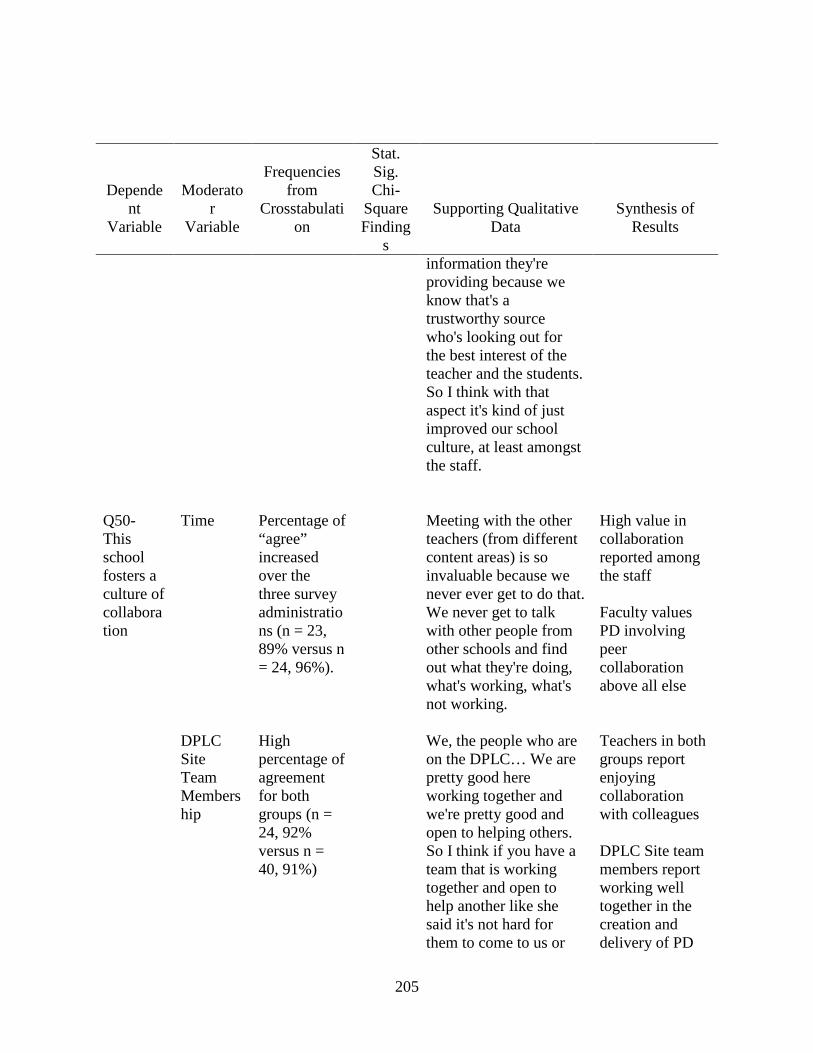
205
Dependent
Variable
Moderator
Variable
Frequencies
from Crosstabulati
on
Stat. Sig. Chi-
Square Finding
s
Supporting Qualitative Data
Synthesis of Results
information they're providing because we know that's a trustworthy source who's looking out for the best interest of the teacher and the students. So I think with that aspect it's kind of just improved our school culture, at least amongst the staff.
Q50- This school fosters a culture of collaboration
Time Percentage of “agree” increased over the three survey administrations (n = 23, 89% versus n = 24, 96%).
Meeting with the other teachers (from different content areas) is so invaluable because we never ever get to do that. We never get to talk with other people from other schools and find out what they're doing, what's working, what's not working.
High value in collaboration reported among the staff Faculty values PD involving peer collaboration above all else
DPLC Site Team Membership
High percentage of agreement for both groups (n = 24, 92% versus n = 40, 91%)
We, the people who are on the DPLC… We are pretty good here working together and we're pretty good and open to helping others. So I think if you have a team that is working together and open to help another like she said it's not hard for them to come to us or
Teachers in both groups report enjoying collaboration with colleagues DPLC Site team members report working well together in the creation and delivery of PD

206
Dependent
Variable
Moderator
Variable
Frequencies
from Crosstabulati
on
Stat. Sig. Chi-
Square Finding
s
Supporting Qualitative Data
Synthesis of Results
ask those questions or take advice from us because we seem to be the veterans and we're open to suggestions and I always tell people I'm still growing and learning too so this is all part of a process. So I liked when we were actually creating the lessons because we were able to like at least like I know we did it like based on our professional learning community thing. So we were like feed off of each other and get different ideas or like what are you doing, what should we do. I was fortunate enough collaborate with a reading teacher (during school-based PD), so it was a great example to see.
Non-members report valuing the creation lessons with each other during PD
Q51- Teachers in this school are given opportuni
DPLC Site Team Membership
A higher percentage of members agreed with the statement (n = 23, 89%
I'm happy to have been a part of this (member of DPLC Site Team) because I probably would have been one of those teachers at my
Members value opportunities that they have been give to be instructional leaders for their

207
Dependent
Variable
Moderator
Variable
Frequencies
from Crosstabulati
on
Stat. Sig. Chi-
Square Finding
s
Supporting Qualitative Data
Synthesis of Results
ties to be instructional leaders for their peers.
versus n = 37, 84%).
school wondering what is going…I like being able to actually present this stuff…when I started reading up and like it's not too bad. And when you start talking about it I’m like everything started coming back to me from the other meetings…So I think it's made me a lot more comfortable.
peers during DPLC
Q52- To what extent has content from the DPLC sessions impacted your thinking about instruction.
Time Level of impact increased over the three survey administrations: Impact (n = 15, 58% versus n = 15, 60%) Large Impact (n = 6, 23% versus n = 9, 36%)
I think that is helpful because it is a strategy you need for everything when you go out into the later life. Even if you don't go to college you still need to be able to read a cell phone contract and get the main idea and figure out how that's going to affect you make all the connections. So I think it's important that they see we're reading things isn't just for ELA, it's you know to get a better understanding. Yeah, it's real life.
Teachers report a positive shift in thinking about literacy instruction based on what was learned through DPLC
Years of Teaching
Highest impact with teachers in
We are pretty good here working together and we're pretty good and
Veteran teachers interviewed report high value
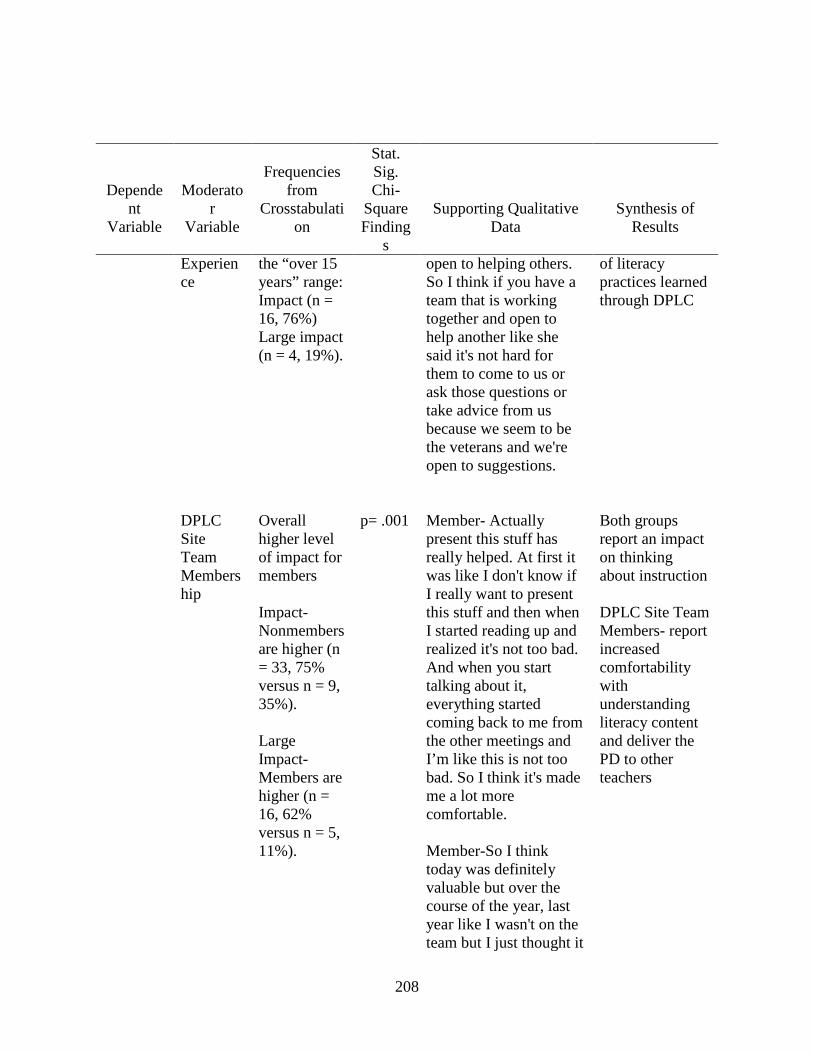
208
Dependent
Variable
Moderator
Variable
Frequencies
from Crosstabulati
on
Stat. Sig. Chi-
Square Finding
s
Supporting Qualitative Data
Synthesis of Results
Experience
the “over 15 years” range: Impact (n = 16, 76%) Large impact (n = 4, 19%).
open to helping others. So I think if you have a team that is working together and open to help another like she said it's not hard for them to come to us or ask those questions or take advice from us because we seem to be the veterans and we're open to suggestions.
of literacy practices learned through DPLC
DPLC Site Team Membership
Overall higher level of impact for members Impact- Nonmembers are higher (n = 33, 75% versus n = 9, 35%). Large Impact- Members are higher (n = 16, 62% versus n = 5, 11%).
p= .001 Member- Actually present this stuff has really helped. At first it was like I don't know if I really want to present this stuff and then when I started reading up and realized it's not too bad. And when you start talking about it, everything started coming back to me from the other meetings and I’m like this is not too bad. So I think it's made me a lot more comfortable. Member-So I think today was definitely valuable but over the course of the year, last year like I wasn't on the team but I just thought it
Both groups report an impact on thinking about instruction DPLC Site Team Members- report increased comfortability with understanding literacy content and deliver the PD to other teachers

209
Dependent
Variable
Moderator
Variable
Frequencies
from Crosstabulati
on
Stat. Sig. Chi-
Square Finding
s
Supporting Qualitative Data
Synthesis of Results
was all overwhelming. Like I knew what close reading and I study reading. I'm like why are we making it over complicated. But the training is being able to break it down for myself and then also for people that we work with in our department was very useful for me.
Q53- To what extent has content from the DPLC sessions impacted instructional practices.
Time Level of impact increased over the three survey administrations: Impact- (n = 13, 50% versus n = 13, 52%) Large Impact- (n = 7, 27% versus n = 9, 36%).
This is my first year so I can't really compare it to anything. But like I think the more we do it obviously the more they get the hang of it and also I've been getting better at it as well over time. But I guess the next year I'll be better and better. I mean each year it just gets better. For the population of students we work with especially the struggling learners that we have, I think close reading is really important. Because it gives them the confidence to get where we need them to be with their academics… It gives
Teachers report implementation and positive impact on students based on content learned through DPLC

210
Dependent
Variable
Moderator
Variable
Frequencies
from Crosstabulati
on
Stat. Sig. Chi-
Square Finding
s
Supporting Qualitative Data
Synthesis of Results
them a better chance at reaching that standard that you were talking about with the content mastery. I think it really is helping them (students) with their writing because they're now comfortable and familiar with marking the text, they can go back and go okay so that question address what you've marked.
Years of Teaching Experience
Highest impact with teachers in the “over 15 years” range: Impact - (n = 14, 67%) Large impact (n = 5, 24%).
In the past selecting text …I wanted to make sure it was high interest and that was the most important. Its high interest and I can align questions to it. But now I think I've taken in more into consideration the complexity of the text. They (students) were sitting there writing out their process, writing down notes, important plot parts of the stories and things like that. Some we're using the tools that are on the program for them to
Veteran teachers report high classroom implementation of literacy practices learned through DPLC
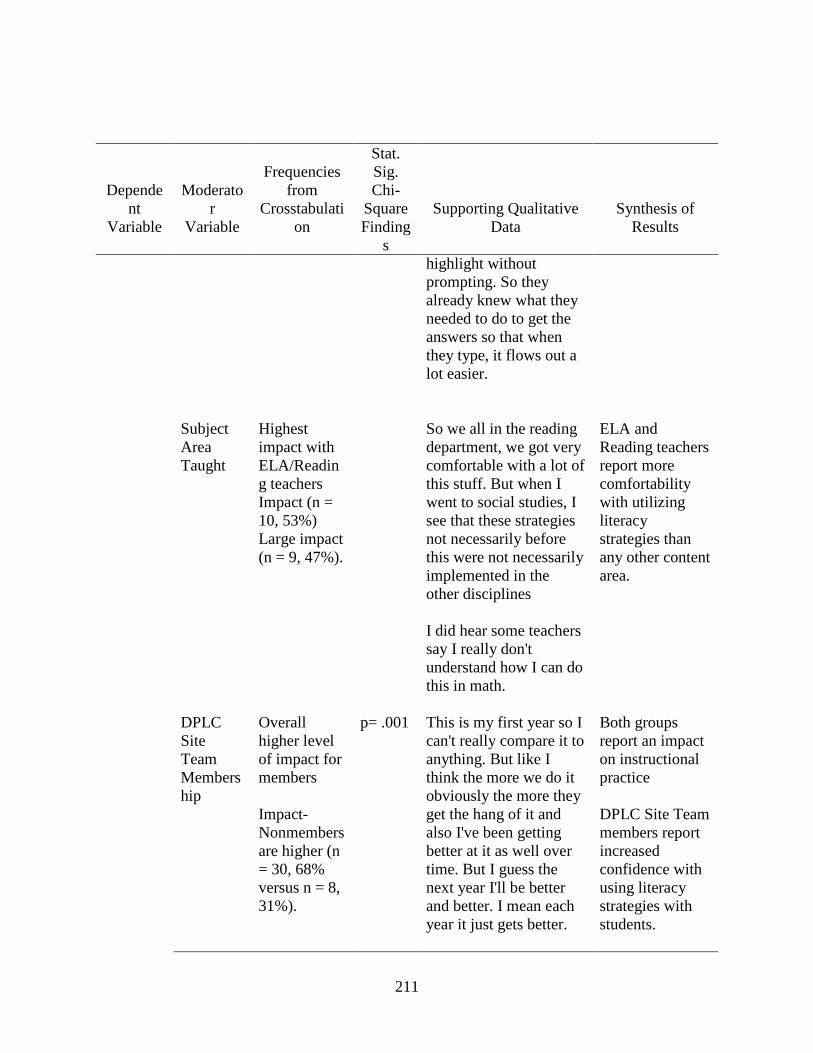
211
Dependent
Variable
Moderator
Variable
Frequencies
from Crosstabulati
on
Stat. Sig. Chi-
Square Finding
s
Supporting Qualitative Data
Synthesis of Results
highlight without prompting. So they already knew what they needed to do to get the answers so that when they type, it flows out a lot easier.
Subject Area Taught
Highest impact with ELA/Reading teachers Impact (n = 10, 53%) Large impact (n = 9, 47%).
So we all in the reading department, we got very comfortable with a lot of this stuff. But when I went to social studies, I see that these strategies not necessarily before this were not necessarily implemented in the other disciplines I did hear some teachers say I really don't understand how I can do this in math.
ELA and Reading teachers report more comfortability with utilizing literacy strategies than any other content area.
DPLC Site Team Membership
Overall higher level of impact for members Impact- Nonmembers are higher (n = 30, 68% versus n = 8, 31%).
p= .001 This is my first year so I can't really compare it to anything. But like I think the more we do it obviously the more they get the hang of it and also I've been getting better at it as well over time. But I guess the next year I'll be better and better. I mean each year it just gets better.
Both groups report an impact on instructional practice DPLC Site Team members report increased confidence with using literacy strategies with students.

212
Dependent
Variable
Moderator
Variable
Frequencies
from Crosstabulati
on
Stat. Sig. Chi-
Square Finding
s
Supporting Qualitative Data
Synthesis of Results
Large Impact- Members are higher (n = 16, 62% versus n = 6, 14%)
But also I think leading by example. So whether it's a ghost walk whether it's opening up our classrooms in the past for teachers to come in and see so what by making ourselves vulnerable and opening up our practice and realizing that you know hey we're not perfect, we're learning along the way as well. I think that says a lot for new teachers to make them more comfortable and get better by and with all teachers really. Yes, interactions (with other schools) are pretty helpful, that's my opinion. So when we see what others are displaying so you have a better idea what you can do for next school year. So you're gonna be improving your practices in class. Especially if you're looking at what the feeders are for your school are displaying. So it gives you an idea of the path you can be working on so that
DPLC Site Team members report a deeper understanding of the purpose of learned literacy practices and schoolwide implementation and longitudinal impact.

213
Dependent
Variable
Moderator
Variable
Frequencies
from Crosstabulati
on
Stat. Sig. Chi-
Square Finding
s
Supporting Qualitative Data
Synthesis of Results
you're gonna be improving students’ skills.
Table 78 is as follows: This table displays the synthesis of results organized by dependent
variable (DPLC survey item) and moderator variable in order to show the connected quantitative
and qualitative data that supported the findings of this study. The following conclusions have
been made regarding the dependent variable, Q48-Teachers in this school receive quality
professional development that impacts instructional practices: (a) teachers reported valuable
DPLC related school-based PD including: co-creating lessons, learning strategies that can be
utilized in the classroom immediately, and visiting other teachers’ classrooms; (b) DPLC Site
members reported PD being well received by veteran teachers; (c)veteran teachers reported value
in content learned during DPLC related professional development; and (d) non-members of the
DPLC Site Team report DPLC related PD being valuable and being implemented during
instruction.
The following conclusions have been made regarding the dependent variable, Q49-
Teachers in this school have the strategies to support literacy in the content area that they teach:
(a) teachers report learning and using the following literacy strategies and practices: close
reading strategies (including annotation, chunking, etc.), progressive text-dependent questions,
academic discourse strategies and structures, and strategic vocabulary instruction; and (b) DPLC

214
Site Team members report confidence with reception and utilization of literacy strategies
learned.
The following conclusions have been made regarding the dependent variable, Q50-This
school fosters a culture of collaboration: (a) high value in collaboration was reported among the
teachers; (b) faculty valued PD involving peer collaboration above all else; (c) DPLC Site team
members reported trusting each other and working well together; and (d) non-members reported
value in co-creating lessons with each other during PD.
The following conclusion has been made regarding the dependent variable, Q51-
Teachers in this school are given opportunities to be instructional leaders for their peers: DPLC
Site Team members valued opportunities that they were given to be instructional leaders for their
peers.
The following conclusions were made regarding the dependent variable, Q52-To what
extent has content from the DPLC sessions impacted your thinking about instruction? (a)
teachers reported a positive shift in thinking about literacy instruction based on what was learned
through DPLC; (b) veteran teachers interviewed reported high value and classroom
implementation of literacy practices learned through DPLC; and (c) DPLC Site Team Members-
report increased comfortability with understanding literacy content and deliver the PD to other
teachers.
The following conclusions have been made regarding the dependent variable, Q53-To
what extent has content from the DPLC sessions impacted your instructional practices: (a)
teachers reported implementation and positive impact on students based on content learned
through DPLC; (b) ELA and Reading teachers reported more comfort with utilizing literacy

215
strategies than any other content area; (c) DPLC Site Team members reported increased
confidence with using literacy strategies with students; and (d) DPLC Site Team members
reported a deeper understanding of the purpose of learned literacy practices and schoolwide
implementation and longitudinal impact.
Credibility Techniques
Certain credibility techniques have been utilized throughout qualitative data analysis to
increase validity and reliability of the results. This section contains a discussion of triangulation
and negative case analysis strategies used in the study.
Triangulation
The researcher used triangulation, a credibility technique designed to seek convergence
and corroboration by comparing findings from qualitative data with quantitative data (Creswell
& Plano Clark, 2018). In the context of this study, the researcher compared findings from the
quantitative survey subsets to data obtained in the focus group interviews. Triangulation has
been addressed within the analysis throughout the synthesis section. The use of joint data
displays signified the depth of triangulation that occurred for each research question.
Negative Case Analysis
The researcher minimized validity and reliability threats by using the process of negative
case analysis. This involved searching for and discussing elements of the data that did not
support or appear to contradict patterns or explanations that were emerging from data analysis
(Patton, 1999). Similar to the process used in the qualitative section, the researcher analyzed
quantitative and qualitative data sets, searching for deviant cases. The discovery of such cases
may result in the revision of conclusion drawn about the data. In the context of this study, the

216
researcher sought data attained from the survey results and focus group interviews that did not
concur with synthesis of the results presented. Table 79 illustrates the revisions that occurred
before the application of the final synthesis of findings for each research question.
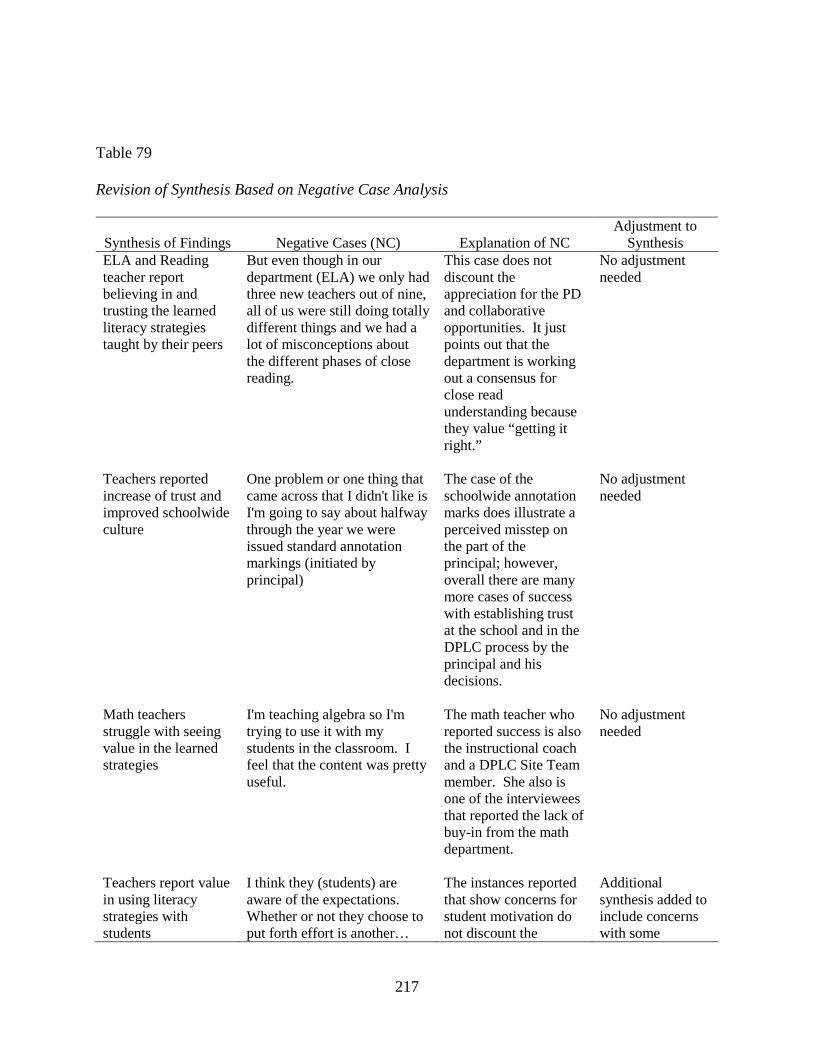
217
Table 79 Revision of Synthesis Based on Negative Case Analysis
Synthesis of Findings
Negative Cases (NC)
Explanation of NC
Adjustment to Synthesis
ELA and Reading teacher report believing in and trusting the learned literacy strategies taught by their peers
But even though in our department (ELA) we only had three new teachers out of nine, all of us were still doing totally different things and we had a lot of misconceptions about the different phases of close reading.
This case does not discount the appreciation for the PD and collaborative opportunities. It just points out that the department is working out a consensus for close read understanding because they value “getting it right.”
No adjustment needed
Teachers reported increase of trust and improved schoolwide culture
One problem or one thing that came across that I didn't like is I'm going to say about halfway through the year we were issued standard annotation markings (initiated by principal)
The case of the schoolwide annotation marks does illustrate a perceived misstep on the part of the principal; however, overall there are many more cases of success with establishing trust at the school and in the DPLC process by the principal and his decisions.
No adjustment needed
Math teachers struggle with seeing value in the learned strategies
I'm teaching algebra so I'm trying to use it with my students in the classroom. I feel that the content was pretty useful.
The math teacher who reported success is also the instructional coach and a DPLC Site Team member. She also is one of the interviewees that reported the lack of buy-in from the math department.
No adjustment needed
Teachers report value in using literacy strategies with students
I think they (students) are aware of the expectations. Whether or not they choose to put forth effort is another…
The instances reported that show concerns for student motivation do not discount the
Additional synthesis added to include concerns with some
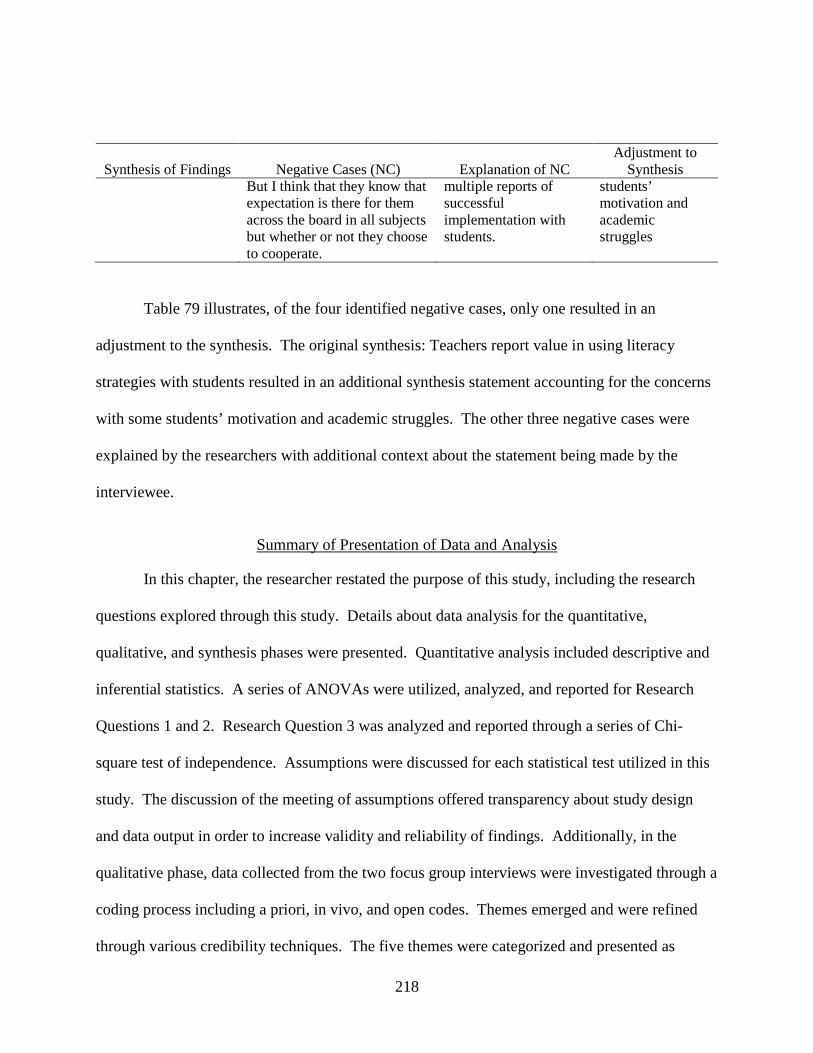
218
Synthesis of Findings
Negative Cases (NC)
Explanation of NC
Adjustment to Synthesis
But I think that they know that expectation is there for them across the board in all subjects but whether or not they choose to cooperate.
multiple reports of successful implementation with students.
students’ motivation and academic struggles
Table 79 illustrates, of the four identified negative cases, only one resulted in an
adjustment to the synthesis. The original synthesis: Teachers report value in using literacy
strategies with students resulted in an additional synthesis statement accounting for the concerns
with some students’ motivation and academic struggles. The other three negative cases were
explained by the researchers with additional context about the statement being made by the
interviewee.
Summary of Presentation of Data and Analysis
In this chapter, the researcher restated the purpose of this study, including the research
questions explored through this study. Details about data analysis for the quantitative,
qualitative, and synthesis phases were presented. Quantitative analysis included descriptive and
inferential statistics. A series of ANOVAs were utilized, analyzed, and reported for Research
Questions 1 and 2. Research Question 3 was analyzed and reported through a series of Chi-
square test of independence. Assumptions were discussed for each statistical test utilized in this
study. The discussion of the meeting of assumptions offered transparency about study design
and data output in order to increase validity and reliability of findings. Additionally, in the
qualitative phase, data collected from the two focus group interviews were investigated through a
coding process including a priori, in vivo, and open codes. Themes emerged and were refined
through various credibility techniques. The five themes were categorized and presented as

219
applicable for each research question. Finally, the researcher merged quantitative and qualitative
findings through joint data displays. Synthesized analyses were presented for each research
question. Credibility techniques utilized in the synthesis phase also offered strengthened validity
and reliability to findings.
220
CHAPTER 5 SUMMARY, DISCUSSION, AND CONCLUSIONS
Introduction
This discussion chapter was organized in five major sections: Summary of Study,
Discussion of Findings, Implications for Practice, Recommendations for Further Research, and
Conclusions in the Study. The Summary of Study section provides a restatement of the purpose
of the study, problem, and research questions being addressed. Furthermore, a brief review of
the methodology is also discussed in this section, including sampling methods, instrumentation,
and data collection and analysis.
The Discussion of Findings section presents an analysis and interpretation of findings.
This section is organized by research question. Each research question is addressed including
interpretations connected the data, extent literature, and theoretical framework. The third major
section, Implications for Practice, suggests how the results of this study are relevant for the field
of education. Specifically, implications are provided for district and school leaders.
The Recommendations for Further Research section discusses the value that this study
offers in this field of research, illustrating how it responds to gaps in the literature. Moreover,
this section contains suggestions for how the research can be further explored and extended
beyond that conducted in this study. Finally, the Conclusions of the Study section provides
closure to the entire study. This section presents conclusions about the research questions
supported by the quantitative and qualitative data. This section is comprehensive and provides a
big picture of the purpose and findings of this research project.
221
Summary of the Study
Researchers have revealed that teachers often do not implement research-based practices
acquired through professional development [PD] (Darling-Hammond et al., 2017; Joyce &
Showers, 2002). Putting PD into practice through classroom implementation has proven to be a
topic worthy of exploration; and researchers and practitioners have continued to investigate the
“why” behind the barriers that impede that utilization of acquired professional learning. Lack of
organizational trust and collective teacher efficacy are likely barriers for ownership of research-
based literacy practices (Brewster & Railsbeck, 2003; Brinson & Steiner, 2007; Goddard et al.,
2004; Supovitz & Christman, 2003).
This study was designed to investigate the District Professional Learning Community
(DPLC) model of professional development during years one and two of implementation in a
large urban school district. DPLC uses a distributed leadership approach to deliver cross-content
area literacy strategies to all teachers across the school district. In addition to the improvement
of literacy instruction, the DPLC model offers potential for impacting organizational trust and
collective teacher efficacy in schools.
In order to investigate the influence of the DPLC model of professional learning on
teacher perceptions, the following three research questions were developed.
1. In what ways and to what extent is collective teacher efficacy influenced by
participation in DPLC model of professional learning?
2. In what ways and to what extent is teacher organizational trust influenced by
participation in DPLC model of professional learning?
222
3. In what ways and to what extent do teachers perceive that DPLC is accomplishing its
goals of improving literacy?
Literature searches revealed no existing literature on the influence of the DPLC model on
collective teacher efficacy and organizational trust. This case study describes and characterizes
the relationship between the implementation of the DPLC model and collective teacher efficacy
and organizational trust at one middle school in a large urban school district.
During the quantitative phase of this study, all instructional faculty members of Central
Florida Middle School (CFMS), 54 participants, were invited to participate in a 53-item Likert
survey. Within the survey, three instruments were utilized to answer the three research questions.
Goddard & Hoy's (2003) CE Scale Form L (see Appendix A) was used to measure collective
teacher efficacy over time. Organizational trust was measured through Hoy & Tschannen-
Moran's (2003) Omnibus-T scale (see Appendix C). Additionally, six DPLC survey items (see
Appendix D) were included to explore teachers’ perceptions of the DPLC model’s influence on
improving student literacy. The average response rate among the three survey administrations
was 44.4%.
An analysis of variance (ANOVA) was utilized for Research Questions 1 and 2 to
compare the amount of variance of the dependent variables over the course of three survey
administrations. Additional two-way ANOVAs were used to compare the amount of variance
between groups using the moderator variables: years of teaching experience, subject area taught,
gender, and DPLC Site Team membership. Research Question 3 was investigated by using the
results from multiple chi-square tests. A series of chi-square tests were performed to investigate
participant responses to each DPLC Likert item. Additional chi-square tests were used compare
223
the differences in perceptions among groups using the moderator variables: years of teaching
experience, subject area taught, gender, and DPLC Site Team membership.
In the qualitative phase of the study, interview questions (see Appendix E) were utilized
during two separate semi-structured focus group interviews. The first focus group interview
consisted of seven instructional faculty members including teachers and instructional coaches
who were DPLC site team members. The second focus group interview consisted of five
teachers representing a variety of content areas and grade levels at the school. Participants were
selected using stratified random sampling, categorizing for subject area taught. The focus group
questions guided teacher discussions in order to capture their perceptions about professional
development opportunities, literacy support, collaborative culture, instructional leadership
opportunities, and impact of DPLC sessions. Additional themes and patterns were surfaced from
the focus group interview data, connecting the discussions to collective teacher efficacy and
organizational trust.
Focus group interview data were examined using a priori codes derived from the research
questions and underlying literature. Additional open codes and in vivo codes were created based
on patterns and themes discovered while examining the data. After the reporting of coding and
emergent themes, findings were utilized to report on the applicability to each research question.
Logic model analytics were then used to develop a conceptual framework for the analysis of the
qualitative data. Through the use of the quantitative and qualitative data collection tools
leveraged in this study, a rich data analysis and synthesis of findings were possible.
224
Discussion of the Findings
Schein’s theoretical framework of organizational culture provided a context for the
design and approach in the presented research. Schein (1988) described three levels of
organizational culture: artifacts, values, and underlying assumptions. Culture is a powerful
phenomenon that has the power to change or sustain an organization (Barth. 2002; Schein,
1988). This study was conducted to investigate cultural aspects of an organization: collective
efficacy and organizational trust. The data acquired through this study were intended to test the
relationships between the values and underlying assumptions of a school. The researcher sought
to determine, during the implementation of the DPLC model over a two-year period, how the
school’s culture was being influenced. Through the developed research questions, the researcher
attempted to disclose whether the espoused beliefs of the DPLC model impacted collective
teacher efficacy, organizational trust, and teacher perception of increased knowledge and skills
of research-based literacy practices.
Research Question 1
In what ways and to what extent is collective teacher efficacy influenced by participation in DPLC model of professional learning? The findings resulting from Research Question 1 indicated a positive relationship
between collective teacher efficacy and participation in the DPLC model of professional
learning. Though statistical significance was not found through statistical testing, descriptive
statistics indicated an increase in means over the course of the two-year study. Qualitative data
supported the increase in means for all moderator variables: time, subject area taught, gender,
years of teaching experience, and DPLC Site Team membership. Findings from the survey and

225
emergent themes from focus group interview analysis were synthesized in order to present the
following conclusions: (a) teachers reported increase of trust and improved schoolwide culture,
(b) teachers reported increase in craft knowledge and skills through DPLC sessions as part of
continuous process, (c) teachers recognized that they are all working towards a common goal, (d)
teachers reported appreciation of increased opportunities to collaborate with colleagues, (e)
teachers discussed value in working with their content area team and teachers from other content
areas on literacy content, (f) teachers reported the value in opening up their practice across the
school, and (g) DPLC Site Team members found additional value in opportunities to collaborate
with other schools.
These conclusions aligned with extant literature regarding effective professional
development. Donohoo (2017) reiterated the importance of effective professional development
practices as it relates to a culture of collective efficacy and student achievement. She identified
the following seven characteristics of effective professional development that foster collective
teacher efficacy: (a) ongoing; (b) reinforces meaningful collaboration; (c) grounded in educator’s
practice; (d) involves reflection based on evidence of student outcomes; (e) increases teacher
influence; (f) builds capacity for leadership; (g) taps into sources of efficacy (mastery
experiences, vicarious experiences, social persuasion, and affective states). Each of these
characteristics are representative of the emergent themes revealed through this study.
The findings from this study also reinforced research on the strong positive relationship
between faculty trust in colleagues and collective efficacy (Goddard et al., 2000). As supported
by Hoy et al., (2006), the combination of collective efficacy, collective faculty trust, and the
components of a professional learning community, (i.e., collaborative work practice,

226
commitment to improving teaching and learning, and high expectations and high academic
standards), the school conditions necessary for student achievement are created. These findings
reinforced the relationship between collective efficacy and professional learning which support
the connections found to the DPLC model through this study.
The conclusions from this study also confirm previous findings highlighting the
connection between a distributed leadership model and collective teacher efficacy. When
teachers were empowered to influence instructionally relevant school decisions, they were likely
to report more confidence in the capability of the faculty to educate students (Goddard et al.,
2004). Consequently, affording faculty members some control over school decisions may be one
approach to strengthening collective efficacy beliefs in schools (Goddard et al., 2004).
Leadership researchers studying leadership actions that foster collective teacher efficacy have
revealed that building instructional knowledge and skills, creating opportunities for teachers to
collaboratively share skills and experience, and involving teachers in school decision making
create a culture of collective efficacy (Brinson & Steiner, 2007). These factors reinforce key
components of the DPLC model of professional learning and the findings revealed through this
study.
Research Question 2
In what ways and to what extent is organizational trust influenced by participation in DPLC model of professional learning? The findings resulting from Research Question 2 indicated a positive significant
relationship between organizational trust and participation in the DPLC model of professional
learning. Specifically, significant findings were discovered in two facets of trust: Faculty Trust

227
in Principal and Faculty Trust in Colleagues. Faculty Trust in Principal experienced a
statistically significant increase throughout the course of two years of DPLC implementation.
Likewise, Faculty Trust in Colleagues experienced a statistically significant increase throughout
the course of the two years of DPLC implementation. Additionally, statistical significance in the
area of Faculty Trust in Colleagues was found based on subject area taught. The mean
difference between ELA/Reading and Math/Science, as well as the difference between
ELA/Reading and all other subject areas (Social Studies, Electives, and Exceptional Student
Education) was revealed. ELA and Reading teachers were found to have higher increases of
trust in colleagues than all other subject area teams. Though the results of the remaining
ANOVA tests did not show statistical significance, there was an increase of mean for all
moderator variables in this study: time, subject area taught, gender, years of teaching experience,
and DPLC Site Team membership.
The qualitative portion of data analysis revealed themes and connected information to
several of the quantitative findings. Qualitative support was provided for all statistically
significant results as well as additional areas. Findings from the survey and emergent themes
from focus group interview analysis were synthesized in order to present the following
conclusions: (a) teachers reported increase in trust and improved schoolwide culture, (b)
teachers reported increased academic expectation for literacy instruction across content areas, (c)
DPLC Site Team reported appreciation for being the chosen leaders of this professional learning,
(d) high levels of trust and comradery were reported among the staff, (e) teachers reported trust
in the professional development being delivered by colleagues, (f) ELA and Reading teachers
reported believing in and trusting the learned literacy strategies taught by their peers, (g) Math

228
teachers struggled with seeing value in the learned strategies, (h) elective teachers needed more
support with understanding how to apply literacy content learned, (i) DPLC Site team members
reported trusting each other and working well together (j) non-members reported value in co-
creating lessons with each other during PD, (k) teachers reported value in using literacy
strategies with students, and (l) teachers reported concerns with some students motivation and
academic struggles.
These conclusions align with extant literature regarding behaviors associated with
distributed leadership and their linkage to increased organizational trust (Bryk & Schneider,
2003; NSDC, 2000). The utilization of professional learning communities has become a vehicle
for engagement in distributed leadership (York-Barr & Duke, 2004). Teacher collaboration and
sharing of knowledge of skills are factors that increase faculty trust. When facilitating
professional development or learning from colleagues, teachers feel the highest sense of efficacy
at work (Mullen & Jones, 2008). Furthermore, when principals are willing to be open to
listening to the ideas of staff members and value those ideas in decision-making, vulnerability is
occurring and a trusting environment is being built (Brewster & Railsbeck, 2003; Mullen &
Jones, 2008). Principal behaviors associated with distributed leadership have the potential for
increasing trust in a school (Goddard et al., 2004). Teachers’ input in decision making
contributes to faculty satisfaction with the school’s climate (Mullen & Jones, 2008). As surfaced
in this study, Faculty Trust in Principal dropped between the first two survey administrations.
During this time, there was a change in principal. According to the literature, turnover in
leadership is a common obstacle in maintaining trust (Brewster & Railsbeck, 2003). After the
new principal had six additional months with his staff, by survey administration three, CFMS’s
229
trust in principal increased, exceeding Faculty Trust in Principal reported in survey
administrations one and two.
As evidenced in the findings of this study, Tschannen-Moran and Hoy (1998) found that
trust between teachers and principal was not enough to foster a trusting school community.
Teacher-colleague trust is vital to collective trust (Adams, 2013). Dufour, in his 1998 and 2006
research on the impact of professional learning communities, reinforced that collaboration was
the key to a successful school. The importance of collective commitment must be present
through a progression of key actions such as working with faculty, using data to agree on a
common goal(s), identifying competencies that are critical in helping staff achieve goal(s),
designing purposeful, goal-oriented strategies and programs to develop those competencies; and
sustaining commitment to those strategies and programs until staff display ownership of intended
knowledge and skills (Dufour, 2006). These key components of trust and effective professional
learning surfaced through the themes in this study.
As reported in this study, the area of Faculty Trust in Clients was the area with the lowest
reported means and increase as compared to the other facets of Faculty Trust. This quantitative
data aligned to the themes that emerged from the focus group interviews. Trust in students’
ability and motivations varied among faculty members. As a school with the highest mobility
rate in the school district, this sentiment is a common barrier discussed in the existing literature.
According to Bryk and Schneider (2003), the stability of the student body directly impacts
teacher-parent trust. Building and maintaining trust depends on repeated social exchanges (Bryk
& Schneider, 2003, Epstein, 2011). Teachers find it hard to develop and sustain direct positive
engagement with all families when the student population changes frequently.
230
Research Question 3
In what ways and to what extent do teachers perceive that DPLC is accomplishing its goals of improving literacy? The findings resulting from Research Question 3 indicated a positive significant
relationship between teachers’ perceptions of DPLC learning and its impact on thinking about
instruction and instructional practice. Statistical significance was found within specific DPLC
items. For item Q52-To what extent has content from the DPLC sessions impacted your thinking
about instruction, there was a statistically significant difference in distributions between the
member and non-members of the DPLC Site Team. In the case of this item, non-members
reported a much higher percentage in the “Impact” category. However, DPLC site team
members reported a much higher percentage in the “Large Impact” category. Likewise, there
was a statistically significant difference in distributions between the two groups for item Q53-To
what extent has content from the DPLC sessions impacted your instructional practice. In the
case of this item, non-members reported a much higher percentage in the “Impact” category.
However, DPLC site team members reported a much higher percentage in the “Large Impact”
category. Though the results of the remaining chi-square tests did not show statistical
significance, there was an increase of frequency and increase of impact report for certain
moderator variables in this study.
The qualitative portion of data analysis revealed themes and connected information to
several of the quantitative findings. Qualitative support is provided for all statistically significant
results as well as select additional areas. Findings from the survey and focus group interview
231
analysis have been synthesized in order to present the following conclusions organized by DPLC
survey item:
The following conclusions have been made regarding the dependent variable Q49-
Teachers in this school have the strategies to support literacy in the content area that they teach:
(a) teachers report learning and using the following literacy strategies and practices: close
reading strategies (including annotation, chunking, etc.), progressive text-dependent questions,
academic discourse strategies and structures, and strategic vocabulary instruction; and (b) DPLC
Site Team members reported confidence with reception and utilization of literacy strategies
learned.
The following conclusions have been made regarding the dependent variable Q50-This
school fosters a culture of collaboration: (a) high value in collaboration was reported among the
teachers, (b) faculty values PD involving peer collaboration above all else, (c) DPLC Site team
members reported trusting each other and working well together (d) non-members reported value
in co-creating lessons with each other during PD.
The following conclusion has been made regarding the dependent variable Q51-Teachers
in this school are given opportunities to be instructional leaders for their peers: DPLC Site
Team members valued opportunities that they have been give to be instructional leaders for their
peers.
The following conclusions have been made regarding the dependent variable Q52-To
what extent has content from the DPLC sessions impacted your thinking about instruction: (a)
teachers reported a positive shift in thinking about literacy instruction based on what was learned
through DPLC, (b) veteran teachers interviewed reported high value and classroom

232
implementation of literacy practices learned through DPLC, and (c) DPLC Site Team Members-
reported increased comfortability with understanding literacy content and deliver the PD to other
teachers.
The following conclusions have been made regarding the dependent variable Q53-To
what extent has content from the DPLC sessions impacted your instructional practices: (a)
teachers reported implementation and positive impact on students based on content learned
through DPLC, (b) ELA and Reading teachers reported more comfort in utilizing literacy
strategies than did teachers in any other content area, (c) DPLC Site Team members reported
increased confidence with using literacy strategies with students, and (d) DPLC Site Team
members reported a deeper understanding of the purpose of learned literacy practices and
schoolwide implementation and longitudinal impact.
In support of these findings, the influence of the DPLC model of Professional Learning is
illustrated in Logic Model Analytics (see Appendix L). This figure shows the complex
relationship among this distributed leadership model, organizational trust, and collective teacher
efficacy. The interconnectedness of emergent themes is showcased through this graphic.
These conclusions align with existing literature on leadership and professional learning.
Researchers have established that there is a significant relationship between distributed
leadership and professional learning (Bashir et al., 2017; Dufour, 1998, 2006; Kurt 2016; Louis
et al., 2010; York-Barr & Duke, 2004). The conclusions about the implementation of the DPLC
model through this study confirm the National Staff Development Council (NSDC, 2000)
research and recommendations. For example, NSDC (2000) indicated that shared leadership
activities provide teachers with authentic opportunities for professional growth. Experienced
233
teacher leaders can both formally and informally share their skills with new teachers (NSDC,
2000). They also can participate in collaborative lesson planning to continuously improve
classroom and schoolwide practice. NSDC (2000), encourages professional development that
goes beyond simply training teachers in content knowledge and pedagogical skills, stating, “Our
vision of effective professional development for teachers and school leaders calls for a daily, job-
embedded, team learning approach that focuses on planning lessons, critiquing student work, and
group problem solving” (NSDC, 2000, p. 8).
When leaders provide regular structured opportunities for teachers to focus on
instructional practices, teachers apply this new learning and produce more effective teaching
(Supovitz & Christman, 2003). Professional learning and distributed leadership practices offered
through the DPLC model have proven to be positively connected. Through a nurturing
professional learning community, effective teacher practice can increase, and a culture of trust
can be cultivated.
Implications for Practice
The findings of this study have implications for many educators who impact and are
impacted by professional development in a school system. Furthermore, the implications speak
to the influence of school culture on teacher perceptions of professional learning.
For school district decision makers, the results of this study provide valuable insights into
the many facets of a distributed leadership structure for professional learning that allow for the
growth of instructional leaders, school ownership of learning, collaboration among colleagues,
and teacher implementation of research-based practices.

234
For principals, this study provides implications for the influence of leadership decisions
on school culture. Specifically, allowing teachers opportunities to be involved in shared decision
making about instruction, engaging in mastery and vicarious experiences, and leading
professional development has the potential to impact faculty trust and collective teacher efficacy.
These leadership experiences can also lead to deeper understanding of content and authentic
implementation of research-based practices in their classrooms.
For literacy specialists and school-based instructional coaches, the findings of this study
highlight the successes and challenges of implementing cross-content area literacy schoolwide.
This study provides insight into meeting specific needs of teachers in various content areas and
with varied years of teaching experience. This insight can lead to more success in moving from
PD to practice with authentic implementation of content learned.
For teachers, this study provides implications for willingness to open up practice and
collaborate with colleagues. Through engagement in professional learning community structures
that foster ongoing collaboration grounded in educator’s practice, collegial trust can be
strengthened. This has the potential to result in increased pedagogical experience and authentic
classroom implementation of research-based practices.
Recommendations for Further Research
Based on the presented limitations of this case study, recommendations for additional
research are presented. Future research has the potential to build on the findings in the present
study. These findings can lead to investigation of program longitudinal sustainability and
increased generalizability in other settings and situations.

235
Due to the time constraints of this study, only the first two years of a three-year program,
were studied. To expand this study, researchers could follow up on this case study at Central
Florida Middle School to investigate longitudinal implementation of literacy learning, utilization
of the DPLC model, collective teacher efficacy, and organizational trust.
Additionally, this mixed-methods case study was limited to one middle school in a large
urban school district. This study has the potential to be replicated and expanded in multiple
ways. To expand this study, researchers could:
1. Utilize a similar methodology with a different grade level band (elementary, K-8, or high
school) within a school district beginning implementation of the DPLC model.
2. Utilize a similar methodology with a different middle school in the same school district.
3. Expand the quantitative phase of study to an entire school district implementing district-
wide literacy learning through the DPLC model.
This study focused on teacher perceptions of cultural aspects of their school environment.
The existing research supports the impact that collective teacher efficacy and organizational trust
have on student achievement. Future researchers can conduct a longitudinal follow-up study
tracking the impact that collective teacher efficacy and organizational trust have on student
achievement at Central Florida Middle School. Furthermore, this connected research could
expand to exploring trends in student achievement within school districts that have implemented
the DPLC model of professional learning.
Conclusions in the Study
The findings of this study expand the research on the impact of distributed leadership and
professional learning on teacher collective efficacy and organizational trust. This study revealed

236
that the District Professional Learning Community model (DPLC) of professional development
has a positive impact on collective teacher efficacy and organizational trust at Central Florida
Middle School. Furthermore, statistical significance was found regarding faculty trust in
principal and faculty trust in colleagues over the course of the two-year study. Additional
significant findings include the increase in collegial trust among English Language Arts
(ELA)/Reading teachers during the first two years of DPLC implementation. Though all
teachers showed an increase in faculty trust during the first two years of implementation, ELA
and Reading teachers’ increased levels of trust outweighed those of their other content area
peers. Moreover, this investigation revealed a statistically significant difference between DPLC
Site Team members when compared with the remainder of the faculty in regard to acquiring and
implementing literacy knowledge and skills learned through the DPLC model. Though the
faculty as a whole reported that literacy learning impacted their thinking about instruction and
instructional practice, members of the DPLC Site Team reported a higher level of impact in these
areas. Being the individuals involved in the leadership decisions and responsibilities for training
their peers impacted DPLC Site Team members’ level of knowledge and implementation.
Through the investigation of the underlying assumptions of the faculty at CFMS, truths
about organizational culture were revealed. The results of this case study confirm the research
supporting the impact of distributed leadership practices and effective professional development
on collective teacher efficacy and organizational trust.

237
APPENDIX A COLLECTIVE EFFICACY SCALE
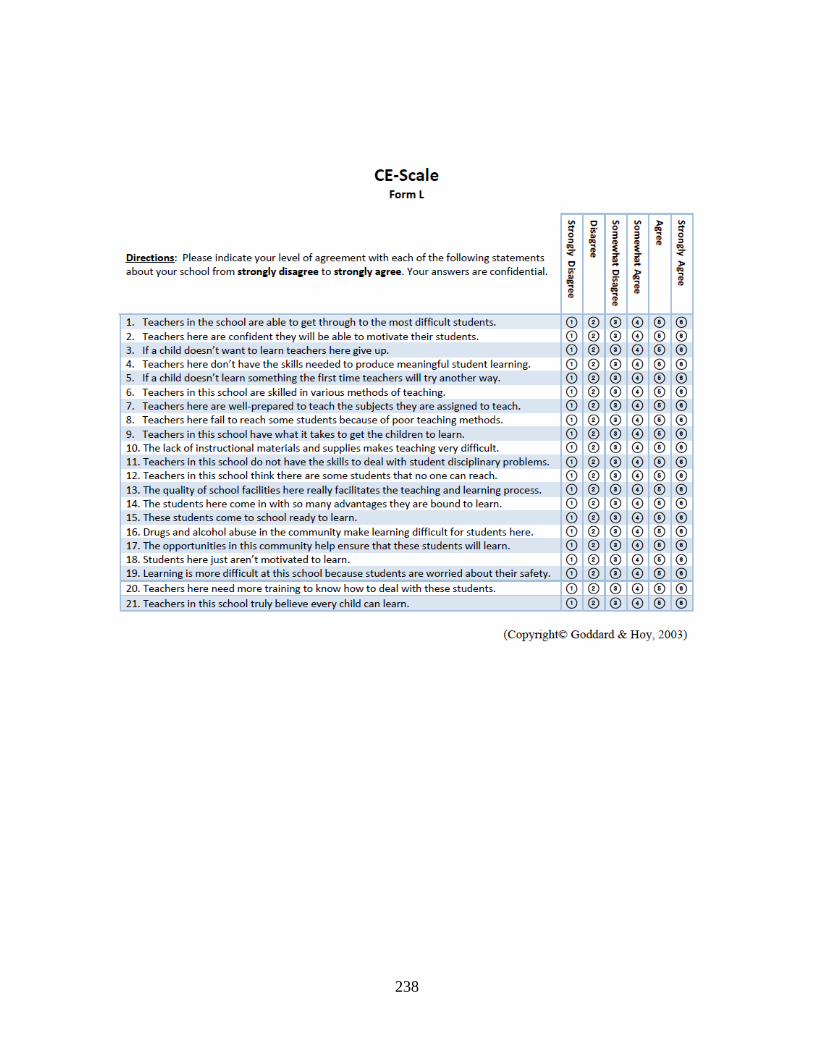
238

239
APPENDIX B A SIMPLIFIED MODEL OF COLLECTIVE EFFICACY
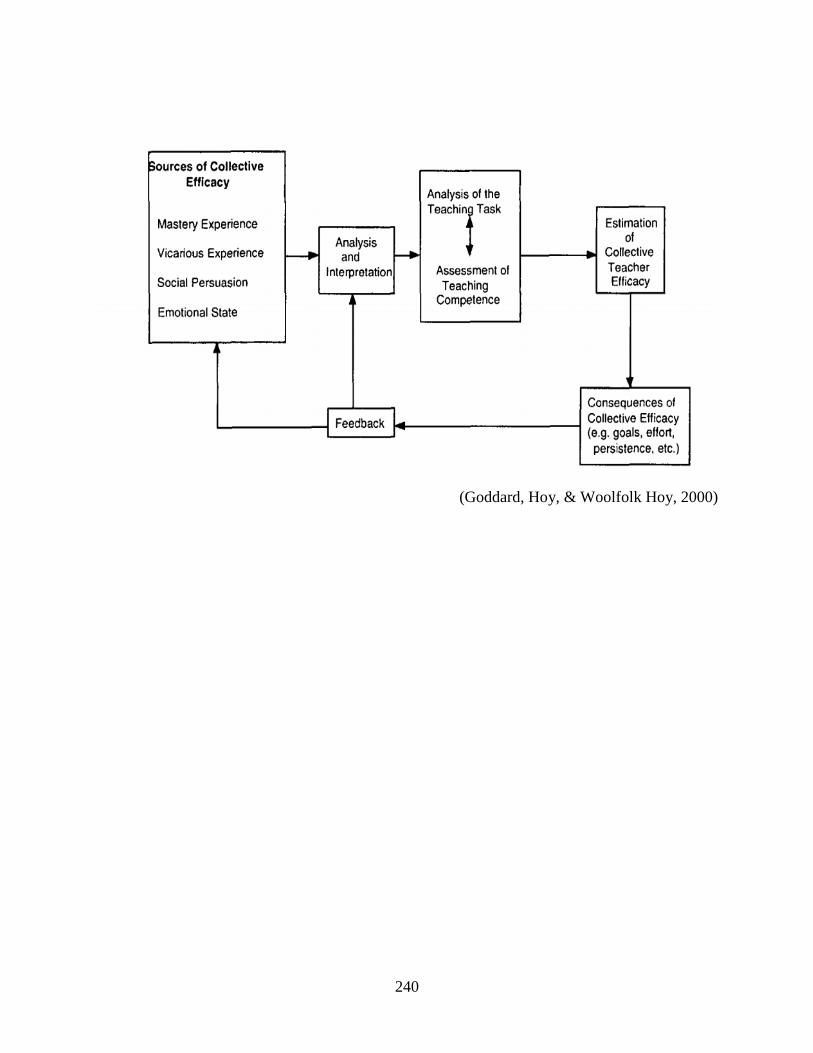
240
(Goddard, Hoy, & Woolfolk Hoy, 2000)

241
APPENDIX C OMNIBUS TRUST SCALE

242

243
APPENDIX D ADDITIONAL EXPERIMENTAL SURVEY ITEMS
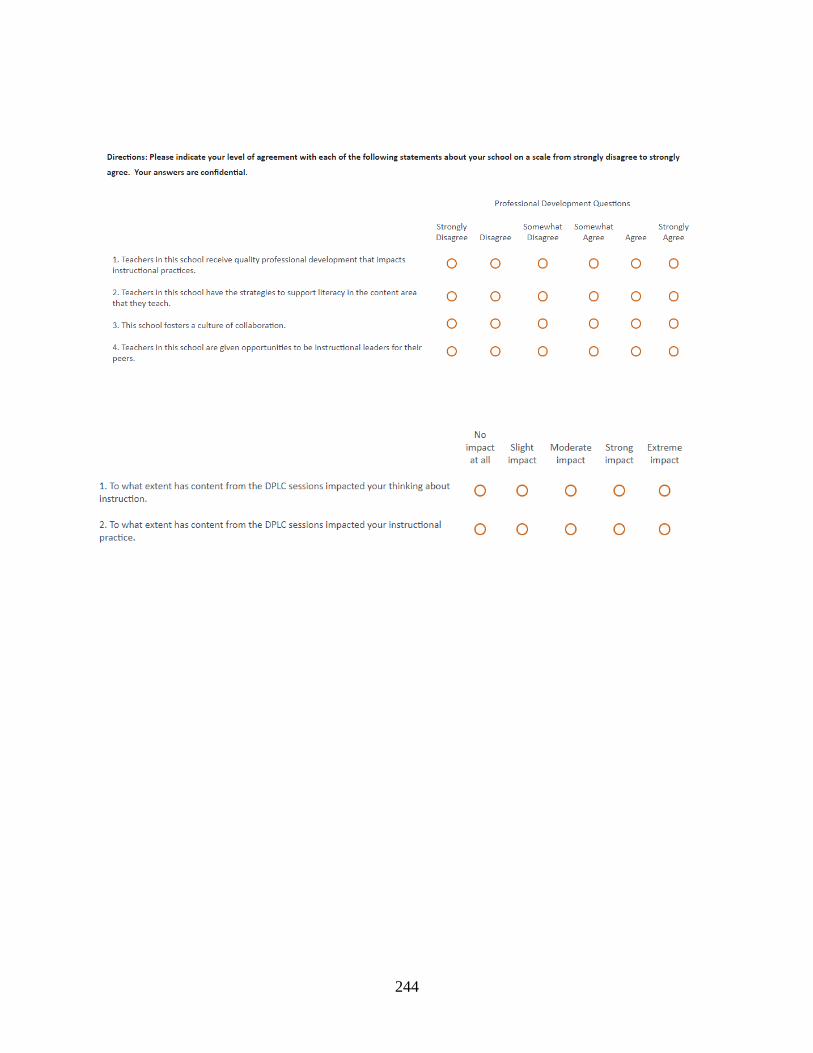
244

245
APPENDIX E FOCUS GROUP INTERVIEW QUESTIONS

246

247
APPENDIX F CONSENT FORM ON PAGE ONE OF SURVEY
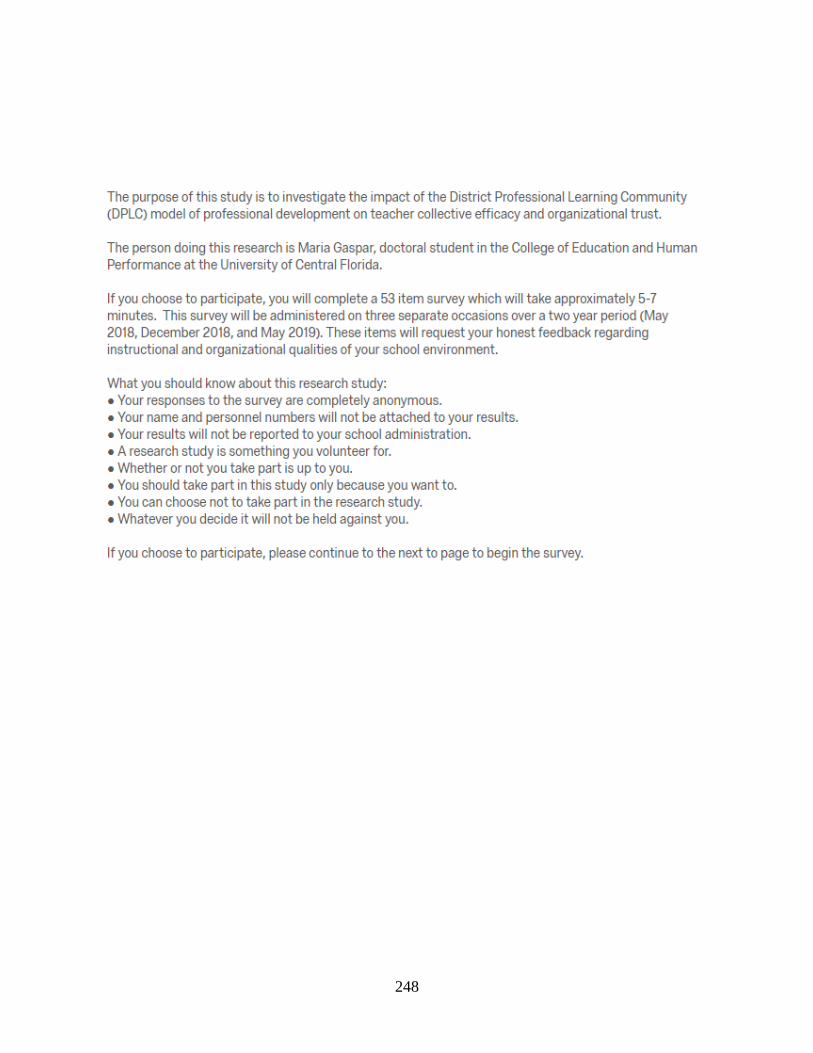
248
249
APPENDIX G EMAIL INVITATIONS FOR SURVEY ADMINISTRATION 1-3

250
Wonderful Union Park teachers,
Greetings! I know it is a crazy time of year, but I would appreciate your help will completing this 5-7
minute survey for my dissertation research at UCF. Thank you for all that you do for the students of
OCPS!
https://ocps.az1.qualtrics.com/jfe/form/SV_8jjbt0nv3DmzgEd
Sincerely,
Maria Gaspar
Wonderful Union Park teachers,
Thank you for allowing me the opportunity to stop by during your Wednesday meetings today. This is
just a reminder email with the link to my survey. It takes 5-7 minutes to complete. Thank you for the
consideration. I hope you have an amazing week!
https://ocps.az1.qualtrics.com/jfe/form/SV_b9mtDKN0rw66sT3
Sincerely,
Maria Gaspar
251
Union Park faculty,
Thank you for your support with my research study for the past 2 years! We have reached the
final survey administration. Your input is vital to the success of this research about DPLC
implementation. You will find the survey link below. It will take about 5-7 minutes to
complete. Thank you again for everything!
https://ocps.az1.qualtrics.com/jfe/form/SV_e5UVvN1w7VD0x93
Sincerely,
Maria Gaspar

252
APPENDIX H EMAIL INVITATIONS FOR FOCUS GROUPS
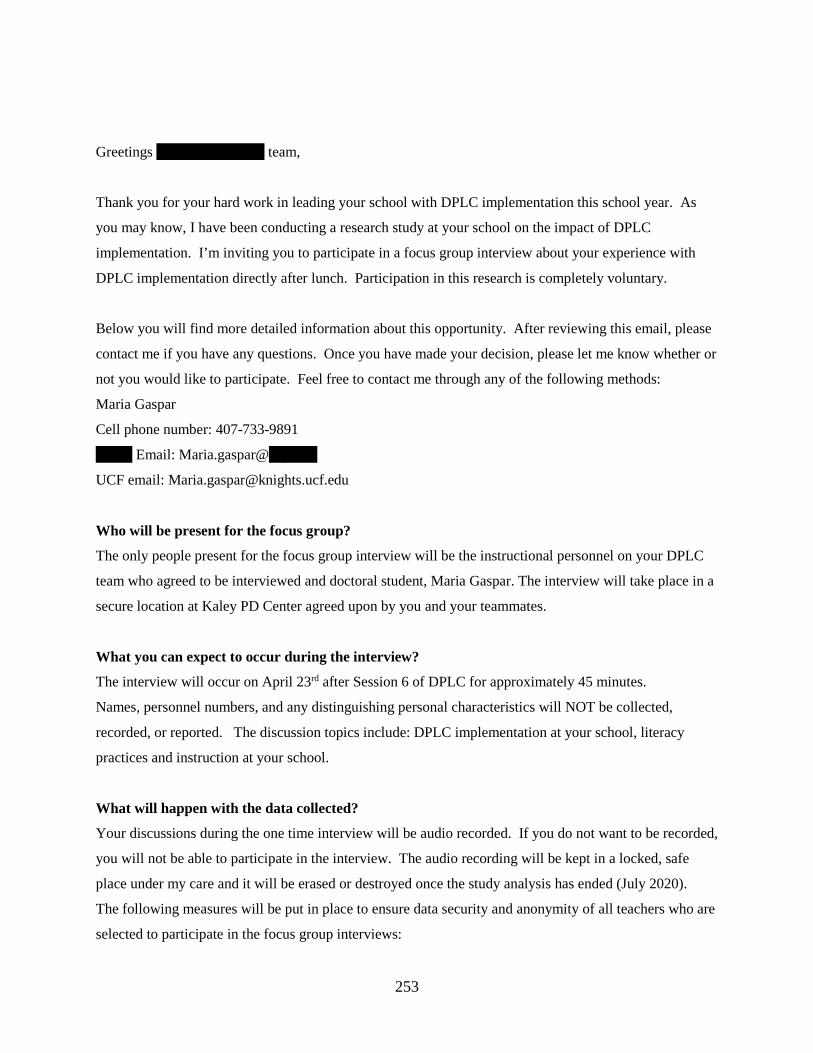
253
Greetings Union Park DPLC team,
Thank you for your hard work in leading your school with DPLC implementation this school year. As
you may know, I have been conducting a research study at your school on the impact of DPLC
implementation. I’m inviting you to participate in a focus group interview about your experience with
DPLC implementation directly after lunch. Participation in this research is completely voluntary.
Below you will find more detailed information about this opportunity. After reviewing this email, please
contact me if you have any questions. Once you have made your decision, please let me know whether or
not you would like to participate. Feel free to contact me through any of the following methods:
Maria Gaspar
Cell phone number: 407-733-9891
OCPS Email: [email protected]
UCF email: [email protected]
Who will be present for the focus group?
The only people present for the focus group interview will be the instructional personnel on your DPLC
team who agreed to be interviewed and doctoral student, Maria Gaspar. The interview will take place in a
secure location at Kaley PD Center agreed upon by you and your teammates.
What you can expect to occur during the interview?
The interview will occur on April 23rd after Session 6 of DPLC for approximately 45 minutes.
Names, personnel numbers, and any distinguishing personal characteristics will NOT be collected,
recorded, or reported. The discussion topics include: DPLC implementation at your school, literacy
practices and instruction at your school.
What will happen with the data collected?
Your discussions during the one time interview will be audio recorded. If you do not want to be recorded,
you will not be able to participate in the interview. The audio recording will be kept in a locked, safe
place under my care and it will be erased or destroyed once the study analysis has ended (July 2020).
The following measures will be put in place to ensure data security and anonymity of all teachers who are
selected to participate in the focus group interviews:

254
• Names, personnel numbers, and any distinguishing personal characteristics will NOT be
collected, recorded, or reported.
• Only the general group demographics will be recorded such as representation of grade levels and
subject areas taught.
• No one will have access to the interview records except the primary investigator (Maria Gaspar),
UCF professor- Dr. Jerry Johnson, and the UCF IRB.
Please do not hesitate to contact me with any questions. I look forward to hearing from you.
Sincerely,
Maria Gaspar

255
Good afternoon _________,
You have been invited to participate in a focus group interview about DPLC implementation at
your school. Participation in this research is completely voluntary.
Below you will find more detailed information about this opportunity. After reviewing this
email, please contact me if you have any questions. Once you have made your decision, please
let me know whether or not you would like to participate. Feel free to contact me through any of
the following methods:
Maria Gaspar
Cell phone number: 407-733-9891 OCPS Email: [email protected]
UCF email: [email protected]
Who will be present for the interviews?
The only people present for the interview will be 5-7 teachers at your school who agreed to be
interviewed and doctoral student, Maria Gaspar. The interview will take place in a secure
location on Union Park Middle School campus agreed upon by the individuals being
interviewed.
What you can expect to occur during the interview?
The interview will occur on one school day in April 2019 selected by the teachers being
interviewed. Approximately 45-60 minutes of time will be required the focus group interview. It
will take place before first period (from approximately 8:30-9:15 am.)
Names, personnel numbers, and any distinguishing personal characteristics will NOT be
collected, recorded, or reported.
The discussion topics include: DPLC implementation at your school, literacy practices and
instruction at your school.

256
What will happen with the data collected?
Your discussions during the one time interview will be audio recorded. If you do not want to be
recorded, you will not be able to participate in the interview. The audio recording will be kept in
a locked, safe place under the care of Maria Gaspar and it will be erased or destroyed once the
study analysis has ended (July 2020).
The following measures will be put in place to ensure data security and anonymity of all teachers
who are selected to participate in the focus group interviews:
● Names, personnel numbers, and any distinguishing personal characteristics will NOT be
collected, recorded, or reported.
● Only the general group demographics will be recorded such as representation of gender,
grade levels and subject areas taught.
● No one will have access to the interview records except the primary investigator (Maria
Gaspar), UCF professor- Dr. Jerry Johnson, and the UCF IRB.
Please do not hesitate to contact me with any questions. I look forward to hearing from you.
Sincerely,
Maria Gaspar
Good afternoon _______,

257
I hope all is well. I just wanted to follow up about your participation in the focus group. Please
let me know if you are interested in being a part of this research by (insert date here).
Thank you for all you do for Union Park MS and the students of OCPS! I look forward to
hearing from you.
Have a great day!
Sincerely,
Maria

258
APPENDIX I
UNIVERSITY OF CENTRAL FLORIDA RESEARCH NOTICE APPROVAL

259

260
APPENDIX J SCHOOL DISTRICT RESEARCH NOTICE APPROVAL YEAR 1

261

262
APPENDIX K SCHOOL DISTRICT RESEARCH NOTICE APPROVAL YEAR 2

263

264
APPENDIX L FIGURE 1 INFLUENCE OF THE DPLC MODEL OF PROFESSIONAL LEARNING AT
CENTRAL FLORIDA MIDDLE SCHOOL
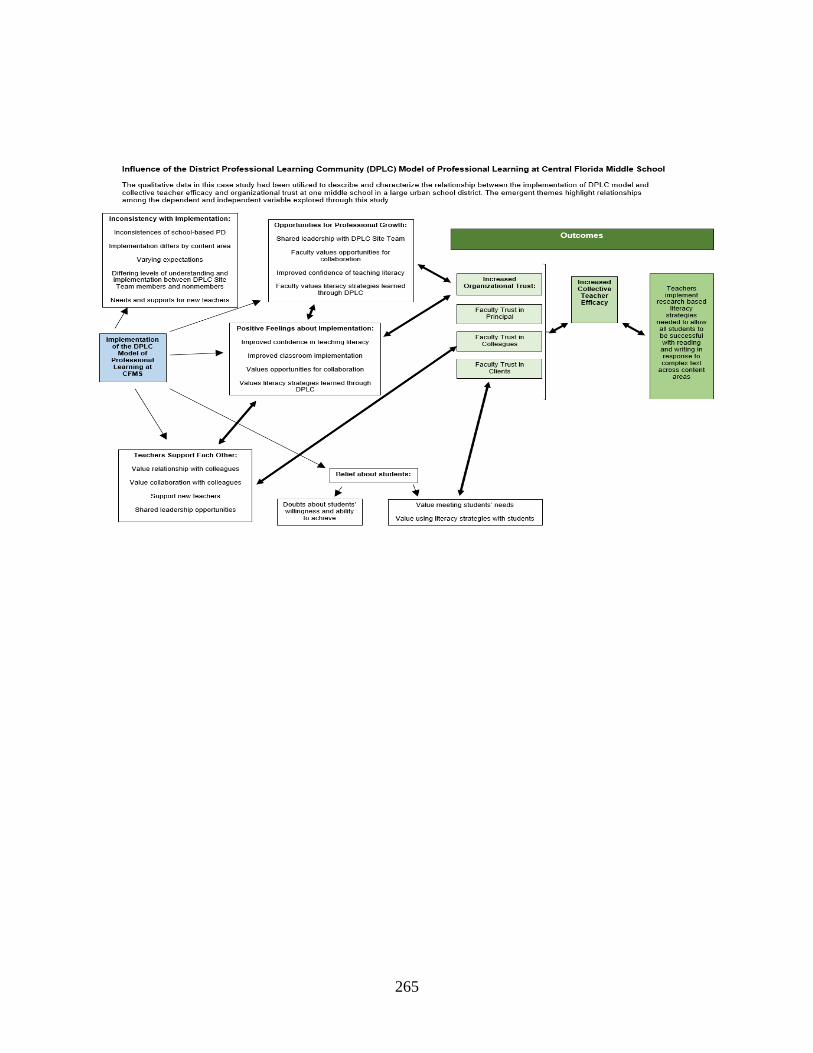
265
266
REFERENCES
Adams, C. (2013). Collective trust: A social indicator of instructional capacity. Journal of Educational Administration,51(3), 363-382. doi:10.1108/09578231311311519
Adams, C., & Forsyth, P. (2013). Revisiting the trust effect in urban elementary
schools. Elementary School Journal, 114(1), 1–21. Adams, C. M., Ware, J. K., Miskell, R. C., & Forsyth, P. B. (2015). Self-regulatory climate: A
positive attribute of public schools. The Journal of Educational Research, 109(2), 169-180.
Angelle, P. S. (2010). An organizational perspective of distributed leadership: A portrait of a
middle school. RMLE Online,33(5), 1-16. doi:10.1080/19404476.2010.11462068 Baier, A. (1985). Trust and antitrust. Ethics, 96, 231-260.
Bandura, A. (1977). Self-efficacy: Toward a unifying theory of behavioral change. Psychological Review, 84(2), 191-215.
Bandura, A. (1993). Perceived self-efficacy in cognitive development and
functioning. Educational Psychologist, 28(2), 117-148. doi:10.1207/s15326985ep2802_3 Bandura, A. (1997). Self-efficacy: The exercise of control. New York: W. H. Freeman. Barth, R. (2002, May). The culture builder. Educational Leadership, 59(8), 6-11. Bashir, I., Akram, M., & Lodhi, H. (2017). Impact of distributed leadership and psychological
empowerment on organizational learning culture [Abstract]. Journal of Educational Research,20(2), 239-255.
Brewster, C., & Railback, J. (2003). Building trusting relationships for school improvement:
Implications for principals and teachers (pp. 1-53, Rep.). Portland, OR: Northwest Regional Educational Laboratory.
Brinson, D., & Steiner, L. (2007). Building collective efficacy: How leaders inspire teachers to
achieve. Retrieved from http://http://www.centerforcsri.org/ Bryk, A., & Schneider, B. (2003). Trust in schools: A core resource for school
reform. Educational Leadership,60(6), 40-45. Cantrell, S. C., & Callaway, P. (2008). High and low implementers of content literacy
instruction: Portraits of teacher efficacy. Teaching and Teacher Education,24(7), 1739-1750. doi:10.1016/j.tate.2008.02.020

267
Central Florida Middle School Official Website. (2018). Retrieved from https://centralfloridams.ocps.net/
Central Florida Middle School Report Card - Orange County Public Schools. (2018). Retrieved
September 15, 2018, from https://www.ocps.net/cms/One.aspx?portalId=54703&pageId=924217
Chhuon, V., Gilkey, E. M., Gonzalez, M., Daly, A. J., & Chrispeels, J. H. (2008). The Little
District That Could: The Process of Building District-School Trust. Educational Administration Quarterly,44(2), 227-281. doi:10.1177/0013161x07311410
Coleman, J. S. et al. (1966). Equality of Educational Opportunity. Washington, DC: Brookings. Copland, M. A. (2003). Leadership of inquiry: building and sustaining capacity for school
improvement. Educational Evaluation and Policy Analysis, 25(4), 375-395. Creswell, J. W., & L., Plano Clark. (2018). Designing and conducting mixed methods research.
Los Angeles: Sage. Daly, A. J., & Finnigan, K. S. (2012). Exploring the space between: social networks, trust, and
urban school district leaders. Journal of School Leadership,22(3), 493-530. doi:10.1177/105268461202200304
Darling-Hammond, L. (1994). Will 21st-century schools really be different? Education Digest,
60(1), 4-8. Darling-Hammond, L., Hyler, M., & Gardner, M. (2017). Effective Teacher Professional
Development (pp. 1-76, Rep.). Palo Alto, CA: Learning Policy Institute. Donohoo, J. (2017). Collective efficacy: How educators beliefs impact student learning.
Thousand Oaks, CA: Corwin Press. Donohoo, J. (2018). Collective teacher efficacy research: Productive patterns of behaviour and
other positive consequences. Journal of Educational Change,19(3), 323-345. doi:10.1007/s10833-018-9319-2
Dufour, R. (1998). Why look elsewhere: Improving schools from within. The School
Administrator,2(55), 24-28. Retrieved from https://learningforward.org. Dufour, R. (2006). Collaboration is the key to unlocking potential. The Learning Principal,2(3),
5-7. Retrieved from www.nsdc.ORG Educational Database Warehouse. (2018). Retrieved September 7, 2018, from
http://edwbi.ocps.net:9704/analytics/
268
Eels, R. J. (2011). Meta-Analysis of the Relationship Between Collective Teacher Efficacy and
Student Achievement (Doctoral dissertation, Loyola University Chicago). Elmore, R. (2000). Building a New Structure For School Leadership. Retrieved from The Albert
Shanker Institute website http://www.shankerinstitute.org Epstein, J. L. (1995). School/family/community partnerships. Phi Delta Kappan, 76, 701–702. Epstein, J. L. (2011). School, family, and community partnerships: Preparing educators and
improving schools. Boulder, CO: Westview Press. Fasso, W., Knight B., & Purnell K. (2016) Distributed leadership of school curriculum change:
an integrative approach, School Leadership & Management, 36(2), 204-220, doi:10.1080/13632434.2016.1209177
Fitzpatrick, J. L., Sanders, J. R., & Worthen, B. R. (2011). Program evaluation: alternative
approaches and practical guidelines. (4th Ed.) Boston, MA: Pearson Education. Forsyth, P. B., Adams, C. M., & Hoy, W. K. (2011). Collective trust: Why schools cant improve
without it. New York: Teachers College Press. Fraenkel, J. R., Wallen, N. E., & Hyun, H. H. (2015). How to design and evaluate research in
education. New York, NY: McGraw-Hill Education. Frey, N., & Fisher, D. (2013). A district-wide high school formative experiment designed to
improve student achievement. Planning and Changing,44(1), 21-35. Gallagher, K., Goodyear, R., Brewer, D., & Rueda, R. (2012). Urban education: A model for
leadership and policy. New York, N.Y: Routledge. Goddard, R. & Hoy, W. (2003). Collective efficacy scale. Retrieved from
http://www.waynekhoy.com/pdfs/collective-efficacy-long.pdf Goddard, R., Hoy, W., Woolfolk Hoy A. (2000). Collective teacher efficacy: Its meaning, measure, and effect on student achievement. American Education Research
Journal, 37(2), 479-507. Goddard, R. D., Tschannen-Moran, M., & Hoy, W. K. (2001). A Multilevel Examination of the
Distribution and Effects of Teacher Trust in Students and Parents in Urban Elementary Schools. The Elementary School Journal,102(1), 3-17. doi:10.1086/499690

269
Goddard, R., Hoy, W., & Woolfolk Hoy, A. (2004). Collective efficacy beliefs: Theoretical developments, empirical evidence, and future directions. Educational Researcher, 33(3), 3-13. Retrieved from http://www.jstor.org/stable/3700071
Gordon, Z.V. (2005). The effect of distributed leadership on student achievement (Doctoral
dissertation). Central Connecticut State University. Retrieved from http://content.library.ccsu.edu/cdm/ref/ collection/ccsutheses/ id/1106
Goddard, R. D., & Skrla, L. (2006). The influence of school social composition on teachers’
collective efficacy beliefs. Educational Administration Quarterly, 42(2), 216–235 The Hanover Research Council. (2010). Distributed Leadership in Primary and Secondary
Education (pp. 1-20, Rep.). Washington, DC: Hanover Research. Retrieved from https://www.hanoverresearch.com
Harris, A. (2008). Distributed leadership: According to the evidence. Journal of Educational
Administration,46(2), 172-188. doi:10.1108/09578230810863253 Hattie, J. (2009). Visible learning: A synthesis of over 800 meta-analyses relating to
achievement. London, UK: Routledge. Hattie, J. (2017). Retrieved June 15, 2018, from
https://www.visiblelearningplus.com/content/research-john-hattie Hoy, W. (2002). Faculty Trust: A Key to Student Achievement. Journal of School Public
Relations,23(2), 88-103. Hoy, W. K. (n.d.). Wayne K. Hoy Official Website. Retrieved March 31, 2017, from
http://www.waynekhoy.com/ Hoy, W. K., & Miskel, C. G. (2002). Theory and research in educational administration.
Greenwich, CT: Information Age Pub. Hoy, W. K., Tarter, C. J., & Woolfolk Hoy, A. (2006). Academic Optimism of Schools: A Force
for Student Achievement. American Educational Research Journal,43(3), 425-446. doi:10.3102/00028312043003425
Hoy, W., & Tschannen-Moran, M. (1999). Five faces of trust: An empirical confirmation in
urban elementary schools. Journal of School Leadership,9, 184-208. Hoy, W., & Tschannen-Moran, M. (2003). The Conceptualization and Measurement of Faculty
Trust in Schools: The Omnibus T-Scale. In Studies in Leading and Organizing Schools(pp. 181-208). Information Age Publishing.

270
Joyce, B.R. & Showers, B. (2002). Student achievement through staff development (3rd ed.).
Kennedy, S. Y., & Smith, J. B. (2013). The relationship between school collective reflective practice and teacher physiological efficacy sources. Teaching and Teacher Education,29, 132-143. doi:10.1016/j.tate.2012.09.003
Kurt, T. (2016). A Model to Explain Teacher Leadership: The Effects of Distributed Leadership
Model, Organizational Learning and Teachers Sense of Self-Efficacy on Teacher Leadership. Ted Eğitim Ve Bilim,41(183), 1-28. doi:10.15390/eb.2016.5081
Kutner, M., Greenberg, E., Jin, Y., Boyle, B., Hsu, Y., and Dunleavy, E. (2007). Literacy in
Everyday Life: Results From the 2003 National Assessment of Adult Literacy (NCES 2007–480). U.S. Department of Education. Washington, DC: National Center for Education Statistics.
Laerd Statistics (2018). Retrieved from https://statistics.laerd.com/. Lambert, L. (2006). Lasting Leadership: A Study of High Leadership Capacity Schools. The
Educational Forum,70(3), 238-254. doi:10.1080/00131720608984900 Leithwood, K., & Mascall, B. (2008). Collective Leadership Effects on Student
Achievement. Educational Administration Quarterly,44(4), 529-561. doi:10.1177/0013161x08321221
Lincoln, Y. S., & Guba, E. G. (1985). Naturalistic inquiry. Newbury Park: Sage Publ. Louis, K. S., Leithwood, K., & Wahlstrom, K. L. (2010). Learning from Leadership:
Investigating the Links to Improved Student Learning (pp. 1-338, Rep.). Minnesota, MN: The Wallace Foundation. doi:https://www.wallacefoundation.org/knowledge-center/pages/investigating-the-links-to-improved-student-learning.aspx
Moolenaar, N. M., Sleegers, P. J., & Daly, A. J. (2012). Teaming up: Linking collaboration
networks, collective efficacy, and student achievement. Teaching and Teacher Education,28(2), 251-262.
Moran, K., & Larwin, K. H. (2017). Building Administrator's Facilitation of Teacher Leadership:
Moderators Associated with Teachers' Reported Levels of Empowerment. Journal of Organizational & Educational Leadership,3(1), 1-28.
Mullen, C. A., & Jones, R. J. (2008). Teacher leadership capacity‐building: Developing
democratically accountable leaders in schools. Teacher Development,12(4), 329-340. doi:10.1080/13664530802579892
271
National Staff Development Council. (2000). Learning To Lead, Leading To Learn: Improving School Quality through Principal Professional Development. (pp. 1-19, Rep.). Oxford, OH: Retrieved October 13, 2018, from https://files.eric.ed.gov/fulltext/ED467224.pdf.
Nelson, J., & Cudeiro, A. (2009). Lasting Impression: Targeted learning plan has a maximum
impact on teacher practice. National Staff Development Council,30(5), 32-35. Patton, M. Q. (1999). Qualitative evaluation and research methods. Newbury Park: Sage. Romero, L. (2015). Trust, behavior, and high school outcomes. Journal of Educational
Administration,53(2), 215-236. doi:10.1108/JEA-07-2013-0079. Schein, E. (1988). Organizational Culture (Massachusetts Institute of Technology, 1988) (pp. 1-
58). Cambridge: Sloan School of Management. Spillane, J. (2005). Distributed leadership. The Educational Forum,69, 143-150.
Spillane, J. (2003). Educational Leadership. Educational Evaluation and Policy Analysis,25(4), 343-346. doi:10.3102/01623737025004343
Spillane, J., Halverson, R., & Diamond, J. (2001). Investigating School Leadership Practice: A
Distributed Perspective. Educational Researcher,30(3), 23-28. doi:10.3102/0013189x030003023
Spillane, J., Camburn, E., & Stitziel Pareja, A. (2007) Taking a Distributed Perspective to the
School Principal's Workday, Leadership and Policy in Schools,6(1), 103 125, doi:10.1080/15700760601091200
Supovitz, J. A., & Christman, J. B. (2003). Developing communities of instructional practice:
Lessons from Cincinnati and Philadelphia. Philadelphia Consortium for Policy Research in Education.
Sutcher, L., Darling-Hammond, L., & Carver-Thomas, D. (2016). A coming crisis in teaching:
Teacher supply, demand, and shortages in the U.S. (pp. 1-107, Rep.). Palo Alto, CA: Learning Policy Institute. doi:https://learningpolicyinstitute.org
Targeted Leadership Consulting. (n.d.). Targeted Leadership Consulting Official Website.
Retrieved July 5, 2019, from https://targetedleadership.net/ The Hanover Research Council. (2014). School Climate, Implementation, and Academic
Achievement (pp. 1-23, Rep.). Washington, DC: Hanover Research. Retrieved from https://www.hanoverresearch.com.
272
Trombly, C. E. (2014). Schools and Complexity. Complicity: An International Journal of Complexity and Education,11(1). doi:10.29173/cmplct19017
Tschannen‐Moran, M., & Hoy, W. (1998). Trust in schools: A conceptual and empirical
analysis. Journal of Educational Administration,36(4), 334-352. doi:10.1108/09578239810211518
Tschannen-Moran, M. (2014). Trust matters: Leadership for successful schools. San Francisco:
Jossey-Bass. Weiner, J. M., & Higgins, M. C. (2016). Where the two shall meet: Exploring the relationship
between teacher professional culture and student learning culture. Journal of Educational Change,18(1), 21-48. doi:10.1007/s10833-016-9292-6
Yin, R. K. (2018). Case study research and applications: Design and methods. Los Angeles:
Sage. York-Barr, J., & Duke, K. (2004). What Do We Know About Teacher Leadership? Findings
From Two Decades of Scholarship. Review of Educational Research,74(3), 255-316. doi:10.3102/00346543074003255
Zambo, R., & Zambo, D. (2008). The Impact of Professional Development in Mathematics on
Teacher Individual and Collective Efficacy: The Stigma of Underperforming Schools. Teacher Education Quarterly, 159-168.