a case study of it professionals based on data from linkedin - linkedin study final.pdf · how...
TRANSCRIPT

How mobile is tech talent?
A case study of IT professionals based on data from LinkedIn
Mikkel Barslund & Matthias Busse

HOW MOBILE IS TECH TALENT?
This study aims to provide independent and in-depth insights into how IT professionals move from one region to another within Europe and beyond. This study was carried out by Mikkel Barslund, Research Fellow, and Matthias Busse, Researcher in the Economic Policy research unit at CEPS. The work was commissioned by the business networking website LinkedIn, whose data analysts kindly provided the data used in this study, aggregated by region and in relative and anonymised terms. The authors are solely responsible for the findings and opinions expressed in this study.
CEPS is an independent policy research institute in Brussels, whose mission is to produce sound policy research leading to constructive solutions to the challenges facing Europe today. The views expressed in this study are solely those of the authors and should not be attributed to CEPS or to any other institution with which they are associated or to the business networking website LinkedIn.
For more CEPS studies on labour mobility in Europe, please visit www.ceps.eu/topics/mobility
ISBN 978-94-6138-531-4
CEPS Special Report No 140 © Copyright 2016, CEPS and LinkedIn.
All rights reserved. No part of this publication may be reproduced, stored in a retrieval system or transmitted in any form or by any means – electronic, mechanical, photocopying, recording or otherwise – without the prior permission of CEPS and LinkedIn.
CEPS
Place du Congrès 1, B-1000 Brussels Tel: (32.2) 229.39.11 E-mail: [email protected]
Website: www.ceps.eu
HOW MOBILE IS TECH TALENT?
Table of Contents
Executive Summary ........................................................................................................................... 5
1. Introduction .................................................................................................................................. 7
1.1. Labour mobility in the EU ........................................................................................................ 7
1.2. EU migration ......................................................................................................................... 11
2. Expanding our knowledge using big data sources......................................................................... 12
3. Mobility of IT professionals: Evidence from LinkedIn .................................................................... 15
4. The war for talent ........................................................................................................................ 21
4.1. The stakes and the competition ............................................................................................ 21
4.2. LinkedIn insights - quantity ................................................................................................... 22
4.3. LinkedIn insights - quality ...................................................................................................... 25
5. Policy recommendations and conclusions .................................................................................... 33
References ...................................................................................................................................... 35
Appendix ......................................................................................................................................... 36
HOW MOBILE IS TECH TALENT?
List of Figures
Figure 1. mobility in the EU, 2009-14 (percent of total population) .................................................... 8 Figure 2. Unemployment rates across the EU, 2003, 2007 and 2013 .................................................. 9 Figure 3. Cumulated emigration by citizenship, 2008-12 .................................................................. 10 Figure 4. WEF’s talent competitiveness indicators ........................................................................... 11 Figure 5. Movements of IT professionals within EU regions, 2014 .................................................... 17 Figure 6. Net flows of IT professionals (% of total flow), 2014 .......................................................... 18 Figure 7. Movements of recently graduated IT professionals within EU regions, 2014 ..................... 19 Figure 8. Net flows of recently graduated IT professionals (% of total flow), 2014 ............................ 20 Figure 9. IT inflows into the EU by previous residence (percent of total) 2014 ................................. 23 Figure 10. IT outflow from the EU by previous residence (percent of total), 2014 ............................ 24 Figure 11. Educational attainment of mobile and ‘immobile’ IT EU workers, 2013-14 ...................... 27 Figure 12. IT Brain Drain/Gain, 2013-14 ........................................................................................... 28 Figure 13a. Inflows of recent graduates and Figure 13b. Outflows of recent graduates .................... 29 Figure 14. The losing end of the talent game in the IT sector ........................................................... 29
Figure A1. Ability to attract and retain foreign talent, by selected countries .................................... 36 Figure A2. Intra-EU tech migrant inflow and outflow, by region and country ................................... 37 Figure A3. Home country of southern EU tech migration to EU-28 ................................................... 38
List of Tables
Table 1. Top 20 IT skills, ranked according to listings on LinkedIn ..................................................... 31 Table 2. Net IT talent losses/gains by EU regions by partner ............................................................ 32
Table A1. Most listed skills by ‘migrant’ group ................................................................................. 39
P a g e 5 | 39
HOW MOBILE IS TECH TALENT?
Executive Summary Skills, labour mobility and Information technology (IT) all rank high on the European policy agenda and feature among the key priorities of the European Commission. Better skills promote employment and growth. Enhanced labour mobility expands employment and growth opportunities by fostering more efficient allocation of resources within the EU and by attracting and retaining talented individuals. And IT expertise enhances employment and growth prospects, since IT is a high-growth sector in its own right, the largest recipient of FDI inflows and an important driver of overall productivity increases. In sum, the EU’s current and future prosperity depend on its ability to get its policies right in order to make progress towards meeting the Lisbon criteria and becoming “the most dynamic economy in the world”.
At the policy level, the theme of this study is linked to the European Commission’s policies via the (Digital) Skills Agenda, the Digital Agenda and the general focus on mobility. Covering any one of these policies in-depth, however, is beyond the scope of this study.
Our aim in this report is to produce new insights into how IT professionals move from one region to another within Europe and beyond. But this cannot be done using traditional data sources, such as the EU Labour Force Survey, which only captures intra-EU labour mobility at a highly aggregated level and does not capture mobility out of the Union at all. Instead, we have teamed up with the business networking site LinkedIn in order to take advantage of their vast amounts of data, which they have kindly provided to us aggregated by region and in anonymised and relative terms. This study is not about riding the craze of big data, however, but simply seeks to tap into the deep reservoir of LinkedIn data to uncover findings that could not have been obtained from public data sources.
And, despite the many anecdotes one hears regularly these days about the loss of European talent,1 very little is in fact actually known about this phenomenon.
Hence, this study looks in detail at both the quantity and quality of the global interchange of IT professionals. It also investigates the behaviour of recent graduates and asks to what extent are they more likely to move – and where to.
1 There is no clear definition of what constitutes talent or a consensus on how to measure it. In recent years, the term has often been overused as a synonym for “human capital”. We will apply a relatively broad definition with which we are comfortable seeing that we are focusing on IT workers (who nearly exclusively have at least a bachelor’s degree), while keeping in mind that IT ‘talent’ in some cases may be disconnected to educational attainment.
P a g e 6 | 39
HOW MOBILE IS TECH TALENT?
Thus, the study is also a first effort to gain insights into intra-EU mobility from large-scale non-traditional data sources such as LinkedIn.
Our key findings can be summarised as follows:
Intra-EU flows of IT professionals follow a general pattern of mobility: from east and south to west and north. Net flows are substantial and more so for recent graduates.
The EU is losing tech skills to the US – especially those possessed by new graduates.
The EU is also losing on quality – the best educated are more likely to leave. This is also the case for intra-EU flows.
Big data sources offer great potential to inform the policy-making process – but obstacles remain on the path to achieving this potential.
Based on the findings in this study, we call for the following policy measures:
Ease access to visas for students who graduate from an EU university (automatic visa for, say, six-to-nine months upon graduation across the EU). This would provide time for non-EU citizens to find a job after graduation.
Reform the Blue Card Directive to allow non-EU citizens to view the EU as one common labour market.
Improve the standing and reputation of European universities in general to attract talent early on.
Pay attention to persistent net flows of talented people within the EU. Experiment further with the use of big data sources for monitoring mobility
trends, focusing on skills and return mobility.
To date, the debate on mobility has focused almost entirely on how many. We believe it is time to shift the focus to who are they. Clearly, we should avail ourselves of all information that can increase our knowledge and understanding. The vast collections of data, such as that amassed by LinkedIn and other global networking sites, may be able to play a role in this shift.
P a g e 7 | 39
HOW MOBILE IS TECH TALENT?
Free movement is very popular among EU citizens… … but only 3.5% make use of it, less than 18 million citizens Almost 2 million people move within the EU every year
1. Introduction 1.1. Labour mobility in the EU A well-functioning economic union requires a common market at its core. The European Union has paved the way by establishing the Single Market, referring to it as “the heart of the European project“2. Its pillars, the four fundamental freedoms, including the free movement of workers, are seen by European citizens as one of the greatest achievements of the EU.3 Not surprisingly, European policy-makers are committed to removing the remaining barriers to the completion of the Single Market and have in recent decades succeeded in lowering the obstacles to labour mobility. One could cite in particular the job-matching platform EURES (European Employment Services), the multilingual classification of European skills, competences and occupations (ESCO), the exportability of both pensions and unemployment benefits and the relatively strong rights of mobile EU citizens. Nevertheless, fostering labour mobility remains high on the policy agenda as it expedites the optimal allocation of labour across the EU, constitutes a potential shock absorber for crisis-ridden member states, benefits mobile workers and deepens cultural exchange.
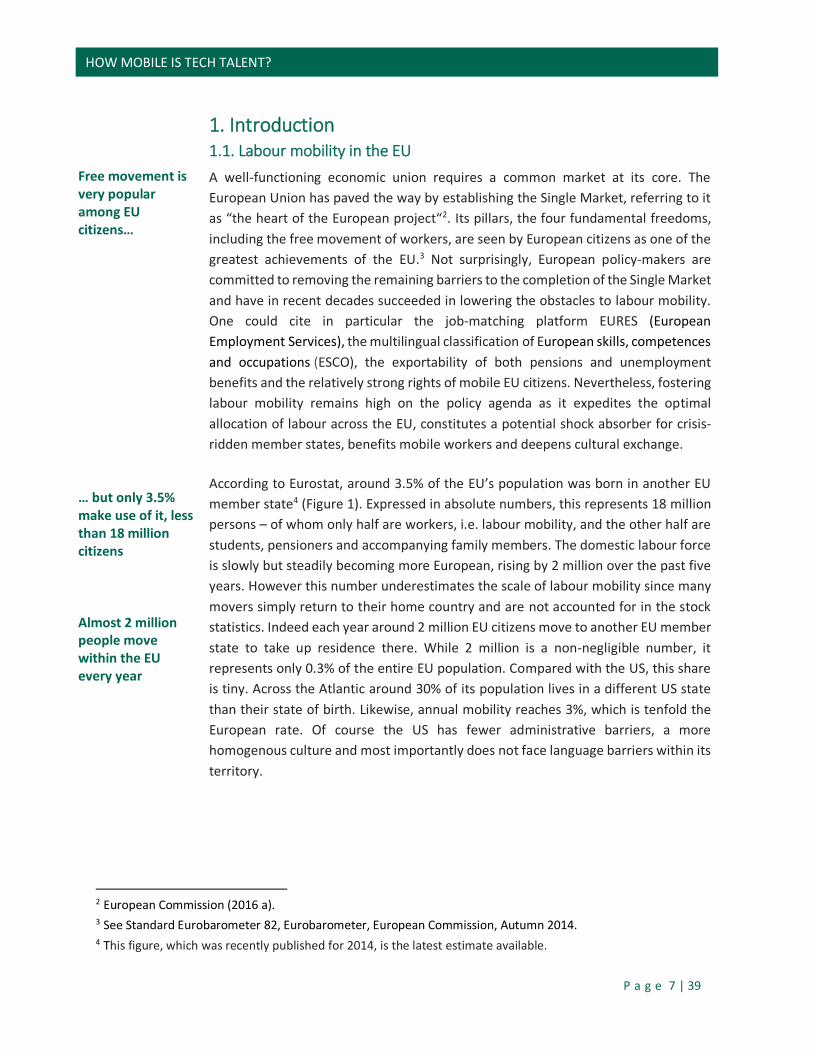
According to Eurostat, around 3.5% of the EU’s population was born in another EU member state4 (Figure 1). Expressed in absolute numbers, this represents 18 million persons – of whom only half are workers, i.e. labour mobility, and the other half are students, pensioners and accompanying family members. The domestic labour force is slowly but steadily becoming more European, rising by 2 million over the past five years. However this number underestimates the scale of labour mobility since many movers simply return to their home country and are not accounted for in the stock statistics. Indeed each year around 2 million EU citizens move to another EU member state to take up residence there. While 2 million is a non-negligible number, it represents only 0.3% of the entire EU population. Compared with the US, this share is tiny. Across the Atlantic around 30% of its population lives in a different US state than their state of birth. Likewise, annual mobility reaches 3%, which is tenfold the European rate. Of course the US has fewer administrative barriers, a more homogenous culture and most importantly does not face language barriers within its territory.
2 European Commission (2016 a). 3 See Standard Eurobarometer 82, Eurobarometer, European Commission, Autumn 2014. 4 This figure, which was recently published for 2014, is the latest estimate available.
P a g e 8 | 39
HOW MOBILE IS TECH TALENT?
EU mobility is comparatively low
Figure 1. mobility in the EU, 2009-14 (percent of total population)
Source: Authors’ own elaboration based on Eurostat data.
Eurostat data suggest that mobility is on the rise or at least is recovering to its pre-crisis level. Unfortunately, it is impossible to take a more long-term historical view since both the stock and the flow of mobility has only become available for the years after 2008 – and even here the data are at times patchy and suffer from significant methodological breaks.
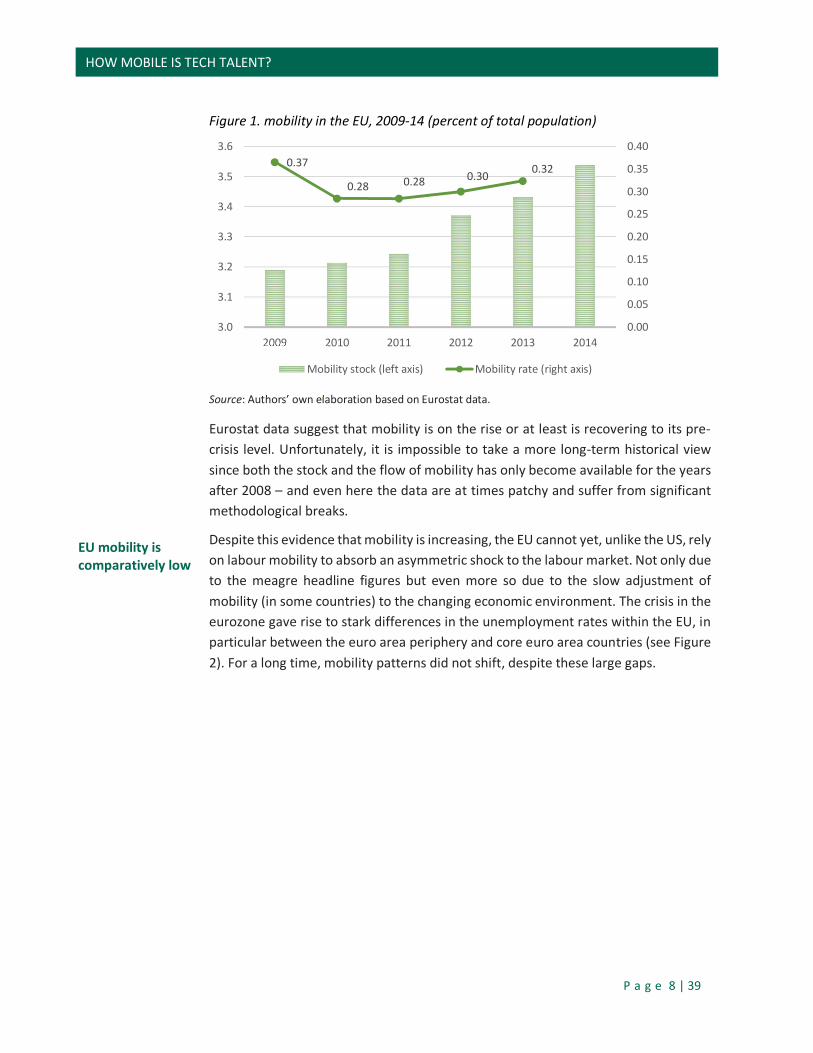
Despite this evidence that mobility is increasing, the EU cannot yet, unlike the US, rely on labour mobility to absorb an asymmetric shock to the labour market. Not only due to the meagre headline figures but even more so due to the slow adjustment of mobility (in some countries) to the changing economic environment. The crisis in the eurozone gave rise to stark differences in the unemployment rates within the EU, in particular between the euro area periphery and core euro area countries (see Figure 2). For a long time, mobility patterns did not shift, despite these large gaps.
0.37
0.28 0.28 0.30 0.32
0.00
0.05
0.10
0.15
0.20
0.25
0.30
0.35
0.40
3.0
3.1
3.2
3.3
3.4
3.5
3.6
2009 2010 2011 2012 2013 2014
Mobility stock (left axis) Mobility rate (right axis)
P a g e 9 | 39
HOW MOBILE IS TECH TALENT?
Unemployment divergence pushes mobility Two-thirds of mobility occurs within western EU member states… …only one-third stems from eastern Europe
Figure 2. Unemployment rates across the EU, 2003, 2007 and 2013
Source: Authors’ own elaboration based on AMECO data.
The EU’s mobility flows can be categorised in three streams: the east-west stream, the south-north stream and the ‘core whirlpool’. Pinpointing the exact volume of these streams is challenging since Eurostat data does not allow us to develop a mobility matrix between all member states. This is only feasible for some countries, whereas for several large economies one can only determine the number of person moving to the rest of the EU as a whole since their public administrations do not distinguish EU citizen’s nationality in all their registries.
Assuming that most Eastern Europeans move towards the West, we can estimate that in 2014 roughly 1/3 of all mobility took place in the east-west stream. Given the strong push factors in the south and the population size of the southern periphery, one would expect a large share in total flows, but in reality only 1/4 stems from the south. Some 2/5 of mobility originates from (and mostly stays in) the middle/northern Europe. These shares also offer insights into the motivation of Europeans to move, since the wage gap is thought to be the dominant factor in eastern mobility whereas southern mobility is driven by high unemployment rates. The single largest part of mobility (the core whirlpool) is most likely simply driven by skills-matching and to a lesser degree by wage differences. On the whole, shifts in unemployment rates seem to be a less accurate predictor than the wage gap.
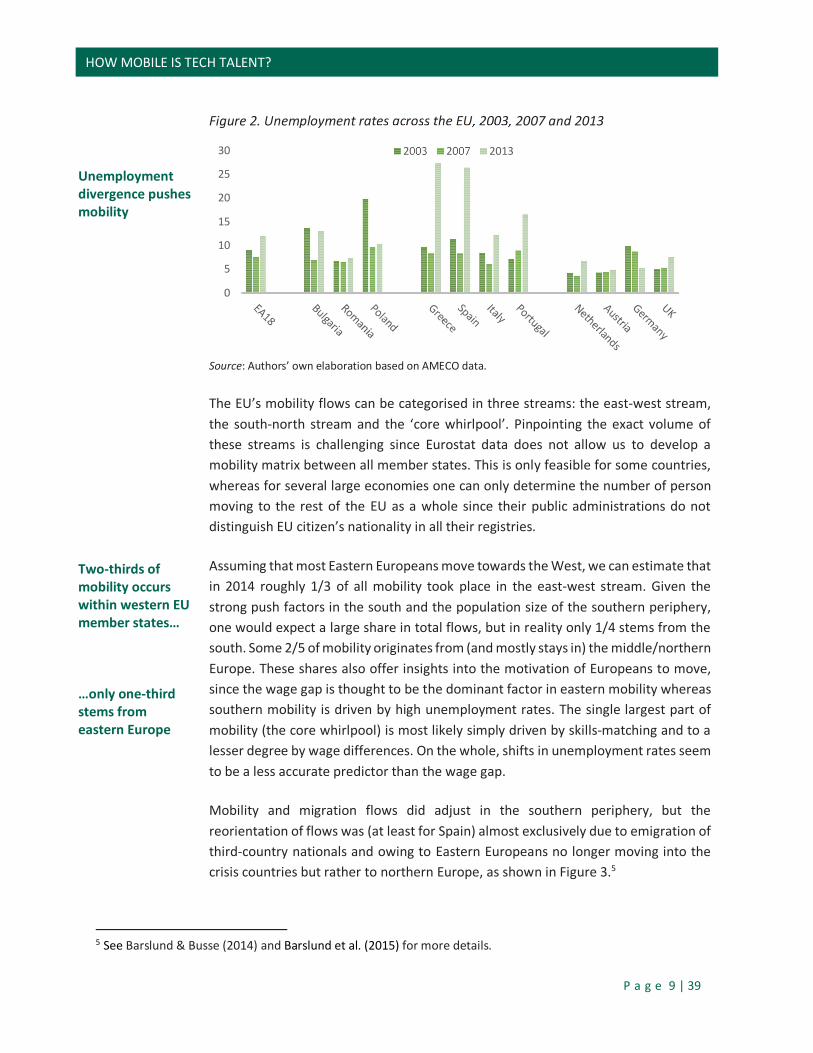
Mobility and migration flows did adjust in the southern periphery, but the reorientation of flows was (at least for Spain) almost exclusively due to emigration of third-country nationals and owing to Eastern Europeans no longer moving into the crisis countries but rather to northern Europe, as shown in Figure 3.5
5 See Barslund & Busse (2014) and Barslund et al. (2015) for more details.
0
5
10
15
20
25
30 2003 2007 2013
P a g e 10 | 39
HOW MOBILE IS TECH TALENT?
Mobility responded strongly to the crisis in the small southern countries Knowledge about EU mobile citizens is still scarce
Characteristics and skills of movers are largely unknown… … but even less is known about EU emigrants (talent drain)
Figure 3. Cumulated emigration by citizenship, 2008-12
Source: Authors’ own configuration based on Eurostat data.
Unfortunately, we cannot distinguish where the individuals in the categories in Figure 3 went, that is whether they constitute intra-EU mobility or emigration, becoming essentially lost workforce for the EU. Our understanding of European mobility, in particular return mobility and loss of human capital, would be greatly enhanced if reliable, harmonized data on emigration/immigration by nationality and next/previous residence would be available based on administrative data. In the foreseeable future this does not seem to be case, leaving analysis to rely on labour market surveys such as the EU Labour Force Survey (EU-LFS).
Survey data can provide insights into the characteristics of the population or the mobile population as a whole. A detailed breakdown in characteristics by nationality of mobile workers or residence of mobility workers, let alone both combined, is for the most part not possible due to the small sample size of these individuals. This severely limits socio-economic research, for example, concerning skills composition of movers, return mobility and upskilling while being abroad. The ability to track individuals and assess their mobility life-cycle would offer invaluable information to isolate barriers and better grasp economic outcomes via mobility.
This is not only relevant for assessing the return on mobility/migration for the individual, but it is also useful for governments that are eager to evaluate what benefits a country reaps from a mobile workforce. For the European Union, mobility payoffs might ex post substantiate or disprove brain-drain fears if the necessary data were available. Since mobility is intended to benefit the Union at large, showing brain-drain patterns (if accurately revealed) would not necessarily question mobility but rather stimulate a debate on the potential mitigation and loss of skilled workers in some countries. The same cannot be said for extra-EU migration outflows.
-0.8
-0.6
-0.4
-0.2
0.0
0.2
0.4
Ireland Greece Spain Italy Portugal
Reporting country EU27-countries except reporting country Non EU27-countries nor reporting country
P a g e 11 | 39
HOW MOBILE IS TECH TALENT?
Survey data show that the EU is less attractive to talent than the US…
1.2. EU migration
The knowledge gaps pertaining to mobility sketched above are even starker with regard to migration to and from the EU. Policy-makers rely on international data (collected, among others, by Eurostat and the International Migration Database of the OECD) to show the magnitudes of both inflows and outflows to the EU member states, but their skill levels are largely unknown. The OECD published data on educational attainment, field of study and even occupation by sector in the year 2000, but unfortunately, this snapshot does not provide any insights on trends and the general landscape of migration, which will have been radically altered over the course of the last 15 years. The European Commission aims to shed lights on migrants’ skills (see, among others, European Commission, 2013) but the data are neither up-to-date nor do they cover emigration – rendering any analysis with regard to the ‘talent war’ completely one-sided. Ultimately our knowledge of talent flows from public data sources is quite limited.
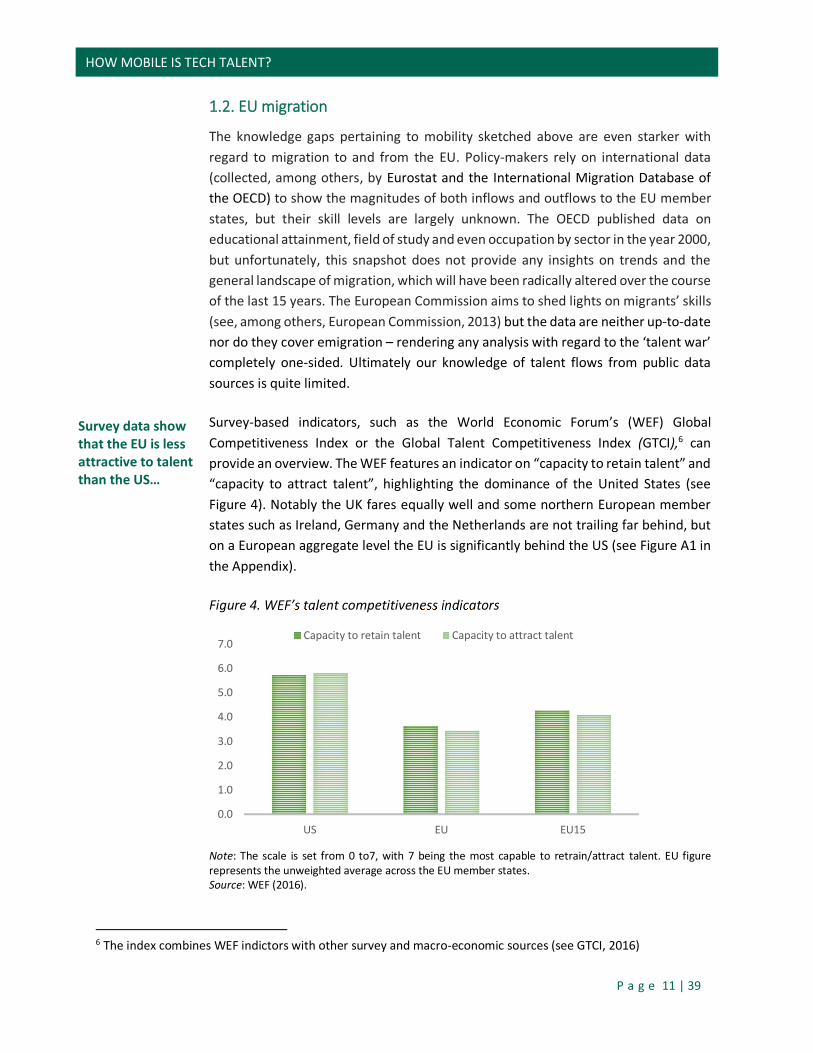
Survey-based indicators, such as the World Economic Forum’s (WEF) Global Competitiveness Index or the Global Talent Competitiveness Index (GTCI),6 can provide an overview. The WEF features an indicator on “capacity to retain talent” and “capacity to attract talent”, highlighting the dominance of the United States (see Figure 4). Notably the UK fares equally well and some northern European member states such as Ireland, Germany and the Netherlands are not trailing far behind, but on a European aggregate level the EU is significantly behind the US (see Figure A1 in the Appendix).
Figure 4. WEF’s talent competitiveness indicators
Note: The scale is set from 0 to7, with 7 being the most capable to retrain/attract talent. EU figure represents the unweighted average across the EU member states. Source: WEF (2016).
6 The index combines WEF indictors with other survey and macro-economic sources (see GTCI, 2016)
0.0
1.0
2.0
3.0
4.0
5.0
6.0
7.0
US EU EU15
Capacity to retain talent Capacity to attract talent
P a g e 12 | 39
HOW MOBILE IS TECH TALENT?
… but there is little hard evidence on which to base policy
More information is needed on talent flows
Despite the usefulness of these annually published indicators, they can at best provide a rough overview enshrined in a single number and they are solely based on perceptions. This is hardly enough to make informed decisions on securing an adequate skill endowment of the population. The European Commission has launched its New Skills Agenda for Europe with a focus on generating “higher and more relevant skills for all”.7 While upskilling the population is a sound recommendation, it has to be accompanied by measures to retain skilled citizens in order to effectively boost European productivity and create jobs. One could say that merely increasing the flow of water from the tap does not help if the bucket has a leak in it.
If the EU is committed to fixing the leak, it requires more information on talent flows; otherwise many essential questions will remain unanswered. Is the EU truly losing talent on a net-basis vis-à-vis its main competitors? Is it losing its most educated talent? And if so, what skills are they taking with them, depleting the reservoir of skills in the EU in the process? Do they coincide with those that are most in demand in the labour market of modern competitive economies? These questions cannot be answered from available public resources, but big data may help provide some key insights.
Traditional surveys are not optimal for the analysis of skills and mobility…
2. Expanding our knowledge using big data sources
Limitations and advantages of traditional surveys8
Traditionally, data on various socio-economic outcomes have been collected by large-scale representative surveys both at the national level and, increasingly coordinated or harmonised, at the EU level. Among the most important data sources coordinated or harmonised within the EU are the EU Labour Force Survey (EU-LFS), the European Social Survey (ESS) and the EU Statistics on Income and Living Conditions (EU-SILC). While these surveys cover a lot of ground, they are inherently limited in the amount of information they can collect due to their labour-intensive collection method of face-to-face interviews. Thus, they do not collect detailed information on such factors as skills, job history and mobility patterns. Sub-samples of the EU-LFS and EU-SILC have a longitudinal element, but they are limited in the time dimension and their scale. An additional drawback is that their results are often only reported with a considerable lag.
7 European Commission (2016b). 8 See Hughes et al. (2016) and Zagheni & Weber (2015) for further discussion of this issue.
P a g e 13 | 39
HOW MOBILE IS TECH TALENT?
… and are ill-suited to capture mobility out of the EU
Administrative data sources may be good complements… …but there are issues related to harmonisation Big data, e.g. from LinkedIn, have advantages… … particularly when it comes to the study of mobility and skills
In the study of mobility, the limitations of traditional surveys become even more binding. Mobile individuals are only a small proportion of those interviewed, even in countries where mobility is high; hence mobile individuals are not very well represented even in very large surveys such as the EU-LFS. Apart from, say, broad levels of educational attainment, it is almost impossible to count on finding more granular information. This also extends to the study of regions or smaller geographical units. Further disaggregation means a loss of representativeness, which is the core strength of representative surveys.
To accurately capture mobility, one must keep track of individuals both arriving and leaving. Surveys administered in one country (or one area, as is the case with EU-LFS) only capture persons moving within the area. At the overall level, the EU-LFS survey delivers a good estimate for intra-EU mobility. But no tab is kept on the number leaving, let alone their specific skill characteristics and occupations, hampering the assessment of net mobility flows.
Some of these issues can be resolved by using administrative data sources or combining them with representative surveys. While doing this systematically within the EU will certainly improve the accuracy of the head-count, detailed individual information about e.g. education is rarely available in tax or residence registers. And, even with the use of administrative data sources there is underreporting of outgoing mobility. Arriving in a country to work, people need to register for reasons of taxes, health care and residency permits; when leaving they may or may not de-register.
Advantages and dis-advantages of big data and non-traditional data sources
Large-scale data sources, such as LinkedIn or other social media and information infrastructure providers (e.g. mobile, Internet service providers, web search companies) can overcome some of the limitations of traditional surveys and administrative sources. In particular, since such sources collect data ‘instantly’, they make much more timely delivery of results feasible.
For the study of skills and mobility, LinkedIn data are by their very nature of particular interest. Because of the size of the data available, they offer wide scope for more granular research, an important feature in the research of skills and mobility. LinkedIn data cover mobile individuals in both directions at a very fine geographical level (city level).9 Furthermore, for some characteristics, its data have a time dimension to draw on.
9 LinkedIn (2014).
P a g e 14 | 39
HOW MOBILE IS TECH TALENT?
Concerns and obstacles related to non-representativeness and … … reliability over time Our focus on one group is chosen to limit bias from non representativeness
There are of course limitations to the use of large-scale non-public data sources in general, most of which also apply to LinkedIn data. One important point is on representativeness of the data source. LinkedIn users are for various reasons unlikely to be representative of the population at large. As an example, an IT engineer seeking a career abroad is in all likelihood more inclined to have a LinkedIn profile than someone who is not looking to change jobs and much less likely to go abroad. Relying on data from LinkedIn to estimate total mobility among IT professionals could therefore lead to an overestimation bias.
Another consideration when basing public policy on data sources not collected by public agencies is the issue of reliability and comparability over time. While there is a risk that the data owner will not provide access in the future; a bigger risk may be that shifts in markets can render a given provider unable to provide the data. A case in point is the decline of Myspace. Related to this is the issue of the non-public nature of the data. Often, as is the case with this study, data analysis is provided by the company internally, meaning that it is not open to outside scrutiny. One worry is that mistakes in data handling will go unnoticed or that information is lost in the communication process with outside analysts who are not directly involved in the data collecting procedure. In addition some of the more interesting figures may not be made available externally due to regulatory constraints (i.e. issues of data protection) or because they are sensitive to the business side of operations.
In this study we focus on one occupational group, IT professionals, who are well represented on LinkedIn. This makes the risk of significant biases smaller. One way to assess and adjust for biases is to validate some data points against a well-known representative data source.10 Of course, the more comparisons that can be made, the less need there is for the large-scale data sources; thus comparisons with official sources, while useful, are not a cure-all.11 In fact, the more innovative is the use made of large-scale data sources, the less straightforward it becomes to validate its findings against publicly available data.
10 We have attempted to validate key ratios and quantities with EU-LFS, which is the only possible source to compare with our data source, given the nature of our sample. Unfortunately, it proved impossible to tease enough information out of the EU-LFS. 11 Other options include assigning post-stratification weights (i.e. giving some observations more say than others) based on characteristics that can be compared with public data sources (see Hughes et al., 2016).
P a g e 15 | 39
HOW MOBILE IS TECH TALENT?
Existing intra-EU mobility statistics give only basic insights Characteristics of LinkedIn data sample
LinkedIn has more than 90 million users in Europe Sample of IT professionals divided into 6 regions covering EU
3. Mobility of IT professionals: Evidence from LinkedIn Data on mobility within the 28 member states of the EU are available through Eurostat, which relies on harmonised numbers reported by member states, most of which are collected from administrative population registers. Some additional insights can be obtained through the EU-LFS, although little detail of the direction of flows is available. Going beyond flows and broad levels of education would require much greater efforts on the part of the member states, and even then – given the nature of the statistics collected – it may not be possible to obtain further insights into mobility flows. Data from LinkedIn provide an alternative possibility of measuring mobility flows.
LinkedIn data – focus on IT professionals
LinkedIn provides a platform for professional networks. It currently has around 430 million members worldwide, more than 90 million of whom are based in Europe. Members, or users, can list their past and current employment and their geographical location, their skills, the educational institutions they attended and other information relevant for potential employers, colleagues, etc. Users can link up with other users they know or are doing business with and thereby stay in contact with potential future collaborators or customers. All information is provided by the users themselves.
This study focuses on the sample of LinkedIn members working in the IT sector (see Box 1). Specifically, the study looks at mobile IT employees moving into or within Europe in the years 2013 and 2014. Useful comparisons are also made between IT professionals who move to another job in the same country and IT professionals who are ‘stationary’. Within Europe we aggregate the country level into six different regions:
o Northern EU: Austria, Denmark, Finland, Germany and Sweden o Benelux: Belgium, the Netherlands, Luxembourg o France o UK and Ireland o Southern EU: Cyprus, Greece, Italy, Malta, Portugal and Spain o Eastern EU: Estonia, Latvia, Lithuania, Hungary, Romania, Czech Republic, Bulgaria,
Poland, Slovenia, Slovakia and Croatia
Box 1. LinkedIn data
This study is based on an analysis of LinkedIn members satisfying the following criteria: Location: LinkedIn members who
have changed the information on their profile to reflect a shift in geographical location from one EU member state to another country;
Industry: LinkedIn members who held or are holding positions in Technology Industries (e.g. information technology and services, e-learning, computer networking etc.);
Time period: Moved location (as indicated on their LinkedIn profile) during 2013 and during 2014.
The size of the overall pool for members meeting this criteria was 295,000.
P a g e 16 | 39
HOW MOBILE IS TECH TALENT?
IT professionals are an important group and well-represented on LinkedIn and … … documenting their mobility is relevant
Around 70,000 IT professionals move within the EU
The group of IT professionals is chosen to keep the sample well-defined and traceable. This group of professionals is also well-represented on LinkedIn. More importantly, shortages of IT skills are generally reported to be a constraint on future economic growth. The European Commission has estimated that there could be more than 750,000 unfilled ICT vacancies by 2020.12 The IT sector is itself a growth sector when it comes to employment and is a major recipient of incoming FDI.13 Although still a small part of the labour market – IT-related jobs make up around 2% of total employment in the EU – employment in the IT sector has been growing by more than 3% annually since 2008. Even countries hit hard by the economic crisis, such as Spain, Italy and Greece, have seen job gains in the IT sector in this period. In comparison, employment in non-IT sectors is now lower than it was in 2008. The importance of the IT sector is underscored by the fact that the Digital Agenda forms one of the seven pillars of the Europe2020 strategy.
Thus, documenting flows and skill sets for this group of professionals is particularly relevant. Although it is beyond the scope of the present study, the data set offers a promising basis for a series of more in-depth studies and monitoring of e.g. skills progression, return mobility and changes over time.
Intra EU mobility of IT professionals
In 2013 and 2014, according to LinkedIn data, around 70,000 IT professionals moved annually from one EU country to another. Relating the number of movers to the total number of IT professionals in the EU estimated from the labour force surveys implies a mobility rate of a bit more than 3 persons in 100. That is, for every 100 IT professionals 3 are moving to work in another EU country every year. This is a much higher mobility rate than for the general population.14 It is a first indication that the overall mobility rate within EU may disguise large and important differences among occupational groups.
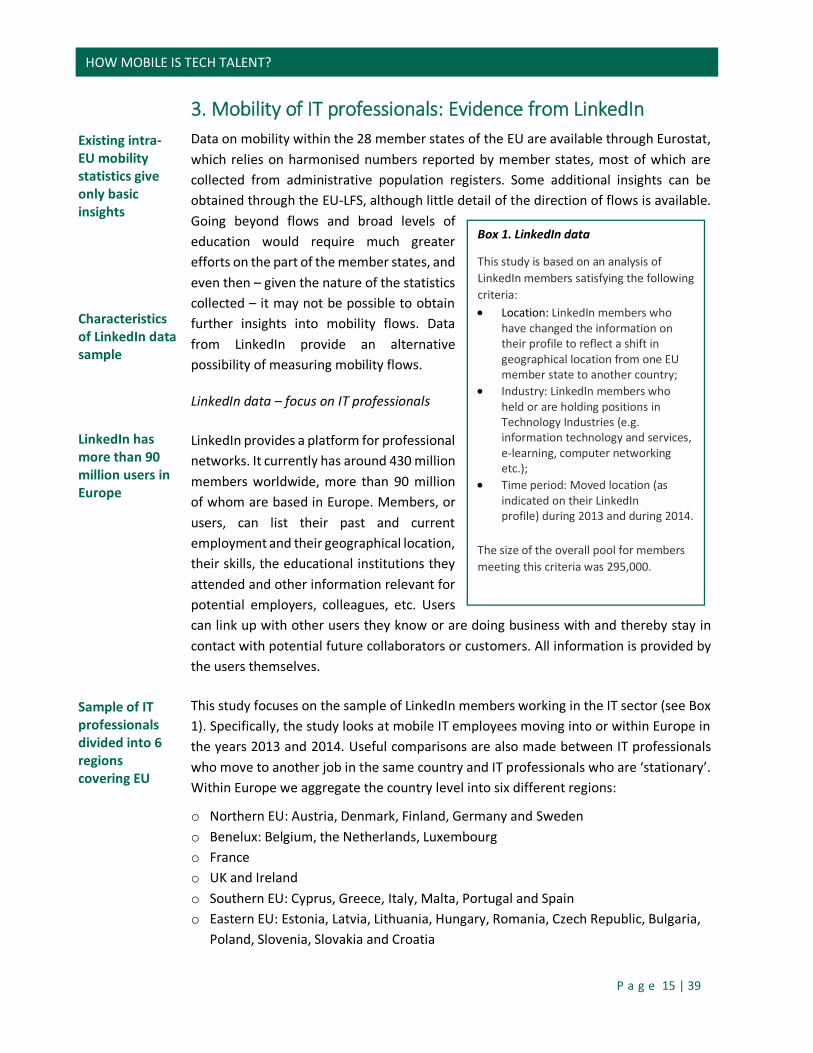
The direction of movements was broadly in line with overall mobility. Looking at flows between regions, Southern and eastern Europe together with France had a net outflow, whereas the opposite was the case for the UK, Ireland, Northern EU and the Benelux countries (Figure 5).
12 See European Commission (2016b) 13 See European Commission (2016b) and EY’s “Attractiveness survey - Europe 2015” (EY, 2014). 14 Since not every IT professional is a LinkedIn user the implied mobility rate is underestimated. Hence numbers in this section are in most cases clear lower bound estimates of the true mobility numbers.
P a g e 17 | 39
HOW MOBILE IS TECH TALENT?
The direction of mobility flows resemble those from the overall population Interesting bilateral region flows …
Figure 5. Movements of IT professionals between EU regions, 2014
Source: Authors’ own configuration based on LinkedIn data.
More than 90% of intra-EU mobility of IT professionals are moves between two of the six regions defined above; hence inter-regional flows are substantial (Figure 6). Moreover, as can be seen from Figure 5 for some regions net flows add up as well. The 10 percentage point net inflow to the UK and Ireland is equivalent to at least around 7,000 individuals. For comparison, this figure is close to 1% of all IT employees in the UK and Ireland as estimated from the EU-LFS. Likewise and of the same magnitude in relative and absolute size but in the opposite direction is the net flow out of southern EU. In fact, even for France, where the net outflow is smaller as a percentage of total flows, this outward mobility is substantial due to the lower absolute level of number of employees in the IT sector.
These flows can be a sign of a well-functioning EU labour market for IT professionals, but if they become persistent in terms of size and directions, they do represent significant barriers to the ambition of adding IT skills in southern and eastern EU.
The aggregated inflows and outflows to each region hide some interesting bilateral flows. Around 40% of IT movers coming from outside the UK and Ireland went to those two countries. Southern Europe received 20% of mobile IT people originating outside southern Europe. Close to half of these came from the UK and Ireland. Given the continued depressed labour markets in southern Europe, a significant part of this flow is likely to consist of southern European IT professionals returning from the UK.15
15 See Table A2 in the Appendix for a further breakdown of intra-EU mobility of IT professionals.
31%
23%
14%
13%
9%
10%
21%
17%
23%
11%
13%
14%
-30% -20% -10% 0% 10% 20% 30% 40%
UK and Ireland
Northern EU
Southern EU
Benelux
France
Eastern EU
Outflow Inflow
P a g e 18 | 39
HOW MOBILE IS TECH TALENT?
…south and east to west and north are the primary directions UK, Ireland and Northern EU have substantial net inflows of IT professionals Spain is the largest contributor to southern EU outflows
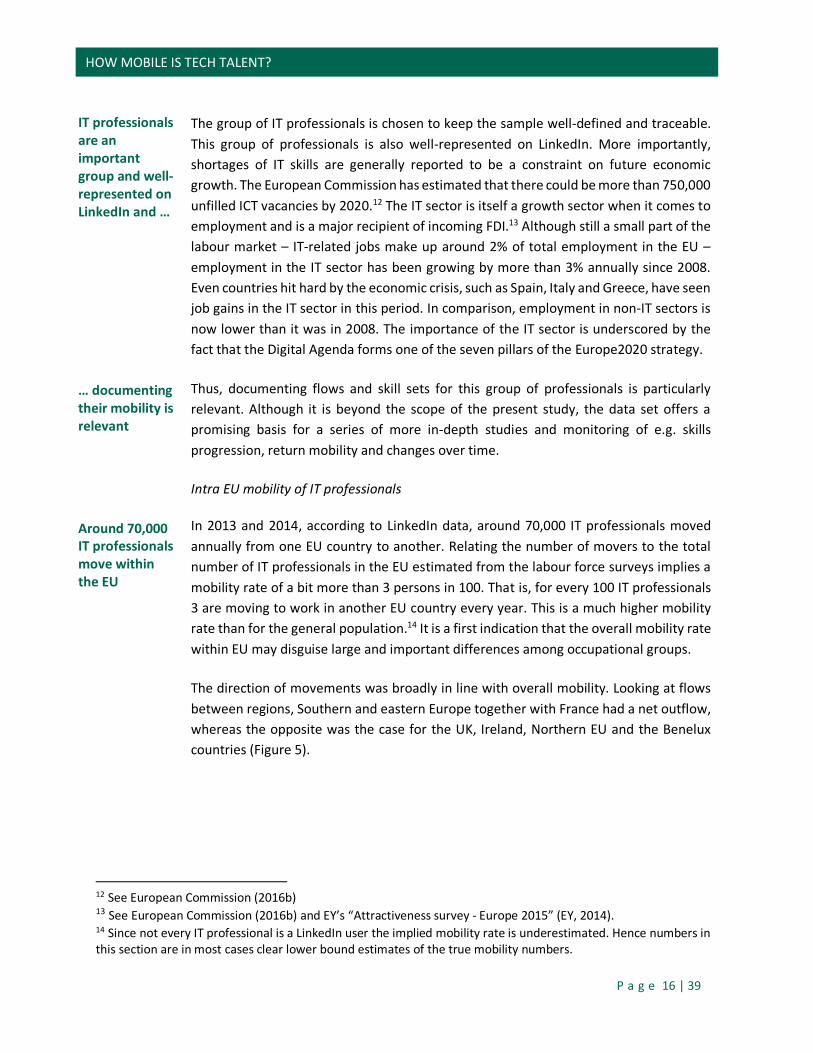
Mobility from the two main regions of origin, southern and eastern Europe, is destined for the UK and northern Europe, which have received in total around 70% of the inflow from these regions. In net flow terms, the UK and Ireland are receiving more than half of the net mobility of IT professionals. Another 30% goes to northern Europe and remaining 20% or less destined for the Benelux region. For the regions with a net outflow, around half comes from southern Europe with the rest coming (with an equal share) from France and eastern Europe (Figure 6). Figure 6 implies that the net flows account for 18% of total flows. This figure is interesting because it indicates the unidirectional character of flows composed of IT professionals. If net flows make up 100% of total flows, it means that flows go only in one direction; not necessarily to the same region, but regions receiving inflows have no outflow. Similarly, a value of 0% indicates that none of these regions are net losers of IT professionals.
Figure 6. Net flows of IT professionals (% of total flow), 2014
Source: Authors’ own configuration based on LinkedIn data.
Further disaggregating southern Europe shows Spain to be the largest contributor to these outflows of IT professionals, accounting for around one-half the share of southern Europe, while Italy account for one-third (see Table A3 in the Appendix).16 This implies that around one-quarter of observed total net flows of IT professionals in the data came from Spain in 2014.
16 At this finer level of aggregation, the data reported by LinkedIn may be more heavily influenced by the differences across countries in the number of LinkedIn members.
-10%
-5%
0%
5%
10%
15%
UK andIreland
Northern EU Benelux France Eastern EU Southern EU
P a g e 19 | 39
HOW MOBILE IS TECH TALENT?
Adjusting for regional differences in share of users yields similar results Looking specifically at young graduates… …amplifies results from the full sample
In terms of changes over time, the LinkedIn sample only goes back to 2013. Comparing 2013 and 2014 does not reveal any large changes. The relative numbers are stable – as one would expect from one year changes in a large sample.
The regions differ in the share of IT professionals using LinkedIn. The implication is that the sample of LinkedIn users is skewed towards some regions and underrepresents other regions. Southern EU, for example, is underrepresented while UK and Ireland, France and Benelux are overrepresented. Adjusting for these differences in representativeness using EU-LFS estimates of the number of IT professionals in each region does not changes the overall mobility picture qualitatively. However, net outflows from Southern and Eastern EU are exacerbated, net inflows into the UK and Ireland increases, whereas the net inflow of IT professionals into northern EU becomes somewhat smaller.
Recent graduates – more mobile?
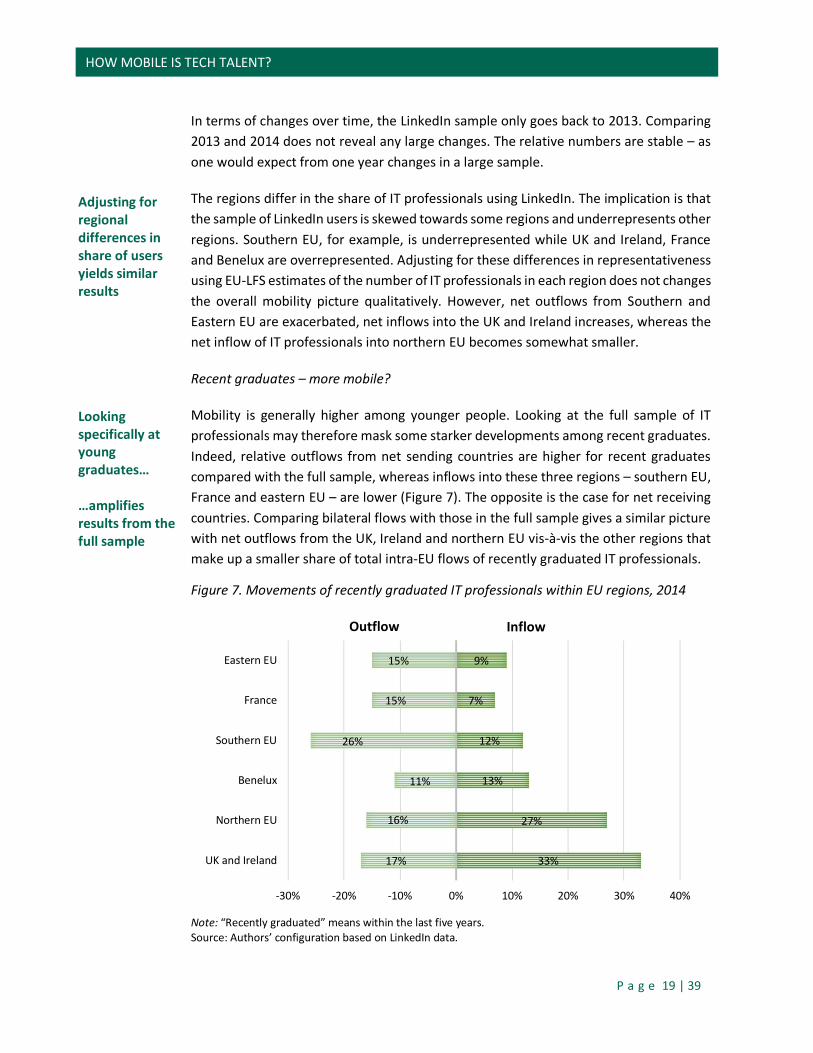
Mobility is generally higher among younger people. Looking at the full sample of IT professionals may therefore mask some starker developments among recent graduates. Indeed, relative outflows from net sending countries are higher for recent graduates compared with the full sample, whereas inflows into these three regions – southern EU, France and eastern EU – are lower (Figure 7). The opposite is the case for net receiving countries. Comparing bilateral flows with those in the full sample gives a similar picture with net outflows from the UK, Ireland and northern EU vis-à-vis the other regions that make up a smaller share of total intra-EU flows of recently graduated IT professionals.
Figure 7. Movements of recently graduated IT professionals within EU regions, 2014
Note: “Recently graduated” means within the last five years. Source: Authors’ configuration based on LinkedIn data.
33%
27%
13%
12%
7%
9%
17%
16%
11%
26%
15%
15%
-30% -20% -10% 0% 10% 20% 30% 40%
UK and Ireland
Northern EU
Benelux
Southern EU
France
Eastern EU
Outflow Inflow
P a g e 20 | 39
HOW MOBILE IS TECH TALENT?
Net flows are a larger share of total flows for recent graduates
Movers from Spain better educated than stayers
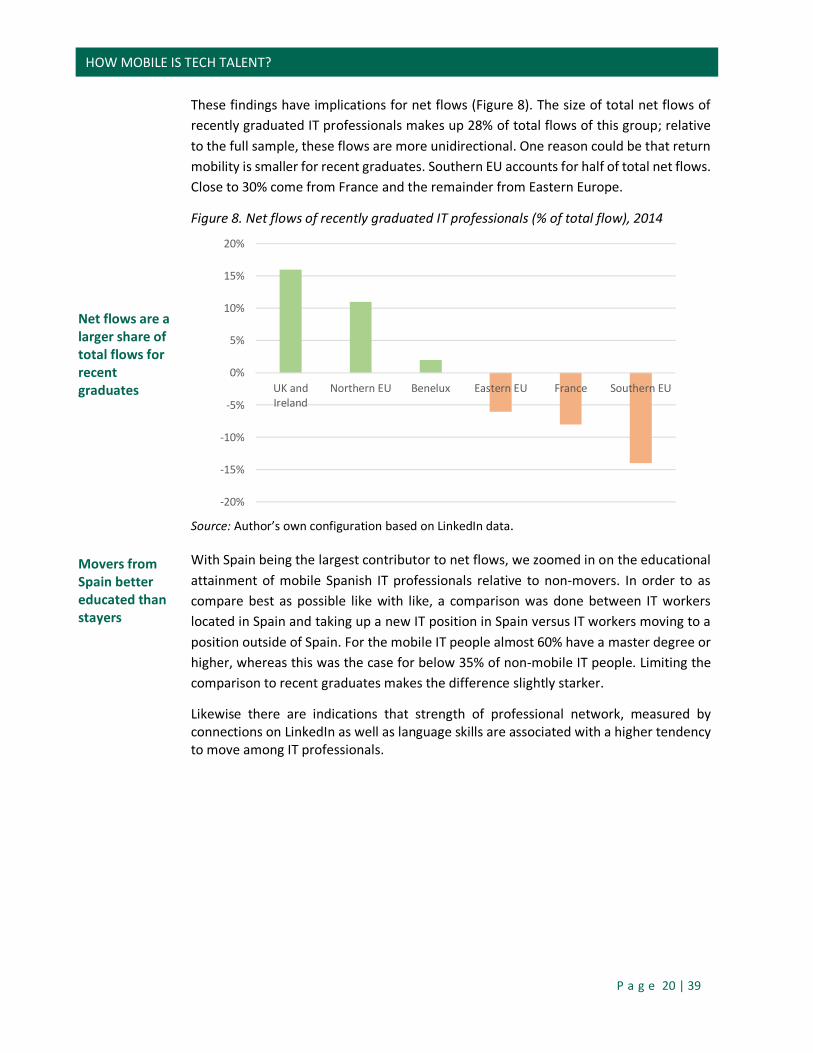
These findings have implications for net flows (Figure 8). The size of total net flows of recently graduated IT professionals makes up 28% of total flows of this group; relative to the full sample, these flows are more unidirectional. One reason could be that return mobility is smaller for recent graduates. Southern EU accounts for half of total net flows. Close to 30% come from France and the remainder from Eastern Europe.
Figure 8. Net flows of recently graduated IT professionals (% of total flow), 2014
Source: Author’s own configuration based on LinkedIn data.
With Spain being the largest contributor to net flows, we zoomed in on the educational attainment of mobile Spanish IT professionals relative to non-movers. In order to as compare best as possible like with like, a comparison was done between IT workers located in Spain and taking up a new IT position in Spain versus IT workers moving to a position outside of Spain. For the mobile IT people almost 60% have a master degree or higher, whereas this was the case for below 35% of non-mobile IT people. Limiting the comparison to recent graduates makes the difference slightly starker.
Likewise there are indications that strength of professional network, measured by connections on LinkedIn as well as language skills are associated with a higher tendency to move among IT professionals.
-20%
-15%
-10%
-5%
0%
5%
10%
15%
20%
UK andIreland
Northern EU Benelux Eastern EU France Southern EU

P a g e 21 | 39
HOW MOBILE IS TECH TALENT?
Modern economies thrive on a highly-skilled workforce
750,000 ICT vacancies in the EU by 2020
4. The war for talent 4.1. The stakes and the competition
Innovation and productivity gains are the engines of rising prosperity in Europe. In the past, population growth and technological advances in production processes could be relied upon to generate strong economic growth. Conversely, in today’s knowledge economies, human capital is the backbone of the economy where skills and innovative capacities determine the share in global value-added and domestic job creation. The conversion into a knowledge-driven society is by no means a new concept. In a famous speech in 1943, Winston Churchill proclaimed that “the empires of the future will be the empires of the mind”. In more recent times this notion has been taken up in the global talent debate. In 1997, McKinsey published a study referring to the ‘war for talent’, the international competition for the most skilled, which is playing out at the level of individual firms. As demographic trends worsens, not only in the EU but also in China, this concept is becoming just as relevant from a macroeconomic as from a business perspective,17 even beyond the pension sustainability debate. If multinational corporations are no longer able to find an adequate workforce in one country, they are likely in the medium term to relocate to another where they can find the necessary skills. Skills shortages have become the key challenges for employers, according to recent surveys, particularly in countries with low unemployment such as German or Austria. These employers are now embracing foreign recruitment as a viable alternative.18
With more than 500,000 listed vacancies in the EU alone, the IT sector is one of the most strained recruitment fields, and bottlenecks are growing in Germany, UK and Italy. ICT vacancies are predicted to rise to 750,000 by 2020.19 The shortage of qualified IT specialists is especially pronounced since the required skills (or even fields of expertise) are rapidly changing, e.g. experience in cloud computing has recently become a mainstream qualification in high demand. Those who possess these skills can virtually choose the country they wish to work in and companies try to lure IT talent from all over the world to join their teams. European firms have to compete with their American counterparts to recruit foreign talent while struggling to retain their domestic human capital. In the medium to long term, other competitors such as China (and other emerging market countries) are becoming more attractive as their standard of living rises and economic growth exceeds that of its western competitors. At the moment, China may still lose more talent to Europe than vice versa, but with the tremendous and rapid demographic change underway, the Chinese government is bound to implement policies
17 For more information, see Morehouse & Busse (2014). 18 Bitcom Research (2013) and EY (2014). 19 See Digitaleurope (2014) and European Commission (2016b)
P a g e 22 | 39
HOW MOBILE IS TECH TALENT?
EU’s main competitor for talent is the United States 50% of IT flows occur within the EU and… …more than 20,000 IT talents leave the EU per annum
to curb their ‘brain drain’ and introduce policy measures to attract foreign talent in order to mitigate their own high-skilled labour shortages.20
For the moment, the US remains the main adversary for the EU in the talent game, not only competing for the same talent from third countries, but just as importantly on a bilateral basis. Many of the world’s leading IT companies are headquartered in the US, and the country is renowned for its innovative-friendly business environment, as well as the knowledge clusters such as Silicon Valley. Moreover, American universities are unmatched by their European counterparts in attracting foreign talent (with the exceptions perhaps of Cambridge and Oxford).21
As pointed out in section 2, most of the ‘evidence’ on the competition for talent is anecdotal or based on out-of-date and highly aggregated data, with the result that we know very little in general about talent flows within and out of the EU. LinkedIn data may hold the promise to change this. In principle, LinkedIn data can provide up-to-date and comparable insights for researchers and policy-makers on movements of talent.
4.2. LinkedIn insights - quantity
The good news for the EU, based on our analysis of LinkedIn data, is the high share of intra-EU mobility in total migration of IT workers. According to LinkedIn data, in 2014 around 70,000 IT professionals moved between EU member states. Mobility facilitates the optimal allocation of labour across the EU to the benefit of the EU, whereas external migration patterns may be hampering European growth potential if the net migration rate is negative. A temporary net emigration does not necessarily constitute a loss for the EU if these emigrants return after a short stay abroad with new skills and connections, which in turn can boost productivity.
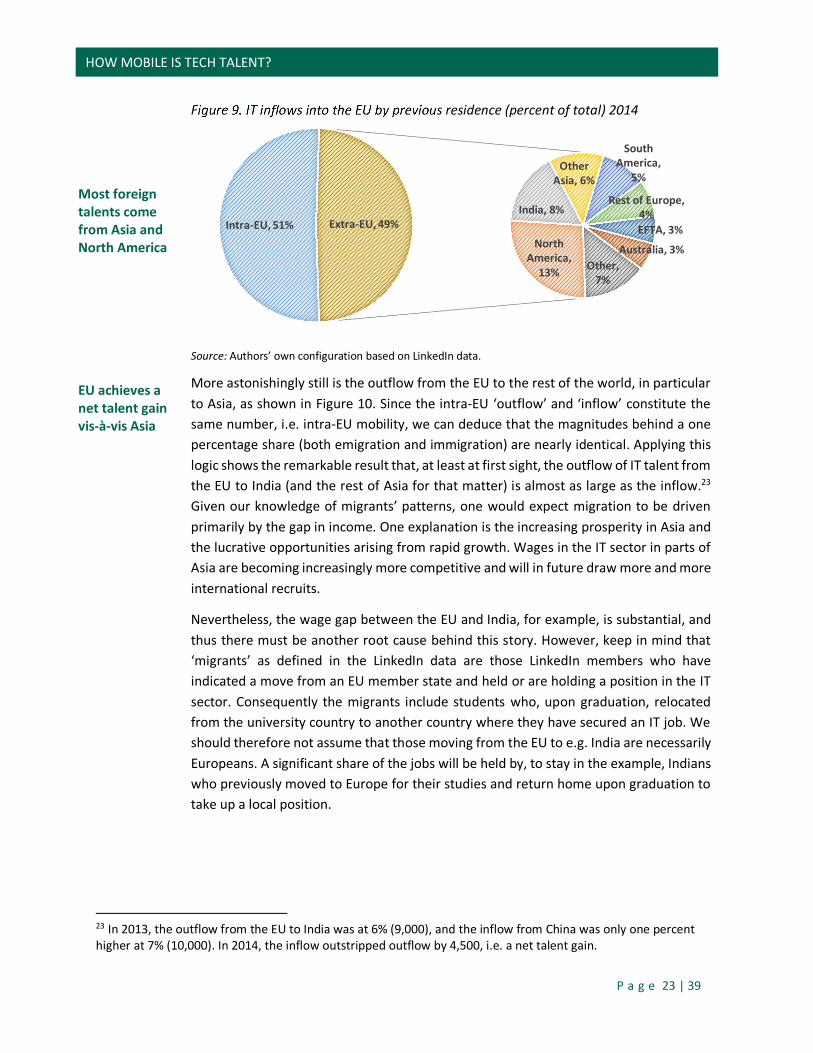
Total emigration of EU IT professionals stood at 70,000 in 2014, just equal to total IT mobility. Abstracting from this intra-EU mobility and viewing the EU as one economic area, the flow of IT workers to the EU is dominated by North America (mainly the United States), accounting for 26% of all non-intra EU inflows, or in absolute numbers about 19,000 IT specialists (Figure 9). Asia is the second-largest external inflow group providing 24% (or 18,000 IT persons), a third of that supplied alone from India, whereas China supplies only 3,000 IT talents22. EFTA countries and the rest of Europe are an important IT recruitment ground due to their relatively good education systems and their geographical proximity. South America features as well partially due to the region’s ties with Spain and Portugal. Given its size, Australia also makes up a surprisingly large share.
20 See Bloomberg (2008) and The Economist (2006). 21 The Economist (2015). 22 Inflow statistics are likely to be underestimated since LinkedIn market penetration rates in Asia are lower than in the EU and it differs greatly among Asian countries.
P a g e 23 | 39
HOW MOBILE IS TECH TALENT?
Most foreign talents come from Asia and North America EU achieves a net talent gain vis-à-vis Asia
Figure 9. IT inflows into the EU by previous residence (percent of total) 2014
Source: Authors’ own configuration based on LinkedIn data.
More astonishingly still is the outflow from the EU to the rest of the world, in particular to Asia, as shown in Figure 10. Since the intra-EU ‘outflow’ and ‘inflow’ constitute the same number, i.e. intra-EU mobility, we can deduce that the magnitudes behind a one percentage share (both emigration and immigration) are nearly identical. Applying this logic shows the remarkable result that, at least at first sight, the outflow of IT talent from the EU to India (and the rest of Asia for that matter) is almost as large as the inflow.23
Given our knowledge of migrants’ patterns, one would expect migration to be driven primarily by the gap in income. One explanation is the increasing prosperity in Asia and the lucrative opportunities arising from rapid growth. Wages in the IT sector in parts of Asia are becoming increasingly more competitive and will in future draw more and more international recruits.
Nevertheless, the wage gap between the EU and India, for example, is substantial, and thus there must be another root cause behind this story. However, keep in mind that ‘migrants’ as defined in the LinkedIn data are those LinkedIn members who have indicated a move from an EU member state and held or are holding a position in the IT sector. Consequently the migrants include students who, upon graduation, relocated from the university country to another country where they have secured an IT job. We should therefore not assume that those moving from the EU to e.g. India are necessarily Europeans. A significant share of the jobs will be held by, to stay in the example, Indians who previously moved to Europe for their studies and return home upon graduation to take up a local position.
23 In 2013, the outflow from the EU to India was at 6% (9,000), and the inflow from China was only one percent higher at 7% (10,000). In 2014, the inflow outstripped outflow by 4,500, i.e. a net talent gain.
Intra-EU, 51%North
America, 13%
India, 8%
Other Asia, 6%
South America,
5%
Rest of Europe, 4%EFTA, 3%
Australia, 3%Other,
7%
Extra-EU, 49%
P a g e 24 | 39
HOW MOBILE IS TECH TALENT?
The US is most attractive student destination due to its high university ranking The US is also the biggest EU talent magnet…
… but US-EU talent flows are balanced
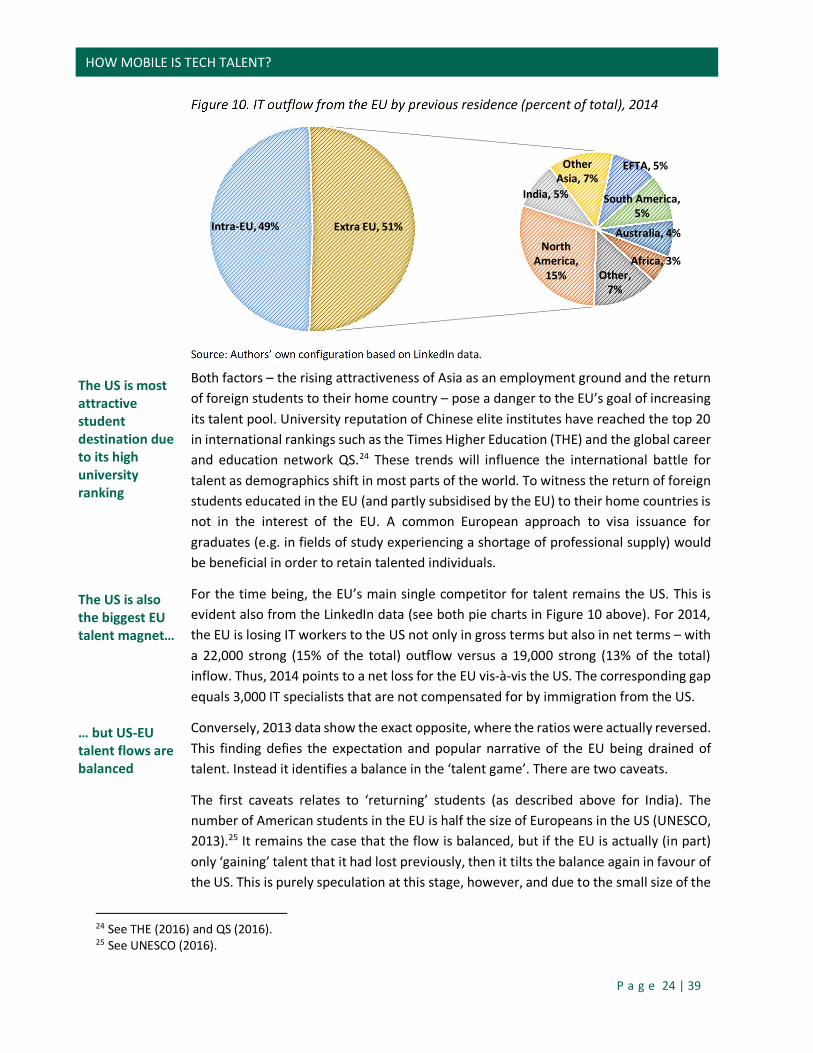
Figure 10. IT outflow from the EU by previous residence (percent of total), 2014
Source: Authors’ own configuration based on LinkedIn data.
Both factors – the rising attractiveness of Asia as an employment ground and the return of foreign students to their home country – pose a danger to the EU’s goal of increasing its talent pool. University reputation of Chinese elite institutes have reached the top 20 in international rankings such as the Times Higher Education (THE) and the global career and education network QS.24 These trends will influence the international battle for talent as demographics shift in most parts of the world. To witness the return of foreign students educated in the EU (and partly subsidised by the EU) to their home countries is not in the interest of the EU. A common European approach to visa issuance for graduates (e.g. in fields of study experiencing a shortage of professional supply) would be beneficial in order to retain talented individuals.
For the time being, the EU’s main single competitor for talent remains the US. This is evident also from the LinkedIn data (see both pie charts in Figure 10 above). For 2014, the EU is losing IT workers to the US not only in gross terms but also in net terms – with a 22,000 strong (15% of the total) outflow versus a 19,000 strong (13% of the total) inflow. Thus, 2014 points to a net loss for the EU vis-à-vis the US. The corresponding gap equals 3,000 IT specialists that are not compensated for by immigration from the US.
Conversely, 2013 data show the exact opposite, where the ratios were actually reversed. This finding defies the expectation and popular narrative of the EU being drained of talent. Instead it identifies a balance in the ‘talent game’. There are two caveats.
The first caveats relates to ‘returning’ students (as described above for India). The number of American students in the EU is half the size of Europeans in the US (UNESCO, 2013).25 It remains the case that the flow is balanced, but if the EU is actually (in part) only ‘gaining’ talent that it had lost previously, then it tilts the balance again in favour of the US. This is purely speculation at this stage, however, and due to the small size of the
24 See THE (2016) and QS (2016). 25 See UNESCO (2016).
Intra-EU, 49%
North America,
15%
India, 5%
Other Asia, 7%
EFTA, 5%
South America, 5%
Australia, 4%
Africa, 3%Other,
7%
Extra EU, 51%
P a g e 25 | 39
HOW MOBILE IS TECH TALENT?
For every IT specialist the EU loses to the US it only receives 0.6 in return
Large networks facilitate international mobility
The EU is losing the talent war
Public data offers little insights into quality of movers...
annual flow of all (not just IT) EU students to the US (at around 60,000), it may not influence the result significantly.
The second, more crucial caveat lies in the difference in the share of LinkedIn users. LinkedIn’s penetration rates (share of the workforce who is on LinkedIn) are extraordinarily high in the US at around 80%. In Europe the share only reaches 40%. Consequently our previous EU-US estimates are biased towards US outflows; that is, we are under-representing EU citizens moving to the US due to the fact that they are less likely to have a LinkedIn profile.
Indeed once adjusted for differences in penetration rates in the IT sector, the balanced relationship turns into a loss pattern for the EU. After adjustment there are 1.6 EU IT workers moving to the US for every US IT worker moving to the EU, in other words the EU receives only 0.6 persons from the US for every person the EU sends across the Atlantic. For 2014 this translates into an inflow of 19,000 IT professionals from the US and an outflow from the EU to the US of 31,000 IT talents. Consequently a good estimate is that the EU loses around 10,000 IT specialists annually. This human capital loss is substantial if accumulated over a decade.
The adjustment used above, on the other hand, may overemphasise the loss slightly, since Europeans can be expected to join LinkedIn once they have moved to the US and ‘adapted’ or have even done so already in preparing for the relocation.
Indeed participation on LinkedIn and even more so having many international connections on this platform greatly increases the likelihood of a person moving later in life. LinkedIn data show that tech migrants, for example from Spain, who have emigrated to the US, have 1.8 times as many connections as those who started a new job in Spain. Even when excluding US-based and Spanish-based connections, Spanish movers to the US still profit from a 1.3 times larger network than their immobile counterparts.26
Overall, at least from the perspective of LinkedIn data, the EU does not fare well in the international competition for IT skills, as the Union loses around 10,000 IT professionals to the US every year. Many of these echoed fears evolve exclusively around the term ‘talent’. It is therefore useful to take a deeper look at the ‘quality’ of those leaving and arriving.
4.3. LinkedIn insights - quality
For policy-makers the ultimate aim in the talent game is to raise productivity and increase potential growth. For this purpose the volume of workers is less important than the quality.27 Comparing international performance of (secondary-level) students has
26 Movers also tend to have a larger domestic (e.g. Spanish) network than those who started a new job in the domestic (Spanish) labour market. 27 See Woessmann, 2014.
P a g e 26 | 39
HOW MOBILE IS TECH TALENT?
… LinkedIn data offers a wealth of new knowledge
Intra-EU mobile IT workers are more educated than the ‘immobile’ ones…
become possible thanks to the OECD’s PISA studies. To date, however, no such test exists for university students – let alone one being followed up by post-graduation tracking of geographical entry into the labour market. The OECD’s AHELO (Assessment of Higher Education Learning Outcomes) project may achieve the former within the next five years and thereby provide an overview of skills by country, although it does not allow for inferences on the competition for talent other than the creation of talent.28 The OECD’s Programme for the International Assessment of Adult Competencies (PIAAC) survey offers some insights into the skills endowment of the adult population and while it is possible to isolate migrants, the number of observations is not sufficiently large to assess the talent gain/loss. Furthermore all these survey have the shortcoming of not being sufficiently timely, owing to the fact that the surveys are published following a substantial delay and are conducted only every three to five years.
LinkedIn data analytics, on the other hand, offer insights into current observations which can be tracked over time. Unfortunately few knowledge test results are listed by users on the website, since not everyone highlights academic records or e.g. GMAT scores. The best measure of talent that is systematically captured and comparable is educational attainment. Unlike the OECD data on educational attainment (which are far outdated in any case), the LinkedIn profiles allow us to differentiate between bachelor-level, master-level and PhD degrees for all countries (or, in our case, regions). The level of academic degree attained is not the ideal proxy for talent, but the concept itself is nearly impossible to define.
For the IT sector, however, the skills obtained during one’s academic training are likely to be high in demand on the labour market. While a university drop-out may turn out to be the most talented (in terms of his/her contribution to economic growth via innovation, it is nevertheless safe to assume that for this sector (on average) the level of educational attainment is a reasonable proxy for quality.
Overall IT migrants
Most regular IT jobs require applicants to hold at least a bachelor degree in a related field of study, a fact that is supported by the educational attainment of European IT workers listed on LinkedIn. Virtually all employees in the IT sector who have recently taken up a new position in that sector hold at least a bachelor degree and over 50% have obtained a masters or PhD degree (see Figure 11, middle bar chart).
Our assumption that mobile workers in general tend to be highly educated can also be confirmed at least for the tech sector (see Figure 11, left-hand bar chart). EU mobile workers who moved from one EU member state to another to take up a position are more qualified than those who stayed within their country/region. More than 2/3 hold at least a master’s degree, compared to around 50% of ‘immobile’ workers.
28 See OECD, 2014.
P a g e 27 | 39
HOW MOBILE IS TECH TALENT?
…and those leaving to the US are not more educated than EU mobile citizens The EU receives the same ‘quality level’ of talent from the US as it gives
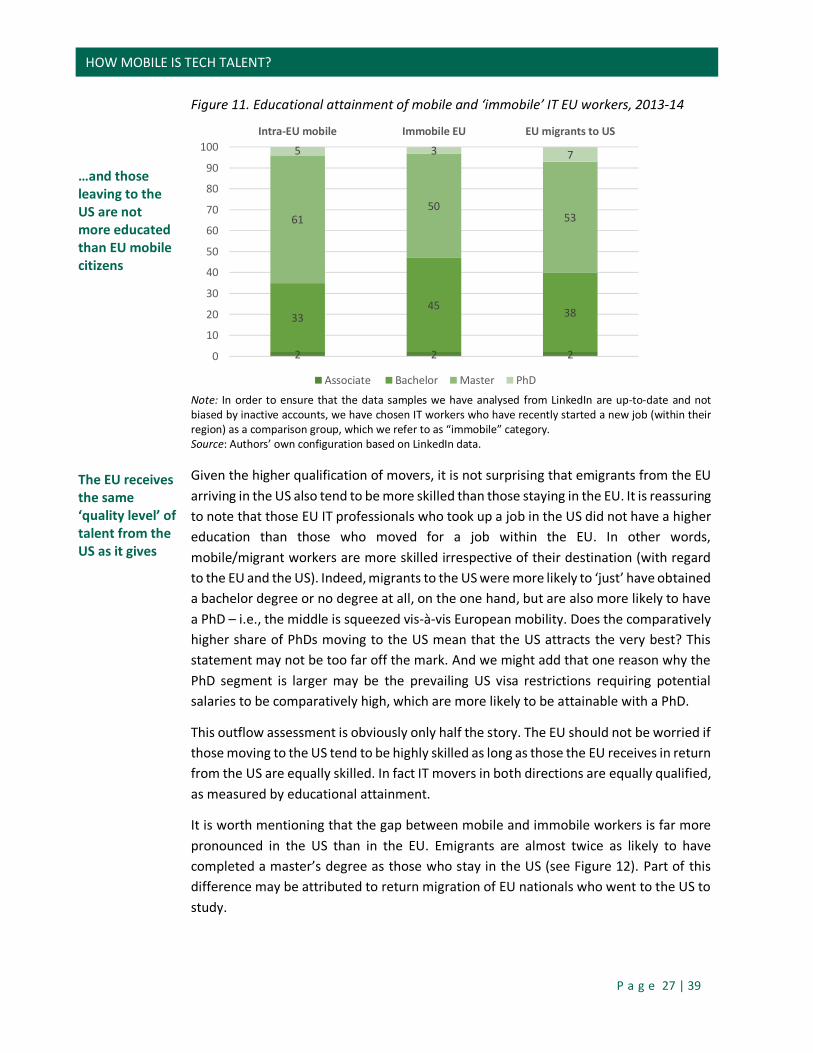
Figure 11. Educational attainment of mobile and ‘immobile’ IT EU workers, 2013-14
Note: In order to ensure that the data samples we have analysed from LinkedIn are up-to-date and not biased by inactive accounts, we have chosen IT workers who have recently started a new job (within their region) as a comparison group, which we refer to as “immobile” category. Source: Authors’ own configuration based on LinkedIn data. Given the higher qualification of movers, it is not surprising that emigrants from the EU arriving in the US also tend to be more skilled than those staying in the EU. It is reassuring to note that those EU IT professionals who took up a job in the US did not have a higher education than those who moved for a job within the EU. In other words, mobile/migrant workers are more skilled irrespective of their destination (with regard to the EU and the US). Indeed, migrants to the US were more likely to ‘just’ have obtained a bachelor degree or no degree at all, on the one hand, but are also more likely to have a PhD – i.e., the middle is squeezed vis-à-vis European mobility. Does the comparatively higher share of PhDs moving to the US mean that the US attracts the very best? This statement may not be too far off the mark. And we might add that one reason why the PhD segment is larger may be the prevailing US visa restrictions requiring potential salaries to be comparatively high, which are more likely to be attainable with a PhD.
This outflow assessment is obviously only half the story. The EU should not be worried if those moving to the US tend to be highly skilled as long as those the EU receives in return from the US are equally skilled. In fact IT movers in both directions are equally qualified, as measured by educational attainment.
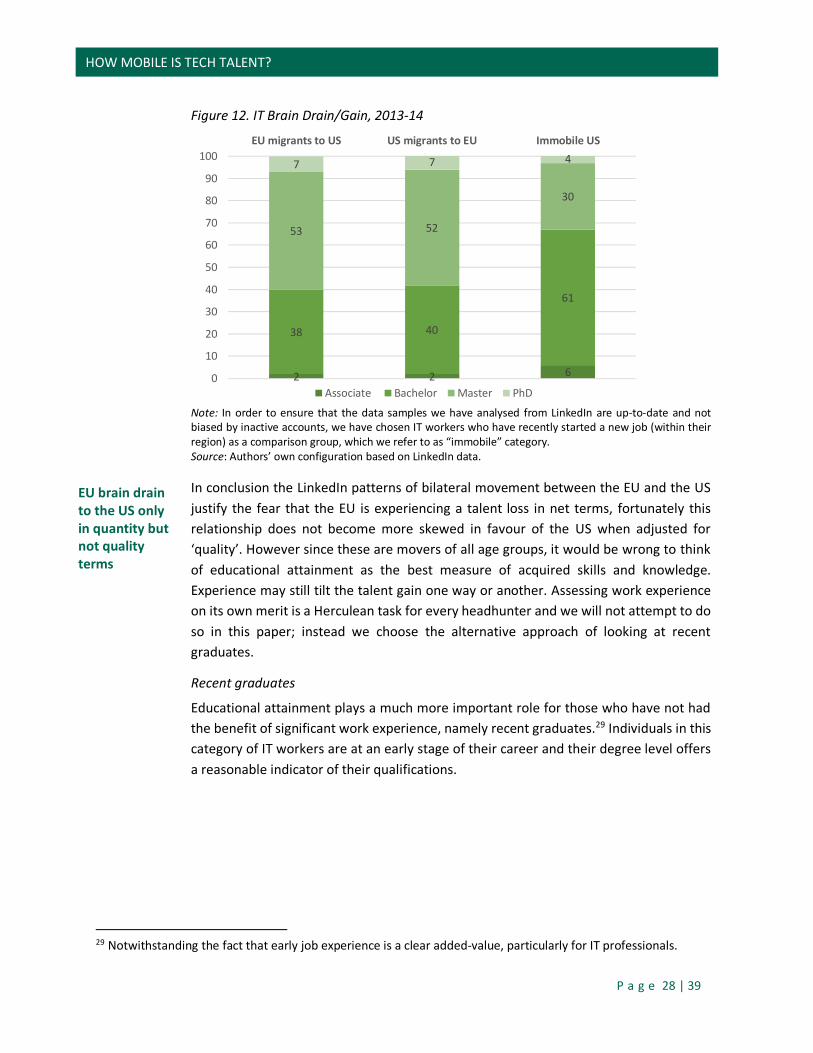
It is worth mentioning that the gap between mobile and immobile workers is far more pronounced in the US than in the EU. Emigrants are almost twice as likely to have completed a master’s degree as those who stay in the US (see Figure 12). Part of this difference may be attributed to return migration of EU nationals who went to the US to study.
2 2 2
3345 38
6150
53
5 3 7
0
10
20
30
40
50
60
70
80
90
100Intra-EU mobile Immobile EU EU migrants to US
Associate Bachelor Master PhD
P a g e 28 | 39
HOW MOBILE IS TECH TALENT?
EU brain drain to the US only in quantity but not quality terms
Figure 12. IT Brain Drain/Gain, 2013-14
Note: In order to ensure that the data samples we have analysed from LinkedIn are up-to-date and not biased by inactive accounts, we have chosen IT workers who have recently started a new job (within their region) as a comparison group, which we refer to as “immobile” category. Source: Authors’ own configuration based on LinkedIn data. In conclusion the LinkedIn patterns of bilateral movement between the EU and the US justify the fear that the EU is experiencing a talent loss in net terms, fortunately this relationship does not become more skewed in favour of the US when adjusted for ‘quality’. However since these are movers of all age groups, it would be wrong to think of educational attainment as the best measure of acquired skills and knowledge. Experience may still tilt the talent gain one way or another. Assessing work experience on its own merit is a Herculean task for every headhunter and we will not attempt to do so in this paper; instead we choose the alternative approach of looking at recent graduates.
Recent graduates
Educational attainment plays a much more important role for those who have not had the benefit of significant work experience, namely recent graduates.29 Individuals in this category of IT workers are at an early stage of their career and their degree level offers a reasonable indicator of their qualifications.
29 Notwithstanding the fact that early job experience is a clear added-value, particularly for IT professionals.
2 2 6
38 40
61
53 52
30
7 7 4
0
10
20
30
40
50
60
70
80
90
100EU migrants to US US migrants to EU Immobile US
Associate Bachelor Master PhD
P a g e 29 | 39
HOW MOBILE IS TECH TALENT?
Recent graduates are more likely to move within the EU than outside The very best recent graduates are moving to the US and…
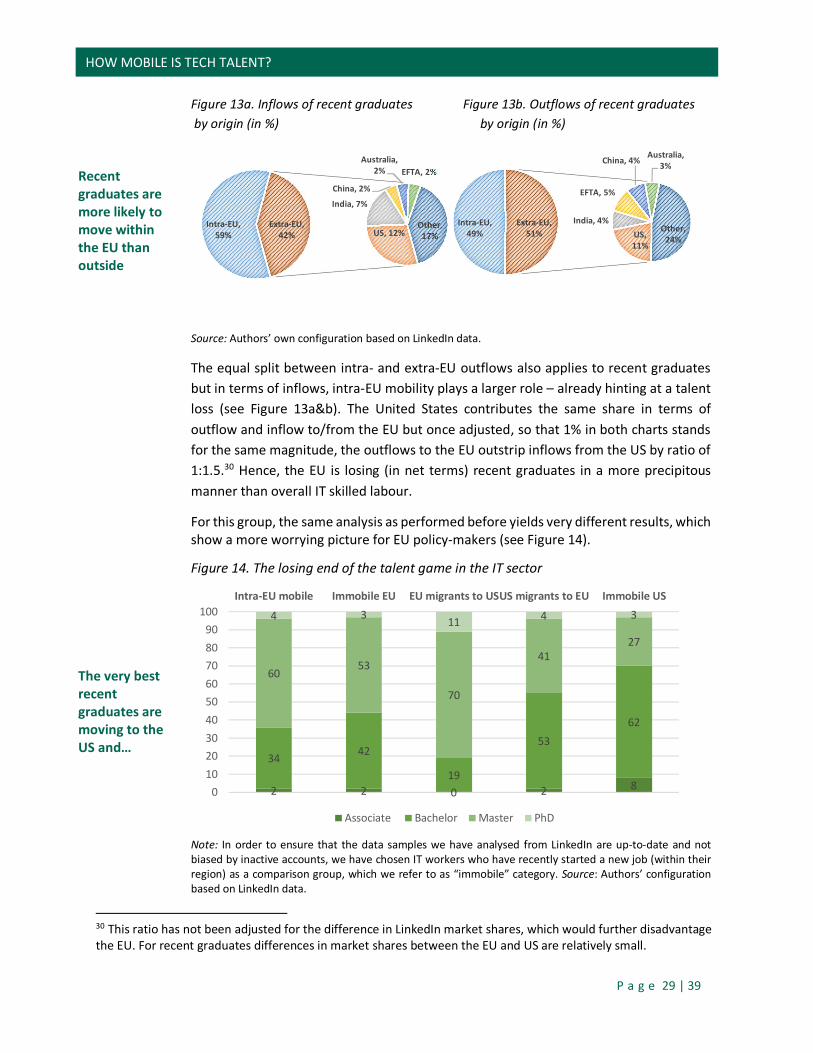
Figure 13a. Inflows of recent graduates Figure 13b. Outflows of recent graduates by origin (in %) by origin (in %)
Source: Authors’ own configuration based on LinkedIn data.
The equal split between intra- and extra-EU outflows also applies to recent graduates but in terms of inflows, intra-EU mobility plays a larger role – already hinting at a talent loss (see Figure 13a&b). The United States contributes the same share in terms of outflow and inflow to/from the EU but once adjusted, so that 1% in both charts stands for the same magnitude, the outflows to the EU outstrip inflows from the US by ratio of 1:1.5.30 Hence, the EU is losing (in net terms) recent graduates in a more precipitous manner than overall IT skilled labour.
For this group, the same analysis as performed before yields very different results, which show a more worrying picture for EU policy-makers (see Figure 14).
Figure 14. The losing end of the talent game in the IT sector
Note: In order to ensure that the data samples we have analysed from LinkedIn are up-to-date and not biased by inactive accounts, we have chosen IT workers who have recently started a new job (within their region) as a comparison group, which we refer to as “immobile” category. Source: Authors’ configuration based on LinkedIn data.
30 This ratio has not been adjusted for the difference in LinkedIn market shares, which would further disadvantage the EU. For recent graduates differences in market shares between the EU and US are relatively small.
Intra-EU, 59% US, 12%
India, 7%
China, 2%
Australia, 2% EFTA, 2%
Other, 17%
Extra-EU, 42%
Intra-EU, 49% US,
11%
India, 4%
EFTA, 5%
China, 4% Australia, 3%
Other, 24%
Extra-EU, 51%
2 2 0 2 8
34 42
19
5362
6053
70
4127
4 3 11 4 3
0102030405060708090
100Intra-EU mobile Immobile EU EU migrants to USUS migrants to EU Immobile US
Associate Bachelor Master PhD
P a g e 30 | 39
HOW MOBILE IS TECH TALENT?
…the recent graduates EU receives in return have by far lower educational attainment
Overall, IT movers have the most valued skills/ specialization EU-US migrants have similar skills listed
Indeed, it is still the case that EU mobile workers are more educated than those who stay and migrants from both sides of the Atlantic outperform their immobile counterparts. Recent graduates from the EU who moved to the US are now three to four times more likely to hold a PhD than those who stay behind. Furthermore, around 80% of those emigrants hold at least a master’s degree. In other words, those recruited by the US are significantly better educated – the bar in the middle in Figure 14 stands out starkly. Clearly the EU is losing its most educated graduates to the US, and this time the opposite flow does not compensate the loss. The truly disquieting aspect is the ensuing qualification discrepancy between US migrants versus EU migrants. IT graduates from the EU are twice as likely to have at least a master’s degree and almost three times as likely to have a PhD as the US immigrants in Europe. The skewered relationship poses a serious challenge to the EU’s determination to remain internationally competitive in the talent game.
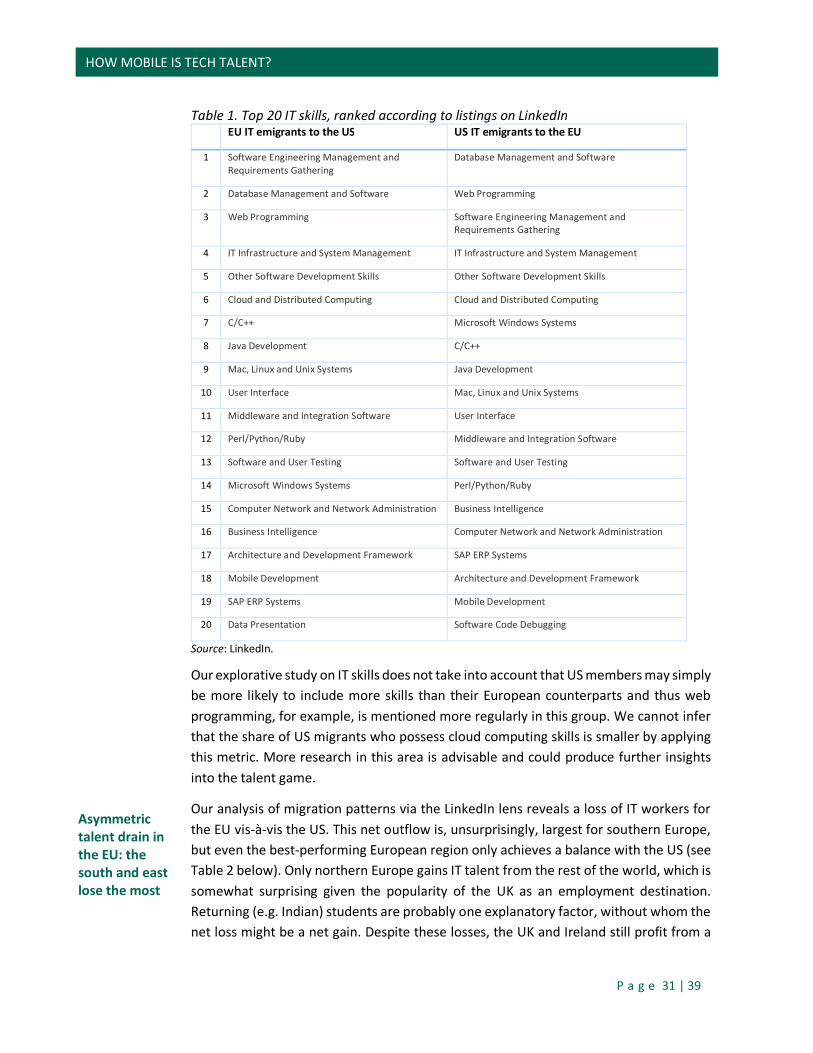
Looking beyond the level of degree attained, one can dive even deeper into the wealth of information hosted on LinkedIn and assess the skills of movers directly. The skills listed on LinkedIn are posted by members themselves (and can be endorsed by their colleagues). For IT professionals, the skills vary from web programming to cloud computing. One cannot objectively determine which of these skills per se is the most valuable, but labour market demand and average salary level provide a reasonable proxy. Table 1 highlights the 20 most-frequently listed IT skills found on LinkedIn for IT emigrants from the EU to the US and vice versa. Just as for educational attainment, movers are more likely to possess skills that are highly valued than those who remain in their country/region (see also Table A1 in the Appendix).
From a ‘war for talent’ perspective, no fundamental differences stand out between the EU and the US at first sight, although some small differences in the ranking of IT skills hint at the higher desirability of EU migrants relative to US migrants. For example, the relatively high-paying and scarce skill “Software Engineering Management and Requirements Gathering” ranks in first place for EU emigrants, whereas two less high-end skills – “Web Programming” and “Database Management and Software” – appear in the first two positions for their American counterparts.
P a g e 31 | 39
HOW MOBILE IS TECH TALENT?
Asymmetric talent drain in the EU: the south and east lose the most
Table 1. Top 20 IT skills, ranked according to listings on LinkedIn EU IT emigrants to the US US IT emigrants to the EU
1 Software Engineering Management and Requirements Gathering
Database Management and Software
2 Database Management and Software Web Programming
3 Web Programming Software Engineering Management and Requirements Gathering
4 IT Infrastructure and System Management IT Infrastructure and System Management
5 Other Software Development Skills Other Software Development Skills
6 Cloud and Distributed Computing Cloud and Distributed Computing
7 C/C++ Microsoft Windows Systems
8 Java Development C/C++
9 Mac, Linux and Unix Systems Java Development
10 User Interface Mac, Linux and Unix Systems
11 Middleware and Integration Software User Interface
12 Perl/Python/Ruby Middleware and Integration Software
13 Software and User Testing Software and User Testing
14 Microsoft Windows Systems Perl/Python/Ruby
15 Computer Network and Network Administration Business Intelligence
16 Business Intelligence Computer Network and Network Administration
17 Architecture and Development Framework SAP ERP Systems
18 Mobile Development Architecture and Development Framework
19 SAP ERP Systems Mobile Development
20 Data Presentation Software Code Debugging
Source: LinkedIn.
Our explorative study on IT skills does not take into account that US members may simply be more likely to include more skills than their European counterparts and thus web programming, for example, is mentioned more regularly in this group. We cannot infer that the share of US migrants who possess cloud computing skills is smaller by applying this metric. More research in this area is advisable and could produce further insights into the talent game.
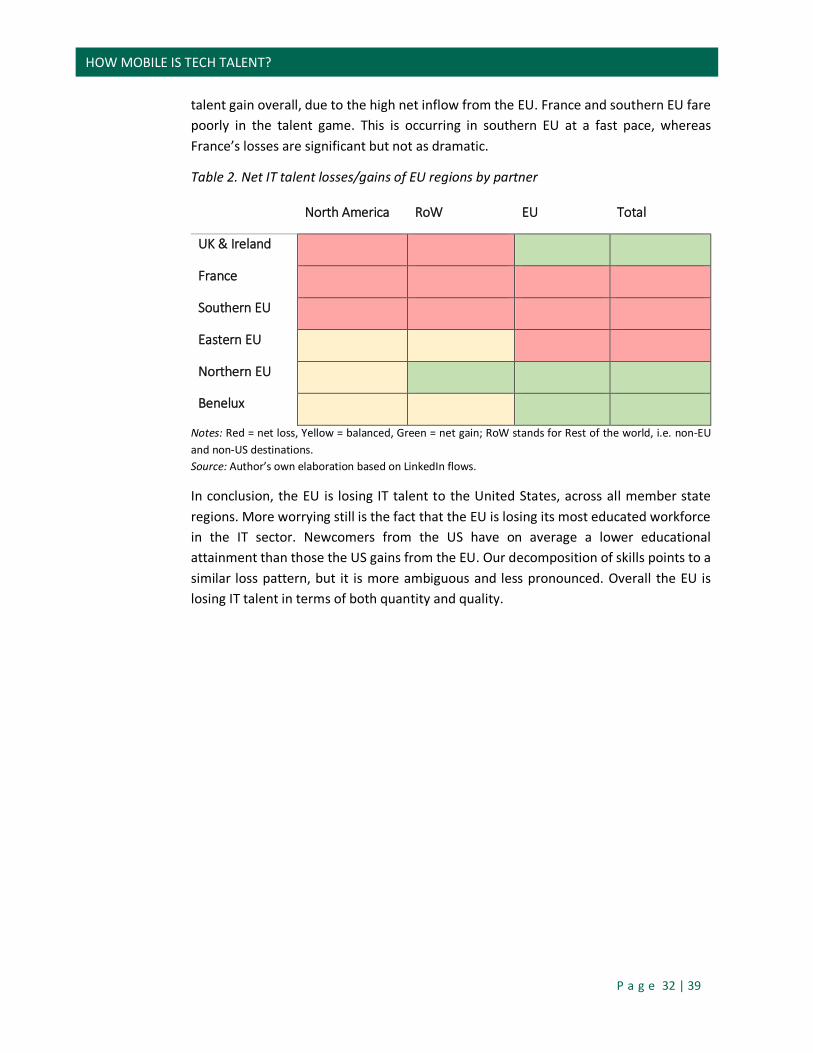
Our analysis of migration patterns via the LinkedIn lens reveals a loss of IT workers for the EU vis-à-vis the US. This net outflow is, unsurprisingly, largest for southern Europe, but even the best-performing European region only achieves a balance with the US (see Table 2 below). Only northern Europe gains IT talent from the rest of the world, which is somewhat surprising given the popularity of the UK as an employment destination. Returning (e.g. Indian) students are probably one explanatory factor, without whom the net loss might be a net gain. Despite these losses, the UK and Ireland still profit from a
P a g e 32 | 39
HOW MOBILE IS TECH TALENT?
talent gain overall, due to the high net inflow from the EU. France and southern EU fare poorly in the talent game. This is occurring in southern EU at a fast pace, whereas France’s losses are significant but not as dramatic.
Table 2. Net IT talent losses/gains of EU regions by partner
North America RoW EU Total
UK & Ireland
France
Southern EU
Eastern EU
Northern EU
Benelux
Notes: Red = net loss, Yellow = balanced, Green = net gain; RoW stands for Rest of the world, i.e. non-EU and non-US destinations. Source: Author’s own elaboration based on LinkedIn flows.
In conclusion, the EU is losing IT talent to the United States, across all member state regions. More worrying still is the fact that the EU is losing its most educated workforce in the IT sector. Newcomers from the US have on average a lower educational attainment than those the US gains from the EU. Our decomposition of skills points to a similar loss pattern, but it is more ambiguous and less pronounced. Overall the EU is losing IT talent in terms of both quantity and quality.
P a g e 33 | 39
HOW MOBILE IS TECH TALENT?
5. Policy recommendations and conclusions Mobility, or rather the free movement of people, has always been a central tenet in the European project. It is one of the fundamental freedoms. The need to acquire a better understanding of labour mobility is more deeply appreciated following the EU enlargements of the last decade, for both political and economic reasons. At the same time there is the perception that the EU is losing steam relative to the US and emerging economies. Part of this is due to demographic trends. But it is also widely believed that many places outside the EU offer better conditions for ambitious, talented people and job creators. In short, there is the fear is that the EU is losing the ‘war for talent’.
In light of the importance attached to mobility in the EU and the need to retain and attract talented people, surprisingly little is actually known about these phenomena. The main reason for this is the paucity of relevant data. But the problem goes beyond simply not collecting the right data in the right places. When it comes to mobile individuals, particularly when looking beyond the EU, relevant data may not be obtainable via conventional public surveys and censuses.
Large scale non-traditional data sources – so-called Big Data – may provide additional insights into the characteristics of mobility that are relevant for the EU and other world regions. As such, this study provides a first overview of the insights into intra-EU mobility and mobility to/from Europe vis-à-vis the rest of the world that can be gained from LinkedIn data. The sample of IT professionals gives a good starting point for exploring the types of analysis that can be performed and the policy implications that can be drawn.
Our findings suggest that, indeed, much can be learned from LinkedIn data. While we are a long way from being able to rely on regular representative statistics from non-traditional data providers, there is plenty of scope for topical studies to supplement and deepen insights from public data sources. In fact, there is plenty of scope for expanding even the present study. We also highlight issues that can hamper the usefulness of data sources, such as the body of data amassed by LinkedIn. Among them is the issue of LinkedIn data not being representative of the full population.
Our quantitative results show IT professionals to be particularly mobile compared with the general population. This is not surprising given that IT professionals have and use an intrinsic ‘common language’ as a basic work tool. It would be interesting to compare mobility in this group with other high-skilled professions where language barriers play a bigger role. It is worth noting that such a comparison is not feasible with the EU-LFS or other public data sources. The pattern of intra-EU mobility is similar to the one for the overall population: flows go from east to west and south to north/north-west. And net flows are large in particular for recent graduates.
P a g e 34 | 39
HOW MOBILE IS TECH TALENT?
LinkedIn data show that the EU is gaining talent from the rest of the world, in particular from Asia. But the EU is losing IT talents vis-á-vis the US – the flows for which we have the best estimate. An estimated 10,000 IT professionals per year, equal to approximately 0.3% of IT professionals in the EU, are moving in net terms to the US. On top of this comes a net deficit for the EU in students moving across the Atlantic, although the impact of this is likely to be small. Moreover, new arrivals to the EU (at least among recent graduates) have substantially lower educational attainment than those going to the US. In terms of specific skills the difference seems to be small. Further work with the data could uncover more subtle differences between the leavers and the arrivers. The same is true for the relationship between the proclivity to move and the size of the professional network, where we find that mobile IT professionals tend to have larger networks, measured by the number of LinkedIn connections, than non-movers. There is also suggestive evidence to support the premise that moving within the EU is facilitated by language skills – even among IT professionals.
Given the focus of talent flows between the EU and the rest of the world, more resources should be devoted to measuring the persistence of intra-EU flows and analysing in more detail their composition, and also going beyond IT professionals. An important component of this additional research would be a better understanding of the composition – in both education and skills – of return mobility.
Based on the findings in this study we call for the following measures:31
easing the access to a visa for students who graduated from an EU university (automatic visa for, say, 6-9 months upon graduation across the EU). This would provide time for non-EU citizens to find a job after graduation.
reforming the Blue Card Directive to allow non-EU citizens to view the EU as one common labour market;
improving the standing and reputation of European universities in general to attract talent early on;
paying attention to persistent net flows of talented people within the EU; and further experimentation with the use of big data sources for monitoring
mobility trends, focussing on skills and return mobility.
To date the debate on mobility has focused almost entirely on how many. We believe it is time to shift the focus to who are they. Clearly, all information that can increase our knowledge should be utilised. LinkedIn data may play a role in this shift.
31 See Barslund and Busse (2014) and Busse and Morehouse (2014) for more details.
P a g e 35 | 39
HOW MOBILE IS TECH TALENT?
References AMECO (2016), “Annual macro-economic database”, European Commission (http://ec.europa.eu/economy_finance/db_indicators/ameco/index_en.htm).
Barslund, M., Busse, M., & Schwarzwälder, J. (2015). Labour Mobility in Europe: An untapped resource?. CEPS Policy Briefs 327 (https://www.ceps.eu/publications/labour-mobility-europe-untapped-resource).
Barslund, M. and M. Busse (2014), “Making the most of EU labour mobility”, CEPS Task Force report, October 2014 (http://www.ceps.eu/book/making-most-eu-labour-mobility).
Bloomberg (2008), “The Global Talent Crisis”, 19 September (www.bloomberg.com/news/articles/2008-09-19/the-global-talent-crisisbusinessweek-business-news-stock-market-and-financial-advice). Bitcom Research (2013), “Migration von Fach- und Führungskräften nach Deutschland“, 11 September (http://www.slideshare.net/linkedindach/linked-in-bitkommigrationsstudiefinal).
Digitaleurope (2014), “E-Skills gap and digital jobs vacancies to increase”, February (www.digitaleurope.org/DigitalHeadlines/Story.aspx?newsID=218).
Economist [The] (2006), “The battle for brainpower”, 5 October (www.economist.com/node/7961894).
_____ (2015), “Top of the class”, 26 March (www.economist.com/news/special-report/21646987-competition-among-universities-has-become-intense-and-international-top-class).
Eurobarometer (2014), “Standard Eurobarometer 82”, European Commission, Autumn.
European Commission (2013), “EU Employment and Social Situation – Quarterly Review”, June (http://ec.europa.eu/social/BlobServlet?docId=10312&langId=en).
_____ (2016a), “The European Single Market” (http://ec.europa.eu/growth/single-market/index_en.htm).
_____ (2016b), “Digital Skills at the core of the new Skills Agenda for Europe”, article on European Commission website, Digital Single Market, 10 June (https://ec.europa.eu/digital-single-market/en/news/digital-skills-core-new-skills-agenda-europe).
EY (2014), Mittelstandsbarometer, January (www.ey.com/DE/de/Newsroom/News-releases/20150225-EY-News-Fachkraeftemangel-groesste-Bedrohung-fuer-deutsche-Unternehmen).
GTCI (2016), “GTCI 2015-16”, (www.gtci2015-16.com/gtci-2015-16/).
Hughes, C., E. Zagheni, G.J. Abel, A. Wisniowski, A. Sorichetta, I. Weber and A.J. Tatem (2016), “Inferring Migrations: Traditional Methods and New Approaches based on Mobile Phone, Social Media, and other Big Data”, Mimeo prepared for European Commission.
LinkedIn (2014), “International talent migration – European Insights from LinkedIn”, (https://business.linkedin.com/content/dam/business/talent-solutions/global/en_US/c/pdfs/linkedin-ebook-international-talent-migration-de-de.pdf).
Morehouse, C. and M. Busse (2014), How to keep a competitive edge in the talent game: Lessons for the EU from China and the US, CEPS Task Force Report, London: Rowman and Littlefield International.
OECD (2014), “Testing student and university performance globally: OECD’s AHELO”, Paris (www.oecd.org/edu/skills-beyond-school/testingstudentanduniversityperformancegloballyoecdsahelo.htm).
QS (2016), “QS World University Rankings 2015/16” (www.topuniversities.com/qs-world-university-rankings). THE (2016), “World University Rankings 2015-2016” (www.timeshighereducation.com/world-university-rankings/2016/world-ranking).
UNESCO (2016), “Global Flow of Tertiary-Level Students“ (www.uis.unesco.org/Education/Pages/international-student-flow-viz.aspx).
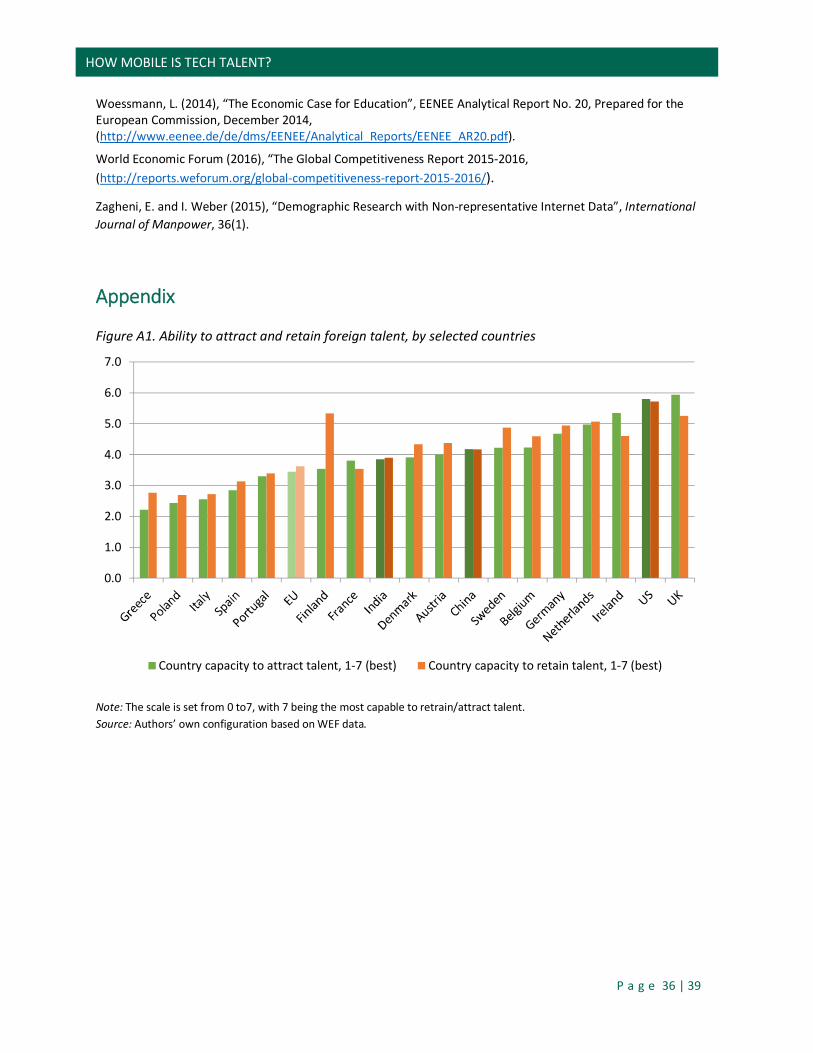
P a g e 36 | 39
HOW MOBILE IS TECH TALENT?
Woessmann, L. (2014), “The Economic Case for Education”, EENEE Analytical Report No. 20, Prepared for the European Commission, December 2014, (http://www.eenee.de/de/dms/EENEE/Analytical_Reports/EENEE_AR20.pdf).
World Economic Forum (2016), “The Global Competitiveness Report 2015-2016, (http://reports.weforum.org/global-competitiveness-report-2015-2016/).
Zagheni, E. and I. Weber (2015), “Demographic Research with Non-representative Internet Data”, International Journal of Manpower, 36(1).
Appendix
Figure A1. Ability to attract and retain foreign talent, by selected countries
Note: The scale is set from 0 to7, with 7 being the most capable to retrain/attract talent. Source: Authors’ own configuration based on WEF data.
0.0
1.0
2.0
3.0
4.0
5.0
6.0
7.0
Country capacity to attract talent, 1-7 (best) Country capacity to retain talent, 1-7 (best)

P a g e 37 | 39
HOW MOBILE IS TECH TALENT?
Figure A2. Intra-EU tech migrant inflow and outflow, by region and country
Distribution of inflow into each region, by region of departure
Distribution of outflow from each region, by destination
Source: Authors’ configuration based on LinkedIn data.
37%23% 24% 21% 23%
38%21%
41%
33% 25%
19%
8%14%
11%18%
16%
18%19%
20% 25%9%
15%
13%12%
22%
19% 22% 15% 9% 12%
U K A N D I R E L A N D
F R A N C E B E N E L U X S O U T H E R N E U
E A S T E R N E U N O R T H E R N E U
Southern EU UK and Ireland Eastern EU Northern Eu Benelux France
28%15% 16% 11% 19%
40% 29%47%
39%36%13%
5%11% 8%
17%28%
20% 27% 22% 32%13%
20%12% 12%
17%19% 16% 10% 6% 12%
U K I R E L A N D F R A N C E B E N E L U X S O U T H E R N E U
E A S T E R N E U N O R T H E R N E U
Southern Eu UK and Ireland Eastern EU Northern Eu Benelux France
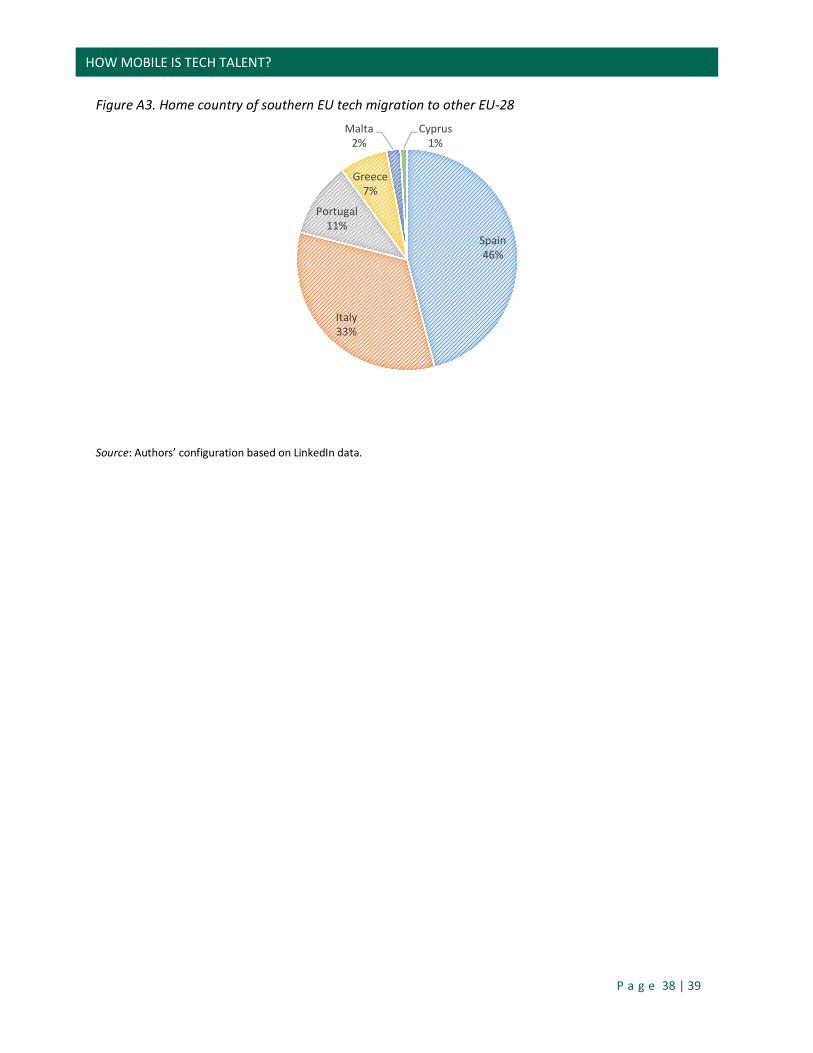
P a g e 38 | 39
HOW MOBILE IS TECH TALENT?
Figure A3. Home country of southern EU tech migration to other EU-28
Source: Authors’ configuration based on LinkedIn data.
Spain46%
Italy33%
Portugal11%
Greece7%
Malta2%
Cyprus1%
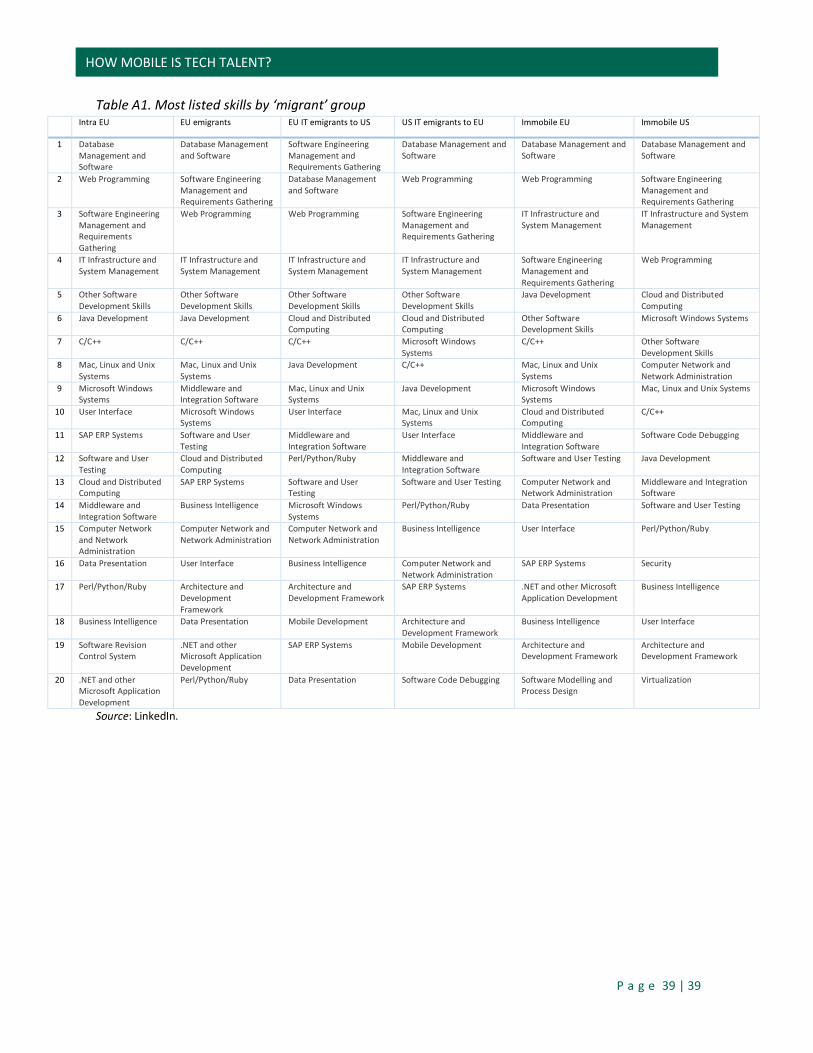
P a g e 39 | 39
HOW MOBILE IS TECH TALENT?
Table A1. Most listed skills by ‘migrant’ group Intra EU EU emigrants EU IT emigrants to US US IT emigrants to EU Immobile EU Immobile US
1 Database Management and Software
Database Management and Software
Software Engineering Management and Requirements Gathering
Database Management and Software
Database Management and Software
Database Management and Software
2 Web Programming Software Engineering Management and Requirements Gathering
Database Management and Software
Web Programming Web Programming Software Engineering Management and Requirements Gathering
3 Software Engineering Management and Requirements Gathering
Web Programming Web Programming Software Engineering Management and Requirements Gathering
IT Infrastructure and System Management
IT Infrastructure and System Management
4 IT Infrastructure and System Management
IT Infrastructure and System Management
IT Infrastructure and System Management
IT Infrastructure and System Management
Software Engineering Management and Requirements Gathering
Web Programming
5 Other Software Development Skills
Other Software Development Skills
Other Software Development Skills
Other Software Development Skills
Java Development Cloud and Distributed Computing
6 Java Development Java Development Cloud and Distributed Computing
Cloud and Distributed Computing
Other Software Development Skills
Microsoft Windows Systems
7 C/C++ C/C++ C/C++ Microsoft Windows Systems
C/C++ Other Software Development Skills
8 Mac, Linux and Unix Systems
Mac, Linux and Unix Systems
Java Development C/C++ Mac, Linux and Unix Systems
Computer Network and Network Administration
9 Microsoft Windows Systems
Middleware and Integration Software
Mac, Linux and Unix Systems
Java Development Microsoft Windows Systems
Mac, Linux and Unix Systems
10 User Interface Microsoft Windows Systems
User Interface Mac, Linux and Unix Systems
Cloud and Distributed Computing
C/C++
11 SAP ERP Systems Software and User Testing
Middleware and Integration Software
User Interface Middleware and Integration Software
Software Code Debugging
12 Software and User Testing
Cloud and Distributed Computing
Perl/Python/Ruby Middleware and Integration Software
Software and User Testing Java Development
13 Cloud and Distributed Computing
SAP ERP Systems Software and User Testing
Software and User Testing Computer Network and Network Administration
Middleware and Integration Software
14 Middleware and Integration Software
Business Intelligence Microsoft Windows Systems
Perl/Python/Ruby Data Presentation Software and User Testing
15 Computer Network and Network Administration
Computer Network and Network Administration
Computer Network and Network Administration
Business Intelligence User Interface Perl/Python/Ruby
16 Data Presentation User Interface Business Intelligence Computer Network and Network Administration
SAP ERP Systems Security
17 Perl/Python/Ruby Architecture and Development Framework
Architecture and Development Framework
SAP ERP Systems .NET and other Microsoft Application Development
Business Intelligence
18 Business Intelligence Data Presentation Mobile Development Architecture and Development Framework
Business Intelligence User Interface
19 Software Revision Control System
.NET and other Microsoft Application Development
SAP ERP Systems Mobile Development Architecture and Development Framework
Architecture and Development Framework
20 .NET and other Microsoft Application Development
Perl/Python/Ruby Data Presentation Software Code Debugging Software Modelling and Process Design
Virtualization
Source: LinkedIn.