a case of success for edison international: an enterprise ... · a case of success for edison...
TRANSCRIPT

Copyright © Best Practice Institute, Inc. Do not share or distribute without prior written or verbal consent of Best Practice Institute, Inc.
1
A Case of Success for Edison International: An Enterprise-Wide Workforce Planning
Process Michael Manning, Sr. Manager of Strategic Workforce Planning, Human Capital Analytics & Employee Engagement at Edison International
Introduction This case study is intended to provide the reader an overview on how enterprise-wide workforce planning was
successfully launched at Edison International between October 2010 and July 2011. It will also introduce the Edison
workforce planning model, provide examples of how six sigma tools were used in designing and launching the program,
and give examples of the metrics used to measure program results. To ground the overall case study, the workforce
planning tie to business strategy and industry challenges are briefly covered. Workforce planning vision, workforce
planning goals, consolidated statement of work for RFP of workforce planning system, labor budget integration process
flow & linkage to annual planning calendar, workforce planning model, program roles, and sample outputs are provided
and discussed with the hope that it will help the reader in his/her workforce planning journey.
“Southern California Edison, in my mind has been one of the most successful organizations ever at launching an
enterprise-wide workforce planning system.” - Quote from Peter Louch, CEO of Vemo
About Edison International Edison International, through its subsidiaries, is a generator and distributor of electric power and an investor in
infrastructure and energy assets, including renewable energy. Edison International is the parent company of Southern
California Edison - one of the nation's largest electric utilities.
Southern California Edison (SCE) serves more than 14 million people in a 50,000 square-mile area of central, coastal and
Southern California, excluding the City of Los Angeles and certain other cities.
Based in Rosemead, California, it has been providing electric service in the region for more than 120 years. SCE's service
territory includes more than 180 cities.
On December 31, 2012, Edison International and its consolidated subsidiaries had an aggregate of 16,593 full-time
employees, 16,515 of which are full-time employees at SCE.
Workforce Planning in the Utility Industry As a leader in the utility industry, Edison is one of the utilities who has taken proactive steps to ensure we will be able to
meet our future workforce needs by launching a comprehensive and integrated enterprise wide workforce planning
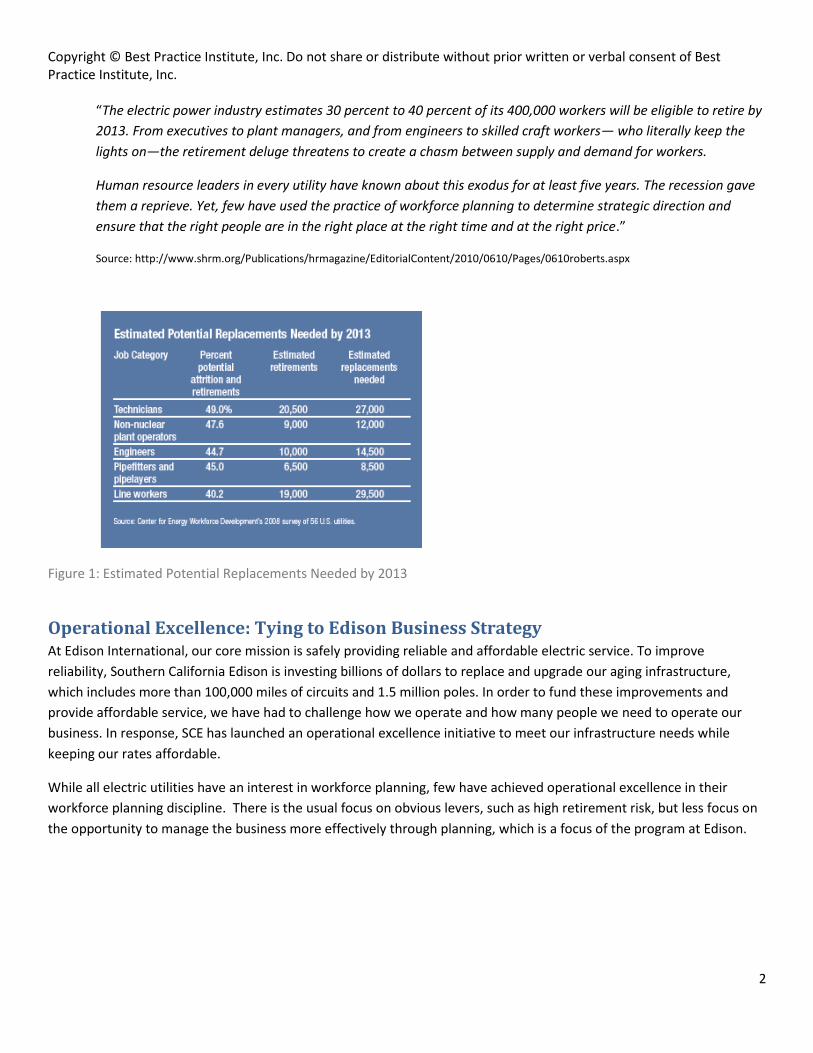
program. Figure 1, as seen below, provides more context for such a need. Additionally, the excerpt below is from a 2010
article in SHRM titled “Can They Keep Our Lights On?” and speaks to the urgency of the need for Workforce Planning
programs in the utility industry:
Copyright © Best Practice Institute, Inc. Do not share or distribute without prior written or verbal consent of Best Practice Institute, Inc.
2
“The electric power industry estimates 30 percent to 40 percent of its 400,000 workers will be eligible to retire by
2013. From executives to plant managers, and from engineers to skilled craft workers— who literally keep the
lights on—the retirement deluge threatens to create a chasm between supply and demand for workers.
Human resource leaders in every utility have known about this exodus for at least five years. The recession gave
them a reprieve. Yet, few have used the practice of workforce planning to determine strategic direction and
ensure that the right people are in the right place at the right time and at the right price.”
Source: http://www.shrm.org/Publications/hrmagazine/EditorialContent/2010/0610/Pages/0610roberts.aspx
Figure 1: Estimated Potential Replacements Needed by 2013
Operational Excellence: Tying to Edison Business Strategy At Edison International, our core mission is safely providing reliable and affordable electric service. To improve
reliability, Southern California Edison is investing billions of dollars to replace and upgrade our aging infrastructure,
which includes more than 100,000 miles of circuits and 1.5 million poles. In order to fund these improvements and
provide affordable service, we have had to challenge how we operate and how many people we need to operate our
business. In response, SCE has launched an operational excellence initiative to meet our infrastructure needs while
keeping our rates affordable.
While all electric utilities have an interest in workforce planning, few have achieved operational excellence in their
workforce planning discipline. There is the usual focus on obvious levers, such as high retirement risk, but less focus on
the opportunity to manage the business more effectively through planning, which is a focus of the program at Edison.

Copyright © Best Practice Institute, Inc. Do not share or distribute without prior written or verbal consent of Best Practice Institute, Inc.
3
Table 1: Edison 2013 Annual Report Financial Highlights
As seen in Table 1 above, the Edison 2012 annual report shows the impact that operational excellence is having on overall headcount levels. Our industry is going through a challenging period of transformational change. As such, planning for our future workforce and doing it in a way that aligns HR strategy to business strategy, while identifying efficiencies, has become increasingly important.
Introducing the Edison Workforce Planning Model The workforce planning model (see Figure 2 below) created at Edison focused on finding immediate operational value by aligning headcount driven functions while looking at the longer term critical talent needs of the business. We developed a two pronged approach where we plan operationally for the many (all positions) for the labor budget, real estate space, IT hardware/software and support; and staffing costs to ensure we have the proper funding to acquire, proper budget to pay, proper space to house and proper technology to enable our whole workforce. Edison continues to build the critical talent planning portion outlined in the workforce planning model below. We plan to take a focused approach on the segmented positions which are key to value delivery. For these key segmented positions, we will filter down to those lacking formal succession plans and work to design workforce plans. The workforce plans take into account internal availability as well as external labor market availability.

Copyright © Best Practice Institute, Inc. Do not share or distribute without prior written or verbal consent of Best Practice Institute, Inc.
4
Figure 2: Workforce Planning Model at Edison
Developing and Launching the Workforce Planning Program Our Vision Provide process and technological capabilities that allow for broad planning around SCE’s future workforce.
Provide tools for operational and financial planning
Respond to workforce trends across the company
Provide a single source for company headcount forecast Our Goals Implement workforce planning solution and redesign the workforce planning process to enable forecasting, modeling and decision support leading to workforce strategies that support our business strategies.
Involving Stakeholder Input & Identifying Program Requirements We identified a list of requirements after extensive workforce planning research, which included inviting seven of the top WFP vendors to demonstrate their solutions, and meeting with over 60 SCE stakeholders both upstream and downstream from the workforce planning process. We then crafted a Supplier, Input, Process, Output and Customer (SIPOC) chart, a six sigma tool used to identify all relevant elements of the process before work begins. The SIPOC chart
Internal talent available
External labor market analysis
OU planner enters forecast
in Vemo
Retirement and attrition forecast
sent to Vemo
Critical positions to business strategy
Succession plans
Skills Inventory Demand and retirement/attrition forecasts combined
Workforce Gap Identified
Right amount of people available At the right time At the right cost With the right skillsTo support SCEs business strategy
Ensuring SCE has Proper funding to acquire (or reduce)
Proper budget to pay Proper work space to house Proper technology to enable the workforce needed for our business strategy
Are talent resources available to support the business strategy
Buy
Build
Redeploy
Outsource
Plan for the Gap
Backfill or do not backfill
Bind or Bounce
Input to Comp & Ben strategy
Input to Talent Acquisition strategy
Input to L & OD strategy
Develop HR Strategy
Input to Engagement strategy
Workforce Planning Model at Edison
Reporting and analytics
related to workforce
planning
Projected real estate needs
Projected IT hardware,
software and support needs
Projected labor costs
IT
Finance
Corp Resources
Projected staffing needs
Staffing
Integrated Planning
OUs determine their workforce forecast based upon business
strategy

Copyright © Best Practice Institute, Inc. Do not share or distribute without prior written or verbal consent of Best Practice Institute, Inc.
5
(as seen below in Figure 3) helped us define how the workforce planning solution would work, including the expected outputs. This was useful to communicate to our stakeholders and vendors.
Figure 3: SIPOC Chart
In addition to the SIPOC chart, a list of solution requirements were developed based on our workforce planning vision
and goals and the stakeholder interviews. This list became the Statement Of Work (SOW) which was used in the Request
for Proposal (RFP).
Statement of Work (SOW) Workforce planning solution will:
Enable strategic workforce planning
Have the ability to receive headcount forecast data for a five year period (by quarter for the first two years, then annually by the remaining three years)
o Headcount demand forecasts can include: Quantity needed Demand driver (will come from a list of initiatives provided by the business units and will like the
headcount demand)
Internal availability
SCE workforce data
stored in SAP
External labor market
data and trends, DOW,
unemployment rate
Workforce
Planning Solution(links, organizes and
prepares data for
scenario planning and
modeling)
AD HOC configurations
specific to business unit
(which positions are
interchangeable, time
needed to become
proficient in a given
position,
future feeder pools,
adjustments to no
change future workforce,
known upcoming
retirements...)
Headcount demand
forecast
(including demand
driver)
Specialty data
provided by SCE
(EO availability,
Construction contractor
availability and
additional inputs to be
identified in future
SCE
scenario planning
and modeling (adjustments to
forecasted headcount
demand and AD HOC
configurations)
Company headcount
forecast(filterable by time, business unit,
business line, location, key position
and/or job title)
Surpluses or shortages
report(filterable by time, business unit,
business line, location, key position
and/or job title)
Workforce
Planning Solution(generates metrics,
reporting and data for
decision support)
Feeder pool strength report(Identifies strong, shallow and
depleted feeder pools. Also identifies
demand against feeder pools.
filterable by time, business unit,
business line, location, key position
and/or job title)
Forecasted retirement and
Vol/Invol turnover exposure
report(filterable by time, business unit..
Positions
with
surpluses or
shortages
Shallow or
depleted
feeder pools
for positions
Forecasted EO report(diversity of feeder pools and future
under represented positions)
Key SCE positions
(either to be defined in
the workforce planning
solution or provided to
the solution as a data
feed
External
availability
Data points for HR
dashboard
(used to track gap progress)
Internal
movement
Forecasted internal
employee movement report(filterable by time, business unit..)
SCE Configurations
(time in job policy
restrictions and
additional configuration
points to be identified in
the future)
Forecasted
retirement
and Vol/Invol
turnover
Current
population
Operational scenarios
for business units
Inputs
Data linkage, gap identification and
human capital availability
Scenarios planning
and modeling
Metrics and report
generation
Suppliers Process Outputs Customers
SCE business unit in
conjunction with HR
Management
(data currently stored
in Excel files)
SCE business unit
management via
labor planners
(data stored in SAP)
IT
(data in SAP data
warehouse)
EO data will be
provided by Diversity
BLS reports
NACE reports
CEWD (Center for
Energy Workforce
Development) reports
Other vendor specific
sources
SCE HR
(data stored in policy)
SCE business unit in
conjunction with HR
Management
(specifications will be
directly entered into
solution)
Executives
Corp Resources
IT
BU Finance
AD HOC data extracts to
Excel
Executives
Staffing
Executives / Mgrs
Staffing
Learning and
Development
Talent Management
Benefits
Staffing
Business unit Mgmt
Diversity
Staffing
HR Analytics
Business units
HR Managers
Business unit Mgrs/
planners
Open requisitions Staffing
(data in ATS?)
Prior forecast
and results
Forecasted location
demand report(filterable by time, business unit..
Real Estate
Labor agreement
restrictions
Labor relations
(data stored in union
contracts)
Testing results
(count of qualified
candidates for positions)
Talent Management

Copyright © Best Practice Institute, Inc. Do not share or distribute without prior written or verbal consent of Best Practice Institute, Inc.
6
Job title ( high level job title and detailed level job title) Location Work area requirements (Parking place required and/or work area required) Multiple organizational layers (business unit, business line…) Justification field to explain why position is needed
Draw upon data stored in SAP, external labor market and other data provided by SCE for decision support
Link the supply and demand data to identify surpluses and shortages by SCE overall, job title, business unit, location and time period
Have the ability to do scenario planning and modeling, save multiple scenarios, and lock scenarios
Enable managers to approve scenarios from their subordinate managers
Identify feeder pools (historic career progressions to a given position)
Have the ability to segment key positions
Identify shallow feeder pools associated with key roles
Identify feeder pool strength (bench strength), and demand against feeder pools
Consider SCE policies and union contracts when modeling workforce data
Calculate estimated cost of labor for modeled scenarios
Have the ability to model contingent workers and overtime
Have the ability to plan by headcount or full time employee equivalent
Include training on system for users
Fast Tracking the Purchase & Configuration In Q3 2010, we were given the green light to launch an RFP for a workforce planning solution (as seen in Figure 4). We
had done the pre-work with stakeholders and the business, so we understood the “nice to have’s” and “need to have’s”
from the program. We narrowed our vendor list down to three firms and sent them each the RFP. After completing our
evaluations, Edison selected VEMO. As part of the negotiation we required the CEO of VEMO to be our point of contact
and implementation manager from the vendor side. We were able to complete the purchase and reach signed
agreement prior to year end 2010.

Copyright © Best Practice Institute, Inc. Do not share or distribute without prior written or verbal consent of Best Practice Institute, Inc.
7
Figure 4: SCE Operationalized Workforce Planning Vision Timeline
Aligning Workforce Planning to Annual Planning Cycles The high level process flow below (Figure 5) shows how we integrated workforce planning into the land, labor and
budget needs of Edison. Our take away: aligning headcount driven budgets to the business strategy.
Figure 5: High Level Process Flow
Labor budget calculated in Vemo based on headcount forecast
Exported to Excel then expenses assigned O&M, Cap...
BU finance pulls
headcount
forecast costs
Costs of needed
space
Costs to hire
workforce
Incorporate into
overall BU budget
Budget keyed into
SAP
Ongoing Facility Master Planning ProcessSelection and prioritization of facilities projects
Annual strategic planning process for staffing
TBD - will ensure staffing is resourced and has funds to
meet future workforce needs
Staffing pulls
headcount
forecast
CR pulls
headcount
forecast space
needs
Costs of needed
workforce
Business
strategy
Workforce
forecast

Copyright © Best Practice Institute, Inc. Do not share or distribute without prior written or verbal consent of Best Practice Institute, Inc.
8
One of the most important relationships developed during the design of the program was with Finance. We met with
the person who oversees company labor budgets and showed him a demo of how we thought there was an opportunity
to integrate workforce planning and labor budget planning. He liked the idea and brought a few other finance people
into the discussion. The consensus was yes, there should be integration. The manager overseeing the budgeting process
invited all finance workers across SCE who play a part in the labor budgeting process to attend two half-day working
sessions led by the HR Workforce Planning team, our vendor (Vemo) and the finance manager where we collectively
defined and documented our new planning process and timeline (see Figure 6 below).
Common process and timeline for leveraging the workforce forecast to build the labor budget
Figure 6: Common Process and Timeline
In conjunction with BU and Corp. Finance, we developed and documented an agreed SCE labor budget process flow and
timeline. Our take away: labor budget based on headcount forecast.
There are numerous benefits to aligning your workforce planning calendar and process to your budgeting calendar and
process. We were able to gain the confidence of the downstream users that the forecasts were going to be reasonably
real since they would be associated with labor dollars. One of the other unanticipated benefits was aligning other
planning function processes to the budget planning cycle.
6/1/2011 12/31/2011
7/1/2011 8/1/2011 9/1/2011 10/1/2011 11/1/2011 12/1/2011
Begin
Directions and
budget targets
from Corp FinanceHeadcount
forecast
SAP data
(including
actual $ and
MRP)
cost of forecasted
headcount
(using MRP not
actual $ for
confidentiality)
Report for Vemo
on forecasted
labor costs
Modifications
to headcount
forecast if needed
cost of forecasted
headcount
(using actual $ )
Incorporate into
overall BU budget
Budget keyed into
SAPEnd
Assignment of
funding sources
(Capital, O&M..)
Corp Finance
notifies BU’s of
actual funding
Headcount
forecast closed
GRC,
Corp Resources (Real Estate),
Staffing...
10/15/2011
Corp Finance notifies
BUs of actual funds 9/15/2011
BUs request budget
7/5/2011 - 9/3/2011
BU management
determines
Headcount forecast
Labor planners enter
head count forecast
into Vemo
10/15/2011 - 11/2/2011
Managers make headcount
forecast adjustments
if needed
Labor planners enter
adjustments into Vemo
12/1/2011
BU budgets due
into SAP
11/20/2011 - 12/1/2011
Calculation of forecasted
Labor costs integrated
into overall BU budget
and keyed into SAP
6/1/2011 - 6/27/2011
BUs clean SAP data
11/1/2011
Headcount forecasts
need to be in
approved or released
Status11/1/2011 - 11/19/2011
Funding sources
Assigned to
headcount forecast extract
(occurs outside of Vemo)
9/15/2011 - 10/13/2011
Priority funds
determined
Initial
BU budget
request
Steps occurring in Vemo
Outside Vemo
Workshop output for process flow and timeline 3/30/11
This is the final agreed process flow
7/1/2011
Corp Finance & HR send BUs
packet with instructions
and budget targets
Dates are estimates and may change
Workshop output for process flow and timeline 3/30/11
This is the final agreed timeline
Final Agreed Process Flow
Final Agreed Timeline

Copyright © Best Practice Institute, Inc. Do not share or distribute without prior written or verbal consent of Best Practice Institute, Inc.
9
One unexpected benefit was the linking of other process timelines to the annual budgeting cycle through linkage to the
workforce planning process. See process flow below (Figure 7):
Integrates Workforce Forecast and Labor Budgeting process into Corp Resources Facility Master Planning process
Figure 7: Process Flow
In conjunction with Corporate Resources, we mapped standard Corp real estate allocations to SCE position titles. Our
take away: real estate planning based on workforce forecast.
Data from Multiple Sources Each month we import 23 full tables of workforce data from SAP. We opted to do a full load of historic data versus a
delta load where we just pull the last month. By sending a full load we are able to capture changes that are applied to
our dynamic data warehouse. From the 23 tables we link 109 workforce data elements. Even with this large amount of
data there were still pieces of data that we needed but did not exist in a row and column format. Going back to the
SIPOC chart we identified the additional data required to meet the needs of our stakeholders.
We created 12 more data feeds which capture data stored outside of our HRIS. Often times this required creating an
Excel sheet with job titles and going to the areas, asking questions such as “what square footage is allocated to which
job title” or, “on 1 to 5 scale is this job title easy or hard to fill”. Building additional knowledge that was not in row and
column format allowed us to give our stakeholders the information they needed and helped with the change
Start
CR pulls
headcount
forecast
Workforce forecast
closed
Forecasted
headcount
analyzed
Priority for master
plan revisions
Update master
plan
Updated list
projects and
project pricing
Projects prioritized
Established initial
capital and O&M
budget
BU input on Cap
and O&M budget
Update Cap and
O&M budget
Submit final Cap
and O&M Budget
Detailed planning
for budget projects
11/1/2011 12/31/2012
12/1/2011 1/1/2012 2/1/2012 3/1/2012 4/1/2012 5/1/2012 6/1/2012 7/1/2012 8/1/2012 9/1/2012 10/1/2012 11/1/2012 12/1/2012
12/31/2011
Priority for
master plan
revised
11/15/2012
Submit final
budget to finance
11/15/2011
CR pulls
headcount
data
9/15/2012
Updated Cap
and O&M
Budget
1/2/2012 - 6/30/2012
- Site visits and
- Other conformations
- New projects identified
- All projects (new & existing) prioritized
- Projects priced
- Master plan updated
7/1/2012 - 9/15/2012
BU input on Cap
and O&M budget
11/16/2011 - 12/31/2011
Headcount data analyzed
And new priorities
identified
12/1/2012
Final budgets
keyed in
to SAP
9/15/2012 - 10/13/2012
Priority funds
determined
7/1/2012
Establish initial
Capital and
O&M budget
Submit initial
budgets
Notification of
actual funds
Project selection
modified if
necessary
10/15/2012 - 11/13/2012
Modifications to
Project selection and
budgets
Dates are estimates and may change
Dates should stay consistent with Labor Budgeting process
Revision to Draft from 4/12/2011
Execute plan
Cycle repeats annually
End

Copyright © Best Practice Institute, Inc. Do not share or distribute without prior written or verbal consent of Best Practice Institute, Inc.
10
management, as they were now building the program rather than the program being pushed on them. Sample Non-SAP
data feeds are shown below (Table 2).
Table 2: Sample Non-SAP Data Feeds
Data Dictionary: Creating a Common Language Now that we had our processes designed and data inputs identified, we needed to work from a common set of
definitions. This required the creation and documentation of a data dictionary to standardize how we define and
calculate information around workforce planning metrics. In conjunction with HR analytics and IT we created a data
dictionary to govern our use of workforce data. This document later grew to cover all HR analytics related data points
and measures.
The data dictionary (as sampled in Table 3 below) contains both a technical definition, often describing how the element
is stored in SAP, and a business definition which describes the element in a more understandable form.
Non SAP import schedule and responsibility
File name Purpose
Source - Also responsible
to notify WFP if changes
are needed
Responsible to
produce
Responsible
to Import
Import
frequency
Import
schedule
Retirement
Forecast SCE
Used to calculate supply.
Forecast of retirements and
attrition
HR Analytics HR Analytics WFP4 times per
year
First week in
Apr,
Jul,Oct,Jan
AAPUse to link underrepresented
jobs to hiring planDiversity and Inclusion
Diversity and
Inclusion WFP
1 time per
yearApril
Trainee Job
Codes.xls
Used to identify how interns
have moved through the
organization
HR Analytics HR Analytics WFP Only if
changes occurupon change
Recruiting
Difficulty
and Time to
Proficiency
Used to slice the organization
by recruiting risk and time to
proficiency risk
Talent Acquisition Talent Acquisition WFPOnly if
changes occurupon change
Real Estate
Needs by
Job Title
Used to link headcount forecast
with real estate needsCorp Resources Corp Resources WFP
Only if
changes occurupon change

Copyright © Best Practice Institute, Inc. Do not share or distribute without prior written or verbal consent of Best Practice Institute, Inc.
11
Table 3: Sample within Data Dictionary
Clarifying User Roles A variety of roles are used in our workforce planning process. We have over 50 planners who reside in the business,
providing the headcount forecasts into the Vemo tool. We then have an approver, who reviews the forecasts of the
planners in the area of the business to approve or will send the forecasts back to the planners for rework. Once the
forecasts have been approved, the data can be extracted and sent to downstream users (finance, real estate, talent
acquisition, general rate case) to serve as an input into their planning processes.
In order to gain early adoption, immediate benefits and generally help make the program “sticky”, we planned at the
overall level including all employment positions (including vacancies). We are now building out advanced consulting and
risk mitigation for the critical positions.
Measures# Measure SCE Technical Definition SCE Business Definition
M5 Rates
All Rates - unless noted as exception - use the
standard Vemo definitions for annualization
that are used across all instance: Period Rate
for Event = (12/Periods) * Sum(Actions or
Event for Period) / Active Employee
Headcount (Average of Period Aggregate)
Rates are standardized in two ways. First, all rates are
created by dividing by the relevant average active
headcount for the period and not just the final or starting
headcount. Second the numerator of each rate is
annualized to show it as a full year. This allows a user to
compare monthly, quarterly, YTD, annual and rolling 12
month rates on an apples to apples basis.
M6Active Employee
Headcount
Employee_Status = 3 (Active) AND
EMP_GROUP <> N AND (Customer_Specific =0
OR (Customer_Specific = 1 AND (
Long_Term_Disability = 0 OR Leave_Tenure < 1
year) ) )
Active Employee Headcount (or AEH) includes Active
Employees and Short-Term Leaves (Leave Tenure < 1
year), and excludes Retirees, Long-Term Leaves and
Contractors. We exclude Long-Term Leaves (or LTDs)
because if they leave SCE, it doesn't pose additional risk to
the business, whereas there is an expectation that many
Short-Term Leaves will return to their positions, which
must be held for them. Active Employee FTE is just AEH
averaged over time, which will happen automatically
where a span of time is viewed. Of note, AEH does
include SCE temps and interns, however there will be
filters made available to filter out interns.
M7Employees on Short-
Term Leave
Employee_Status = 3 (Active) AND
Customer_Specific = 1 AND EMP_GROUP <> N
AND ( Long_Term_Disability = 0 OR
Leave_Tenure < 1 year )
Employees on Leave is all Employees who are Active in
SAP but on Long Term Disability other type of Leave. They
are not included in Headcount for Planning or Reporting,
however, the population is defined for sake of clarity.
Also there be measures showing Active to Leave and
Leave to Active to explain some of the periodic
adjustments to Active Employee Headcount that is not
related to hiring, attrition or workforce movement.

Copyright © Best Practice Institute, Inc. Do not share or distribute without prior written or verbal consent of Best Practice Institute, Inc.
12
Workforce planning program outputs
Figure 8: Workforce Planning Program Outputs
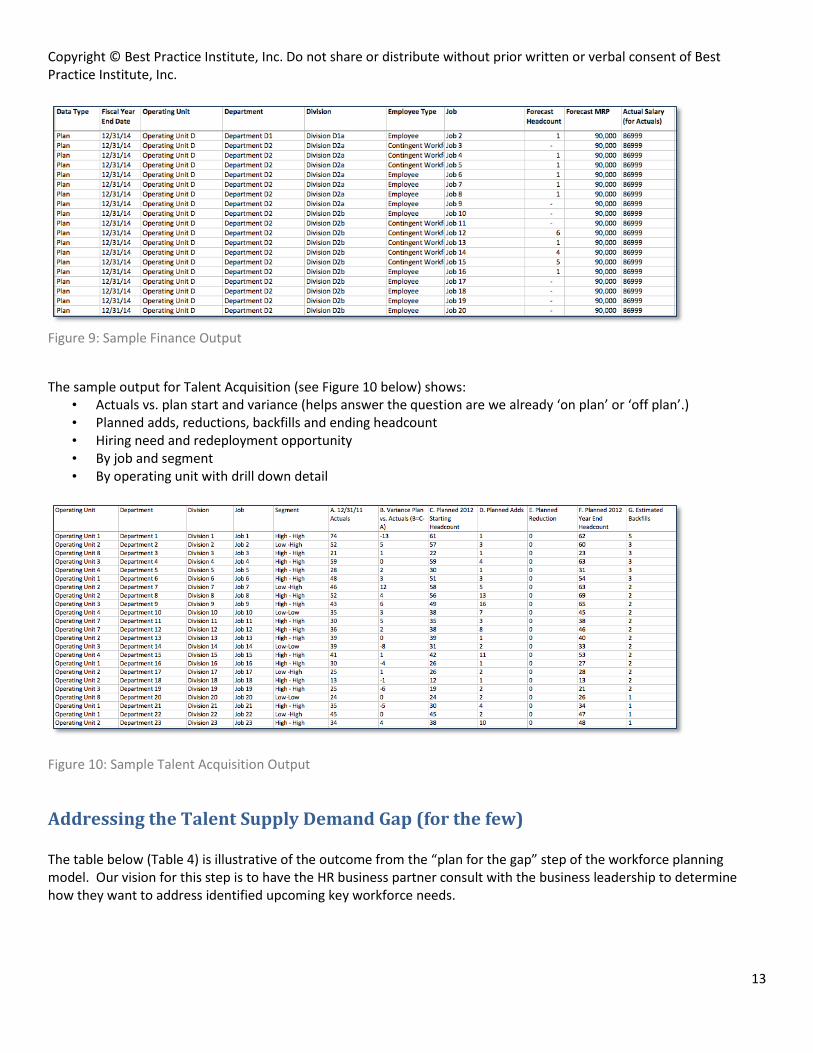
Operational Planning (for the many) Before building the outputs for our downstream operational planning users (finance, real estate, talent acquisition, other users) we met with them to get a better understanding of their needs and how they could get the most out of the forecast information. While each group was interested in receiving the forecast, they were most interested in applying the information to their specific function. For example, finance’s crucial need for the cost of the workforce versus real estate’s need to acquire employee’s square footage needs and other facility requirements. The sample output for Finance (see Figure 9 below) shows:
• Summary-level budgets by resource type • Detailed headcount, MRP and Projected Salary by Operating Unit, Department, Division and Job • Budgeting can build non-labor budget on top of WFP
Copyright © Best Practice Institute, Inc. Do not share or distribute without prior written or verbal consent of Best Practice Institute, Inc.
13
Figure 9: Sample Finance Output
The sample output for Talent Acquisition (see Figure 10 below) shows: • Actuals vs. plan start and variance (helps answer the question are we already ‘on plan’ or ‘off plan’.) • Planned adds, reductions, backfills and ending headcount • Hiring need and redeployment opportunity • By job and segment • By operating unit with drill down detail
Figure 10: Sample Talent Acquisition Output
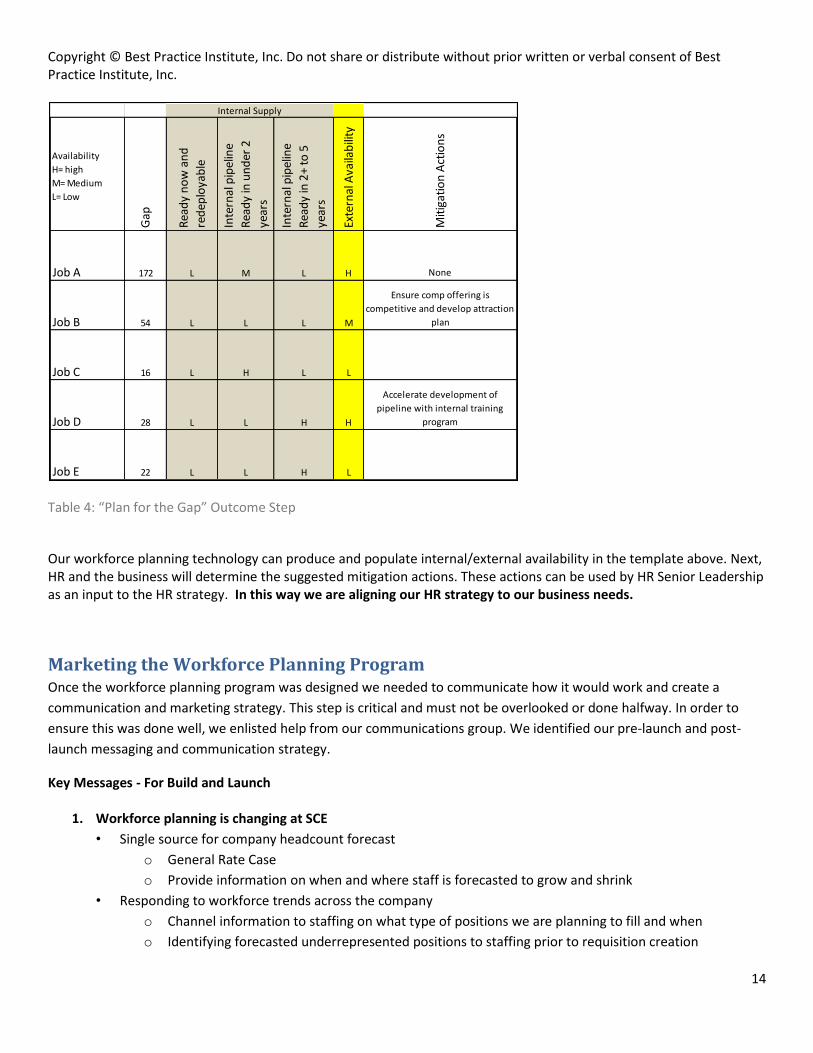
Addressing the Talent Supply Demand Gap (for the few) The table below (Table 4) is illustrative of the outcome from the “plan for the gap” step of the workforce planning model. Our vision for this step is to have the HR business partner consult with the business leadership to determine how they want to address identified upcoming key workforce needs.
Copyright © Best Practice Institute, Inc. Do not share or distribute without prior written or verbal consent of Best Practice Institute, Inc.
14
Table 4: “Plan for the Gap” Outcome Step
Our workforce planning technology can produce and populate internal/external availability in the template above. Next, HR and the business will determine the suggested mitigation actions. These actions can be used by HR Senior Leadership as an input to the HR strategy. In this way we are aligning our HR strategy to our business needs.
Marketing the Workforce Planning Program Once the workforce planning program was designed we needed to communicate how it would work and create a
communication and marketing strategy. This step is critical and must not be overlooked or done halfway. In order to
ensure this was done well, we enlisted help from our communications group. We identified our pre-launch and post-
launch messaging and communication strategy.
Key Messages - For Build and Launch
1. Workforce planning is changing at SCE
• Single source for company headcount forecast
o General Rate Case
o Provide information on when and where staff is forecasted to grow and shrink
• Responding to workforce trends across the company
o Channel information to staffing on what type of positions we are planning to fill and when
o Identifying forecasted underrepresented positions to staffing prior to requisition creation
Availability
H= high
M= Medium
L= Low
Gap
Rea
dy
no
w a
nd
red
eplo
yab
le
Inte
rnal
pip
elin
e
Rea
dy
in u
nd
er 2
year
s
Inte
rnal
pip
elin
e
Rea
dy
in 2
+ to
5
year
s
Exte
rnal
Ava
ilab
ility
Mit
igat
ion
Act
ion
s
Job A 172 L M L H None
Job B 54 L L L M
Ensure comp offering is
competitive and develop attraction
plan
Job C 16 L H L L
Job D 28 L L H H
Accelerate development of
pipeline with internal training
program
Job E 22 L L H L
Internal Supply

Copyright © Best Practice Institute, Inc. Do not share or distribute without prior written or verbal consent of Best Practice Institute, Inc.
15
o Decision support around employee movement patterns across SCE
o Identifying and modeling career progression
• Tools for operational and financial planning
o Link headcount planning to budgeting (through workforce modeling and scenarios)
o Calculate the cost of forecasted labor
o Calculate real-estate space needs for forecasted labor
2. How the changes will enhance the way we plan
• How the Vemo tool works (for background)
• Replacing SAP template for headcount forecast (GRC headcount forecast)
• Integration with:
o Talent Acquisition
o Finance (Labor budgeting)
o Corp resources (Real estate needs planning)
3. Logistics of the workforce planning changes
• Launch date
• Who will have access
• Training
• Expert users group will be first line contact for BUs
• Where to go for further details
Key Messages – Post Launch
4. Planning logistics
• Timeline and process
o When to enter the headcount forecast
o What needs to be entered
o Who will enter the forecast
o How to access the Vemo tool
o When the forecast will close
5. Who to contact with questions and or issues
• Expert user/s for your BU
• Workforce planning contact
• Web page
o Timelines and process
o Training material
o Quick reference guides
6. How and when to access the forecast data
• Date headcount forecast is locked
• What data is available
Copyright © Best Practice Institute, Inc. Do not share or distribute without prior written or verbal consent of Best Practice Institute, Inc.
16
• How to extract headcount forecast data
o Online pivot tables
o Exports to Excel and PDF or Export of raw data
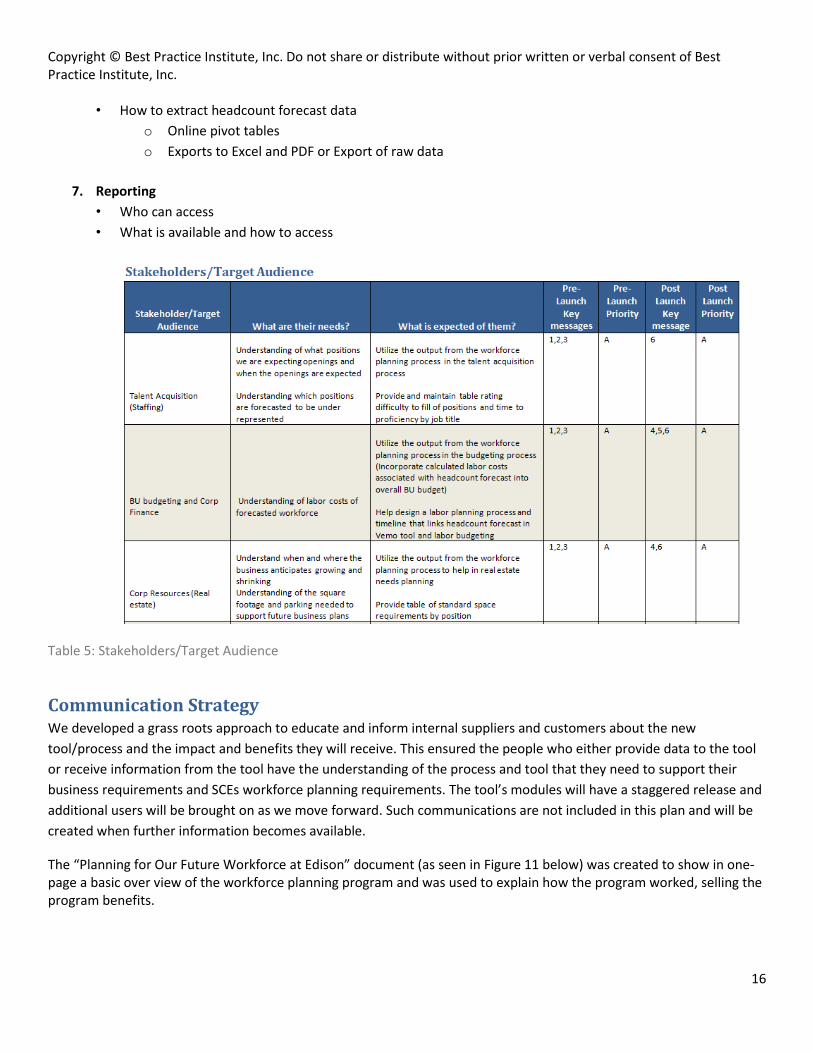
7. Reporting
• Who can access
• What is available and how to access
Table 5: Stakeholders/Target Audience
Communication Strategy We developed a grass roots approach to educate and inform internal suppliers and customers about the new
tool/process and the impact and benefits they will receive. This ensured the people who either provide data to the tool
or receive information from the tool have the understanding of the process and tool that they need to support their
business requirements and SCEs workforce planning requirements. The tool’s modules will have a staggered release and
additional users will be brought on as we move forward. Such communications are not included in this plan and will be
created when further information becomes available.
The “Planning for Our Future Workforce at Edison” document (as seen in Figure 11 below) was created to show in one-page a basic over view of the workforce planning program and was used to explain how the program worked, selling the program benefits.

Copyright © Best Practice Institute, Inc. Do not share or distribute without prior written or verbal consent of Best Practice Institute, Inc.
17
Forecast Workforce Data
PwC Saratoga benchmarks,
Electric utilities benchmarks,
External labor market data
External workforce data
Internal workforce data
Information on current population,
job movement history, standard
position costs, turnover,
retirements, contract workers...
SCE retirement and attrition forecasts
Standard work space needed by job title
Mapping to Affirmative Action Plans
5 year headcount forecast
Labor planners
enter the forecast
into Vemo
OU management
determines needed
headcount
Ability to add other data feeds
Information on recruitment in
progress
OUs can make adjustments to forecast through scenario planning and modeling in Vemo
Forecast of needed workforce
Staffing Excellence
Labor costs based on forecast Space needed based on forecast
GRC
Directional hiring plan
Initial opportunity:
What type of positions are we
planning to fill
When are we planning to fill them
Are the positions underrepresented
How many recruiters will we need
Future opportunity:
Requisition approval based on
approved headcount forecast
Initial opportunity:
Provide forecasted SCE headcount for
GRC
Future opportunity:
Leverage reporting to respond to some
GRC data requests
Workforce planning reportingGap between workforce supply and demand
Corporate Resources
Initial opportunity:
Provide information on when and where staff is forecasted to grow and to shrink
Provide details on expected space needed (based on job title and location)
Provide details on variance against space available - BU’s can be notified that they are
looking to hire more people in a location than space available
Forecasted real-estate needs report
Customers
Decision support
Future opportunity:
Link forecast to headcount budget
items beyond salaries
Port forecasts into SAP
Finance
Initial opportunity:
Linking headcount planning to budgeting
(through workforce modeling and scenarios)
Calculate the cost of forecasted labor
Time Interval Location_Descr Ending Headcount Ending FTE SQFT_Direct SQFT_Loaded
3/31/2008 Location 7 5 5 1920 2774.57
6/30/2008 Location 7 5 5 1920 2774.57
9/30/2008 Location 7 5 5 1920 2774.57
12/31/2008 Location 7 3 3 1152 1664.74
Planning for our future workforce at Edison
Sample data
Interval Date Job Group R1 R2 FTotal
Hires
Adds Backfills
Bookkeeping/Acctg Well Gap Gap 0 0 0
Other Professionals Well Gap Well 2 0 2
Senior Management Gap Gap Gap 2 0 2
Analysts Well High Gap Well 8 0 8
Engineers & Scientists Gap Gap Gap 6 0 6
Other Professionals Well Gap Well 2 0 2
Professional Support Well Gap Well 107 29 78
Other Clerical Well Well Well 2 0 2
Middle Management Gap Well Gap 6 0 6
135 29 1062011 Q1 Total
REPRESENTATION - GAP
RATING
Grand Total
Job Title (CIP)
2011 Q1
MPC1
SPM3
PSO2
PSP2
PTW2
PRF1
STU5
SUP4
7650
Figure 11: “Planning for Our Future Workforce at Edison” document

Copyright © Best Practice Institute, Inc. Do not share or distribute without prior written or verbal consent of Best Practice Institute, Inc.
18
Measuring the Workforce Planning Program Below, you have been provided the metrics that we used to evaluate the workforce planning program (see Table 6).
Specifically, we define the measure, the purpose of the measure, results and improvement steps if improvements were
needed.
Measure Purpose Result Improvement Steps
% of Assigned Plans Complete Measure Participation High N/A
% Planner who submitted plan
on time
Measure Participation Medium More effective training; plan at more
consistent levels; use Talent Acquisition
data for reconciliation instead of SAP
vacancies
% Accuracy of Proforma Supply
Forecast
Measure Usefulness of
Attrition and Retirement
Forecast to determine
Backfills
High N/A
% Forecasts Usable by Talent
Acquisition and Management at
time of plan submission
Measure Accuracy in Terms
of Usefulness of Plan to
Downstream Users
Medium Planners need to delve more into
specific job roles: all headcount is not
the same
% Forecasts Usable by Talent
Acquisition and Management 6
month after plan submission
Measure Accuracy in Terms
of Usefulness of Plan to
Downstream Users
Low N/A: Rate Challenge has materially
changed staffing strategies; Going
forward, integrate Staffing Cap into
workforce forecast
Directional Accuracy of Plan to
Real Estate
Measure Accuracy in Terms
of Usefulness of Plan to
Downstream Users
High N/A
Table 6: Metrics Used to Evaluate the Workforce Planning Program
Next Steps for Edison– Linking to External Data Currently, we are brokering an industry first partnership with Vemo, our workforce planning solution provider and
Wanted Analytics, a well-known provider of labor market data, to link external labor market data directly into our
planning solution. This should allow planners at Edison to be notified in real time that a specific position they are
planning might be very difficult to fill from the external labor market. The planner can then make the informed decision
on if the planned position is “a nice to have”, “a need to have”, or if the work could be done by some other means.

Copyright © Best Practice Institute, Inc. Do not share or distribute without prior written or verbal consent of Best Practice Institute, Inc.
19
Edison has been developing a pilot program with the Vemo and PwC Saratoga to import benchmarks from Saratoga
directly into Vemo. PwC Saratoga’s Global metrics and measurement database spans more than 450 metrics across
workforce productivity, span of control, succession planning, recruiting costs and efficiency, quality of hire, labor costs,
turnover, diversity and human resource department cost and organizational structures. This should allow Edison to
make more informed data driven decisions and better understand how our specific workforce measures compare to
external benchmarks.
By bringing together the right information and the right people, we can come up with the plans needed to deliver on
tomorrow’s business strategy. As workforce requirements evolve and the workforce demands change, workforce
planning allows for realignment of the HR strategy to support the business strategy by recruiting, developing, engaging
the best possible talent, at the needed time and at a reasonable cost.
Copyright © Best Practice Institute, Inc. Do not share or distribute without prior written or verbal consent of Best Practice Institute, Inc.
20
About the Author
Michael Manning is the Sr. Manager of Strategic Workforce Planning, Human Capital Analytics & Employee Engagement at Edison International and has accountability for setting the strategic direction for the use of Edison’s employee data. Michael leads a team of 7 professionals with responsibility for strategic workforce planning, company HR goals, metrics, analytics and reporting, and the company-wide employee engagement program. Michael joined Edison in March of 2010 as Sr. Project Manager. In this role Michael led the requirements collection, RFP, and selection of a strategic workforce planning solution. In 2011 Michael led the configuration, customization and implementation of the SWP solution. The SWP solution successfully launched in July of 2011, at which point Michael was moved to his current position. Prior to joining Edison, Michael worked for Merck pharmaceuticals where he managed human resources for quality operations across 3 sites in New Jersey and Pennsylvania. In addition to his generalist role he was responsible for HR measurement and planning/modeling of the workforce for those sites. Prior to Merck, Michael worked for Siemens in various HR strategy and engineering roles in California, Kentucky, Massachusetts and New Jersey/New York. Michael was a member of a 3 person team who launched Siemens first HR data warehouse and a graduate of Siemens fast track rotational development program. Michael holds an MBA with Beta Gamma Sigma honors in operations management, is an experienced Six Sigma Black Belt with a focus on HR and business processes, and is certified as a Senior Professional in Human Resources. He resides in the greater Los Angeles area.