a c t iv it ie s f o r l in e a r r e g r e s s io ninspire.stat.ucla.edu/unit_02/helilinear.pdf ·...
TRANSCRIPT

NCSSM Statistics Leadership Institute 2000
ACTIVITIES FOR LINEAR REGRESSION
From theNCSSM Statistics Leadership Institute 2000
Julie Hicks Mark Lutz Sandi TakisWoodbridge HS Dayton, Ohio Yorktown HSWoodbridge,VA Arlington, [email protected] [email protected] [email protected]
George Box first designed the helicopters used in this activity for teaching statistics. This specificactivity can be used in the unit on inference for linear regression. Students are asked to design anexperiment to collect data, fit a linear model to the data, check the assumptions for regression andinference on the slope of the regression line, perform a hypothesis test, and construct a confidenceinterval estimate of the slope. Alternatively, students could collect the data when studying linearregression and complete the Descriptive Statistics section, then revisit the data later whenstudying inference for regression. This packet is organized as follows:
• A student activity package.
• Sample data and answers (in italics) for the student activities: This section provides sampleresults from the experiment.
• Teacher commentary: This section provides an in-depth discussion of the issues involved inthe design and analysis of this activity.
• Appendix A: This section examines data collected under an alternative experimental design.
• Appendix B: This section provides the helicopter template and directions for constructing thehelicopter.
• Appendix C: Bouncing ball activity: This section provides an additional or alternativeactivity that will illustrate the same ideas of linear regression and inference for regression.
NCSSM Statistics Leadership Institute 2000 1
HELICOPTER FLIGHTS
The QuestionHow does the mean time it takes for a helicopter to fall to the floor change as the height fromwhich it is dropped increases?
Materials• Helicopter Template• Stopwatches• Measuring tapes or meter sticks• Paper clips (for varying weight) or medium-sized binder clips for outdoor drops• Masking tape (to mark drop heights on vertical wall)• Cards, dice, or random digit table
Experimental DesignDescribe in detail how you will collect your data. Include the number of trials you will conductat each height, the heights you will use, and how you will randomize these. Also address theissue of how the helicopters will be dropped (technique for dropping and who will do the drop)and how the descent will be timed (number of timers). Explain possible sources of variability inyour data and efforts you will make to reduce effects of possible confounding variables.Describe the scope of inference for your results.
Data CollectionAs your group collects data, record the drop height and time for each drop. You may use theattached Student Data Sheet or create a similar data sheet to be consistent with the design of yourexperiment.

NCSSM Statistics Leadership Institute 2000 2
STUDENT DATA SHEET
(Height is measured in meters, time in seconds)
Trial Height: ____ Height: ____ Height: ____ Height: ____ Height: ____
1
2
3
4
5
6
7
8
9
10
11
12
13
14
15
16
17
18
19
20

NCSSM Statistics Leadership Institute 2000 3
Descriptive Statistics1. Construct a scatterplot of the response variable (time of descent) versus the explanatory
variable (height) and copy it below. Does a linear model appear to be appropriate for thesedata? Explain.
2. Find a least squares regression line. Graph the line on the scatterplot and make a scatter plotof the residuals. Do you feel that a linear model is appropriate? Explain using the residualplot. What does the slope tell you about the relationship between drop height and descenttime? What is the meaning of the y-intercept?
Inferential Statistics1. Checking the assumptions: For each drop height, construct a histogram to display the
distribution of times of descent. Calculate and record the sample mean and standarddeviation of these distributions. Are the assumptions of normality and equal variance acrossvalues of the explanatory variable valid with these data? Explain. Also discuss any otherassumptions necessary for inference on regression. Be sure to explain why you think eachassumption is or is not satisfied.
2. Provide a copy of your computer output. Specifically include the parameter estimates andthe standard errors of the estimates.

NCSSM Statistics Leadership Institute 2000 4
3. Perform a hypothesis test for the slope of the regression line. Be sure to state yourhypotheses in both symbols and words.
4. Construct a confidence interval estimate of the slope β. Show all work.
5. Conclusions. State your conclusions in complete sentences, summarizing the results of thehypothesis test and confidence interval in the context of the question you are trying toanswer.

NCSSM Statistics Leadership Institute 2000 5
HELICOPTER FLIGHTSSAMPLE STUDENT ANSWERS
The Question: How does the mean time it takes for a helicopter to fall to the floor change asthe height from which it is dropped increases?
Note to teacher: The following provides results from when we ran this experiment at theNCSSM Statistics Institute. The specific experimental design that we used and the resultswe obtained are provided in this section. For a discussion of alternative designs andconsequent changes in the conclusions we can draw, see the Teacher Commentary. Thedesign and results were written from a student’s point of view.
Experimental DesignDescribe in detail how you will collect your data. Include the number of trials you will conductat each height, the heights you will use, and how you will randomize these. Also address theissue of how the helicopters will be dropped (technique for dropping and who will do the drop)and how the descent will be timed (number of timers). Explain possible sources of variability inyour data and efforts you will make to reduce effects of possible confounding variables.Describe the scope of inference for your results.
Data Collection:To examine the relationship between the drop height and descent time, we dropped helicoptersfrom each of five different heights and measured the descent time.• We constructed 50 long-rotor helicopters. (See template for constructing helicopters in
Appendix B.) We used copy paper and placed a jumbo paper clip on the shaft to providemore stability.
• We selected and marked five drop heights in a gym: 1.77 m, 2.29 m, 2.83 m, 3.36 m 4.39 m.• To organize the data collection, we worked in pairs. Ten people collected data, giving 5
pairs. In each pair, one acted as a dropper and the other as a timer and then the roles werereversed.
• Each of us dropped one helicopter from each height, using a different helicopter for eachdrop. Because we were working in pairs, each timer also measured at each height. Thisresulted in 10 trials at each height.
• Each pair randomized the order of height and dropper, using a calculator random numbergenerator.
• The dropper held the helicopter under the rotors with the base even with the height marker.• The timer measured the time it takes from when the helicopter is released until it hits the
ground. Times were recorded to the nearest hundredth second.• We combined the data from all students for the analysis.
Sources of Variability and Efforts to Reduce Effects of Confounding Variables:• Differences in droppers and timers: Because everyone drops and times at each of the heights
these differences should not be confounded with height though they will lead to additionalvariation in times reported.
• Differences in helicopters: Because the helicopters were constructed in the same manner andwere selected randomly, helicopter condition should not be confounded with height if a newhelicopter is used for each drop. The use of different helicopters may also increase variationin times reported. However, repeated use of helicopters could cause problems due to wear

NCSSM Statistics Leadership Institute 2000 6
and tear that we felt were more difficult to control and repeated use restricts the scope ofinference.
• Weather conditions (temperature, humidity, and altitude): Attempts should be made tocontrol these conditions by performing the experiment in one location and gathering all dataat the same time. We performed the experiment inside because conditions were easier tocontrol than if we had performed the experiment outside, where breezes could be aconfounding variable.
Scope of Inference:• Since all helicopters were constructed from the paper in one package of paper, it is only
possible to make inferences about helicopters constructed from that package of paper.However, it seems reasonable to expect helicopters made from copy paper of the same weightto behave in a similar manner, so we feel comfortable extending our scope of inference toinclude other packages. It would not be reasonable to make inferences about helicoptersconstructed from paper that was either lighter or heavier based on our data.
• The time of descent may be predicted from the height of the drop for heights ranging fromapproximately 1.77 m to 3.36 m. It would be risky to try to predict for heights either above orbelow those values.
• The drops were performed during the month of July in Durham, NC. It is reasonable tobelieve that locations with different altitudes, temperature, or humidity levels may producedifferent results.
Actual Sample Data (Height is measured in meters, time in seconds)
Trial Height: 1.77 Height: 2.29 Height: 2.83 Height: 3.36 Height: 4.391 1.49 1.77 2.36 2.60 3.382 1.12 1.62 2.04 2.65 3.423 1.39 1.66 2.27 2.80 3.914 1.19 1.64 2.30 2.58 3.135 1.35 1.28 1.75 2.31 2.636 1.32 1.20 1.97 2.33 2.587 1.28 1.63 2.26 2.73 2.868 0.73 1.83 2.20 2.74 2.899 1.32 1.72 2.27 2.56 3.2710 1.53 1.64 2.29 3.04 2.99
Descriptive Statistics1. Construct a scatterplot of the response variable (time of descent) versus the explanatory
variable (height) and copy it below. Does a linear model appear to be appropriate for thesedata? ExplainAnswer:

NCSSM Statistics Leadership Institute 2000 7
Although there is variation in the response variable at each height, there appears to be apositive linear relationship between height and mean time of descent. The points at thegreatest height appeared to be more spread than the lower heights. Because of thesedifferences, we interviewed the people involved in collecting the data, and determined thatthere were different conditions affecting the drops from that height. Specifically, individualspositioned their helicopters much differently because the height was not labeled, somestudents dropped at one end of the gym and others at the other end. Furthermore, this dropwas from the balcony, not from the bleachers like all of the other heights. Therefore, wedecided to omit the data collected at this height for further analysis. Thus our scope ofinference is narrowed, making it risky to predict times for heights exceeding 3.36 meters.
Note to teacher: It is important to note that you should be very careful when making adecision to omit data. Getting a better fit for your model is not a legitimate reason toexclude information!
2. Develop a linear model for the data. Graph the line on the scatterplot and make a scatter plotof the residuals. Do you feel that a linear model is appropriate? Explain using the residualplot. What does the slope tell you about the relationship between drop height and descenttime? What is the meaning of the y-intercept?
Since the data appear to be linear, a least squares regression line was fit to the data.
SCATTERPLOT: PLOT OF RESIDUALS:

NCSSM Statistics Leadership Institute 2000 8
Time = -0.330329 + 0.877787 Height
The plot of residuals does not suggest any major problems with the linear model. At each height,both positive and negative values may be observed and there is no obvious pattern to theresiduals. The envelope, or outermost points, in the residual plot appears curved; however, ifone covers the residual point in the upper right corner, the apparent curvature disappears. Thissuggests that there is no true pattern of curvature -- only an envelope that suggests curvature tothe inexperienced eye.
The slope of the regression line tells you that for every one-meter increase in drop height, thedescent time increases by approximately .88 sec on average. The reciprocal of the slope is anestimator for the velocity of the helicopters. This velocity is therefore estimated at 1.13923m/sec on average. The y-intercept would be the time of descent when the initial height is zero.This value certainly should be zero. Since it is not zero, this is an example of the dangers ofextrapolating outside the range of the data. For further discussion, see the teacher commentary.
Note to teacher: If you only look at the largest residual at each height, there appears to becurvature. The eye is drawn to the outer most points in any plot. However, looking at all points, alinear model seems appropriate because the positive and negative residuals were balanced at eachheight. For further discussion, see the teacher commentary.

NCSSM Statistics Leadership Institute 2000 9
Inferential Statistics
1. Checking the assumptions: Construct a histogram of the distributions of observed times ofdescent for each height. Calculate and record the sample means and standard deviations foreach height. Are the assumptions of normality and equal variance appropriate with thesedata? Explain. Also discuss any other assumptions necessary for inference on regression.
(See the last page of this section for graphs. Sample means and standard deviations areprovided with the graphs.)
Normality: For each height, a histogram, boxplot, and normal quantile plot has beenconstructed. The lowest height (1.77 m) has a low outlier, otherwise the distributionappeared to be fairly normal. The distributions at 2.29 m and 2.83 m are suspect,but only one point falls outside the confidence band for the normal quantile plots.The measurements at 3.36 m and 4.39 m look fairly normal. The small sample sizemade assumptions for normality somewhat difficult to judge, but no serious concernsseem to be present.
Constant standard deviation of the response variable across values of the explanatoryvariable: The difference in the sample standard deviations for the four heightsincluded in the analysis was not large enough to be a concern.
Data were collected using techniques consistent with a SRS. The helicopters were constructedfrom paper taken from one package of copy paper, then selected randomly before theywere dropped. It is reasonable to believe there was independence between the drops.
A linear model seems appropriate for these data as discussed earlier.
Note to Teacher: It should be noted that normality is not a requirement fordescriptive statistics. It is needed when conducting tests and calculatingconfidence intervals for slope. Also, computer packages usually use the termsmean, variance, and standard deviation without regard to whether populationparameters or their sample estimates are being computed. It is theresponsibility of the experimenter to communicate clearly whether populationor sample quantities are being considered.
2. Parameter Estimates (from computer output or calculator):
Parameter EstimatesTerm Estimate Std Error t Ratio Prob>|t|Intercept -0.330329 0.146986 -2.25 0.0305Height 0.877787 0.05588 15.71 <.0001
3. Perform a hypothesis test for the slope of the regression line. Be sure to state yourhypotheses in both symbols and words.
H0: β = 0 (On average the descent time of the helicopters is the same regardless of the height from which they are dropped.)
Ha: β > 0 (On average the descent time of the helicopters increases as drop height increases.)
. ..b
b 0 877787t 15 71se 0 05588
= = = (b and seb come from the computer output)

NCSSM Statistics Leadership Institute 2000 10
. .0001p 000052
< = (The computer reports the results for a two-sided test. Since
this is a one-sided test, the p-value from the compute output was divided by 2.)
4. Construct a confidence interval estimate of β. Show all work.
95% Confidence Interval: b ± t* (seb) = 0.877787 ± 2.025 * 0.05588 = (.764792, .990782)
The t*-value is based on 40 – 2 = 38 degrees of freedom. We are 95% confident that themean change in time per unit change in height is between 0.765 sec/m and 0.991 sec/m.A confidence interval for the velocity was calculated by taking the reciprocal of theendpoints of the confidence interval for the slope. With 95% confidence, the meanvelocity is between 1.009 m/sec and 1.307 m/sec.
5. Conclusions: State your conclusions in complete sentences, summarizing the results of thehypotheses test and confidence interval in the context of the question you are trying toanswer.
Based on the small p-value, we can conclude that it is highly unlikely we would get thislarge or larger positive slope from a regression on a random sample if the true value of βwere zero. The confidence interval contains only positive values, supporting theconclusion drawn by our hypothesis test that the true slope β is greater than zero.
Therefore, we can conclude that there is a positive relationship between time and height,i.e. greater heights produce larger descent times. Because of the linear nature of thedata, descent time can be predicted from height of drop using the least squaresregression line.

NCSSM Statistics Leadership Institute 2000 11
DISTRIBUTION OF TIME BY HEIGHTThe following graphs were made using JMP IN (pronounced “jump in”). They were provided togive the teacher additional insight into the analysis. It is not necessary that you have JMP IN toperform this experiment. Other statistical packages and some graphing calculators will give similarplots
Height: 1.77m
0.4
0.6
0.8
1
1.2
1.4
1.6.01 .05 .10 .25 .50 .75 .90 .95 .99
-2 -1 0 1 2 3
Normal Quantile Plot
Mean 1.272000Std Dev 0.226657
Height: 2.29m
1
1.2
1.4
1.6
1.8
2.01 .05 .10 .25 .50 .75 .90 .95 .99
-2 -1 0 1 2 3
Normal Quantile Plot
Mean 1.599000Std Dev 0.201850
Height: 2.83m
1.6
1.8
2
2.2
2.4.01 .05 .10 .25 .50 .75 .90 .95 .99
-2 -1 0 1 2 3
Normal QuantilePl t
Mean 2.171000Std Dev 0.191395
Height: 3.36m
2.2
2.4
2.6
2.8
3
3.2.01 .05 .10 .25 .50 .75 .90 .95 .99
-2 -1 0 1 2 3
Normal QuantilePl t
Mean 2.634000Std Dev 0.216035
Height: 4.39m
2.2
2.4
2.6
2.8
3
3.2
3.4
3.6
3.8
4.01 .05 .10 .25 .50 .75 .90 .95 .99
-2 -1 0 1 2 3
Normal QuantilePl t
Mean 3.106000Std Dev 0.404343
NCSSM Statistics Leadership Institute 2000 12
Teacher Commentary
Questions about the Logistics of the Experiment
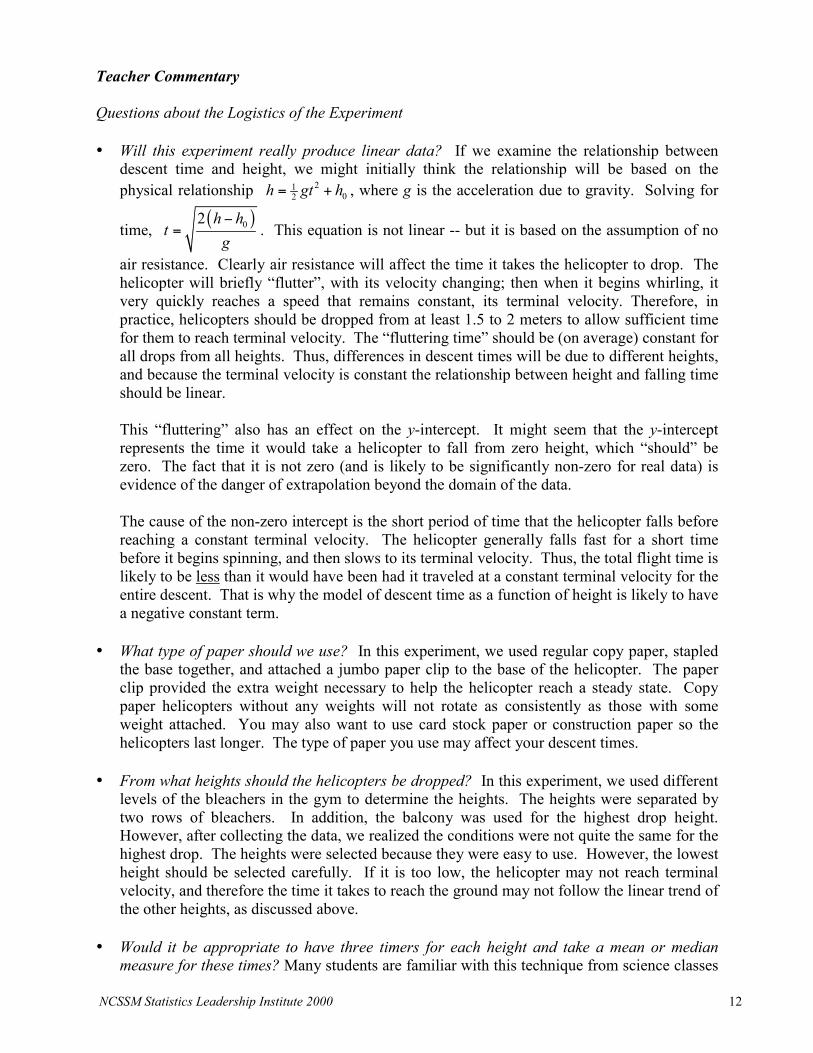
• Will this experiment really produce linear data? If we examine the relationship betweendescent time and height, we might initially think the relationship will be based on thephysical relationship 21
02h gt h= + , where g is the acceleration due to gravity. Solving for
time, ( )02 h h
tg−
= . This equation is not linear -- but it is based on the assumption of no
air resistance. Clearly air resistance will affect the time it takes the helicopter to drop. Thehelicopter will briefly “flutter”, with its velocity changing; then when it begins whirling, itvery quickly reaches a speed that remains constant, its terminal velocity. Therefore, inpractice, helicopters should be dropped from at least 1.5 to 2 meters to allow sufficient timefor them to reach terminal velocity. The “fluttering time” should be (on average) constant forall drops from all heights. Thus, differences in descent times will be due to different heights,and because the terminal velocity is constant the relationship between height and falling timeshould be linear.
This “fluttering” also has an effect on the y-intercept. It might seem that the y-interceptrepresents the time it would take a helicopter to fall from zero height, which “should” bezero. The fact that it is not zero (and is likely to be significantly non-zero for real data) isevidence of the danger of extrapolation beyond the domain of the data.
The cause of the non-zero intercept is the short period of time that the helicopter falls beforereaching a constant terminal velocity. The helicopter generally falls fast for a short timebefore it begins spinning, and then slows to its terminal velocity. Thus, the total flight time islikely to be less than it would have been had it traveled at a constant terminal velocity for theentire descent. That is why the model of descent time as a function of height is likely to havea negative constant term.
• What type of paper should we use? In this experiment, we used regular copy paper, stapledthe base together, and attached a jumbo paper clip to the base of the helicopter. The paperclip provided the extra weight necessary to help the helicopter reach a steady state. Copypaper helicopters without any weights will not rotate as consistently as those with someweight attached. You may also want to use card stock paper or construction paper so thehelicopters last longer. The type of paper you use may affect your descent times.
• From what heights should the helicopters be dropped? In this experiment, we used differentlevels of the bleachers in the gym to determine the heights. The heights were separated bytwo rows of bleachers. In addition, the balcony was used for the highest drop height.However, after collecting the data, we realized the conditions were not quite the same for thehighest drop. The heights were selected because they were easy to use. However, the lowestheight should be selected carefully. If it is too low, the helicopter may not reach terminalvelocity, and therefore the time it takes to reach the ground may not follow the linear trend ofthe other heights, as discussed above.
• Would it be appropriate to have three timers for each height and take a mean or medianmeasure for these times? Many students are familiar with this technique from science classes

NCSSM Statistics Leadership Institute 2000 13
or sporting events. It is appropriate to use this technique and it will probably reduce thevariability of times because some of the measurement error will be removed. The regressionmodel is for the average true descent time. What we can measure is “true descent time + stopwatch error, etc.” If you know the “stop watch error” is not symmetric, the median of thethree measurements should be used.
• How long did the experiment take? If you only have 45-minute periods, we suggest that youdiscuss the experimental design issues and perform some practice runs on the first day so thatthe design, the heights, and the dropping and timing techniques can be finalized beforestarting the full experiment. The second day would be the actual data collection, which couldtake the entire period. At the end of this period, students could be given the class data to takehome and start the preliminary analysis or write up a full analysis outside of class.
Questions about the Experimental DesignThe challenging part of teaching experimental design is that students can come up with a widevariety of designs. As the teacher, you must determine not only if they have good designs, butalso whether the data collected from these designs will answer the question posed and what typeof analysis should be performed on the data. The following discussion examines some changesin the experimental design and how these changes would affect the conclusions we can draw andthe analysis we would perform.
• What if only one pair of students collects the data? If one student drops all helicopters andanother does all the timing, variability would be reduced. However, the scope of inference islimited to drops by those two students. The time required to collect the data may beprohibitive for a class period because the pair will be collecting all the measurements andmust move from height to height in random order. In addition, to keep students engaged, it isbetter to have everyone collect some data. To study this design in more detail, we collecteddata using one dropper and one timer. A discussion of the results is provided in theAppendix A.
• What if you stationed one pair of students at each height and had the pair collect all of thedata at that height? This method would certainly reduce the time it takes to collect the data.However, it creates a major issue in the analysis. Differences in timing and droppingbetween the pairs will likely create confounding variables that might not allow us to see alinear relationship. In addition, a major assumption in inference on slope is that the times ateach height will be normally distributed with the same variance. Although we did not testthis method, it is possible that different pairs will have different variability and therefore, theassumptions underlying the inference techniques may not be met.
• What if you didn’t require each group to drop from each height, rather the pairs randomlyselected 10 heights and dropped the helicopters from the heights in the order selected? Inthis scheme it is possible that each student may not drop from every height. However, thisdesign is valid and similar techniques to those provided in the Sample Student Answers canbe used.
Questions about the Analysis - Descriptive Statistics
• When is it appropriate to remove data from the analysis? As discussed in the SampleAnswers, we must be very cautious about removing data. In this experiment, when we first

NCSSM Statistics Leadership Institute 2000 14
examined the data, we could see that times for the four lowest heights behaved much moreconsistently than times for the highest drop height. Thus, we reviewed our data collection atthis height and found that individuals dropped at different positions on the balcony and atslightly different heights. In addition, all of the other heights were collected from the samepart of the gym. There were enough differences in the data collection at the highest heightthat we felt we should limit our scope of inference for heights to the four lowest heights. Weemphasize that removing data just because it does not fit the linear trend is not appropriate.
• What are reasonable guidelines for examining residuals and patterns? Residuals provide themajor tool in assessing the linearity of the data. Students should look for patterns in theresiduals that imply a linear relationship is not appropriate. An obvious pattern that implies alinear function is not appropriate is residuals that follow the trend of a parabola.Occasionally, it is difficult to determine whether or not a pattern is present—what one studentrecognizes as a pattern, another student might suggest is random. If you consider your x-values in three groups (low, medium, and high), you can use the following guideline: check tosee that the residuals are relatively balanced between positive and negative values for each ofthe three groups
• Can we use the line to make predictions? Because we are comfortable that the mean descenttimes are linear for heights above that needed for the initial flutter, we can use the line topredict the mean descent time for different heights within the range of heights we used(interpolation). However, we should not use the line to predict the descent times for heightsthat are outside of the range of heights (extrapolation).
Questions about the Analysis – Inferential Statistics
• What do the assumptions mean and what are reasonable guidelines for accepting theassumptions? A major focus of this experiment is to illustrate the requirements for validinferential statistics on regression:
! There is a linear relationship between the x-values and the means of the y-values. In thisexperiment, we examined whether the data were linear by considering the physical realitywe were exploring as discussed earlier in the teacher commentary. The data supportedlinearity as well. Typically scientists will have a strong theory on the type of functionthat should be used to model the data. When possible, theoretical models should bediscussed with students before moving quickly to analysis of the data. As discussedabove, residuals should be examined thoroughly to determine whether a linear model isappropriate.
! At each x-value there is a population of y-values that is normally distributed. Thisexperiment allows students to examine the normality of the data at each x-value becausethere are multiple trials at the same height. With only 10 values at each x-value, a smoothbell-shape is unlikely. However, students can examine a histogram or boxplot of thedata, look for outliers and extreme skewness in the data. Because the t-procedures arerobust, some departure from normality is acceptable. More measurements at each heightwill enable you to determine more easily whether this assumption is met. Frequently, inpractice, the data do not include multiple y-values at each x-value. If this is the case, wecan examine the normality of the residuals. If the residuals are relatively normal, we feelmore comfortable with the assumption that the y-values are normally distributed at each

NCSSM Statistics Leadership Institute 2000 15
x-value because in a random selection of y-values, we should see the same variationaround the line as we should see for each x-value.
! The variance in y-values at a given x-value is constant across all x-values. The scatterplotproduced in this experiment provides a nice visual to understand this concept. We cansee in the graph the range in y-values for each x. With the exception of the fifth height,the range in y-values is very consistent. Based on the sample size used in thisexperiment, the largest variance should be no more than about four times the size of thesmallest variance.
! The sample y-values are independent. This assumption connects to the idea that there is apopulation of y-values for each x. We are assuming that individual observations fromthis population of y-values are independent of each other. The values are centered aroundthe population mean and the population is normally distributed; however, the differencebetween an individual y and the mean y-value—the error or residual—is a randomvariable. Thus the y-values are independent.
• Why didn’t we discuss all of these assumptions when we studied regression as a DescriptiveStatistics topic? Inference on regression is based on the same ideas as inference on means orproportions: we are using sample data to draw conclusions about or make estimates of thepopulation parameters. In linear regression, we are estimating two parameters—the slope andthe y-intercept—to estimate the population regression line. It is important to consider thatthere are two lines—the “true” population line and the line estimated using the sample data.The population regression line models the change in the mean y-value for correspondingchanges in x. It is not intended to model all y-values at each x-value. If we are not intendingto perform a statistical test on or build a confidence interval for the slope and y-intercept,these assumptions are not important: we can use the line to describe the trend and to makepredictions within the range of our x-values.
• How should my students interpret the results of a t-test for the slope of the regression? Thist-test is used to assess whether or not the “true” slope is zero. It does not tell us whether ornot the relationship is linear; the residual graph, as discussed above, is our primary tool inassessing linearity. However, students should go beyond stating that the slope is zero or theslope is not zero. In this experiment, we were examining if the descent time increases as theheight increases. Because we showed that the slope was significantly positive, we concludedthat the descent time does increase as descent height increases and we can estimate, onaverage, how much the descent time will change with changes in drop height. If we failed toreject the null hypothesis, we would conclude that there was not sufficient evidence tosuggest that the descent time changed with changes in height.
• Why don’t we test the significance of the y-intercept? In our experiment, the computer outputincluded a p-value of 0.0305 for the y-intercept, implying that it was statistically differentfrom zero. However, zero is well below the range of heights we studied and, as discussedearlier, we should not drop the helicopters from heights that are too low because the linearrelationship may not hold. Furthermore, the y-intercept would represent the time it wouldtake the helicopter to fall if it were dropped from a height of zero. Therefore, the intercept isnot very valuable in this situation and hence, we did not use inferential techniques on theintercept. In many other situations, it is appropriate to examine the significance of the y-

NCSSM Statistics Leadership Institute 2000 16
intercept. For example, if we were modeling salary based on years of experience, we couldestimate the mean starting salary using the y-intercept.
• How should my students interpret the results of the confidence interval? The confidenceinterval provides an estimate for the slope parameter. It is important to reiterate that thisestimate is based on sample measurements.

DRAFT - NCSSM Statistics Leadership Institute 2000 A-1
Appendix A - What if you only used one dropper?
In our suggested design, we used several droppers and required that each dropper drophelicopters from each height. Another design might have only one dropper and timer pair for theentire experiment. This dropper would drop multiple times from each height. It is still veryimportant that the dropper randomize the heights and not just drop all of the helicopters fromheight 1, then height 2, and so on. Rather, random numbers between 1 and 5 to represent heightsshould be selected until each height is selected 10 times. This string of numbers will representthe order in which the heights are completed. For instance, the string 134253312 would suggestthat you drop at height 1 first, then height 3, then height 4, etc.
This design has a narrowed scope of inference. Because we are using only one dropper/timerpair, the true scope of inference is only for this pair. In contrast, if several droppers are used, thescope of inference is widened to more droppers and if these droppers are random selections ofstudents at the school, then we can draw inferences for the entire population of students at thatschool. We have provided the following discussion to show what differences in the data wefound when a single dropper was used (Single Dropper/Timer Design) and how it compares tothe data collected in our suggested design (Multiple Dropper/Timer Design).
Actual Sample Data Single Dropper/Timer Design – (Height is measured in meters, times inseconds)
Trial Height 1.77 m Height 2.29 m Height 2.83 m Height 3.36 m1 1.21 1.60 1.95 2.652 1.17 1.30 2.17 2.393 1.36 1.40 2.27 2.254 1.30 1.48 1.64 2.335 1.21 1.63 1.92 2.166 1.20 1.49 1.76 2.467 1.05 1.58 1.93 2.428 1.25 1.34 1.91 2.429 1.35 1.48 1.90 2.39
10 1.25 1.39 2.17 2.43Mean 1.235 1.469 1.962 2.390
St. Dev. 0.091 0.112 0.193 0.130Sample Size 10 10 10 10
Multiple Dropper/Timer Design (The raw data are in the Main Report)Mean 1.272 1.599 2.171 2.634
St. Dev. 0.227 0.202 0.191 0.216Sample Size 10 10 10 10
An initial review of the summary statistics illustrates two key differences in the results underthese designs:

DRAFT - NCSSM Statistics Leadership Institute 2000 A-2
• Mean Time: The data collected under the single dropper/timer design had a lower mean timefor each height than from the multiple dropper/timer design. This result could be due todifferences in the timer and dropper combination. For example, an individual timer mayconsistently start timing late or may have better reaction times and thus, stop the timer morequickly than the other timers. Therefore, if this timer is used to collect all of the data, meantimes will be consistently lower than when multiple timers are used. If a different persontimed all of the drops, we easily could have had all higher mean times or had times thatvaried randomly around the means.
• Variation in Time: The data collected under the single dropper/timer design had much lessvariation in descent times than the times for the multiple droppers. With the exception of the2.83 m height, the standard deviations are approximately twice as large under the multipledropper/timer design. Using one dropper provides more consistency in the method used todrop. In addition, the dropper/timer pair collected much more data, and thus, had morepractice in working together. Both of these factors are likely to reduce the variation indescent times.
In both designs, the population of y-values at each x-value consists of all possible times for thehelicopter to drop from height x under the conditions of the study. In the original design,variability in times at a fixed height was due to differences in droppers, differences in timers, andunexplained variability. In this design, variability in times at a fixed height no longer includesdifferences in droppers or timers. The scope of inference is restricted to that timer and thatdropper. With this restriction, a reduction in the variability in the y’s (times) at a given x(heights) is gained.
Single Dropper/Timer DesignBivariate Fit of Time By Height
Linear FitLinear FitTime = -0.147722 + 0.7460378 Height
Summary of FitRsquare 0.906791RSquare Adj 0.904339Root Mean Square Error 0.145691Mean of Response 1.764
Observations (or Sum Wgts) 40
Analysis of VarianceSource DF Sum of Squares Mean Square F RatioModel 1 7.8469745 7.84697 369.6880Error 38 0.8065855 0.02123 Prob > FC. Total 39 8.6535600 <.0001
Parameter EstimatesTerm Estimate Std Error t Ratio Prob>|t|Intercept -0.147722 0.102061 -1.45 0.1560Height 0.7460378 0.038801 19.23 <.0001

DRAFT - NCSSM Statistics Leadership Institute 2000 A-3
Multiple Dropper/Timer DesignBivariate Fit of Time By Height
Linear FitLinear FitTime = -0.330329 + 0.877787 Height
Summary of FitRSquare 0.866552RSquare Adj 0.86304Root Mean Square Error 0.20982Mean of Response 1.919Observations (or Sum Wgts) 40
Analysis of VarianceSource DF Sum of Squares Mean Square F RatioModel 1 10.863229 10.8632 246.7542Error 38 1.672931 0.0440 Prob > FC. Total 39 12.536160 <.0001
Parameter EstimatesTerm Estimate Std Error t Ratio Prob>|t|Intercept -0.330329 0.146986 -2.25 0.0305Height 0.877787 0.05588 15.71 <.0001

DRAFT - NCSSM Statistics Leadership Institute 2000 A-3
The scatterplots also illustrate that the mean drop time is lower under this single dropper/timerpair than the multiple dropper/timer pairs. An interesting question is whether the two lines aresignificantly different. The statistical techniques to answer this question are beyond the scope ofthe AP curriculum. However, we have included a brief discussion of the techniques and theresults below. There are two questions we can answer about the differences in the lines:
1) Are the slopes significantly different?2) Are the y-intercepts significantly different?
To answer these questions, we performed a multivariable regression on the combined data thatincludes an intercept dummy for the type of design used, and a slope dummy for the interactionbetween slope and the type of design used. A dummy variable incorporates categorical data inan equation by taking the value one for a single category and zero for the other category. Ourspecified model is provided below:
Time = β0 + β1*DropperType + β2*Height + β3*DropperType*Height + error
Where DropperType = 0 for the single dropperDropperType = 1 for the multiple droppers
The variable DropperType has the effect of adding a constant to the slope and y-intercept whenmodeling the multiple dropper/timer design. Effectively, the above model provides twoequations:
Single Dropper/Timer Design: Time = β0 + β2*height + errorMultiple Dropper/Timer Design: Time = (β0 + β1) + (β2 + β3)*height + error
If we find that the parameter β1 is significantly different from zero, we can conclude that thesingle dropper/timer design produced a statistically different y-intercept than the multipledropper/timer design. Similarly, if we find that the parameter β3 is significantly different thanzero, we can conclude that the slopes or the relationship with height is significantly different.The following output summarizes the fit of the multivariable model.
Parameter EstimatesTerm Estimate Std Error t Ratio Prob>|t|Intercept -0.239026 0.089472 -2.67 0.0092Height 0.8119124 0.034015 23.87 <.0001DropperType[Class] 0.0775 0.020194 3.84 0.0003(Height-2.5625)*DropperType[Class] 0.0658746 0.034015 1.94 0.0565
Effect TestsSource Nparm DF Sum of Squares F Ratio Prob > FHeight 1 1 18.587841 569.7385 <.0001DropperType 1 1 0.480500 14.7279 0.0003Height*DropperType 1 1 0.122362 3.7505 0.0565

DRAFT - NCSSM Statistics Leadership Institute 2000 A-4
The overall equation includes all of the variables:
Time = 0.239 0.0775 DropperType+0.812 Height+0.0659 DropperType Height− + ⋅ ⋅ ⋅ ⋅
Single Dropper/Timer Design: Time = -0.239+ 0.812*HeightMultiple Dropper/Timer Design: Time = (-0.239+0.0775) + (0.812+0.0659)*Height
= -0.162 + 0.878*Height
The p-value (0.0003) associated with the variable DropperType suggests that there is asignificant difference in the y-intercepts for the different designs. This conclusion is supportedby the discussion above comparing the mean times at each of the heights. The mean descenttimes collected in multiple dropper/timer design were consistently higher; therefore, thecoefficient for the variable DropperType is positive, shifting the line up.
The p-value (0.0565) associated with the variable DropperType*Height suggests that at the 5%significance level the slopes are not significantly different. This result suggests that the terminalvelocity of the helicopters are not significantly different for the two designs.
DRAFT - NCSSM Statistics Leadership Institute 2000 B-1
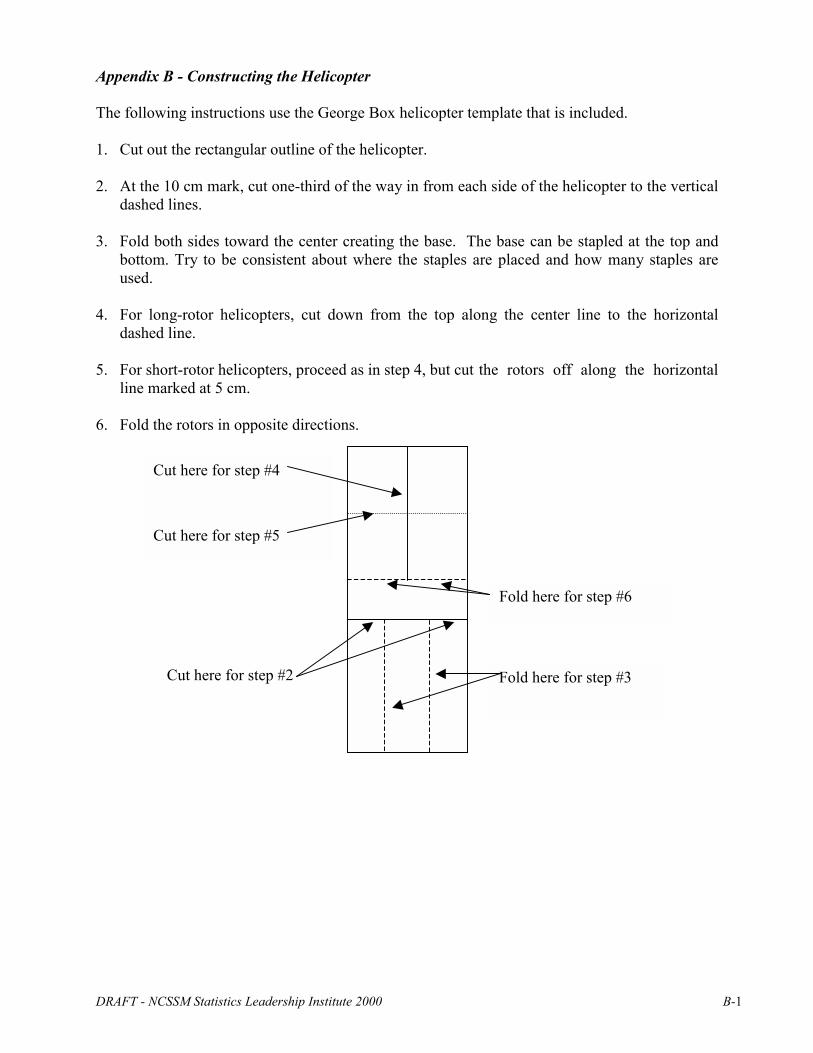
Appendix B - Constructing the Helicopter
The following instructions use the George Box helicopter template that is included.
1. Cut out the rectangular outline of the helicopter.
2. At the 10 cm mark, cut one-third of the way in from each side of the helicopter to the verticaldashed lines.
3. Fold both sides toward the center creating the base. The base can be stapled at the top andbottom. Try to be consistent about where the staples are placed and how many staples areused.
4. For long-rotor helicopters, cut down from the top along the center line to the horizontaldashed line.
5. For short-rotor helicopters, proceed as in step 4, but cut the rotors off along the horizontalline marked at 5 cm.
6. Fold the rotors in opposite directions.
Fold here for step #6
Cut here for step #2
Cut here for step #4
Cut here for step #5
Fold here for step #3

DRAFT - NCSSM Statistics Leadership Institute 2000 B-2
PAPER HELICOPTER DESIGNOriginal Design by George Box
4.5 cm 4.5 cm
5 cm
5 cm
3 cm
10 cm
2.8 cm 2.8 cm3.4 cm

DRAFT - NCSSM Statistics Leadership Institute 2000 C-1
WHAT GOES DOWN MUST COME UP(ONLY NOT QUITE AS FAR)
QUESTION: How does the height from which a ball is dropped affect the height of thefirst bounce? Can we use the initial height to predict the bounce height?
MATERIALS:• One ball for each group• Stopwatches• Tape measures taped to the wall to measure height
EXPERIMENTAL DESIGN:A ball will be dropped repeatedly from different heights and the height of the firstbounce will be measured. Describe in detail the design of your experiment and how youwill randomize your trials. Explain possible sources of variability in your data andefforts you will make to reduce effects of possible confounding variables. Describe thescope of inference for your results.

DRAFT - NCSSM Statistics Leadership Institute 2000 C-2
DATA FOR BALL BOUNCE
TRIAL HEIGHT: HEIGHT: HEIGHT: HEIGHT:
1
2
3
4
5
6
7
8
9
10
11
12
13
14
15
16
17
18
19
20

DRAFT - NCSSM Statistics Leadership Institute 2000 C-3
Descriptive Statistics1. Construct a scatterplot of the response variable (rebound height), versus the
explanatory variable (initial height). Does a linear model appear to be appropriate forthese data? Explain.
2. Find the least squares regression line for the data. Graph the line on the scatterplot andmake a scatter plot of the residuals. Do you feel that a linear model is appropriate?Explain using the residual plot. What does the slope tell you about the relationshipbetween the initial height and the rebound height? What is the meaning of the y-intercept?
Inferential Statistics:1. For each drop height, construct a histogram to display the distribution of rebound
heights. Calculate and record the mean and standard deviation of these distributions.Are the assumptions of normality and equal variance across values of the explanatoryvariable valid with these data? Explain. Also discuss any other assumptionsnecessary for inference on regression. Be sure to explain why you think eachassumption is or is not satisfied.
2. Provide a copy of your computer output. Specifically include the parameter estimatesand the standard errors of the estimates.

DRAFT - NCSSM Statistics Leadership Institute 2000 C-4
3. Perform a hypothesis test for the slope of the population regression line. Be sure tostate your hypotheses in both symbols and words.
4. Construct and interpret a confidence interval estimate of the slope β. Show all work.
5. Conclusions: State your conclusions in complete sentences, summarizing the results of thehypothesis test and confidence interval in the context of the question you are trying toanswer.

DRAFT - NCSSM Statistics Leadership Institute 2000 C-5
TEACHER COMMENTARY
Experimental Design:
In addition to answering the questions posed, a focus of this experiment is to take multiplereadings on each explanatory variable in order to illustrate the assumptions necessary forinference for regression. For this reason it is necessary for each group to make many dropsfrom each initial height. We suggest at least 20 drops from each height. We also suggest atleast four different initial heights so that a pattern of linearity may be established.
This experiment may be done when first studying linear regression or experimental design. Inthis case, the students would complete the Descriptive Statistics section first. The data couldbe revisited later when studying inference for regression.
Class discussion prior to developing a design should focus on such problems as:• Is it appropriate to do all drops from one height before moving to the next height or should
all 80 trials be randomized? What are the benefits and drawbacks of each method?• Should the same person drop the ball each time? Should the same ball be used?• How should measurement be accomplished? Is it sufficient for one person to measure all
drops, or should there be more than one person measuring on each drop? Should the samepeople measure each drop?
• Should practice drops be done before starting the experiment?• Consider the scope of inference. What variables are most important to consider?• What other sources of variation are present in this experiment? Which are most important
to control for?
Descriptive Statistics:Ideally the scatterplot and residuals will indicate a linear model is appropriate. If not, a transformationof the data or re-examination of the data collection process may be necessary.
The slope indicates the increase in rebound height per unit increase in initial height.
The y-intercept would be the mean rebound height when the initial height is zero. Of course,when the initial height is zero, the ball is on the ground and it cannot rebound. However, theintercept may be significantly different from zero. If this is the case, students can clearly see theproblem of drawing inference outside the range of the data.

DRAFT - NCSSM Statistics Leadership Institute 2000 C-6
Inferential Statistics:The assumptions for inference for regression are:
• The values of the y-variable for each value of the x-variable are normally distributed.• The mean values of the y-variables are linearly related.• The values of the y-variables associated with a given x-variable are independent of
one another.• The variance of the y-variables is the same for each x-variable.
The distribution of the y-variables at each x-variable should be normally distributed and thevariances of these distributions should be approximately equal. Because of the robustness of the t-procedures, some departure from these assumptions is acceptable. Students should address thisissue, whether or not the assumptions are fully met.
The summary statistics for regression should include estimates and standard errors for both theslope and the y-intercept.
The hypothesis test should include null and alternative hypotheses and a calculation of the t-statistic:
b
btse
=
Conclusions should be stated in the context of the problem. Include a statement relatingthe p-value of the hypothesis test to the confidence interval. Scope of inference should bediscussed here.
If each group has a different type of ball, the regression equations should be compared. See ifstudents can match equations with balls.