a byte at the apple rethinking education data for the post...
TRANSCRIPT
A Byte at the AppleRethinking Education Data for the Post-NCLB Era
A Byte at the AppleRethinking Education Data for the Post-NCLB Era
Edited by Marci Kanstoroom and Eric C. Osberg
Thomas B. Fordham InstituteNovember 2008
Copyright © 2008 by the Thomas B. Fordham Institute
Published by the Thomas B. Fordham Institute Press 1016 16th Street NW, 8th Floor Washington, D.C. 20036 www.edexcellence.net [email protected] (202) 223-5452
The Thomas B. Fordham Institute is a nonprofit organization that conducts research, issues publications, and directs action projects in elementary/secondary education reform at the national level and in Ohio, with special emphasis on our hometown of Day-ton. It is affiliated with the Thomas B. Fordham Foundation. Further information can be found at www.edexcellence.net, or by writing to the Institute at 1016 16th St. NW, 8th Floor, Washington, D.C. 20036. The report is available in full on the Institute’s website; additional copies can be ordered at www.edexcellence.net. The Institute is neither con-nected with nor sponsored by Fordham University.
Text set in Scala and Scala Sans Design by Alton Creative, Inc.
Printed and bound by Peake DeLancey Printers LLC in the United States of America
9 8 7 6 5 4 3 2 1
Contents
Foreword ........................................................................................................ixMarci Kanstoroom, Eric C. Osberg, and Robert D. Muller
Introduction: Education Data Today ...................................................................................1
Paul Manna
I. Why We Don’t Have the Data We Need
Getting FERPA Right: Encouraging Data Use While Protecting Student Privacy ......38
Chrys Dougherty
Federalism and the Politics of Data Use ...........................................................................70
Kenneth K. Wong
Political Roadblocks to Quality Data: The Case of California .........................................90
RiShawn Biddle
II. Innovations and Promising Practices
States Getting It Right: The Cases of Kansas and Virginia ..........................................116
Nancy Smith
The Student Data Backpack ............................................................................................. 142
Margaret Raymond
Balanced Scorecards and Management Data .................................................................160
Frederick M. Hess and Jon Fullerton
Circling the Education-Data Globe .................................................................................186
Daniele Vidoni and Kornelia Kozovska
Cutting-Edge Strategies from Other Sectors ..................................................................218
Bryan C. Hassel
III. The Way Forward
From Building Systems to Using Their Data .................................................................248
Aimee Rogstad Guidera
Education Data in 2025 ....................................................................................................266
Chester E. Finn, Jr.
Appendix
Author Biographies ...........................................................................................................280
ix
Foreword
Marci Kanstoroom, Robert D. Muller, and Eric C. Osberg
The Thomas B. Fordham Institute has long observed the state of U.S. education data from two perspectives. As ardent users of this information for our own research, we have often struggled to find accurate and timely data on important questions that we
seek to answer. Several years ago, for example, we undertook to answer what seemed like a straightforward question about charter school funding: how many per-pupil dollars do charters receive in various states in comparison to district-operated schools? To our dismay, answering that question turned out to be anything but straightforward. Our team of analysts wound up devoting 18 months and a sizable budget to arrive at a set of defensible numbers. The existing data, in other words, were nowhere near equal to the rather obvious analytic and public policy use we wanted to make of them. In that instance, they were elusive, non-comparable, out of date, very confused and sometimes misleading. From our other perspective — that of observer, commentator, booster, and sometimes critic of education reform across the United States — we have witnessed hundreds of policymakers struggling to make decisions in the face of incomplete information; school leaders in need of better, clearer, and more actionable data about the performance of their teachers and pupils;
A Byte at the Apple
x xi
Foreword
What’s in This Book
Paul Manna of the College of William & Mary begins by mapping the landscape of data providers and users and suggesting why the data made available by the former are not always the data needed by the latter. Chrys Dougherty of the National Center for Educational Achievement then initiates a trio of chapters on “Why We Don’t Have the Data We Need,” as he offers a perceptive analysis of the role of privacy laws in general and FERPA (the Family Educational Rights and Privacy Act) in particular in restricting what information is available, particularly to policymakers and analysts. (The FERPA landscape could soon be modified by revised federal regulations now underway.) Kenneth Wong of Brown University details the problems posed by federalism, by the multiplicity of government units and agencies with data responsibilities, and by institutional and bureaucratic self interest. Journalist RiShawn Biddle then depicts California’s struggles to develop a statewide data repository, illustrating how policy, politics, and human foible can conspire to limit the availability and dissemination of high-quality education statistics. Lest the reader despair, those critical chapters set the table for five authors who offer a tantalizing menu of possible alternatives and solutions, under the banner of “Innovations and Promising Practices.” Nancy Smith of the Data Quality Campaign shows how two states, Kansas and Virginia, have found ways to overcome political and technical challenges to make solid advances in their education data systems. Stanford’s Margaret Raymond dares to dream of an entirely new system of achievement data management, a “student backpack” of information that accompanies individuals from place to place, separate from the oft-vexed state and district systems. Frederick Hess of the American Enterprise Institute and Jon Fullerton of Harvard offer a vision, too, showcasing the potential uses of data to manage schools and school systems more efficiently and effectively. To add perspective on these issues from beyond the usual U.S. education space, we enlisted three creative and knowledgeable authors. Daniele Vidoni of the Italian National Institute for Educational Evaluation (INVALSI) and Kornelia Kozovska of the Centre for Research on Lifelong Learning (CRELL) explain how school systems in the United Kingdom, Italy and South Korea use education data in powerful ways, while Public Impact’s Bryan Hassel explains how other vital sectors of the American economy have ingeniously deployed data to effect valuable advances.
taxpayers and public officials puzzled by why more resources keep pouring into a system from which little more pours out by way of learning; and fellow analysts frustrated by their inability to draw clear conclusions from muddy or outdated statistics. Fordham president Chester Finn and trustees Diane Ravitch and Bruno Manno have particularly strong and long-standing interests in solving this problem, dating back to, indeed before, their own stints in the U.S. Department of Education as well as their scholarly work. Keenly aware that what gets measured and reported in education is what gets taken seriously, mindful that few problems are correctly diagnosed without good data and even fewer solutions successfully implemented absent accurate information, they encouraged a close examination of this topic. And so we did. With the generous support of the Robertson Foundation, we set out to examine the state of education data in 21st century America and to shape a vision of how this crucial yet seldom studied enterprise might be done differently and better. We knew going in that a small think-tank-style project would not, in and of itself, redirect U.S. education data, but we believed we could usefully lay out the problems, air some alternatives, help get this issue back on the policy agenda, and do a bit of stirring of this important pot. Every once in a while, it’s necessary to do for education data what data and those who compile and disseminate them are supposed to do for education itself. Historians know that Congress’s charge to the original federal “Department of Education,” shortly after the Civil War, was “for the purpose of collecting such statistics and facts as shall show the condition and progress of education in the several states and territories, and of diffusing such information respecting the organization and management of schools and school systems, and methods of teaching, as shall aid the people of the United States in the establishment and maintenance of efficient school systems, and otherwise promote the cause of education throughout the country.” That enterprise is even more vital today — and not just for Uncle Sam. Education data in modern America represent a multi-dimensional, multi-layered undertaking with the power to do great good. The assignment we gave ourselves was to appraise its own “condition and progress.” Toward that end, we enlisted an esteemed set of scholars, analysts and writers whose contributions appear in these pages.
A Byte at the Apple
xii xiii
Foreword
and for a variety of purposes: for holding people and programs accountable, for informing policy, for evaluating programs, for rewarding performance, and for identifying necessary interventions. “We can now ask many questions that we could not previously investigate,” observed a state-level analyst. Advances in technology generally, and web-based applications in particular, make what were formerly a pipe dream — real-time data — a possibility. Many groups have been pressing for further improvements. At the risk of overlooking others who deserve plaudits, let us salute the Data Quality Campaign (DQC), a venture of the National Center for Educational Achievement (NCEA), originally founded by Tom Luce and formerly known as Just for the Kids, which has been skillfully nudging states toward longitudinal databases. We’re also impressed by the Schools Interoperability Framework (SIF) Association, whose 1,400 members are working on common software rules and definitions for seamless data sharing. Greatschools.net and SchoolMatters.com provide parents and policymakers with more school-level data than have ever before been accessible (or intelligible). Note, too, that SchoolMatters.com is run by Standard & Poors, an encouraging example of a for-profit firm’s interest in education data — and capacity to improve them. Nonprofit funders such as the Bill and Melinda Gates Foundation, the Walton Family Foundation, the Eli and Edythe Broad Foundation (all three of which support the Fordham Institute) and many others are infusing resources into these and kindred reform efforts. In the public sphere, the U.S. Department of Education’s EdFacts initiative is streamlining and centralizing the many state data submissions it receives. Under former commissioner Mark Schneider’s expert leadership, the National Center for Education Statistics (NCES) strengthened its performance (and its helpfulness) on a dozen fronts. The Council of Chief State School Officers (CCSSO) is working with state education leaders to improve their databases, including tighter connections between K-12 and higher education, while CCSSO’s SchoolDataDirect provides comparable state education data and presses for additional reform. Grants from the federal Institute for Education Sciences to support statewide longitudinal data systems are enabling some of the advances urged by the Data Quality Campaign and others. In sum, progress has been made and lots of praiseworthy efforts are underway. Our hope with this volume is to complement and build upon them so that the U.S. can overcome the great challenges that remain.
Finally, “The Way Forward” offers two future-oriented chapters that integrate much of what came before. Aimee Guidera of the Data Quality Campaign urges states and education leaders to take specific steps to use their newly built data systems thoughtfully and constructively. Fordham’s Chester Finn closes the volume with a vision for the year 2025, in which Washington joins with schools, districts and states to collect and deploy education data in ways that most benefit those who depend on this information.
What We’ve Learned
The authors’ tireless work and steady f low of ideas, commentary and insights over the last year have given us new appreciation for longstanding problems in U.S. education data, as well as for progress made over the past decade and the opportunities and challenges that lie ahead. We’ve also spoken with a number of people — administrators, teachers, parents, policymakers, analysts — who have first-hand experiences with education data. This mini-tutorial has underscored and amplified both the important advances that America has recently made on the education data front and the sizable problems that remain. Let us share our ten key takeaways:
First, America has made significant gains in data collection and use — and a small army of organizations is pressing for further gains. We hope that readers come to share our appreciation for the significant progress that the country has recently made in education data collection and use. The much-criticized No Child Left Behind Act (NCLB) has in fact led to important strides in the quantity, timeliness and potential uses of pupil (and school, subgroup, district, and state) achievement data. This added transparency has raised the level of public awareness and debate about school performance in general and achievement gaps in particular. According to a veteran teacher in an urban school to whom we spoke, “NCLB was a wakeup call for our state. It forced us to recognize and spotlight the achievement gap in our state, the largest gap in the nation.” Nor is NCLB the only force driving improvement in this sphere. Emerging technologies are changing how such information is collected and used by making data entry, correction, analysis and dissemination far easier than before. States that wish to can now look at their data from multiple perspectives
A Byte at the Apple
xiv xv
Foreword
time.” These data would allow one to examine trends, compare subgroups, and investigate the reasons for progress, or lack thereof, with the aim of mounting instructional improvements or institutional interventions. And the kinds of “value-added” analysis that become possible with multi-year data on student achievement are far more precise (and fairer) gauges of school (and teacher) effectiveness than the year-end snapshots. Yet even as NCES undertakes more and better longitudinal studies, and despite heroic efforts by the DQC, too many states still lack longitudinal databases that deal with student achievement. One obstacle is nervousness about using “unique student identifiers” (which allow records from different years to be connected without names being revealed), compounded by the technical challenges of “tracking” individuals over time.
Fourth, educators crave — and deserve — more formative data. In our conversations with principals and superintendents, many voiced the view that NCLB and state-level standards-based reform efforts have led to “huge emphasis” on summative data, disproportionate to the role that such information can play in improving instruction. As one superintendent argued, “if you’re ever going to change the culture of schools, you have to improve and use formative assessment information.” Swift “formative” feedback loops provide practitioners with information that enables them to solve problems before these are compounded. Yet the capacity to develop and use effective such assessments remains underdeveloped in many places, in part because such systems are relatively costly and require concomitant investment in professional development. These are investments worth making, though, as we begin to see examples, from Virginia to Connecticut and beyond, of schools and districts making regular and savvy use of data to improve their practice.
Fifth, we need better means of investigating the sources of school effectiveness. Educational progress depends on not only tracking the performance of students and schools but also understanding what drives achievement at the several levels (individual, classroom, school, district, and state) that matter most. As an urban superintendent summed it up, the primary question is, “what variables affect student growth?” Some jurisdictions are using improved data systems, with variables measuring characteristics of the school environment, to probe the factors that produce educational results. As a
Second, despite the improvements, today’s education data are far from adequate. Many of America’s education data systems remain archaic. They are exceedingly slow and frequently non-comparable from place to place. For example, pre-K information systems typically don’t “speak” to the K-12 systems, which in turn don’t “speak” to the higher education systems. Some important information (e.g., the cost of teacher benefits) isn’t even systematically gathered. Seemingly obvious questions (e.g., where does the money come from and how is it spent) are all but unanswerable. Key definitions (e.g., dropout) remain unsettled. And because most of the data systems are institution- rather than student-based, they’re ill-equipped to “follow” individuals who move from school to school or “graze” their way through college on multiple campuses. Nor are systems based on traditional institutions well-suited to such innovations as charter schools, “virtual” learning, proprietary colleges and part-time students (or faculty). Amid the boatloads of data that do exist, moreover, identifying useful information — especially about “what works” — sometimes resembles seeking needles in really big haystacks. That kind of analysis typically requires joining data of more than one sort, a task that is often painfully difficult. A common problem is the misalignment between “administrative” data (meaning those generated in the course of a school’s daily affairs, such as attendance, fiscal information, and test results under state accountability systems) and “survey” data (meaning those collected outside the course of a school’s daily affairs, such as test results generated by National Assessment of Educational Progress or Programme for International Student Assessment or teacher data collected by the Schools and Staffing Survey). Without careful planning, administrative and survey data cannot be mapped to each other, limiting the analyses that can be performed on each set of them. Meanwhile, privacy concerns have given rise to restrictions on data gathering and use, constraints that, however well-intended, are yet now out of whack with reality and arguably do as much harm as good to the conduct of American education.
Third, we need more longitudinal data and value-added analyses. While NCLB and most state-level accountability systems focus on snapshots of student achievement, typically at year’s end, what educators crave, in the words of one observer, are “[data] that tell us about individual student achievement over
A Byte at the Apple
xvi xvii
Foreword
prepared, how do they fare there, and how does any of that tie back to their experiences in the K-12 system? What jobs do graduates take — and can we discern how these are shaped by their K-12 and postsecondary experiences? Analysts and policymakers don’t need names, but they do need the capacity to link aggregate information about students with data about their subsequent educational and work lives.
Eighth, academic achievement isn’t the whole story. The focus of NCLB and other accountability systems is, of course, on pupil performance — what one might call “the bottom line” in education. Yet that single-minded focus may lead us to overlook innumerable measures of how a school or district is functioning: how well it is keeping the lights on and the buses running, how safe its hallways and classrooms are, or how knowledgeably and efficiently it is hiring teachers for its classrooms. In several urban districts, analysis by the New Teacher Project showed that inefficient human resources processes were driving away many of the best candidates before they could even be employed. To spot, much less fix, such crucial management breakdowns, schools need “measurement for performance” as well as “measurement of performance.” This becomes possible if educators adapt such corporate management tools as “balanced scorecards” and customer satisfaction surveys. Absent such information, school and district executives are struggling in the dark.
Ninth, data are only useful when people know how to use them. Some schools and districts have more and better data than they do practiced and eager users. A common concern was voiced by a district leader: “The majority of our schools do not have a data specialist. If schools are evaluated on data, then schools need people who are responsible for making sense of that data.” It is clear that a critical corollary of having data is developing teachers and administrators who are adept at analyzing and applying them.
Tenth, and finally, parents need information, too. Today’s parents may have access to ample information about their child’s school, but too few know how their own daughters and sons are doing there, what to do about problem areas, how to compare their school to others nearby, and what they can do at home to help. As one principal put it, “these parents
result, said one district leader, “we can then begin to think about relationships and correlation.” Data can be mined to investigate (for example) the relationship between changes in curricula and student performance by subgroup, or to examine whether different investments in professional development or common planning time yield changes in pupil achievement. Some jurisdictions have begun to develop data-driven management systems that seek to boost achievement by “distilling the myriad of performance indicators the school system generates down to key leverage points.” The Montgomery County, Maryland, M-Stat system and the Western States Benchmarking Consortium are two such examples. In Montgomery County, leaders have found seven “leverage points,” including reading skills in K-2, fifth grade advanced math, and Advanced Placement participation and performance — areas that now receive additional attention. These sorts of analyses should be common practice, but today they’re exceptional.
Sixth, we need, in particular, to link student and teacher data. A critical data gap in most jurisdictions is the relationship between pupil performance and individual teachers. Creating such a link will allow comparisons of how students fare in different classrooms and enable us to pinpoint what (and who) is making the difference. Yet such linkages also demand protections against misuse and misinterpretation, in order to create school cultures that are comfortable with, even crave, comparisons of how students fare in different classrooms. As one long-time education advocate observed, “I am conceptually very interested in teacher-level data, but also very nervous about whether that data will be good or fair.” Fears that such information will be used in a punitive fashion, the belief that teachers should not be held accountable for deficiencies that students bring to class, and a general resistance to transparency all feed the reluctance to explore teacher effectiveness via data on student learning.
Seventh, we need to link K-12 and other databases. To know for sure whether children are getting the education they need to succeed, we must start with better information about what they do before and after their K-12 schooling. What sort of preschools, if any, did youngsters attend, and what did they learn there? Who gets in to college, how well are they

A Byte at the Apple
xviii xix
Foreword
multiple fronts; Christina Hentges guided this volume from final draft through publication; interns Natasha Brooks and Molly Kennedy provided frequent help; and Michael Petrilli provided guidance throughout. Copy editor Quentin Suffren ensured that the sentences parse and Edward Alton’s cover design and layout work helped enliven our words. We are grateful to everyone above and many others for their support, encouragement, and hard work.
need reports that are easy to read and easy to understand. The information needs to be prescriptive. Right now parents and guardians aren’t getting suggestions on specifically how to help.” Whether one’s child has mastered this week’s lessons or this year’s curriculum is only the start. Parents also need data about college preparation, enrollment and retention, and career readiness, presented in understandable ways. Education data have innumerable clients and potential clients, as well as suppliers, aggregators, and analysts. One goal of this volume is to provide a clearer perspective on that sprawling and diverse population as well as the condition of the data themselves. Though the education world is awash in clients, interest groups, and reformers, the cause of better education data has far too few advocates. It’s not a high profile issue, and many people settle for today’s inadequate information because they can’t quite picture the ways in which tomorrow could be different. The editors of this volume want to change that situation — to assist readers to visualize how our education data could and should be better, and the good that such improvement would do for America and its children.
Acknowledgments
This volume would not have been possible without the contributions of many individuals. The authors themselves deserve tremendous credit for producing terrific chapters and enduring Fordham’s exacting editing and questioning. We are deeply appreciative of their hard work. The Robertson Foundation deserves special thanks for supporting this project. Foundation staffer Rob Luther, in particular, has steadfastly shared our vision while simultaneously provoking our best thinking. This undertaking benefited from an initial brainstorming meeting and subsequent feedback session where early chapter drafts were aired. We are grateful to all of those who participated: Jack Buckley, Kevin Carey, Rob Curtin, David DeSchryver, Robert Gordon, Kathy Gosa, Julie Greenberg, Larry Fruth, Dorothy Hardin, Jim Hirsch, Bill Jackson, William Moloney, Deborah Newby, Jay Pfeiffer, Amy Rickerson, Ross Santy, Mark Schneider, Jeff Sellers, Christopher B. Swanson, and Hugh Walkup. The Fordham Institute’s sister organization, the Thomas B. Fordham Foundation, also provided financial support to this project; research associate Coby Loup spent long hours behind the scenes and offered fresh thinking on
1
Introduction: The Education Data Landscape
By Paul Manna
Paul Manna is an assistant professor in the Department of
Government at the College of William & Mary.
These days it seems nearly everyone in education is, or at least claims to be, guided by data. Elected representatives and agency officials seek evidence on the relationship between policy, school performance, and student success. Parents select houses based
in part on school quality in a particular neighborhood or town. Private foundations aim to support research that will reveal “what works” in education. Business leaders want to know that schools are preparing students for the workforce. Even vocal critics of test-based accountability are not necessarily anti-data. These critics suggest evaluating student, teacher, or school performance on a range of measures, rather than focusing primarily on test scores. Clearly, the No Child Left Behind Act (NCLB) has energized discussions of data, but other forces have contributed, too. The impulse for data-driven decision making is not unique to education, nor to the United States. Globally, governments have initiated management reforms to evaluate public programs based on performance.
1 It is difficult to enter a government office today
without being surveyed about one’s experience either on the spot or in a follow-up mailing.
A Byte at the Apple
2 3
Introduction: The Education Data Landscape
education data potentially available, the sources of those data, and their key uses and users.
Forms and Types Education data come in many forms that may make them useful for some purposes but not others. First, they can provide information about many different units of analysis. These could include, among others, students, parents, teachers, principals, classrooms, schools, school districts, states, or nations. An advantage of data sets with finer units of analysis (e.g., student- or teacher-level versus school-level) is that one can often aggregate more granular measures to reveal information about larger units. In other words, a government agency may have data from a specific school district with students as the unit of analysis. From that source one could create school-level and grade-level measures as long as each student record came with a school and grade identifier. Second, education data sets sometimes contain information about entire populations and other times they represent smaller samples. With the latter,
Being data-driven can mean different things to different people. Here it means making choices about what is best for students and schools based on hard (frequently quantitative) evidence, rather than anecdotes, impressionistic feelings, or prior commitments. Making those judgments begs an obvious question: Do we have the education data we need? And if not, why not? The four sections in this chapter begin a discussion about those questions, which subsequent chapters elaborate. The first section introduces key conceptual building blocks. The second identifies problems on the current education data landscape. The third section offers reasons for those problems. The fourth concludes by describing some persistent challenges and some thoughts on how to prioritize the nation’s education data needs. Before continuing, consider one useful definitional point at the outset. In colloquial terms, authors and speakers sometimes use “data” and “statistics” interchangeably even though these words represent different concepts. Data refer to pieces of information that one could gather from the world, while statistics are any quantities that one could compute from those data. For example, each year students generate thousands of data points when they take state tests in reading and math. From their individual responses one can generate a variety of statistics including test averages and standard deviations for particular classrooms, schools, districts, and states. Researchers may also merge test data with data about school characteristics, such as the number of certified teachers, dollars spent per pupil, and number of violent incidents in the school, to calculate correlations and regression coefficients. Those statistics can illustrate whether certain variables are associated with each other. This seemingly arcane technical distinction between data and statistics is important. The quality of education data is directly related to the quality of the education statistics that parents, teachers, principals, policymakers and others may calculate and then use as they make decisions. If our data are inaccurate, filled with noise, or actually measure something other than what we thought they were measuring, then the statistics we compute and the inferences we draw will not be useful, and may even do harm.
1. Dimensions of Education Data
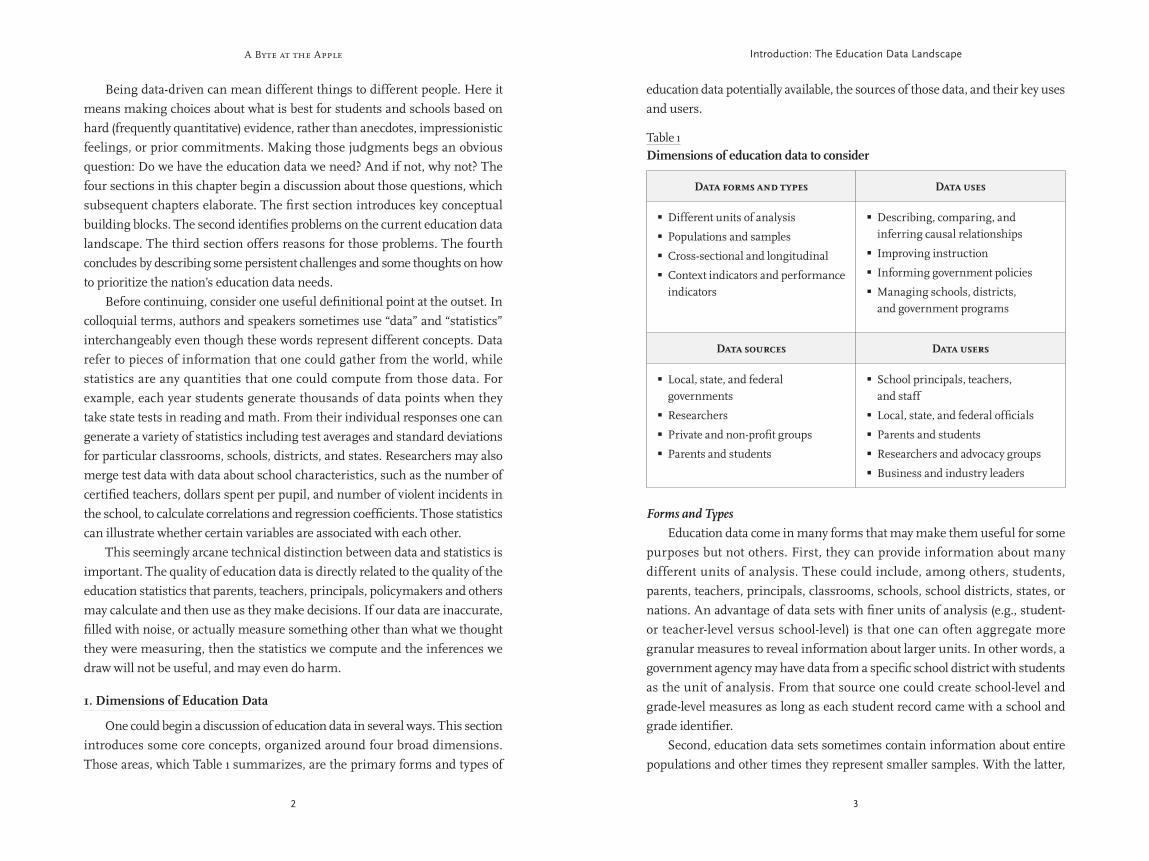
One could begin a discussion of education data in several ways. This section introduces some core concepts, organized around four broad dimensions. Those areas, which Table 1 summarizes, are the primary forms and types of
Table 1Dimensions of education data to consider
Data forms and types Data uses
Different units of analysis �
Populations and samples �
Cross-sectional and longitudinal �
Context indicators and performance �indicators
Describing, comparing, and �inferring causal relationships
Improving instruction �
Informing government policies �
Managing schools, districts, �and government programs
Data sources Data users
Local, state, and federal �governments
Researchers �
Private and non-profit groups �
Parents and students �
School principals, teachers, �and staff
Local, state, and federal officials �
Parents and students �
Researchers and advocacy groups �
Business and industry leaders �
A Byte at the Apple
4 5
Introduction: The Education Data Landscape
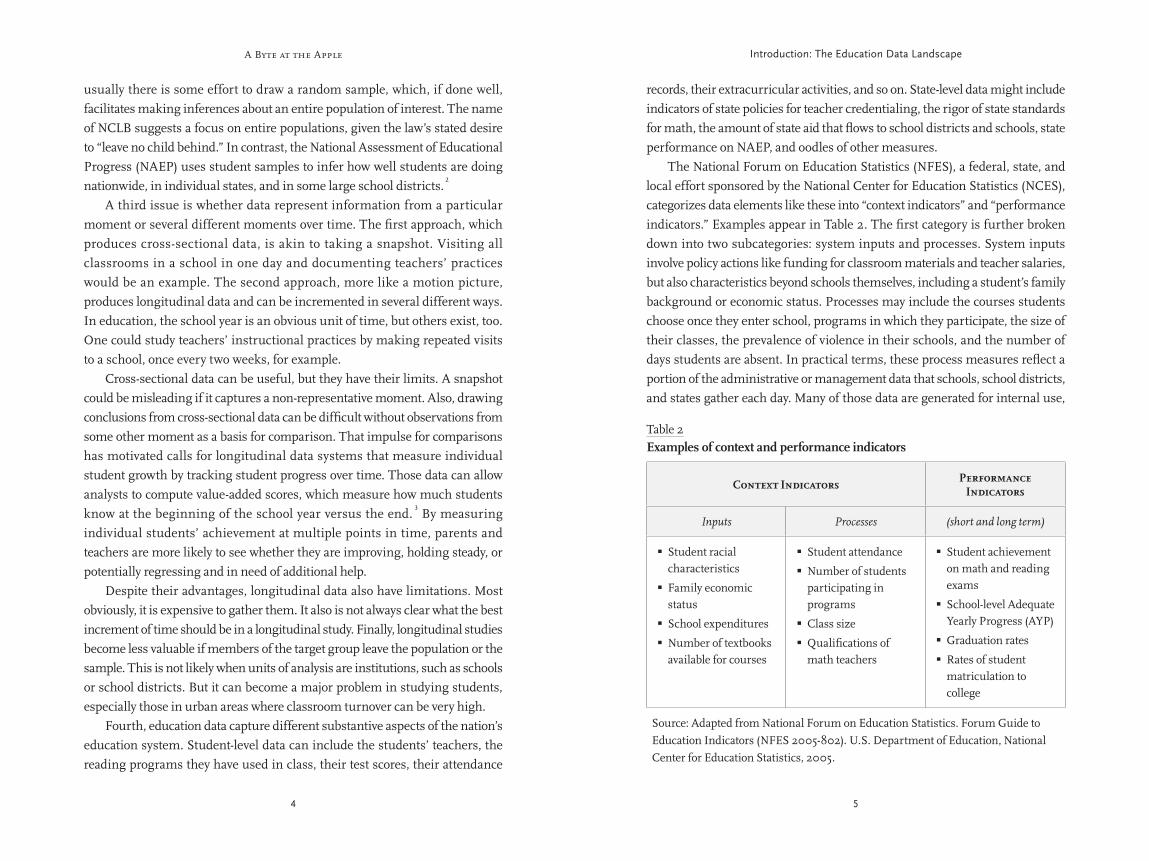
records, their extracurricular activities, and so on. State-level data might include indicators of state policies for teacher credentialing, the rigor of state standards for math, the amount of state aid that flows to school districts and schools, state performance on NAEP, and oodles of other measures. The National Forum on Education Statistics (NFES), a federal, state, and local effort sponsored by the National Center for Education Statistics (NCES), categorizes data elements like these into “context indicators” and “performance indicators.” Examples appear in Table 2. The first category is further broken down into two subcategories: system inputs and processes. System inputs involve policy actions like funding for classroom materials and teacher salaries, but also characteristics beyond schools themselves, including a student’s family background or economic status. Processes may include the courses students choose once they enter school, programs in which they participate, the size of their classes, the prevalence of violence in their schools, and the number of days students are absent. In practical terms, these process measures reflect a portion of the administrative or management data that schools, school districts, and states gather each day. Many of those data are generated for internal use,
usually there is some effort to draw a random sample, which, if done well, facilitates making inferences about an entire population of interest. The name of NCLB suggests a focus on entire populations, given the law’s stated desire to “leave no child behind.” In contrast, the National Assessment of Educational Progress (NAEP) uses student samples to infer how well students are doing nationwide, in individual states, and in some large school districts.
2
A third issue is whether data represent information from a particular moment or several different moments over time. The first approach, which produces cross-sectional data, is akin to taking a snapshot. Visiting all classrooms in a school in one day and documenting teachers’ practices would be an example. The second approach, more like a motion picture, produces longitudinal data and can be incremented in several different ways. In education, the school year is an obvious unit of time, but others exist, too. One could study teachers’ instructional practices by making repeated visits to a school, once every two weeks, for example. Cross-sectional data can be useful, but they have their limits. A snapshot could be misleading if it captures a non-representative moment. Also, drawing conclusions from cross-sectional data can be difficult without observations from some other moment as a basis for comparison. That impulse for comparisons has motivated calls for longitudinal data systems that measure individual student growth by tracking student progress over time. Those data can allow analysts to compute value-added scores, which measure how much students know at the beginning of the school year versus the end.
3 By measuring
individual students’ achievement at multiple points in time, parents and teachers are more likely to see whether they are improving, holding steady, or potentially regressing and in need of additional help. Despite their advantages, longitudinal data also have limitations. Most obviously, it is expensive to gather them. It also is not always clear what the best increment of time should be in a longitudinal study. Finally, longitudinal studies become less valuable if members of the target group leave the population or the sample. This is not likely when units of analysis are institutions, such as schools or school districts. But it can become a major problem in studying students, especially those in urban areas where classroom turnover can be very high. Fourth, education data capture different substantive aspects of the nation’s education system. Student-level data can include the students’ teachers, the reading programs they have used in class, their test scores, their attendance
Table 2Examples of context and performance indicators
Context IndicatorsPerformance
Indicators
Inputs Processes (short and long term)
Student racial �characteristics
Family economic �status
School expenditures �
Number of textbooks �available for courses
Student attendance �
Number of students �participating in programs
Class size �
Qualifications of �math teachers
Student achievement �on math and reading exams
School-level Adequate �Yearly Progress (AYP)
Graduation rates �
Rates of student �matriculation to college
Source: Adapted from National Forum on Education Statistics. Forum Guide to Education Indicators (NFES 2005-802). U.S. Department of Education, National Center for Education Statistics, 2005.
A Byte at the Apple
6 7
Introduction: The Education Data Landscape
including downloadable data sets, individual school report cards, published reports, and internal documents. Professional researchers are a second source of education data. These individuals may work in universities, independent firms such as RAND or Mathematica, and research and advocacy organizations such as the Education Trust. Sometimes they generate original data, though often they analyze data from government sources. Governments and private foundations spend millions of dollars each year supporting these data collection efforts. Some of their data are published for all to see, while other data, especially those that academics produce, remain proprietary, sometimes for several years until scholars publish articles or books using what they have gathered. Private sector and other nonprofit sector groups represent a third source of education data, again both as original producers and reporters of data that others generate. As part of their marketing campaigns, for example, private schools often report data showing their students’ test scores or their teachers’ qualifications. One popular education data source is the magazine US News and World Report, whose annual rankings of colleges and university programs are essentially considered required reading for college-bound students and university administrators concerned about their institutions’ reputations. Similarly, the College Board and ACT release annual reports detailing the participation and success of students taking college entrance exams. Real estate agents represent another group — important, but often overlooked — that can steer prospective homebuyers to data about neighborhood schools. Comprehensive websites, such as Greatschools.net, are also emerging that make school-level information easily available to anyone. Two final data sources are students and parents. The primary basis of a school’s Adequate Yearly Progress (AYP) status, after all, is annual student test results. Students and their parents sometimes provide systematic data to school leaders in course evaluations, school satisfaction surveys, and the general process of enrollment in school. (Macke Raymond’s chapter in this volume explores some innovative ways that these data might be gathered, maintained, and used.) Parents and students also possess anecdotal data about individual teachers and schools. That information, or “word on the street” from key parents in a neighborhood, can be incredibly valuable to other parents and students when families discuss which teachers or classes to take and which to avoid.
6
and help school leaders monitor the heartbeat of a school or district. They may also help these leaders fulfill reporting requirements that accompany state and federal education dollars.
4
In the past, those concerned with student achievement often complained that the United States had overemphasized process indicators and spent too few resources examining performance data. Before the rise of the standards and accountability movement in education, managers of education programs would spend much time documenting how much money a program spent and how many students participated, but less effort on whether students learned anything as a result. During the last two decades, and since 2000 in particular, student performance has received much more attention and more data to track it have become available.
Sources Education data come from several sources. First, the largest producers of education data are governments themselves. National governments around the world publish statistics on the state of education in their respective countries. In the United States, in fact, the federal government’s initial major role in education, other than administering land grants under the Morrill Act, was to gather and report data on education in the nation’s states and territories.
5
Within the U.S. Department of Education, the NCES and the Education Data Exchange Network (EDEN) carry on that tradition today, but other federal agencies, such as the Census Bureau, the Bureau of Labor Statistics, and the Department of Health and Human Services also gather and generate statistics relevant to education. These federal data represent the small tip of a large iceberg, though. Many of the data appearing in NCES reports are from lower levels of government. The federal government collates and aggregates those numbers into regular reports, such as the annual Digest of Education Statistics, but most data in those publications originate from some other source. States, school districts, and ultimately schools and teachers in individual classrooms produce the vast majority of education data that governments report, including how much districts spend on teacher salaries; the percentage of students attending Ms. Smith’s eighth-grade algebra class each day; the graduation rates at City High School; the number of students benefiting from Title I funding; or the proportion of K-12 education revenues that come from state sources. Those data are gathered and collected in several different media
A Byte at the Apple
8 9
Introduction: The Education Data Landscape
A second overall use of education data is to improve instruction. At the micro level, teachers constantly use data in this way. A very common tool here are grade and attendance books, which help teachers to see the trajectory of students’ performance across a marking period or semester. Short quizzes and exercises in advance of unit tests or final projects enable teachers to see which concepts are the most difficult for the entire class or individual students. Those intermediate quizzes and exercises are sometimes called “formative assessments,” while those coming at the end of a unit or major topic can be called “summative assessments.” Using data from both, teachers can make judgments about which instructional approaches might be working best, and which students could benefit most from different teaching methods or assignments. In recent years, individual schools have become more strategic in how they use formative and summative assessments to track students’ progress and improve instruction. Especially in schools with multiple teachers teaching multiple sections of the same class (e.g., three third-grade sections or four sections of advanced algebra), the use of formative and summative assessments has become increasingly systematic. In other words, schools can have teachers administer the same or similar assessments in order to obtain consistent measures of student progress. Those data can allow teachers and school administrators to determine which instructional strategies, class materials, and teachers seem to be most effective, and which children need the most additional help. When assessments are analyzed item-by-item or concept-by-concept, teachers may also begin to realize that they all are having similar difficulties teaching certain topics to certain groups of students. With those problems identified, schools can better target their professional development activities. Third, education data can inform specific policies and practices that governments and schools develop. In legislatures and school board rooms, public officials use education data as they set funding priorities and design specific programs. Sometimes education laws, such as Title I of NCLB, contain formulas that determine how money will be allocated. Data on key conditions in states and districts, such as the level of poverty and number of students, will largely determine the level of funding that these places receive. Clearly, the use of data and accompanying statistics are not the only or even necessarily the key factor in policy deliberations. Politics and ideology also assert influence, but dispassionate examinations of data can enter the
Uses and Users Many different people use education data for numerous purposes. A first broad use, which carries over to the other uses described shortly, simply is to describe, compare, and infer causal relationships between measures. How many fourth graders attend New York City Public Schools? How much money did Wisconsin spend on facilities upgrades in rural school districts? Even these seemingly straightforward questions sometimes elicit conflicting answers. The different producers of education data sometimes disagree over the appropriate way to measure a particular indicator. For example, NCLB enables parents to transfer their children from schools that their state describes as “persistently dangerous.” Given how states define that term, only 46 public schools in the nation received that label for the 2006 – 07 academic year. No doubt more schools would have made that list if parents, students, or school security officials had been surveyed to determine whether schools are “persistently dangerous.”
7
Descriptions often become especially powerful when they compare particular groups of students, teachers, schools, states, and even nations. Today, for instance, education data frequently show that white students outperform black and Hispanic students on standardized tests; that students from Asian and several European nations tend to take more rigorous mathematics and science courses than American students; and that the nation’s most disadvantaged students often have the least experienced teachers when compared with their more advantaged peers. Analyzing education data using more advanced statistical techniques, beyond simple descriptions, can enable analysts to infer causal relationships between different variables. Data show, for example, that disadvantaged students tend to have teachers with less experience and who have less training in their subjects. Does that matter? Research strongly suggests it does. When provided with experienced and knowledgeable teachers, even students who otherwise struggle can make large achievement gains.
8 Do private school
vouchers work? Here the answer depends on what one means by “work.” Much agreement exists that parents whose children use vouchers express higher levels of satisfaction with schools than parents who do not choose their children’s schools. But efforts to pinpoint gains in student achievement due to vouchers have produced hotter debates, with some sources reporting clear gains and others seeing no statistically discernible effects.
9
A Byte at the Apple
10 11
Introduction: The Education Data Landscape
home of the nation’s oldest publicly-funded school voucher program, hundreds of parents rely on data from the Milwaukee Policy Forum, a local think tank. Each year, the Forum produces a publication for parents that systematically describes basic characteristics of each Milwaukee private school participating in the voucher program.
11
Other people may be more interested in aggregate data that show the performance of individual schools, school systems, states, and the nation as a whole. Elected officials, policymakers in legislatures or government agencies, and analysts at universities and think tanks have already been mentioned here. Other individuals meriting attention are local, state, and national business leaders. Among others, groups such as Achieve, a network of governors and business leaders, and the Business Roundtable, made up of CEOs from the nation’s largest companies, have become increasingly interested in educational quality, and crave hard data to reveal how the nation is performing compared to its economic rivals.
2. Potential Problems with the Data We Have
Being data-driven requires, above all, good data. Unfortunately, as seasoned data users will attest, problems frequently exist with education data. Those problems fall into two broad categories: availability and quality. Reasons why they exist appear in the next section. For now, this section simply describes those problems in further detail.
Data Availability For most of American history, little information was available about students, schools, and school systems. Schools were classic “coping” organizations, to use Wilson’s term,
12 in which school leaders, parents, and policymakers — the
proverbial overseers of public schools — possessed little systematic information on daily classroom activities and did not know how much students were learning. As the cliché goes, once the teacher closed the door, it was anyone’s guess about what was happening inside. Stricter accountability for student and school performance has changed that in many communities, and, some would argue, has pushed things to the opposite extreme. Schools in some places now resemble Wilson’s “production” organizations, where scripted lesson plans and evidence of their completion dictate every minute of the day, and students are assessed at regular intervals.
conversation nevertheless. 10 Today there is even a growing interest in using
large scale policy experiments to evaluate the effectiveness of programs or instructional techniques. Does that reading program work? And if so how much of a benefit does it provide to students, compared with others who were not exposed to the program? Policymakers seeking to devote resources to “what works” in education are particularly interested answering those questions. Fourth, public officials at all levels gather and report data to help them manage schools, school systems, and government programs. Although descriptive data on achievement gaps may grab the education headlines, most descriptive data are used for these more mundane, yet still important, purposes. As noted earlier, local officials generate many process indicators that track the regular operations of schools and entire districts, including data such as student and teacher attendance, the size of the student body, fuel consumption of a district’s bus fleet, and weekly supply orders for school cafeterias. Other management data capture the flow of funds over time into and out of particular programs or activities. The high school debate team might spend $1,000 for weekend tournament travel, and later that month receive a $100 donation from a local business. On a larger scale, hundreds of thousands of dollars in federal Title I money may support a schoolwide Title I program. District budget offices monitor those finances and generate regular reports that help administrators assess the overall financial situation of their schools. Eventually, many of these management data are collated into reports that local districts assemble and send to state authorities for oversight purposes. Once in state capitals, some of those reports are collated again and then forwarded to various federal agencies for the same purpose. Many of these management measures are invisible to the casual observer, and even to education researchers or politicians who might otherwise follow education rather closely. As this entire section implies, the users of education data can be as diverse as their uses. Parents, like teachers and other school staff, examine data that describe their children’s performance, and even compare it with the performance of other children by examining percentile scores from state tests or college entrance exams. In choosing where to live or send their children to school, parents also can consult individual school report cards or data collections that independent groups maintain to help them make wise choices about public and private schools in a community. For example, in Milwaukee, Wisconsin,
A Byte at the Apple
12 13
Introduction: The Education Data Landscape
teachers and students, and teachers discuss results with a data coach, usually a colleague from their school. Early reviews from teachers are positive, and the assessments, known as FAST-R, which stands for Formative Assessments of Student Thinking in Reading, are undergoing a formal evaluation.
16
The NCLB requirement that schools and school districts make AYP provides another example of the timing problem. Ideally, schools not making progress based on last year’s performance would learn that fact well before the next school year begins. That way, schools and districts could better implement the remedies that NCLB requires when schools persistently fail to achieve AYP goals. Those remedies can also require parental involvement, as in schools where students qualify for NCLB-sponsored school choice, which allows a student to transfer to another public school, or in schools where students are eligible for free tutoring, called “supplemental educational services.” Parents learning of these options at the last minute as a new school year begins may be reluctant to exercise them. It could be disruptive to move their child to another school or to rearrange child care providers to accommodate a tutoring schedule. Unfortunately, most states publish their final AYP data during late summer or later.
17
Data Quality Even when data are available, they can be of questionable quality. Discussions of quality center on two main issues. First, some concepts are simply difficult to measure with much accuracy because they are multidimensional or complex. Getting good data on a student’s “innate ability” for particular subjects or even gathering measures that properly identify students with certain learning disabilities is challenging.
18 Researchers or analysts sometimes say things like “We
don’t have quality measures of X,” by which they often mean that certain concepts are simply hard to capture. Those quality problems are difficult to remedy. Second, quality may suffer if limited resources are available for data collection or data are not carefully verified for accuracy. In this instance, the concepts or topics may not be intrinsically complicated to measure, such as how many students took algebra classes last year or the professional credentials of a district’s teachers. But data still may be poor in quality if the crucial tasks of data entry and maintenance of data systems or virtual data warehouses receive little support. Data may also suffer from problems of validity and reliability.
19 “Validity”
means that an indicator actually measures what we think it measures. A
A lack of systematic data in education has had important consequences. Where data are nonexistent, decisions about instruction emerge from impressions or anecdotes about what works, or worse, folk wisdom and prior commitments to teaching strategies or ideologies that have never undergone rigorous examination. Limited or no data on student performance often left child advocates with little concrete evidence of the harm caused by persistent and glaring educational inequities. For example, in its famous school funding decision, San Antonio Independent School District v. Rodriguez (1973), the U.S. Supreme Court argued that attorneys representing local students were unable to show that funding differences across districts had an impact on student performance. Among other things, the emergence of testing data has reenergized advocates for disadvantaged children, some of whom are now using test scores to document what the lawyers in 1973 could not show.
13
Limited data availability can also hamper teachers’ efforts to design instruction to help their students master crucial content and skills. A diligent fifth-grade teacher studying the end-of-course math results of last year’s fourth graders will have some idea about each student’s preparation. But the teacher might prefer item-by-item or concept-by-concept breakdowns of student scores to help him target his instruction where students are weakest. Research has shown great value in looking behind overall scores to investigate these details. And some school districts have designed reporting systems to provide these data to teachers.
14
Timing is another dimension of the availability problem. Even when education data and statistics exist, sometimes they are unavailable when parents, teachers, and principals need them most. That can neuter their impact and sow frustration, given the huge effort required of teachers and school support staff to gather data in the first place. One reason classroom teachers sometimes complain about state-mandated testing, for example, is that students typically take tests in the spring, too late for their current teachers to use the results. Testing that provided these teachers information in real time would be more useful for nipping potential problems in the bud. As one Washington, D.C. teacher observed, “You should really give [tests] every five weeks, starting at the beginning of the year…That way, you can adapt right away, instead of saying at the end of the year: ‘Oh, I’m sorry you didn’t make proficient.’”
15 Some
schools in Boston have begun experimenting with more regular assessments for that purpose. These tests are systematic but carry no consequences for
A Byte at the Apple
14 15
Introduction: The Education Data Landscape
into individual schools. This occurs, for instance, when districts use a technique called salary cost averaging. Even though teachers in a school district can earn different salaries based on their level of experience and other factors, for accounting purposes, districts sometimes assume that all teachers in a school earn the same amount. As Hill and Roza state, “Urban districts calculate school budgets using average teacher costs. Thus, in a district where teacher salaries range from $25,000 to $65,000 annually, all teachers are assumed to earn some average amount, say, $45,000.”
24 Salary cost averaging
can foster cross-school funding inequities that are invisible to casual observers of district budgets.
3. Reasons Why Education Data Problems Exist
Improving the availability and quality of education data will require overcoming several technical, institutional, human, and political challenges. Table 3 summarizes four main interrelated obstacles that affect the United States as it struggles to produce better education data.
Capacity Limits Capacity limits are an initial reason why problems exist with education data. One should interpret the word “capacity” here in a broad sense. It includes money, but also human and organizational resources, such as the prevalence of well-trained people working in well-functioning bureaucracies, and the availability of modern computers and software systems to manage data. Often capacity is merely defined in financial terms, which is too limiting as the following examples illustrate.
school’s high score for teacher quality should mean that the school does, indeed, possess high quality teachers. The score from a math exam written in Russian but administered to an English speaker would likely not be a valid measure of the person’s math ability. Rather, it would really be demonstrating that the person does not understand the Russian language. “Reliability” refers to the ability of a measurement technique to perform consistently during repeated uses. In some states, for example, tests used to gauge the proficiency of a school or district’s students in reading and math are not reliable indicators of performance over time. That is because state policymakers have sometimes changed the cut scores needed for students to score at proficient levels, or they have kept the same cut scores but altered the difficulty level of the questions appearing on the test. Therefore, the state’s test results would not be reliable measures of performance from one year to the next. Variation in state tests across years and across states is one reason why the federal NAEP exam provides the most reliable measure of student achievement across time and across state lines.
20
At the classroom level, the proliferation of informal district- and school-designed diagnostics to gauge student progress should also raise these validity and reliability concerns. As one RAND report has concluded, policymakers “would benefit from a better understanding of the reliability and validity of progress test results, which are a popular yet relatively under-researched type of outcome data in districts across the country. Educators appear to be making fairly important decisions based on these data, yet we know very little about the quality of these tests, particularly those developed in-house by school districts.”
21
Education finance is another area where data quality complicates analysis. A common measure that public officials and researchers consider is per-pupil spending. At the school level, at least, there is much debate over whether more money produces better results. Based on examinations of case studies, though, researchers know that how schools and school districts use money can matter for the results they produce. But unless the way dollars are spent is measured consistently across schools, it is difficult to deepen our understanding of how money matters.
22
Further complicating the issue is that reported budget statistics obscure the school-level realities. Roza and Hill’s work on within-district spending inequities is instructive here.
23 Because of how school district offices calculate
and report district budgets, their figures can misstate the resources flowing
Table 3Key sources of the nation’s education data problems
Limited human, organizational, and financial capacity �
Fragmented governance, both vertically (e.g., many levels of government) and �horizontally (e.g., many different programs administered at each level)
Diverse preferences and incentives of data users and data producers �
Political disagreements, incentives, and trade-offs �
A Byte at the Apple
16 17
Introduction: The Education Data Landscape
pass more laws that create more reporting requirements for schools and state agencies. For instance, states have done an inconsistent job of monitoring and reporting performance data on NCLB supplemental services providers. It is also difficult for outsiders using state data to determine precisely how many schools are at different levels of improvement status. How many are offering public school choice or supplemental services? Of those that have entered corrective action or restructuring, what precisely have they done? Those latter two points are particularly important because NCLB allows many options at the corrective action and restructuring phases, and in many cases those labels imply more change than is actually occurring.
27 Knowing what schools have done is crucial
in order to tie policy interventions to changes in student achievement. When test scores exist, but data on school policy changes do not, then one cannot draw larger lessons about which interventions are most promising. Complicating matters is that state agency capacity is not the only factor creating problems with education data. The experiences of some states have raised questions about the nation’s more general capacity to accurately administer and score the millions of tests that students take each year. States frequently rely upon private contractors to score and compile results. Debates are now underway about whether the nation’s testing industry itself possesses the capacity to meet the needs of its state clients.
28
Facing these and other capacity challenges becomes even more difficult when local or state expectations change. It is neither cheap nor easy to develop a data collection system, train individuals in the field to use it, and then communicate adjustments along the way. Difficulties can snowball if current systems must adapt, rather than simply be built anew. State and local education agencies are presently experiencing such a transition challenge as they try to meet new data collection requirements of the Individuals with Disabilities Education Act (IDEA).
29 The 2004 reauthorization of IDEA requires performance plans and
reports in 20 different indicator areas. While some indicators represent data that states were already gathering, some do not. And further, the “new methods of analyzing the information have required a thorough overhaul of how states collect, compile, and analyze data on students with disabilities.”
30
Fragmented Governance The fragmented governance of American education is a third factor undermining the quality and availability of education data, a topic that
At the grass-roots level, schools frequently rely upon teachers themselves to collect valuable data, often the management data that monitor the daily pulse of a school. Those responsibilities can burden teachers or even clash directly with their instructional prerogatives. A classic example is the common requirement for teachers to post an attendance sheet outside their classroom doors within 15 minutes of class beginning. The goal of that data collection effort — to develop a timely record of student attendance so school offices can call parents when students miss class — can interfere with instruction during a class’ crucial start-up time. Most teachers would rather focus on building momentum for the day’s lesson than tending to this administrative task. And some, no doubt, fail to record attendance carefully and accurately because they are focusing on instruction. School secretaries, often the front-line workers in the nation’s system of education data collection, face similar pressures to juggle many tasks at once. As one source puts it:
“We want trained data-entry personnel who work in an environment that assists, not
hinders, data entry. When people are doing important work, we want them to concentrate
on the task. We do not expect, for example, the person preparing our tax returns to be eating
lunch or talking on the phone with clients while entering our itemized deductions into a
computer. However, those may be the conditions of a school secretary’s life. And remember,
bad data about a student or school can cause bigger problems than a lost tax refund.” 25
Ironically, some of the lowest-paid and most overworked school staff often perform the critical task of data entry. Everyone interested in data quality should take pause when a secretary’s daily to-do list gives data entry the same priority as scheduling custodians to change light bulbs or answering calls from vendors trying to sell the school drinks for its vending machine. At higher levels of government, state agencies have strained to meet the data demands accompanying the country’s embrace of educational accountability. One recurring problem is errors in the computation and release of state test scores. An example is the disaster that Illinois experienced in calculating scores and AYP results from testing during the 2005 – 06 school year. Students and schools received those scores in March 2007, though they were supposed to have been available well before the 2006 – 07 school year began.
26
A related, but less frequently discussed, capacity problem concerns the overwhelming number of policy variables that states might potentially track. Those variables can accumulate quickly as federal and state policymakers
A Byte at the Apple
18 19
Introduction: The Education Data Landscape
something Wyoming districts previously had not tracked. 33
This example illustrates one specific case of how the construction and method of monitoring different school processes can vary by state. That complicates matters for anyone interested in aggregating and then comparing how different programs unfold. Because not all states use the same definitions and software packages for gathering these management data, it is not surprising that efforts like the new IDEA data rules can take many months, even years, to implement. Fragmentation not only creates complicated data demands for local schools, it also fosters technical complexities. Usually there are not seamless connections between the software packages and databases that schools, districts, and states maintain. This might prevent school leaders from examining relationships between a school’s finances, teaching staff, student performance, and student family characteristics. It may be impossible, or nearly impossible without tremendous effort, to build merged data sets from these different areas of school operations because the different software systems used to manage data in each area cannot communicate. Presently, several groups are hard at work attempting to overcome these software integration problems. For example, the Schools Interoperability Framework Association (SIFA) is an umbrella group containing over 1,400 members — software vendors, school districts, state departments of education, and others — who are addressing the integration issue. The group is developing standards and procedures to facilitate the sharing of education data across different software platforms.
34
Further, the growth in use of individual student identifiers may attenuate the present fragmentation problem.
35 At a very basic level, states will be less
likely to lose track of students who move from one district to another, but identifiers will also allow districts to streamline the administrative tasks associated with incorporating new students from other districts into their data systems. (Problems associated with students moving from state to state will still remain, however.) The identifiers will also create a way to bridge gaps among program silos. In an ideal world, local and state education officials could touch a button and see a student’s complete history of program participation, test scores, teachers in each grade, and disciplinary records. Today, even schools and districts with the most advanced data systems are far from this ideal situation, but the development of identifiers is a step in the right direction for dealing with the horizontal and vertical fragmentation that plagues the system.
36
Kenneth Wong explores more deeply in his chapter. This fragmentation has two dimensions. A vertical dimension exists because the American intergovernmental system has many layers that must somehow work together to share information. One federal government, 50 states, approximately 14,200 school districts, and over 90,000 schools all play some role in producing quality data. A horizontal dimension is present due to the dozens of programs that governments have adopted to address children’s needs. Writers often use the term “silos” to characterize these different programs, which typically operate in school districts as parallel but rarely intersecting administrative systems, creating serious problems for public officials, researchers, and even school administrators themselves interested in analyzing education finance (or other) data. Roza and Hill nicely summarize the silo problem as follows:
Tracking money is a huge challenge for school districts for many reasons: Their revenues
come from many sources (state, local, federal, and philanthropic) at different times. Funders
require separate record-keeping for each program, and their rules about cost accounting differ.
Districts therefore maintain separate accounting systems for funds from different sources, and
information is often kept on separate computer systems, bought and programmed at different
times, so they cannot talk to one another. 31
Such confusion has important consequences. Superintendents struggle to know exactly how much money resides in district coffers. Accounting systems become so complex that very few, if any, individuals truly understand how they work. The vertical dimension involving many layers of government is partially to blame for delays and strained data capacity at the state level. Intergovernmental dynamics contributed to Illinois’s problem with its test scores for 2005 – 06. The state’s data system, which generates results for subgroups of students, required that local districts accurately submit student demographic data. The contractor compiling the results found that demographic information to accompany approximately 11,000 tests was either missing or incorrect.
32
Similarly, the IDEA reforms mentioned earlier have challenged some states and local districts to better coordinate their efforts. For instance, even though Wyoming had a “pretty good infrastructure in place” for data collection, according to the state’s director of special education, state officials needed at least a year to help local districts address the new reporting requirements. In particular, the IDEA data rules call for information on student suspensions,
A Byte at the Apple
20 21
Introduction: The Education Data Landscape
requirements as public schools makes some people oppose publicly-funded voucher programs. Private schools respond that it would fundamentally change the character of their institutions should they become subject to the same regulatory requirements that govern traditional public schools. Even though some private schools publish data about their internal characteristics and student performance as part of their marketing strategies, most would resist government efforts to compel them to do so. A last illustration reveals disagreements that sometimes occur between researchers on one side and school officials, parents, or elected representatives on the other. Specifically, researchers’ desires can clash with laws designed to protect student and family privacy, a topic that Chrys Dougherty addresses in his chapter. Even though researchers typically are not interested in data sets containing personal identifying information such as student names (anonymous identification numbers usually will suffice), student-, parent-, or teacher-level data often require great effort to obtain, if they are made available at all.
39 One can understand the school district’s impulse to play it safe. Why
release data that might prompt a future lawsuit from parents? A related issue is studies that attempt to gather education data from randomized field experiments. Returning to the school choice example, much ink has been spilled in methodological debates over whether the results from voucher programs are biased because of selection effects.
40 In other
words, parents opting for a voucher are typically unlike parents who would not consider one, which raises questions about whether student success in those programs is more driven by family-level variables than voucher use. A powerful way to sidestep the methodological debates about selection would be to run a large experiment involving all students in a district where some were randomly assigned to use a voucher and the others were not. The problem with such a plan, assuming that the political obstacles to it could be surmounted (a huge assumption!), is that families may not like the category to which they are assigned, and they would likely try to have their assignment changed. Unfortunately, tampering with the integrity of the treatment and control group would undermine the potential power of the experiment. Really, one could broaden that voucher discussion to include any situation in which researchers would like to run a controlled experiment to test the effects of a particular educational intervention. Not only does that raise equity questions for many people, but the entire notion of using children in research
User and Producer Preferences Education data are imperfect in part because there are so many potential data users and producers whose incentives and interests can clash. Put another way, quality and availability really have different meanings for different people. One assistant superintendent, for example, distinguished between “trailing” data, including state test results and other relatively older measures that are not very useful in real time but could be valuable to program overseers, and “leading” data, such as those from district diagnostics that a teacher or principal could use on the spot to adjust classroom practices.
37
Overall, one person’s data garbage can be another’s treasure, as an example from federal policy illustrates. Pullout programs funded through Title I of the Elementary and Secondary Education Act (ESEA) have been a popular method to address the needs of disadvantaged students. But the idea that needy students should miss time from their regular classes to participate in these programs was never clearly motivated by strong empirical evidence that the benefits would outweigh what the students would miss from their regular classrooms. So why do pullouts? A management concern of local school districts and states largely motivated the concept. School officials could more easily prove to program auditors that Title I funds supported disadvantaged students if pullouts were used because districts then had expenditure data showing that the dollars funded staff and supplies for Title I classrooms.
38
The data system and instructional model that emerged from pullouts served budget makers and grant program managers well, but had little grounding in research about what would most help disadvantaged students. To return to earlier concepts, the data system produced management data that were context indicators, but not performance indicators. Elected officials also reaped political benefits from this model because they could describe specifically how federal dollars supported hiring new teachers and purchasing materials in home districts. The question of whether students were actually learning more became lost amidst these other concerns. An overall lesson from this example is that dangers ensue when the data collection tail wags the classroom instruction dog. Debates over school choice provide additional examples of diverse preferences among data producers and users. While data concerns are not the only (or even the main) issue animating school voucher discussions, the fact that private schools are not required to abide by the same reporting
A Byte at the Apple
22 23
Introduction: The Education Data Landscape
million and $3 million dollars per state, over several years of implementation. That does not include annual maintenance of these systems at the state level, which was $360,000 in Wisconsin and $200,000 in Utah. Local districts would also incur additional costs, which, in most cases according to the study, were “absorbed by having existing staff work overtime, delaying other projects, and shifting responsibilities.”
43 Those expenses can be a difficult political sell
in states or communities where political pressures exist to funnel scarce dollars to the classroom, rather than building valuable technical capacities in state or local agencies. The unfortunate reality is that few, if any, politicians build their careers around helping government bureaucracies develop and sustain the technical capabilities to do their jobs well.
44 Politically speaking, elected officials get
more mileage out of promoting a new reading program, without mentioning, of course, that its design (engendering yet another program silo) will create more paperwork for civil servants charged with gathering data on the program’s administration and performance. Simply not wanting to know what the data show is another political calculation that can undermine the availability and accuracy of education data. For example, due to political calculations among Wisconsin Republicans and Democrats, public funds for monitoring and evaluating the Milwaukee Parental Choice Program (MPCP), the nation’s oldest publicly-funded school voucher program that began in 1990, were eliminated after 1994. That created a gap of over a decade for which no evaluation data exist on the program. Fortunately, a new comprehensive evaluation, which will gather data on several dimensions of the MPCP, is presently underway.
45
At the federal level, legislators interested in making funding decisions based on data and program performance can generate resistance when their efforts collide with otherwise popular initiatives. A proposal in 2007 to launch an experimental evaluation of the effectiveness of the federal Upward Bound program prompted such criticism from Senator Tom Harkin (D-Iowa) who said, “Young people deserve to know that programs like Upward Bound will be there for them as they climb that ladder and that they will not lose that access for the purpose of an evaluation.” Harkin formally expressed his opposition by presenting an amendment to the Higher Education Amendments Act that “would bar the department [of education] from forcing Upward Bound programs to participate in evaluations that deny services to control-group
experiments to test particular interventions would be a hard sell in many communities. Those feelings may exist despite there being no systematic evidence showing that the treatment that children in the control group are denied produces educational benefits. Creative researchers have managed to work within such constraints by identifying or helping to administer quasi-experiments that approximate the randomized control and treatment groups present in an experimental setting. Still, valuable data from true experiments are relatively few and far between in education.
Politics Political considerations are a final factor that help account for the nation’s education data problems. The case study of California in RiShawn Biddle’s chapter provides one example. The political components of data collection and use permeate the previous three sections on capacity issues, governance, and user and producer preferences. For example, the nation has such a fragmented system of education governance due to constitutional arrangements and its long political tradition of decentralization.
41 Establishing a more unitary system
with a powerful national ministry of education, common in many European and Asian countries, would help streamline the collection of education data, but would be next to impossible to implement given constitutional concerns and the nation’s aversion to a strong federal presence in K-12 education (NCLB notwithstanding).
42
Politics also contribute to the capacity problems that prevent government agencies from becoming more proficient collectors and managers of data. The political slogan that education dollars should go directly to “the classroom” and not “bloated bureaucracies” does contain a grain of truth. But taken too far, as it often is, that view can justify limiting federal, state, or local investments to modernize data systems, hire talented information technology personnel, and maintain the needed support systems to help schools and teachers gather and use education data. These are costly expenses that typically receive less attention than they deserve in legislative hearings and debate. Consider, for example, a study from the Data Quality Campaign that estimated the expense associated with creating a unique student identifier at the state level. Such a tool would allow states to track individual students from their first day of school until graduation. Based on the efforts of leading states, this study estimated that such a system would have annual costs of between $1
A Byte at the Apple
24 25
Introduction: The Education Data Landscape
data it needs. Even if creative leaders managed to corral those forces, at least four persistent challenges would remain. First, on the policy side, there will always exist more education initiatives than can be tracked systematically in great detail. In allocating scarce resources, governments, researchers, and foundations will have to decide which policies or activities most merit detailed and sustained attention. Second, on the results side, perhaps the most valuable data about students — the ultimate outcomes and accomplishments of their lives — are hardly ever available. In other words, most data collection in education resides between the bookends of a student’s kindergarten through 12th-grade worlds. Schools and school districts (and in turn, their state and federal overseers) know very little about what happens to students once they complete their studies and move on. Did students who learned from a particular curriculum or who had certain teachers eventually live happy, enriching, and productive lives? We have scant evidence on those issues in part because tracking students over their entire lifetimes is incredibly difficult and expensive.
50
Third, in terms of policy and results, education data emerge from the unfolding of human systems. Those systems are unlike data generated by an electron accelerator or in a chemist’s lab. Chemical reactions in a test tube will proceed in a predictable way regardless of whether a scientist has the flu. In contrast, a student who is upset or suffering from a nasty cold will likely perform worse on her state reading test. There will always be some degree of noise in education data because of human factors. A key for researchers and governments is to try to minimize the noise factor, or better account for it along the way.
51
Fourth, even if the nation possessed the education data it needed, individuals who matter would have to act upon those data in consequential ways.
52 Parents would have to use data to inform their discussions with school
personnel. Teachers and principals would need to use data to inform their classroom choices. Policymakers would have to make data a larger part of their policy deliberations. And voters without children in the schools would have to consider the data when they hold their representatives accountable for the performance of the public education system. There is no guarantee that simply having better data will make all or any of these things happen. Getting the education data America needs will not be easy. But it is worth noting that creative people in societies across history and the globe have successfully confronted similar problems. In 19th-century England, for
students.” In the end, Harkin won and Congress eliminated funding for the random-assignment study.
46
Greater data transparency can create political push-back when it proves embarrassing to officials who have resisted examining long-standing programs or practices more carefully. Despite some of the reasonable criticisms hurled at NCLB, for example, the law’s emphasis on releasing data by student subgroups has revealed startling facts about some schools and districts with otherwise favorable reputations. When student achievement had been evaluated considering grand averages that lumped all students together, many schools looked as if they were performing quite well. But breaking out those averages into subgroups has revealed that some of these model districts were actually failing their poor and minority students in large numbers. Now, armed with those data, public officials at all levels of government along with parents and their supporters are much better positioned to push for changes that will meet these students’ needs. The result is that these previously celebrated schools and districts are now feeling accountability pressures and are experiencing greater scrutiny.
47
In considering politics and data, one should also remember that education policy does not exist in a vacuum. Proposals to improve data collection must compete for resources with other areas including public safety, environmental protection, and health and human services. Cross-cutting issues, such as concerns over protecting personal privacy and the integrity of data systems, also affect education policy.
48 Privacy concerns are at the center of discussions
about how states and their affiliates may use student-level information that were originally generated in local schools but now reside in state-run longitudinal data systems.
49 When governments attempt to write general rules to protect
individuals’ privacy, some requirements will seem to make little sense when applied to education. Gathering research data through the use of human subjects is one such area. Many of the rules governing the use of human subjects were originally designed with medical research in mind, which involve invasive physical procedures that can be matters of life and death. While some of those rules are appropriate for the collection of education data, others are not.
4. Looking Ahead
Diverse user and producer preferences, capacity limits, fragmentation, and politics are major reasons why the nation does not have the education
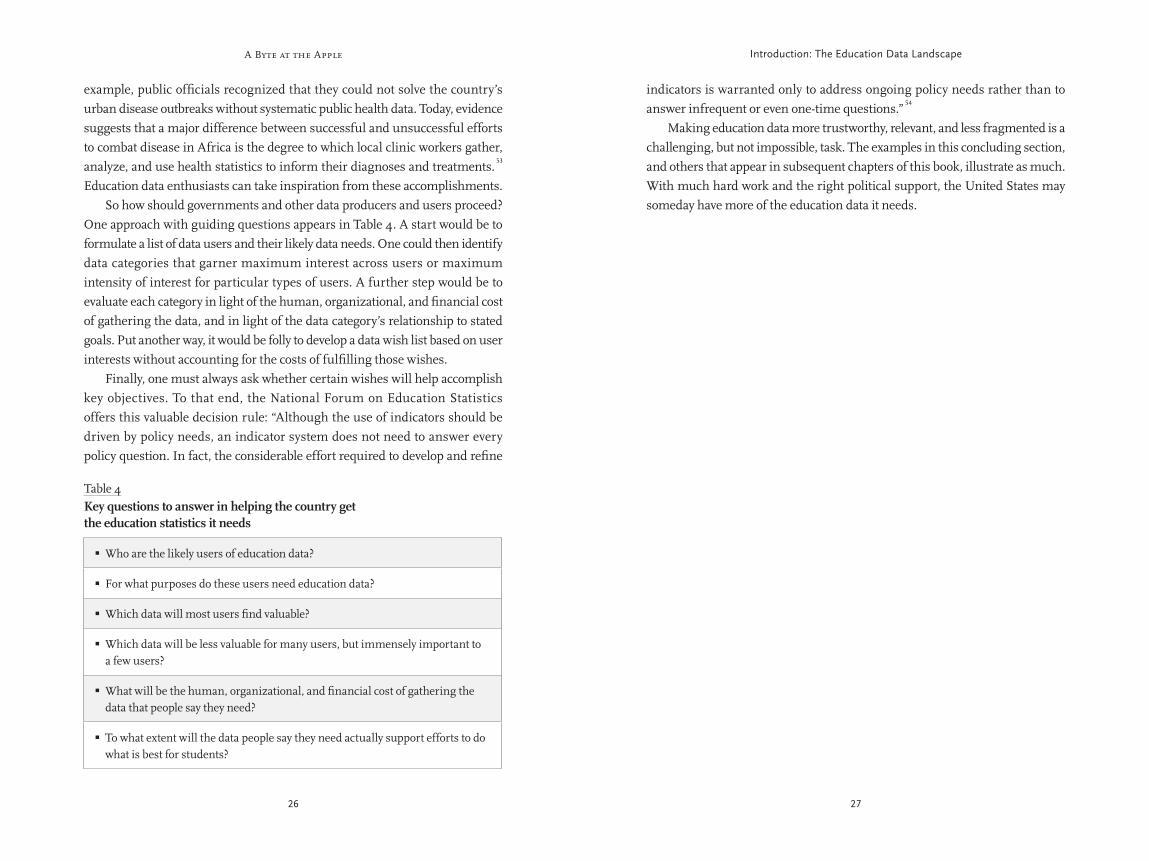
A Byte at the Apple
26 27
Introduction: The Education Data Landscape
indicators is warranted only to address ongoing policy needs rather than to answer infrequent or even one-time questions.”
54
Making education data more trustworthy, relevant, and less fragmented is a challenging, but not impossible, task. The examples in this concluding section, and others that appear in subsequent chapters of this book, illustrate as much. With much hard work and the right political support, the United States may someday have more of the education data it needs.
example, public officials recognized that they could not solve the country’s urban disease outbreaks without systematic public health data. Today, evidence suggests that a major difference between successful and unsuccessful efforts to combat disease in Africa is the degree to which local clinic workers gather, analyze, and use health statistics to inform their diagnoses and treatments.
53
Education data enthusiasts can take inspiration from these accomplishments. So how should governments and other data producers and users proceed? One approach with guiding questions appears in Table 4. A start would be to formulate a list of data users and their likely data needs. One could then identify data categories that garner maximum interest across users or maximum intensity of interest for particular types of users. A further step would be to evaluate each category in light of the human, organizational, and financial cost of gathering the data, and in light of the data category’s relationship to stated goals. Put another way, it would be folly to develop a data wish list based on user interests without accounting for the costs of fulfilling those wishes. Finally, one must always ask whether certain wishes will help accomplish key objectives. To that end, the National Forum on Education Statistics offers this valuable decision rule: “Although the use of indicators should be driven by policy needs, an indicator system does not need to answer every policy question. In fact, the considerable effort required to develop and refine
Table 4Key questions to answer in helping the country get the education statistics it needs
Who are the likely users of education data? �
For what purposes do these users need education data? �
Which data will most users find valuable? �
Which data will be less valuable for many users, but immensely important to �a few users?
What will be the human, organizational, and financial cost of gathering the �data that people say they need?
To what extent will the data people say they need actually support efforts to do �what is best for students?
A Byte at the Apple
28 29
Introduction: The Education Data Landscape
Endnotes
Kettl, Donald F. “The Global Revolution in Public Management: Driving 1
Themes, Missing Links.” Journal of Policy Analysis and Management 16 no. 3,
1997; Kettl, Donald F. “Public Administration at the Millennium: The State of
the Field.” Journal of Public Administration Research and Theory 10 no. 1, 2000.
Information on NAEP is available here: http://nces.ed.gov/nationsreportcard/.2
The state of Tennessee has been a pioneer in using longitudinal data. Much 3
credit goes to researcher William Sanders and the value-added data system
he developed. See Sanders, William L. and June C. Rivers. “Cumulative and
Residual Effects of Teachers on Future Student Academic Achievement.”
University of Tennessee, Value-Added Research and Assessment Center, 1996;
and Robelen, Erik. “Tennessee Seeks to Use Students Tests to Show Teacher
Quality.” Education Week, May 7, 2003.
See http://nces.ed.gov/forum/. For the NFES’s indicator categorization 4
scheme see: “Forum Guide to Education Indicators (NFES 2005-802).” U.S.
Department of Education, National Center for Education Statistics, 2005 pp. 16-
18. The NFES notes that not all indicators fall cleanly into these categories. Their
placement can vary depending on their use.
The Organic Act of 1867 stated: “That there shall be established in the city 5
of Washington, a department of education, for the purpose of collecting such
statistics and facts as shall show the condition and progress of education in the
several states and territories, and of diffusing such information respecting the
organization and management of schools and school systems, and methods of
teaching, as shall aid the people of the United States in the establishment and
maintenance of efficient school systems, and otherwise promote the cause of
education throughout the country.” Quoted in Vought, Sabra W. “The Library of
the Federal Office of Education.” Peabody Journal of Education 12 no. 1,
1934 p. 21.
A seminal work on these parent and family discussion networks is: 6
Schneider, Mark, Paul Teske, and Melissa Marschall. Choosing Schools:
Consumer Choice and the Quality of American Schools. Princeton, NJ: Princeton
University Press, 2000.
Maxwell, Lesli A. “IG Report Questions NCLB’s Unsafe-Schools Option.” 7
Education Week, August 15, 2007.
A nice summary of this literature appears in: Haycock, Kati. “The Elephant 8
in the Living Room.” Brookings Papers on Education Policy. Ed. Diane Ravitch,
Washington, DC: Brookings Institution, 2004; and Wayne, Andrew J. and Peter
Youngs. “Teacher Characteristics and Student Achievement Gains: A Review.”
Review of Educational Research 73 no. 1, 2003.
On parent satisfaction see Gill, Brian P. et al. 9 Rhetoric Versus Reality: What We
Know and What We Need to Know About Vouchers and Charter Schools. RAND,
2001. For conflicting accounts over student achievement in Milwaukee see
Greene, Jay P., Paul E. Peterson, and Jiangtao Du. “Effectiveness of School
Choice: The Milwaukee Experiment.” Education and Urban Society 31 no. 2,
1999; Rouse Cecelia. “Private School Vouchers and Student Achievement: An
Evaluation of the Milwaukee Parental Choice Program.” Quarterly Journal of
Economics 113 no. 2, 1998; Witte, John F. The Market Approach to Education: An
Analysis of America’s First Voucher Program. Princeton, NJ: Princeton UP, 2000.
On New York see: Howell, William G. and Paul E. Peterson. The Education Gap:
Vouchers and Urban Schools. Washington, DC: Brookings Institution, 2002;
and Krueger, Alan B. and Pei Zhu. “Another Look at the New York City School
Voucher Experiment.” American Behavioral Scientist 47 no. 5, 2004.
Hess, Frederick M. Ed. 10 When Research Matters: How Scholarship Influences
Education Policy. Cambridge, MA: Harvard Education Press, 2008.
This publication from the Forum is available on line at 11
http://www.publicpolicyforum.org/issues.php?category=2.
Wilson, James Q. Bureaucracy: 12 What Government Agencies Do and Why They Do
It. New York: Basic Books, 1989 pp.168-71. On production organizations, which
appears later in the paragraph, see pp. 159-163 in the same source.
Gorman, Siobhan. “Can’t Beat ’Em? Sue ’Em!” 13 Washington Monthly, December
2001. http://www.washingtonmonthly.com. Using state test score data and
school characteristics, the Education Trust’s on-line data tool, Dispelling the
Myth, allows users to search for schools with high minority or low income
students who are nevertheless achieving at high levels. See
http://www2.edtrust.org/edtrust/dtm/.
Jacob, Brian A. “No Child Left Behind, Chicago Style.” 14 No Child Left Behind?
The Politics and Practice of School Accountability. Eds. Paul E. Peterson and
Martin R. West, Washington, DC: Brookings Institution, 2003; Datnow,
Amanda, Vicki Park, and Priscilla Wohlstetter. “Achieving with Data: How
High-Performing School Systems Use Data to Improve Instruction for
A Byte at the Apple
30 31
Introduction: The Education Data Landscape
Roza, Margeurite and Paul T. Hill. “How within-District Spending Inequities 23
Help Some Schools to Fail.” Brookings Papers on Education Policy. Ed. Diane
Ravitch, Washington, DC: Brookings Institution, 2004.
Roza, Margeurite and Paul T. Hill. “How within-District Spending Inequities 24
Help Some Schools to Fail.” Brookings Papers on Education Policy. Ed. Diane
Ravitch, Washington, DC: Brookings Institution, 2004.
“Forum Guide to Building a Culture of Quality Data: A School and District 25
Resource (NFES 2005-801).” US Department of Education, National Center for
Education Statistics, 2004 p. 3.
McNeil, Michelle. “Glitches, Data Errors Delay Illinois Test-Score Release.” 26
Education Week, December 6, 2006.
On supplemental services and schools at different levels of improvement 27
see: Hess, Frederick M. and Chester E. Finn, Jr., Eds. No Remedy Left Behind:
Lessons from a Half-Decade of NCLB. Washington, DC: AEI Press, 2007. On
restructuring see: Mead, Sara. “Easy Way Out: “Restructured” Usually Means
Little Has Changed.” Education Next, Winter 2007.
Cech, Scott J. “Florida Scoring Glitch Sparks Broad Debate.” 28 Education Week,
June 13, 2007.
Samuels, Christina A. “Special Education Official Leads Data-Collection Push.” 29
Education Week, January 10, 2007.
Samuels, Christina A. “IDEA Imposes Hefty Data Burden on States.” 30 Education
Week, January 31, 2007. One state official from Michigan quoted in this story
said that the changes from 2004 are “so big, it has redefined part of the core
work of the state education agency.”
Roza, Margeurite and Paul T. Hill. “How within-District Spending Inequities 31
Help Some Schools to Fail.” Brookings Papers on Education Policy. Ed. Diane
Ravitch, Washington, DC: Brookings Institution, 2004 p. 202.
McNeil, Michelle. “Glitches, Data Errors Delay Illinois Test-Score Release.” 32
Education Week, December 6, 2006.
Samuels, Christina A. “IDEA Imposes Hefty Data Burden on States.” 33 Education
Week, January 31, 2007.
More information is available at the SIFA website: http://www.sifinfo.org.34
Researchers affiliated with the CALDER project are taking advantage of the 35
growing number of states with individual student identifiers. See
http://www.caldercenter.org/.
Elementary Students.” Center on Educational Governance, University of
Southern California, 2007 p. 33.
Hoff, David J. “A Hunger for Data.” 15 Education Week, June 20, 2007.
Olson, Lynn. “Homegrown Tests Measure Core Critical-Reading Skills.” 16
Education Week, May 2, 2007. More information on Boston’s FAST-R initiative,
including links to evaluation reports, is available at http://www.bpe.org/
fast-r2.htm.
Manna, Paul. “NCLB in the States: Fragmented Governance, Uneven 17
Implementation.” No Remedy Left Behind: Lessons from a Half-Decade of
NCLB. Eds. Frederick M. Hess and Chester E. Finn, Jr., Washington, DC:
AEI Press, 2007.
Lyon, G. Reid et al. “Rethinking Learning Disabilities.” 18 Rethinking Special
Education for a New Century. Eds. Chester E. Finn, Jr., Andrew J. Rotherham,
and Charles R. Hokanson, Jr., Thomas B. Fordham Foundation and the
Progressive Policy Institute, 2001.
Carmines, Edward G. and Richard A. Zeller. 19 Reliability and Validity Assessment.
Newbury Park, CA: Sage Publications, 1979.
Cavanagh, Sean. “State Tests, NAEP Often a Mismatch.” 20 Education Week, June
13, 2007; “Mapping 2005 State Proficiency Standards onto the NAEP Scales
(NCES 2007-482).” US Department of Education, National Center for Education
Statistics, 2007; Fuller, Bruce et al. “Is the No Child Left Behind Act Working?
The Reliability of How States Track Achievement.” Policy Analysis for California
Education, 2006; Has Student Achievement Increased Since 2002? State Test-Score
Trends Through 2006 – 07. Center on Education Policy, 2008.
Marsh, Julie A., John F. Pane, and Laura S. Hamilton. “Making Sense of Data-21
Driven Decision Making in Education.” RAND, 2006 p. 11.
Burtless, Gary. Ed. 22 Does Money Matter? The Effect of School Resources on Student
Achievement and Adult Success. Washington, DC: Brookings Institution, 1996;
Greenwald, Rob, Larry V. Hedges, and Richard D. Laine. “The Effect of School
Resources on Student Achievement.” Review of Educational Research 66 no.
3,1996; Hanushek, Eric A. “Assessing the Effects of School Resources on
Student Performance: An Update.” Educational Evaluation and Policy Analysis 19
no. 2, 1997; Ladd, Helen F., Thomas Sobol, and Janet S. Hansen. Eds. Making
Money Matter: Financing America’s Schools. Washington, DC: National Academy
Press, 1999.
A Byte at the Apple
32 33
Introduction: The Education Data Landscape
Manna, Paul. 42 School’s In: Federalism and the National Education Agenda.
Washington, DC: Georgetown UP, 2006.
Smith, Nancy J. and Jane Armstrong. “Creating Longitudinal Data Systems: 43
Lessons Learned by Leading States.” Data Quality Campaign, 2006. p. 9.
Wilson, James Q. 44 Bureaucracy: What Government Agencies Do and Why
They Do It. New York: Basic Books, 1989; Arnold, R. Douglas. The Logic of
Congressional Action. New Haven, CT: Yale UP, 1990.
Witte, John F. 45 The Market Approach to Education: An Analysis of America’s First
Voucher Program. Princeton, NJ: Princeton UP, 2000. p. 189;
“Evaluation; a Study to Fill in the Blanks on Vouchers.” Milwaukee Journal
Sentinel, January 29, 2006. Information on the current evaluation of the
Milwaukee voucher program is available at http://www.uark.edu/ua/der/SCDP/
Milwaukee_Research.html.
Viadero, Debra. “Congress May Thwart Upward Bound Study.” 46 Education Week,
July 18, 2007. For information on the evaluation funding being eliminated,
see: Viadero, Debra. “U.S. Position on Research Seen in Flux.” Education Week,
March 5, 2008.
One example is in Fairfax County, Virginia. See Glod, Maria. “Fairfax Success 47
Masks Gap for Black Students.” Washington Post, April 14, 2006.
“Maximizing the Power of Education Data While Ensuring Compliance with 48
Federal Student Privacy Laws.” Data Quality Campaign, 2007.
Winnick, Steven Y., Scott R. Palmer, and Arthur L. Coleman. “State 49
Longitudinal Data Systems and Student Privacy Protections under the Family
Educational Rights and Privacy Act.” Data Quality Campaign, 2006.
A notable effort is the National Education Longitudinal Study ( http://nces.50
ed.gov/surveys/nels88/). Another, with a much smaller cohort of subjects, but
several more years of data is the High/Scope Perry Preschool Study
(http://highscope.org/Content.asp?ContentId=219).
Kane, Thomas J. and Douglas O. Staiger. “Volatility in School Test 51
Scores: Implications for Test-Based Accountability Systems.” Brookings Papers
on Education Policy. Ed. Diane Ravitch , Washington, DC: Brookings Institution,
2002.
For an historical treatment of this, see: Tyack, David and Larry Cuban. 52 Tinkering
toward Utopia: A Century of Public School Reform. Cambridge, MA: Harvard
University Press, 1995. For a recent and skeptical view, see: Wolk, Ronald A.
“Education Research Could Improve Schools, but Probably Won’t.” Education
Datnow, Amanda, Vicki Park, and Priscilla Wohlstetter. “Achieving with Data: 36
How High-Performing School Systems Use Data to Improve Instruction
for Elementary Students.” Center on Educational Governance, University of
Southern California, 2007 p. 66.
Datnow, Amanda, Vicki Park, and Priscilla Wohlstetter. “Achieving with Data: 37
How High-Performing School Systems Use Data to Improve Instruction
for Elementary Students.” Center on Educational Governance, University
of Southern California, 2007 p. 36. Principals and teachers also sometimes
disagree when describing the data they find most valuable. On that point see
Marsh, Julie A., John F. Pane, and Laura S. Hamilton. “Making Sense of Data-
Driven Decision Making in Education.” RAND, 2006 p. 12.
Wong, Kenneth K. and Stephen J. Meyer. “Title I Schoolwide Programs as 38
an Alternative to Categorical Practices.” Title I: Compensatory Education at the
Crossroads. Ed. Geoffrey D. Borman, Samuel C. Stringfield, and Robert E. Slavin,
Lawrence Erlbaum Associates, 2001 pp. 195-96.
In some areas the federal Family Educational Rights and Privacy Act clearly 39
does not interfere with data collection, but in others the law is more ambiguous.
For those distinctions see: Winnick, Steven Y., Scott R. Palmer, and Arthur L.
Coleman. “State Longitudinal Data Systems and Student Privacy Protections
under the Family Educational Rights and Privacy Act.” Data Quality Campaign,
2006.
Witte, John F. “The Milwaukee Voucher Experiment.” 40 Educational Evaluation
and Policy Analysis 20, no. 4, 1998; Greene, Jay P., Paul E. Peterson, and Jiangtao
Du. “Effectiveness of School Choice: The Milwaukee Experiment.” Education
and Urban Society 31, no. 2 1999; Krueger, Alan B. and Pei Zhu. “Another Look
at the New York City School Voucher Experiment.” American Behavioral Scientist
47, no. 5, 2004; Peterson, Paul E. and William G. Howell. “Efficiency, Bias, and
Classification Schemes: A Response to Alan B. Krueger and Pei Zhu.” American
Behavioral Scientist 47, no. 5, 2004.
Wirt, Frederick M. and Michael W. Kirst. 41 The Political Dynamics of American
Education. Berkeley, CA: McCutchan Publishing Corporation, 1997; Conley,
David T. Who Governs Our Schools? Changing Roles and Responsibilities. New
York: Teachers College Press, 2003; Epstein, Noel. Ed. Who’s in Charge Here?
The Tangled Web of School Governance and Policy. Denver, CO and Washington,
DC: Education Commission of the States and the Brookings Institution, 2004.
A Byte at the Apple
34
Week, June 20, 2007. Optimistic examples include: Williams, Trish, Kenji
Hakuta, and Edward Haertel. “Similar English Learner Students, Different
Results: Why Do Some Schools Do Better?” Mountain View, CA: EdSource,
2007; and Olson, Lynn. “Homegrown Tests Measure Core Critical-Reading
Skills.” Education Week, May 2, 2007.
For the England and Africa examples, see: Epstein, Helen. “Death by the 53
Numbers.” New York Review of Books, June 28, 2007.
“Forum Guide to Education Indicators (NFES 2005-802).” US Department of 54
Education, National Center for Education Statistics, 2005.

Section I
Why We Don’t Have the Data We Need
38 39
Getting FERPA Right: Encouraging Data Use While Protecting Student Privacy
Getting FERPA Right: Encouraging Data Use While Protecting Student Privacy
Chrys Dougherty
Chrys Dougherty, Ph.D. is a senior research scientist at ACT
and the National Center for Educational Achievement
1. Introduction
The creation of large statewide education databases offers an unparalleled opportunity to improve our information about effective schools, programs, practices, and reforms. This opportunity is at risk, however, because of excessive restrictions on access to data
based on concerns about student privacy. In many places, privacy has been used as a justification to restrict many types of research, data mining, and data analysis that depend on access to statewide data. Like their peers in medicine, counseling, law, and accounting, educators have an obligation to protect the privacy of their charges. However, as in medicine, an appropriate balance must be struck between the need to protect individual privacy and the equally compelling mission to use data and research to improve outcomes for students. Because all uses of data contain some small risk that the data will be improperly disclosed, the key to privacy policy is to create arrangements whereby those risks are minimized while the large benefits from use of the data for analysis, research, and the improvement of schools and student learning can still be realized. It would be an error, while focusing on privacy risks, to overlook the even greater risk to which we subject millions of students if we fail to improve their education.
Section 2 of this chapter provides an overview of the federal Family Educational Rights and Privacy Act (FERPA) privacy law. Section 3 briefly describes the U.S. educational and policy environment at the time of FERPA’s enactment in 1974. Section 4 describes changes since then, including the increased focus on school accountability and the development of statewide longitudinal student data systems. Section 5 describes the research and analysis opportunities that have been created by these data systems, while Section 6 explains how federal privacy law can be interpreted or amended to take full advantage of these opportunities while continuing to safeguard privacy. Section 7 offers reasons why policymakers may assign greater weight to small privacy risks than to large data use benefits. Section 8 concludes with recommendations in three areas: interpreting appropriately privacy law, strengthening research and data analysis using longitudinal student data, and helping the policy world do a better job of balancing privacy risks and data analysis benefits.
2. FERPA Fundamentals
The Family Educational Rights and Privacy Act was passed by Congress and signed into law by President Gerald Ford in August 1974. Known as the “Buckley Amendment” after the law’s principal sponsor, Senator James Buckley of New York, the law gave parents oversight of their children’s educational records.
1
At the time the law was passed, the Watergate scandal was current news and concerns about abuses of government power and invasions of privacy were ubiquitous. Senator Buckley and others were concerned that allegations about students (“Johnny is a troublemaker”) were being placed in those pupils’ file folders and later inappropriately used against them — without parents being able to view the information, challenge its accuracy, or prevent its unwanted release. Senator Buckley stated that the new law was intended to counter “frequent, even systematic violations of the privacy of students and parents by the schools…and the unauthorized, inappropriate release of personal data to various individuals and organizations.”
2
FERPA guaranteed parents three specific rights with regard to their children’s education records. The first was the right to inspect and review the accuracy of the record. Second was the right to challenge the accuracy of the record at a hearing, at which time the parent could ask that inaccurate material be corrected or removed. Third was the right to prevent personally identifiable
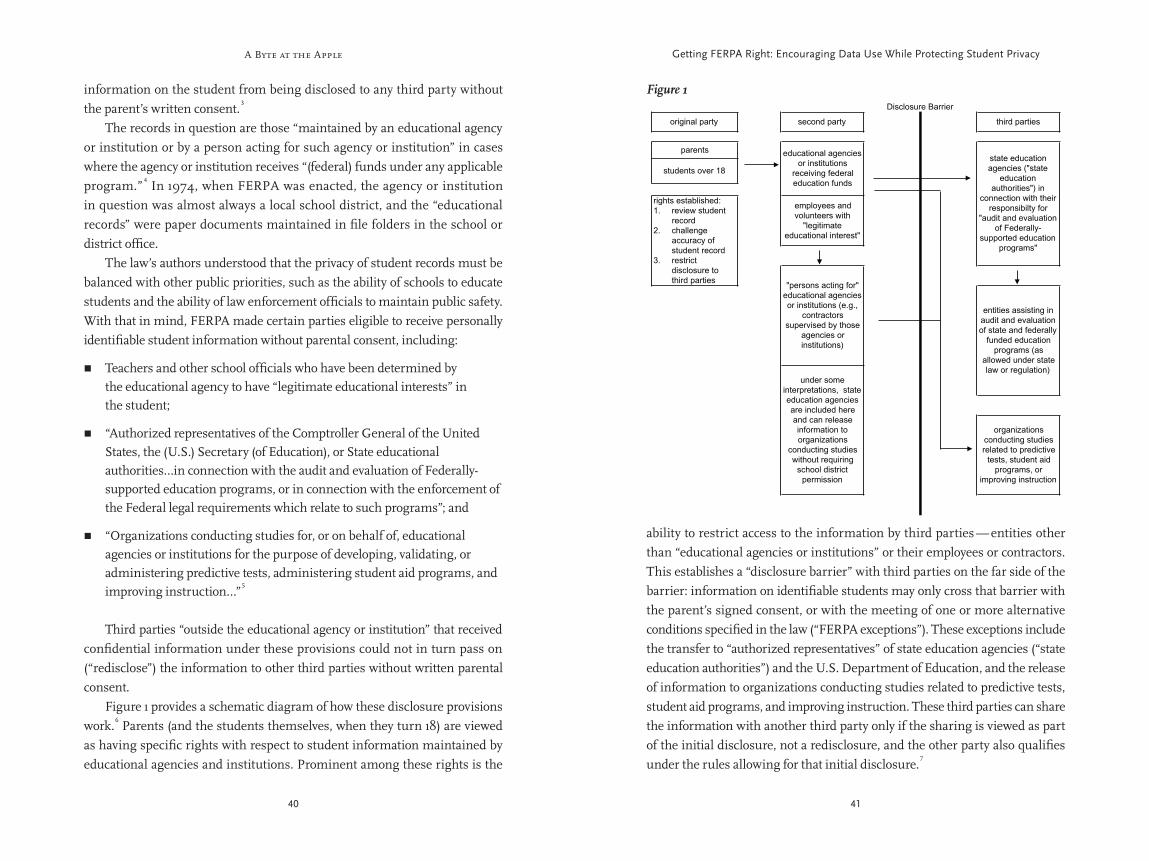
A Byte at the Apple
40 41
Getting FERPA Right: Encouraging Data Use While Protecting Student Privacy
ability to restrict access to the information by third parties — entities other than “educational agencies or institutions” or their employees or contractors. This establishes a “disclosure barrier” with third parties on the far side of the barrier: information on identifiable students may only cross that barrier with the parent’s signed consent, or with the meeting of one or more alternative conditions specified in the law (“FERPA exceptions”). These exceptions include the transfer to “authorized representatives” of state education agencies (“state education authorities”) and the U.S. Department of Education, and the release of information to organizations conducting studies related to predictive tests, student aid programs, and improving instruction. These third parties can share the information with another third party only if the sharing is viewed as part of the initial disclosure, not a redisclosure, and the other party also qualifies under the rules allowing for that initial disclosure.
7
information on the student from being disclosed to any third party without the parent’s written consent.
3
The records in question are those “maintained by an educational agency or institution or by a person acting for such agency or institution” in cases where the agency or institution receives “(federal) funds under any applicable program.”
4 In 1974, when FERPA was enacted, the agency or institution
in question was almost always a local school district, and the “educational records” were paper documents maintained in file folders in the school or district office. The law’s authors understood that the privacy of student records must be balanced with other public priorities, such as the ability of schools to educate students and the ability of law enforcement officials to maintain public safety. With that in mind, FERPA made certain parties eligible to receive personally identifiable student information without parental consent, including:
Teachers and other school officials who have been determined by ��
the educational agency to have “legitimate educational interests” in the student;
“Authorized representatives of the Comptroller General of the United ��
States, the (U.S.) Secretary (of Education), or State educational authorities…in connection with the audit and evaluation of Federally-supported education programs, or in connection with the enforcement of the Federal legal requirements which relate to such programs”; and
“Organizations conducting studies for, or on behalf of, educational ��
agencies or institutions for the purpose of developing, validating, or administering predictive tests, administering student aid programs, and improving instruction…”
5
Third parties “outside the educational agency or institution” that received confidential information under these provisions could not in turn pass on (“redisclose”) the information to other third parties without written parental consent. Figure 1 provides a schematic diagram of how these disclosure provisions work.
6 Parents (and the students themselves, when they turn 18) are viewed
as having specific rights with respect to student information maintained by educational agencies and institutions. Prominent among these rights is the
1.
2.
3.
third parties
educational agencies
or institutions
receiving federal
education funds
state education
agencies ("state
education
authorities") in
connection with their
responsibilty for
"audit and evaluation
of Federally-
supported education
programs"
"persons acting for"
educational agencies
or institutions (e.g.,
contractors
supervised by those
agencies or
institutions)
entities assisting in
audit and evaluation
of state and federally
funded education
programs (as
allowed under state
law or regulation)
organizations
conducting studies
related to predictive
tests, student aid
programs, or
improving instruction
under some
interpretations, state
education agencies
are included here
and can release
information to
organizations
conducting studies
without requiring
school district
permission
second party
employees and
volunteers with
"legitimate
educational interest"
restrict
disclosure to
third parties
original party
parents
students over 18
rights established:
Disclosure Barrier
review student
record
challenge
accuracy of
student record
Figure 1
A Byte at the Apple
42 43
Getting FERPA Right: Encouraging Data Use While Protecting Student Privacy
ensuring that schools had proper procedures in place to involve parents on committees. Both what and how much the funded students were learning were not treated as a matter of equal urgency. In the language of economics, the emphasis was on inputs, not on productivity. Research on “effective schools” was in its infancy. The 1965 Coleman Report was widely misinterpreted as implying that students’ socioeconomic status was the only relevant factor determining educational outcomes, so that schools don’t make much of a difference. The 1969 Westinghouse Report suggested that Head Start didn’t seem to make much difference either. The 1970s equivalent of the “standards movement” was the call for “minimum competency,” asking students to demonstrate sixth-grade performance by the time they graduate from high school. Even these minimal standards were widely regarded as unfair and unrealistic for many students.
13
Although record numbers of students were enrolling in higher education, the policy emphasis at the time on “equity” did not translate into a call for achievement gaps to be closed or for the majority of disadvantaged students to be academically prepared for college or other postsecondary learning opportunities. Rather the emphasis was on “access” to higher education regardless of whether students were actually prepared to succeed once they enrolled. The 1970s were a heyday of the “shopping mall high school” and of corresponding elementary and middle school practices based on the idea that only a minority of students were cut out for challenging academic content.
14
This toxic combination of low expectations and a focus on rules over results meant that there was little pressure on students or schools to improve performance and little demand for research or public information on school effectiveness. Thus, the need to create better arrangements for using student data while safeguarding privacy rights was not a salient issue in 1974.
4. Major Developments Since 1974
After 1974, and particularly after the publication of A Nation at Risk in 1983, the education policy environment in the United States changed dramatically in ways that placed a strong emphasis on collecting and using data to improve schools and student learning. The emergence of data on international comparisons led to a widespread understanding that American students were underperforming relative to their peers overseas. In addition, the availability
When FERPA was enacted, state education agencies did not collect student-level data, and alternative governance structures, such as charter schools, charter management organizations, and charter school sponsors did not exist. Nor had any state proposed comprehensive arrangements to gather data on individual students from early childhood through K-12 and into higher education and the workforce.
8 Therefore, it was not necessary to clarify which,
if any, of these data-maintaining entities should be classified under the law as “educational agencies or institutions or persons acting for such agency or institution,” and which as outside third parties.
9
To summarize, the issue of who is an “educational agency or institution or person acting on behalf of such an institution” is critical under FERPA, because the law places no constraints on how such an entity can make use of the data, so long as the data are accurate and subject to parental inspection and correction, and the user has a “legitimate educational interest” in the information. The constraints come in as soon as the data are to be released to third parties, and therefore must cross the disclosure barrier in Figure 1. The data can only be released to third parties with the parent’s written consent or under specific circumstances described by the law (e.g., to organizations conducting studies on behalf of the educational agency or institution). Third parties, in turn, cannot share (“redisclose”) the data with other third parties without parents’ written consent. So the law is restrictive with respect to the use of data by third parties, but not by educational agencies or their contractors — “person(s) acting on (their) behalf.”
10
3. The Education Environment in 1974
In 1974, the U.S. was in a period of educational stagnation. Test scores were falling not only on the SAT but also on standardized tests such as the Iowa Tests of Basic Skills, declining by more than could be explained by changes in the composition of the test-taking population.
11 Education did not attract the
level of interest from policymakers or the public that it did in earlier or later decades. Anecdotally, the counterculture and various educational fads, such as the “open classroom,” were having a negative influence on the ability of schools to educate students.
12
The federal policy focus was almost exclusively on funding and rules — for example, paying for programs for specific populations, monitoring to make sure that federal dollars were being spent on exactly the right students, and
A Byte at the Apple
44 45
Getting FERPA Right: Encouraging Data Use While Protecting Student Privacy
statistics about student performance levels in a given grade and year. Comparisons of the performance of last year’s third graders and this year’s fourth graders approximated a measure of average student growth only if student mobility was low. These databases were even less helpful in following students across levels — elementary, middle, high school, and higher education — or in tracking student transfers in order to produce better measures of dropout rates. The enactment of the No Child Left Behind Act in early 2002, with its requirement of reporting test score data disaggregated by student characteristics, greatly accelerated the development of statewide longitudinal data systems. That was because accurate disaggregation of students depends on having such a system.
18 Congress’s appropriation of funds to provide grants to states to
develop longitudinal student information systems also helped to accelerate the development of these systems. As of 2007, 27 states had received Statewide Longitudinal Data System (SLDS) grants, and every state was working on developing such a system.
19 In that year, four states reported having all of the
“ten essential elements” of a robust longitudinal data system described by the Data Quality Campaign, giving those states the ability to follow students across enrollment, demographic, program participation, state test, course completion, dropout, graduation, college readiness test, and college enrollment databases.
20
These systems were facilitated by the revolution in electronic data collection storage, transfer, and analytic capabilities. The creation of the internet, the lower cost of computers that can handle large data sets, and the increasing user-friendliness of database management and statistical software have made the collection of data by states and the use of the data by third-party analysts much easier and less costly. The expansion of internet-accessible computer databases has increasingly transformed the student privacy issue into one of computer security: protecting student records from identity theft and the ability of malicious individuals to steal poorly protected data. For example, one federal report stated that over a nine-month period in 2005, 93 documented breaches of computer security occurred involving personal information from education records such as Social Security numbers (SSNs), credit card information, and dates of birth.
21
Almost half of these breaches occurred in colleges and universities. 22
Since there is no legal reporting requirement for data security violations, the total number of such breaches may have been greater. In addition, every news
of data on race- and income-based achievement gaps from the National Assessment of Educational Progress (NAEP) helped to focus policy leaders on the adverse implications of failing to educate poor and minority students. Since the 1980s, the emphasis has increasingly shifted from the amount of resources to whether those resources are making a difference. Other developments influenced the supply of education information and how that information is stored and analyzed. In 1994, the Improving America’s Schools Act introduced federal standards-based testing requirements, and several states went beyond the federal requirements for standards-based testing in the 1990s.
15 Around the same time, a number of states began producing
“school report cards” with student test results. The increasing collection and publication of school performance information in the 1980s and 1990s was, in part, based on a realization that it is difficult to sustain an effort to improve performance if there are large costs to doing so while actual performance is hidden from view. At the same time, the expansion of magnet programs, open enrollment, charter schools, and other “school choice” arrangements has made school performance information more valuable both to parents choosing schools and to the policymakers seeking to evaluate those reforms. The issue of consumer and public information on school performance was notably absent from the original FERPA policy discussion.
16 Policymakers have also become more
interested in keeping up with the performance of highly mobile students and of students as they cross institutional boundaries, such as between K-12 and higher education. In addition, the expansion of online education and of dual credit programs means that students are more likely to be enrolled in multiple educational institutions at once. From the point of view of this discussion, the most important change was the development by states of longitudinal student data systems with the ability to follow students over time and across multiple databases. The first statewide student information systems were created in Delaware in 1985, Texas in 1990, and Florida in 1992. By 2001, seven states (Arkansas, Delaware, Florida, Louisiana, Minnesota, Mississippi, and Texas) could match student-level test and enrollment records over time. Many other states acquired student-level test data, but could not match test records for the same students across different grades and years.
17 These
non-longitudinal datasets were mainly useful for reporting “snapshot”
A Byte at the Apple
46 47
Getting FERPA Right: Encouraging Data Use While Protecting Student Privacy
Statewide longitudinal student databases can serve the role of large 1. epidemiological databases in medicine — making it possible to look for patterns in large numbers of individuals over time and predict what is likely to happen to students if certain actions are or are not taken.
27
The availability of statewide data increases analysts’ ability to address questions such as:
To what extent do students who are academically prepared ��when they leave elementary school remain “on track” in middle and high school?
To what extent do students catch up later if they leave elementary ��school poorly prepared?
What variables are most closely associated with the odds that a ��student will drop out?
How are student course-taking patterns and course grades related ��to success on college readiness exams and the need for remediation in college?
How well does the workplace reward different student achievement ��levels and educational degrees and certifications, and how is that changing over time?
28
How does the answer to each of these questions vary across ��student populations in different schools, districts, and regions in the state?
Statewide longitudinal student databases can be used to widen the search 2. for the most effective schools, teachers, programs, and policies — making it possible to learn systematically from “What Works.” As educators and policymakers pursue information on what is working well and where, they will want to know answers to questions such as:
Are your local schools as effective as the best in the state serving ��similar student populations?
How good are the charter schools in your community, and how do ��charter schools compare with traditional public schools in your community and statewide?
report of a privacy breach occurring in another industry — whether missing Veterans Administration laptops or stolen credit card records — accentuates these concerns. In 1974, breaches of privacy mainly consisted of school district officials voluntarily or carelessly releasing information contained in paper files, and the law’s emphasis was on schools and districts having policies in place to prevent such releases. The creation of large government databases of any kind was a concern among privacy advocates in 1974.
23 At the time, however, these
concerns were more about misuse of the information by government officials, not theft of records by outside individuals.
24
In addition, the increased public reporting of school results since NCLB has led to concerns that individual student results might inadvertently be “leaked” in these reports. For example, reporting the test passing rate of all 50 students in a grade and of the 49 white students would make it possible to identify whether the remaining one African American student passed or failed the test. This has led to policies of masking (not reporting) results for “small cells” (small student groups) in public reports.
25 While these
small student groups do indeed need to be removed from public reports, many behind-the-scenes data investigations require their inclusion in the underlying analysis.
26
5. Opportunities Created by Statewide Longitudinal Student Data Systems
The creation of statewide longitudinal data systems has multiplied the opportunities to address questions of importance to educators, parents, and policymakers. The fact that the databases are longitudinal means that they can be used to address questions about student growth; school, teacher, or program effectiveness; and whether students are “on track” to later success. Getting clear answers to these questions into the hands of educators — while helping them understand what those answers imply in terms of taking action and changing adult behavior — is critical for the goal of improving schools. The fact that the databases are statewide means that they can answer questions that are far better addressed with records on as many students and schools as possible. The questions that these databases can help address may be organized into two main categories as follows:
A Byte at the Apple
48 49
Getting FERPA Right: Encouraging Data Use While Protecting Student Privacy
for the Kids began releasing school reports on the web comparing achievement in each Texas public school with that in the highest performing schools in the state serving equally or more disadvantaged student populations. Though the statistics in these reports were aggregate data and did not reveal individual student information, they were built from longitudinally-matched individual student data. Examples of these longitudinal statistics include “the percent of students meeting academic growth benchmarks,” “the percent of below passing eighth grade students who later met college readiness benchmarks in high school,” and “the proficiency rate of students who were continuously enrolled in the same school for three years or more.” A handful of state education agencies have joined the effort to promote the use of third-party research for school improvement. Most notable among those is the Florida Department of Education (FLDOE), which provides on request a list of key areas where research and analysis are needed to improve student learning in Florida’s schools. FLDOE invites outside third parties to submit proposals for investigations in these areas using Florida’s statewide longitudinal student database.
33 The agency also works with researchers and analysts who
propose investigations of other topics. Kansas has developed a partnership with the state’s two largest universities and the Kansas Board of Regents to promote research using student data. North Carolina and Texas have set up state-sponsored education research centers to take advantage of the availability of student data in those two states, and Arkansas has shared its data with researchers at the University of Arkansas. These efforts have been viewed by their respective states as complying with state and federal privacy laws and fully addressing the need to safeguard the privacy of student records. However, concerns about federal interpretation of privacy law may be why similar efforts are not happening in more states, despite the fact that a few less timid states have been leading the way.
34
6. Statewide Longitudinal Student Data Systems and Federal Privacy Law
In general, federal privacy law has placed few barriers in the way of teachers and other school and school system personnel using data on their own students and hiring private contractors to help them with those efforts.
35 However,
barriers to the analysis and use of statewide longitudinal data by third parties threaten to hamper the search for answers to questions such as those in the previous section. Here is where getting FERPA (and privacy rights in general) right is most likely to make a difference.
Are some schools especially good at catching up academically ��behind students? Are these different from the schools that do the best job with academically advanced students?
Which schools and programs work best for English language ��learners and other at-risk student groups?
Which types of preschool interventions produce the best results ��for students in elementary school, and in general, which interventions lead to the greatest student success in the next higher level of education?
How often is school improvement in one subject accomplished at ��the expense of performance in other subjects?
What will it take to double the percentage of low-income students ��reaching college and career readiness benchmarks?
How well are the state’s teacher preparation programs ��preparing teachers?
29
What will it take to attract highly effective teachers to the high-��poverty schools in your community and region?
These questions and many others like them have three things in common. First, they cannot be answered well without longitudinal student data. In many cases, this means the use of confidential student data to which FERPA applies.
30 Second, they are best answered by gathering information from as
many schools and school systems as possible: hence the advantage of accessing statewide student databases, not just the data from a single school or district. Third, involving third-party data analysts is likely to greatly accelerate the rate at which these questions are addressed.
31
Efforts to bring outside resources to bear on research questions using statewide data began shortly after the first statewide longitudinal databases were developed. In 1992, Harvard economics professor John F. Kain established the Texas Schools Project (TSP) to take advantage of Texas’ statewide data. TSP began studying the achievement of minority students in residentially integrated suburban school districts, and moved on to address issues such as teacher quality, teacher incentives, and charter school effectiveness.
32
The longitudinal Texas data were also used to identify effective schools and design innovative school reports. In late 1998, the nonprofit organization Just
A Byte at the Apple
50 51
Getting FERPA Right: Encouraging Data Use While Protecting Student Privacy
Thus it should be understood as a separate type of “person acting for such agency or institution” with the authority to make independent decisions, including the ability to conclude its own agreements with third-party data analysts. This interpretation would move the state education agency to the left side of the disclosure barrier in Figure 1, and provide a “yes” answer to the question above.
37
A second opportunity for analysis of statewide data can arise when states establish formal procedures in state law and/or regulation for outside analysts to be authorized to assist the state education agency in carrying out its responsibility to evaluate teacher, school, and program effectiveness in the state. This is the basis on which the U.S. Department of Education’s Family Policy Compliance Office has given a green light to the three education research centers established under Texas law.
38
B. Can a system be established for approving the use of statewide data for analyses that state education agencies may not want?
There are obvious reasons why state agencies or local school districts should not be expected, much less required, to sponsor and control all longitudinal education data analysis. Consider, for example, an assessment of whether the state agency and local school districts are counting dropouts correctly. States and school systems may be reluctant to commission studies that are likely to find major flaws in their own practices. Similarly, a risk-averse or politically sensitive state agency may have no desire to approve data analyses that are likely to produce results unpopular with influential constituencies. Rather than having to say “no” to the political hot potatoes, the agency might choose the easier path of not approving any third-party data analysis at all — perhaps citing privacy issues as the reason. Or agency leaders might truly believe that the privacy risks of releasing data to third parties almost always outweigh any potential benefits from analyzing the data. State law might provide an alternative channel, such as a research review board, for approving data analytic projects. The board would need to have the status under state law or regulation as a “person acting on behalf of educational agencies or institutions” or an “authorized representative in connection with
To illustrate what we mean by “getting FERPA right,” in this section we set out four questions that a sound student privacy policy would answer in the affirmative.
A. Can third-party analysts obtain statewide longitudinal data for studies or evaluations directly from the state education agency, without having to get the permission of each individual school district and charter school?
The FERPA regulations proposed in March 2008 authorize studies initiated by third-party researchers or data analysts using confidential student data “for, or on behalf of, educational agencies or institutions,” without the prior consent of students or their parents, if the analysts conclude an agreement with the educational agency or institution that is the source of the data.
36
This could be interpreted as meaning that, in a state with 1,000 school districts and hundreds of charter schools, data analysts must conclude a separate agreement with each of these entities for each analytic project in order to gain access to statewide data. The legal argument for this position holds that state education agencies have traditionally not been defined as “educational agencies or institutions,” nor are they clearly defined in statute or regulations as “person(s) acting for such agency or institution,” since they neither directly educate students nor are voluntarily hired as contractors by the agencies that do. Nor do they operate under the direct control of local education agencies. Therefore, when school districts send student data to a state-managed longitudinal data system, this represents a disclosure to a third-party entity outside the local educational agency or institution. Under FERPA, so the argument goes, such third parties lack the independent authority to make further redisclosures to other third parties without written parental consent. Only if an agreement was concluded between the researchers and each school district whose data is provided in the study, as proposed in the March 2008 draft regulations, would such an arrangement be FERPA compliant. According to this line of reasoning, therefore, the answer to the question above would be “no.” The contrary argument holds that the legal responsibility of a state education agency is, in effect, to “act for” the state’s school districts and charter schools, even though it is not a contractor and is not controlled by the school districts.
A Byte at the Apple
52 53
Getting FERPA Right: Encouraging Data Use While Protecting Student Privacy
If state education agencies can provide data to third parties for the purpose of evaluation or analysis, then other state agencies should be able to qualify as third parties as long as they sign an appropriate interagency agreement. However, to qualify for a FERPA data-sharing exception to parental consent, analyses conducted by those other agencies must be intended to “improve instruction” or “evaluate Federally-supported education programs.” Thus it is not clear that an analysis addressing practices that improve a student’s educational outcomes indirectly would qualify. In addition, if the study is strictly to improve the agencies’ own services, without any anticipated impact on the students’ educational success, such a study would clearly not qualify for a FERPA data-sharing exception. Federal privacy law may need to be amended so that third-party studies intended to improve students’ educational outcomes, but not necessarily through the mechanism of improving instruction or evaluating educational programs, qualify for a FERPA exception to parental consent. Alternatively, “education programs” in this context might be defined broadly to include any program that is likely to affect educational outcomes.
7. Weighing Privacy Risks Against Data Analysis Benefits
Even if each of the four questions above is answered affirmatively by federal policy, state privacy laws in some states impose restrictions beyond those established by the federal law. For example, as of fall 2007, four states — Connecticut, Ohio, New Hampshire, and Wisconsin — forbade sharing of student records between K-12 and higher education institutions.
42 Ohio prohibits reporting of student
names or social security numbers to the state education agency. 43
Unless state policies are also open to the use of data, states can use privacy laws or pure risk aversion to avoid sharing data. For balanced policies to become the norm, it is necessary not only to get federal privacy policy right, but also to establish the right policy climate in each state. States, after all, are the keepers of the data. As we saw in Section 5, only a handful of states have adopted policies that allow or encourage third-party analysis with statewide longitudinal student data. This could imply that policymakers in most states assign greater weight to the risks of data analysis than to its benefits.
the evaluation of Federally-supported education programs” but with the independent ability to approve studies. A memorandum of agreement would need to exist between the review board and the state agency operating the longitudinal data system, providing for the release of data by the state agency to the research organization if the project is approved by the review board. Such an arrangement might provide political cover for state agencies not wishing to approve studies directly.
C. Can state early childhood, K-12, and higher education agencies combine the data possessed by each of these agencies into a single database for joint research and analysis purposes?
If the state happens to structure multiple levels of its education system under the control of a single education agency, as Florida does,
39 the answer to
this question for the data managed by that agency is an unambiguous “yes.” But where the agencies are separate, ambiguity arises. Consider the students currently in K-12 — does the higher education agency have a “legitimate educational interest” in them, even though they are not currently enrolled in any of the state’s higher education institutions and some may never enroll? As for the students in higher education, many are former participants of the state’s K-12 system, but others are not. None (except for dual enrollment students) are currently enrolled in K-12. Does the state education agency have a legitimate educational interest in those students?
40
As former Massachusetts Commissioner of Education David Driscoll pointed out in a letter to U.S. Secretary of Education Margaret Spellings, the answer to a question such as this should not depend on the accident of how a state configures its education agencies. A state should be able to combine the data from its preschool, K-12, and higher education agencies into a single database for research and analysis purposes.
41
D. May non-education state agencies, such as employment or social service agencies, obtain longitudinal student data in order to improve their own services to students or former students?
A Byte at the Apple
54 55
Getting FERPA Right: Encouraging Data Use While Protecting Student Privacy
The culture and folklore of education emphasize the special talents ��of individual teachers over accumulated research and professional knowledge as a source of teacher effectiveness. In medicine, we usually think of the effectiveness of doctors as mainly due to accumulated medical research and professional knowledge acquired through training and experience, rather than to individual doctors having “the right stuff” or the inborn personal talent of a great doctor. Yet in education, our culture tends to think of teacher ability as an inborn talent or “magic spark” whose expression is as likely as not to be hindered by encouraging teachers to follow research-based practices.
The relative shortage of independent education data analysis may ��have adversely affected policymakers’ and the public’s perception of the value and credibility of education data. When much of the data story is “spun” by school district officials, when the public hears about “teaching to the test” and manipulations of dropout rates, and when there is little independent information or transparency about what is actually going on, much of the public comes to mistrust education data and to heed the voices in education that say that educational measures and indicators don’t carry much meaning.
Powerful interest groups in education are not comfortable with the ��transparency that widespread third-party data analysis could bring. State and federal accountability systems have made many educators uncomfortable by taking away some of their control over the story on how their educational institutions are performing. Yet the limited information and analysis provided in most accountability systems leaves plenty of room to avoid transparency. For example, most such systems do not provide clear answers to the questions posed in Section 5. Third-party data analysis, coupled with investigations into educational practices, could make school systems more transparent.
Strategies to help policymakers find an appropriate balance between privacy risk and data analysis benefits must take these issues into account. Some of these strategies are discussed in the following section.
8. Promoting Data Analysis and Use While Protecting Privacy
Below are recommendations aimed at encouraging the use of data to improve education outcomes, organized under four headings: 1) making the
Reasons why policymakers may see the risks of data analysis as greater than the benefits include:
Policymakers and the broader public are more easily motivated by fear ��than by lost opportunity. Privacy issues are easily framed in terms of fear. Research in economics and psychology has documented the human tendency to “loss avoidance” — to giving greater weight to possible losses than to potential gains.
44 Similar research has
documented that human beings do a poor job of weighing the risk of relatively infrequent but salient events.
45
Privacy violations have clearly defined victims, whereas the beneficiaries ��of research and data analysis are a large and ill-defined group. Breaches of privacy and thefts of student records happen to specific individuals, whereas it is harder to identify the beneficiaries of a piece of analysis that contributes, for example, to the overall understanding of teaching mathematics. Public officials face clear political consequences when individuals suffer losses of which they are readily made aware, but are likely to receive fewer political benefits when the advantages of a policy are spread out over many individuals who do not know that they have benefited.
46
Because other types of databases are frequent targets of identity thieves, ��policymakers may overestimate the privacy risk from databases created for education data analysis. Statewide databases created for research and analysis can be made more secure and less target-rich (i.e., with statistics less useful to identity thieves) than is the average database maintained by a school district or college.
47
The benefits from education data analysis are little understood by ��policymakers and the public. Education research and data analysis lack the dramatic examples that medical research has of diseases cured and lives saved. In addition, because the widespread use of data by teachers and school administrators is relatively new, and analysis using statewide longitudinal data has simply not been available in the past, educational practitioners themselves are just beginning to learn of the benefits of data analysis and use. Some educators’ complaints about data (“too much testing”) may have been more loudly heard than testimonials from other educators about the benefits of data.
A Byte at the Apple
56 57
Getting FERPA Right: Encouraging Data Use While Protecting Student Privacy
Implement a system of data security audits that are applied to every a. repository of statewide student data and on a spot-check basis to the databases maintained by local education agencies.
Delete key variables that are useful to identity thieves from b. databases provided to outside analysts. These variables, such as student names and social security numbers, are important for the state agency itself to collect in order to match records correctly across multiple databases. But once the matching is done, an appropriate alternative student identifier may be attached to each student record and the social security number deleted from the data supplied to third-party analysts. This makes the research databases the state creates relatively useless as targets for identity thieves.
Strengthen and expand analysis using longitudinal statewide and cross-state 3. student databases. To encourage third-party data analysis, not just allow it, state and federal policy and private philanthropy can do the following:
Continue to fund the development of statewide longitudinal a. student data systems with the ten essential elements recommended by the Data Quality Campaign.
48
Increase state, federal, and private funding to promote data analysis b. using statewide and multistate longitudinal student databases.
49
As a bolder policy, establish a multistate or national repository c. of student data combining the contents of the longitudinal data systems of multiple states. This might be done with the support of private philanthropy if the federal government finds it too politically difficult to sponsor such a repository.
50
Help policymakers, educators, and the attentive public see the benefits of 4. analysis using longitudinal student data.
For policymakers and other audiences to keep the benefits of analysis using longitudinal data in mind, they must be continually reminded of these benefits. This can be done if data analysts, funders, and advocates do the following:
necessary interpretations of or amendments to privacy law; 2) taking steps to reassure the public that privacy risks are being minimized; 3) strengthening and expanding analysis using longitudinal student databases; and 4) helping policymakers see the benefits of this analysis.
Make necessary interpretations or amendments to privacy law.1. To ensure that federal laws and regulations do not pose an unreasonable barrier to data analysis conducted with adequate attention to the protection of student privacy, make sure that federal privacy policy provides a “yes” answer to the four questions in Section 6, whether through regulatory interpretation or statutory amendments. Where necessary, state privacy laws should also be made consistent with these requirements. To summarize, regulation and/or legislation should clarify that:
State education agencies can conclude agreements with and a. provide confidential student data directly to third-party analysts without having to receive local school district approval of the planned analysis.
States may establish additional entities, such as education research b. centers or education research review boards, with the same authority as the state education agency to approve third-party data analysis projects.
States may establish a comprehensive longitudinal research c. database spanning all levels of the education system (early childhood, K-12, and higher education), which can be accessed for analysis intended to evaluate programs and improve instruction and student outcomes at any or all of these levels.
State employment and social service agencies may gain access to d. confidential student data under the same conditions as other third-party analysts.
Take steps to reassure the public that privacy risks are being minimized.2. To provide assurance that reasonable precautions are being taken to reduce privacy risks, state agency officials can:

A Byte at the Apple
58 59
Getting FERPA Right: Encouraging Data Use While Protecting Student Privacy
Bibliography
Buckley, James. Joint Statement in Explanation of the Buckley/Pell Amendment.
Congressional Record — Senate. Vol. 120, December 13, 1974.
Buckley, James. Address to the Legislative Conference of the National Congress
of Parents and Teachers, March 12, 1975. Congressional Record, Volume 121, S7974,
May 13, 1975.
Copperman, Paul. The Literacy Hoax. New York: Morrow Quill, 1980.
Dougherty, Chrys. “States Must Improve Data for Adequate Yearly Progress,”
Education Assessment Insider, August, 2002.
Driscoll, David. Letter to Margaret Spellings, Secretary of Education.
August 30, 2007. http://www.dataqualitycampaign.org/files/Publications-Driscoll_
FERPA_letter_to_Spellings-080107%20final.pdf
Finn, Chester. We Must Take Charge: Our Schools and Our Future. New York: Free
Press, 1992.
— — — . Troublemaker: A Personal History of School Reform since Sputnik.
Princeton, N.J.: Princeton UP, 2008.
Hansen, William D. Key Policy Letter Signed by the Education Secretary.
January 20, 2003. http://www.ed.gov/print/policy/gen/guid/secletter/030130.html
Kahneman, Daniel, Jack L. Knetsch, and Richard H. Thaler. “Anomalies:
The Endowment Effect, Loss Aversion, and Status Quo Bias.” Journal of Economic
Perspectives 5:1, 1991.
“Legislative History of Major FERPA Provisions.” U.S. Department of Education,
2002. http://www.ed.gov/policy/gen/guid/fpco/ferpa/leg-history.html
Lerner, Barbara. “Good News about American Education.” Commentary,
March, 1991.
Remind policymakers and their staffs, educators, and other a. audiences of questions that cannot be answered well without longitudinal student data. This should include questions that have come from these audiences.
Encourage states to publish data tables derived from the analysis b. of longitudinal student data (e.g., achievement and academic growth statistics disaggregated by the students’ prior academic performance; test scores disaggregated by the prior school the student attended; longitudinal graduation rates; and higher education enrollment and success rates tied back to students’ high school). These statistics can help make educators and the public aware of what can be done with the data.
Present examples of progress that has been made in answering c. important questions using statewide longitudinal student data. Describe the decisions that allowed the data analysis to happen. Discuss the implications of the analysis for policy and educational practice, keeping the language accessible to non-technical policymakers, educators, and other laypersons.
Work with educational practitioners to help them use the d. knowledge generated by the data analysis. Where possible, document where this knowledge was used to improve outcomes for students. Work with school and school system leaders to bring these examples in front of policymakers.
In conclusion, any use of data entails some small incremental risk of a breach of student privacy. If the sole goal were to minimize privacy risk, there would be no use of data at all. On the other hand, the risk from the appropriate use of data for third-party analysis can be held to a minimum, while the potential benefits from such uses of data are large. While working to protect students’ privacy rights, policymakers must keep in mind the value of appropriately used data to answer important questions about student progress, teacher quality, and school effectiveness — to help students and schools get better. State and federal privacy law must do its job but must not become an obstacle to improving schools and student learning.
A Byte at the Apple
60 61
Getting FERPA Right: Encouraging Data Use While Protecting Student Privacy
Endnotes
The oversight passes to students when they turn 18. However, as stated in the 1
law and reemphasized in the March 2008 proposed regulations, parents still
have access to the academic records of their dependent over-18 children without
those children’s written permission.
See Buckley, Address to the Legislative Conference. Then, as now, concerns 2
about possible abuses of government databases and potential invasions of
privacy resonated with both the political left and right, with the left being more
concerned about abuses by law enforcement and intelligence agencies and
the right being suspicious of government power in general. Senator Buckley
himself was a member of New York’s Conservative Party and the brother of
famed conservative commentator William F. Buckley, Jr.
In this section “third parties” is used as follows: parents (and students over 18) 3
are the first party, education agencies or institutions and persons acting for
them are the second party, and all others are third parties.
“Applicable programs” are those funded by the U.S. Department of Education 4
(in 1974, the U.S. Office of Education), given that the law is part of the General
Education Provisions Act.
Other groups given access to confidential student records without parental 5
consent include school accrediting organizations and juvenile justice
authorities as permitted by state law, and “in connection with an emergency,
(to) appropriate persons if the knowledge is necessary to protect the health
and safety of the student or other persons.” (In the wake of the Virginia Tech
shootings, proposed regulations released in March 2008 clarify that the U.S.
Department of Education will not second guess the judgment of the educational
institution in making this determination. See Federal Register, March 24, 2008,
p. 15589.)
This diagram is based on the March 2008 proposed regulations, the most recent 6
information available at the time of this writing.
Because the law distinguishes between initial disclosures (allowable without 7
parental consent under FERPA exceptions) and redisclosures (allowable only
with parental consent), one of the roles of FERPA regulations has been to
clarify what is a “disclosure” as compared with a “redisclosure.” For example,
the March 2008 proposed regulations indicate that when students move from
one educational institution to another, having the receiving institution share
Lockwood. J.R. and D.F. McCaffrey. “On the Use of Value-Added
Assessment to Evaluate Teacher Preparation Programs.” Manuscript submitted
for publication, 2007.
Mellor, Lynn, Mary Lummus-Robinson, Veronica Brinson, and Chrys
Dougherty. “Linking Teacher Preparation Programs to Student Achievement in
Texas.” Manuscript submitted for publication, 2008.
Pfeiffer, Jay. Email communication with Chrys Dougherty, March 4, 2008.
Pipho, Chris. “Assessment — High Stakes. Seven Lessons Learned from
Minimum Competency Testing.” Policy Brief, Texas Schools Project. The Education
Commission of the States, 2002. http://www.utdallas.edu/research/tsp/Index.htm
Powell, Arthur G, Eleanor Farrar and David Cohen. The Shopping Mall
High School: Winners and Losers in the Educational Marketplace. Boston:
Houghton-Mifflin, 1985.
Proposed Rules. Federal Register vol. 73, no. 57. U. S. Department of Education,
March 24, 2008.
Rothstein, Richard. The Way We Were? The Myths and Realities of America’s
Student Achievement. New York: Century Foundation Press, 1998.
The Statewide Longitudinal Data System Grant Program. Institute of Education
Sciences, National Center for Education Statistics. U. S. Department
of Education, 2007. http://nces.ed.gov/Programs/SLDS/
Winnick, Steven Y., Scott R. Palmer and Arthur Coleman. “State Longitudinal
Data Systems and Student Privacy Protections under the Family Educational
Rights and Privacy Act.” 2006. http://www.hklaw.com/content/whitepapers/
StateLongitudinalsDataSystems2.pdf
A Byte at the Apple
62 63
Getting FERPA Right: Encouraging Data Use While Protecting Student Privacy
Wobegon effects,” with students in all states or districts performing above
average, and were not tied to standards for student performance or academic
growth. See Finn, We Must Take Charge.
Since FERPA was an amendment to the General Education Provisions Act 16
offered on the floor of the Senate and there were no committee hearings, there
is little 1974 legislative history on the bill (U.S. Department of Education, 2002).
See Buckley, Joint Statement.
For example, California began statewide testing in grades 2-11 in 1998, but could 17
not match scores for third grade test-takers with the following year’s scores for
fourth graders.
In the absence of a statewide student information system, disaggregation of 18
data by income and ethnicity as required by NCLB often had to depend on
students or teachers filling in the information on test answer sheets, resulting in
notoriously unreliable data. See Dougherty, “States Must Improve.”
See Statewide Longitudinal Data System Grant Program. A total of $115 19
million has been awarded for these grants. The post-1974 period has also
seen the creation of nationwide student databases outside state agencies, such
as the National Student Clearinghouse’s database of college enrollment and
graduation records collected in order to help colleges verify student eligibility for
financial aid.
For information on the ten essential elements and on states’ development of 20
longitudinal data systems with those elements, see www.dataqualitycampaign.
org and Aimee Guidera’s chapter in this book. The Data Quality Campaign
was funded by the Gates Foundation after a number of persons associated with
the National Center for Educational Achievement and other organizations,
including the author, spoke and wrote in favor of making the development of
these systems an important public policy priority.
Office of Inspector General, 2006.21
Office of Inspector General, 2006.22
Privacy fears about government databases have led to restrictions on some 23
states’ ability to maintain student records: for example, Pennsylvania was
prohibited from having student records until recently, and Ohio is prohibited
by law from sharing the state’s K-12 student ID with other agencies, including
the state’s higher education institutions. The same concerns have blocked the
creation of federal student-level databases, such as the one recently proposed for
higher education.
information with the sending institution for purpose of records verification is not
a “redisclosure” and therefore is permissible without written parental consent.
Given the widespread concern — ssome might say paranoia — about the creation 8
of government databases, such an idea might well have been viewed more as a
threat than as an opportunity had it been proposed in 1974.
For example, if state education agencies or charter school authorizing 9
organizations are regarded as “educational agenc(ies) or institution(s)” or
“persons acting for such agency or institution,” then they have the same status
as school districts under the law and move to the left side of the disclosure
barrier in Figure 1. If, on the other hand, they are third-party recipients of
student records, then they cannot redisclose those records to other third parties
without the consent of parents or of the school districts that are viewed as the
primary custodian of the records. See Winnick, Palmer, and Coleman, “State
Longitudinal Data Systems.”
The revised FERPA regulations proposed in March 2008 clarified that a 10
contractor hired by an educational agency or institution, operating under the
direction of the educational agency and performing functions that would
otherwise be done by agency employees, could send the data to another
education agency or a third party on behalf of the agency or institution
employing the contractor. In other words, the educational agency approves the
release, but the contractor does the actual data transfer. Such a transfer is not
treated as a redisclosure.
See Rothstein, 11 The Way We Were? pp. 58-68.
For extensive anecdotal evidence of this from the state of California, see 12
Copperman, The Literacy Hoax. Copperman’s evidence was taken from before
the passage of Proposition 13, so it had nothing to do with how schools were
funded, but rather with how they were managed and with the prevailing student
ethos of the time.
See Lerner, “Good News.” The first minimum competency testing laws were 13
passed in four states in 1975 (Pipho 2002).
See Powell, Farrar, and Cohen , 14 The Shopping Mall High School. The “shopping
mall high school” describing high schools that deliver a strong curriculum to
the students who want it and a weak curriculum to the poorly prepared and to
students wishing to coast through high school with minimum effort.
Norm-referenced testing was required for Title I programs beginning in the 15
1960s, but these testing programs as implemented were vulnerable to “Lake
A Byte at the Apple
64 65
Getting FERPA Right: Encouraging Data Use While Protecting Student Privacy
student-level longitudinal data so that FERPA no longer applies entails
removing not only student names, but also information on individual students
or small groups of students with combinations of characteristics that might
make those students “readily identifiable” by members of their local community
if the data were made public. This removal of data on students in “small cells”
often creates datasets with too many missing records, especially when the
student’s school and grade level are part of the record. Because small cells are
created by unique combinations of variables, they multiply exponentially with
the number of pieces of information collected on each individual student, and
multiply further when multiple datasets are combined. Also, students who
are different from others in their grade or school tend to end up in small cells.
Thus, removing “small cells” to de-identify data tends to limit research to data
sets with a) not much information on each student; b) little information on
characteristics that might make some students unusual; and c) little matching
of students across multiple data sets.
Many state education agencies have had difficulty getting funding for enough 31
staff to develop and maintain their longitudinal data systems, let alone
conduct multiple investigations, data-mining, and research exercises into
what can be learned from all of those data. Small staffs are also unlikely to be
able to implement all of the ideas that they and others can devise. Finally, the
advantages of having multiple groups and individuals working with different
approaches on a variety of educational problems should be apparent. (It is worth
noting that an inquisitive school district research and program evaluation staff
has the status of a “third party” with regard to statewide data on students in
other school systems.)
See 32 www.utdallas.edu/research/tsp/Index.htm. In addition, an early example
of an organization that worked with a single school district was the Consortium
on Chicago School Research, organized in 1990, that conducted analysis of
longitudinal student data from the Chicago Public Schools.
These areas include effective ways of training teachers, research on teacher 33
effectiveness, effects of retention and promotion policies, performance of
charter schools, and the relationship between earlier academic performance and
student success in higher grades, college, and the workforce. See Pfeiffer, Email
communication.
Section 7 of this chapter discusses why timidity over small privacy risks can 34
overwhelm the benefits of data analysis in some policymakers’ minds.
See Buckley, Address to the Legislative Conference pp. 13990-1.24
In general, records for enough students must be masked in order to prevent the 25
reader from calculating the results for individual students or very small groups
using published data. In the example above, the passing rate for both whites
and African Americans would need to be masked. It should be noted that small
cell rules need to be applied to the denominator but not to numerator in these
passing percentages. For example, if one African American student out of 50
African Americans failed the test, the number need not be masked — how can
one know which student out of 50 failed? If, however, all 50 either passed or
failed, reporting a 100 percent passing or failing rate does in fact convey the
results for each tested student.
See the discussion in footnote 30 below.26
A well-known example of a longitudinal medical database used for research 27
was the database created for the Framingham Heart Study, which originally
consisted of 5,209 men and women between the ages of 30 and 62 from
the town of Framingham, MA. ( http://www.framingham.com/heart/).
In education, the U.S. Department of Education has created a number of
student-level longitudinal databases, including the well-known High School
and Beyond (HS&B), National Education Longitudinal Study (NELS), and
Early Childhood Longitudinal Surveys (ECLS) cohort data sets. These contain
confidential data subject to FERPA but have been made available to researchers
under license agreements, a successful example of addressing privacy concerns
while maintaining the ability of third parties to access the data. Each of these
federally maintained data sets contains information on a national sample of
students — but possibly few or no students from a particular school or school
system — while the state databases discussed here contain records on all of the
students enrolled in a state’s public schools.
This question requires matching data from the state employment agency with 28
state education data.
The issues involved in addressing this question are discussed in Mellor et al., 29
“Linking Teacher Preparation” and Lockwood and McCaffrey, “One the Use of
Value-Added Assessment.”
Some research projects use “de-identified” student-level data from which all 30
information has been removed that could be used to identify an individual
student or small group of students. These data sets are not subject to FERPA
restrictions on confidential student data. However, completely de-identifying
A Byte at the Apple
66 67
Getting FERPA Right: Encouraging Data Use While Protecting Student Privacy
Ohio Revised Code, Title 33, Section 3301.0714, paragraph (D)(1). See 43 http://
codes.ohio.gov/orc/3301.0714. In Ohio, students are assigned student IDs,
called “data verification codes” out of sensitivity to the idea of having a student
identifier. This assignment is performed by local school districts or regional
technology centers contracting with school districts. Having IDs assigned by
local or regional entities increases the odds of different students being assigned
the same ID or of students being assigned new IDs when they cross district
boundaries, producing errors in longitudinal student data. It also creates greater
difficulties in merging in data from outside sources, such as SAT, ACT, or AP
scores, employment data, or the already forbidden higher education data.
See Kahneman, Knetsch, and Thaler , “Anomolies.” This is why the benefits to 44
school improvement have often been more effectively framed in the policy world
as protecting students from bad outcomes such as academic failure and low
wages. No Child Left Behind was presented in that way when it was enacted in
2002. On the other hand, failure-avoidance in education can lead to an undue
emphasis on minimum standards.
To remind people of the small size of the privacy risks, organizations that use 45
student data must be willing to document and emphasize the safeguards they
have put in place to protect student privacy, and any evidence they have of the
small size of the risks to privacy that are created by the databases that they
maintain. For example, research databases may have suffered relatively few of
the privacy breaches that have affected student databases maintained for other
purposes.
Another way of saying this is that costs and risks are easy to picture, whereas the 46
possible benefits of something one has never had before are often nebulous and
hard to estimate. See Finn, Troublemaker p. 76.
For example, social security numbers (SSNs) can be used as a match key to help 47
identify which student a record belongs to, but then a different identifier for
that student can be assigned to the record (and the SSN removed) before placing
the record in the research database. The Florida Department of Education is an
example of an agency that follows this practice. These non-SSN student identifiers
and other educational variables such as test scores and free and reduced price
lunch indicators are of little use to identity thieves, as those pieces of information
are not used by lending institutions to verify individuals’ identities.
See Aimee Guidera’s chapter in this volume for a description of the ten 48
essential elements.
Up until spring 2008, there were questions about whether a contractor could 35
transfer student records on behalf of an educational agency or institution to a
second educational institution (e.g., if the student transfers and the contractor
is managing the “sending” education agency’s data system). That was clarified
as being permissible under FERPA in the proposed regulations released for
comment in March 2008, which stated that the contractor, as a “person acting
on behalf of an education agency or institution,” could disclose records on the
agency’s behalf. See footnote 8.
Previously the agency had interpreted the “for, or on behalf of, educational 36
agencies or institutions” language to mean that the educational agency or
institution had to control the study.
See Winnick, Palmer and Coleman, “State Longitudinal Data Systems.”37
The Family Policy Compliance Office (FPCO) is the federal office that oversees 38
FERPA compliance, interpretation, and enforcement. According to the March
2008 proposed regulations, state law or regulations govern the circumstances
under which outside analysts may be given this authorization, as FERPA is
silent on the issue. The one restriction is that the state agency still exercises
oversight and control over who can access the data and is responsible for the
maintenance of student confidentiality.
Although Florida combines the management of K-12 and higher education 39
under a single agency, Head Start and private early childhood programs remain
under separate management.
The new regulations seek to clarify that educational agencies or institutions 40
have a right to records on former students without written parent or student
consent — receiving these records will not count as a “disclosure” — but that is
described as applying mainly for verifying the identity of former students, and
at any rate does not apply to higher education students who never attended the
state’s public K-12 institutions.
See Driscoll, Letter to Margaret Spellings p. 3. Given the May 2008 letter from 41
FPCO approving the educational research centers in Texas, similar centers in
other states established under state law and supervised by the state education
agency should be able under these guidelines to combine data from multiple
agencies even if the governance of the agencies is separate.
The source is the fall 2007 Data Quality Campaign annual survey. See 42 http://
www.dataqualitycampaign.org/files/element9_survey_responses.pdf
A Byte at the Apple
68 69
A modest amount of federal funding for that purpose is currently provided 49
to the Center for the Analysis of Longitudinal Data in Education Research
(CALDER), a collaborative of researchers at the Urban Institute, Duke
University, Stanford University, the University of Florida, the University of
Missouri-Columbia, the University of Texas at Dallas, and the University of
Washington.
A precedent for this has been the creation of the SchoolDataDirect database 50
funded by the Gates Foundation. As of fall 2008 this database contained no
student data and held few statistics built from longitudinal student data, but that
could change in the future.
70 71
Federalism and the Politics of Data Use
Federalism and the Politics of Data Use
Kenneth K. Wong
Kenneth K. Wong is department chair and director of the
Urban Education Policy Program at Brown University
In his opening remarks at a national research conference on charter schools in fall 2006, Mark Schneider, the Commissioner of the National Center for Education Statistics, stated that federalism is his biggest challenge when it comes to building a more coherent system of
data collection and reporting at the national level. Commissioner Schneider then went on to describe the variations among the 50 states in measuring academic proficiency, tracking school and student progress, and meeting federal reporting requirements. At the same time, state commissioners of education and legislatures are just as frustrated with what they consider to be federal intrusion in state affairs. An example is Virginia, where the state board of education has repeatedly challenged the federal testing and reporting requirements that are associated with the No Child Left Behind Act. Clearly, the U.S. Department of Education does not have the capacity or the authority of a national ministry of education in a nationalized public education system. The Institute for Education Sciences (IES), which includes the National Center for Education Statistics, is the core unit within the U.S. Department of Education with a focus on data collection, evaluation, and research. The entire IES employs a total of about 200 professionals. The federal government relies
on state governments to gather, analyze, and report most of the data that pertain to the conditions and performance of public schools across the nation. Data policy is further complicated by interest-based politics within each level of government. Increasingly, data are used to drive governmental decisions. Consequently, competing interests are engaging in data gathering, analysis, and reporting with the objective of influencing governmental activities. As discussed later in this chapter, among the competing interests are consumers and providers of data as well as governmental actors and agencies. Political disagreements arise not only within each level of the government but also between levels of government. In the pages ahead, I will propose a conceptual framework for how politics shapes data policy and practice in public education. The chapter then provides examples of four different political scenarios. The chapter concludes by examining several options to promote better data policies and practices.
Proposing a Framework for the Politics of Data
The phrase “education data” suggests technical and methodological issues, not political ones, but politics is a prominent factor in shaping data policy. In contemporary policymaking in Western democracies, data have become a necessary condition for advancing legitimate claims. In education, a variety of data is gathered and used for setting policy priorities, arbitrating disagreements, and measuring the effectiveness of publicly-funded programs and agencies. At the state and district level, for example, superintendents of schools are hired and fired based in part on data measuring management and academic performance. This chapter focuses on the use of data at the federal, state, and district levels. I will examine the roles played by the executive and legislative branches of the government, but not court decisions. Also, I will not address the politics of data use at the school and classroom levels. The key question I examine in this chapter is: How does politics affect data policy and practices? I argue that data policy is jointly shaped by the purpose of the data activity and the alignment of competing political interests. As Table 1 shows, data policy and practices can be broadly seen as serving two purposes. First, data are used for meeting statutory and administrative requirements. State and local agencies are required to submit annual reports to the federal government in response to mandates on civil rights, safety, and
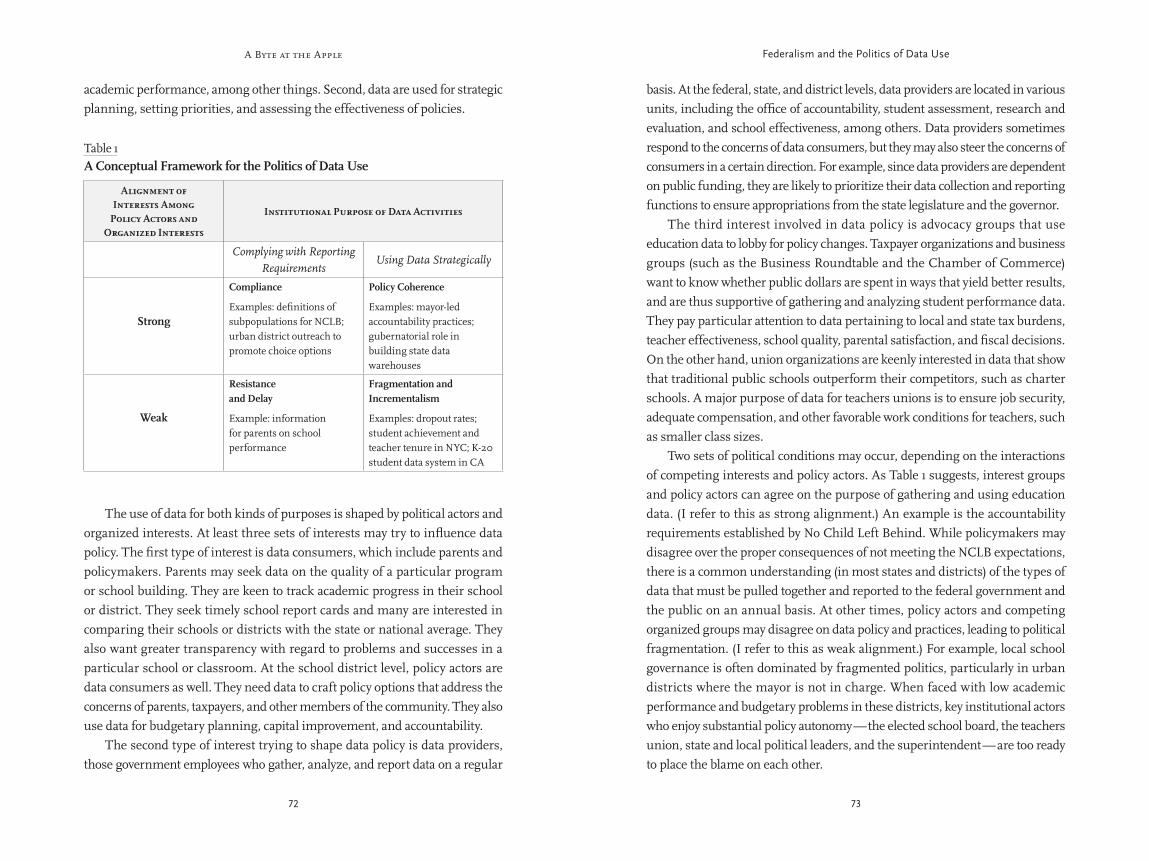
A Byte at the Apple
72 73
Federalism and the Politics of Data Use
basis. At the federal, state, and district levels, data providers are located in various units, including the office of accountability, student assessment, research and evaluation, and school effectiveness, among others. Data providers sometimes respond to the concerns of data consumers, but they may also steer the concerns of consumers in a certain direction. For example, since data providers are dependent on public funding, they are likely to prioritize their data collection and reporting functions to ensure appropriations from the state legislature and the governor. The third interest involved in data policy is advocacy groups that use education data to lobby for policy changes. Taxpayer organizations and business groups (such as the Business Roundtable and the Chamber of Commerce) want to know whether public dollars are spent in ways that yield better results, and are thus supportive of gathering and analyzing student performance data. They pay particular attention to data pertaining to local and state tax burdens, teacher effectiveness, school quality, parental satisfaction, and fiscal decisions. On the other hand, union organizations are keenly interested in data that show that traditional public schools outperform their competitors, such as charter schools. A major purpose of data for teachers unions is to ensure job security, adequate compensation, and other favorable work conditions for teachers, such as smaller class sizes. Two sets of political conditions may occur, depending on the interactions of competing interests and policy actors. As Table 1 suggests, interest groups and policy actors can agree on the purpose of gathering and using education data. (I refer to this as strong alignment.) An example is the accountability requirements established by No Child Left Behind. While policymakers may disagree over the proper consequences of not meeting the NCLB expectations, there is a common understanding (in most states and districts) of the types of data that must be pulled together and reported to the federal government and the public on an annual basis. At other times, policy actors and competing organized groups may disagree on data policy and practices, leading to political fragmentation. (I refer to this as weak alignment.) For example, local school governance is often dominated by fragmented politics, particularly in urban districts where the mayor is not in charge. When faced with low academic performance and budgetary problems in these districts, key institutional actors who enjoy substantial policy autonomy — the elected school board, the teachers union, state and local political leaders, and the superintendent — are too ready to place the blame on each other.
academic performance, among other things. Second, data are used for strategic planning, setting priorities, and assessing the effectiveness of policies.
The use of data for both kinds of purposes is shaped by political actors and organized interests. At least three sets of interests may try to influence data policy. The first type of interest is data consumers, which include parents and policymakers. Parents may seek data on the quality of a particular program or school building. They are keen to track academic progress in their school or district. They seek timely school report cards and many are interested in comparing their schools or districts with the state or national average. They also want greater transparency with regard to problems and successes in a particular school or classroom. At the school district level, policy actors are data consumers as well. They need data to craft policy options that address the concerns of parents, taxpayers, and other members of the community. They also use data for budgetary planning, capital improvement, and accountability. The second type of interest trying to shape data policy is data providers, those government employees who gather, analyze, and report data on a regular
Table 1A Conceptual Framework for the Politics of Data Use
Alignment of Interests Among
Policy Actors and Organized Interests
Institutional Purpose of Data Activities
Complying with Reporting Requirements
Using Data Strategically
Strong
Compliance
Examples: definitions of subpopulations for NCLB; urban district outreach to promote choice options
Policy Coherence
Examples: mayor-led accountability practices; gubernatorial role in building state data warehouses
Weak
Resistance and Delay
Example: information for parents on school performance
Fragmentation and Incrementalism
Examples: dropout rates; student achievement and teacher tenure in NYC; K-20 student data system in CA
A Byte at the Apple
74 75
Federalism and the Politics of Data Use
found in the annual Digest of Education Statistics issued by the U.S. Department of Education. In the most recent report, there were 367 districts that did not submit enrollment information to the federal government.
1 And the number
of districts that did not submit enrollment information has remained more or less the same since the late 1970s. Even though 367 districts constitute a small fraction of the total number of districts nationwide, the fact that these districts simply do not report data to the federal government tells us something about the nature of federalism.
Weak Political Alignment Generates Resistance When political actors at different levels of government are not in agreement, it is unlikely that data reporting requirements will be met. A recent example of this can be found in the limited implementation of the school choice provisions of NCLB. In this case, the interests in conflict are those of parents and those of the school district office. NCLB requires school districts to distribute information on school performance to parents of students at certain low-performing schools; students in these schools are eligible to move to a higher performing public school or a charter school. But many school districts have been reluctant to report the information to parents as required by law. During 2002-03, only 18,000 students in low-performing schools exercised the option of moving to a higher performing school, though over 5 million students were eligible. In 2004-05, the number of students switching to better public schools increased to 48,000, as the federal government began to monitor whether school districts were providing the required information to eligible parents and students.
2
Given the lack of interest in complying with the law in many school districts, particularly in districts facing enrollment declines, it remains unclear if the choice provision in NCLB can be fully implemented across districts and states.
Political Alignment Facilitates Data Compliance When policy actors and organized interests are ready to work toward a set of shared goals, tension over data compliance becomes manageable. The federal government has been willing to compromise in response to several state and local concerns about specific provisions of NCLB, and this has brought about greater compliance with reporting requirements. Beginning in 2003 and 2004, as more schools and districts were being identified as “in need of improvement” based on their failure to meet Adequate Yearly Progress (AYP) targets, the
The two sets of institutional conditions, namely the purpose of data activities and the alignment of political actors, combine to generate four different types of data policy, as shown in the four cells of Table 1. When political actors are in agreement (strong alignment), it is likely to promote two types of data policy, depending on the purpose of the data activity. Where clear political agreement exists and data are needed to meet a government mandate, policy stakeholders are likely to make sure that data are gathered, analyzed, and reported in order to comply with the requirement. When it comes to the second function of data, the use of data for strategic purposes, political actors who are in agreement are likely to achieve policy coherence by creating incentives for the strategic use of data or by supporting a clear process to seek data-driven solutions. In contrast, when political interests are in disagreement (weak alignment), data policy and practices exhibit two other distinct patterns. When data are needed to meet statutory or administrative requirements, weakly aligned political actors are likely to generate organizational resistance to the request for data. Any requirements that data be reported are likely to be met with incremental efforts to meet a minimally acceptable level of expectations. Weak political alignment is also likely to impede the second type of data use (strategic efforts to use data). Political fragmentation perpetuates interest-based calculations for political gain at the expense of longer term strategic priorities. What follows is a more substantive discussion of each of these four patterns of activity.
Compliance with Governmental Mandates
Federalism allows substantial autonomy at the state and district levels, but this often means that federal agencies (as well as policy researchers, school reformers, the public, and the media) often encounter difficulties in gaining access to accurate education data in a timely manner from states and school districts. School districts are independent entities that are mostly governed by independently elected school boards, financed by their own fiscal authority, and managed in ways that are often constrained by collective bargaining agreements. Each of the 14,200 school districts in the U.S. has its own governing culture and bureaucratic inertia. Federally mandated reporting is often seen by districts as an insufficiently funded activity, draining away staffing resources from other service delivery activities. There is great variation in the way districts respond to governmental mandates that data be reported. One surprising example of local autonomy is
A Byte at the Apple
76 77
Federalism and the Politics of Data Use
the services and how to select a provider, all schools with eligible students are required to host open houses for parents and providers, and advertisements and flyers have been used to promote the availability of free tutoring services.
5 As a
result, over 75,000 students registered for Supplementary Education Services with more than 40 service providers at 300 school sites during 2005-06. The alignment of federal and local interests, in other words, has facilitated a higher degree of local compliance with reporting requirements.
How Political Fragmentation Hurts Data Policy and Practice
Reporting data in order to comply with requirements is a relatively straightforward use of data. The second function of data is its use for strategic planning, setting priorities, and assessing the effectiveness of policies. Collaboration is necessary to use data in these ways. Unfortunately, interest-based politics provides insufficient incentives for collaboration. At each level of government, agency rivalries, leadership instability, and the political inertia of organizational maintenance lead to data use that is incremental rather than strategic.
Organizational Silos Since information is a key source of influence, governmental agencies tend to insulate their own data collection and reporting functions, even when they duplicate similar efforts in other agencies. The more specialized and unique the data, the less likely the agency will be to build connections to other data systems. With very few exceptions, data sharing remains limited between state boards of higher education and state commissioners of elementary and secondary education, for instance. Further, bureaucracies, like other social institutions, have a primary goal of maintaining themselves. Too often, school bureaucracies consider data transparency to be a threat to their control. In education, the data gathering and reporting entities are almost always the same as the operating agencies that deliver the services in the first place, leading to the possibility of data manipulation. An example is the various ways that districts and states define and track their dropout and graduation rates. For example, New Mexico defines its graduation rate as the percentage of 12th graders who graduate, which does not take into consideration students who dropped out earlier in high school.
6
Until recently, in Rhode Island, the graduation rate included all graduating
U.S. Department of Education negotiated with states and made adjustments. 3
Among the first policy changes was an adjustment to the rules covering the inclusion of two subgroups, students with disabilities and English language learners, in state accountability systems. There were objections from some state and local actors to holding all students with disabilities to grade-level standards and to expecting English language learners to achieve proficiency in English quickly. States were finding that schools with large numbers of students in these two subgroups were more likely to fail to meet AYP targets than schools without students in these subgroups, and some of the best schools were being identified as needing improvement based on the performance of students in the two subgroups. Compromises have also been made in the implementation of the Supplementary Educational Services (SES) provisions of NCLB, where negotiations between the federal government and several school districts have overcome obstacles that might have interfered with data use. Under NCLB, students in certain low-performing schools can receive free tutoring services provided by school districts and outside providers. However, school districts that themselves fail to meet AYP are not eligible to offer the extra learning services to their students; in these districts, only outside providers can offer the tutoring. Not surprisingly, many urban districts have been reluctant to offer information to parents about supplementary services provided by outside groups. Only 5 percent of school districts used up the funds that had been set aside to pay for supplemental services during 2005 – 06.
4 Faced with low levels of compliance with the SES
notification requirements, the federal government launched a pilot program that allows certain low-performing districts to offer supplemental educational services in return for making stronger efforts to raise parental awareness of and student participation in those services. Under the pilot agreement, participating districts must provide parents with early notification that supplementary services are available, and then must report on notification procedures, program participation rates, and attendance to the U.S. Department of Education. This agreement has led urban districts to become increasingly willing to disseminate information to parents about supplementary services. In Chicago, for example, many steps have been taken to boost participation. Parents have been notified early that their children could be eligible to receive free tutoring, the district distributed to parents a handbook explaining how to register for
A Byte at the Apple
78 79
Federalism and the Politics of Data Use
they’re helping students learn. We cannot afford to restrict the city’s ability to set high standards.”
9 In the end, both the Democratic-controlled Assembly and the
Republican-controlled Senate voted to preclude local districts from setting their own standards on teacher performance, standards which may have included student test scores.
10 The New York State United Teachers was successful in its
lobbying effort to preserve the status quo. 11
The New York case illustrates the difference between agenda setting and the process of searching for policy options. Political scientist John Kingdon argues that agenda setting can be “quite discontinuous and nonincremental…” but “incrementalism might still characterize the generation of alternatives.”
12 In other words, the politics of reform may push policymakers to pay attention to controversial proposals such as using student learning as the basis for evaluating teachers. However, organized interests and existing operational practices tend to restrict the range of options that are deemed politically acceptable. Efforts to improve data systems, too, are often constrained by existing institutional arrangements and practices, so these reforms tend to take on an incremental character. In a seminal article, political scientist Charles Lindblom argued that governmental decisions are not entirely a result of rational consideration. Instead, policymakers tend to rely on what they already have and then make modest adjustments.
13 Since decision makers are not likely to have complete
information and tend to be influenced by their previous practices, analysts have found incrementalism in public budgeting and other policy arenas for decades.
14
Education is no exception to this rule, and the case of California (detailed in the chapter in this volume by RiShawn Biddle) illustrates this phenomenon well. In a recent report that examines the challenge of building a K-20 student data system in California, the Rand Corporation pointed to the fragmentary nature of the seven major student information systems that are either in operation or in development in California. As the Rand researchers observed, each governance entity “has developed its own politics and administrative practices and all have developed strong separate culture and identities as well as a protective mindset.”
15 As a result, they recommended an incremental
approach toward changing their data systems over the next five years. 16
Political Alignment and the Strategic Use of Data
When political interests converge around the strategic use of data, the data system can become an analytical tool for policy evaluation. Data can be used to
seniors, regardless of the number of years they spent in high school, and did not count “unknown departures” of students from the system.
7 The
challenges of data under-reporting and data exaggeration are not unique to student performance. Similar problems exist in the use of school funds, special education classification, and other management issues.
Institutional Instability Agency rivalry is not the only factor interfering with the strategic use of data. Federal appropriations to support data use are often the victim of instability and fragmentation at the U.S. Department of Education, which can create cycles of uncertainty about the research role of the federal government. The institutions involved with federal education research from the 1960s to the 1990s have gone through what education historian Carl Kaestle has described as “a merry-go-round” process of endless rounds of reorganization.
8 Each
reorganization disrupts the ongoing relationship between the agency and the research infrastructure, including data collection efforts. Partisan changes in Congress and the White House also tend to destabilize appropriations for research since the policy priorities change. While reliable data collection requires long-term, persistent effort, shifting leadership at the federal level often frustrates such long-term investment in many districts and states.
Inertia of the Status Quo Decisions about what kind of information to gather and how to collect the data are shaped by the distribution of power in a specific context. Policymakers are constrained by existing institutional norms, procedures, and regulations in defining the scope of options. Powerful stakeholders, such as unions, may hinder new practices of data reporting. When unions benefit from an existing set of practices, they may not want to support greater transparency, which may create challenges to the established power structure. In April 2008, New York state lawmakers considered a proposal that would have allowed local districts the option of examining student performance on standardized tests when awarding tenure to teachers. New York City Mayor Michael Bloomberg has been a strong advocate for basing teacher promotions on student performance. As the mayor’s legislative staff observed, “To make sure kids have the best possible teachers, we need to look at all available data. Teachers should be accurately evaluated with information about how well
A Byte at the Apple
80 81
Federalism and the Politics of Data Use
that incorporated all ten elements: Arkansas, Delaware, Florida, and Utah. 21
In some of the states with the most robust systems, the governor’s office has played a critical role. In Delaware, two-term Democratic Governor Thomas Carper successfully pushed the elements of a comprehensive education accountability plan through the state legislature between 1993 and 2000. A key feature of Governor Carper’s reform was to link individual student test scores to teachers. The 2000 reform made student achievement “count for at least 20 percent of the performance reviews given to teachers, administrators, and other instructional staff members.”
22 Governor Carper’s successor, Governor Ruth
Ann Minner, has continued to advocate for using student achievement to hold teachers accountable.
23
In Florida, Governor Jeb Bush and the legislature launched the A-Plus education accountability reform in 1999. The plan was designed to end social promotion, reduce class size, and expand preschool programs. The accountability system required annual testing of students in math and reading in grades three through eight, thereby allowing the state and districts to assess individual student performance gains from grade to grade.
24 In his state-of-the-
state address during his 2002 re-election campaign, the governor advocated for greater scrutiny of student performance data and stronger state intervention in low-performing schools.
25 Since 2002, the Florida Education Data Warehouse
has allowed policymakers and researchers to conduct longitudinal analyses at the student level.
26 The Warehouse pulls data from multiple sources and is
maintained by six full-time programmers. Strategic use of data can also be facilitated by a convergence of political and research interests. A good example of such a strategic alignment is Project STAR (Student Teacher Achievement Ratio), a statewide randomized experiment on class-size reduction that was implemented in Tennessee from 1985 until 1990. The project was supported by an unusual coalition.
27 Among
the key players was Democratic lawmaker Steve Cobb, an influential chair of the Ways and Means Committee in the Tennessee House of Representatives, who supported Republican Governor Lamar Alexander’s comprehensive education reform plan in 1984. Cobb was also a formally trained sociologist who valued rigorous program evaluation. Cobb was joined by Helen Pate Bain, a former president of the National Education Association and a strong advocate for class-size reduction. The collaborative effort also included researchers from each of the four major public and private higher education institutions in the
uncover the underlying causes of educational problems, to form the basis for new policy initiatives, and to ensure that accountability policies are working properly. Political leadership at the city or state level has been the key to getting interests aligned behind data use in two promising examples: (1) mayors in several urban districts who are starting to do for education data what they have already done for data on crime and government operations, and (2) governors who are pushing for longitudinal student data systems. Several big city mayors are beginning to use data to foster policy coherence for the city as a whole. During the late 1970s and the 1980s as well as the early 2000s, when cities faced severe fiscal stress, mayors began to adopt a new governing culture, sometimes characterized as the New Fiscal Culture (NFC).
17
NFC-oriented mayors tend to focus on management efficiency and emphasize “quality of life” issues, and to move away from policies defined by traditional party labels and organized interest groups.
18 In reforming the management of agencies,
NFC-oriented mayors try to contract out, focus on management efficiency, and introduce outcome measures for periodic evaluation. These changes tend to overlap with the policy vision of civic-spirited business leaders and the taxpaying electorate. The quality of life issues are often defined in terms of the city’s physical environment, parks and recreation, and public education. In an extension of this New Fiscal Culture, mayors who lead school systems are likely to apply accountability and fiscal discipline to the schools in both formal and informal ways, and these often involve the use of data. They recruit administrators to improve the district’s student performance data reporting, human resource information, and financial management systems.
19 By sharing
financial, management and auditing expertise with the school system, city hall can improve capital projects, balance the budget, and even improve union-management negotiations. School districts run by mayors are able to achieve financial solvency, often turning a deficit into a balanced budget. In New York and Chicago, for example, bond ratings have improved since mayors have taken control of the schools. A second example of the alignment of political forces behind the strategic use of data can be seen in states where governors are leading efforts to build longitudinal data systems. Today, nearly all states are building or have built these data systems. The Data Quality Campaign, a nongovernmental organization, has identified ten necessary elements for a “robust longitudinal data system.”
20 A 2007 survey found that four states maintained a data system
A Byte at the Apple
82 83
Federalism and the Politics of Data Use
students in subgroups smaller than 100, Pennsylvania has a lower threshold of 40 students for each subgroup. Definitional variations like these mean that a school’s test scores may be counted as making AYP in one state but not another state. Given these discrepancies and the likely cost savings that would come with a single system, one might argue for a stronger federal role in standardizing data that pertains to accountability.
Expanding State Leadership As discussed earlier, state policy actors and organized interests can collaborate on data work to address strategic purposes. Project STAR in Tennessee, and the good work of several states whose longitudinal databases have met most of the criteria set forth by the Data Quality Campaign, are good examples. Where governors take the lead and sustain their commitments, robust data systems can be created and maintained. State political leaders may be willing to spend their political capital on data work for several reasons. First, state action preempts federal micromanaging of data issues. Second, states can make sure that data are used to support their policy priorities. Third, the process of building and maintaining a statewide data system will promote collaboration between the state and school districts. Finally, state-led data policy is consistent with the current governance arrangement in our federal system, where states have constitutional authority over education.
Cultivating Public-Private Partnerships One likely future scenario may involve both public and private investment in education data. As states and districts face periodic budget cuts for K-12 education, the focus will be on making sure that basic data are gathered and reported for mandated purposes, and the strategic use of data may suffer. Additional support from private foundations and other sources to support the Data Quality Campaign and other similar efforts can strength the analytic capacity around state data systems. Florida has pursued an innovative strategy of engaging the private sector to support its education data system. Access to education data is used as an incentive to get private companies involved. In response to Florida’s Request for Proposals (RFP), 13 companies submitted bids to help the state in creating the Education Data Warehouse (EDW). The EDW was designed to be a repository for a collection of longitudinal data from different policy arenas, including K-20
state, thereby ensuring support from the postsecondary sector. The coalition overcame the natural tendency toward disagreement between leaders of the two political parties, union and management, public and private higher education interests, and policy reformers and researchers. Consequently, the Tennessee legislature appropriated $12 million to hire the extra teachers needed to reduce class size for a four-year period to support the experiment. As the longest running randomized field trial in education, Project STAR provided Tennessee lawmakers with clear evidence on the benefits of smaller class size in the early grades and in rural schools.
Implications for the Future of Data Policy and Practice
The use of data in education will continue to be shaped by political alignment and the functions of those data. Clearly, there is a need to build broad-based coalitions at all levels of the federal system to improve the quality of data systems so that they can be used to address the most challenging education problems. At issue are the necessary political conditions that foster the strategic use of education data. This concluding section will explore several options for the future of data policy. One option is to take a centralized approach, with the federal government serving as the primary agent for data collection, verification, and reporting. A second option is to leave data policy to the states, but with the expectation that all states will ultimately meet the criteria of a robust data system as defined by the Data Quality Campaign. A third option is to involve quasi-governmental or nonprofit entities in data work. Such an arrangement may foster public-private partnerships in the long run.
Federalizing Data on Accountability The current climate of education accountability has created an interest among policy actors and the public in comparing student achievement across districts and states. However, 50 states have generated 50 systems of standards and accountability, a fact that makes comparisons across state lines extremely difficult. Analyses using performance on the National Assessment of Educational Progress (NAEP) as a yardstick have revealed large discrepancies between scores on state-designed tests and scores on the NAEP, which means that states are setting the bar for proficiency at very different levels. States also use different threshold levels for counting the scores of various subgroups of students toward AYP calculations. While California discounts the scores of
A Byte at the Apple
84 85
Federalism and the Politics of Data Use
Chicago Consortium on School Research (CCSR) that includes all the key stakeholders in governmental agencies, higher education institutions, and advocacy groups in Chicago school reform. For two decades, the CCSR has organized a comprehensive, longitudinal student-level database for assessing key policy challenges, including standards for academic promotion, breaking up large high schools, the effectiveness of local school councils, and the implementation of district-wide curriculum standards. Several of the CCSR recommendations have been adopted by the Chicago Public Schools. While non-governmental research organizations may gain cooperation from state and local officials in data collection for evaluation purposes, governmental oversight remains necessary to guard against potential conflicts of interest. Most importantly, designers of education intervention programs should not be the sole source in conducting their own evaluations or influencing governmental decisions affecting the conduct of the evaluation. The credibility of evaluations must be validated through a refereed process. It is an ongoing challenge to get political interests aligned to support data needs. My brief summary of Project STAR in Tennessee suggests that it can be done, but managing to get all the interests aligned remains somewhat rare. There is the old saying, “good government is good politics.” In the current accountability climate, elected officials need to champion a new set of norms that “good data are good politics.” In crime prevention policy, for example, mayors are using CompStat or similar data information systems to collect, process, and act upon data measuring criminal activity in targeted neighborhoods very quickly. The electorate has rewarded those mayors who are able to use crime statistics to combat the problem. As the public continues to support stronger accountability and greater transparency in education, political leaders will find it electorally rewarding to use data for strategic purposes as well.
education, welfare, corrections, employment, and others. The EDW began with an initial state investment of $7 million for gathering and organizing student and staffing data for K-20. Through the RFP process, the private sector was encouraged to develop new applications for the database; in return a company would gain access to K-20 education data without having to spend resources to gather them. The incentive of instant data access seemed to work. The state’s final decision was between two major companies, IBM and Microsoft. The latter was chosen because of the breadth of technical services, licenses, tools and applications it offered to teachers, schools, and policymakers.
28 For the last four
years, Microsoft has enhanced the capacity of the Education Data Warehouse at no financial cost to the state of Florida.
29 With Microsoft’s help, the state now stores data on student demographics, enrollment, courses, achievement test scores, financial aid, and employment. It also stores data on staff demographics, certifications, instructional activities, curriculum, and education institutions. Through the efforts of the public-private partnership, the Education Data Warehouse has recently been connected to the Florida Education and Training Placement Information Program (FETPIP) to form the Integrated Education Data Systems (IEDS). The FETPIP provides follow-up information on students and trainees who have graduated or completed the training programs. The IEDS can address both short-term and long-term strategic concerns about education and the work force. In short, Florida has gone beyond the ten elements of a robust data system by linking to postsecondary and labor force activities. Externally funded, independent research teams can also add value to the process of data analysis and reporting.
30 Non-governmental research
organizations, networks, and companies have track records of research activities that meet professional standards, and they tend to focus on policy effectiveness rather than on regulatory compliance. Many examples of independent research organizations that analyze and otherwise add value to education data can be cited. The Hoover Institution’s Koret Task Force has conducted comprehensive assessments of education reform in Arkansas, Texas and Florida. Each of the state reports critically examines the conditions of education in that state and offers specific recommendations for improving standards and curriculum, assessments, and accountability, the organization of school districts, choice and charter schools, and teachers (including certifying and preparing teachers, rewarding effectiveness, and building a solid teacher workforce in the future). Another example is the
A Byte at the Apple
86 87
Federalism and the Politics of Data Use
Lindblom, Charles. “The Science of Muddling Through.” 13 Public
Administration Review 14, Spring 1959.
Wildavsky, Aaron. 14 The Politics of the Budgetary Process. 3rd Ed. Boston:
Little Brown, 1979.
Vernez, Georges , Cathy Krop, Mirka Vuolla, and Janet Hansen. 15
“Toward a K-20 Student Unit Record Data System for California.”
Rand Corporation, 2008.
Vernez, Georges et al.16
Clark, Terry N. and Vincent Hoffman-Martinot. 17 The New Political Culture.
Boulder: Westview, 1998.
Wong, Kenneth, Pushpam Jain, and Terry Clark. “Mayoral Leadership in 18
the 1990s: Fiscally Responsible and Outcome Oriented.” Paper presented at
the 1997 Annual Conference of Association for Public Policy Analysis and
Management, Washington DC.
Wong, Kenneth, Francis Shen, Dorothea Anagnostopoulos, and Stacey 19
Rutledge. The Education Mayor: Improving America’s Schools. Washington DC:
Georgetown University Press, 2007.
Information from Data Quality Campaign was retrieved from 20 http://www.
dataqualitycampaign.org/survey_results/index.cfm?&print=Y on April 15, 2008.
Information from Data Quality Campaign was retrieved from 21
http://www.dataqualitycampaign.org/survey_results/state_of_nation.cfm
on April 15, 2008.
Sack, Joetta. “Del. Ties School Job Reviews to Student Tests.” 22 Education Week,
May 3, 2000.
Johnston, Robert. “Math Specialists Sought for Del. Middle Schools.” 23 Education
Week, February 2, 2005.
Dillon, Sam. “As 2 Bushes Try to Fix Schools, Tools Differ.” 24 New York Times,
September 28, 2006.
Richard, Richard. “Bush Wants More Teeth in Accountability Law.” 25
Education Week, January 30, 2002.
“Florida Case Study: Building a Student-Level Longitudinal Data System.” Data 26
Quality Campaign, August 2006.
Ritter, Gary and Robert Boruch. “The Political and Institutional Origins of a 27
Randomized Controlled Trial on Elementary School Class size: Tennessee’s
Project STAR.” Educational Evaluation and Policy Analysis 21 No. 2,
Summer 1999.
Endnotes
“Number and Enrollment of Regular Public School Districts, by Enrollment 1
Size and District-Selected Years, 1979-80 through 2005-06.” Table 84. Digest of
Education Statistics. National Center for Education Statistics, April 2008.
Hess, Frederick and Chester Finn, eds. 2 Leaving No Child Behind. New York:
Palgrave, 2007. Also National Assessment of Title I – Final Report. U.S.
Department of Education, 2008.
Gail Sunderman, 3 The Unraveling of No Child Left Behind: How Negotiated
Changes Transform the Law. Cambridge, MA: The Civil Rights Project at Harvard
University. 2006.
Spellings, Margaret. “Letter to Chief State School Officers regarding more 4
effective implementation of provisions of the No Child Left Behind Act of 2001
(NCLB) authorizing public school choice and supplemental educational services
(SES).” May 2006. http://www.ed.gov/policy/elsec/guid/secletter/060515.html
According to the Congressional testimony (September 2006) of Erica Harris, 5
manager of academic afterschool programs in Chicago Public Schools.
Dillon, Sam. “U.S. to Require States to Use a Single School Dropout Formula.” 6
The New York Times, April 1, 2008.
Hamilton, William. “R.I. Graduation Rates Dip under New Calculations.” 7
Providence Business News, June 4, 2008.
Kaestle, Carl. “The Awful Reputation of Education Research.” 8 Educational
Researcher 22, Jan.-Feb. 1993. Also Sroufe, Gerald. “Legislative Reform of
Federal Education Research Programs: A Political Annotation of the Education
Sciences Reform Act of 2002.” Peabody Journal of Education Vol. 78, No. 4, 2003.
Medina, Jennifer. “Bill Would Bar Linking Class Test Scores to Tenure.” 9
New York Times, March 18, 2008,.
“New York Lawmakers Vote to Bar Linking Tenure to Students’ Scores.” 10
Education Week, April 16, 2008.
New York is not the only state where there is little support for basing 11
teacher promotions on the learning of their students. Only 12 states today
include student achievement in their teacher evaluations. See Swanson,
Christopher. “Grading the States.” Education Week, January 10, 2008.
http://www.edweek.org/ew/articles/2008/01/10/18sos.h27.html?print=1
Kingdon, John. 12 Agendas, Alternatives, and Public Policies. 2nd Ed.
New York: Longman.
A Byte at the Apple
88
Personal correspondence with Jay Pfeiffer, Deputy Commissioner, 28
Division of Accountability, Research, and Measurement, Florida Department of
Education, August 14, 2008.
“Florida Case Study: Building a Student-Level Longitudinal Data System.” Data 29
Quality Campaign, August 2006.
Paul Hill. “The Politics of Educational Data Collection.” Paper prepared for the 30
National Center for Education Statistics, June 1985.
90 91
Political Roadblocks to Quality Data: The Case of California
In 1997, policymakers in California started building a comprehensive, longitudinal data system that would provide quality education data to politicians, parents, administrators, researchers and activists. Eleven years — and numerous laws, policy statements and blue-ribbon
reports — later, the work remains incomplete. California’s difficulties in developing its data system exemplify the problems faced by other states in pulling together the student-, teacher-, school- and district-level performance data needed to conduct high-quality research and make wise decisions. The state legislature established California School Information Services (CSIS) in 1997 to serve as a statewide repository for student data.
1 The CSIS
system was designed to enable school districts to transfer individual student records electronically to the state using its State Reporting and Record Transfer System (SRRTS) instead of sending reports based on aggregate data. CSIS assigns unique student identifiers and collects basic information such as gender, school lunch (or socioeconomic) status, and grade and course completion information for individual students (with names and other personally identifiable information stripped out). However, CSIS isn’t a truly comprehensive statewide system. Why? State officials never committed to fully funding its rollout. As a result, just 263 of
the state’s 1,058 school districts — representing 60 percent of the state’s public school population — send data to CSIS. And the records that are submitted to CSIS lack some desirable features: student-level records for English language learners (ELL) do not include information about the program or setting in which an ELL student is being taught, for instance. The agency doesn’t collect or store test score data from the array of exams given by the state every year. Finally, it only stores data for seven years. The rest of California’s education data system — from its array of data collections to the test-score information collected by its vendors — isn’t any better. Russlynn Ali, executive director of the California division of the Education Trust, the Washington, D.C. school reform group, declared in a 2007 brief on school data, “California’s education data system barely merits the name: It is a confusing assembly of collection vehicles, aggregated at different levels, reported at different times, housed in a multitude of different databases and only linked manually according to the ever-increasing demands of federal and state reporting.” In March 2008, the Committee on Education Excellence, a panel convened by the state’s governor, Arnold Schwarzenegger, pointed out that the problem isn’t a lack of data. What is lacking, the committee noted, is a systematic effort to “collect, integrate and maintain the array of information available.” In order to remedy the shortcomings of the CSIS system, in 2002 the state legislature voted to create a new state data system, the California Longitudinal Pupil Achievement Data System (CALPADS). The design for CALPADS was not approved until November 2007; it took five years to complete the process of putting together feasibility studies, getting approval from the state department of finance, putting together requests for proposals, and procuring the actual bid. The system is currently scheduled to go online by the beginning of the 2009 – 10 school year. Unfortunately, even when fully realized, CALPADS will be inadequate in many ways. And the problems California has encountered as it has attempted to build CSIS, and now CALPADS, have arisen in other states attempting to develop comprehensive data systems. As this case study reveals, there are three main failings which can emerge as states attempt to build high-quality data systems:
Data systems are too narrowly focused on meeting accountability 1. rules, restricting the array of data included: The systems are created
Political Roadblocks to Quality Data:
The Case of California
RiShawn Biddle
RiShawn Biddle is a journalist and editor of Dropout Nation
A Byte at the Apple
92 93
Political Roadblocks to Quality Data: The Case of California
discipline records, and scores on the battery of achievement tests given by the state every year. Information on whether the student graduated from high school, dropped out, or received a General Education Development or special education certificate will also be collected and stored in the system. Much of this is data which must be collected to comply with the No Child Left Behind Act. Ideally, CALPADS would store an even wider array of student-specific data. Student course grades, for example, won’t be stored in CALPADS — nor will SAT and other college-readiness test scores, individual student attendance records, or information on vocational and special education programs. Essentially, declared Education Trust’s Ali, “A wide gulf lies between what the new data sets should and could tell us and what they will actually have the capacity to do.”
Conflicting needs, dueling priorities
The narrowness of CALPADS’ holdings ref lects the conf lict over whether data systems should focus on collecting and storing data needed for compliance with state and federal laws or whether they should include a wider array of data and organize it in a way that is useful for broader decision making and research. Traditionally, state-level school data systems were developed as key data delivery and compliance points for the U.S. Department of Education and for state policymakers, not as sources of information for school- or district-level managers, much less teachers. This priority has only grown in the past two decades with the passage of No Child Left Behind and accountability measures at the state level. The very efforts to make schools accountable for student academic performance and to improve data quality have, ironically, focused state and local education officials more on compliance than ever, at least when it comes to data. For those administrators charged with monitoring compliance, the primary need is for aggregate student achievement data and the same data disaggregated by NCLB-specified population groups, not longitudinal measures of the performance of individual students. But this traditional emphasis on compliance ignores the needs of other parties with expanding roles in the educational landscape. Although data-driven research and decision making is a fairly new concept in education, it has been widely embraced by policymakers,
only to comply with No Child Left Behind and state accountability requirements. As a result, they don’t contain the wide range of data that can be used by teachers and administrators to effectively shape curricula and instruction — especially for the very socioeconomic groups the accountability laws are supposed to help. And the data collection processes supplying information into the systems “silo” data in ways that are oriented towards monitoring compliance. It’s difficult to reorganize the information so it can be used for research and decision-making.
The systems aren’t fully integrating state and district elementary and 2. secondary school databases: Seamlessly connecting state systems to district-level databases — which hold the underlying files and information — by standardizing technology and processes at all levels is crucial. This integration can also help expand data capacity at the district level. But states aren’t devoting enough technical and financial effort towards this goal.
A lack of cooperation among K-12 and postsecondary agencies 3. and institutions limits the scope of the data: The sprawl of K-12 and higher education agencies (each with their own systems, technologies, data sets, interpretations of student privacy laws, and procedures), the varying quality of data in each system, and their mutual unwillingness to concede ground to the other impedes efforts to tie them together into unified regimes. A lack of unified governance intensifies the disputes.
For policymakers, administrators, advocates, researchers, and parents in other states, the struggles faced by the Golden State in these three areas offer lessons about obstacles that must be overcome.
Failing #1: Narrow Focus, Narrow Purpose, Limited Use
A first step in developing a data system is deciding what information should be collected and for what purpose. California’s experience in the development of the CALPADS system offers some insight into how a narrow focus and purpose can limit a system’s usefulness. CALPADS will store student-specific data including school enrollment, socioeconomic status, whether the student is an English Language Learner,
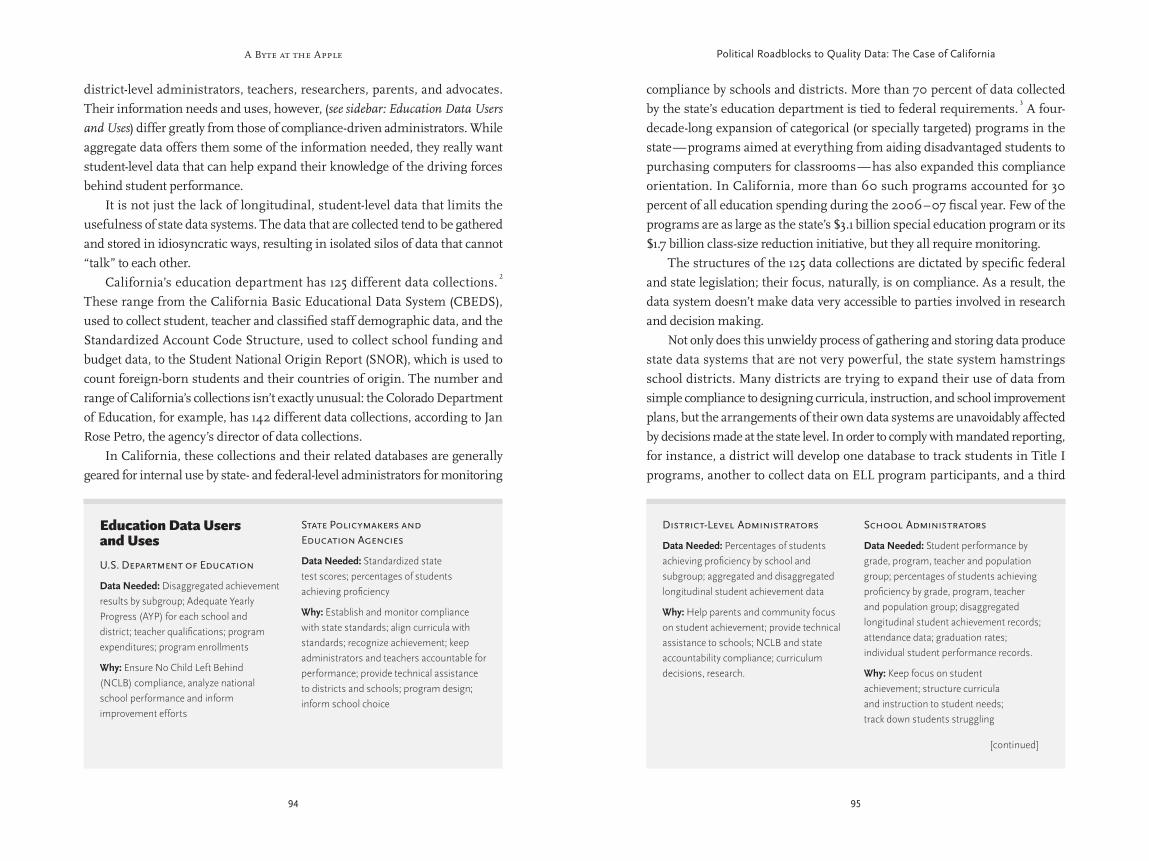
A Byte at the Apple
94 95
Political Roadblocks to Quality Data: The Case of California
compliance by schools and districts. More than 70 percent of data collected by the state’s education department is tied to federal requirements.
3 A four-
decade-long expansion of categorical (or specially targeted) programs in the state — programs aimed at everything from aiding disadvantaged students to purchasing computers for classrooms — has also expanded this compliance orientation. In California, more than 60 such programs accounted for 30 percent of all education spending during the 2006 – 07 fiscal year. Few of the programs are as large as the state’s $3.1 billion special education program or its $1.7 billion class-size reduction initiative, but they all require monitoring. The structures of the 125 data collections are dictated by specific federal and state legislation; their focus, naturally, is on compliance. As a result, the data system doesn’t make data very accessible to parties involved in research and decision making. Not only does this unwieldy process of gathering and storing data produce state data systems that are not very powerful, the state system hamstrings school districts. Many districts are trying to expand their use of data from simple compliance to designing curricula, instruction, and school improvement plans, but the arrangements of their own data systems are unavoidably affected by decisions made at the state level. In order to comply with mandated reporting, for instance, a district will develop one database to track students in Title I programs, another to collect data on ELL program participants, and a third
district-level administrators, teachers, researchers, parents, and advocates. Their information needs and uses, however, (see sidebar: Education Data Users and Uses) differ greatly from those of compliance-driven administrators. While aggregate data offers them some of the information needed, they really want student-level data that can help expand their knowledge of the driving forces behind student performance. It is not just the lack of longitudinal, student-level data that limits the usefulness of state data systems. The data that are collected tend to be gathered and stored in idiosyncratic ways, resulting in isolated silos of data that cannot “talk” to each other. California’s education department has 125 different data collections.
2
These range from the California Basic Educational Data System (CBEDS), used to collect student, teacher and classified staff demographic data, and the Standardized Account Code Structure, used to collect school funding and budget data, to the Student National Origin Report (SNOR), which is used to count foreign-born students and their countries of origin. The number and range of California’s collections isn’t exactly unusual: the Colorado Department of Education, for example, has 142 different data collections, according to Jan Rose Petro, the agency’s director of data collections. In California, these collections and their related databases are generally geared for internal use by state- and federal-level administrators for monitoring
District-Level Administrators
Data Needed: Percentages of students
achieving proficiency by school and
subgroup; aggregated and disaggregated
longitudinal student achievement data
Why: Help parents and community focus
on student achievement; provide technical
assistance to schools; NCLB and state
accountability compliance; curriculum
decisions, research.
School Administrators
Data Needed: Student performance by
grade, program, teacher and population
group; percentages of students achieving
proficiency by grade, program, teacher
and population group; disaggregated
longitudinal student achievement records;
attendance data; graduation rates;
individual student performance records.
Why: Keep focus on student
achievement; structure curricula
and instruction to student needs;
track down students struggling
Education Data Users and Uses
U.S. Department of Education
Data Needed: Disaggregated achievement
results by subgroup; Adequate Yearly
Progress (AYP) for each school and
district; teacher qualifications; program
expenditures; program enrollments
Why: Ensure No Child Left Behind
(NCLB) compliance, analyze national
school performance and inform
improvement efforts
State Policymakers and Education Agencies
Data Needed: Standardized state
test scores; percentages of students
achieving proficiency
Why: Establish and monitor compliance
with state standards; align curricula with
standards; recognize achievement; keep
administrators and teachers accountable for
performance; provide technical assistance
to districts and schools; program design;
inform school choice
[continued]
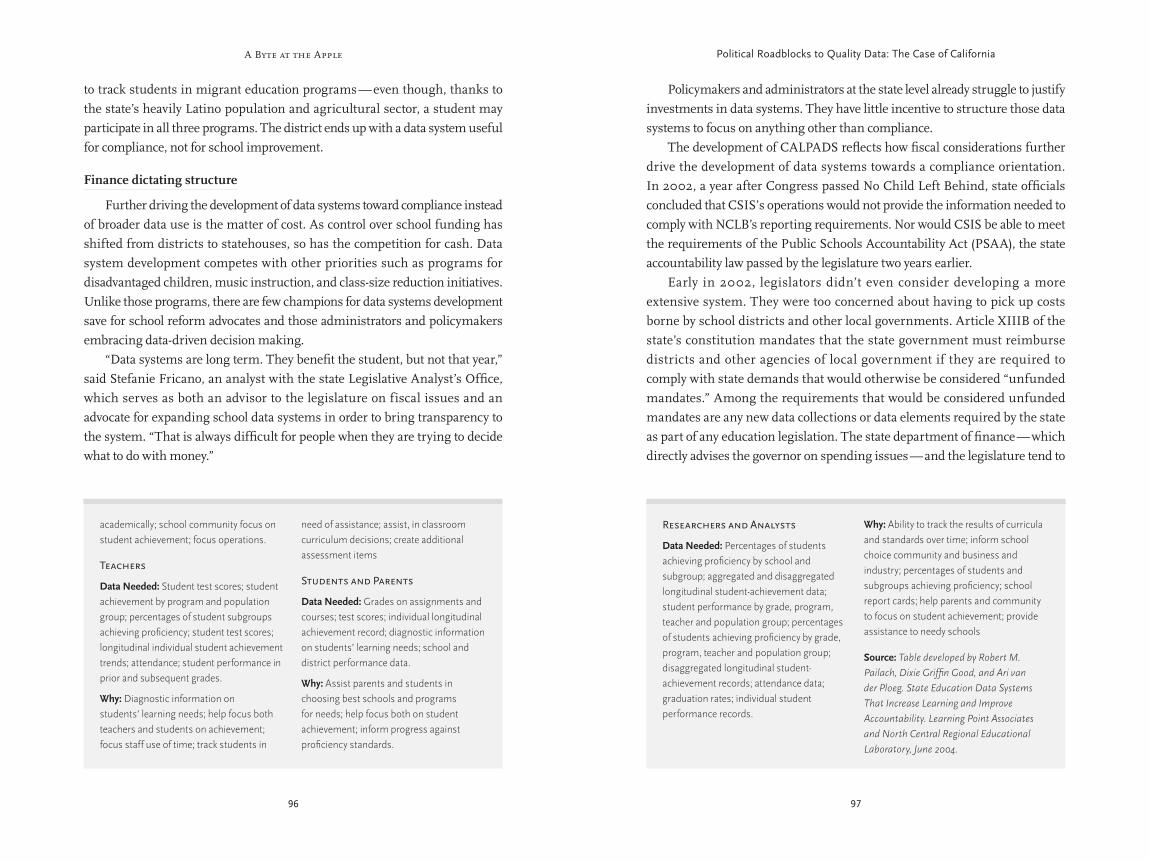
A Byte at the Apple
96 97
Political Roadblocks to Quality Data: The Case of California
Policymakers and administrators at the state level already struggle to justify investments in data systems. They have little incentive to structure those data systems to focus on anything other than compliance. The development of CALPADS reflects how fiscal considerations further drive the development of data systems towards a compliance orientation. In 2002, a year after Congress passed No Child Left Behind, state officials concluded that CSIS’s operations would not provide the information needed to comply with NCLB’s reporting requirements. Nor would CSIS be able to meet the requirements of the Public Schools Accountability Act (PSAA), the state accountability law passed by the legislature two years earlier. Early in 2002, legislators didn’t even consider developing a more extensive system. They were too concerned about having to pick up costs borne by school districts and other local governments. Article XIIIB of the state’s constitution mandates that the state government must reimburse districts and other agencies of local government if they are required to comply with state demands that would otherwise be considered “unfunded mandates.” Among the requirements that would be considered unfunded mandates are any new data collections or data elements required by the state as part of any education legislation. The state department of finance — which directly advises the governor on spending issues — and the legislature tend to
to track students in migrant education programs — even though, thanks to the state’s heavily Latino population and agricultural sector, a student may participate in all three programs. The district ends up with a data system useful for compliance, not for school improvement.
Finance dictating structure
Further driving the development of data systems toward compliance instead of broader data use is the matter of cost. As control over school funding has shifted from districts to statehouses, so has the competition for cash. Data system development competes with other priorities such as programs for disadvantaged children, music instruction, and class-size reduction initiatives. Unlike those programs, there are few champions for data systems development save for school reform advocates and those administrators and policymakers embracing data-driven decision making. “Data systems are long term. They benefit the student, but not that year,” said Stefanie Fricano, an analyst with the state Legislative Analyst’s Office, which serves as both an advisor to the legislature on fiscal issues and an advocate for expanding school data systems in order to bring transparency to the system. “That is always difficult for people when they are trying to decide what to do with money.”
Researchers and Analysts
Data Needed: Percentages of students
achieving proficiency by school and
subgroup; aggregated and disaggregated
longitudinal student-achievement data;
student performance by grade, program,
teacher and population group; percentages
of students achieving proficiency by grade,
program, teacher and population group;
disaggregated longitudinal student-
achievement records; attendance data;
graduation rates; individual student
performance records.
Why: Ability to track the results of curricula
and standards over time; inform school
choice community and business and
industry; percentages of students and
subgroups achieving proficiency; school
report cards; help parents and community
to focus on student achievement; provide
assistance to needy schools
Source: Table developed by Robert M.
Pailach, Dixie Griffin Good, and Ari van
der Ploeg. State Education Data Systems
That Increase Learning and Improve
Accountability. Learning Point Associates
and North Central Regional Educational
Laboratory, June 2004.
academically; school community focus on
student achievement; focus operations.
Teachers
Data Needed: Student test scores; student
achievement by program and population
group; percentages of student subgroups
achieving proficiency; student test scores;
longitudinal individual student achievement
trends; attendance; student performance in
prior and subsequent grades.
Why: Diagnostic information on
students’ learning needs; help focus both
teachers and students on achievement;
focus staff use of time; track students in
need of assistance; assist, in classroom
curriculum decisions; create additional
assessment items
Students and Parents
Data Needed: Grades on assignments and
courses; test scores; individual longitudinal
achievement record; diagnostic information
on students’ learning needs; school and
district performance data.
Why: Assist parents and students in
choosing best schools and programs
for needs; help focus both on student
achievement; inform progress against
proficiency standards.
A Byte at the Apple
98 99
Political Roadblocks to Quality Data: The Case of California
The consequences of limited structures
One consequence of designing a data system to focus only on compliance is illustrated by a report released in January 2006 by the American Institutes for Research (AIR) and WestEd, a San Francisco-based education think tank, on the instruction of ELL students.
5
California has 1.6 million children in need of English language instruction — one in every four students. In 1998, voters approved Proposition 227, which required schools to instruct ELL students by immersing them in English rather than using bilingual instruction, but no one is sure whether immersion is actually working as intended. AIR teamed up with WestEd on a five-year project commissioned by the state legislature to analyze whether English immersion instruction is better than bilingual instruction. Unfortunately, student-level data — especially about the instructional setting in which a student is being taught — isn’t available statewide in California. Aggregate data on the performance of ELL students are distributed across at least four state data collections, each with their own collection periods. As a result, it is difficult to combine them. All this limited the analysis that AIR and WestEd could perform. In their report, released in 2006, they wrote that they were unable to determine whether traditional bilingual instruction methods or full English immersion was more effective at improving the academic performance of ELL students.
6 AIR and
WestEd researchers conceded “limitations in statewide data made it impossible to definitively resolve the longstanding debate.”
Failing #2: Failure to Integrate State and District Technologies
The second critical component of comprehensive school data systems — especially at the K-12 level — is integration with the district-level systems and databases that initially collect and store the data. The key to this is standardizing the underlying technology of both systems in order for data to be easily transferred electronically. For state-level administrators, integrating state and district systems allows data to be collected, stored, and accessed in real time, making for smoother, more accurate transfers of information. It can also help reduce the burden of paperwork faced by districts in meeting overlapping state and federal reporting requirements. Data system integration can also spur districts to
err towards interpreting new reporting requirements as unfunded mandates, the costs of which the state must bear. So when Senate Bill 1453, which established CALPADS, was crafted and passed by state legislators, it was only authorized to store information need to comply with the requirements of No Child Left Behind and PSAA.
4 (PSAA data collection isn’t considered
an unfunded mandate because it involves data that schools are already required to collect in order to receive funding under previous federal and state laws.) The compliance orientation was further emphasized by the state’s process for approving the technical and financial parameters of the information technology system. At the time of CALPADS’ development, the department of finance was charged with overseeing this process; that role has since been handed over to the state’s chief information officer. The department of finance strictly interpreted the legislation that established those data systems to ensure that the data elements being included in them did not violate the unfunded mandates clause. Tensions between the education department and the department of finance were exposed in a January 2005 review of a report which included design and technical specifications for CALPADS. In that review, the finance department concluded that the initial plan for the systems contained “data elements and/or collections” related to ELL students not specified either by law or for NCLB compliance. Education department officials explained to finance department officials that school districts were already required to collect those elements as part of the Language Census data collection, according to Keric Ashley, the education department’s director of data systems. Eventually, finance officials conceded that point, approving the project. An effort to expand the data stored in CALPADS came in 2005 in the form of Senate Bill 368, a bilingual education bill authored by State Sen. Martha Escutia. A provision, amended into the bill early on, would have required the creation of a separate database in CALPADS for tracking the performance of individual ELL students — including test scores, course completion information, and whether the students were eventually mainstreamed into regular classes — in a longitudinal manner. The associated cost of expanding CALPADS to include this database, however, led to the provision being stripped out of the bill upon its passage a year later.
A Byte at the Apple
100 101
Political Roadblocks to Quality Data: The Case of California
individual-level data to CSIS using the SRRTS software, and CSIS generates the necessary aggregate data reports and sends them to the California Department of Education. Districts that do not participate generate their own aggregate data reports and send them to the California Department of Education themselves. A lack of sustained funding for integrating CSIS with district-level systems is the main culprit behind the low level of participation, but another factor must surely be the fact that CSIS and the education department haven’t succeeded in transitioning many data collections to the new system. By 2008, only five data collections were handled using individual-level data submitted to CSIS. And submitting data electronically to CSIS is not simple. To prepare data for submission to the state, district-level administrators use a 214-page data dictionary to find the proper codes. They must comb through five different Microsoft Word files — some of the files as long as 54 pages — in order to learn the requirements needed for creating the files that will be sent through the system. A 62-page guide details how each file being transferred through CSIS must be put together for processing. Five Excel spreadsheets map out other data requirements. All of this work is required to submit individual-level data to CSIS to satisfy five of the state education department’s data collections. For the state’s other data collections, districts must deal with other manuals, file-creation rules, schedules, and formats.
Why the effort failed
Why wasn’t the legislature’s mandate to integrate state- and district-level data systems ever fully realized in California? The problem begins at the state level. Back in 2002, a report on the data processing and management practices of the state education department by MGT of America, a Tallahassee, Fla., consultancy, noted that the state education department was struggling with its key role in the state’s data system:
7
Data collection within the department was highly decentralized; ��
each program office had its own process for collecting, processing, and storing data.
Coordination of data among those offices was minimal; essentially ��
no one could get a full understanding of how data were managed within the department.
improve existing systems and improve the quality of the data stored at the district level. Achieving such integration, however, requires policymakers and administrators at the state level to include districts as they design the system and its underlying processes, and also to provide financial and technical support for districts. California offers lessons in how not to do so.
Lofty goals, sluggish follow-through
Early on, California’s legislature recognized the importance of integrating state and district-level systems along with standardizing technology among districts. Through the law that created CSIS in 1997 and later legislation, the agency was charged with helping the districts develop “comparable, effective, and efficient pupil information systems” for their own operations and reporting to state and federal education agencies. Legislators wanted 90 percent of districts to submit data to CSIS in a standardized, electronic format by the 2004 – 05 school year and sought to encourage it in these ways:
CSIS would oversee the implementation of statewide student identifiers ��
to be used at the district level.
Schools would be able to electronically transfer individual student ��
transcripts, test score results, even health and discipline records to CSIS. This would lead to technical and data management standardization and integration between state and district systems.
Aggregate data collections would gradually be replaced by reports ��
generated from the individual student data and CSIS would work with the Education Department on streamlining the latter’s 125 data collections. The two initially identified 40 aggregate data collections to be transitioned from traditional paper delivery to electronic transfer.
Technical advice would be given to districts, especially when it came to ��
sending data to CSIS.
Although CSIS has successfully transitioned districts into using statewide student identifiers, it hasn’t made much headway in its other goals. An electronic data transmission system was created, but by 2005 – 06, just 263 districts were using the system. Districts that participate submit
A Byte at the Apple
102 103
Political Roadblocks to Quality Data: The Case of California
education spending at the local level. That role grew in 1978, when voters first passed Proposition 13, which essentially froze and then reduced property tax revenues for school districts. A decade later, voters passed Proposition 98, which required that a minimum percentage of the state budget be spent on education. The result was that the state’s share of education spending in California increased, from 34 percent in 1972 to 67 percent by 2005.
8 (The share of
spending paid for by local revenues declined from 60 percent to 22 percent in that period.) Nationwide, the average share of education spending by state governments grew from 38 percent in 1972 to 46 percent by 2005, according to the U.S. Department of Education. The increased burden on the state was intensified in California by Article XIIIB of the state constitution, which mandates that the state government must reimburse districts for complying with reporting requirements that otherwise would be considered “unfunded mandates.” As a result, legislators, governors and the state department of finance look for ways to limit state-level costs when developing data systems, which ultimately limits the integration of state- and district-level systems. Early on in the development of CSIS in 1997, legislators debated whether to make district-level participation mandatory. The ultimate deciding factor was the cost. In order to avoid imposing any “unfunded mandates,” legislators made participation voluntary; districts could decide whether they wanted to submit individual-level data to CSIS. In exchange for participating, districts would receive one-time implementation grants covering 50 percent of a district’s cost of implementation. But by 2001, funding voluntary participation became a challenge. That year, officials overseeing CSIS proposed to spend $23 million on implementation grants, but the legislature only allotted $11 million, financing implementation grants for a mere 98 districts. That same year, the legislature attempted to guarantee 90 percent district participation by the 2004 – 05 school year by passing AB 295, which would have required the state to spend $104 million over four years to reach that goal. But Governor Gray Davis vetoed that bill, arguing that the state would likely have to cover costs above the $104 million because of the unfunded mandates clause. Three years later, during one of the state’s periodic budget crisis, the legislature cut out implementation grants altogether, stalling the expansion of the program to other districts.
Data management within program offices wasn’t rigorous, aligned ��
to any kind of data management standards. The department itself didn’t have a common vision about how data should be processed, collected and stored.
Data dictionaries weren’t standardized throughout the department; ��
thus no consistent system for naming and defining datasets and data elements throughout the department.
Electronic data transmission barely existed; paper submission was ��
heavily relied on.
Data collections involved inconsistent units of analysis or inconsistent ��
time periods.
Part of the problem lies with the penchant of California state legislators for using categorical programs to fund schools. The original goal behind creating categorical programs was to force specific reforms at the school district level and keep tabs on their progress. But as the number of categorical programs grew, so did the number of offices set up to monitor these programs. Each office and program developed its own data collection process. This contributed to a confusing sprawl of data collections and databases at both the district and state level. Although the education department has since moved to create a data oversight office charged with streamlining processes and standardizing data dictionaries, this office still struggles to serve both districts and other data decision making parties. The main reason behind the lack of integration of state and district technologies, however, was lack of sustained funding. California’s experience shows how states are struggling with the fiscal price of their expanded role in funding and structuring education policy. Since the 1970s, when property tax revolts and lawsuits over equal funding of poor and wealthy schools began to reshape the public education landscape and move power away from school districts, state governments have become the primary arena for education policymaking. California’s experience is all too familiar on this front. Beginning in 1971, when the legislature — heeding the call from homeowners about rising property taxes — enacted “revenue limits” or caps on income districts could generate from property taxes, the state has become the dominant player in deciding
A Byte at the Apple
104 105
Political Roadblocks to Quality Data: The Case of California
get funds to help build out new data systems that could be easily integrated with the new state system. As part of the process, districts would clean up student standardized test files and improve data management practices so that the districts could begin delivering data electronically. Funding for Best Practices, however, was contentious from the start. The Legislative Analyst’s Office, though supportive of the program, recommended that legislators trim the original $30 million proposal by half. The department of finance opposed the program, arguing that implementation grants weren’t needed until CALPADS was up and running, according to Janet Hansen, a senior policy researcher with the Rand Corp. After some wrangling, Best Practices was funded to the tune of $31 million, to be spent from 2006 – 07 through 2008 – 09. Attempts to increase funding for Best Practices ran into roadblocks. A plan to boost funding for Best Practices by $65 million (along with an extension of the program into the 2009-10 school year) was scotched before its final passage. Governor Arnold Schwarzenegger included some funding for Best Practices in his proposed 2008 – 09 budget; but an impasse between state legislators and the governor over the overall budget may eventually mean that the program will no longer be funded — just as CALPADS prepares to go online.
Failing #3: Failing to Unify K-12 and Postsecondary Data Systems
Since 1994, 38 states have formed P-20 councils of some kind to increase the alignment of their preschool, K-12, and higher education systems, according to Education Week, in its most recent “Diplomas Count” report. But achieving the goal requires unifying elementary-secondary and postsecondary data systems, which currently operate independently of each other. California’s experience offers a sober lesson in how educational governance structures and turf battles can frustrate such unification. As the state embarked on developing a comprehensive, longitudinal data system at the K-12 level in 1999, it also began moving towards integrating its multiple systems at the postsecondary level. That year, the legislature reorganized its higher education oversight body, the Postsecondary Education Commission (CPEC), and charged it with connecting the data systems of the University of California (UC), California State (Cal State), and the state’s community college systems. This new database was to conform to the one being developed by CSIS for K-12, creating the potential for unification. In
Meanwhile CSIS began to find that, if anything, districts needed additional help in understanding the technology requirements for integrating their systems with the state system. Many districts had datasets of extremely poor quality that would have required significant cleanup before they could participate. A lack of adequate staffing and training to run existing systems also made it difficult for districts to take steps towards working with the state on systems integration. CSIS’s own mission of getting districts up to speed is itself compromised by low staffing. Of the agency’s 53 employees, just 11 work on assisting districts with their data processing issues and questions. This lack of manpower limits the help districts can get for their data processing needs. The launch of CALPADS in 2002 shifted the focus away from expanding CSIS. It also marked a move toward mandatory participation by districts in the state data system. In establishing CALPADS, legislators argued that in order to meet the accountability rules contained in both No Child Left Behind and the PSAA, all school districts would need to integrate their systems with that of the state. Any school district accepting Title I funds and state general purpose funding (or base operational funds) doled out on the basis of enrollment — essentially every school district in the state — had to go along. “By taking federal funding, they are making a commitment to reporting anything the federal government is funding,” said Ashley, the state official overseeing CALPADS. Having decided that district-level participation in CALPADS would be mandatory, state policymakers needed to develop a strategy to get those districts not participating in CSIS’s individual-level data collection up to speed technologically so that they could be integrated into the new system. Some 300 school districts have enrollments of 300 or fewer students, and the quality of their data systems is mixed. Some districts are storing data using Excel spreadsheets and FileMaker software, with a secretary or another staffer handling data processing needs. Integrating these districts into the state system will be an arduous task for the districts and the education department alike. The state opted to begin the transition to CALPADS in the 2006 – 07 school-year by funding a program called Best Practices. Under the program, school districts with enrollments less than 1,800 that implemented the unique student identifier (and weren’t already participating in the CSIS data collection) would
A Byte at the Apple
106 107
Political Roadblocks to Quality Data: The Case of California
and develop longitudinal tracking of student performance. In its own data system, Cal-PASS collects at least five years of longitudinal data from 4,000 participating K-12 schools and colleges. (Participation is voluntary.) Like CPEC, Cal-PASS stores student-specific information on degree completion status and high school of origin, but it also has access to transcripts and course grades not contained in CPEC’s collection. Even if the university systems were more cooperative, a major technical barrier remains: a lack of a unique student identifier used by all educational institutions. At the K-12 level, a unique identifier has been used for tracking data since the 2004-05 school year; high school seniors are now jotting down those identifiers on UC and Cal State applications so that the schools can access the students’ records through CSIS and eventually, CALPADS. Colleges and universities, however, haven’t adopted the K-12 identifier or developed a uniform system of their own. Within UC, each campus issues its own identifier; student movement is not tracked within or outside the system. A student transferring from, say, the University of California, Los Angeles to UC Santa Barbara is issued a new identifier upon admittance.
Governance structures that impede data unification
At the heart of California’s problems are governance structures that impede cooperation on data systems unification. At the K-12 level, governance is divided between the state board of education and a secretary of education — both appointed by the governor — and the state education department (controlled by an elected superintendent). There is also the Fiscal Crisis Management and Assistance Team (FCMAT), which manages CSIS and handles fiscal affairs within the education system, and the Commission on Teacher Credentialing, the teacher certification agency. Governance of the university systems is even more unwieldy. Although CPEC oversees the higher education system, the UC, Cal State, and community college systems function independently, each with their own systems, procedures, and data sets. Even within institutions, governance is complex. Although a chancellor oversees the community college system, each college also reports to a regional board. Each campus in the UC system has an academic senate that shares power with campus-level administration. With so many institutions and a lack of an overall governing body, it is difficult to get all the parties at the table. The result is predictable: little gets
its database, CPEC was supposed to collect student transcripts — including information on course completion, grades, unit hours earned, and degree-seeking status — along with student-level socioeconomic data. From the get-go, CPEC struggled to get the universities on the same page. The community college system had been supplying student-level data to the commission since 1993, long before CPEC was reorganized and charged with unifying higher-ed data systems. The data include a student’s high school of origin, degree-seeking status, and grade point average. The UC and Cal State systems, on the other hand, were more reluctant to release data because of their interpretations of the federal Family Education Rights and Privacy Act (FERPA) and the state’s own array of student privacy laws. Only in 2005 — six years after the legislature charged the commission with its task — did CPEC begin collecting data from them. So far, files collected from the central offices of the University of California and California State systems don’t contain any course completion data at all because such information is located in files on university campuses and isn’t transferred to either system’s central database. They do contain such student-specific information as scores on SAT and ACT exams, credit hours earned, and degree-seeking status. By law, CPEC and the university systems are supposed to meet regularly to advance the integration of data systems and develop a common data set that includes socioeconomic and course information. This isn’t happening. University officials are unwilling to work with the agency because, they say, CPEC fails to consult them about how the data it receives will be used in its own research projects; the commission, for its part, notes that universities do get to review research before it is published. The lack of progress on this front has done little to improve CPEC’s already low reputation among state legislators. “Nobody trusts their opinion anymore,” said Amy Supinger, a consultant to the state senate’s Budget and Fiscal Review Committee. CPEC has approached the Association of Independent California Colleges and Universities about accessing the data of its members, but no progress has been made on that front. While CPEC struggled to integrate university data systems, the legislature took another step towards P-20 data system unification in 2003 by funding the California Partnership for Achieving Student Success (Cal-PASS), an Encinitas-based nonprofit group, to help link university and district-level data systems
A Byte at the Apple
108 109
Political Roadblocks to Quality Data: The Case of California
and helped districts improve their ability to use data in decision making. Beginning in 1976, data sets and data elements were standardized for all educational agencies and institutions. By 1985, state- and district-level systems were integrated through the Florida Information Resource Network (FIRN), which served as the backbone of the state’s current school data system; by 1991, districts could transfer student records to one another through the FIRN, encouraging data sharing among districts (and also, with universities). As a result of these and other moves, the Sunshine State is one of just four states cited by the Data Quality Campaign as positioned to have all ten basic elements of a comprehensive, longitudinal data system in place by the end of this past school year. California has only six of the ten elements in place. The two states have faced the key challenges of creating a statewide data system in very different ways.
Taking a broader view of data: 1. While Florida’s data system is designed to help districts and the state comply with federal and state regulations, it is also becoming more useful for all parties. Teachers will soon be able to access student-specific data on the Sunshine Connections portal and use tools that will help with designing instructional efforts. The development of a data warehouse, in which student-level data is stored along with information from other state agencies and institutions, also allows for researchers to conduct a wide range of longitudinal research.
Incorporating districts in data system design: 2. As noted earlier, Florida has tailored its system so that all sides gain; the state can get the information it needs while the reporting burdens of districts are reduced (and districts get a wider range of data). In 1987, the state began replacing aggregate data collections with individualized student- and teacher-level data reporting in FIRN; this simplified district-level reporting while moving the more tedious job of aggregating data and generating reports to the state level.
Requiring the entire education sector to cooperate on data system 3. integration: Cutting through complex educational governance structures is critical to integrating K-12 and postsecondary systems. Policymakers in Florida have found a way to make this happen. Leadership from governors as diverse as Lawton Chiles and Jeb Bush helped universities
done on P-20 unification. “Data and information systems are one of the victims of the state’s current convoluted governance structure,” according to Governor Schwarzenegger’s Committee on Education Excellence. And there has been little recent effort to push for a change in the status quo. In 2004, the state schools superintendent, Jack O’Connell, announced with great fanfare the formation of a 64-member P-16 council in order to build consensus among all stakeholders on unifying the education system, including integrating data systems. Three years later, the council has issued reports on reforming high schools. But so far, data systems integration hasn’t been on its agenda. In November 2007, Governor Schwarzenegger’s Committee on Educational Excellence recommended the creation of a commission to take over all current data systems and create a new one that unifies not only data systems at the state level, but those at the local level that often don’t match up technologically. The governor, however, ignored that recommendation; instead, he proposed in his state of the state address to create an education data commission to develop additional recommendations. That investigative body has yet to be formed. In June 2008, Senate Budget and Fiscal Review Committee Chairman Denise Moreno Ducheny proposed to eliminate CPEC by the 2010 – 11 fiscal year and hand over its data management function to the state library. A lack of a plan for handling CPEC’s other functions, along with lobbying by members of the agency’s governing board, quashed that effort.
Steps Toward More Comprehensive Data Systems: Two Approaches
California’s experience offers lessons to policymakers in other states on how not to proceed with developing comprehensive data systems. Florida has taken a very different approach. States have different traditions when it comes to developing a “culture of data” in which data-driven decision making is encouraged and policymakers focus on improving data systems at all levels. Only a few have a strong tradition of supporting data system capacity at the district level. California has always shown “lukewarm support for education data system development” at all levels, according to Rand’s Hansen in a report on the development of the state’s data systems released last year.
9
This contrasts with Florida. Since 1970, policymakers in the state have taken an active, involved approach to encouraging districts to improve data systems; they have also reduced reporting burdens, streamlined data reporting,
A Byte at the Apple
110 111
Political Roadblocks to Quality Data: The Case of California
Glossary
CALPADSCalifornia Longitudinal Pupil Achievement Data System. Launched by the state in 2002 and expected to be operational in the 2009 – 10 school year, it will collect such individual student-specific data as socioeconomic status, discipline records, and scores on state assessments.
Cal-PASSCalifornia Partnership for Achieving Student Success. A partnership of K-12 and higher education institutions authorized by the state legislature to foster linkages between K-12 and higher education data systems on a voluntary basis.
Cal StateCalifornia State University System
CALTIDESCalifornia Longitudinal Teacher Integrated Data Education System. This database will include a unique identifier for each teacher, credentials for each subject taught, and how the credential was achieved.
CBEDSCalifornia Basic Educational Data System. The California Department of Education’s collection of aggregate student and staff demographic information.
CPECCalifornia Postsecondary Education Commission. The state higher education oversight and coordination agency. It is tasked with unifying the data systems of the state’s three university and college systems.
CSISCalifornia School Information Services. It oversees the implementation of the unique student identifier (SSID) and operates the State Reporting and Record Transfer System.
overcome their reluctance to share data. And universities in Florida have a lot to gain. Since education databases there have been linked to other state databases containing information about employment, universities can assess their own performance by tracking how graduates perform in the workforce after leaving college.
Many of the difficulties faced by California in attempting to build a comprehensive data system involve state-specific challenges. As Nancy Smith notes in her paper in this volume, the cultural norm in California is that the state department of education does not collect data without a specific mandate and funding. And the part of the state constitution prohibiting “unfunded mandates,” has meant that the California Department of Education must reimburse districts for the effort involved in submitting any data that are not strictly required in order to comply with state or federal law. Compounding this problem is a state department of finance and state legislature that are very aggressive about stopping the state from imposing costs on districts. This makes it extremely expensive for the state to collect the data it needs from districts, even though that very same data would be useful to districts. California was also hampered by its propensity to fund its schools via a large number of different categorical programs, each with its own data requirements, which may have fostered the tendency to organize the data into silos. Finally, there was a real lack of leadership behind California’s efforts to build a statewide education database. Without the governor or powerful legislators taking this project on and seeing it through, and without the state superintendent or state board of education making it a high (and sustained) priority, it was impossible to cut through the many fiefdoms with competing interests and narrow focuses to make anything big happen. But in many ways, California is not a special case. The tendency to gather data in many separate collections and to store data in databases that don’t connect with one another is common. The tendency to only collect the data strictly required for federal and state compliance is also common. The difficulty of financing data systems is typical throughout states without strong cultures of data-driven decision making. And the inability to get higher-ed institutions on board with sharing data for a statewide database is something nearly all states have experienced.
A Byte at the Apple
112 113
Political Roadblocks to Quality Data: The Case of California
Endnotes
CSIS is an agency operated by the Fiscal Crisis and Management Team 1
(FCMAT) — a quasi-state operation — and overseen by the state education
department. A glossary of acronyms and other terms can be found at the
conclusion of this chapter.
Hansen, Janet. “Education Data in California: Availability and Transparency.” 2
The Rand Corp., November 2006.
Edwards, Sonya. “Reducing Data Collection and Reporting Burden on LEAs.” 3
CDE Education Data News, Issue 2. California Department of Education,
Spring 2007.
California received a grant of $3.2 million to assist with the development of 4
CALPADS from the U.S. Department of Education’s program supporting
longitudinal data systems.
Parrish, Thomas B., Maria Perez, Amy Merickel, Robert Linquanti, et. al, 5
“Effects of the Implementation of Proposition 227 on the Education of English
Learners, K-12: Findings from a Five-Year Evaluation.” American Institutes for
Research and WestEd, January 2006.
Parrish, Thomas B., Maria Perez, Amy Merickel, Robert Linquanti, et. al, 6
“Effects of the Implementation of Proposition 227 on the Education of English
Learners, K-12: Findings from a Five-Year Evaluation.”
“Data Management Study of the California Department of Education.” 7
MGT of America, April 2002.
Timar, Thomas. “How California Funds K-12 Education.” Institute for Research 8
on Education Policy and Practice, Stanford University, September 2006.
Hansen, Janet. “Education Data in California: Availability and Transparency.” 9
The Rand Corp., November 2006.
ELLEnglish language learner. Students learning English as a second language.
FCMATFiscal Crisis Management and Assistance Team. Run by the Kern County Office of Education, it operates California School Information Services (CSIS).
FERPAFamily Education Rights and Privacy Act. A federal law that limits access to individual student data to certain parties.
FIRNFlorida Information Resource Network. The initial effort by Florida’s state government to develop a fully longitudinal data system.
PSAAPublic School Accountability Act. The state’s standards and accountability law, which created the Academic Performance Index, a school performance measurement system similar to the No Child Left Behind Act’s Adequate Yearly Progress measurement.
SNORStudent National Origin Report. One of the California Department of Education’s data collections.
SRRTSState Reporting and Record Transfer System. Operated by California School Information Services, it allows school districts to transfer individual-level data that can be used to generate reports for five data collections (including CBEDS) to the state Department of Education.
UCUniversity of California System
Section II
Innovations and Promising Practices
116 117
Building Longitudinal Data Systems in Kansas and Virginia
Building Longitudinal Data Systems in Kansas and Virginia
by Nancy Smith
Nancy Smith is the deputy director of the Data Quality Campaign.
The passage of the No Child Left Behind Act (NCLB) brought about more than just a change in how accountability works in the education sector. In order to meet the reporting requirements of NCLB, staff at state education departments across the country
realized that they would need to drastically alter not just their data collection systems, but the role of the states and the culture of data in education. Prior to NCLB, most education departments served as a conduit of data — they collected specific pieces of data from the school districts and passed them to the U.S. Department of Education as required by law, or produced state-mandated reports with the data. The state was rarely a user of the data, especially not with the purpose of helping districts determine better ways to educate their students. Without the perceived need to do in-depth analyses of the data received from districts, it was common practice across states to ask for and receive aggregate statistics instead of student-level data. That is, districts would send the count of students by race/ethnicity or the number and percentage of students who passed the statewide assessment by race/ethnicity instead of sending individual records for each student that included fields for race/ethnicity, assessment scores, limited English proficient status, and so on.
Having all of this detailed student-level data would enable a tremendous amount of analysis, but since the state education departments had neither a state nor a federal mandate to analyze the data nor the staff to do so, they were content to receive aggregate data. Prior to NCLB, discussions about collecting student-level data were already occurring, but there was much resistance in many states to the idea. Since a few states did already collect student-level data and track students over time, discussions of the benefits and the requirements had been going on for a few years at annual conferences of data directors. It was obvious that unique student identifiers would be necessary, but staff from many states indicated that the political climate in their state (among parents and schools in particular) would never allow the tracking of individual student-level data by a state agency. In fact, Ohio has a law prohibiting its education department from collecting or maintaining individually identifiable data (names, dates of birth) for students. While NCLB did not mandate that states develop a student-level data system, it was quickly apparent to states that they would not be able to meet NCLB reporting requirements without one. For example, states were required to show how students receiving English language learner (ELL) services performed after participating in ELL programs for the allowable three years. Unless states could track which students received three years of services and connect them with subsequent assessment scores, they would not be able to meet this reporting requirement. There were so few examples of student-level data systems at the state level across the country that there was a lot of confusion about how to build one and what exactly states were to do with all of that information. In 2003, the National Center for Educational Accountability, now known as the National Center for Educational Achievement (NCEA), began surveying states on whether they had in place nine essential elements of a robust longitudinal data system. NCEA developed the list of elements based on research that it was conducting, often at the behest of governors or other state policymakers. The early research by NCEA was conducted in Texas and Florida because they had many years of student-level data. When asked by policymakers in other states to conduct similar analyses, NCEA had to decline because the states only had aggregate data collections. There was a convergence of energy in 2005, when almost all states were planning to build student-level data systems, but confusion reigned about what
A Byte at the Apple
118 119
Building Longitudinal Data Systems in Kansas and Virginia
a longitudinal data system really was, and many states had concerns about student privacy laws. In November 2005, the Data Quality Campaign (housed at NCEA) was launched. By this time, the nine essential elements had been expanded to ten, a few states had made progress in designing their longitudinal data systems, and there was more agreement among state policymakers that student-level data systems were essential. While the stated goal of the Data Quality Campaign was to get states to implement the ten essential elements of a robust student-level longitudinal data system, the ultimate purpose of the campaign was to get state policymakers to use those data to inform their policies, and to get educators to use data to improve instruction. The three states whose stories are told here — California, Virginia, and Kansas — were on the leading edge of states deploying unique student identifiers (which are the basis for developing a data system capable of linking student data across years) between 2002 and 2004. These states have taken very different routes along the way due in part to different cultural issues and to different types of expertise within their education departments. Staff in Kansas and Virginia have been successful in building robust student-level systems that ultimately help policymakers and educators, and in gaining buy-in from school district staff along the way. California has struggled with some elements of its data system, though it expects to have a fully functional one by 2009-10. California’s story is told in great detail in an earlier chapter in this volume by RiShawn Biddle. In this chapter, efforts by Virginia and Kansas to develop data systems are recounted, and some thoughts are offered as to why these two states have been more successful than California.
California California mandated in 2002 that a unique student identifier be implemented statewide via the California School Information Systems (CSIS). Staff in CSIS and the California Department of Education have worked together to share data to meet state and federal reporting requirements. As of July 2005, all students have been assigned an identifier. While CSIS is mandated to collect data, it is not mandated to conduct research or analysis on the data; consequently, there is no effort to share data with policymakers, researchers or educators so that data can be used to inform new policies and practices. California has moved from having two of the nine elements of a robust longitudinal data system in 2003 to seven of ten elements in 2007, and back
to six elements in 2008. (The state’s education department erroneously reported that it collected student-level college readiness test scores in 2007). With the assignment of unique student identifiers to all students in the system, the state now has the ability to track some student information across years, including student-level graduation and dropout data, but not test scores for students across the state. A new initiative called the California Longitudinal Pupil Achievement Data System (CALPADS) will include student test scores. The state department of education is also in the process of developing a course code system that will enable it to maintain course transcript information and connect student and teacher data in CALPADS. The data system is expected to be fully functional in 2009-10, so while California’s education department has checked off six of the ten essential elements outlined by the Data Quality Campaign,
1 some of those elements
are not yet fully operational. At this point student data are seldom used beyond compliance and accountability.
Kansas With the advent of NCLB, leaders of the Kansas State Department of Education (KSDE) understood that they needed to develop a student-level data collection system. The state education department initially used funds received through a federal grant to develop their student-level data collection system, and the state legislature provided funds to do the initial work in building their longitudinal ”enterprise” data warehouse.
2 Education department leadership,
including both former and current chief state school officers, has supported the building of this robust data system as necessary to comply with NCLB and to provide districts and others with the information needed to improve student achievement. Kansas has moved from having two of the ten essential elements in 2003 to having six of them in 2008. In those five years, KSDE has implemented a unique statewide student identifier that tracks students’ demographic, enrollment, and assessment data across school years and as students change schools and/or districts. The department also now has the ability to track individual students’ graduation or dropout status. Staff in Kansas are developing an enterprise data warehouse to increase access to data by key stakeholders and are working with staff in higher education to connect student-level data across sectors. Student-level course completion and college readiness data are targeted for collection in
A Byte at the Apple
120 121
Building Longitudinal Data Systems in Kansas and Virginia
requirements and the needs of policymakers, managers, and local educators. Success in Kansas and Virginia, as will be shown in this chapter, is due in large part to three things: a strong data champion, room for the state to be flexible without excessive oversight, and a unified mission for the data system.
Kansas
Impetus for a Student-level Data System After NCLB was passed, staff at the Kansas State Department of Education began identifying necessary changes in the existing data system and data collection practices in light of NCLB reporting requirements. There was no state legislative mandate to guide department activities regarding NCLB; the response to NCLB was left to staff and not dictated by the legislature. After reviewing federal and state legislation, internal resources, and lessons learned from other states and other industries, education department staff felt that the only way to meet NCLB requirements was to develop a statewide student identifier. The identifier would be associated with each student in each of the critical data collections in order to garner the most complete data set from which to study student academic and performance history. Staff decided to implement a student identifier assignment and tracking system purchased from a vendor, and all students received unique statewide identifiers in spring 2005. They also decided to develop their student-level data collection system in-house and closely integrate it with the identifier assignment system. This integrated system, known as Kansas Individual Data on Students (KIDS), was implemented in the fall of 2005 and is used to collect enrollment, program and assessment data. The Kansas education department expected some push-back from key stakeholders about creating a student identifier, but received much less than expected. A few parents were concerned that assigning identifiers to students and tracking their performance and program participation could lead to long-term labeling, prejudicial treatment, and embarrassment. Several district superintendents raised concerns about the amount of work required to create the new data system. However, clear explanations of the new NCLB requirements and privacy protection practices quieted the objections. Staff — with strong support from the commissioner and deputy commissioner of education — spent a lot of time explaining the reasons for and benefits of implementing a student-
the 2009-10 school year, which means that Kansas will soon have additional points on the Data Quality Campaign survey.
3
Virginia Leadership at the Virginia Department of Education (VDOE) also understood that in order to comply with NCLB, the department would need to develop the means to track student data over time. Staff at the state’s education department began investigating a system to assign unique identifiers (called State Testing IDs in Virginia) and what systemic changes needed to be made in order to move from collecting aggregate data to collecting student-level data. About the same time that the department was reviewing NCLB requirements, Virginia’s recently elected governor, Mark Warner, asked some key questions about student performance and teacher preparation programs that could not be answered with the data that VDOE collected. The convergence of conversations around student-level data culminated in the governor and the education department working with the general assembly to procure the necessary financial resources for the state and districts to assign unique student identifiers and implement a new student-level data collection system. Since 2003, VDOE has moved from having five of the original nine essential elements of a robust longitudinal data system to having seven of ten current elements. The department had collected test scores (from the Standards of Learning assessment), demographic and enrollment data, and graduation status at the student-level data prior to 2003. They have since expanded the use of the unique student testing identifier that allows tracking of student performance across years and are now collecting student-level college readiness scores. VDOE is working with postsecondary leaders to connect students’ data across sectors. In addition, since 2005 the department has worked with a vendor to develop and deploy a robust data warehouse with reporting and analysis tools for use by teachers, principals, and district staff. The rest of this chapter will provide a more in-depth description of the work undertaken by Kansas and Virginia over the last five years as a counterweight to the chapter about California in this volume. The California chapter shows how difficult it can be to implement a large scale data system when there is little coordination between data champions and conflicting visions among oversight agencies. While Kansas and Virginia have traveled different paths, they have both succeeded in building data systems that meet both federal reporting
A Byte at the Apple
122 123
Building Longitudinal Data Systems in Kansas and Virginia
implementing the system and expects to launch EDS by the end of 2009. (In California, on the other hand, there were great battles in the legislature over funding for new data collections, and the funding desired by data champions was rarely committed.) KSDE was awarded a $3.8 million grant from the federal Institute of Education Sciences Statewide Longitudinal Data System grant program in August 2007. The objectives of this grant include enhancing staff and licensure data systems, establishing a statewide course code system and collecting student course completion data. In addition, staff will use these funds to implement business intelligence tools and decision support systems for stakeholders, to provide training on effectively using data, and to create a research consortium to design and implement a research agenda that uses the Enterprise Data System to inform education decisions and identify best practices.
Technology Vision A tremendous amount of work was done prior to 2005 to review the information technology structure at the state and district levels, to define the data elements that needed to be collected for NCLB, and to research the best approach to meeting state and local needs. In April 2004, the state hired a new director of information technology, and she, along with the director of planning and research, provided leadership and vision for this work. However, a year after the statewide identifier and KIDS system were deployed, and before the Education Data System was commissioned, the director of planning and research retired from the state education department. (All is not lost though: she is currently employed within the postsecondary sector and is working with KSDE on the connection between K-12 and postsecondary data systems.) The director of information technology came to the agency from the private sector, where she spent most of her career in telecommunications and finance. She brought to the agency an enterprise-wide perspective (integrating all areas of the organization in a cohesive system) and experience with data warehousing. Her skills have been extremely valuable; much of the department’s success in developing its data system can be attributed to a sound vision and clear, honest, and frequent communications between the state, the districts, and other stakeholders.
level data system; apparently, open communication from the state was enough to address most folks’ concerns. In Kansas, the department of education was able to serve as a champion for the data system, and for the most part the department was able to speak in a single voice about the changes that were needed. In California, the education department played a very different role. California is a “state mandate” state with an established culture in which the department does not collect data without a specific mandate and funding. In California, there were multiple data champions, both inside and outside of state government. In some instances the different data champions in California advocated for different data system features and goals. During the planning and implementation of the data system, California Department of Education was never able to convey and act on a strong unified message about the data system.
Funding Once the decision to develop KIDS was made, the next big hurdle was to find the funds for design and implementation. Long before the Institute of Education Sciences (IES) began providing competitive grants to states to build longitudinal data systems in 2005, the U.S. Department of Education provided grants to states for Safe and Drug Free Schools. States were encouraged to create data systems to track information about student disciplinary incidents (e.g., fights, suspensions, drugs or guns at school). The Kansas State Department of Education applied for and received a grant from the Safe and Drug Free Schools program to build a student-level discipline system. This provided a great opportunity to develop a student identifier system and to link the identifier with students’ discipline records. Kansas used part of this grant to develop the KIDS student-level data collection system. The student identifier was then expanded to other student-level data collections, such as special education, migrant, and career and technical education. The KIDS student data collection system is also the basis for school accountability and state and federal funding and reporting. In January 2006, the legislative agenda of the Kansas State Board of Education included $2.4 million for building the longitudinal Enterprise Data System (EDS), and the state legislature committed those funds over three years. Today, Kansas’ education department is in the final phases of developing and
A Byte at the Apple
124 125
Building Longitudinal Data Systems in Kansas and Virginia
While staff in California are developing a new longitudinal data system, the commitment to building an enterprise-wide system is missing. California’s data system is seen as an information technology project, not an endeavor involving the entire department of education. Creating an enterprise-wide system requires ongoing input and participation from across the entire department of education, and a real change in culture. Unless the entire department is engaged — and unless school districts, in turn, buy in — an enterprise-wide system will fail to live up to its potential.
Stumbling Blocks Implementing a new data system involves massive changes at both the state and local levels, and Kansas was also implementing a new assessment system at the same time. The commissioner determined that the new identifiers should be included in the new assessment system, and both systems were fully implemented during the 2005 – 06 school year. Doing everything at once created a tremendous burden for the state as well as for schools and districts. The organizations had to change the way they operated, and implementing the changes required a lot of communication between program areas, schools, and the district central office. As to be expected, there were stumbling blocks and criticism. Schools and districts had a steep learning curve, just as state education department staff had a lot to learn about school and district processes. Some of the specific challenges included security issues (user authentication and confidentiality policies), the variety of vendors supplying district student information systems, communication across state education offices, communication within schools and with the state, and data quality processes. As a result of so many changes in such a short period of time, the quality of the data collected in 2005 is likely not as high as in subsequent years, when the training was better and the processes cleaner. Kathy Gosa, Director of Information Technology, shared the following description of the first year:
During the first year of the KIDS student-level data collection, we did provide training;
however in many cases, since neither we nor the schools had a firm understanding of the new
role, the person who attended training was not the person who ended up submitting the data!
Therefore many of the folks who had to collect and submit the data had the task dumped in
their laps with no training and little information. This meant that we had a large backlog of
Enterprise Architecture
Launching a data system with an enterprise-wide perspective does not mean just addressing the technology changes that affect all program areas; it includes a culture change, which requires the active involvement of staff in all areas of the agency in the design, maintenance and governance of the data system.
Involving Stakeholders Before building their new systems, staff considered both technical and business aspects of what was needed.
4 Key questions that were asked included:
What do your stakeholders want?��
How does our current environment compare to the vision of the ��
new system?
What needs to be done?��
How will we do it?��
Who will do it?��
When will we do it?��
In order to answer these questions, the Kansas Department of Education worked with stakeholders to clarify their needs and determine how they could be met. These stakeholder groups included parents, teachers, principals, district superintendents, school boards, and state policymakers. For example, parents had questions about protecting student privacy, while teachers and principals were concerned about how data from their schools would be used and what student-level data they would receive to help them improve instruction. Based on questions and comments from stakeholders about what they needed the system to do, KSDE developed policies and procedures dealing with privacy protection, data access, and data use. They also used this information to develop communication strategies for sharing these policies and procedures with stakeholders. Staff knew it was also important to identify the data champions (which in this case turned out to be the state board of education, commissioner of education, and governor) who could be included as necessary in conversations with stakeholders.
A Byte at the Apple
126 127
Building Longitudinal Data Systems in Kansas and Virginia
Data Governance
A key feature of Kansas’s enterprise-wide solution was to develop a high-level three-year plan that integrated multiple initiatives. The state also developed a data governance structure to oversee the development and maintenance of the education department’s data systems.
7 A critical function in this structure
is the data governance board that is made up of directors of teams which are responsible for applications and their associated data. Board members include representatives from many different divisions across the agency, some directly involved with curriculum and assessments, some not. Generally, people think of education data as meaning test scores and student enrollment, but Kansas is involving all aspects of organization, student and teacher data in their solution. Involving agency staff from diverse areas and requiring them to participate in detailed conversations about data policy was quite a change for the state’s education department. Over time the benefits of creating and maintaining a strong data governance structure became apparent to all parties, and the data governance process has become a foundation of the data infrastructure within the agency. Another benefit of the agency’s data governance process is the message it sends to districts about developing a culture of data. The districts are not hearing about data just from the information technology staff; they receive a strong message about focusing on data from people throughout the state education department. The Kansas State Department of Education, like most state education agencies, has an audit process to verify the quality of all data submitted from school districts. However, correcting data quality issues at the state level leaves schools and districts with poor data in their local systems. In a proactive measure to improve data quality at the point of entry, the state has developed a Data Quality Certification program for school-level staff. Kansas is taking a slow and deliberate path towards determining how to use the data (beyond meeting state and federal reporting requirements) and how to provide the data back to schools and districts. It has launched a research consortium in partnership with the University of Kansas, Kansas State University, and the Kansas Board of Regents to develop and implement a statewide agenda of key research topics and to develop a process for using data to improve instruction and student achievement.
help-desk calls, and several of us spent eight hours a day emailing answers to folks, and then
had to do our jobs after that! This also meant that many times schools were left to figure out
many things on their own. We heard from school staff and superintendents about secretaries
who had to work holidays, weekends, and evenings to get the data put together, and several of
them actually quit their jobs because they couldn’t take it! I received a number of irate emails
and phone calls explaining that time spent on submitting data to the state was taking away
from educating students.
In addition, as Kansas developed the KIDS student-level data collection system we made
a number of assumptions regarding how schools work, but in several cases what we assumed
was not reality. For example we thought that the school that gets the state funding for a
student should also know the details about the student’s education. However, we found that
in many cases this wasn’t true and so schools were required to submit data they didn’t have!
Some didn’t submit them, some made them up (we believe), and some contacted the school of
attendance and got the data, then sent them to us. All of these caused a significant burden on
the schools, and they didn’t like it and let us know about it. We also assumed that all schools
had some way to create and submit data files. Again, this wasn’t reality. Once we discovered
that a number of schools did not have student information systems, it was well into the first
submission cycle, so we created an Excel template for them and gave instructions regarding
how to populate it. But then we found that many of those folks had no idea how to use Excel!
Again, this ended up taking a lot of help-desk time and causing a great deal of frustration for
schools as we had to walk them through the process. 5
The first year, many lessons were learned that resulted in improvements to the applications, documentation, communication standards, data governance, training, and data quality processes.
6 As a result, the state education department
believes there have been fewer stumbling blocks and better data quality with each passing year. While that first year was very painful, the state believes that it is farther along than it would have been if it had taken a piecemeal approach to implementation. While Kansas’ efforts to help districts adjust to the new data system have been ongoing, California’s efforts to bring districts on board with new data procedures have been intermittent. The state has come up with funding to allow a limited number of districts to participate in initiatives aimed at shoring up district-level data practices; the remaining districts are simply not able to participate.
A Byte at the Apple
128 129
Building Longitudinal Data Systems in Kansas and Virginia
means to track longitudinal data for individual students. Department staff also wanted to put data into the hands of teachers so they could use them to improve student achievement, instead of just using the data for compliance and accountability purposes. However, it was difficult to consider collecting individual student data when the state had privacy laws at the time that were more stringent than the FERPA regulations. Between 2002 and 2003, they brought in outside experts to conduct a needs analysis and reviewed lessons learned from other states and industries. Ultimately, Virginia implemented the Education Information Management System (EIMS) in order to meet state and federal reporting requirements and enable stakeholders at all levels to make informed decisions based on accurate and timely data. EIMS would have tremendous potential to reduce the burden on district staff by streamlining and automating the data collection process, allowing staff and administrator time to be redirected towards instruction. The student-level data collection would also improve data quality.
Governor’s Interest In 2001, at the same time that Virginia was reviewing NCLB requirements, a new governor, Mark Warner, was elected to office. Governor Warner had a business background and a keen interest in education. Early on in his term he asked some key questions about student progress (e.g., what percentage of high school graduates went on to higher education in the state and how they did perform there?) and teacher preparation programs (e.g., how well were teachers’ students performing on the state Standards of Learning?) that could not be answered with the data currently collected. Governor Warner was interested in what happened to individuals as they transitioned across education sectors and he wanted to be able to identify appropriate interventions, improve teacher preparation, and highlight programs or services in need of improvement. Essentially, the governor wanted a data system that would be able to answer many basic policy questions. With his executive authority, the department of education could pilot a student information system in a few volunteer districts. Once the pilot was implemented and had support from participating districts, the governor and education department leadership went to the general assembly for ongoing resources. In Virginia, efforts to build a data system have from the start been about making data available to policymakers, managers, and teachers. In California,
Future Goals There is still much work to be done on Kansas’s data system. In addition to developing a research agenda that will make full use of the data system, the education department has identified additional data elements that need to be added to meet federal and state reporting. Kansas, along with all states, is realizing that building a longitudinal data system is not a project with an end date. These systems, and the technology behind them, will need to go through changes (both expansions and deletions) to stay up-to-date with reporting requirements, school and district needs, and state-of-the-art technology. The next big hurdle the state faces is the need for funds to sustain the data system. The education department has staff with the requisite skills and knowledge to maintain and expand the systems. However, the funding for the technology, much of the programming staff, and the training comes from three-year grants from the state and federal government. Kansas, like other states, will soon have to locate the necessary resources to keep the system running.
Virginia
The Impetus to Create a Student-level Data System In 2000, Virginia launched the Standards of Learning (SOL) Technology Initiative for public schools with the goal of reducing student-to-computer ratios; creating internet-ready local area networks and high-speed, high-bandwidth capability in all schools; and establishing a statewide online testing system.
8 The SOLs describe the commonwealth’s expectations for learning
and achievement for P-12 students in English, mathematics, science, history and social science, technology, the fine arts, foreign language, health, physical education, and driver education, which were initially approved in 1995. As part of the SOL Technology Initiative, the state legislature mandated an online testing system to hasten the turnaround time between student assessment and the receipt of test results in the classroom. One byproduct of the online testing was that it made the uploading of data from districts easier and facilitated more reporting of data back to districts. The most significant by-product, though, was the construction of a robust technology infrastructure in schools that would support testing, but would also provide access to a wealth of instructional materials via the internet throughout the school year. Leadership at the Virginia Department of Education understood in 2002 that in order to comply with NCLB, the department would need to develop the
A Byte at the Apple
130 131
Building Longitudinal Data Systems in Kansas and Virginia
wanted to be able to assess students’ progress on the Standards of Learning. Many stakeholders in Virginia were uncomfortable with the idea of tracking student test scores across years, much less other types of student data, particularly without a clear understanding of how the data would be used, so the department was careful to talk about building a student information system that would help teachers help students. As the expanded system has been built, getting teachers and administrators data they need to improve student achievement has been as much a priority as calculating Adequate Yearly Progress or other accountability indicators.
Stakeholder Buy-in and Involvement Even though Virginia developed a ten-year plan, starting in 2002, for developing their expanded data system, they were constrained by the need to make a lot of progress in a short period of time since governors in Virginia only serve one term. That meant that the department only had until March 2005 to develop and deploy the initial phases of the longitudinal data system. This put a tremendous amount of pressure on state education department staff and the districts, and required that leadership and staff work closely with everyone from higher education to assessment coordinators to ensure that all were kept apprised of plans and progress and that concerns raised by their stakeholders were addressed. Staff created an advisory committee of representatives from a variety of districts — large, small, urban, rural, wealthy, and not-so-wealthy. They strategically invited particular staffers who had been generally more resistant to change to participate in the advisory board in order to hear and address their complaints and questions early on in the process. Virginia, like all states, has districts of varying sizes (from 303 students to 164,000) and resource levels. Large districts often have more resources (staff and money) to devote to information systems, training, and programming than their state counterparts. In Virginia, the Fairfax County school district had developed their own data warehouse and a sophisticated student-level data system, and had a full a research and evaluation staff before the state began developing its own data system. On the other hand, most school districts in the state barely had the information technology staff to create the files necessary to meet state reporting requirements, much less analyze their data and share them with their teachers. The new system would have to be built to meet the
by contrast, efforts to develop data systems have been consistently focused on meeting state and federal reporting requirements. State legislators launched CALPADS to meet new federal reporting requirements for NCLB as well as Perkins regulations for career and technical education. Moving to a student-level data collection system will clearly help California meet current and future reporting requirements more easily. However, education advocates in California lament that there is little energy being put into getting the student-level data into the hands of local educators in a timely fashion so that they can improve instruction and student achievement.
Financial Support from the State The SOL Technology Initiative was launched prior to NCLB with a $360 million appropriation from the general assembly. These funds were provided to the department and schools to build the infrastructure for a statewide online testing system and to increase computer and internet use in the schools.
9
Virginia used NCLB Assessment funds to pilot the new system prior to making it a statewide effort and asking for state funds. Based on the vision of a long-term data collection, storage and reporting system, staff estimated a $35 million price tag to expand the pilot to the entire state. Since the state could not afford to fund the entire system at once, they began to work on it piecemeal. Since 2004, the general assembly has appropriated more than $13 million to support the development of the new data system.
10 The annual costs for what
is in place as of 2008 run about $3.5 million. Virginia received a $6.1 million grant in 2007 from the federal government to enhance the data system for collecting, reporting, and analyzing student data from school divisions. The grant will enable the state to develop an electronic system that allows for the exchange of student records between schools within Virginia and between P-12 and postsecondary institutions. In addition, they will expand their current web-based user interface and conduct additional training for administrators, counselors and teachers who use the data warehouse.
Challenges to Address
Concerns about Data Use Virginia did not have state testing identifiers prior to building the system and did not have the ability to track student test scores over time, but they
A Byte at the Apple
132 133
Building Longitudinal Data Systems in Kansas and Virginia
One recent development was the advent of “interoperability standards.” With these new standards and specific software and hardware, it was possible to more easily share data across different data systems within a district (e.g., student information, assessment, transportation, library and health) and to more easily share data between districts and the state, regardless of the vendor or software on which the district system was based. Virginia introduced new interoperability standards to the districts at the same time to make data transfers from schools to districts to the state more consistent and to reduce burden on the districts. Prior to the development of the new data system, Virginia districts had to submit approximately 50 aggregate data collections to the state. By 2005, the department had incorporated all of those data collections into the new system and all students had unique identifiers.
Postsecondary Connection
Virginia used to have a state law preventing the education department from sharing student-level data with higher education, but recent state legislation now requires the P-12, higher education, and community college sectors to work together to build a P-16 (pre-K through college) data system. As in many states, Virginia’s education department does not collect students’ social security numbers; it assigns and maintains its own identifiers to students. Postsecondary institutions and governing agencies, however, collect and use students’ social security numbers, so students’ records cannot be matched based on a single identifier. A cross-walk system — based on fields such as names, date of birth, gender, etc. — needs to be developed in order to ensure that the correct records from each sector are matched together. Virginia’s P-16 Council was created in 2005 and is chaired by the state secretary of education. The council is charged with exploring ways to ensure that P-12 students are prepared for college and/or a career upon graduation from high school, to help define college and career standards, and to work with the state’s education department, the community college system, and the State Council of Higher Education for Virginia (SCHEV) to find ways to share data.
11
SCHEV has had a student data system since 1992 and also has a data warehouse for reporting purposes. The new P-12 system has been built
needs of most districts and not complicate the systems in place in larger, more sophisticated districts.
Selecting a Vendor and Designing the System Virginia, like most other states, is a strong “local control” state, meaning that the state education department cannot dictate much to its districts. Local control extends to the student information systems purchased at the district level. Districts purchase their student information systems from the vendor of their choice; consequently, there are systems developed and maintained by a plethora of vendors across the state. Any changes to the state data collection system must take into consideration the various types of systems maintained by the districts. As a leader in the construction of a new generation of data systems, Virginia learned a lot of lessons the hard way. One such lesson was that, while there were a handful of vendors in the education arena promising that they could build a system, the vendors had much to learn about assigning and deploying student identifiers on a statewide scale, building data warehouses, and collecting data from districts. State education department staff thought they would get more guidance from the vendor than they did, and the vendor had a lot to learn about working with so many diverse districts. It was critical, therefore, that the department create advisory committees to ensure that districts were vested in building the system and would help the vendor and department staff understand the complications and constraints involved in building this system.
Data Sharing and Use
Technological Issues As stated previously, the fact that there were a variety of vendors supplying student information systems to the 132 districts, and that the state education department was introducing a state-level vendor and drastically different data collection procedures into the mix, created a difficult situation for all parties, especially since existing data collections had to continue until the new system was deployed. The hardware and software technology available for individual-level tracking systems had improved drastically in the years leading up to the NCLB era, but changes to existing systems were not easy or cheap.
A Byte at the Apple
134 135
Building Longitudinal Data Systems in Kansas and Virginia
exchange tools for schools and higher education institutions to use for sharing electronic transcripts.
Expanding Research The Virginia Department of Education, under the direction of the new executive director of research and strategic planning, is working on a research and evaluation agenda. Along with that agenda comes the work of identifying additional data elements needed for further research and balancing those needs with the desire to limit data reporting burdens for the districts. As the potential uses of student-level data expand, so do the potential abuses. The state will continue work on establishing data governance policies, both internally and externally, that specify who can have access to which data and how they will be used and reported.
Staying State of the Art As mentioned previously, Virginia has been on the cutting edge of states developing longitudinal student data systems. Staffers are constantly researching activities involving other states, vendors, and industries in order to ensure that they know about the latest available solutions. As long as the state does not inadvertently add to the burden of the districts by constantly changing or adding new solutions without investigating the true value of the new technology, Virginia should remain a model for other states.
Summary
Kansas and Virginia have been successful in implementing longitudinal data systems due in large part to three factors: the leadership of a data champion or champions, the ability of the state education agency to accomplish a great deal without being micromanaged, and the shared goals for the data system. In Kansas, the chief provided political support to implement a lot of changes at once, and without a lot of legislative involvement and oversight. In Virginia, the governor used his executive privilege to implement a pilot data system to test the concept and garner local and state support. California, however, has not benefitted from a strong data champion who could bring parties together to support the main purpose of the new data system. There are many strong data advocates in California and the state has benefitted from various pieces
completely separate from the higher education system; even the electronic student record exchange systems are different. In hindsight, staff at the education department acknowledge that they should have begun working with SCHEV and other higher education organizations earlier in the process of building EIMS, especially now that work has begun in both sectors around electronic student record exchange.
District Access and Use of Data EIMS and the web-based data warehouse provide more historical student-level data to teachers and principals than ever before in an easy-to-use format. District staff and the Virginia Department of Education continue to work together to make the data warehouse easy to use with little training and to make sure that it contains easily accessible reports (with data at the district, school or student level) and analyses to inform the work of teachers, counselors and administrators. The types of student- and teacher-level data included in the data warehouse are: results from state assessments (updated weekly), SAT and AP test scores, literacy screening results, exit data, as well as attendance and promotion/retention records.
Future Goals
Expanding the Data Virginia wants to include additional student-level demographic and program data in EIMS in order to get a more complete picture of its students and to understand the various factors affecting student achievement, especially related to different program areas (such as special education services, bilingual and English language learner programs, and services for low-income students). As the state collects student-level course completion data, they will be added to the data warehouse. In addition, they hope to expand the amount of interoperable data that can be more easily shared across districts and with the state to include additional demographic information, assessment results, student records, and transfer information. Virginia plans to build a connection with the higher education data system. In addition to work with the P-16 Council, the education department continues to participate in conversations with admissions offices at individual higher education institutions and to develop electronic student record
A Byte at the Apple
136 137
Building Longitudinal Data Systems in Kansas and Virginia
a particular teacher needs help or if there is a systemic problem in one subject. All education stakeholders can benefit from longitudinal data to inform their actions and decisions, but this will only happen if the data system is set up to enable people to use the data.
of legislation mandating a longitudinal data system, but there is not a strong unified vision of how the system is to be built and used. Staff at the state education agency in California also do not have the ability to work flexibly without excessive oversight. Multiple state agencies and departments have an oversight role and their visions often conflict. The legislature may mandate one project or program, but the department of finance may not agree and may only partially fund it, leaving the department of education staff unable to meet their mandates. Stakeholders in both Kansas and Virginia, at both the state and district levels, are now seeing the benefits of their new student-level data systems. Among the benefits are:
Fewer data collections from the districts;��
Improved data quality;��
More current, timely data at the state level;��
The ability to identify more easily graduates, dropouts, transfers;��
The ability to share data across districts, and potentially with ��
higher education;
Increased savings at the district level (time and resources);��
Better and more use of data at the local level; and��
Better data available for research and evaluation.��
Building successful longitudinal data systems involves more than assembling the necessary hardware and software to collect and store the data. The ten essential elements of a robust longitudinal data system identified by the Data Quality Campaign are necessary, but not sufficient.
12 Success comes
from making full use of the data in the system. Kansas and Virginia focused on creating data systems that could inform state and local policy decisions and improve student achievement. This focus gave districts an additional incentive to make sure the data system works and the quality of the data is high. With longitudinal student-level data, teachers can develop individual education plans for their students; principals and district superintendents can use data at the classroom and school level to see if
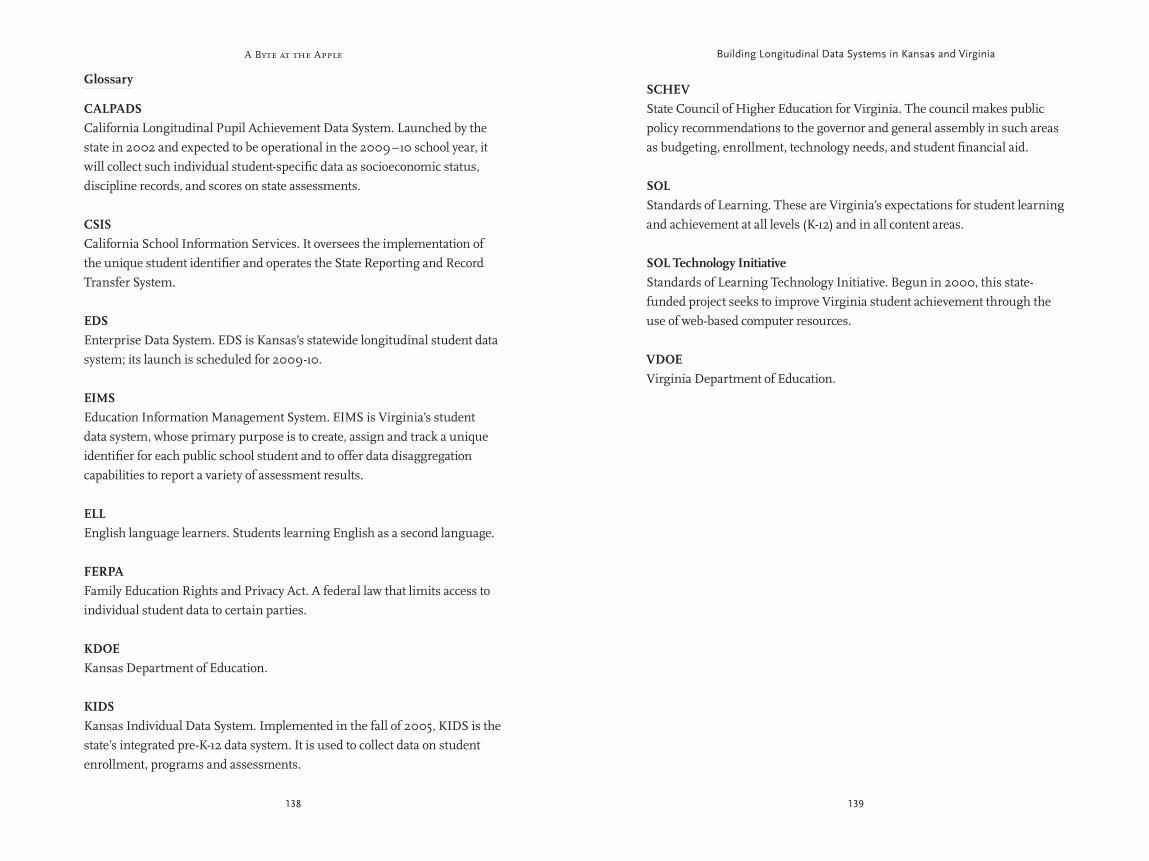
A Byte at the Apple
138 139
Building Longitudinal Data Systems in Kansas and Virginia
SCHEVState Council of Higher Education for Virginia. The council makes public policy recommendations to the governor and general assembly in such areas as budgeting, enrollment, technology needs, and student financial aid.
SOLStandards of Learning. These are Virginia’s expectations for student learning and achievement at all levels (K-12) and in all content areas.
SOL Technology InitiativeStandards of Learning Technology Initiative. Begun in 2000, this state-funded project seeks to improve Virginia student achievement through the use of web-based computer resources.
VDOEVirginia Department of Education.
Glossary
CALPADSCalifornia Longitudinal Pupil Achievement Data System. Launched by the state in 2002 and expected to be operational in the 2009 – 10 school year, it will collect such individual student-specific data as socioeconomic status, discipline records, and scores on state assessments.
CSISCalifornia School Information Services. It oversees the implementation of the unique student identifier and operates the State Reporting and Record Transfer System.
EDSEnterprise Data System. EDS is Kansas’s statewide longitudinal student data system; its launch is scheduled for 2009-10.
EIMSEducation Information Management System. EIMS is Virginia’s student data system, whose primary purpose is to create, assign and track a unique identifier for each public school student and to offer data disaggregation capabilities to report a variety of assessment results.
ELLEnglish language learners. Students learning English as a second language.
FERPAFamily Education Rights and Privacy Act. A federal law that limits access to individual student data to certain parties.
KDOEKansas Department of Education.
KIDSKansas Individual Data System. Implemented in the fall of 2005, KIDS is the state’s integrated pre-K-12 data system. It is used to collect data on student enrollment, programs and assessments.
A Byte at the Apple
140
Endnotes
Different states approach the Data Quality Campaign (DQC) survey in different 1
ways: some don’t indicate that they have one of the ten elements until their
system is fully functional in the area, while others will take credit for having an
element planned even it if is not yet up and running.
Historically, states have built data collections and warehouses or reporting tools 2
in silos; that is, each data collection is self-contained and does not connect to
tools in other program areas. The “enterprise”-wide collection and warehouse
incorporates data from across the agency into one system, so that data can be
connected and analysis of the data can show the relationships between the
different program areas.
Kansas did not claim credit on the 2008 DQC survey for having these elements 3
in place. Staff in Kansas who responded to the DQC survey have stated publicly
that they respond conservatively to the survey rather than taking credit for what
they cannot yet do.
Gosa, Kathy. “Building for Enterprise Data Management: The Kansas 4
Approach.” Presentation made to the NCES MIS Conference, March 2007.
Gosa, Kathy. Email communication, September 8, 2008.5
Gosa, Kahty. “Kansas Individual Data on Students (KIDS): The Ongoing Story.” 6
Presentation made to NCES MIS Conference, March 2007.
Kansas State Department of Education: Data Governance Program, 7
Version 2.0., 2008.
Virginia 2000 Appropriation Act (Item 143 C 11). http://www.doe.virginia.gov/8
VDOE/Technology/soltech/LegislativeDocs/item143.htm)
“Virginia Case Study: Building a Student-Level Longitudinal Data System.” 9
Data Quality Campaign, 2006.
2007 Report to the Governor and General Assembly. Virginia’s P-16 Education 10
Council, 2007. http://www.education.virginia.gov/initiatives/P-16Council/
P-16_2007Report.pdf
For more information about Virginia’s P-16 Council, see 11
http://www.education.virginia.gov/Initiatives/P-16Council/index.cfm.
Other fundamentals of a robust system include a data warehouse or other 12
repository from which robust reports and analyses can be culled, protection
of student privacy, and connection to financial data in order to understand the
return on investment of various programs.
142 143
The Student Data Backpack
The Student Data Backpack
Margaret Raymond
Margaret Raymond is director of the Center for Research on
Education Outcomes (CREDO) at Stanford University
The world of education data is rapidly evolving. As accountability policies exert more pressure on schools to demonstrate student achievement, educators are becoming more focused on using available information about their students, resources and practices
to understand current levels of performance and to glean possible paths to improvement. So-called evidence-based or data-driven organizations put rhetoric and conventional wisdom to the test, and thereby chart a truer course to effective teaching and subsequent student learning. Or so the theory goes. As appealing as the rosy picture is in the abstract, the reality in schools and districts across the United States is more mixed. To be sure, there are local education agencies (LEAs) that have well developed information systems, or whose leaders understand the value of regular review of their schools’ efforts and their effect on students’ progress. But even these enlightened instances face the same hurdle that confronts so many others. The entire data-driven enterprise is a house of cards if the data that serve as its foundation are filled with errors, are incomplete, or do not capture the details that educators and policymakers most need. To realize improvements in student achievement, accurate and complete data on students should be made available to educators, policy analysts and
other decision makers in a timely manner. Those decision-makers require confidence that the data have integrity, that they are complete and accurate. This chapter diagnoses the multiple points of failure in current practice that result in poor data quality — including people, data system architecture, and prevailing information management processes — to illustrate how the incentives to collect and manage data that are complete, accurate and timely are diluted. The diagnosis begs a new approach that will create one essential subset of education data, or information about students and their backgrounds. The Student Data Backpack proposed here creates a different mechanism for collecting and maintaining certain kinds of student data that are currently collected in flawed ways. It begins with a data file that interacts with both parents and LEAs. The Student Data Backpack will be attractive to families because it provides an easy way for parents to enroll their child in school, but its real benefit is that it contributes to the completeness, accuracy and timeliness of critical data. This will give educators and policymakers a firmer foundation for their work, and parents will become fuller partners in their children’s education. The Student Data Backpack also uses a social networking model to support and enhance parents’ natural interest in their child’s education.
Diagnosis of Current Data Quality
Poor data quality has important consequences for schools and students. Schools can lose funding if they undercount attendance or delivery of program services such as special education or Free and Reduced Price Lunch. Auditing data quality and correcting data errors are costly and LEAs usually avoid doing them in order to economize. But if details of student progress or teacher support programs are flawed, schools could allocate their resources imperfectly, potentially perpetuating ineffective practices or terminating successful ones.
1
Given the value of sound data, one might reasonably question why LEAs do not undertake programs of improvement in their information technologies and practices. The manner by which schools and districts gather, store and update their data today is less the product of careful planning and design than of gradual evolution and marginal adjustments. Some effort has been devoted to crafting unifying solutions, but to date these efforts have been at the margin. A more general re-engineering of existing data collection, transfer and storage practices as is proposed here has not been considered.
A Byte at the Apple
144 145
The Student Data Backpack
Data Storage The databases into which a student’s information is entered create their own barriers to high quality data and its use. Each database is proprietary and has its own data dictionary (the list of variables that it contains and the formats for each variable). Once a state or school district adopts a vendor and its data dictionary, it is quite costly to swap vendors. Indeed, the vendors have created that barrier as a means to retain their customer base. Two significant barriers result from the fact that variables and formats are not standardized. First is the difficulty of data exchange with other information systems, such as transportation management or food service applications. It is common practice that each system collects its own data on students, often at different points in time, so that inconsistent data on students exist across the various applications. The second is that unique data dictionaries make it difficult for schools and districts to use their data easily to file state mandated reports; often, customers must pay for an additional layer of software or programming to manipulate the contents of the database into the formats required by the state education departments. Thus, even if an LEA collects the “correct” data on students and their backgrounds, the way the variables are collected and the formats that the variables assume in different applications can make it challenging for LEAs to access and rely on the data they have on hand. Recent developments point to a more promising future. The U.S. Department of Education has placed pressure on vendors of student information systems to make their database structures more uniform so that information can be exchanged across vendor platforms. Under the Education Data Electronic Network (EDEN), state education departments are required to use a uniform data dictionary when reporting on federal education program activities in their state, beginning in the 2006 – 07 school year. Early indications suggest that data coming from the SEAs are slowly converging on the EDEN requirements, which means that SEAs are shouldering the burden of translating the multiple coding formats from LEAs. It is clear that LEAs will inevitably be required to conform to the new variable formats. The problem of having volumes of information isolated from each other — so-called silos — is common with information management systems generally, and has a well documented history in business and other fields.
4
Public education lags behind other sectors in the design and use of information
The sections below summarize some pressing data quality challenges and offers some diagnoses.
Flawed Student Data Collection Practices The initial point of data collection is the single most influential moment to ensure data quality, yet it typically receives the least attention.
2 When a parent
wishes to register his or her child for school, a personal visit to the school or district central office is required. Identity and required immunizations are verified, and then parents fill out registration forms that are populated with the data fields the state, district or school requires. These data are then input by district personnel into computerized databases. Input errors are common, and parents are often dissuaded from providing full information about their child out of embarrassment or fear of having their child relegated to inferior opportunities. While distortions are probably inevitable, the typical set-up exacerbates rather than minimizes that risk. After this initial encounter, parents are asked repeatedly to supply much of the same information in a variety of forms, such as emergency contact information, known food allergies, permission slips, and so on. However, rarely is any effort made to check the accuracy of the data or update the original data record, which can rapidly become outdated, especially the address and telephone information for mobile populations. The majority of mobile families do not forego telephone or cable connections when they move, but there is currently no mechanism for maintaining current information for mobile students. There is little research on how widespread the problem is. In the course of developing data for a national study, one research group graded the student data sets provided to it by schools and found that while a few schools delivered flawless data, the average school had errors or missing values in over 20 percent of the fields.
3 State education departments have found it necessary to invest
extensively in electronic data checkers to examine information provided by LEAs before allowing that data into state education agency (SEA) databases. Two fundamental problems are evident in this description. The first is that current data collection practice presumes that student data have a long half-life, but for significant numbers of students, the assumption is flawed when it comes to things like phone numbers and addresses. Second, once data are gathered by LEA personnel, there is no ownership of the duty to maintain currency or quality, since each opportunity for collection is treated independently.
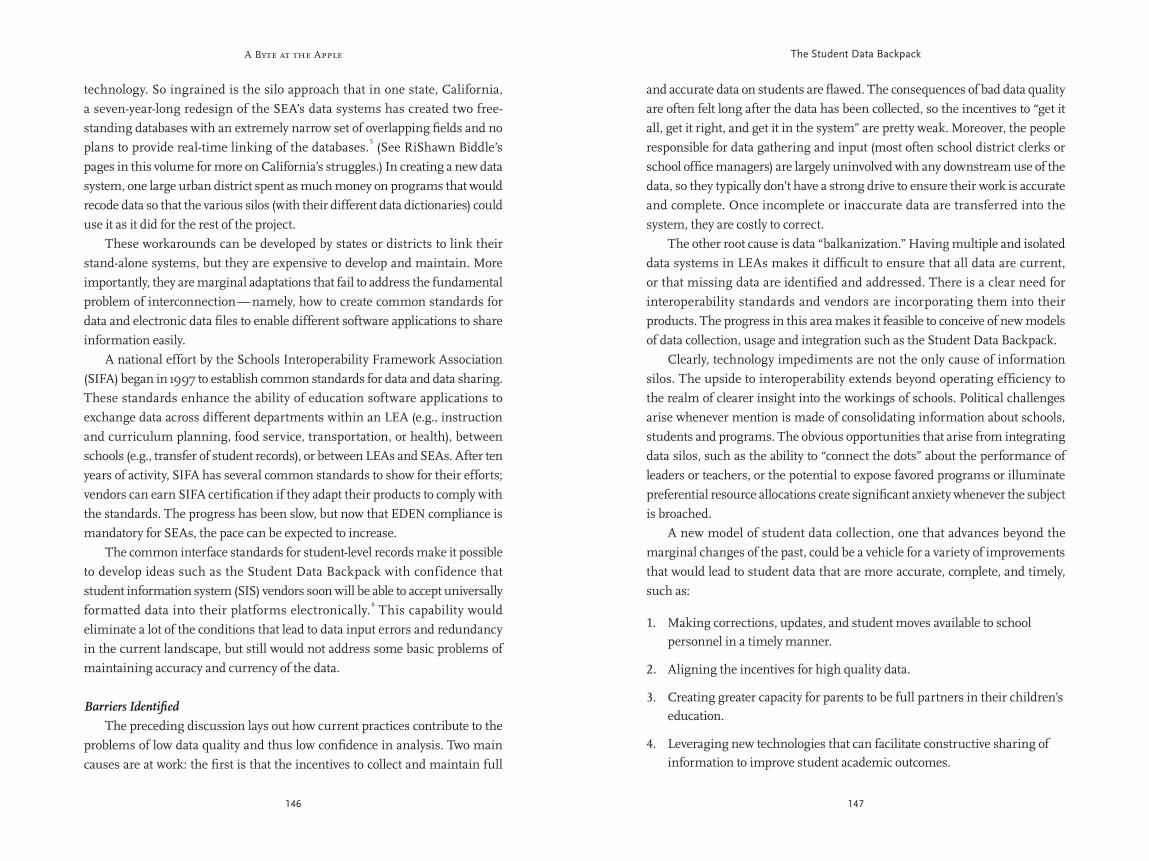
A Byte at the Apple
146 147
The Student Data Backpack
and accurate data on students are flawed. The consequences of bad data quality are often felt long after the data has been collected, so the incentives to “get it all, get it right, and get it in the system” are pretty weak. Moreover, the people responsible for data gathering and input (most often school district clerks or school office managers) are largely uninvolved with any downstream use of the data, so they typically don’t have a strong drive to ensure their work is accurate and complete. Once incomplete or inaccurate data are transferred into the system, they are costly to correct. The other root cause is data “balkanization.” Having multiple and isolated data systems in LEAs makes it difficult to ensure that all data are current, or that missing data are identified and addressed. There is a clear need for interoperability standards and vendors are incorporating them into their products. The progress in this area makes it feasible to conceive of new models of data collection, usage and integration such as the Student Data Backpack. Clearly, technology impediments are not the only cause of information silos. The upside to interoperability extends beyond operating efficiency to the realm of clearer insight into the workings of schools. Political challenges arise whenever mention is made of consolidating information about schools, students and programs. The obvious opportunities that arise from integrating data silos, such as the ability to “connect the dots” about the performance of leaders or teachers, or the potential to expose favored programs or illuminate preferential resource allocations create significant anxiety whenever the subject is broached. A new model of student data collection, one that advances beyond the marginal changes of the past, could be a vehicle for a variety of improvements that would lead to student data that are more accurate, complete, and timely, such as:
Making corrections, updates, and student moves available to school 1. personnel in a timely manner.
Aligning the incentives for high quality data.2.
Creating greater capacity for parents to be full partners in their children’s 3. education.
Leveraging new technologies that can facilitate constructive sharing of 4. information to improve student academic outcomes.
technology. So ingrained is the silo approach that in one state, California, a seven-year-long redesign of the SEA’s data systems has created two free-standing databases with an extremely narrow set of overlapping fields and no plans to provide real-time linking of the databases.
5 (See RiShawn Biddle’s
pages in this volume for more on California’s struggles.) In creating a new data system, one large urban district spent as much money on programs that would recode data so that the various silos (with their different data dictionaries) could use it as it did for the rest of the project. These workarounds can be developed by states or districts to link their stand-alone systems, but they are expensive to develop and maintain. More importantly, they are marginal adaptations that fail to address the fundamental problem of interconnection — namely, how to create common standards for data and electronic data files to enable different software applications to share information easily. A national effort by the Schools Interoperability Framework Association (SIFA) began in 1997 to establish common standards for data and data sharing. These standards enhance the ability of education software applications to exchange data across different departments within an LEA (e.g., instruction and curriculum planning, food service, transportation, or health), between schools (e.g., transfer of student records), or between LEAs and SEAs. After ten years of activity, SIFA has several common standards to show for their efforts; vendors can earn SIFA certification if they adapt their products to comply with the standards. The progress has been slow, but now that EDEN compliance is mandatory for SEAs, the pace can be expected to increase. The common interface standards for student-level records make it possible to develop ideas such as the Student Data Backpack with confidence that student information system (SIS) vendors soon will be able to accept universally formatted data into their platforms electronically.
6 This capability would
eliminate a lot of the conditions that lead to data input errors and redundancy in the current landscape, but still would not address some basic problems of maintaining accuracy and currency of the data.
Barriers Identified The preceding discussion lays out how current practices contribute to the problems of low data quality and thus low confidence in analysis. Two main causes are at work: the first is that the incentives to collect and maintain full
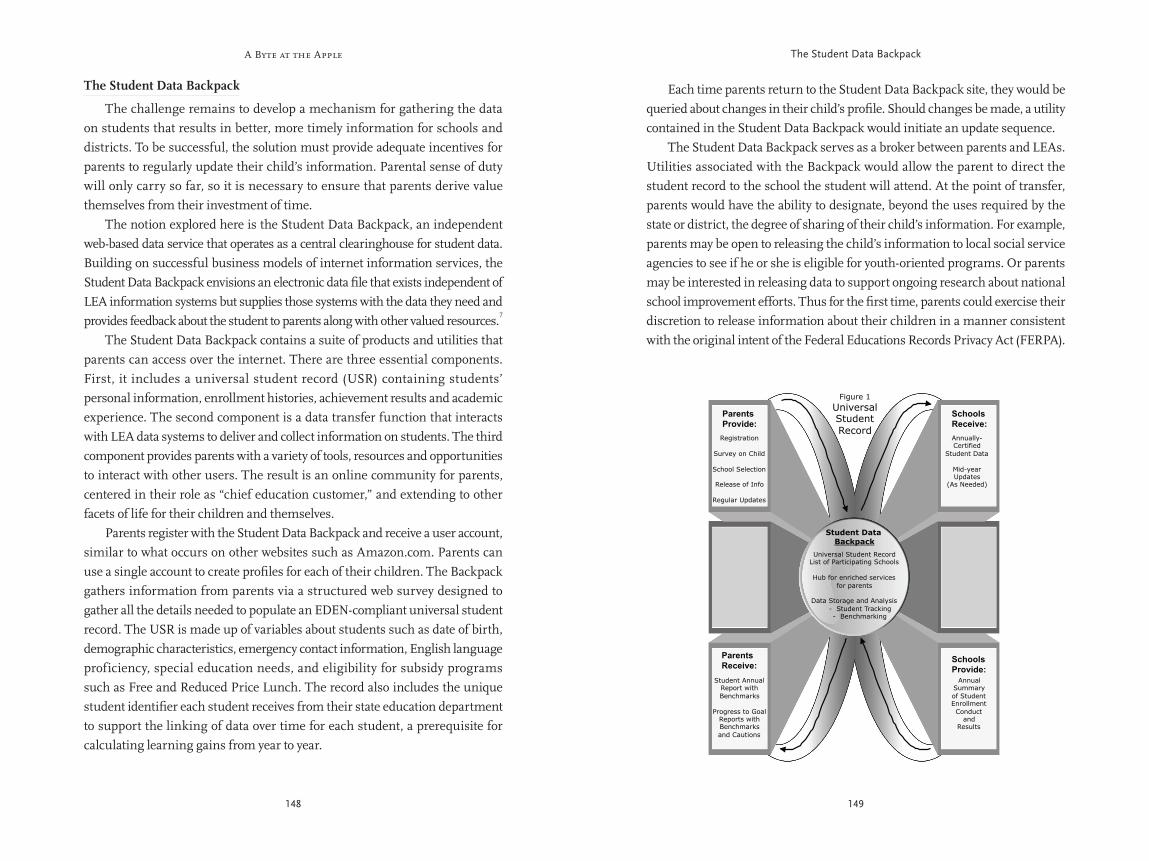
A Byte at the Apple
148 149
The Student Data Backpack
Each time parents return to the Student Data Backpack site, they would be queried about changes in their child’s profi le. Should changes be made, a utility contained in the Student Data Backpack would initiate an update sequence. The Student Data Backpack serves as a broker between parents and LEAs. Utilities associated with the Backpack would allow the parent to direct the student record to the school the student will attend. At the point of transfer, parents would have the ability to designate, beyond the uses required by the state or district, the degree of sharing of their child’s information. For example, parents may be open to releasing the child’s information to local social service agencies to see if he or she is eligible for youth-oriented programs. Or parents may be interested in releasing data to support ongoing research about national school improvement efforts. Thus for the fi rst time, parents could exercise their discretion to release information about their children in a manner consistent with the original intent of the Federal Educations Records Privacy Act (FERPA).
The Student Data Backpack
The challenge remains to develop a mechanism for gathering the data on students that results in better, more timely information for schools and districts. To be successful, the solution must provide adequate incentives for parents to regularly update their child’s information. Parental sense of duty will only carry so far, so it is necessary to ensure that parents derive value themselves from their investment of time. The notion explored here is the Student Data Backpack, an independent web-based data service that operates as a central clearinghouse for student data. Building on successful business models of internet information services, the Student Data Backpack envisions an electronic data fi le that exists independent of LEA information systems but supplies those systems with the data they need and provides feedback about the student to parents along with other valued resources.
7
The Student Data Backpack contains a suite of products and utilities that parents can access over the internet. There are three essential components. First, it includes a universal student record (USR) containing students’ personal information, enrollment histories, achievement results and academic experience. The second component is a data transfer function that interacts with LEA data systems to deliver and collect information on students. The third component provides parents with a variety of tools, resources and opportunities to interact with other users. The result is an online community for parents, centered in their role as “chief education customer,” and extending to other facets of life for their children and themselves. Parents register with the Student Data Backpack and receive a user account, similar to what occurs on other websites such as Amazon.com. Parents can use a single account to create profi les for each of their children. The Backpack gathers information from parents via a structured web survey designed to gather all the details needed to populate an EDEN-compliant universal student record. The USR is made up of variables about students such as date of birth, demographic characteristics, emergency contact information, English language proficiency, special education needs, and eligibility for subsidy programs such as Free and Reduced Price Lunch. The record also includes the unique student identifi er each student receives from their state education department to support the linking of data over time for each student, a prerequisite for calculating learning gains from year to year.
Registration
Survey on Child
School Selection
Release of Info
Regular Updates
Student Data
Backpack
Universal Student Record List of Participating Schools
Hub for enriched services
for parents
Data Storage and Analysis
- Student Tracking - Benchmarking
Parents
Provide:
Parents
Receive:
Student Annual Report with
Benchmarks
Progress to Goal Reports with Benchmarks
and Cautions
Annually- Certified
Student Data
Mid-year Updates
(As Needed)
Schools
Receive:
Schools
Provide:
Annual Summary
of Student Enrollment
Conduct and
Results
Figure 1
Universal Student
Record
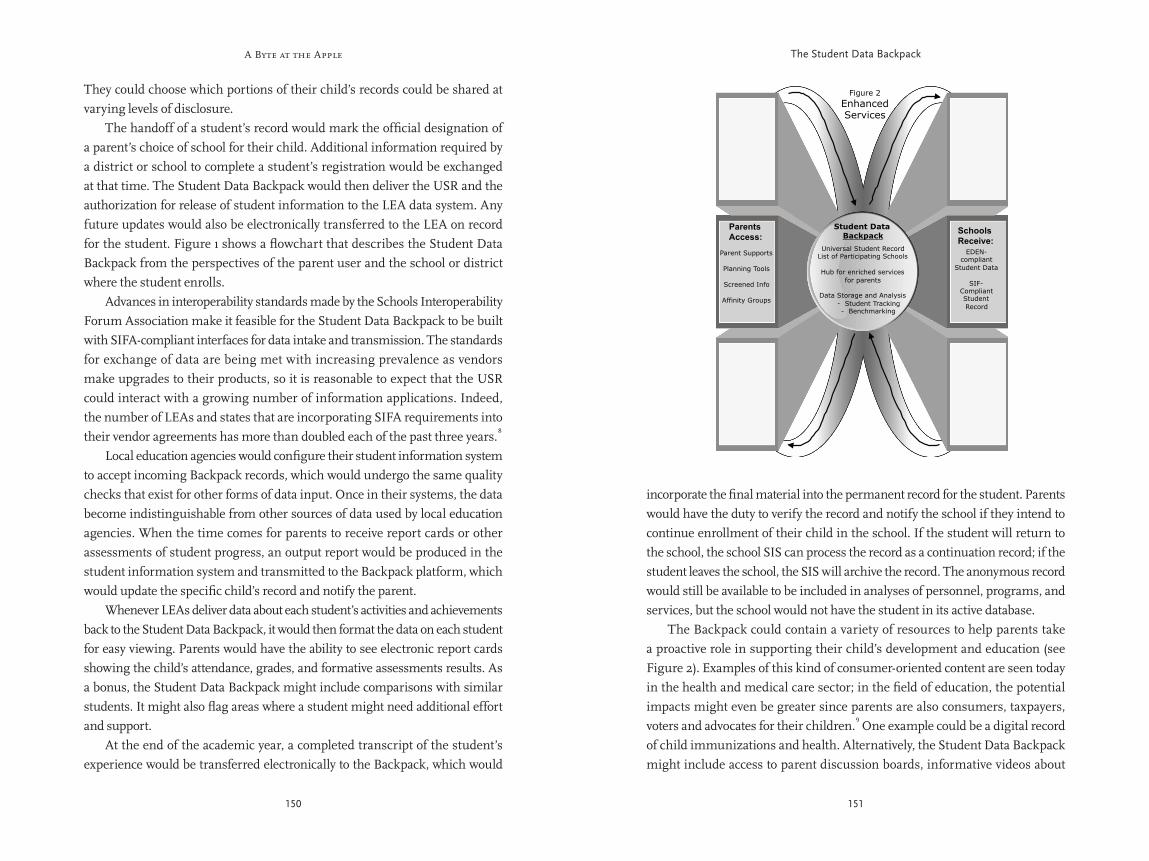
A Byte at the Apple
150 151
The Student Data Backpack
incorporate the fi nal material into the permanent record for the student. Parents would have the duty to verify the record and notify the school if they intend to continue enrollment of their child in the school. If the student will return to the school, the school SIS can process the record as a continuation record; if the student leaves the school, the SIS will archive the record. The anonymous record would still be available to be included in analyses of personnel, programs, and services, but the school would not have the student in its active database. The Backpack could contain a variety of resources to help parents take a proactive role in supporting their child’s development and education (see Figure 2). Examples of this kind of consumer-oriented content are seen today in the health and medical care sector; in the fi eld of education, the potential impacts might even be greater since parents are also consumers, taxpayers, voters and advocates for their children.
9 One example could be a digital record
of child immunizations and health. Alternatively, the Student Data Backpack might include access to parent discussion boards, informative videos about
They could choose which portions of their child’s records could be shared at varying levels of disclosure. The handoff of a student’s record would mark the offi cial designation of a parent’s choice of school for their child. Additional information required by a district or school to complete a student’s registration would be exchanged at that time. The Student Data Backpack would then deliver the USR and the authorization for release of student information to the LEA data system. Any future updates would also be electronically transferred to the LEA on record for the student. Figure 1 shows a fl owchart that describes the Student Data Backpack from the perspectives of the parent user and the school or district where the student enrolls. Advances in interoperability standards made by the Schools Interoperability Forum Association make it feasible for the Student Data Backpack to be built with SIFA-compliant interfaces for data intake and transmission. The standards for exchange of data are being met with increasing prevalence as vendors make upgrades to their products, so it is reasonable to expect that the USR could interact with a growing number of information applications. Indeed, the number of LEAs and states that are incorporating SIFA requirements into their vendor agreements has more than doubled each of the past three years.
8
Local education agencies would confi gure their student information system to accept incoming Backpack records, which would undergo the same quality checks that exist for other forms of data input. Once in their systems, the data become indistinguishable from other sources of data used by local education agencies. When the time comes for parents to receive report cards or other assessments of student progress, an output report would be produced in the student information system and transmitted to the Backpack platform, which would update the specifi c child’s record and notify the parent. Whenever LEAs deliver data about each student’s activities and achievements back to the Student Data Backpack, it would then format the data on each student for easy viewing. Parents would have the ability to see electronic report cards showing the child’s attendance, grades, and formative assessments results. As a bonus, the Student Data Backpack might include comparisons with similar students. It might also fl ag areas where a student might need additional effort and support. At the end of the academic year, a completed transcript of the student’s experience would be transferred electronically to the Backpack, which would
Parent Supports
Planning Tools
Screened Info
Affinity Groups
Student Data
Backpack
Universal Student Record List of Participating Schools
Hub for enriched services
for parents
Data Storage and Analysis
- Student Tracking - Benchmarking
Schools
Receive:
Parents
Access:
EDEN- compliant
Student Data
SIF- Compliant Student
Record
Figure 2
Enhanced Services
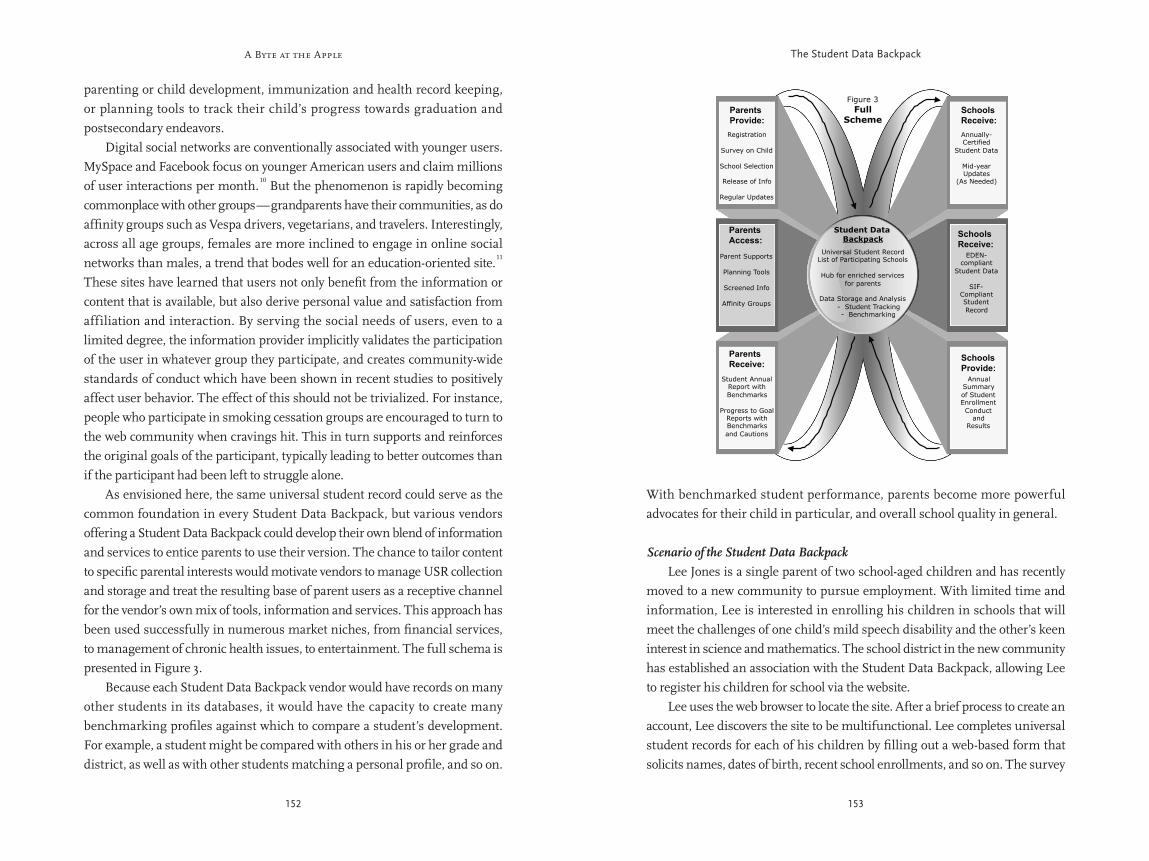
A Byte at the Apple
152 153
The Student Data Backpack
With benchmarked student performance, parents become more powerful advocates for their child in particular, and overall school quality in general.
Scenario of the Student Data Backpack Lee Jones is a single parent of two school-aged children and has recently moved to a new community to pursue employment. With limited time and information, Lee is interested in enrolling his children in schools that will meet the challenges of one child’s mild speech disability and the other’s keen interest in science and mathematics. The school district in the new community has established an association with the Student Data Backpack, allowing Lee to register his children for school via the website. Lee uses the web browser to locate the site. After a brief process to create an account, Lee discovers the site to be multifunctional. Lee completes universal student records for each of his children by fi lling out a web-based form that solicits names, dates of birth, recent school enrollments, and so on. The survey
parenting or child development, immunization and health record keeping, or planning tools to track their child’s progress towards graduation and postsecondary endeavors. Digital social networks are conventionally associated with younger users. MySpace and Facebook focus on younger American users and claim millions of user interactions per month.
10 But the phenomenon is rapidly becoming
commonplace with other groups — grandparents have their communities, as do affi nity groups such as Vespa drivers, vegetarians, and travelers. Interestingly, across all age groups, females are more inclined to engage in online social networks than males, a trend that bodes well for an education-oriented site.
11
These sites have learned that users not only benefi t from the information or content that is available, but also derive personal value and satisfaction from affiliation and interaction. By serving the social needs of users, even to a limited degree, the information provider implicitly validates the participation of the user in whatever group they participate, and creates community-wide standards of conduct which have been shown in recent studies to positively affect user behavior. The effect of this should not be trivialized. For instance, people who participate in smoking cessation groups are encouraged to turn to the web community when cravings hit. This in turn supports and reinforces the original goals of the participant, typically leading to better outcomes than if the participant had been left to struggle alone. As envisioned here, the same universal student record could serve as the common foundation in every Student Data Backpack, but various vendors offering a Student Data Backpack could develop their own blend of information and services to entice parents to use their version. The chance to tailor content to specifi c parental interests would motivate vendors to manage USR collection and storage and treat the resulting base of parent users as a receptive channel for the vendor’s own mix of tools, information and services. This approach has been used successfully in numerous market niches, from fi nancial services, to management of chronic health issues, to entertainment. The full schema is presented in Figure 3. Because each Student Data Backpack vendor would have records on many other students in its databases, it would have the capacity to create many benchmarking profi les against which to compare a student’s development. For example, a student might be compared with others in his or her grade and district, as well as with other students matching a personal profi le, and so on.
Parent Supports
Planning Tools
Screened Info
Affinity Groups
Registration
Survey on Child
School Selection
Release of Info
Regular Updates
Student Data
Backpack
Universal Student Record List of Participating Schools
Hub for enriched services
for parents
Data Storage and Analysis
- Student Tracking - Benchmarking
Parents
Provide:
Schools
Receive:
Parents
Access:
Parents
Receive:
Student Annual Report with
Benchmarks
Progress to Goal Reports with Benchmarks
and Cautions
Annually- Certified
Student Data
Mid-year Updates
(As Needed)
Schools
Receive:
EDEN- compliant
Student Data
SIF- Compliant Student
Record
Schools
Provide:
Annual Summary
of Student Enrollment
Conduct and
Results
Figure 3
Full Scheme
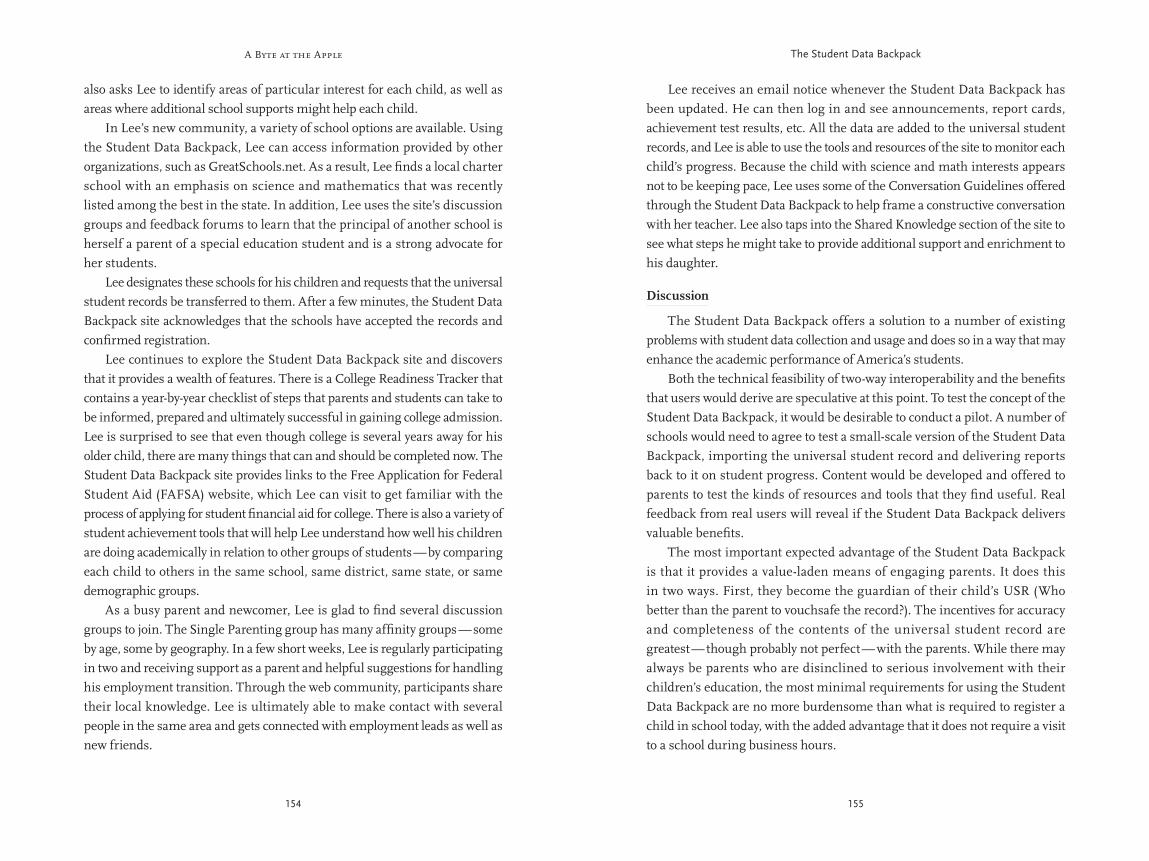
A Byte at the Apple
154 155
The Student Data Backpack
Lee receives an email notice whenever the Student Data Backpack has been updated. He can then log in and see announcements, report cards, achievement test results, etc. All the data are added to the universal student records, and Lee is able to use the tools and resources of the site to monitor each child’s progress. Because the child with science and math interests appears not to be keeping pace, Lee uses some of the Conversation Guidelines offered through the Student Data Backpack to help frame a constructive conversation with her teacher. Lee also taps into the Shared Knowledge section of the site to see what steps he might take to provide additional support and enrichment to his daughter.
Discussion
The Student Data Backpack offers a solution to a number of existing problems with student data collection and usage and does so in a way that may enhance the academic performance of America’s students. Both the technical feasibility of two-way interoperability and the benefits that users would derive are speculative at this point. To test the concept of the Student Data Backpack, it would be desirable to conduct a pilot. A number of schools would need to agree to test a small-scale version of the Student Data Backpack, importing the universal student record and delivering reports back to it on student progress. Content would be developed and offered to parents to test the kinds of resources and tools that they find useful. Real feedback from real users will reveal if the Student Data Backpack delivers valuable benefits. The most important expected advantage of the Student Data Backpack is that it provides a value-laden means of engaging parents. It does this in two ways. First, they become the guardian of their child’s USR (Who better than the parent to vouchsafe the record?). The incentives for accuracy and completeness of the contents of the universal student record are greatest — though probably not perfect — with the parents. While there may always be parents who are disinclined to serious involvement with their children’s education, the most minimal requirements for using the Student Data Backpack are no more burdensome than what is required to register a child in school today, with the added advantage that it does not require a visit to a school during business hours.
also asks Lee to identify areas of particular interest for each child, as well as areas where additional school supports might help each child. In Lee’s new community, a variety of school options are available. Using the Student Data Backpack, Lee can access information provided by other organizations, such as GreatSchools.net. As a result, Lee finds a local charter school with an emphasis on science and mathematics that was recently listed among the best in the state. In addition, Lee uses the site’s discussion groups and feedback forums to learn that the principal of another school is herself a parent of a special education student and is a strong advocate for her students. Lee designates these schools for his children and requests that the universal student records be transferred to them. After a few minutes, the Student Data Backpack site acknowledges that the schools have accepted the records and confirmed registration. Lee continues to explore the Student Data Backpack site and discovers that it provides a wealth of features. There is a College Readiness Tracker that contains a year-by-year checklist of steps that parents and students can take to be informed, prepared and ultimately successful in gaining college admission. Lee is surprised to see that even though college is several years away for his older child, there are many things that can and should be completed now. The Student Data Backpack site provides links to the Free Application for Federal Student Aid (FAFSA) website, which Lee can visit to get familiar with the process of applying for student financial aid for college. There is also a variety of student achievement tools that will help Lee understand how well his children are doing academically in relation to other groups of students — by comparing each child to others in the same school, same district, same state, or same demographic groups. As a busy parent and newcomer, Lee is glad to find several discussion groups to join. The Single Parenting group has many affinity groups — some by age, some by geography. In a few short weeks, Lee is regularly participating in two and receiving support as a parent and helpful suggestions for handling his employment transition. Through the web community, participants share their local knowledge. Lee is ultimately able to make contact with several people in the same area and gets connected with employment leads as well as new friends.
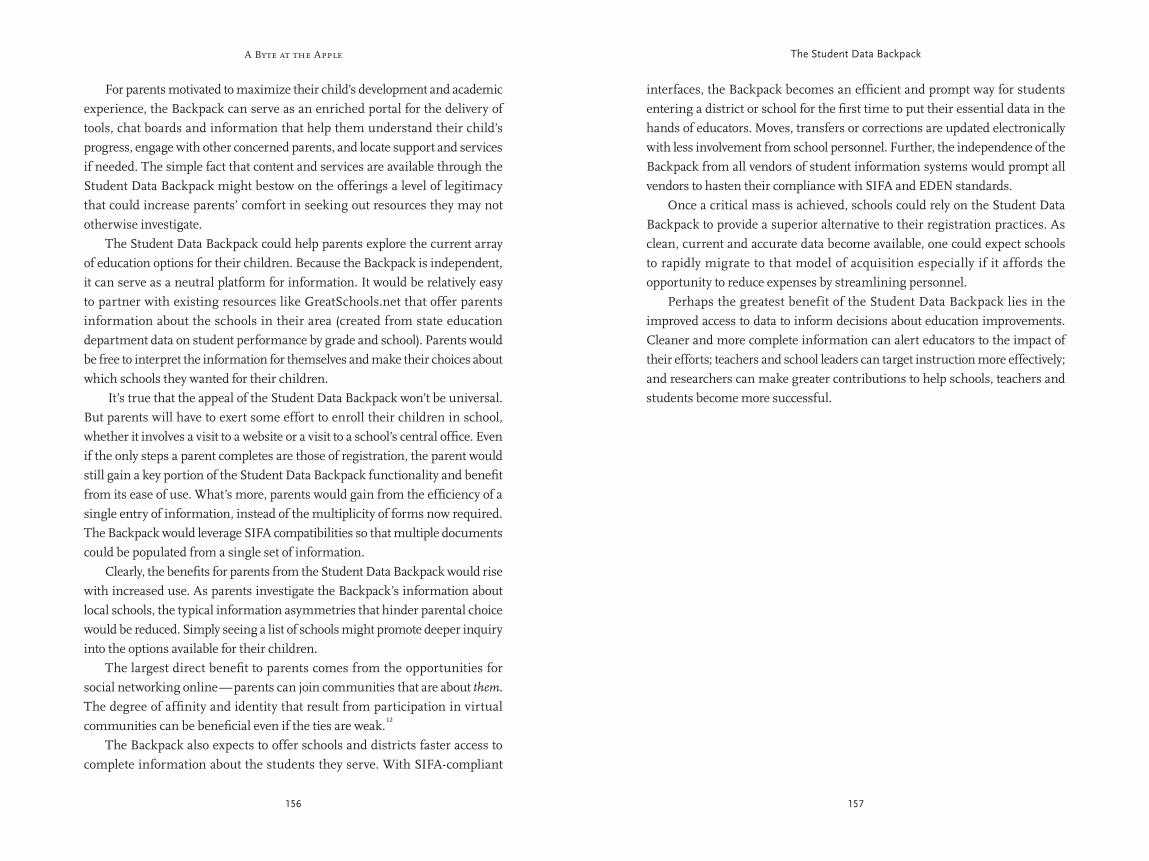
A Byte at the Apple
156 157
The Student Data Backpack
interfaces, the Backpack becomes an efficient and prompt way for students entering a district or school for the first time to put their essential data in the hands of educators. Moves, transfers or corrections are updated electronically with less involvement from school personnel. Further, the independence of the Backpack from all vendors of student information systems would prompt all vendors to hasten their compliance with SIFA and EDEN standards. Once a critical mass is achieved, schools could rely on the Student Data Backpack to provide a superior alternative to their registration practices. As clean, current and accurate data become available, one could expect schools to rapidly migrate to that model of acquisition especially if it affords the opportunity to reduce expenses by streamlining personnel. Perhaps the greatest benefit of the Student Data Backpack lies in the improved access to data to inform decisions about education improvements. Cleaner and more complete information can alert educators to the impact of their efforts; teachers and school leaders can target instruction more effectively; and researchers can make greater contributions to help schools, teachers and students become more successful.
For parents motivated to maximize their child’s development and academic experience, the Backpack can serve as an enriched portal for the delivery of tools, chat boards and information that help them understand their child’s progress, engage with other concerned parents, and locate support and services if needed. The simple fact that content and services are available through the Student Data Backpack might bestow on the offerings a level of legitimacy that could increase parents’ comfort in seeking out resources they may not otherwise investigate. The Student Data Backpack could help parents explore the current array of education options for their children. Because the Backpack is independent, it can serve as a neutral platform for information. It would be relatively easy to partner with existing resources like GreatSchools.net that offer parents information about the schools in their area (created from state education department data on student performance by grade and school). Parents would be free to interpret the information for themselves and make their choices about which schools they wanted for their children. It’s true that the appeal of the Student Data Backpack won’t be universal. But parents will have to exert some effort to enroll their children in school, whether it involves a visit to a website or a visit to a school’s central office. Even if the only steps a parent completes are those of registration, the parent would still gain a key portion of the Student Data Backpack functionality and benefit from its ease of use. What’s more, parents would gain from the efficiency of a single entry of information, instead of the multiplicity of forms now required. The Backpack would leverage SIFA compatibilities so that multiple documents could be populated from a single set of information. Clearly, the benefits for parents from the Student Data Backpack would rise with increased use. As parents investigate the Backpack’s information about local schools, the typical information asymmetries that hinder parental choice would be reduced. Simply seeing a list of schools might promote deeper inquiry into the options available for their children. The largest direct benefit to parents comes from the opportunities for social networking online — parents can join communities that are about them. The degree of affinity and identity that result from participation in virtual communities can be beneficial even if the ties are weak.
12
The Backpack also expects to offer schools and districts faster access to complete information about the students they serve. With SIFA-compliant
A Byte at the Apple
158
Endnotes
See Chrys Dougherty’s chapter, “Getting FERPA Right: Ecouraging 1
Data Use While Protecting Student Privacy” in this volume.
Ligon, Glynn. “The Data Quality Imperative” ESP Solutions Group, 2007.2
CREDO Data Quality Report Cards, Spring 2006.3
Gulati, Ranjay. “Silo Busting: How to Execute on the Promise of Customer 4
Focus.” Harvard Business Review, May 2007.
CALPADS and CALTIDES are the student and teacher databases respectively in 5
California. They are both under development–a prime chance to create a formal
nexus between the two collections–and have only a convoluted single path to
link the two together.
Collins, Laurie and Larry Fruth, et al. “The Right Data to the Right People 6
at the Right Time.” Data Quality Campaign Quarterly Issue Brief, June 2007.
One successful example is the Information Services Group 7
(http://www.informationsg.com), which amasses information from a variety
of commercial collection points to synthesize industry and sector reports for
businesses, investors and regulatory agencies.
Annual Report8 . Schools Interoperability Framework Association, 2007.
http://www.sifinfo.org.
See WebMD’s most recent financial reports to see how successful the web-9
based education and patient support: http://investor.shareholder.com/wbmd/
releasedetail.cfm?ReleaseID=326466.
As of July 2008, MySpace claimed 73 Million users and Facebook reported 10
37 Million users. This user base is predominantly in the 18-24 year old group;
they are the user group that would use the Student Data Backpack in the next
ten years.
See 11 http://investor.shareholder.com/wbmd/releasedetail.
cfm?ReleaseID=326466 for information on usage differences by gender.
Granovetter, Mark. “Economic Action and Social Structure: The Problem 12
of Embeddedness.” American Journal of Sociology 91, November 1985.
160 161
Balanced Scorecards and Management Data
Balanced Scorecards and Management Data
Frederick M. Hess and Jon Fullerton
Frederick M. Hess is director of education policy studies at the American Enterprise Institute.
Jon Fullerton is executive director of the Project for Policy Innovation in Education
at Harvard University.
Successful organizations, public and private, monitor their operations — extensively and intensively. UPS and FedEx know where every package is in transit. Dell is famous for running an extremely tight supply chain, pushing the cost of holding inventory
onto its suppliers by having a crystal clear understanding of its immediate requirements and only ordering what it needs when it needs it. Baseball teams employ sophisticated statistical analyses in making personnel decisions. Compare such approaches to what has long prevailed in public education. In 2007, Michelle Rhee, then the new chancellor of the Washington, D.C. Public Schools, reported that millions of dollars worth of textbooks and supplies had been moldering, unnoticed, in a warehouse for months and years. Few districts understand their true costs of recruiting a new teacher and principals have little idea what their schools’ actual budgets are. One consequence of this data drought is that school systems focus single-mindedly, even obsessively, on the few metrics they do have — such as test scores and expenditures. Even districts that tout themselves as “data-driven” often mean only that they can break down test scores by teacher, subject, or student population; few, in our experience, have reliable information on how satisfied principals are with the support provided by human resources or how
rapidly the information technology team addresses instructional requests. Generally speaking, this is as true when it comes to systems of charter schools as it is for traditional districts. This dearth of data makes it difficult to manage and improve the critical functions that support teaching and learning. For instance, many urban systems, though desperate for talent, are unresponsive to inquiries from promising candidates. However, absent good data on this count, senior officials are rarely even attuned to the problem. The New Teacher Project’s (TNTP) 2005 study Unintended Consequences provides a compelling illustration of how good management data can change this equation. The study reported that transfer and excess rules forced many urban schools to hire teachers they did not want while preventing them from removing teachers deemed unsuitable. On average, 40 percent of school-level vacancies were filled by voluntary transfers or “excessed” teachers in which schools had either no choice at all or limited choice in hiring. TNTP collected data from labor relations staff and reported that districts typically terminated only one or two tenured teachers a year for inadequate performance.
1 In 2005,
prodded by the furor surrounding Unintended Consequences, the New York City Department of Education and the United Federation of Teachers signed a landmark contract that reformed the staffing process for teachers and schools by enabling schools to choose which teachers they hired, regardless of seniority; ending the “bumping” of novice teachers by senior teachers; and increasing transparency in hiring. In 2008, TNTP reported that, in the first two hiring seasons, the new system allowed over 7,500 transfer and excessed teachers to obtain jobs at new schools, with 90 percent of transfer teachers and 80 percent of excessed teachers describing their new placements as satisfactory.
2
Put plainly, it is difficult to manage modern organizations for breakthrough improvement without accurate, timely data and the knowledge and willingness to use them. Yet we see a vacuum in schooling when it comes to collecting crucial data that stretch beyond reading and math scores and auditable enrollment and financial information. Test results are an important measure of student learning. Attendance is an important element of budgeting. But ensuring the high-quality provision of services requires operational measures and data well beyond those of student achievement and body counts. Districts need to complement such basic data with reliable measures that illuminate the performance of complex operations like human resources, procurement, and data management, at both the district and school levels.
A Byte at the Apple
162 163
Balanced Scorecards and Management Data
Developing and tracking appropriate metrics is the starting point in enabling effective management. Data should primarily measure not compliance (e.g., was a regulation followed?) or inputs (e.g., how much was spent?) but the efficiency, effectiveness, and quality of district services (e.g., the cost of recruiting a new math teacher, the percentage of textbooks distributed on time to the proper schools and classrooms, or how rapidly teachers can access assessment data). While discussion of “data-driven” schooling revolves today around the narrow tasks of identifying effective teachers and students who need added assistance, managing with data is more broadly concerned with making schools and the school system more supportive of teaching and learning. Doing so requires tracking an array of indicators, including the shipment and distribution of books and materials and the satisfaction of teachers with the results; the speed at which maintenance workers address school-level concerns; the percentage of teachers who rate the professional development they receive as helpful; and turnaround time on assessment data and the frequency with which those data are employed by teachers. A school system which has these kinds of data is one where management is equipped to revolutionize how schools work, how teachers are supported, and how dollars are spent.
Why Achievement Data Aren’t Enough
Over the past ten years, there has been for the first time a concerted push to hold schools accountable for their results by looking principally at student achievement data. Accountability efforts — and particularly the 800-pound-gorilla of No Child Left Behind-style testing — have created an appetite for data. Districts are collecting more achievement data than ever before, and states and districts are becoming less and less diffident about holding schools accountable for results. Many think we are on the verge of a management revolution in using data to drive achievement. In practice, however, there is a rarely acknowledged tension between collecting data with an eye to public policy and external accountability (measurement of performance) and doing so for purposes of internal management (measurement for performance). The data most useful to parents and policymakers are often straightforward data on how well students and schools are faring on content assessments; whereas the key data for district officials seeking to facilitate improvement are data that shed light inside the “black box” of the school and district — illuminating why those results look like they do. This is why the
public financial reports by corporations like General Electric or Google are quite different from the measures that managers there use when seeking to improve operations or practices. Most available achievement data are of limited use for management purposes. First, state testing regimes tend to provide measures of achievement too coarse to be of much use to teachers and principals seeking to change practice. Those districts serious about using data have adopted benchmark and/or formative assessment processes to supplement state tests. Second, a surprising number of districts are unable to easily link teachers and students in their student information systems. There can be little incentive to address this challenge, given substantial political resistance to such linkages from some teachers, unions, and others who are concerned that such data systems will be used to evaluate teachers on the basis of student achievement.
3 Finally, while
achievement tests are a useful measure of educational outcomes, they do not capture all that we expect from schools. We expect schools to teach subjects (art, music) and skills (cooperation, self-discipline) outside the reach of appropriate and cost-effective testing regimes. Even if these issues with achievement data were resolved, there are three problems with focusing solely on such outcomes. First, student achievement measures are largely irrelevant to motivating and managing a large number of important district employees. Does it really make sense to hold a payroll processor responsible for student achievement rather than the speed and accuracy of his/her work? Or for the percentage of principals and teachers who rate the payroll office’s service as courteous and attentive? In fact, it is not clear that it makes sense to encourage districts to evaluate trainers, recruiters, or data analysts on student test scores rather than on indicators which more precisely measure the quality of their work. By focusing so relentlessly on achievement, especially in just a few skill domains, many employees are either excused from results-driven accountability or held accountable for things over which they have little control. The result of this is to undermine the development of a performance ethic and foster cynicism. Second, it is easy for even talented educators to give short shrift to the operations, hiring, and financial practices that can support educators in schools and classrooms. Operations are like the air we breathe in that we scarcely notice the air around us until something goes awry, at which point there can be devastating results. Focusing on “instructional leadership” is difficult when
A Byte at the Apple
164 165
Balanced Scorecards and Management Data
effective management required collecting and monitoring performance and cost data on a range of activities that go beyond the “bottom line.” Well-designed balanced scorecards develop a clear link between operational metrics and financial performance. They install long-term financial performance as the primary objective and then identify how various operational metrics impact that outcome. Ideally, the balanced scorecard brings together, in a single management tool, many ostensibly disparate corporate concerns, such as improving customer relations, boosting product quality, investing in research and development, and developing employees.
7
In education, employing the balanced scorecard entails articulating goals for student achievement and other key student outcomes (such as completion rates) and then translating them into measures for improving operational efficiency inside and outside the classroom.
Levels of Sophistication in Data Collection
While most districts do not yet assemble the kind of data managers need, districts already collect much more than student achievement data. The amount of financial reporting alone that state and the federal governments require for compliance purposes is absurdly extensive. Indeed, these state and federal demands have historically resulted in data collection that monitors enrollment and minutely tracks broad program and personnel costs. Given limited manpower and expertise, and dated computer systems, district officials will privately concede that they have emphasized these auditing exercises rather than potentially more useful management metrics. The kinds of changes necessary to turn school systems into high-performing organizations will be dramatic. Even districts routinely heralded as data-driven and high-performing have often not invested in the technology, hired the personnel, or developed the requisite expectations, feedback loops, processes, and analytic competencies. Consequently, many schools and systems are today at the very edge of their capacities when they seek to produce student-level achievement data in a timely fashion in order to ensure that teachers can put that data to work. We do not term a hospital “well-run” because its doctors make proper use of diagnostic tools; instead, we would reserve that label for hospitals where staff are competent and efficient, supplies carefully tracked and promptly
the hiring process does not value teacher quality and assigns instructors to schools with little time to prepare for the new academic year, or when principals and teachers must wait weeks or months for assessment results. Management must monitor the overall effectiveness of key operations, as well as how those operations translate to the school level. Finally, student achievement data alone can only yield a “black box.” They will not allow organizations to diagnose problems and manage improvement. If math scores are disappointing, why is that? Is professional development the problem? Is hiring? It is as if a CEO’s management dashboard consisted of one item — the stock price. In fact, given the state of most student achievement data systems, the better analogy is to last year’s stock price. District management needs to create the preconditions and processes that foster high achievement; doing so, however, requires metrics and data that stretch well beyond student achievement. Ultimately, education leaders need to take a page from the “balanced scorecard” approach that has reshaped how private and public sector firms have approached data and management.
4
Developed in the early 1990s by Robert Kaplan and David Norton, the balanced scorecard seeks to provide a quick but comprehensive view of firm performance. It includes standard financial metrics that reflect past performance but, crucially, complement these with operational metrics on customer satisfaction, internal processes, and the organization’s learning and innovation capabilities — the key predictors of future success. In 1992, Kaplan and Norton explained in the Harvard Business Review, “Managers should not have to choose between financial and operational metrics. In observing and working with many companies, we have found that senior executives do not rely on one set of measures to the exclusion of the other. They realize that no single measure can provide a clear performance target or focus attention on the critical areas of the business.”
5
The balanced scorecard, which by 1998 had already been adopted by an estimated 60 percent of U.S. Fortune 500 companies, was a response to the recognition that relying solely on financial metrics could create distortions.
6 An
emphasis on short-term financial numbers can readily lead firms to sacrifice long-term viability. The proponents of the balanced scorecard approach recognized that enormous value resided in hard-to-measure areas like customer relations, information technology, and employee skills. They realized that
A Byte at the Apple
166 167
Balanced Scorecards and Management Data
companies measure customer service from several dimensions (internal and external) to quickly diagnose operational or professional issues that will hurt their ability to maintain the confidence of the people they serve. While many district and school officials may seek piecemeal information on the satisfaction of employees or parents, these efforts tend to be haphazard. Real progress on this count requires that customer service and satisfaction data be routinely and systematically collected and analyzed.
Data with sufficient granularity to illuminate units and activities within 4. departments: Measuring efficiency requires capturing outputs as well as practices and processes that otherwise remain in the vague cloud called “overhead.” For example, when considering the role of human resources, there are various metrics that might help illuminate how resources are being used and opportunities for improved productivity. One set would assess how long it takes a human resources department to vet, interview, consider, and hire or reject an applicant. Others would reflect how human resources managers apportion their time, such as how much time is devoted to engaging in various kinds of recruitment efforts, to addressing the concerns of existing employees, or to handling workers’ compensation. It is the exceptional district that collects that sort of data or monitors them in a fashion that permits useful analysis. Typically, systems will know how much is spent on human resources and the size of the staff, but not how much time the human resources staff spends on recruitment or responding to the needs of teachers and principals. This is a key step in the journey from basic data to useful management data.
Data connected across content areas (and to outcomes5. ): Even if the efficiency of human resources processes has improved and vacancies are filled more rapidly, more is needed to judge human resources’ effectiveness. Do the new teachers achieve better or worse student outcomes than the teachers that came before them? Do they stay longer? Are they more or less satisfied with the district’s support services? What about the new principals? Do they “lead” better? Do students in their schools learn more than students in other schools? What would be the financial impact of adding new human resources staff? What would be the expected improvement in processing time or yield? Answering these questions requires connecting human resources system data to student-
refilled, data files up-to-date, personnel needs quickly handled, and the facility well-maintained. Yet, in schooling, systems that have embraced only the most fundamental elements of professional practice are heralded (and regard themselves) as paragons of modern management. What would it take for school systems to start collecting the data that would make possible breakthrough management? There are six key needs, forming a rough hierarchy.
Accurate collection of basic student, financial, and human resource data: 1. The first step is for any organization to collect the most fundamental data on what it does and how it spends its money. School systems are generally pretty good at this. Federal law now requires school systems to test students and collect basic achievement and attainment data. Basic financial management requires districts to ensure that accounts are not overspent, that school enrollment and attendance figures are accurate, and that only authorized positions are on the payroll. Intergovernmental grants (such as Title I) require that districts account accurately for how they spent the money received and show that it was spent in accordance with regulations. Most districts are already well along on this count, as any district not doing this effectively will run into legal and financial trouble.
Data linked over time:2. Once districts have the initial building blocks, the key is to link them across time. This is essential if leaders are to determine how to improve performance. In general, a district that can collect its basic data accurately can also link them longitudinally. However, there are significant exceptions. Some systems do not maintain consistent identifiers across years for students or employees. One common problem is that organizational change is often not accounted for in financial coding systems. Districts may assign costs only to offices (such as the office of instruction) and not to functions (such as math professional development). The result is that when a district reshuffles its organizational chart (not an uncommon occurrence!) and math professional development is reassigned to human resources or a new office, it becomes impossible to make comparisons over time.
Customer service and satisfaction data: 3. Every company knows that its existence depends upon the satisfaction of its customers. Great
A Byte at the Apple
168 169
Balanced Scorecards and Management Data
achievement and school completion. Today, too many problems still exist, but most school systems can provide coherent data on how well students are doing on state assessments. However, outcome metrics beyond state assessments are often difficult for management to come by. Key data in this field include:
Performance of students on various sub-strands (e.g., number sense, ��
spatial relations on the math test) of state tests with results taken down to (and accessible to) the classroom teacher.
Item-level analysis at the individual student and classroom level. This ��
allows teachers to analyze whether all or most of their students miss the same test items — and then to adjust their teaching strategies.
Results of benchmark tests provided back in a timely manner (e.g., no ��
more than one or two days after the test is completed).
Employment or enrollment status of students after high school.��
The second domain is that of counting and tracking people and things. Monitoring the number of students and teachers, the state of facilities, and relevant district assets are all necessary to provide operational baselines. School systems have historically been good at tracking these kinds of data, largely because state and federal requirements led districts to configure their data systems accordingly. Unfortunately, there has been much less effort at ensuring that these descriptive data are captured with sufficient granularity (as individuals rather than as broad categories) or that they can be matched with expenditures, programs, and outcomes. Key elements would include:
Authorized staff positions, the location of the positions, the purpose and ��
reporting relationships of the positions, whether they are filled and by whom, and whether they are full or part time.
District assets and materials, where they are located, and the transfer of ��
assets between locations (e.g., the delivery of textbooks).
Students, which schools and classrooms they attend, and the teachers ��
and staff in those schools and classrooms. This should include not just the “teacher of record” for the students, but also aides, tutors and other staff working with the student.
level longitudinal test data to retention data to survey data. Similar connections are necessary to examine the efficacy of professional development (e.g., which teachers get what services — and do they matter?) and student interventions (e.g., does a pullout program work to improve student achievement?). With this level of data sophistication, it becomes feasible to start conducting cost-benefit analyses of programs, services and organizational units.
Doing the above in real time:6. Ideally, district management should be able to find out instantly which schools are waiting for textbooks or which teachers have received what professional development. While FedEx can tell millions of customers exactly where their packages are around the world, large school systems routinely lose track of thousands of dollars worth of textbooks and supplies.
When districts can marry information on operations and activities to particular educational or intermediate outcomes, they enable managers to gauge relative program effectiveness. When all the pieces are in place, it becomes possible to engage in meaningful cost-benefit analysis. This would permit a district to know not only the relative costs for each teacher recruited by The New Teacher Project rather than its own human resources operation, but also the relative effectiveness of teachers coming from each route — allowing an evidence-based judgment about the value of alternatives. Few or no school systems have all of these elements in place today. Most are currently at step two. Consultants or internal district analysts can, with enough time, manpower, and supplemental data collection, provide school systems with analyses that may push to steps four and five. The challenge is for districts to consistently reach step six.
The Numbers We Need
So what kinds of data should school systems be collecting and connecting? There are six major strands deserving attention. Unfortunately, even those that have been an ostensible priority have been shortchanged by a tendency to focus less on what will help managers improve schools and systems than on what elected officials need to police fiscal improprieties or measure school performance. The first and most important type of data to collect is student outcomes. Just a decade ago, most districts had abysmal systems for tracking pupil
A Byte at the Apple
170 171
Balanced Scorecards and Management Data
What professional development is delivered to which personnel, when, ��
for what length of time, and by whom?
What tutoring or afterschool programs are delivered to which students, ��
when, for what length of time, and by whom?
Which reading programs and which math programs are being used by ��
which schools? How well are they implemented, at what cost, and with what results?
What texts and ancillary materials are utilized by which schools, ��
classrooms and students?
Fifth, more crucial than any other element of school system management may be human capital operations. Dramatically improving the quality of teaching and learning requires that a school system be able to monitor personnel; to gauge performance; to compensate or remediate in response to performance; and to manage competently hiring, transfer, benefits, employee concerns, and termination. The key is to measure human capital operations not in terms of inputs (number of hires or percentage of educators with advanced degrees) but with metrics that reflect meaningful performance. Key data on human capital include:
The quality of new hires, in terms of skills, experience, past performance, ��
qualifications, or interview grades.
The quantity of applicants for positions, how rapidly they are screened ��
and offers made, and the rapidity with which successful applicants are placed and prepared.
The satisfaction of employees with the support and responsiveness of ��
human resources to various concerns.
The performance of instructional personnel, support staff, and ��
school leaders as measured by student progress (potentially including standardized assessments, promotion, graduation, course selections, and attendance).
The performance of personnel on relevant metrics beyond student ��
achievement (e.g., soliciting “forced rankings” of teachers by their
Teacher and student attendance — and the reasons for absences.��
When it comes to finance, systems have invested great effort in developing a capacity to keep track of transactions but little in tracking expenditures in ways that facilitate useful analysis. Developing a management-friendly system for tracking expenditures would require ensuring that managers can link dollars and time spent by employees to locations, activities, reporting structures, and, if appropriate, students. If a professional development coach or a gifted-and-talented teacher works at multiple locations, this should be reflected in financial and payroll data and linked to the teachers and students in question so that the cost-effectiveness of the activity can be monitored and assessed. Some key elements that are often not tracked well include:
Are dollars actually being spent in specific schools and classrooms or are ��
they being spent by central administration and then “allocated” to school sites based on calculations and projections (e.g., total heating costs for the district distributed proportionally to all schools by number of students)? For instance, schools could be charged per teacher for the average teacher salary cost for the whole district, or schools could be charged the actual salaries of the teachers working at the site.
Who controls the decision to make the expenditure and for whom does ��
the expenditure take place? For instance, is a school-based professional development program purchased by the office of instruction at the central office or by an individual principal or by an individual teacher? Each of these expenditures are for teachers at the school; however, those held accountable for these expenditures should be quite different.
What program, activity, and function does the expenditure support?��
Fourth, while attention to “instructional leadership” and “capacity building” has led the current generation of district leaders to devote increased time to providing professional development and related resources, few districts track instructional and curricular services in a manner that makes it possible to determine who got what services when. As a result, district leaders are unable to identify particularly effective tactics or programs, effective or ineffective personnel, points of concern, or opportunities for cost savings. Key data on instructional and curricular services include:
A Byte at the Apple
172 173
Balanced Scorecards and Management Data
the system was broadened to include 734 categories of concern, including the incidence of loud parties.
8 Compstat made it easier to hold officers accountable,
to pinpoint areas of concern, and to provide real-time data to assist both officers and street cops in making decisions. Precincts were required to update crime statistics on a daily or weekly basis, rather than on the monthly or quarterly basis that had been the norm. New mapping software allowed department officials to identify crime clusters by neighborhood and then correlate them with drug sale sites, addresses of known felons, areas of gang activity, and public housing — and to communicate all this information department-wide within seconds. In the first five years after the 1993 introduction of Compstat, the number of homicides in New York City fell from 1,946 to 629 — a rate of decrease three times that of the nation as a whole. In Philadelphia, Compstat was implemented in 1998. In the first year, the murder rate and auto theft rate both fell by more than 15 percent. Similar results were experienced in other cities, including Los Angeles, New Orleans, Albuquerque, Sacramento, and Omaha.
9
The system worked equally well in other domains. When the New York City police extended the system to traffic control in 1998, vehicle accidents fell 38 percent and pedestrian fatalities declined 36 percent in the first six months. These improvements were credited to the system’s ability to highlight the need for small changes like fixing a stop sign, changing light timing, and placing orange nylon mesh at intersections to prevent pedestrians from stepping too far into the street.
10
The Council of Great City Schools has recently begun a comprehensive benchmarking process across a whole series of “meat and potatoes” metrics for business operations such as transportation costs per student, food services participation rates, and lead time required for procurement.
11 This is the first
time these types of data have been collected for school systems, and their power is evident. Michael Eugene, business manager for the Los Angeles Unified School District and a driving force behind the benchmarking project, has explained the importance of comparative statistics on outcomes:
“I didn’t know we had one of the lowest meal participation rates among secondary
students until I saw the benchmark data. Between 2002 and 2006 we improved from 17
percent of secondary ADA [Average Daily Attendance] to 37 percent participating in the
lunch program, so I thought we’d improved significantly based on trending ourselves over time.
principals or supervisors, while systematically collecting evaluations of supervisors by their staff).
Finally, it is essential to monitor business practices like procurement, information technology, data management, and maintenance which facilitate system operation. The functioning of these elements is crucial to effectively support school leaders, classroom educators, and school communities. The key, again, is to measure these services not in terms of inputs but in terms of core metrics that accurately reflect performance:
How long does it take the district to process a supply request, how rapidly ��
are supplies delivered to the classroom, and how does the system’s cost per order compare to benchmarks?
How rapidly are school personnel able to access the results of formative ��
assessments, how satisfied are they with the user-friendliness of the data interface, and how intensively/extensively do faculty make use of formative assessments and student data?
How rapidly does the facilities team respond to complaints and what ��
percentage of complaints is resolved on the first visit? How many work orders do maintenance teams perform in a week?
What is the cost per square foot of maintenance and what is the staff ��
satisfaction rate with the physical condition of the school?
The Power of Data
Collecting, maintaining, and employing these kinds of information will permit school and district leaders to manage in profoundly different ways. They will make it possible for them to help professionals fully utilize their skills; eliminate unnecessary or redundant tasks, programs, and personnel; and target resources and effort more effectively. How might this work in practice? One illustration is provided by the remarkable success that New York City and other cities enjoyed using new data tools to combat crime in the 1990s. The New York Police Department’s system, Compstat, short for “computer statistics,” compiled data from street cop reports, crime complaints, arrest and summons activities, crime patterns, and police activities and used this information to help target police patrols. Over time,
A Byte at the Apple
174 175
Balanced Scorecards and Management Data
shaping those budgets. 14
The result is a chicken-and-egg situation, in which districts have limited incentive to assemble these data, because they have only limited ability to use it, yet the data vacuum that results makes it more difficult to argue to policymakers that new flexibility will be utilized in informed and appropriate ways. This dilemma makes clear that discussions about data and statistics must proceed in tandem with broader policy proposals. Second, public education has underinvested in its information technology infrastructure for years. The problem is that updating such infrastructures is expensive in the short run — both in terms of dollars and political capital. When a superintendent is faced with the choice between spending millions on information technology or “putting that money into the classroom,” few will opt to explain to parents, teachers, or school board members why they are putting money into data systems rather than class-size reduction, pay raises, or art programs. In the private sector, management can justify such investments by pointing to the bottom line — such an approach, even when compelling, is a more difficult pitch for educational leaders. Moreover, as recent implementations of new payroll and planning systems in Chicago and Los Angeles show, there are undeniable risks to major upgrades in such systems. Installing a new financial or human resources system is a complex undertaking that often requires employees to change routines and that is challenging even for high-functioning organizations. Even when such installations are successful, design, procurement, implementation, and training mean that the results will not be manifest for several years, while the headaches and costs emerge in the short term. Moreover, if not managed carefully, the result of these efforts can be disastrous — especially in a sector where these efforts are so rare that there’s limited expertise on the part of either vendors or peer districts. Los Angeles Unified School District (LAUSD) has spent over a year sorting out problems from the introduction of its new integrated financial and business operations system. The local union established a permanent RV camp outside district headquarters to highlight mistakes in the payment of teachers, and has used this to indict LAUSD management more broadly. Given that plenty of private sector installations of such systems also have significant difficulties (in fact, one survey suggested that almost half of such Enterprise Resource Planning installations are deemed unsuccessful
15), who can blame
superintendents for not wanting to take on such projects. If they succeed, few will notice; if they fail, the costs are high.
But when I saw where we were in the benchmark data my heart sank. Still being among the
lowest in the nation blew me away. It has created the utmost urgency to break down barriers
of access to nutrition. Until 2002, food services was measured by its profitability rather than
its participation rate. While fund balance is important, clearly the District was focusing on
the wrong KPI [Key Performance Indicator].” 12
One little noted, but very important, benefit of Compstat, benchmarking and other such processes is that they force managers to make sure the data are accurate. A lot of bad data are stored and analyzed because middle managers in the organization neither use nor are held accountable for data accuracy. Once attendance rates or dropout rates of individual schools are benchmarked, officials have much more incentive to ensure that the numbers are correct.
13
What’s the Problem?
Everything we have said so far seems pretty obvious and is the way that almost any large, well-functioning organization operates in the 21st century. Why, then, is the collection and analysis of basic student achievement data and so little else regarded as the cutting edge when it comes to managing with data in schooling? Political, cultural, and organizational tensions explain the current paucity of important management data in K-12 education. Five deserve particular mention. First, and most significantly, our school systems do not reward educational leaders for pursuing new efficiencies, redeploying resources, or coming up with innovative delivery mechanisms for school services. Indeed, superintendents or principals who use management data to propose the elimination of redundant personnel or to zero out ineffective programs are likely to ignite firestorms and invite political conflict. Even if successful, leaders are typically not rewarded (professionally, monetarily, or otherwise) for such decisions. School leadership as a whole is a highly political field, one where a reputation for consensus-building and peacemaking is a treasured asset. So long as the aggressive use of management data is not rewarded, there is little mystery as to why it is rarely collected or employed. Similarly, because state and federal statutes, salary structures, and existing commitments mean district and school officials have a limited ability to redeploy resources, there is not a lot of incentive to collect data whose value is their ability to steer such determinations. District and school leaders often feel more like overseers of a formula-driven budget than like active participants in
A Byte at the Apple
176 177
Balanced Scorecards and Management Data
measure, monitor, and benchmark performance. Ironically, it is by focusing on these areas of operational concern that one could most readily demonstrate the power of data to drive decisions. In the end, no student of government or of K-12 schooling will be surprised that political pressures can trump or overwhelm fact-based decision making. In fact, on issues like teacher performance, efficiency of maintenance operations, or school system procurement, there are sometimes involved constituencies that simply do not want certain kinds of information gathered or made public. There are no easy answers to such challenges — indeed, collecting and using data will ultimately prove as much a political challenge as a technical one. On that count, one heartening example is the success that some other public sector enterprises have enjoyed employing operational performance data. In cases such as the U.S. Postal Service, the policing examples described above, or the litany of other efforts famously flagged in the Gore Report or David Osborne and Ted Gaebler’s Reinventing Government, public pressure, persistence, and a commitment to rewarding reform-minded leaders has led to substantial progress even in the face of entrenched constituencies and balky bureaucracies.
What to Do?
The foregoing list of obstacles suggests just how difficult it will be for even those states, districts, charter school systems, and schools that have already embraced student testing to make the leap required to become truly data-driven organizations. Core changes on this front need to occur at the system level (whether that is a district or a charter management organization is immaterial) because what we are talking about is management data. That is not primarily a challenge for federal officials or state bureaucracies, except as agents to encourage, facilitate, and support system efforts. In practice, collecting and analyzing these data require a role for the state in providing funding and promoting comparability — but the primary purpose is to provide real information in real time to address real management challenges in schools and districts problems. To our minds, there are at least five takeaways for educators, reformers, and policymakers who believe in the importance of doing so.
Create opportunities and change the incentives. 1. As discussed above, a crucial problem is that there is little incentive for school systems to
Third, while “data-driven” instruction has become a popular buzzword, the cultures of school districts are not data-driven in any fundamental sense. State and local officials with decades spent under the sway of familiar systems and a focus on compliance with state and federal mandates constitute significant obstacles to more fundamental change. It is only in the past five or six years that many superintendents, central office staff, principals, and teachers have even embraced the principle that pupil achievement data should be a defining element of the school culture. Principal preparation continues to devote scant attention to data-related questions.
16 Due to career paths in which educators
have little opportunity to see how management is practiced beyond the world of K-12 schooling, there is often limited familiarity with how data might be collected or employed more aggressively. This helps foster a strong bias for data that measure “inside-the-classroom” metrics — like test results and teacher practices — rather than other dimensions of organizational performance. Fourth, districts have done a poor job of developing and rewarding the behaviors and skills required to collect, analyze, and report information. Even when potentially useful data exist, there has to be internal capacity to examine, use, and probe them. Few districts have any spare capacity of this type. While a small team of skilled analysts could help a school district dramatically improve its operations by putting appropriate metrics into place and identifying operational inefficiencies, such analysts tend not to have a natural client base outside of the superintendent — who has many other considerations to balance. Meanwhile, such analysts are likely to have ready-made opponents among those whose inefficiencies are exposed. Thus it should be little surprise that such analysis tends to make little headway. Finally, the current focus on “data-driven decision making,” because it concentrates on pupil achievement and school performance, has districts and schools starting at what may be the most difficult entry point. Reaching reliable inferences about what drives student achievement can be difficult even in the best of circumstances (e.g., in the case of controlled, randomized field trials). Tackling this challenge with imperfect data, under conditions fraught with potential bias and measurement error, and in a politicized environment, poses daunting challenges. While districts are busy seeking to isolate “best practices,” they are neglecting low-hanging fruit in the operational areas. In areas such as human resources, data management, and professional development there is a wealth of experience from organizations outside education that could be used to help
A Byte at the Apple
178 179
Balanced Scorecards and Management Data
require a fancy new data system and showed real results. Each week, starting in April 2005, the SchoolStat team met with the director of human resources to review the number of vacancies in all of Baltimore’s schools by subject area, grade level, and teacher qualifications. This consistent focus on outcomes provided a needed shock to teacher recruitment teams. When they did better, it was easy to see. When they fell behind, management was able to apply pressure and assistance. Weekly meetings revealed both strategies that worked and those that did not. In August, the team tried advertising in a local community paper, and it worked. They tried holding smaller, simpler recruitment events, rather than huge expos, and that worked. They tried blast emails, and they did not work, so these were soon ended. Baltimore reached a record low of 35 vacancies around Thanksgiving 2005. Shortly thereafter, however, vacancies shot upward. More than 40 teachers suddenly left the system after Christmas. After conducting interviews and analyzing data from three previous years, human resources discovered through SchoolStat that departing teachers were mostly recent hires who were exhausted and frustrated. This “time of disenchantment” had shown up in each of the previous three years; it had just escaped notice. Going into the 2006 – 07 recruitment season, the district sought to both reduce vacancies and address the holiday “time of disenchantment.” Instead of hiring to fill a projected number of August vacancies, human resources geared its recruitment goal to accommodate the “time of disenchantment” and intentionally over-hired by several dozen. These new hires were placed alongside experienced teachers who would help guide them through the difficult first year. When the holiday exodus came, the district was ready, and the rise in vacancies after the holiday season was quickly addressed. These performance improvements were accomplished without adding human resources staff or dollars, and with nothing fancier than Microsoft Excel. While the SchoolStat model is still formally employed in Baltimore, it has evolved and many of the Stat processes have been turned over to the individual departments involved. Whether this means that the “Stat” way of thinking has been fully internalized or that the constructive pressure brought by a central “Stat” office has been removed is hard for an outsider to judge. In the end, the long-term success of such efforts is ultimately precarious and subject to the political winds, until they are firmly embedded in the culture of the organization.
collect the data essential for transformative management. The first step in convincing educational leaders to embrace data-based management is to allow them to actually manage. This means unwinding the webs of input-based policies and regulations governing staffing formulas, class size, service delivery, procurement, and so forth, and permitting systems to devise and deploy their own ways of doing business. To do this, state legislatures, state boards, and school boards need to find new ways to evaluate systems — monitoring district and school leaders on the basis of outcomes, employee morale, operational efficiency, and progress on these counts, and linking these measures to evaluation and compensation.
Get started.2. Much of the data needed to measure and manage performance is collected already. It may not come in convenient, automated reports, and the data sources may not “talk” to each other, but the data are there waiting to be assembled by a skillful analyst. The key to the Compstat model was not a new information technology (IT) system, but the decision to use extant crime data to guide management and the practice of holding police captains accountable for improving results. This model has in fact been extended to other city departments (CityStat) and, more recently, to school systems (SchoolStat).
Implementing such “stat” processes can happen right now (in fact, it is happening in places including Baltimore; Washington, DC; Paterson, New Jersey
17; Jackson, MS; and Chicago). What is most needed is not a new computer
system but talent, a focus on outcomes, and political will and organizational skill. In fact, if districts revamp their IT systems prior to implementing performance management processes, district leaders will almost certainly not get the numbers they need, but the numbers the information technology staff think they need. The only way for district leaders to truly understand what they need is by focusing on performance, identifying key processes and tasks, and then working with their teams to find smart ways to monitor those on a regular basis. Absent such leadership, it is unrealistic to expect a new IT system to fix a broken human system. One example of the potential to get started now can be found in the Baltimore School System.
18 The district started a SchoolStat process around
teacher recruitment starting in the 2005 – 06 school year. The process did not
A Byte at the Apple
180 181
Balanced Scorecards and Management Data
data using the same state definitions and protocols. California, with its detailed standard account code structure, has taken sensible steps in this direction. On the other hand, if states design their required reporting primarily around compliance and accounting conveniences for the state, districts will adapt their internal systems to meet these requirements and opportunities to drive systematic management reform across multiple districts will be lost.
States can also reorient their own data collection responsibilities from compliance to performance management. Like local school districts, state education agencies collect mountains of data for reporting. Too often this transfer of data is a one way street. States should not only collect data on highly qualified teachers, services to students with special needs, and so forth, but feed these data back to school districts with comparisons to other districts. One small example of feeding useful data back to districts can be found in a report from the Los Angeles County Office of Education (LACOE). The 80 school districts in Los Angeles County are required by law to report their financial performance, revenues, and expenses every year to LACOE. Rather than sitting on this information, LACOE produces a report that has all of the districts’ revenue and spending data per student, allowing any district that desires to benchmark itself against its neighbors on these measures.
19
States could also help smaller districts capture economies of scale in the collection and analysis of data. Much of the above discussion has focused on large, urban districts that could redirect some of their central office spending to better management practices. However, smaller districts have fewer options. They are unlikely to be able to afford either sophisticated information technology systems or high-quality business analysts. States, however, can set up these systems and provide analytic support in a much more cost-effective manner. There is also an important role for Uncle Sam to play. For one thing, federal leadership can provide the bully pulpit and political cover to enable a few leading districts to make the case for aggressive new data efforts. By recognizing those districts that act through gestures or publications, the feds can make it easier for superintendents to act. We would caution, though, that there is at least one role that state and federal governments should not seek to play. They should not hold districts accountable for improving their performance on the management measures
Got money? Got talent? 3. District leaders looking to assemble the appropriate data for active performance management face two immediate challenges. Collecting and connecting the existing data is a labor-intensive process. Then it is necessary to find those with the training and skill to provide useful analysis. While these investments should ultimately save districts money, any serious move towards performance management will require more research and analytic capacity. Such spending can be politically unpopular and even runs afoul of popular calls for driving more dollars down to individual classrooms.
Private foundations are well-positioned to help districts with this challenge. They are positioned to provide start-up funding, and technical assistance for setting up performance management processes, and identify talent from non-traditional pools that will allow districts to get performance management off the ground. One promising source of candidates, for instance, is the Broad Foundation’s resident fellows program, which recruits graduates from top business and policy schools, looking for proven business leadership experience. This program is much more likely to identify and recruit candidates with the skills to construct and supervise performance management systems. Funders can also help bring in external assistance to help systems develop essential tools and master critical skills. Of course, once performance management systems have shown their ability to save money and improve performance, states and systems will need to plan on shouldering the costs. Indeed, one major concern with foundations or consultants playing too large a role is that the new approach may be seen as a short-term maneuver and not be institutionalized or woven into the system’s core routines.
State and federal governments have roles to play, too. 4. States drive districts’ core operational, financial, and student reporting requirements. If states design these requirements to capture financial data in a managerially useful way, then districts can more readily compare their costs and performance in areas from transportation to reading instruction. States can facilitate this process by creating a forum for interested school systems to meet regularly, share metrics, compare data, and benchmark their processes and results against same-state districts that are administering the same assessment and collecting
A Byte at the Apple
182 183
Balanced Scorecards and Management Data
management lacks the ability, grit, or know-how to launch such efforts, external reformers can play a crucial role.
Final Thoughts
Some might wonder whether it is realistic to expect superintendents and other school district leaders to embrace the sustained management project of collecting more and better data and using them to manage and measure performance. Indeed, some might note that one of the authors (Hess) has argued that superintendents have historically had incentives to favor fast and furious change rather than slow, incremental reforms.
21
However, one key reason superintendents historically enacted one short-lived reform after another was an environment in which it was hard to measure outcomes and because time was short. As a result, it was paramount to appear to be “doing something.” This pressure can be alleviated if superintendents are accountable for measurable improvements in the near term. While it may be hard to credit a small percentile point increase in test scores to a superintendent (especially when the tests change — as they do so often), it is much easier to track improvement in teacher hiring, retention of employees, delivery of texts and materials, or data availability and utilization. By demonstrating progress in attracting quality educators, addressing needs, and wringing out inefficiencies, superintendents can win time to bring longer-term strategies to fruition. There is a range of promising developments underway across the land. District leaders in places like New York City and Washington, D.C. have made collecting and employing operational data a priority. Charter school systems, like Edison Schools and KIPP, have taken important steps in collecting data that districts previously overlooked. Meanwhile, collaborative efforts like the Schools Interoperability Framework and vendors like SchoolNet, Wireless Generation, and S&P have brought a new level of sophistication and technical acumen to collecting data for management rather than reporting purposes. Nevertheless, if schooling is to enter an era in which data are truly a tool of breakthrough management, the real work lies ahead.
The authors would like to thank Thomas Gift for his invaluable research and editorial assistance and Michael Eugene, Erin McGoldrick, and Bryan Richardson for their feedback and suggestions.
discussed in this chapter. Performance metrics are tools that districts can and should use to improve student achievement and cost effectiveness. Asking state or federal officials to get involved in monitoring specific intermediate outcomes, much less attaching consequences to performance on them, implies a uniformity to improvement strategies which would limit the ability of districts to respond to their specific, varied circumstances. For instance, if the state were to reward and penalize districts on the basis of reducing turnaround time in hiring teachers, districts with an oversupply of quality teachers (for whom turnaround time was not an issue) might be forced to divert resources from more relevant challenges in response to the mandate. States and the feds should focus on ensuring that school systems are producing results — the object of interest to policymakers, parents, and voters — while leaving the granular data on system activity to the local officials and practitioners best equipped to interpret and make use of them.
Support management change.5. Finally, advocacy groups, business leaders, local media, mayors, and even governors can give district managers the political cover and support they need to move forward on performance management. Business leaders ought to not only highlight areas where school operations might be improved and support processes that allow for a reallocation of resources that can address the problems, but also highlight the gains that are made in these areas as they occur.
Outside advocacy groups can help the public draw connections between seemingly non-academic management issues and student achievement. One compelling example has been The New Teacher Project’s work on district hiring mentioned previously. In analyzing data from several major urban districts, TNTP has shown how seemingly mundane back-office processes can have dramatic effects on who ends up in the classroom. In 2003, TNTP examined hiring in several urban districts and found that balky human resources practices prompted roughly half of teacher applicants, especially the most qualified, to accept jobs elsewhere — with the majority of those citing delayed timelines as the rationale.
20 The attention prompted several districts to rethink their
procedures and practices. The New Teacher Project’s work provides compelling examples of how outside attention to important managerial metrics fostered awareness of an overlooked problem and changed district behavior. When local
A Byte at the Apple
184 185
Balanced Scorecards and Management Data
Endnotes
Levin, Jessica, Jennifer Mulhern, and Joan Schunck. 1 Unintended
Consequences: The Case for Reforming the Staffing Rules in Urban Teachers
Unions Contracts. The New Teacher Project, 2005. http://www.tntp.org/files/
UnintendedConsequences.pdf
Daly, Timothy, David Keeling, Rachel Grainger and Adele Grundies. 2
Mutual Benefits: New York City’s Shift to Mutual Consent in Teaching Hiring.
The New Teacher Project 2008. http://www.tntp.org/files/TNTP_Mutual_
Benefits_042708F.pdf
In fact, the New York State legislature recently included language in its budget 3
bill putting a moratorium on using student performance data for granting
tenure to teachers. See Hakim, Danny and Jeremy W. Peters. “Legislators Balk at
Tying Teacher Tenure to Student Tests.” New York Times, April 9, 2008.
Kaplan, Robert S. and David P. Norton. 4 The Balanced Scorecard:
Translating Strategy into Action, Boston: Harvard Business School Press, 1996.
Kaplan, Robert S. and David P. Norton. “The Balanced Scorecard — Measures 5
that Drive Performance.” Harvard Business Review, Jan. – Feb. 1992.
Silk, Scott. “Automating the Balanced Scorecard.” 6 Management Accounting, Vol.
11, No. 17, 1998.
Kaplan, Robert S. and David P. Norton. “The Balanced Scorecard- Measures that 7
Drive Performance.” Harvard Business Review, Jan. – Feb. 1992.
Anderson, David C. “Crime Control by the Numbers.” 8 Ford Foundation Report,
Winter 2001. See also Rashbaum, William K. “Crime-Fighting by Computer:
Scope Widens.” New York Times, March 24, 2002.
Dussault, Raymond. “Maps and Management: Compstat Evolves.” 9 Government
Technology, April 2000.
Marzulli, John. “Cops Tackle Road Perils: Computer Helping to Identify 10
Hotspots.” New York Times, July 19, 1998.
Managing for Results in America’s Great City Schools: A Report of the Performance 11
Measurement and Benchmarking Project. Council of the Great City Schools,
April, 2007.
Eugene, Michael. Personal communication, May 2008.12
Of course, managers also have to be aware of the possibility of audit in order to 13
prevent “over-counting.”
Indeed, even if cost efficiencies are discovered and executed, given the politics 14
of public budgeting processes, any savings are likely to be driven into covering
existing deficits or routine increases in employee salary and benefits, not
strategic change.
“ERP Survey Results Point to Need For Higher Implementation Success.” 15
Robbins-Gioia, January 28, 2002. http://www.robbinsgioia.com/news_
events/012802_erp.aspx
Hess, Frederick M. and Andrew Kelly. “Learning to lead: What gets taught in 16
principal preparation programs.” Teachers College Record 109(1), 2007.
Hu, Winnie. “Statistics Pinpoint Problems in Paterson Schools.” 17 New York
Times, December 2, 2007.
This example was provided by Bryan Richardson, the founder of Baltimore’s 18
SchoolStat system in a personal communication.
200619 – 07 Annual Financial Report. Los Angeles County Office of Education, 2007.
Levin, Jessica and Meredith Quinn. 20 Missed Opportunities: How We Keep
High-Quality Teachers Out of Urban Classrooms. The New Teacher Project, 2003.
http://www.tntp.org/docs/reportfinal9-12.pdf
Hess, Frederick M. 21 Spinning Wheels: The Politics of Urban School Reform.
Washington, D.C.: Brookings Institution Press, 1999.
186 187
Circling the Education Data Globe
Circling the Education Data Globe
Daniele Vidoni Kornelia Kozovska
Daniele Vidoni is a senior economist of education for the Italian National
Institute for Educational Evaluation (INVALSI). †
Kornelia Kozovska is a researcher at the European Commission JRC-Centre for
Research on Lifelong Learning (CRELL). ‡
On the international scene, reaching a general agreement on what data should be collected in education and how is an issue far from being settled. The United States is likely one of the countries with the most experience in dealing with issues of
collection, storage, and treatment of social scientific data. In the field of education, the “Equality of Educational Opportunity Study (EEOS),” known by most as the Coleman Report of 1966, is a milestone that many investigators have used as a model for subsequent research. The development of ideas and models for the collection, management, and governance of education data is facilitated by the organizational structure of U.S. education — over 14,000 school districts in 50 independent state school systems. The fragmentation of the system and the enormous variation in district characteristics and responsibilities allow for different districts to simultaneously implement different strategies to solve similar problems, thereby optimizing the search for viable solutions. This U.S. advantage also has a cost: namely, that it’s difficult to track students across districts and states. Yet this cost is common to most actors in the international scene, and only recently have countries started addressing this issue seriously.
Indeed, in the past decades, more and more countries have begun collecting and analyzing data to inform educational policies. Some uses of data are genuinely new, while others refine and adapt ideas initially conceived in the U.S. This chapter explores some of the best practices with the aim of providing food for thought on the challenges of conceiving, explaining the need for, and implementing a “Holy Grail” of education data — i.e. a “robust longitudinal data system” as described by the Data Quality Campaign. These best practices from around the world may also inspire improvements in how existing data are collected, stored, analyzed, and communicated to families and to the public.Although a country’s search for the Holy Grail may be easier if it can learn from the experiences of others, some steps along the path are driven by a specific mix of culture, politics, and contextual variables. The journey can be broken up into at least three stages:
Collecting and using data for a school’s self-evaluation,1.
Collecting and using data for comparing institutions and informing 2. parents, and
Collecting and using individual-level data for the effective management 3. of schools and the education system.
This chapter includes snapshots of the current situations in Italy, England, and Korea, with each snapshot illustrating one of these steps. Italy, a large country with little tradition of data collection and accountability in education, is at the first stage; it has devoted massive efforts to setting up a national accountability system which can be seen by the schools as a tool rather than as a burden. The system collects student scores on standardized tests and extensive data on individual school characteristics. Though the information is standardized at the national level, so far the data have been used solely for self-evaluation purposes by schools. The hope is that the progressive development of a culture of evaluation (among the general public and within the school) will open the way to refinement of the system features and a much wider use of data both for counseling and evaluation purposes. Already the new national contract for Italian school principals ties a share of a principal’s salary to the results of a qualitative and quantitative evaluation process that makes use of the data collected through the national accountability system.
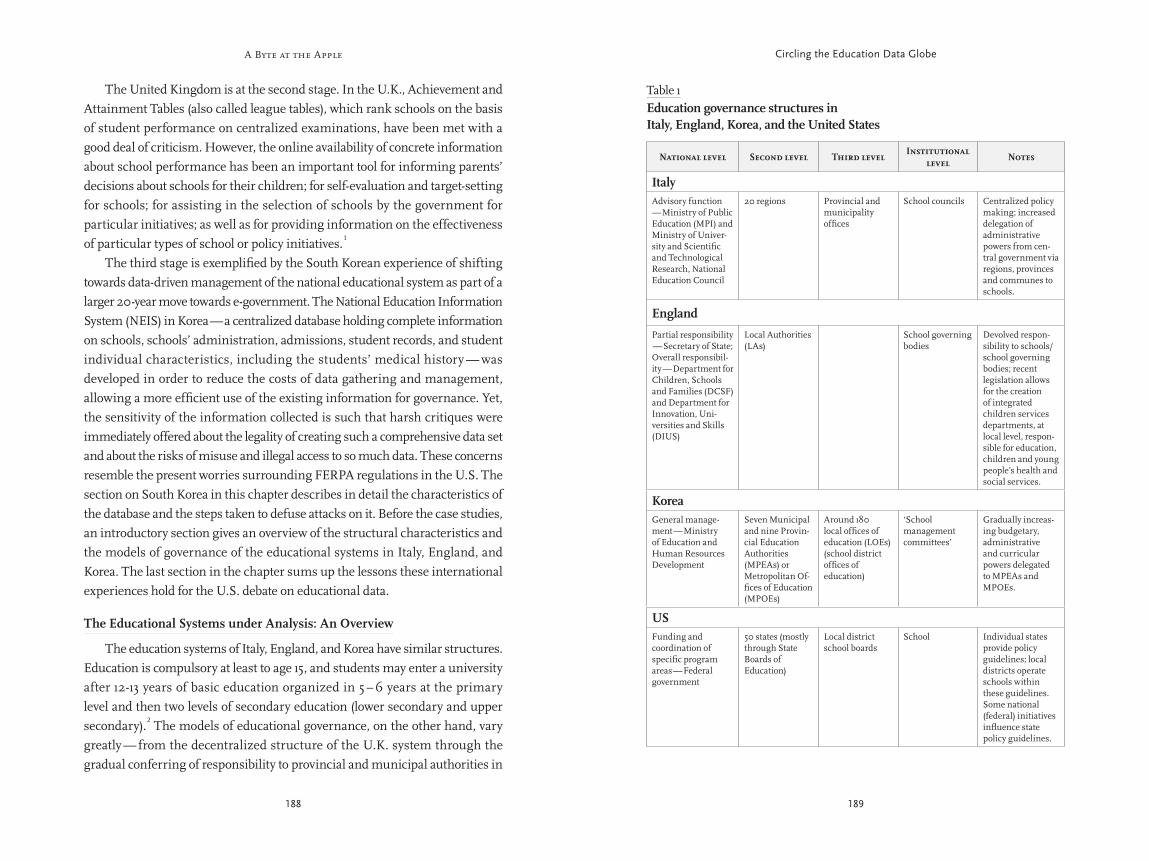
A Byte at the Apple
188 189
Circling the Education Data Globe
The United Kingdom is at the second stage. In the U.K., Achievement and Attainment Tables (also called league tables), which rank schools on the basis of student performance on centralized examinations, have been met with a good deal of criticism. However, the online availability of concrete information about school performance has been an important tool for informing parents’ decisions about schools for their children; for self-evaluation and target-setting for schools; for assisting in the selection of schools by the government for particular initiatives; as well as for providing information on the effectiveness of particular types of school or policy initiatives.
1
The third stage is exemplified by the South Korean experience of shifting towards data-driven management of the national educational system as part of a larger 20-year move towards e-government. The National Education Information System (NEIS) in Korea — a centralized database holding complete information on schools, schools’ administration, admissions, student records, and student individual characteristics, including the students’ medical history — was developed in order to reduce the costs of data gathering and management, allowing a more efficient use of the existing information for governance. Yet, the sensitivity of the information collected is such that harsh critiques were immediately offered about the legality of creating such a comprehensive data set and about the risks of misuse and illegal access to so much data. These concerns resemble the present worries surrounding FERPA regulations in the U.S. The section on South Korea in this chapter describes in detail the characteristics of the database and the steps taken to defuse attacks on it. Before the case studies, an introductory section gives an overview of the structural characteristics and the models of governance of the educational systems in Italy, England, and Korea. The last section in the chapter sums up the lessons these international experiences hold for the U.S. debate on educational data.
The Educational Systems under Analysis: An Overview
The education systems of Italy, England, and Korea have similar structures. Education is compulsory at least to age 15, and students may enter a university after 12-13 years of basic education organized in 5 – 6 years at the primary level and then two levels of secondary education (lower secondary and upper secondary).
2 The models of educational governance, on the other hand, vary
greatly — from the decentralized structure of the U.K. system through the gradual conferring of responsibility to provincial and municipal authorities in
Table 1Education governance structures in Italy, England, Korea, and the United States
National level Second level Third levelInstitutional
levelNotes
ItalyAdvisory function — Ministry of Public Education (MPI) and Ministry of Univer-sity and Scientific and Technological Research, National Education Council
20 regions Provincial and municipality offices
School councils Centralized policy making; increased delegation of administrative powers from cen-tral government via regions, provinces and communes to schools.
England
Partial responsibility — Secretary of State; Overall responsibil-ity — Department for Children, Schools and Families (DCSF) and Department for Innovation, Uni-versities and Skills (DIUS)
Local Authorities (LAs)
School governing bodies
Devolved respon-sibility to schools/school governing bodies; recent legislation allows for the creation of integrated children services departments, at local level, respon-sible for education, children and young people’s health and social services.
KoreaGeneral manage-ment — Ministry of Education and Human Resources Development
Seven Municipal and nine Provin-cial Education Authorities (MPEAs) or Metropolitan Of-fices of Education (MPOEs)
Around 180 local offices of education (LOEs) (school district offices of education)
‘School management committees’
Gradually increas-ing budgetary, administrative and curricular powers delegated to MPEAs and MPOEs.
USFunding and coordination of specific program areas — Federal government
50 states (mostly through State Boards of Education)
Local district school boards
School Individual states provide policy guidelines; local districts operate schools within these guidelines. Some national (federal) initiatives influence state policy guidelines.
A Byte at the Apple
190 191
Circling the Education Data Globe
are also shared with the regional authority and the ministry. Clearly, this information is grossly insufficient to develop any data-driven policy. The need for more information led to the development of an evaluation process aimed at gathering information on all schools and students in the compulsory education range. This new evaluation process will supplement, not supplant, the process of administrative data collection described above. The development of the system has involved two distinct phases: three pilot projects (2001-04), which explored the possibility of putting into place a national system of evaluation (SNVI
5), and then its actual implementation. While participation in
the pilot projects was voluntary for schools, the national system of evaluation is now compulsory. The first concrete step towards the creation of an evaluation system dealing with all aspects of schooling was the establishment of the National Institute for the Evaluation of Education and Training Systems (INVALSI
6) in 1999.
INVALSI, a public organization, was assigned the tasks of evaluating the efficiency and effectiveness of the entire national system of education, as well as of single schools; of researching the causes of success and failure; and of monitoring the effects of education policies put into place by the government. As noted, the establishment of the evaluation system was preceded by an experimental phase comprised of three pilot projects between 2001 and 2004. These had the goal of testing the ability of the organization to produce, administer, and analyze the assessments and questionnaires that would make up the national evaluation system, and also to gauge the interest of schools. Participating schools were selected from among a pool of schools that had volunteered and that already had some experience with self-evaluation. The evaluation process involved multiple-choice tests in the designated subjects administered to students at three grade levels. The tests were linked to a school questionnaire probing the characteristics of the school system. Figure 1 presents the areas of analysis, which are investigated every year. Pilot project one (2001-02) was carried out on a group of around 3,000 self-selected schools (about 25 percent of all schools) with previous experience in evaluation. The objectives set by the ministry for this study were to test Italian language and mathematics among students through multiple-choice tests. Pilot project two (2002-03) expanded the number of subjects evaluated to three: Italian, math, and science. Two groups of schools participated in the
Korea to the still-rather-centralized-in-practice structure of the Italian education system. (See Table 1.)
Italy: Moving Slowly but Making Solid Progress
Italy has a long tradition regarding student evaluation. Indeed, national exams for all students at the end of each study cycle were first introduced in 1928 and are even referred to in the Constitution of the Republic of Italy.
3
However, the implementation of a data-driven evaluation of the school system is only a recent process. Historically, the centralization of the Italian school system has meant that the Ministry of Education defined, at the national level, the rules for most aspects of school life and the internal organization of the school. The role of school principal was to make sure that the school correctly applied the laws and administrative procedures. In this highly bureaucratic approach, the evaluation of the school consisted of school inspections aimed at ensuring that services were delivered in accordance with the law, with little focus on issues of school quality. Although school budgets are still defined and provided by the national government, in the past 15 years Italian schools have acquired increased operational autonomy and have started to use tools for self-evaluation and school improvement.
4 The growing demand for instruments that the
public and the school staff can use to understand school performance and improvements are behind the development of a model aimed at a system-wide evaluation of schools.
Development of the Evaluation System The education data available in Italy have historically been quite limited. The main sources of data are the Ministry of Education and the National Statistical Service, which collect, report, and analyze administrative information on the student population (ethnicity, language, number of students, special needs students); school characteristics (school buildings, school assets); number and years of experience of school staff; and graduation and dropout rates. This information is updated almost every year at the regional level, but it is difficult to obtain detailed and comprehensive information at lower levels (school, district, and province). Information on student socioeconomic status, details about the staff, and student grades are only available at the individual school, though final grades for students
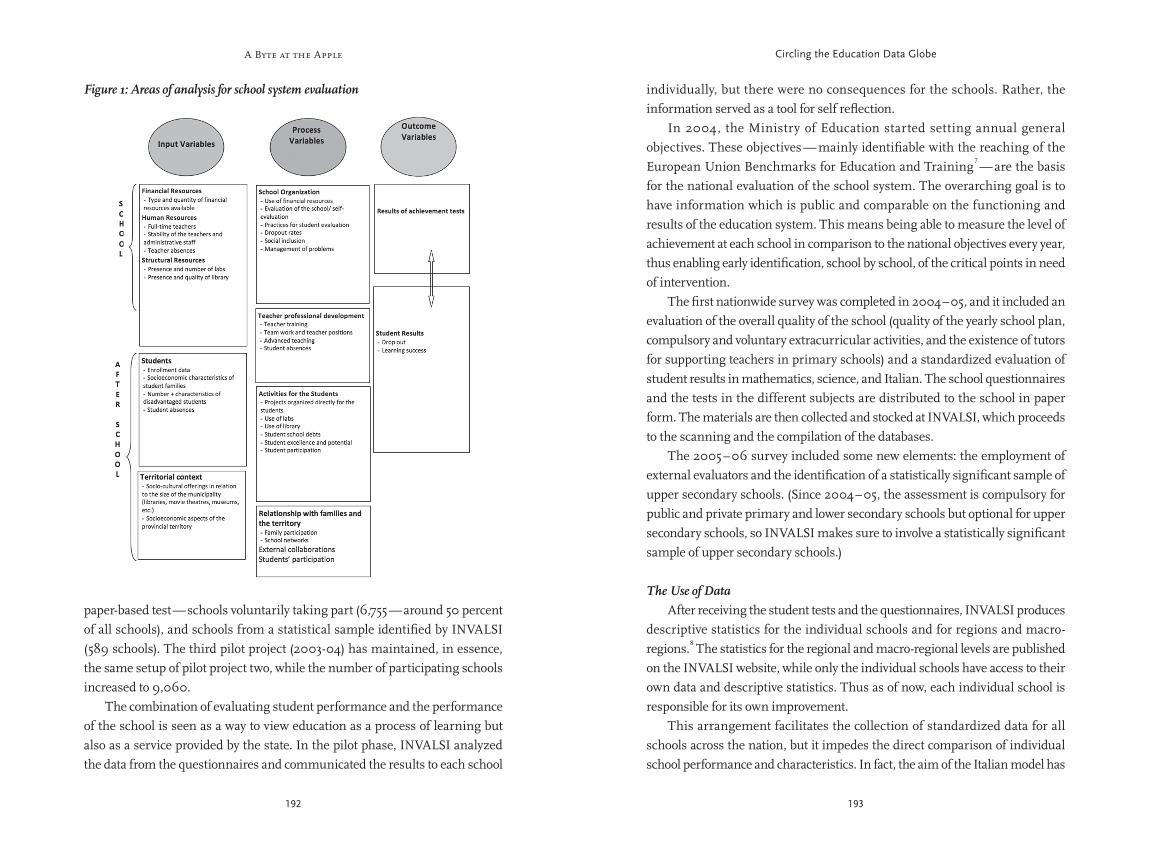
A Byte at the Apple
192 193
Circling the Education Data Globe
individually, but there were no consequences for the schools. Rather, the information served as a tool for self reflection. In 2004, the Ministry of Education started setting annual general objectives. These objectives — mainly identifiable with the reaching of the European Union Benchmarks for Education and Training
7 — are the basis
for the national evaluation of the school system. The overarching goal is to have information which is public and comparable on the functioning and results of the education system. This means being able to measure the level of achievement at each school in comparison to the national objectives every year, thus enabling early identification, school by school, of the critical points in need of intervention. The first nationwide survey was completed in 2004 – 05, and it included an evaluation of the overall quality of the school (quality of the yearly school plan, compulsory and voluntary extracurricular activities, and the existence of tutors for supporting teachers in primary schools) and a standardized evaluation of student results in mathematics, science, and Italian. The school questionnaires and the tests in the different subjects are distributed to the school in paper form. The materials are then collected and stocked at INVALSI, which proceeds to the scanning and the compilation of the databases. The 2005 – 06 survey included some new elements: the employment of external evaluators and the identification of a statistically significant sample of upper secondary schools. (Since 2004 – 05, the assessment is compulsory for public and private primary and lower secondary schools but optional for upper secondary schools, so INVALSI makes sure to involve a statistically significant sample of upper secondary schools.)
The Use of Data After receiving the student tests and the questionnaires, INVALSI produces descriptive statistics for the individual schools and for regions and macro-regions.
8 The statistics for the regional and macro-regional levels are published
on the INVALSI website, while only the individual schools have access to their own data and descriptive statistics. Thus as of now, each individual school is responsible for its own improvement. This arrangement facilitates the collection of standardized data for all schools across the nation, but it impedes the direct comparison of individual school performance and characteristics. In fact, the aim of the Italian model has
paper-based test — schools voluntarily taking part (6,755 — around 50 percent of all schools), and schools from a statistical sample identified by INVALSI (589 schools). The third pilot project (2003-04) has maintained, in essence, the same setup of pilot project two, while the number of participating schools increased to 9,060. The combination of evaluating student performance and the performance of the school is seen as a way to view education as a process of learning but also as a service provided by the state. In the pilot phase, INVALSI analyzed the data from the questionnaires and communicated the results to each school
Figure 1: Areas of analysis for school system evaluation
A Byte at the Apple
194 195
Circling the Education Data Globe
information that is collected, produced, and made available to parents to help them choose the best schools for their children. The introduction of the Achievement and Attainment Tables (AATs) in the United Kingdom came as a result of a process aimed at making parents more effective partners in their children’s education. The first “Parent’s Charter,” published by the Conservative government in 1991, promised the publication of examination results in order to give parents the information they need to make informed choices for their children’s schooling.
10 The Education
Reform Act of 1988 provided the basis for national testing and the collection of comparative test score data through the establishment of a uniform national curriculum, which sets standards of achievement in each subject for pupils aged 5 – 14.
11 Students are tested at the end of each “key stage” (i.e., ages 7, 11,
14, and 16), providing an indication of how pupils and schools are performing in comparison with national standards. The resulting “school performance tables” for secondary schools in England, Scotland, and Wales were first published in 1992. The tables contained an alphabetical list of schools along with information about the number of students in the relevant age cohort and the percentage of those students meeting the relevant standard or its equivalent. Primary school tables were published in 1997 and were based on the performance of 11-year-olds on key stage 2 tests. In 1999, unique pupil numbers (UPN) were introduced, allowing for more accurate matching of student records over time; earlier, records had been linked using pupils’ names and dates of birth. Even though not all pupils have a UPN yet (due to errors in assigning them or other external factors), it is possible to match records in the absence of UPNs by using other techniques. The UPN system has allowed the Department for Children, Schools and Families
12 (DCSF) to construct a national pupil database, linking test data to
the information provided by the Pupil Level Annual Schools Census 13
and improving consistency in the value-added analyses. The initial school performance tables were based on raw score figures, which caused continuous debate as students’ raw scores are heavily dependent on prior attainment and family background and may not correctly reflect the contribution of the school to students’ learning. Partially as a result of these discussions, policymakers in Wales decided to abolish performance tables for individual schools in 2001. In the same year, Northern Ireland also decided not to publish
been to stimulate continuous improvement at the school level by giving quick and confidential assessment results to each school along with comparable data about attainment at the national, regional, and provincial levels. Afterwards, data are analyzed by the school in relation to its particular context (social background, educational offerings, etc.) This limited use of the data has been necessary because these first steps towards standardized evaluation and data collection were viewed with great suspicion by school staff and by labor unions in Italy. Slowly, stakeholders have become more aware of the need for objective information on school characteristics as a tool for improving school quality. Along the way, expectations have increased to the point that school principals and labor unions have agreed to link a share of the principals’ salary to the results of an evaluation process. INVALSI is currently drafting a proposal for a model for principal evaluation, and is considering the necessary steps forward in terms of gathering the data necessary for the evaluation. These steps include the need to collect contextual information on the students, the development of a “unique pupil number” that could allow linking student and school characteristics for conducting analyses at the central level, and the importance of improving the quality of data at the level of the individual school. In principle, all parties have agreed to such plans and are considering the development of a national school register (i.e., a panel data set with the data for all students in Italy — which would be a giant step forward towards the data “Holy Grail” discussed in the introduction). There is even talk today, contrary to the mainstream opinion that prevailed two to three years ago, of tying high stakes to the tests for students and of using student performance to evaluate teacher performance.
9
For now, Italy is still leaving all school-specific performance data in the control of the school. Thus although analyses can be carried out using aggregate data to investigate the general quality of the education system, the results of these analyses cannot yet be tied to any particular school, and there are no policy consequences for schools.
Information for Empowering Parents: The English Achievement and Attainment Tables
In England, the transition from self-evaluation to use of data for institutional comparisons has already been completed. This section investigates the
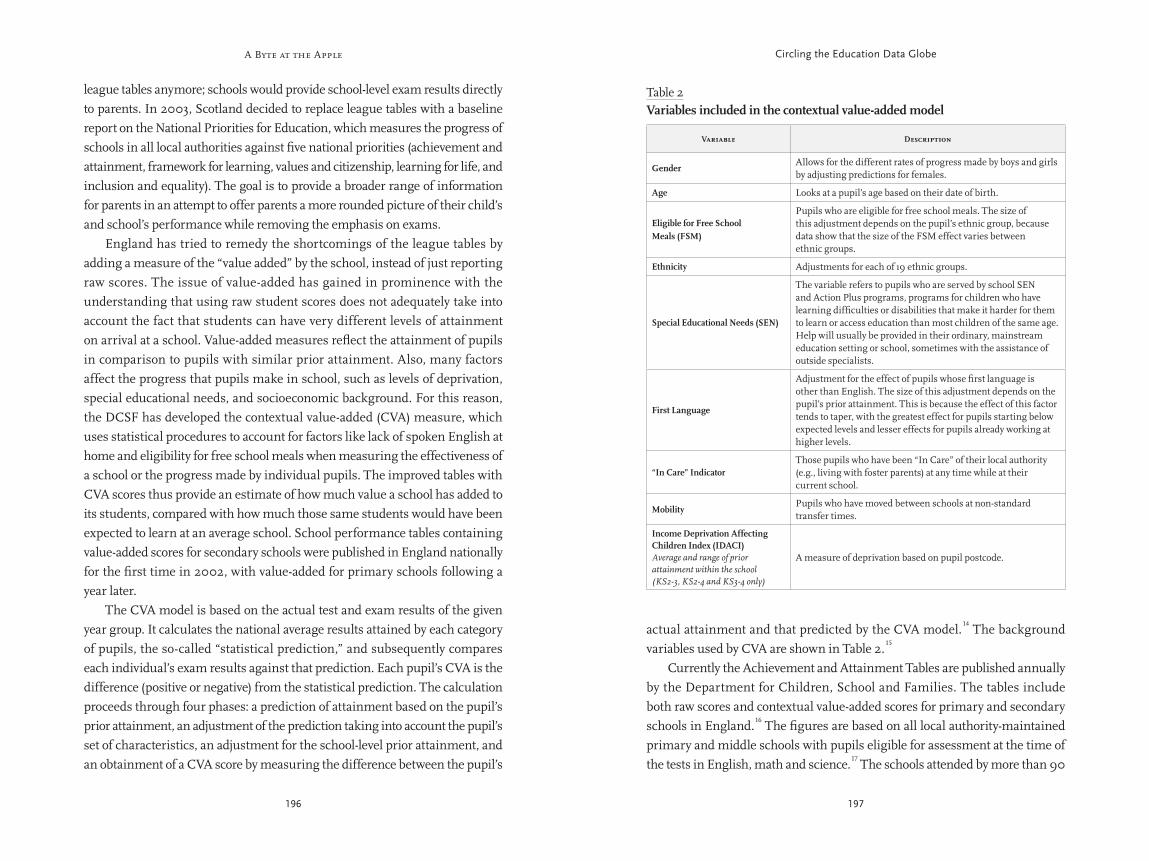
A Byte at the Apple
196 197
Circling the Education Data Globe
actual attainment and that predicted by the CVA model. 14
The background variables used by CVA are shown in Table 2.
15
Currently the Achievement and Attainment Tables are published annually by the Department for Children, School and Families. The tables include both raw scores and contextual value-added scores for primary and secondary schools in England.
16 The figures are based on all local authority-maintained
primary and middle schools with pupils eligible for assessment at the time of the tests in English, math and science.
17 The schools attended by more than 90
league tables anymore; schools would provide school-level exam results directly to parents. In 2003, Scotland decided to replace league tables with a baseline report on the National Priorities for Education, which measures the progress of schools in all local authorities against five national priorities (achievement and attainment, framework for learning, values and citizenship, learning for life, and inclusion and equality). The goal is to provide a broader range of information for parents in an attempt to offer parents a more rounded picture of their child’s and school’s performance while removing the emphasis on exams. England has tried to remedy the shortcomings of the league tables by adding a measure of the “value added” by the school, instead of just reporting raw scores. The issue of value-added has gained in prominence with the understanding that using raw student scores does not adequately take into account the fact that students can have very different levels of attainment on arrival at a school. Value-added measures reflect the attainment of pupils in comparison to pupils with similar prior attainment. Also, many factors affect the progress that pupils make in school, such as levels of deprivation, special educational needs, and socioeconomic background. For this reason, the DCSF has developed the contextual value-added (CVA) measure, which uses statistical procedures to account for factors like lack of spoken English at home and eligibility for free school meals when measuring the effectiveness of a school or the progress made by individual pupils. The improved tables with CVA scores thus provide an estimate of how much value a school has added to its students, compared with how much those same students would have been expected to learn at an average school. School performance tables containing value-added scores for secondary schools were published in England nationally for the first time in 2002, with value-added for primary schools following a year later. The CVA model is based on the actual test and exam results of the given year group. It calculates the national average results attained by each category of pupils, the so-called “statistical prediction,” and subsequently compares each individual’s exam results against that prediction. Each pupil’s CVA is the difference (positive or negative) from the statistical prediction. The calculation proceeds through four phases: a prediction of attainment based on the pupil’s prior attainment, an adjustment of the prediction taking into account the pupil’s set of characteristics, an adjustment for the school-level prior attainment, and an obtainment of a CVA score by measuring the difference between the pupil’s
Table 2Variables included in the contextual value-added model
Variable Description
GenderAllows for the different rates of progress made by boys and girls by adjusting predictions for females.
Age Looks at a pupil’s age based on their date of birth.
Eligible for Free School Meals (FSM)
Pupils who are eligible for free school meals. The size of this adjustment depends on the pupil’s ethnic group, because data show that the size of the FSM effect varies between ethnic groups.
Ethnicity Adjustments for each of 19 ethnic groups.
Special Educational Needs (SEN)
The variable refers to pupils who are served by school SEN and Action Plus programs, programs for children who have learning difficulties or disabilities that make it harder for them to learn or access education than most children of the same age. Help will usually be provided in their ordinary, mainstream education setting or school, sometimes with the assistance of outside specialists.
First Language
Adjustment for the effect of pupils whose first language is other than English. The size of this adjustment depends on the pupil’s prior attainment. This is because the effect of this factor tends to taper, with the greatest effect for pupils starting below expected levels and lesser effects for pupils already working at higher levels.
“In Care” Indicator Those pupils who have been “In Care” of their local authority (e.g., living with foster parents) at any time while at their current school.
Mobility Pupils who have moved between schools at non-standard transfer times.
Income Deprivation Affecting Children Index (IDACI) Average and range of prior attainment within the school (KS2-3, KS2-4 and KS3-4 only)
A measure of deprivation based on pupil postcode.
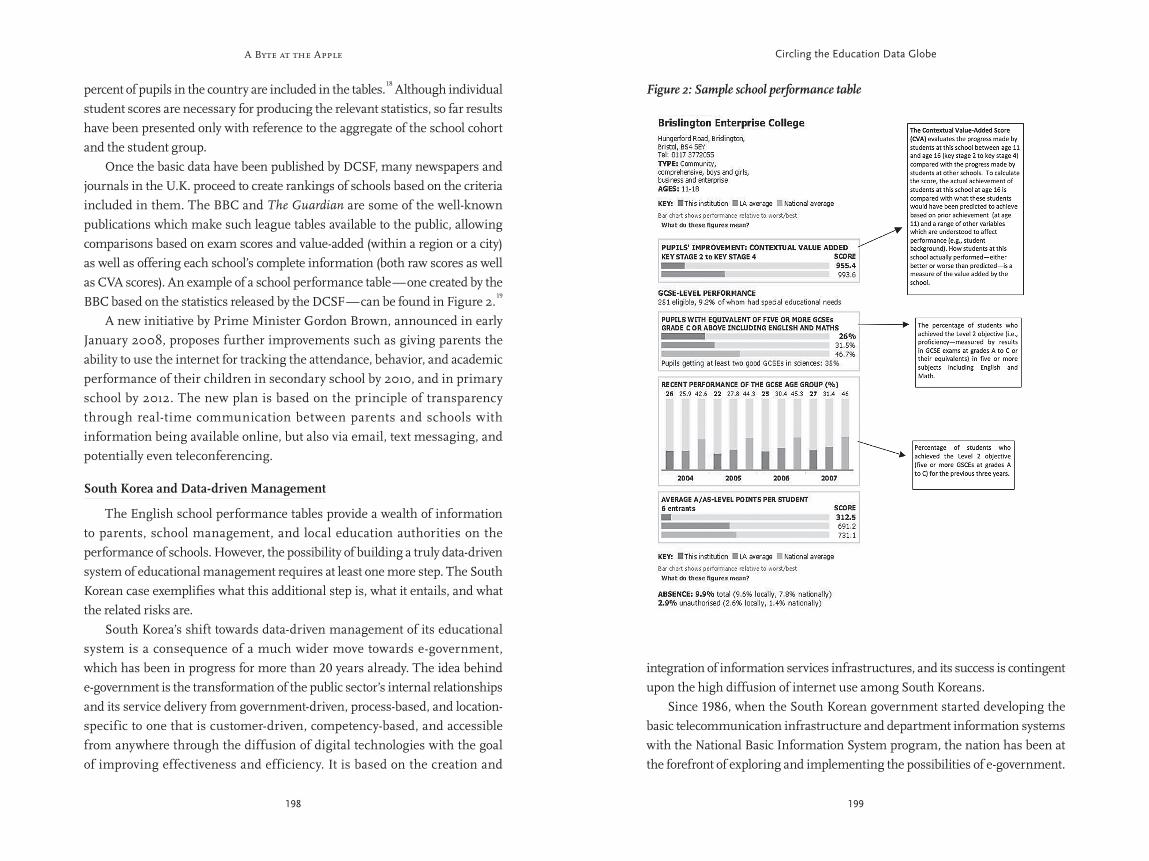
A Byte at the Apple
198 199
Circling the Education Data Globe
integration of information services infrastructures, and its success is contingent upon the high diffusion of internet use among South Koreans. Since 1986, when the South Korean government started developing the basic telecommunication infrastructure and department information systems with the National Basic Information System program, the nation has been at the forefront of exploring and implementing the possibilities of e-government.
percent of pupils in the country are included in the tables. 18
Although individual student scores are necessary for producing the relevant statistics, so far results have been presented only with reference to the aggregate of the school cohort and the student group. Once the basic data have been published by DCSF, many newspapers and journals in the U.K. proceed to create rankings of schools based on the criteria included in them. The BBC and The Guardian are some of the well-known publications which make such league tables available to the public, allowing comparisons based on exam scores and value-added (within a region or a city) as well as offering each school’s complete information (both raw scores as well as CVA scores). An example of a school performance table — one created by the BBC based on the statistics released by the DCSF — can be found in Figure 2.
19
A new initiative by Prime Minister Gordon Brown, announced in early January 2008, proposes further improvements such as giving parents the ability to use the internet for tracking the attendance, behavior, and academic performance of their children in secondary school by 2010, and in primary school by 2012. The new plan is based on the principle of transparency through real-time communication between parents and schools with information being available online, but also via email, text messaging, and potentially even teleconferencing.
South Korea and Data-driven Management
The English school performance tables provide a wealth of information to parents, school management, and local education authorities on the performance of schools. However, the possibility of building a truly data-driven system of educational management requires at least one more step. The South Korean case exemplifies what this additional step is, what it entails, and what the related risks are. South Korea’s shift towards data-driven management of its educational system is a consequence of a much wider move towards e-government, which has been in progress for more than 20 years already. The idea behind e-government is the transformation of the public sector’s internal relationships and its service delivery from government-driven, process-based, and location-specific to one that is customer-driven, competency-based, and accessible from anywhere through the diffusion of digital technologies with the goal of improving effectiveness and efficiency. It is based on the creation and
Figure 2: Sample school performance table
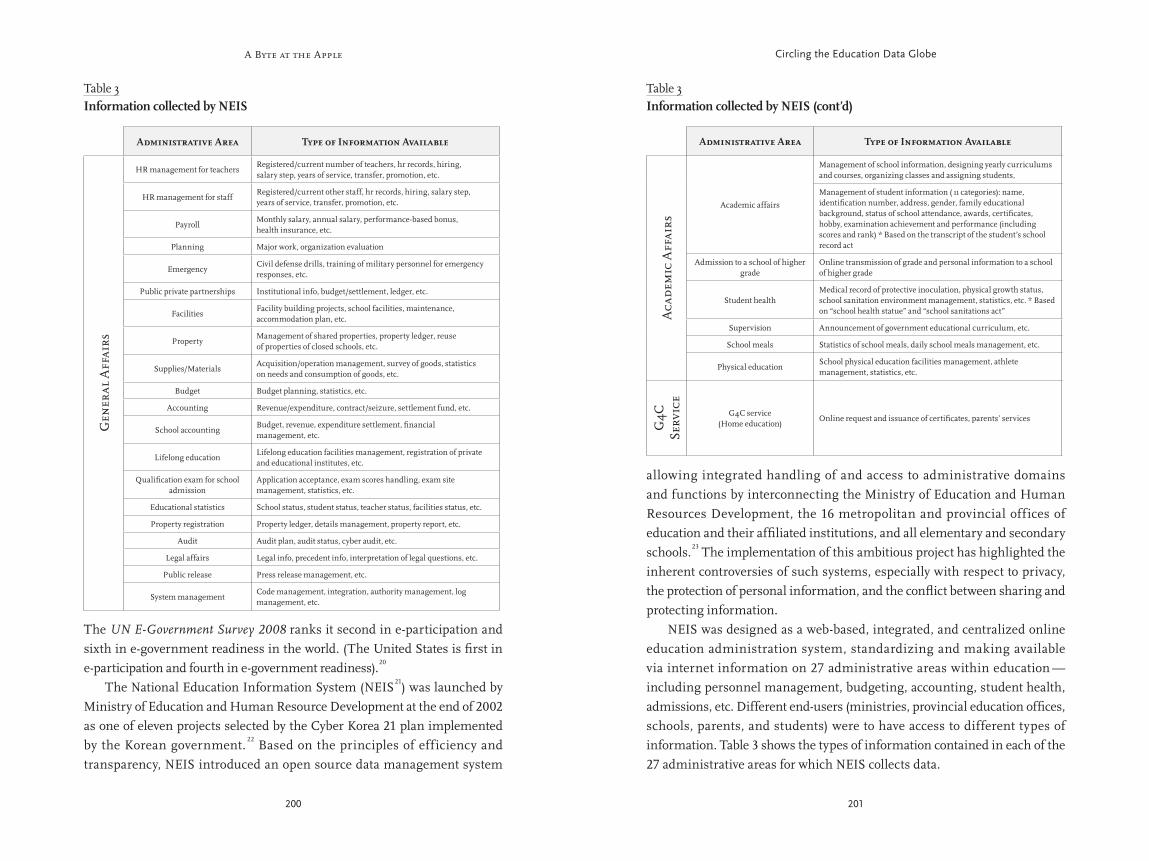
A Byte at the Apple
200 201
Circling the Education Data Globe
allowing integrated handling of and access to administrative domains and functions by interconnecting the Ministry of Education and Human Resources Development, the 16 metropolitan and provincial offices of education and their affiliated institutions, and all elementary and secondary schools.
23 The implementation of this ambitious project has highlighted the
inherent controversies of such systems, especially with respect to privacy, the protection of personal information, and the conflict between sharing and protecting information. NEIS was designed as a web-based, integrated, and centralized online education administration system, standardizing and making available via internet information on 27 administrative areas within education — including personnel management, budgeting, accounting, student health, admissions, etc. Different end-users (ministries, provincial education offices, schools, parents, and students) were to have access to different types of information. Table 3 shows the types of information contained in each of the 27 administrative areas for which NEIS collects data.
The UN E-Government Survey 2008 ranks it second in e-participation and sixth in e-government readiness in the world. (The United States is first in e-participation and fourth in e-government readiness).
20
The National Education Information System (NEIS 21
) was launched by Ministry of Education and Human Resource Development at the end of 2002 as one of eleven projects selected by the Cyber Korea 21 plan implemented by the Korean government.
22 Based on the principles of efficiency and
transparency, NEIS introduced an open source data management system
Administrative Area Type of Information Available
Gen
eral
Aff
airs
HR management for teachersRegistered/current number of teachers, hr records, hiring, salary step, years of service, transfer, promotion, etc.
HR management for staffRegistered/current other staff, hr records, hiring, salary step, years of service, transfer, promotion, etc.
PayrollMonthly salary, annual salary, performance-based bonus, health insurance, etc.
Planning Major work, organization evaluation
EmergencyCivil defense drills, training of military personnel for emergency responses, etc.
Public private partnerships Institutional info, budget/settlement, ledger, etc.
FacilitiesFacility building projects, school facilities, maintenance, accommodation plan, etc.
PropertyManagement of shared properties, property ledger, reuse of properties of closed schools, etc.
Supplies/MaterialsAcquisition/operation management, survey of goods, statistics on needs and consumption of goods, etc.
Budget Budget planning, statistics, etc.
Accounting Revenue/expenditure, contract/seizure, settlement fund, etc.
School accountingBudget, revenue, expenditure settlement, financial management, etc.
Lifelong educationLifelong education facilities management, registration of private and educational institutes, etc.
Qualification exam for school admission
Application acceptance, exam scores handling, exam site management, statistics, etc.
Educational statistics School status, student status, teacher status, facilities status, etc.
Property registration Property ledger, details management, property report, etc.
Audit Audit plan, audit status, cyber audit, etc.
Legal affairs Legal info, precedent info, interpretation of legal questions, etc.
Public release Press release management, etc.
System managementCode management, integration, authority management, log management, etc.
Table 3Information collected by NEIS
Table 3Information collected by NEIS (cont’d)
Administrative Area Type of Information Available
Aca
dem
ic A
ffai
rs
Academic affairs
Management of school information, designing yearly curriculums and courses, organizing classes and assigning students,
Management of student information ( 11 categories): name, identification number, address, gender, family educational background, status of school attendance, awards, certificates, hobby, examination achievement and performance (including scores and rank) * Based on the transcript of the student’s school record act
Admission to a school of higher grade
Online transmission of grade and personal information to a school of higher grade
Student healthMedical record of protective inoculation, physical growth status, school sanitation environment management, statistics, etc. * Based on “school health statue” and “school sanitations act”
Supervision Announcement of government educational curriculum, etc.
School meals Statistics of school meals, daily school meals management, etc.
Physical educationSchool physical education facilities management, athlete management, statistics, etc.
G4C
Se
rvic
e
G4C service(Home education)
Online request and issuance of certificates, parents’ services
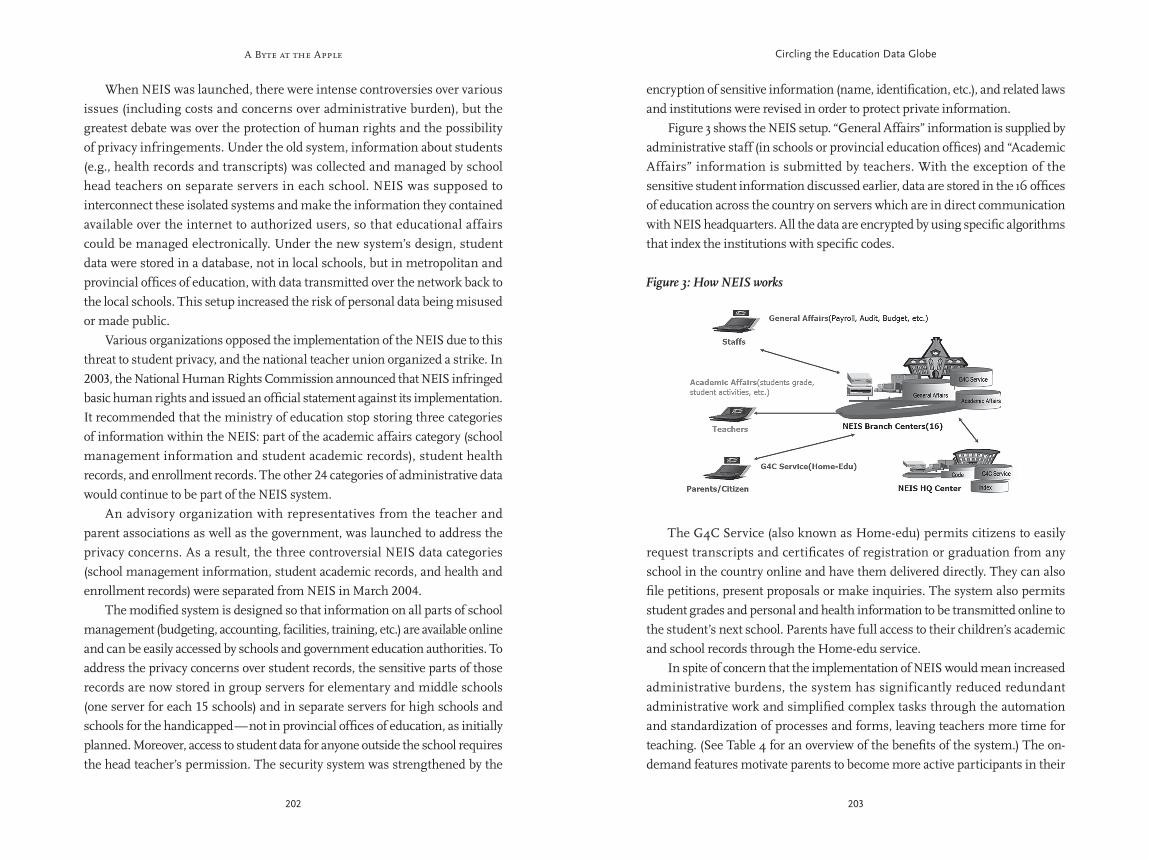
A Byte at the Apple
202 203
Circling the Education Data Globe
encryption of sensitive information (name, identification, etc.), and related laws and institutions were revised in order to protect private information. Figure 3 shows the NEIS setup. “General Affairs” information is supplied by administrative staff (in schools or provincial education offices) and “Academic Affairs” information is submitted by teachers. With the exception of the sensitive student information discussed earlier, data are stored in the 16 offices of education across the country on servers which are in direct communication with NEIS headquarters. All the data are encrypted by using specific algorithms that index the institutions with specific codes.
The G4C Service (also known as Home-edu) permits citizens to easily request transcripts and certificates of registration or graduation from any school in the country online and have them delivered directly. They can also file petitions, present proposals or make inquiries. The system also permits student grades and personal and health information to be transmitted online to the student’s next school. Parents have full access to their children’s academic and school records through the Home-edu service. In spite of concern that the implementation of NEIS would mean increased administrative burdens, the system has significantly reduced redundant administrative work and simplified complex tasks through the automation and standardization of processes and forms, leaving teachers more time for teaching. (See Table 4 for an overview of the benefits of the system.) The on-demand features motivate parents to become more active participants in their
When NEIS was launched, there were intense controversies over various issues (including costs and concerns over administrative burden), but the greatest debate was over the protection of human rights and the possibility of privacy infringements. Under the old system, information about students (e.g., health records and transcripts) was collected and managed by school head teachers on separate servers in each school. NEIS was supposed to interconnect these isolated systems and make the information they contained available over the internet to authorized users, so that educational affairs could be managed electronically. Under the new system’s design, student data were stored in a database, not in local schools, but in metropolitan and provincial offices of education, with data transmitted over the network back to the local schools. This setup increased the risk of personal data being misused or made public. Various organizations opposed the implementation of the NEIS due to this threat to student privacy, and the national teacher union organized a strike. In 2003, the National Human Rights Commission announced that NEIS infringed basic human rights and issued an official statement against its implementation. It recommended that the ministry of education stop storing three categories of information within the NEIS: part of the academic affairs category (school management information and student academic records), student health records, and enrollment records. The other 24 categories of administrative data would continue to be part of the NEIS system. An advisory organization with representatives from the teacher and parent associations as well as the government, was launched to address the privacy concerns. As a result, the three controversial NEIS data categories (school management information, student academic records, and health and enrollment records) were separated from NEIS in March 2004. The modified system is designed so that information on all parts of school management (budgeting, accounting, facilities, training, etc.) are available online and can be easily accessed by schools and government education authorities. To address the privacy concerns over student records, the sensitive parts of those records are now stored in group servers for elementary and middle schools (one server for each 15 schools) and in separate servers for high schools and schools for the handicapped — not in provincial offices of education, as initially planned. Moreover, access to student data for anyone outside the school requires the head teacher’s permission. The security system was strengthened by the
Figure 3: How NEIS works
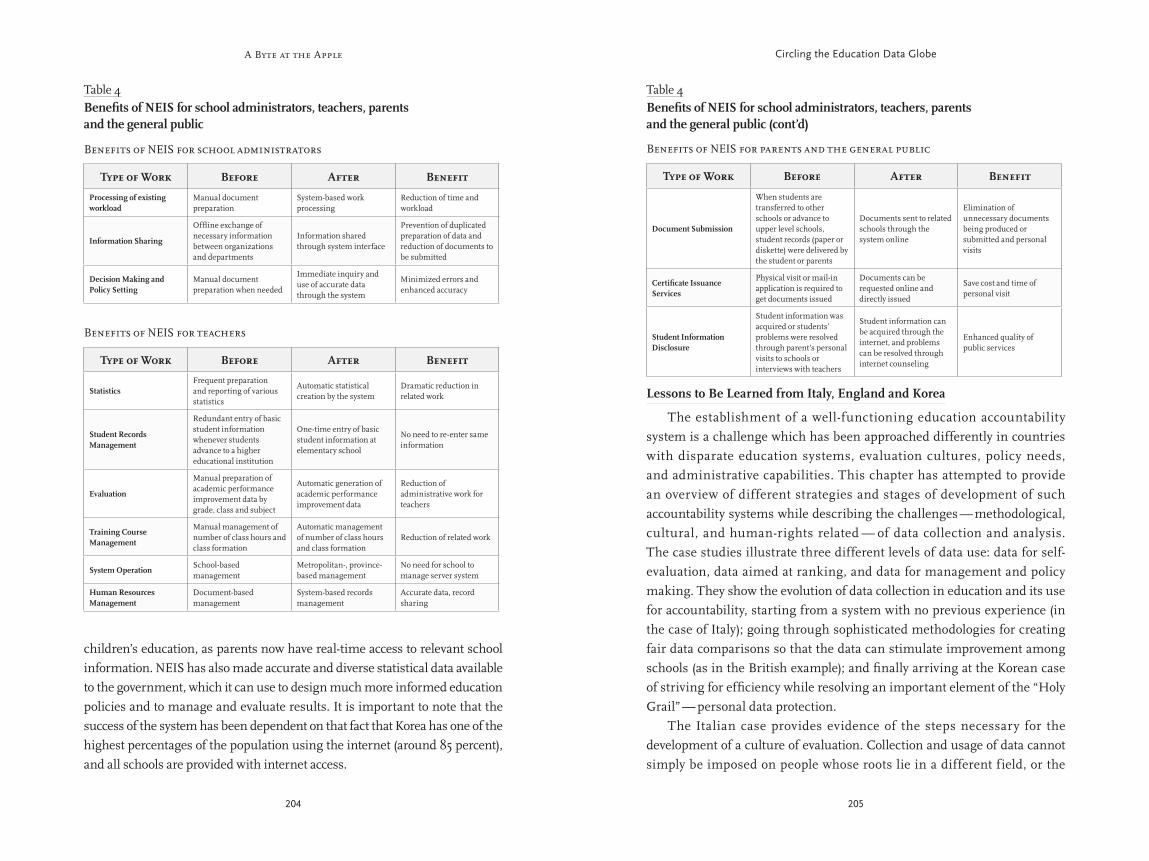
A Byte at the Apple
204 205
Circling the Education Data Globe
Lessons to Be Learned from Italy, England and Korea
The establishment of a well-functioning education accountability system is a challenge which has been approached differently in countries with disparate education systems, evaluation cultures, policy needs, and administrative capabilities. This chapter has attempted to provide an overview of different strategies and stages of development of such accountability systems while describing the challenges — methodological, cultural, and human-rights related — of data collection and analysis. The case studies illustrate three different levels of data use: data for self-evaluation, data aimed at ranking, and data for management and policy making. They show the evolution of data collection in education and its use for accountability, starting from a system with no previous experience (in the case of Italy); going through sophisticated methodologies for creating fair data comparisons so that the data can stimulate improvement among schools (as in the British example); and finally arriving at the Korean case of striving for efficiency while resolving an important element of the “Holy Grail” — personal data protection. The Italian case provides evidence of the steps necessary for the development of a culture of evaluation. Collection and usage of data cannot simply be imposed on people whose roots lie in a different field, or the
children’s education, as parents now have real-time access to relevant school information. NEIS has also made accurate and diverse statistical data available to the government, which it can use to design much more informed education policies and to manage and evaluate results. It is important to note that the success of the system has been dependent on that fact that Korea has one of the highest percentages of the population using the internet (around 85 percent), and all schools are provided with internet access.
Benefits of NEIS for school administrators
Type of Work Before After Benefit
Processing of existing workload
Manual document preparation
System-based work processing
Reduction of time and workload
Information Sharing
Offline exchange of necessary information between organizations and departments
Information shared through system interface
Prevention of duplicated preparation of data and reduction of documents to be submitted
Decision Making and Policy Setting
Manual document preparation when needed
Immediate inquiry and use of accurate data through the system
Minimized errors and enhanced accuracy
Benefits of NEIS for teachers
Type of Work Before After Benefit
Statistics Frequent preparation and reporting of various statistics
Automatic statistical creation by the system
Dramatic reduction in related work
Student Records Management
Redundant entry of basic student information whenever students advance to a higher educational institution
One-time entry of basic student information at elementary school
No need to re-enter same information
Evaluation
Manual preparation of academic performance improvement data by grade, class and subject
Automatic generation of academic performance improvement data
Reduction of administrative work for teachers
Training Course Management
Manual management of number of class hours and class formation
Automatic management of number of class hours and class formation
Reduction of related work
System Operation School-based management
Metropolitan-, province-based management
No need for school to manage server system
Human Resources Management
Document-based management
System-based records management
Accurate data, record sharing
Table 4Benefits of NEIS for school administrators, teachers, parents and the general public
Table 4Benefits of NEIS for school administrators, teachers, parents and the general public (cont’d)
Benefits of NEIS for parents and the general public
Type of Work Before After Benefit
Document Submission
When students are transferred to other schools or advance to upper level schools, student records (paper or diskette) were delivered by the student or parents
Documents sent to related schools through the system online
Elimination of unnecessary documents being produced or submitted and personal visits
Certificate Issuance Services
Physical visit or mail-in application is required to get documents issued
Documents can be requested online and directly issued
Save cost and time of personal visit
Student Information Disclosure
Student information was acquired or students’ problems were resolved through parent’s personal visits to schools or interviews with teachers
Student information can be acquired through the internet, and problems can be resolved through internet counseling
Enhanced quality of public services
A Byte at the Apple
206 207
Circling the Education Data Globe
system centered upon inspections, they have proven useful for benchmarking, goal-setting, and self-improvement purposes. Moreover, the increasing use that the press has made of Achievement and Attainment Tables to construct rankings of schools has helped stimulate debates on school performance and has kept public opinion — and hence policy making — focused on the issue of school quality. Instead of dismantling the system, England has tried to refine the measures with the development of the contextual value-added measure, and the joint presentation of raw scores and value-added measures serves the purpose of showing both the absolute performance of the school and also whether schools are meeting or exceeding expectations, given the students they enroll. It is expected that the availability of both raw and value-added scores could be of great interest to American parents, even if they are not as free to exercise choice as English parents are. Of course, value-added measures are not unique to England. The Tennessee Value-Added Assessment System, (TVAAS) developed by William Sanders and first implemented in 1992, is possibly the first accountability system that made institutional use of value-added measures.
26 While the English model limits itself to producing an overview of school development, in the Tennessee case “teachers and schools are held accountable for making sure that their students improve in scores from one test to the next, not for having their students meet some fixed standard minimum score.”
27 In England, the information
about school performance is available online to anybody as an important feature of a quasi-market in education that is organized around the idea of serving customers. As noted, this soon will extend to making data on individual students available online. The U.S. has so far not made much use of value-added rankings for schools. The methodology developed by Sanders in Tennessee is now part of the Education Value-Added Assessment System (EVAAS), a data analysis and reporting service offered by SAS in Schools. In the school systems that have contracted with EVAAS for value-added analysis to be performed, the results of the analysis are only available to the districts themselves. On the methodological side, while the U.K.’s value-added methodology is publicly available, the methodology developed by Sanders in Tennessee is now a proprietary part of a private business initiative and is held in secret. Up to now, it has not been subject to any independent review. It is known, though, that the EVAAS is based on the assumption that “each child serves as his or her
tool would be considered an extra weight to carry, rather than a powerful instrument to use. In Italy, the schools were initially able to choose to participate in the evaluation system in order to gain prestige or information. By the time the system became compulsory, the evaluation process already involved almost all Italian schools, and the confidentiality of the data reassured schools about their concerns involving unwanted (and potentially unfair) comparison with institutions of different socioeconomic makeup or other conditions. Now the system is understood, and the data will soon be used not only for counseling purposes, but also for the evaluation of school principals. Because of the increasing acceptance of data use, more detailed data will be collected, and there is growing demand for training in the use of the data. Thus the Italian case suggests the need of planning ahead, because building a system that is understood and used by schools and stakeholders is a process that can take many years.
The U.K. system of generating educational performance statistics has a few essential characteristics. It tries to identify the many factors influencing student performance and then evaluates schools on the basis of how they manage the various factors and best educate the student. It has increasingly focused on the use of relative indicators, monitoring the individual student’s development both in comparison to his own previous achievement and to that of his peer group. It has also put an emphasis on the comprehensiveness of the evaluation system (i.e., the inclusion of a very large number of schools, covering both the primary and secondary cycles of education). The system gives parents the opportunity to make educated decisions about the schooling of their children and at the same time gives schools a stimulus for improvement. Over the years, many have criticized the use of league tables because they could provide a false picture of the effectiveness of schools that, for example, serve students of poorer backgrounds or use International General Certificate of Secondary Education (IGCSE) exams rather than the traditional GCSE test for evaluating students.
24 As noted earlier, Scotland, Wales, and Northern
Ireland have decided to abolish performance tables because they are considered divisive and are thought to place an unnecessary burden on schools.
25 Still,
although “naming and shaming” could be detrimental to the schools that are not fairly depicted by the indicators in use, rankings serve as an important source of information for prospective students. In parallel with an accreditation
A Byte at the Apple
208 209
Circling the Education Data Globe
how, through extensive negotiations, stakeholders have been able to reach a compromise. A technological solution (hosting the data on different servers) has allowed Korea to obtain many of the advantages of data availability while still providing an adequate level of data privacy.
own control.” Because the child’s earlier test scores are included in the model, and because important socioeconomic and demographic characteristics are already factored into a student’s earlier test scores, Sanders believes there is no need to statistically control for the influence of those variables on achievement.
28
The U.K. model instead specifically includes socioeconomic characteristics as control variables in the analysis — as these variables are believed to affect how well students learn — which means that data collection must include many of these contextual characteristics. Assessing which kind of value-added model best serves the needs of the system and the students is an issue that goes far beyond the scope of this essay. What can be noted is that, while the TVAAS/EVAAS model makes it possible to link student results to individual teachers, there are still debates over whether the methodology accurately identifies causal relationships (i.e., whether the teacher or the school are the cause of low or high levels of student achievement, or whether other factors — that have not been controlled for — are responsible).
29
Thus a more descriptive approach, such as the English system that makes available to the public both raw scores and contextual value-added measures, seems more prudent. Given its earlier experiences with value-added measures, why hasn’t the U.S. developed its own league tables? One reason might be the fact that No Child Left Behind has shifted the focus to the “percentage of proficient students” path as opposed to the value-added one. Another reason is that a broader consensus on the ways to calculate and implement value-added measures for statewide or nationwide comparisons has not yet been achieved.
The controversy sparked by the Korean NEIS system illuminates a key issue surrounding the use of sensitive data. The centralized availability of information could bring about economies of scale that would reduce the cost of data collection and data infrastructure while facilitating the use of information for evidence-based policy. But the required data are highly sensitive and touch upon the most intimate characteristics of individuals and their families (income, health status, family relations, etc.). The tension between the two objectives — the availability of data for analysis and data privacy — could have led the system to stall. The Korean success shows
A Byte at the Apple
210 211
Circling the Education Data Globe
Sanders, William L., Arnold M. Saxton and Sandra P. Horn. “The Tennessee
Value-Added System: A Quantitative, Outcomes-based Approach to Educational
Assessment.” Grading Teachers, Grading Schools: Is Student Achievement a Valid
Evaluation Measure? Thousand Oaks, CA: Corwin Press Inc., 1997.
Sanders, William L. and Sandra P. Horn. “Research Findings from the
Tennessee Value-Added Assessment System (TVAAS) Database: Implications for
Educational Evaluation and Research” Journal of Personnel Evaluation in Education
vol. 12, 1998.
“Schools and Pupils in England: January 2007 (Final).” Statistical First Release.
Department for Children, Schools and Family, 2007.
Seung Mann Yang. “The Future of Education: NEIS.” WBI Learning
Programs –Education.” World Bank, 2007. http://info.worldbank.org/etools/docs/
library/243124/day2Session5_Seung%20Mann%20Yang_2.pdf
Soon Kim, Y. “Challenges and Barriers in Implementing E-Government:
Investigation on NEIS of Korea.” Advanced Communication Technology ICACT 2006.
vol. 3 issue 20-22, 2006.
Tymms, Peter and Colin Dean. “Value-Added in the Primary School League
Tables: A Report for the National Association of Head Teachers.” Curriculum,
Evaluation and Management Centre, University of Durham, 2004.
“United Nations E-Government Survey 2008.” United Nations, 2008.
http://unpan1.un.org/intradoc/groups/public/documents/UN/UNPAN028607.pdf
“Value-Added in Education: A Briefing Paper from the Department for
Education.” Department for Children, Schools and Family, 1995.
“White Paper on Adapting Education to the Information Age.” Ministry of
Education & Human Resources Development and Korea Education & Research
Information Service, 2002.
Bibliography
“E-Government White Paper.” Special Committee for e-Government.
Republic of Korea, 2003. http://unpan1.un.org/intradoc/groups/public/documents/
APCITY/UNPAN015126.pdf
Gorard, Stephen. “Value-added Is of Little Value.” Paper presented at the
British Educational Research Association Annual Conference, University of
Glamorgan, 2005.
Gori, Enrico, Eric Hanushek, Daniele Vidoni and Charles Glenn.
Institutional Models in Education. Netherlands: Wolf Legal Publishers, 2006.
Grossi, L. et al. Country Report — Italy. European Agency for Development in
Special Needs Education, 2006. http://www.european-agency.org/site/themes/
assessment/reports.shtml
Hoyle, Rebecca and James Robinson. “League Tables and School Effectiveness:
A Mathematical Model.” Proceedings: Biological Sciences vol. 270 no. 1511, 2002.
http://unpan1.un.org/intradoc/groups/public/documents/un/unpan028607.pdf
Joon Song, H. “Prospects and Limitations of the E-government Initiative in
Korea.” International Review of Public Administration vol. 7 no. 2, 2002.
Korea Agency for Digital Opportunity and Promotion. https://www.kado.or.kr/
koil/aboutkado/
Kupermintz, Haggai. “Teacher Effects and Teacher Effectiveness:
A Validity Investigation of the Tennessee Value-Added Assessment System.”
Educational Evaluation and Policy Analysis 25, 2003.
Park, Jin. “Conflict Resolution Case Study: The National Education Information
System (NEIS).” KDI School Working Paper Series WP 06-04, 2006.
Ray, Andrew. “School Value Added Measures in England.” Paper for the OECD
project on the Development of Value-Added Models in Education Systems, 2006.
http://www.dfes.gov.uk/research/data/uploadfiles/RW85.pdf
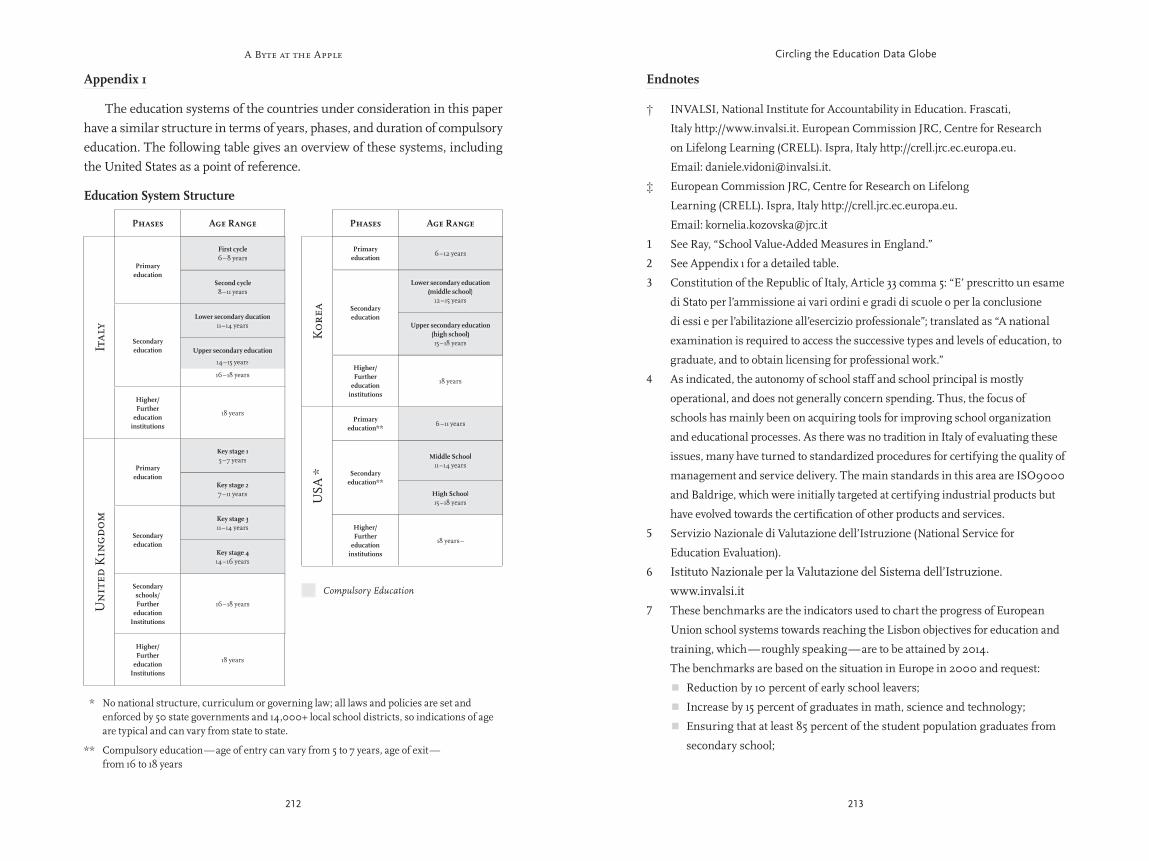
A Byte at the Apple
212 213
Circling the Education Data Globe
Endnotes
† INVALSI, National Institute for Accountability in Education. Frascati,
Italy http://www.invalsi.it. European Commission JRC, Centre for Research
on Lifelong Learning (CRELL). Ispra, Italy http://crell.jrc.ec.europa.eu.
Email: [email protected].
‡ European Commission JRC, Centre for Research on Lifelong
Learning (CRELL). Ispra, Italy http://crell.jrc.ec.europa.eu.
Email: [email protected]
See Ray, “School Value-Added Measures in England.”1
See Appendix 1 for a detailed table.2
Constitution of the Republic of Italy, Article 33 comma 5: “E’ prescritto un esame 3
di Stato per l’ammissione ai vari ordini e gradi di scuole o per la conclusione
di essi e per l’abilitazione all’esercizio professionale”; translated as “A national
examination is required to access the successive types and levels of education, to
graduate, and to obtain licensing for professional work.”
As indicated, the autonomy of school staff and school principal is mostly 4
operational, and does not generally concern spending. Thus, the focus of
schools has mainly been on acquiring tools for improving school organization
and educational processes. As there was no tradition in Italy of evaluating these
issues, many have turned to standardized procedures for certifying the quality of
management and service delivery. The main standards in this area are ISO9000
and Baldrige, which were initially targeted at certifying industrial products but
have evolved towards the certifi cation of other products and services.
Servizio Nazionale di Valutazione dell’Istruzione (National Service for 5
Education Evaluation).
Istituto Nazionale per la Valutazione del Sistema dell’Istruzione. 6
www.invalsi.it
These benchmarks are the indicators used to chart the progress of European 7
Union school systems towards reaching the Lisbon objectives for education and
training, which — roughly speaking — are to be attained by 2014.
The benchmarks are based on the situation in Europe in 2000 and request:
Reduction by 10 percent of early school leavers;��Increase by 15 percent of graduates in math, science and technology;�Ensuring that at least 85 percent of the student population graduates from ��secondary school;
Appendix 1
The education systems of the countries under consideration in this paper have a similar structure in terms of years, phases, and duration of compulsory education. The following table gives an overview of these systems, including the United States as a point of reference.
* No national structure, curriculum or governing law; all laws and policies are set and enforced by 50 state governments and 14,000+ local school districts, so indications of age are typical and can vary from state to state.
** Compulsory education — age of entry can vary from 5 to 7 years, age of exit — from 16 to 18 years
Education System Structure
Phases Age Range
Ital
y
Primary education
First cycle6 – 8 years
Second cycle8 – 11 years
Secondary education
Lower secondary ducation11 – 14 years
Upper secondary education
14 – 15 years
16 – 18 years
Higher/ Further
education institutions
18 years
Un
ited
Kin
gdom
Primary education
Key stage 15 – 7 years
Key stage 27 – 11 years
Secondary education
Key stage 311 – 14 years
Key stage 414 – 16 years
Secondary schools/Further
education Institutions
16 – 18 years
Higher/ Further
education Institutions
18 years
Phases Age Range
Kor
ea
Primary education
6 – 12 years
Secondary education
Lower secondary education (middle school)
12 – 15 years
Upper secondary education(high school)15 – 18 years
Higher/ Further
education institutions
18 years
USA
*
Primary education**
6 – 11 years
Secondary education**
Middle School11 – 14 years
High School15 – 18 years
Higher/Further
education institutions
18 years –
First cycle6 – 8 years
Second cycle8 – 11 years
Lower secondary ducation11 – 14 years
Upper secondary education
14 – 15 years
Key stage 15 – 7 years
Key stage 27 – 11 years
Key stage 311 – 14 years
Key stage 414 – 16 years
6 – 12 years
Lower secondary education (middle school)
12 – 15 years
Upper secondary education(high school)15 – 18 years
6 – 11 years
Middle School11 – 14 years
High School15 – 18 years
Compulsory Education
A Byte at the Apple
214 215
Circling the Education Data Globe
made by the pupils at the end of key stage (KS) 3 since taking their KS 2 tests,
and another related to the progress made by pupils at school leaving age since
taking the KS 3 tests. The KS 2 to KS 3 value-added score compares the pupil’s
performance with the median performance of other pupils with the same or
similar results at KS 2. The individual scores are averaged to give a score for
the school that is represented as a number based around 100, indicating the
value the school has added, on average, for their pupils (a score higher than 100
indicates that the school’s students have performed better than similar students
nationally). The KS 3 to GCSE/GNVQ measure is calculated in the same way
with the respective KS3 and GCSE/GNVQ results. The individual AAT includes
a confidence interval which estimates the uncertainty of the value-added score
as a measure of school effectiveness due to the fact that the score is based on a
given set of pupils’ results for a particular test paper on a particular day and as
such depends on the number of pupils included in the calculation. The primary
school league tables are based on the results from the tests given at the end of
key stage 2.
Special schools (educational institutions with the resources and staff expertise 17
to meet the needs of pupils with special educational needs), pupil referral units,
hospital schools or independent schools are not included.
Schools not included in the AAT are primary schools with ten or fewer pupils, 18
any school where fewer than half of the pupils have matched data with which to
calculate CVA, and some independent schools.
The table for this school can be found at http://news.bbc.co.uk/1/shared/bsp/19
hi/education/07/school_tables/secondary_schools/html/801_4032.stm.
Explanations for each indicator have been taken from the BBC guide:
http://news.bbc.co.uk/1/hi/education/7176947.stm; and DCSF:
http://www.dcsf.gov.uk/performancetables/Final-Decisions-on-Changes-to-the-
Content-of-the-2007-Achievement-and-Attainment-Tables.pdf.
See 20 UN E-government Survey 2008.
For more information, see the NEIS’ http://www.neis.go.kr.21
For more information on Korea’s e-government initiatives, see 22
http://www.korea.go.kr/eng/_eng_demonstration/demonstration.jsp.
A similar approach to the integration of educational applications is 23
represented by the Schools Interoperability Framework (SIF), an industry
initiative enabling the efficient and secure interaction and sharing of data
among schools, districts and states though a common certification program
Reducing by 20 percent the levels of low achievers in reading at ��age 15;
Ensuring that at least 12.5 percent of the adult population participates in ��lifelong learning activities.
Italy is administratively divided in 20 regions. The 20 regions are aggregated 8
into five macro regions: North-West, North-East, Centre, South, Islands.
Currently, these tests do not have any consequences for students, and — for cost 9
reasons — it is not clear whether these tests will be given in the future to the
whole population of students or just to samples. If entire cohorts of students are
tested, then the test results could count toward students’ grades.
In the U.K., parents must apply for a place in school for their children, either 10
their local school or an alternative school. When possible, these preferences
have to be met, but where there are more applications than empty seats, the
admission authority (the school or the Local Education Authority) has to follow
published oversubscription criteria in the final allocation of places. Parents are
then able to appeal the final school assignment, giving them a final opportunity
to get the school of their choice.
See Hoyle and Robinson, “League Tables and School Effectiveness.”11
The Department for Children, Schools and Families is responsible for 12
coordinating work across government related to youth justice, family policy,
child poverty and child health while also taking over responsibility for education
policy up to the age of 19 in England.
The Pupil Level Annual School Census is a census of each pupil in school, and 13
contains contextual details and a unique pupil number, enabling LEAs and
DCFS to match attainment data and use the information collected for research,
reducing the need to request further data from schools. It covers all schools in
England in the maintained sector.
For detailed information on the calculation methodology, see the Technical 14
Annex of the Performance Tables at http://www.dcsf.gov.uk/performancetables/
va1_03/docD.shtml
The CVA model uses data from the Pupil Level Annual Schools Census 15
(PLACS), introduced in 2002 with the aim of collecting contextual data on pupil
background factors from schools’ administrative records on all pupils annually
and not only at the end of each key stage.
The tables can be found at 16 http://www.dcsf.gov.uk/performancetables/. There
are two measures of value-added for each school: one related to the progress
A Byte at the Apple
216
for educational management software. It defines common data formats and
high-level rules of interaction and architecture, which guarantee interoperability
between education applications regardless of the hosting platform. Until
recently, SIF has been used primarily in the U.S., but it is progressively
being implemented elsewhere (e.g., Australia and the U.K.). In fact, the U.K.
Department for Children, Schools and Families issued a statement in July 2008
recommending the adoption and use of the Schools Interoperability Framework.
See for example: 24 http://education.guardian.co.uk/secondaries/
story/0,,1988200,00.html
See: 25 http://news.bbc.co.uk/1/hi/scotland/3137808.stm; http://news.bbc.co.uk/1/
hi/education/1448158.stm; http://news.bbc.co.uk/1/hi/education/1109516.stm
https://tvaas.sas.com/evaas/login.js26 p
See Sanders and Horn, “Research Findings” p. 250.27
See Sanders, Saxton and Horn, “The Tennessee Value-Added System.”28
See Kupermintz, “Teacher Effects and Teacher Effectiveness.” Kupermintz notes 29
that the TVAAS methodology is almost entirely focused on the relationship
between student performance and teaching effectiveness, with the goal of
measuring the unique and independent contribution a particular teacher makes
to his/her students’ growth, regardless of students’ contextual factors (socio-
economic background, ethnicity, prior knowledge, etc.). In fact, Kupermintz
points out that much of Sanders’ data appears to contradict this claim (that
student background need not be controlled for statistically) leading to a model
based on a circular logic where teachers and not students are responsible for
learning and for producing measurable progress in learning outcomes.
218 219
Cutting-Edge Strategies from Other Sectors
Introduction
K-12 public education is poised to make great strides in how data are amassed and used by a variety of audiences. With the advent of annual testing in reading and math, and increasing capacity in states and districts to track individual students’ progress
over time, the quantity and quality of information available to everyone from parents and students, to teachers and administrators to policymakers and the general public, are already increasing dramatically. Hundreds of software packages and websites have emerged that aim to help these different audiences tap into this new pipeline of information. Nearly every classroom now houses one or more computers with an internet connection. As exciting as these prospects are, it’s important to place them in the context of what is happening more broadly in the world of data accumulation and use. While most of the developments under way in K-12 education are absolutely necessary and worthy of encouragement, their overall effect will be to bring U.S. public education data systems barely into the 21st century, if that. As states have crept toward milestones like assigning a unique identification number to each student, other sectors have raced ahead with stunning advances in how data and information are gathered, aggregated, packaged and used for a
variety of purposes. The vast expansion of the internet and broadband access to its resources have revolutionized the world of data and information in business, nonprofits, and even in other governmental sectors. So even as K-12 moves its necessary incremental advances forward, now is a good time to pause and look at some of these more quantum leaps that have happened elsewhere — and could be relevant for K-12. The potential payoff is large for many different actors in the K-12 world. Parents, for starters, are hungry for better information, whether they are choosing schools for their children, figuring out how to intervene with a school when it is not working well for their kids, or joining forces to press for policy change. What if parents could tap into not just the static, once-a-year, fairly uni-dimensional results that are now available for schools, but into a dynamic, multi-dimensional stream of data? What if that stream of information were so rich it could answer the myriad of questions that different parents have, such as “how do children like mine do at this school?” or “what can I do at home to help my children with such and such specific problem?” Teachers are another information-hungry audience. Every day, they struggle to figure out the best way to help different children overcome the diverse barriers they face to achievement. The amount of research-based information about “what works” is paltry relative to the number of questions they have. What if the data inherent in millions of daily teacher and student interactions could be harnessed to give teachers real insight into whether method X or Y is better? What if they could pose questions and obtain practical, data-based answers quickly? What if assessment results came back to teachers along with research-based suggestions for how to help each student overcome her shortfalls? And education leaders, from principals to district officials to state policymakers, need much better information as well. They currently have only blunt instruments for measuring how well individual schools and teachers are doing; they have virtually no instruments for predicting the trajectory of schools into the future. What if leaders had access to an evolving pool of data that illuminated the questions they need answered, like which of my teachers are doing what is needed to improve their instruction, or which of my district’s schools are most in need of an infusion of new leadership? What if policymakers could more readily distinguish between schools that are on track to get better and those that are likely to languish without new action?
Cutting-Edge Strategies from Other Sectors
Bryan C. Hassel
Bryan C. Hassel is co-founder of Public Impact 1
A Byte at the Apple
220 221
Cutting-Edge Strategies from Other Sectors
The good news is that in other sectors, leading organizations are finding ways to answer these sorts of questions and create these sorts of dynamic information streams. This paper examines two major trends in data and information and speculates about their applications in K-12 education. The first is “data-mining,” which refers to applying sophisticated analytical tools to the wealth of data that organizations now have on their customers, suppliers, and markets. The second is what has been called “the wisdom of crowds,” or tapping the implicit, collective information that resides in the heads of thousands or millions of individuals.
2 These trends involve the use of new
technologies, but more fundamentally they involve a change in the way people think about “data.” The word brings to mind official statistics, gathered by having people fill out forms and send them in to centralized repositories. These new trends, by contrast, seek to convert very different kinds of information into data. Data-mining, for example, often relies on information generated almost automatically through the day-to-day activities of employees and the users of products and services. Rather than filling out forms, people are contributing to this data mountain simply by doing what they do. The wisdom of crowds trend aims to tap a very different kind of information — knowledge and insights that would otherwise remain in the minds of isolated individuals. This same kind of information exists, of course, in K-12 education. Every day, teachers, students, and parents engage collectively in billions of activities that are full of information content, if only that information could be collected and used. Students and teachers tap away at the computers that have now been installed in so many classrooms, leaving behind “click-trails” that reveal a lot about how they learn and process information. Those same people harbor myriad bits of knowledge and insight, information that can’t generally be seen or used by others. Just as other sectors have figured out ways to turn this kind of information into data and use them for transformative purposes, K-12 education could as well. To explore how, this paper describes each of these two trends in more detail, providing examples of how they have transformed activity in a sector other than K-12. It then speculates about potential applications of the ideas within K-12 public education. How could public education begin to gather — and then use — data in these radically different ways? And what sort of positive difference could that make to educators, parents, policymakers, and ultimately students? In some cases, this paper discusses nascent attempts to develop
such applications in K-12 education, though this is by no means an exhaustive survey of what may well be bubbling along in “laboratories” across the world. Finally, the paper explores why these ideas may have slow uptake in public education, and what policymakers, funders and others might do to accelerate experimentation and adoption of the most promising developments.
Trend #1: Mining Insights from the Data Mountain
Both trends discussed in this paper have been made possible by the enormous expansion in networking in the last quarter century — connecting computers to many others within the same office or globally through the internet. Most organizations now link their employees’ computers together in local networks, making it possible for them to share information with each other and maintain sources of information that are available to everyone. More radically, the internet has connected computers across not just organizational lines, but national lines. Anyone with internet access can communicate with others around the world instantaneously, and tap into growing stores of information on almost any topic. K-12 schools are fully part of this networked system. In 2005, according to the National Center for Education Statistics, 94 percent of U.S. public schools had access to the internet in instructional classrooms, up from 3 percent in 1994. Almost all of these schools (97 percent) enjoyed fast connections known as “broadband,” enabling them to take advantage of all that the Internet has to offer. Teachers and students everywhere are putting their networked computers to good use. They are using the internet to find information; using email to communicate with experts and with each other; using district data warehouses to obtain more timely assessment results; and the like. But what K-12 has not done yet is take full advantage of this networked existence in the way other sectors have. Instruction more or less continues as it always has, with technological tools taking the place of more traditional resources, but playing the same roles. One activity networking has enabled in other sectors is “data-mining” — gleaning insights from the mountains of information that are now available to companies, governments and, increasingly, individuals. Networking propelled data-mining in two ways. First, information that once resided in one person’s file cabinet, ledger sheet, or spiral notebook can now be easily made available to an entire work unit, organization, or the public at large via the internet. Of course, organizations have always made efforts to gather and aggregate data from far-
A Byte at the Apple
222 223
Cutting-Edge Strategies from Other Sectors
flowing in from its stores to decide which suppliers to keep and toss; to press suppliers for faster deliveries or fewer defects; to plan new store openings; and to decide what to put on its shelves even when a hurricane isn’t on its way. Wal-Mart also uses data to make sure its “everyday low prices” are not any lower than they need to be. Its information systems tell managers which items typically end up together in shoppers’ carts; price-setters can use that data to mix lower and higher prices within a given likely basket of goods. Another avid data-miner is Harrah’s, the casino chain. As Michael Lewis made famous in Moneyball, his book about management by numbers in baseball, the conventional wisdom within an industry about what drives performance can often be off the mark. In the casino world, many assume that glitzy facilities, free steak dinners, and free hotel rooms are key attractors, especially for the “high rollers” that casinos think they want to cultivate. Harrah’s, by contrast, embarked on an effort in the late 1990s to mine actual data about its customers in order to determine what would draw more of them in more of the time.
5 The company already had a frequent visitors’
program, through which thousands of customers were routinely swiping their membership cards at Harrah’s properties, thereby generating reams of data about everything they were doing. Every time a customer plays a game, checks into a hotel room, or has a meal at a Harrah’s property, she or a casino employee swipes her card through a card-reading machine. Harrah’s thus gains a record of what the customer is doing or buying, at which property, at what time of day, during what part of the year. It can “follow” the customer over the course of a visit, or across visits, to amass information about patterns of spending, gaming, and eating. And through the membership sign-up process, it knows other information about the customer: where she lives, for example, as well as other data she may have provided, like her income range or her interests. Harrah’s aggregates all of this information in a central database, which analysts can then use to discover patterns and correlations that give Harrah’s important insights. By supplementing the card-swipe stream with survey and focus group data, Harrah’s was able to learn a great deal. About a quarter of its customers were responsible for 82 percent of the company’s revenue, but these generally were not the stereotypical “high rollers.” Instead, they tended to be middle class retirees, people with some disposable income but also time to spend gambling. Most stopped by casinos near their own homes for a few hours; they weren’t
flung sources in order to make better decisions, but the networked world has made the process immensely easier and, in some cases, automatic. When we buy a bottle of salad dressing at the grocery store, the cashier’s act of checking us out instantly shares information about the purchase, which can then be used in short-term ways: to notify the stockroom when salad dressing is getting thin on the shelves, or to trigger the next shipment of salad dressing to your neighborhood store. But the cashier’s act also creates data that can be mined for a variety of longer-term purposes: to inform buying strategies by the chain, for example, or (to the chagrin of some consumers) to increase understanding of our own buying habits, which can in turn suggest different ways of marketing, packaging, and otherwise encouraging us to spend more at the store over time. Without an electronic network that shares data instantly and high-powered computers to process them, this kind of mining wouldn’t be impossible, but it would be sufficiently cumbersome that it would only happen rarely. Now, it can happen more or less constantly. The other way networking has facilitated data-mining is by making it possible for consumers to buy products and engage in other activities on the internet, which in turn enables owners of websites to observe what people do when they are shopping for products, looking for information, seeking a mate, or carrying out any of the innumerable list of activities that we now engage in at our computers. As we click, we leave “click-trails” which become part of the data mountain, data that can be mined by whoever can see the trail. It is useful to think of two different ways that organizations are able to dig into to the piles of information they are accumulating.
3 One is after-the-fact
data-mining: taking the reams of information an organization generates and analyzing it to discern patterns and correlations. When a hurricane is barreling toward a town, what kinds of products should Wal-Mart stock more heavily in anticipation? Some guesses are obvious, like batteries and flashlights, but Wal-Mart’s data-mining systems made it possible for the retailing giant to know for sure as it prepared for Hurricane Frances in 2004. At that time, some experts estimated that Wal-Mart’s data warehouse held more than twice as much data as the entire internet.
4 By analyzing patterns from prior hurricanes, Wal-Mart
was able to determine that batteries and flashlights weren’t the only items customers would want to stockpile. Pop-Tarts were also high on the list, and at the very top was beer. The hurricane analysis is just one example of how Wal-Mart puts its massive data warehouse to work. The company uses the constant stream of information
A Byte at the Apple
224 225
Cutting-Edge Strategies from Other Sectors
displays that make it easier for precinct commanders and top brass to see trouble spots. The data can be analyzed to identify trends and correlations, such as what time of day different crimes are most likely to occur. Top brass can use comparative information to hold precinct commanders accountable for crime in their jurisdiction, as New York and other cities now do through weekly Compstat meetings. And by looking city-wide, officials can make more informed decisions about how to allocate resources, such as New York City’s massive increase of funding and staff for narcotics enforcement. After-the-fact data-mining yields a lot of valuable information for organizations, but it has limits. Organizations often want answers to “what if” questions — if we tried this marketing approach or that one, which one would work better? While it’s possible to look at after-the-fact data for answers (as in the credit card case), the best method for answering “what if” questions is the technique known as “randomized experimental design.” In this method, some subjects are randomly assigned to a “treatment” group that receives some kind of intervention — a new medicine, or a new form of advertising. Other subjects, in the “control” group, do not get the intervention. Researchers can then track each group’s outcomes: their health gets better or worse, they buy more or less. Since people were randomly assigned to one group or the other, if the two groups’ outcomes are different, it must be due to the fact that the treatment group received the treatment, and the control group did not. The advent of the internet has made it possible for companies to use randomization like this to conduct a constant stream of experiments on the users of their websites at a very low cost, and in a way that is very unobtrusive from the users’ point of view. They can then use the results of these experiments to change their products, services, and user interface in ways that yield more sales (or whatever behavior they want to induce). As Babson College technology professors Bala Iyer and Thomas H. Davenport put it, “It’s relatively easy to perform randomized experiments on the Internet: Simply offer multiple versions of a page design, an ad, or a word choice.”
6
If we visit an Amazon.com page for a particular book, for example, we will almost certainly see a small picture of the book’s cover. But this hasn’t always been true on Amazon: in the early days, Amazon faced an enormous task if it was going to scan in or otherwise acquire digital images of literally millions of book covers. To make that kind of investment, Amazon had to believe doing so would be worth it. They used randomization to find out. When visitors came
making big trips to far away destinations. Slot machines were their top activity. And they weren’t all that loyal to Harrah’s: they spent only 36 percent of the gambling dollars on average in the company’s casinos. These results, and others like them, dramatically changed Harrah’s strategies. To encourage members to spend more of their money at Harrah’s, they created a tiered membership system based on spending, with very visible differential benefits for higher-tier members, such as shorter waiting lines. They revamped the incentives that they offered customers, shifting the focus from hotel stays and meals (not highly valued by most of their top customers) to free chips for slot machines (highly valued). Realizing the centrality of slot machines, they invested heavily in figuring out how to increase slot revenue. As data-mining has spread, so has the use of sophisticated techniques of statistical analysis to get the most value from the data. One example comes from the bane of all of our mailboxes: the seemingly never-ending flood of credit card offers. Though it may seem that credit card companies just send every offer to every address, in fact they try to make rational decisions about which mailings are worth sending to which customers. In its basic form, this kind of decision making relies on “regression analysis” — determining how influential a range of variables (age, zip code, occupation, income, previous credit history, and so on) are in individuals’ decisions to accept a given kind of credit card offer. With the results of such a regression analysis, marketers can direct their mailings to people who are statistically more likely to say “yes.” In theory, the result is fewer offer letters in recycling bins. They can also use this kind of analysis to figure out what kinds of marketing approaches work best with different kinds of customers, examining everything from what color envelopes are used to how sales pitches are worded. The result is an increasing ability to target specific customers in ways likely to get results. Data-mining strategies like these are not limited to the for-profit sector. Urban police forces around the country, for example, have in the last decade adopted versions of the Compstat data system that many believe played a central role in New York City’s dramatic reduction in crime rates. In a Compstat-style system, the data generated by daily police activity are immediately logged into a computer-based system: every arrest, but also every call from a citizen reporting a crime, every complaint, every ticket, every report filed by an officer, and so on. The resulting data can be mapped by location, resulting in vivid
A Byte at the Apple
226 227
Cutting-Edge Strategies from Other Sectors
that inform practice. They are not just looking at the equivalent of end-of-year test scores over the summer and using that one snapshot as the basis for their planning and decision making. Though public schools are clearly different in many ways from organizations like Wal-Mart, Harrah’s, and Amazon.com, they do have exactly the same sort of ongoing stream of experiences that could potentially be fodder for data-mining. Every day, teachers explain concepts to students using a variety of different techniques. Students answer questions, fill out worksheets, work problems on the whiteboard, read aloud, work with manipulatives, play educational games, and so on. Teachers respond to student effort in verbal, written, and other ways. Students interact with each other as they engage in learning. Collectively, across all public schools in the U.S., this activity amounts to billions of data points that could, in theory, be mined to answer vital questions of practice. Individual teachers may learn from their own repeated experience when they notice patterns in how students respond to their instructional techniques. But this kind of learning is inherently limited in two ways. First, a teacher’s own learning is potentially biased because of the idiosyncrasies of her specific students and because of random chance. She may think that technique X works, but in fact it may just have appeared to work in a few instances that really should not be generalized. Second, even accurate learning by individual teachers remains largely unshared with others, especially on a large scale. There may be ways to foster more large-scale sharing like this — a topic discussed in the next section. But it would be vastly more efficient and valuable if somehow all of this experience could be “mined” in the way that the organizations above are mining their data piles. The obvious problem is that unlike Amazon’s customers, who leave click-trails behind them, or Wal-Mart shoppers, who at least have to record their purchases with the cashier before they leave the store, public education has no ready way to capture most of these data. They exist only in the fleeting interactions that go on within the walls of schools. And somehow trying to capture these interactions from outside the stream, through third-party observation or teacher logs or the like, would be ridiculously costly. The beauty of the Wal-Mart, Amazon, and Harrah’s systems is that they collect data in the natural course of activity, rather than as some kind of costly, add-on task that requires enormous ongoing effort. Rather than throw up our hands at this point, it seems worthwhile to ask the question: what changes in K-12 would make it possible to capture
to some books’ pages, they were randomly offered a thumbnail picture of the book’s cover, or not. Amazon could then track subsequent purchase behavior of cover viewers and non-cover viewers. As it turns out, people are more likely to buy when they see a cover, and so now covers are ubiquitous on Amazon. The same process helped Amazon make countless other decisions, such as the move to encourage publishers to let surfers “search inside” of books and view excerpted content. Many other companies have used randomization as well. “Every day,” say Iyer and Davenport, “Google does thousands of experiments for their own benefit.” Google even allows the customers of its web-advertising service to run their own experiments, testing which ads and search terms yield the best results.
7 Another heavy user of web experiments is the credit card and financial
services purveyor Capital One, which runs thousands of experiments annually related to new products, web layouts, and any number of other variables, discarding 99 percent of what they try based on poor response, but benefiting greatly from the 1 percent that succeed.
8 Randomization is even possible in
non-internet settings. When Harrah’s launched a campaign to woo back former customers to its casinos, it wasn’t sure which offers or incentives would work best. So its telemarketers randomly made different offers (a steak dinner, free casino chips, hotel stays) and recorded the results, which fed into Harrah’s revamped customer loyalty program described above. What kind of expanded role could data-mining play in K-12 education? Of course, analytic techniques such as regression and randomization are already well-known in K-12, with researchers all over the world running regression analyses on available data sets and a heightened interest at the federal level in recent years in randomized experimental design as the “gold standard” of casual research. What’s different about the efforts in other sectors described above is their ongoing nature within the lives of the organizations that use them. Amazon’s random “study” of the use of book covers was not a multi-year academic study that went through peer review before landing in a scholarly journal. Rather, it was a research activity undertaken by Amazon in the course of doing business, an activity that is repeated over and over to answer different questions. The same goes for the regression-based data-mining efforts: the organizations making the most of them have institutionalized systems in which, as more data come in, the organizations continuously apply an evolving set of analytical techniques in order to generate an ongoing stream of insights
A Byte at the Apple
228 229
Cutting-Edge Strategies from Other Sectors
even be used to conduct the kind of randomization experiments Amazon and Capital One use. A handheld could prompt a teacher randomly to try one or another method of explaining some material, and then capture the results of a quick assessment to see what students had learned. Across thousands of similar experiments, analysts could see which approaches generated better results, and feed that information back to teachers through their handhelds as well. A second, related idea is to make much better use — from a data-generating point of view — of all of the time that students now spend in front of computers for educational purposes. Computers are nearly ubiquitous now in U.S. schools, with 95 percent of fourth graders having school-based access to computers. Schools average about one computer for every 3.8 students. In addition, the prevalence of online coursework (through entire virtual schools, or through one-off online courses) has increased dramatically. Half of the nation’s states have established a virtual school.
9 And according to the North American
Council for Online Learning, U.S. students enrolled in about 1 million online courses in 2007 – 08.
10 Clayton Christensen and Michael Horn project that
by 2013, 10 percent of all courses will be computer-based, with the percentage reaching 50 percent by 2019.
11
Though scholars have debated the instructional value of these machines and courses, here the question is different: whether they can be harnessed as a data-generating engine for K-12 education. As with customers on Amazon, students sitting at these terminals working through computer-based instructional modules generate click-trails. They select activities, give answers, and respond to feedback. They sit and think (and don’t click), or they forge ahead quickly. They learn from their mistakes (or don’t). All of this activity could, in theory, be captured and analyzed in the same way that Amazon and Google capture and analyze data about what their customers are doing online. These interactions also hold the most obvious opportunities for randomization. As noted above, the country has seen increased interest in randomized experimental design in recent years, but gold standard randomization studies are very expensive and time-consuming. Even at the accelerated rate we now see, it is unlikely that such studies will address more than a tiny fraction of all the problems of practice educators face daily. Randomization on students’ computers, by contrast, could yield insights much more quickly on a wide array of problems, such as the best ways to present different kinds of material, the best ways to present it to students with different learning approaches, the best
more of this daily activity data? Here are two ideas worth exploring. First, a dramatic expansion of handheld devices by both teachers and students could capture and share much of the daily-experience information that currently evaporates into the ether. A company called Wireless Generation, for example, has pioneered the use of handhelds by teachers to administer live reading assessments, with the results instantly uploaded and available for analysis by the teacher, his peers, the school principal, and potentially, higher-ups. In a more conventional setting, a teacher might administer a set of questions to a student and record the student’s response on paper. Later, the teacher or some other person would have to go back and grade the test, going answer-by-answer and marking each right or wrong. Only after this grading process was complete would the teacher have the student’s results. And to conduct any kind of analysis of how a student is progressing over time, or what kinds of patterns are emerging across a class or grade level, someone would need to enter the results manually into a computer, and then manually generate reports. With the handheld system, the device guides the teacher through the live assessment, telling her what to ask when and keeping time if the test has time limits. As soon as the assessment is done, the device can “grade” the test and show the teacher the results. And when connected to a computer, the handheld automatically transfers the data to the network, making it available to the teacher, administrators, and potentially parents. With the growing prevalence of wireless networks, even this transfer step will become automatic: a student’s completion of an assessment will immediately register her results in the larger system. Pre-established reports make it easy to look at individuals’ progress over time or patterns across classrooms or grade levels. Increasingly, the system can also give teachers ideas for activities that can be used to remedy specific challenges revealed by the data. The potential for expanded use of this basic platform is significant. If teachers and students used handheld devices to record more and more of their interactions, the amount of information captured would be richer. And if the data from these devices could be aggregated at higher and higher levels (with appropriate safeguards for student and teacher privacy), the sort of data-mining described above could become much more common and valuable. Instead of just running regressions based on year-old, end-of-grade test data, analysts would have a rich array of real-time data at their fingertips. The devices could
A Byte at the Apple
230 231
Cutting-Edge Strategies from Other Sectors
insights. Also enabled by the networking revolution are technologies that tap into what author James Suroweicki called “the wisdom of crowds” in the title of his best-selling book. The idea behind the wisdom of crowds is that the collective knowledge of large numbers of people is often more accurate or “wise” than the analysis of a single expert. For example, when retailer Best Buy asked experts to forecast its gift card sales for February 2005, the experts’ estimate was 95 percent accurate. When they emailed hundreds of employees the same question and averaged the 190 responses that came in, the “crowd” estimate was 99.5 percent accurate.
12 It’s not that most of the 190 responders, as individuals, were
smarter than the experts. It’s that the collective information of the 190, which incorporated the many perspectives that individuals throughout a complex organization had on the question, added up to a smarter average than what the experts could generate. The expansion of electronic networks has enabled people to tap into the wisdom of crowds in several ways. One way is by facilitating actual collective work among far-flung people. A common expression of this approach is the “wiki,” which is basically a website that users can edit. The most famous wiki, Wikipedia, has created an enormous encyclopedia from user submissions, which are modified over time by users who visit the entries. Complex software packages, even entire computer operating systems, are now routinely being written through “open source” programming, in which far-flung, voluntary networks of programmers contribute “code” to a larger software development effort, the results of which are freely available for users to see, and improve upon further.
13
While these applications are interesting, more relevant to this paper are efforts to tap crowd-wisdom to generate “data,” which can then be analyzed and used. Two developments in particular are worth exploring. One is a crowd-oriented version of the data-mining described above. Whenever we view or buy an item on Amazon.com, Amazon takes note. Since Amazon tracks this over time, and over millions of visitors, its data systems capture patterns of viewing and buying that Amazon then shares with users in various ways on the site. For example, it displays a list of other items that were viewed or bought by others who viewed or bought the items we are considering. It offers customized “recommendations,” again based on what other users who appear to have similar preferences have bought. It sends emails to us letting us know about releases of books that are linked in this way to our apparent interests. And of course, Amazon is just one of many examples of this kind of system.
ways to respond to students when they don’t understand a concept or face some barrier, the best ways to motivate children to take on challenging work, and so on. If thousands of children were having repeated interactions with such a system, with data on their experiences, behavior, and outcomes rolled up into a central warehouse, we could learn much faster what works best, and what works best with different children. And the learning could be much more dynamic and continuously improved, versus the current cycle of spending years developing approach X, and then years testing it, and then years disseminating it. Techniques that proved effective with a certain type of student would automatically be used more frequently with that kind of student going forward. Admittedly, our nation’s schools are a long way from being able to harness this kind of data. Though computer use in schools has become much more prevalent, it is greatly fragmented. In contrast to Amazon.com, which is a single organization that can observe its customers’ actions within a unified platform, decisions about what kinds of educational software to use are made by individual school districts, schools, teachers, and even students. Though millions of school children may be sitting in front of computers at any one time, they are by no means all creating similar or comparable click-trails that are ready for analysis. To overcome this challenge, a major effort would be required on one or both of two fronts: creating incentives for educators and students to use platforms that are set up to feed data into an analytical engine like the one envisioned here (and thus making click-trails less fragmented); or developing mechanisms by which click-trail data from these now diverse sources can be aggregated and analyzed despite their different origins. Either would require substantial investment and innovation. As this last point demonstrates, it would be an understatement to say that implementing these ideas would require overcoming significant technical hurdles, as well as cultural obstacles. The paper will return to these hurdles in the concluding section. For now, the important point is that K-12 education is currently letting a great deal of valuable information slip through its hands. Substantial hurdles notwithstanding, it’s worth applying the nation’s considerable technical and entrepreneurial talent to letting less of it slip away.
Trend #2: Tapping the “Wisdom of Crowds “
Trend #1 is still hierarchical in nature — some kind of central intelligence is monitoring behavior, generating experiments, and then crunching data to glean
A Byte at the Apple
232 233
Cutting-Edge Strategies from Other Sectors
night. With crowd wisdom, in theory it is possible to focus on reviews of others who have similar tastes (i.e., those who like other restaurants that you like) or who are seeking similar features (e.g., kid-friendliness, a romantic atmosphere). And by aggregating over dozens or even hundreds of meals, the collection of ratings has less chance of being skewed by particularly good or bad experiences that are not the norm. A second example of crowd wisdom tapped by technology is the emergence of “prediction markets.” Think back to the Best Buy sales forecasting example above, in which employees in the aggregate did a much better job than experts of projecting holiday card sales. In that example, employees had no real reason to give their best estimates; they had no stake in the outcome. They also had no wide scale way of getting cues from each other about whether their estimates were high or low: they just emailed them in and were done with it. Prediction markets seek to improve on crowd-based forecasting by giving predictors an incentive to predict well. The resulting market “prices” provide useful information that predictors can use over time to make better predictions. Most people are already familiar with some existing prediction markets. Stock markets, for example, serve the purpose of raising and allocating capital for companies, but in the process, all the buying and selling reveal information about how highly the market values different companies. Another example is betting at the horse track — before a race, the shifting odds on different horses represent the collective judgment of all the bettors about each horse’s probability of winning. Less familiar are efforts to create prediction markets to serve some organizational or social purpose. One set of examples of such prediction markets resides at the Iowa Electronic Markets (IEM), a project of the University of Iowa’s College of Business.
14 IEM has established a handful of prediction
markets, including several related to upcoming presidential elections. As of this writing, for example, IEM was running a market designed to predict the outcome of the 2008 general election. Users could buy securities that would pay $1.00 times the percentage of the vote a given party receives in November 2008. So if you were holding a Democratic Party security and the Democratic candidate won 49 percent of the two-party vote on Election Day, you would receive 49 cents. On April 24, 2008, Democratic shares closed at 53.3 cents, versus 47.6 cents for Republican shares. In markets like this, the price of a party’s shares can be interpreted as the market’s estimate of the vote-share
Most online retailers have some version of the Amazon method. Most news and information sites, from The New York Times to the Fordham Institute’s Education Gadfly, supply users with lists of “most e-mailed articles.” Google’s underlying method for ranking a webpage is based in large part on how many links to that page come from other pages (especially pages that are themselves highly ranked). The “crowd” in this case is all the people who have created other webpages. What’s important about these systems is that all of these suggestions and recommendations and rankings are not manufactured by some expert who has analyzed the data and come to these conclusions. Instead, they are generated by the behavior (and one hopes, the wisdom) of the crowd. The examples in the previous paragraph happen behind the scenes, in the sense that users are not necessarily aware that they are contributing to the collective wisdom as they peruse and buy items on Amazon.com, or look for DVDs to rent on Netflix, or share Gadfly tidbits with their colleagues. Like honeybees going after nectar and inadvertently spreading pollen, users going about their own shopping and information-seeking are contributing to crowd wisdom unintentionally. In other cases, sites ask users to contribute explicitly. Amazon users can rate items on a star system and write reviews that other users can read; average star ratings feature prominently in each item’s display. eBay encourages buyers and sellers to provide feedback on each other’s behavior in a transaction. Zagat elicits consumers’ reviews of restaurants, hotels, and attractions as a supplement to its own expert ratings. Digg.com provides a way for Internet users to indicate that they “digg” certain online news stories, and then assembles its own news site based on what these users are telling them through their clicks. Tripadvisor.com invites users to rate hotels and attractions, and then displays those rating for other travelers. Over 15 million reviews now populate the site. Crowd wisdom, like in these examples, has important potential advantages, especially when there is a strong subjective component to the information users are seeking. In the case of a restaurant, for example, one might be interested in the opinion of the one reviewer that the New York Times sends to file a report. But that reviewer inevitably has particular tastes, which may differ from yours. She may be on the lookout for certain features of the dining experience that may be more or less important to you. And she will have had one particular experience that may or may not be a good indicator of what diners can generally expect: one particular set of appetizers, entrees and desserts on one particular
A Byte at the Apple
234 235
Cutting-Edge Strategies from Other Sectors
rating and gives space for a 10-150 word narrative comment. Each school’s page then shows the average parent rating alongside GreatSchools’ own rating, with a link to the narrative comments.
17 The Savvy Source seeks to provide a similar
service for parents interested in preschools, inviting parents to fill out a survey on a given preschool that includes the ubiquitous five star rating as well as a series of other questions.
18
Some nascent websites even aim to bring students’ perceptions into the mix. RateMyTeachers.com enables students and their parents to rate K-12 teachers on “easiness,” “helpfulness” and “clarity.” As of June 2008, this site contains 10 million reviews of 1.5 million teachers nationwide. RateMyProfessors.com offers the same for higher education, claiming 6 million reviews of a million professors at 6,000 colleges and universities. Another potential use is to help teachers in their ongoing quest for useful lesson plans, instructional materials, and advice in general about how to address problems of practice. There are few if any tasks that Ms. Jones in a Dayton elementary school encounters that haven’t been encountered hundreds or thousands of times by other similarly situated teachers. What teachers don’t have is any way of seeing how their peers have dealt with these common tasks and, vitally, any way of knowing which of the strategies their peers have tried have actually been effective. In theory, this could be enabled by the technology that is now on most teachers’ desks. Indeed, the internet is already replete with websites that offer material for teachers, but there are few mechanisms (aside from general purpose search engines like Google) to help educators separate the wheat from the chaff — which is the real potential value of the wisdom of crowds. If a critical mass of teachers began using the internet for this purpose, it is possible to imagine the collective wisdom being mobilized to help educators. If it were easy for teachers to rate the resources they find online, either explicitly (assigning a one to five star rating, posting a comment) or implicitly (revealing their preferences as lesson plans or student materials are clicked on), teachers would at least have a window into which resources were most popular. If services used Amazon-style matching technology to discern users’ own “shopping” patterns over time, the “advice” users received could become even more powerful. It would generate a whole new form of data about the perceived quality and value of different instructional approaches and resources, data amassed from the opinions expressed by individual users.
it will win. This kind of prediction market has proven remarkably accurate when compared to the other primary method for predicting election outcomes: stratified random polls. According to one study of 12 years of elections markets, the average market missed the true vote share by 1.49 to 1.55 percentage points, compared to an average of 1.93 points for polls in the same elections.
15
Some organizations have started using prediction markets internally, such as Google. At the time of a McKinsey roundtable discussion published in April 2008, Google had used prediction markets to elicit forecasts on 275 questions on subjects ranging from demand for Google’s products (“how many people will use [Google’s email service] Gmail in the next three months?”) to the company’s performance (will a certain project meet a deadline?) to major events in the industry (such as mergers and acquisitions of other companies).
16
One value of this kind of prediction market — as well as “real” markets such as stock exchanges — is that their existence creates an incentive for predictors and traders to find information that helps them make good predictions and trades, which in turn creates incentives for others to amass and provide helpful information to them. Witness the profusion of websites, newsletters, books, television talk shows, and other sources of information about stocks. Investors stand to gain from being well-informed; information providers stand to gain, through advertising or subscription revenue, from providing data and insights that investors value. So while the markets themselves provide one form of data (stock prices, predictions about outcomes of elections and other real-world events), they also stimulate the creation and dissemination of other forms of data. This secondary data-eliciting effect is arguably the most powerful information-generating aspect of trading markets. Do these wisdom of crowds trends have any potential value in K-12 education? The most obvious fit is the first set of examples discussed above, in which website visitors rate products (implicitly or explicitly), and those ratings are then shared with other visitors. Numerous potential uses of this technology come to mind in the education setting. One where there is already considerable action is in websites designed to help parents evaluate and choose schools. GreatSchools.net, for example, provides detailed information about schools, from street address and phone number to demographics to test results. Increasingly, it has sought to supplement this top-down data with bottom-up parent ratings and comments. From a prominent spot on any school’s page, users can click “Rate it!” — calling up a window that asks for a one to five star
A Byte at the Apple
236 237
Cutting-Edge Strategies from Other Sectors
can also see the site’s own rating of the school (expert assessment) and direct information about the school’s performance on state tests (objective data). Exacerbating the quality question is another serious challenge all of these efforts face: getting sufficient volume of users to make them work in the ways described above. The wisdom of crowds requires, yes, a crowd, and these sites have generally struggled to attract them. GreatSchools.net’s parent ratings area for this author’s children’s elementary school, for example, had just nine parent ratings in April 2008, several of which provided mostly vague praise. Parents considering the school would learn little of value from these ratings. RateMyTeachers.com reviewed only one of the school’s teachers. The teacher sites as well tend to lack critical mass. The most viewed video on TeacherTube as of April 2008 had been watched over 500,000 times, but the numbers ramp down precipitously: the 101st most watched had only about 12,000 views, the 501st about 4,000. Low numbers create a vicious cycle: with few users’ wisdom being tapped, the sites can’t dispense much in the way of crowd wisdom; but without crowd wisdom, it is difficult for them to become the kind of go-to resources that attract large numbers of reviewers. Is this cycle reversible? It seems too early to say. With brand heavyweights like Yahoo! entering the fray, presumably with some marketing budget behind it, it seems plausible that uptake could increase. Another encouraging development is that in other sectors, an early finding of analyses of such crowd-wisdom efforts is that they can work well even if just a small but highly motivated and capable corps of people take part. Not every teacher has to post and rate videos for a video-sharing site to be useful. In fact, a McKinsey study of video sharing found that just 3-6 percent of users posted 75 percent of the content, and less than 2 percent posted more than half.
21 A deliberate
effort to recruit and cultivate power users could yield dividends. It may also be possible to create incentives for people to share through these mechanisms, perhaps by making sharing the “price of admission” to something of value. For example, to gain access to premium content, users might first be asked to rate some number of items listed on the site, or to share some number of lesson plans. Other incentives are promising as well. While it’s easy to poke fun at RateMyProfessors.com’s “hotness” ratings, for example, adding this kind of element to such a site will arguably draw more “eyeballs,” at least some of which will result in serious reviews. Finally, while the idea of nationwide parent and teacher crowd networks is appealing, smaller, more focused networks (e.g., for
Nascent efforts are underway on this idea as well. Yahoo! is set to release Yahoo! Teachers at some point in 2008. Teachers will be able to share lesson plans and projects, which other teachers can then search and pull into their own online “portfolios.” As of this writing, Yahoo! Teachers did not contain much information about how crowd wisdom would be mobilized to help users tell wheat from chaff.
19 By contrast, TeacherTube, launched in March
2007, utilizes many of the crowd-wisdom techniques described above. This service allows teachers to upload videos to the web, either to demonstrate how they carry out instruction on a certain topic, or to post educational videos designed for students. The more popular videos rise to the top. Users can also rate videos, though the usual five stars are replaced by what looks like a cross between an apple and an old-fashioned TV set with rabbit ears. Users can “tag” videos — label them by subject or other keywords, which enables others to find relevant videos more easily. Beyond these parent, student, and teacher examples, there are many other potential ways crowd ratings could be used to point K-12 actors in the right direction. Teachers could rate the education schools and licensing programs they attended to become teachers, or even specific courses or instructors. They could rate the professional development offerings in which they engage. The same goes for school leaders, whose wisdom could be enlisted on administrator preparation programs or summer leadership institutes. Teachers and principals could rate their schools and districts on metrics related to what it is like to work there. And so on. One challenge with crowd-driven rating systems is that by their nature they tend to emphasize popularity, which may or may not be a good proxy for quality when it comes to something like a school, a teacher, or an instructional approach. RateMyProfessors.com, for example, has been challenged by a Central Michigan University analysis showing that professors whose courses are easier or who are rated as better looking rise to the top of the website’s rankings.
20
Though another study showed that the site’s ratings are highly correlated with the results of a widely used student evaluation system that includes more quality controls, questions persist about the value of RateMyProfessors, at least for students who are looking for high-quality instructors rather than attractive ones. The most promising approaches to tapping crowd wisdom, therefore, may involve combining crowd judgments with expert assessments and objective data. On GreatSchools.net, for example, a parent can read peer reviews, but

A Byte at the Apple
238 239
Cutting-Edge Strategies from Other Sectors
What if more explicit prediction markets existed for long- and short-term outcome measures for individual schools and districts, such as graduation rates, test scores, and growth in test scores? “Investors” could buy and sell securities related to these measures, which would then pay off at some future time based on the outcome. For example, suppose a state calculated a test-score-growth index for every school each year that ranged between zero and one. Securities could be created for each school that paid $1 times the school’s growth index. The market price for the security would represent investors’ collective prediction about the school’s test score growth for the year. As noted above, the potential power of such a market would not be the predictions themselves. Instead, the hope would be that the existence of the markets would lead “investors” to seek out good information to help them understand schools’ growth potential. That search would in turn lead others to provide information that investors valued. There would be no telling in advance what this information would look like: information-providers might survey parents, or conduct school visits to produce ratings, or analyze previous test score data more finely, or ask experts to rate schools, or develop new ways to rate schools that this paper can’t envision. And that, in fact, would be the chief reason to have the market in the first place: to create an engine for better forms of data about school effectiveness. What would be the value of data like these? Parents choosing schools (or considering whether to stay put) could use them to make better decisions. Teachers could use them to decide where to seek employment. As noted above, district and state leaders could make better decisions about where to place scarce resources for school intervention — both financial resources and “human capital” such as turnaround leaders or teachers. Researchers could use the new measures to identify schools that are likely to be performance outliers, and then start observing those schools’ practices earlier rather than later. In general, “leading indicators” would provide a range of decision makers with much better predictions about the future, which would enable them to make better decisions. The notion is admittedly far-fetched, and replete with potential problems. The largest, as with other wisdom-of-crowds ideas, is how to generate enough volume of trading to make a market function. Volume is essential not only to make trading possible, but also to create incentives for information providers to come forward with their offerings. They need eyeballs on their information
teachers implementing certain instructional models) may have more chance of reversing the vicious cycle. One of the problems with the broad-gauged teacher sites, for example, is that the wheat-from-chaff problem is compounded by the fact that for a given teacher, 99 percent of the content is irrelevant: it’s the wrong subject, the wrong grade level, the wrong instructional approach, etc. As for prediction markets, prediction for the sake of forecasting is not the most compelling application. There could be some quantities worth using prediction markets to estimate, such as enrollment trends, but the more interesting question is whether the prediction market structure could be used to generate more robust information about the quality of districts, schools, and teachers than we receive from current measures. Our current measures of quality are, in fact, very weak. Mostly what we have is school and district student achievement data that represent a snapshot at a point in time. Even if longitudinal data continue to advance and “value-added” measures of school and teacher effectiveness become more widespread, these are still fairly narrow measures of quality, even if they are important slices. In addition to narrowness, all of these measures are inherently backward-looking, lagging indicators of performance. They provide little insight about how a school is likely to do next semester, next year, or in three years. Prediction markets, by contrast, encourage analysts to look to the future. Forward-looking indicators are important for parents, who want to know how a school is likely to do in the near term. They could also be valuable to districts and states with have limited resources to apply to school interventions; any indicators that helped them distinguish between schools on track to get better and schools more likely to languish could be valuable. A prediction market of sorts related to school quality already exists via the market for homes. Economists and families alike have long known that home prices reflect in part the perceived quality of local public schools. Home shoppers with school-aged children are willing to pay more, all else equal, for a house in a better school district. This market, however, is of limited value as a source of useful data about schools and school quality. While home buyers may know that home prices reflect perceived school quality, the information they can obtain from home prices is very blunt and general. They can glean a broad sense that district X is preferred to district Y, but not more detailed and useful information about specific schools, or how their own children are likely to fare.
A Byte at the Apple
240 241
Cutting-Edge Strategies from Other Sectors
markets like this might work in K-12, what problems emerge, and what kinds of valuable data and information they begin to elicit.
Discussion
In education circles, data-driven instruction is the subject of innumerable papers and professional development workshops. It is the mantra of most every school principal and district superintendent. If anyone in a discussion of K-12 improvement suggests that more and better use of data is vital, everyone will nod and murmur their assent. So why is it that K-12 data systems ignore the kinds of opportunities sketched above? Of course, the first culprit is lack of funding. Companies like Amazon and Wal-Mart invest huge sums in developing the kinds of systems described in this paper. They do so because they expect even more enormous profits to flow as a result of these investments. In public education, as in all public sector activities, it is clearly more difficult to make that kind of investment, because even socially valuable investments will not necessarily generate the financial return needed to pay for the investment in the first place. It is likely that higher levels of government, such as state and federal agencies, will need to be the source of investment capital for these developments. Schools and all but the largest districts are unlikely to be able to bankroll the kinds of investments needed to build and scale the kinds of systems needed to conduct data-mining and wisdom-of-crowds applications. But funding is only part of what’s needed. A related missing piece is the intense drive that the leading data-using organizations described in this paper have to find new ways to exploit and use data. Netflix, for example, is engaged in an all-out war against Blockbuster for market share, not to mention the rapidly growing sector of video-on-demand providers who can deliver movies even more quickly than they arrive in Netflix’s famous red envelopes. Netflix must distinguish itself or be extinguished. As Blockbuster moves to compete and catch up, Netflix has to leapfrog ahead again. And so on. To capitalize on these same opportunities in K-12 education, that same kind of leap-frogging spirit needs to be infused. Already, there are numerous education ventures afoot that have formed to build the kind of data systems K-12 need to succeed, some of them described in this paper. The fact that many of them, such as Greatschools.net, are nonprofits suggests that is not just the profit motive that can generate the drive to leapfrog. But nonprofit or for-profit,
in order to make it worthwhile, either financially or otherwise, to gather and post it. Another challenge relates to “insider trading” — the people in the best position to predict a school’s outcomes are the staff and parents involved in the school. Yet, allowing them to bet on the school’s outcomes raises serious ethical questions. Even if they are not allowed to bet, having them emerge as information providers would also be problematic. One way companies like Google have minimized insider trading problems is by making the financial stakes of the markets fairly low. Successful traders receive some financial rewards, but the biggest payoff is in recognition. But this example highlights the inherent tradeoff: the higher the stakes, the more likely a market is to attract a volume of serious investors and the consequent inflow of information providers. Lower stakes minimize insider trading issues but also make it less likely that the process will have the data-generating effects that are possible with richer markets. Another way prediction markets could work in education is the creation of futures contracts linked to individual teachers or groups of teachers. Suppose, for example, that individual elementary school teachers received contracts that would pay off according to how well their students did on state tests in future years relative to expectations based on their starting points. So if a teacher’s students did better than expected, the teacher’s contract would be worth more. In this basic form, the system would just be a form of performance-based pay, without any relevance to the question of data in education. But what if teachers could sell their contracts to investors? A market would form in which the price of each teacher’s contract would reflect investors’ collective estimate of the teacher’s effectiveness. As with the example above, the hope would be that the existence of such a market would spur the creation of information flows to help investors rate teachers and make good trades. This information would be forward-looking, aiming to educate investors about likely future success rates of teachers. That kind of information could be enormously valuable to administrators, teacher developers, and ultimately teachers themselves as they plan for professional growth and make staffing decisions over time. The idea of using prediction markets to elicit better data and information about schools and teachers needs a lot more development. Perhaps the best way to accomplish that would be through pilot projects, in which philanthropists prime the pump of prediction markets in order to get trading and information flowing. Once they are underway, it would be possible to see how prediction
A Byte at the Apple
242 243
Cutting-Edge Strategies from Other Sectors
Endnotes
The author wishes to thank Public Impact’s Emily Ayscue Hassel for her 1
many insights that informed this paper, especially with regard to the potential
of technology to help teachers diagnose and respond to students’ specific
challenges; Public Impact’s Dana Brinson for invaluable research assistance;
Fordham’s Eric Osberg, Coby Loup, Marci Kanstoroom, and Chester E. Finn Jr.,
for their guidance and helpful comments; and the authors of other chapters in
this volume for their feedback and suggestions.
Suroweicki, James. 2 The Wisdom of Crowds: Why the Many Are Smarter Than
the Few and How Collective Wisdom Shapes Business, Economies, Societies and
Nations. New York: Doubleday, 2004.
Ayres, Ian. 3 Super Crunchers: Why Thinking-by-Numbers Is the New Way to Be
Smart. New York: Bantam, 2007. Davenport, Thomas H. and Jeanne G. Harris.
Competing on Analytics: The New Science of Winning. Cambridge: Harvard
Business Press, 2007.
This and subsequent references to Wal-Mart’s data systems: Hays, 4
Constance L. “What Wal-Mart Knows about Customers’ Habits.” New York
Times, November 14, 2004. http://www.nytimes.com/2004/11/14/business/
yourmoney/14wal.html.
Loveman, Gary. “Diamonds in the Data Mine.” 5 Harvard Business Review,
May 2003.
Iyer, Bala and Thomas H. Davenport. “Reverse Engineering Google’s Innovation 6
Machine.” Harvard Business Review, April 2008.
Iyer, Bala and Thomas H. Davenport. “Reverse Engineering Google’s Innovation 7
Machine.” Harvard Business Review, April 2008.
Davenport, Tom. “Entrepreneurial Execution: The Future of Strategy.” 8 The Next
Big Thing (a Harvard Business Publishing blog), December 11, 2007. http://
discussionleader.hbsp.com/davenport/2007/12/entrepreneurial_execution_
the_1.html; See also Farson, Richard and Ralph Keyes. “The Failure-Tolerant
Leader.” Harvard Business Review, August 2002.
Data table in 9 Technology Counts 2008: STEM, Education Week, 2008.
http://www.edweek.org/media/ew/tc/2008/30trends.h27.pdf
Christensen, Clayton and Michael Horn. “How Do We Transform Our 10
Schools?” Education Next, Summer 2008.
Christensen and Horn.11
the nation needs a much larger and more robust set of organizations out to win the race to create the next great data application for K-12 education. Private philanthropy — and public investment — can usefully be applied to creating and growing this sector. Public policy can play a role as well, primarily by promoting the kinds of accountability policies that create a demand on the part of schools, districts, parents, and others for the kinds of services that these data-oriented organizations might offer. Ultimately, these organizations need “customers” who will pay for their services, either directly through fees, or indirectly by providing the eyeballs that advertisers covet and are thus willing to pay for. By ramping up their insistence that schools and districts report out ever more refined data on their performance, that districts take action when schools are truly languishing, that teachers be evaluated more meaningfully and granted tenure only when deemed effective, that families have options among public schools, policymakers can increase the demand from parents, teachers, school leaders, districts, and others for ever-better sources of data to act on these new imperatives.
A Byte at the Apple
244
Dye, Renée. “The Promise of Prediction Markets: A Roundtable.” 12
The McKinsey Quarterly No. 2, 2008.
For a fascinating overview of open source technology, with an emphasis on how 13
open source projects manager to elicit such wide scale voluntary contributions,
see Weber, Steven. The Success of Open Source. Cambridge: Harvard University
Press, 2004.
Iowa Electronic Markets. 14 http://www.biz.uiowa.edu/iem/
Berg, Joyce, Robert Forsythe, Forrest Nelson and Thomas Rietz. “Results from a 15
Dozen Years of Election Futures Markets Research,” forthcoming in C.A. Plott
and V. Smith (Eds.) Handbook of Experimental Economic Results, 2001. http://
www.biz.uiowa.edu/iem/archive/BFNR_2000.pdf.
Dye, Renée. “The Promise of Prediction Markets: A Roundtable.” 16
The McKinsey Quarterly No. 2, 2008.
“Frequently Asked Questions: Writing a Review of Your Child’s School.” 17
Greatschools.net. http://www.greatschools.net/cgi-bin/static/
guidelines.html/nc/
About Us.” The Savvy Source. 18 http://www.savvysource.com/savvy/jsp/aboutus/
aboutUs.jsp Disclaimer: the author’s organization has provided content for both
GreatSchools.net and The Savvy Source.
Yahoo! Teachers. 19 http://teachers.yahoo.com/
“‘Hotness’ and Quality.” Insidehighered.com, May 8, 2006. 20
http://www.insidehighered.com/news/2006/05/08/rateprof
Bugin, Jacques. “How Companies Can Make the Most of User-Generated 21
Content.” The McKinsey Quarterly, August 2007.
Section III
The Way Forward
248 249
From Building Systems to Using Their Data
From Building Systems to Using Their Data
Aimee Rogstad Guidera
Aimee Rogstad Guidera is director of the Data Quality Campaign
Because good information is critical to both the processes and the outcomes of high-performing education systems, a rising chorus of voices — inside and outside the system — is calling for better education data. But achieving this requires a dual focus:
building the data infrastructure at the federal, state, and local levels, while implementing policy and administrative changes to ensure that these data are accessible, timely, reliable and user-friendly. Policies and practices to support these two actions are necessary to turn data into information that is actually used to improve education performance. Unlike Ray in the film Field of Dreams, we cannot blindly follow the dictum “build it and they will come” and expect a happy ending. The new “fields” of data being built in states and districts change the rules of the game. They redefine what and how information is collected, shared and used. Different skills and increased capacity are required to analyze and use this newly available information. The improving quality of this data also has potential to improve the results of the game. With timely and useful data, educators have valuable new equipment in their quest to improve student achievement. However, without consensus building and strategic planning across systems and stakeholders about what we want to use these data systems for — not just next year, but in the
next decade — our investments are unlikely to fulfill their potential to improve decision making and results in education. Historically, states and districts have collected data for compliance and accountability purposes, but it is time for them to focus on using data for continuous improvement across the systems and for increasing student achievement in particular. We should celebrate the progress states have made in building longitudinal data systems, while also demanding more strategic focus and investments to ensure that the data collected can be turned into knowledge used to improve student and system performance. Part of the challenge is that no one single data system fits all states’ and districts’ political and practical realities. No district or state is starting from scratch, as they all have some sort of existing data collection and reporting system in place, albeit built mainly for compliance purposes. To date, very few data systems have been built for the broader purpose of decision making. Building such a data system — one that meets not only the demands of today, but the potential needs of users in the future — requires political leadership to provide the necessary time, funding, stability and staff. Nearly every chapter in this volume discusses the challenges that impede the development and use of data systems in education. These include the decentralized nature of education governance, siloed organizations within the education sector, a lack of incentives to change current operating procedures, the fear of greater transparency, and a lack of capacity to use this new information. Because data have often been used for accountability purposes and connected with negative consequences, it has not been in the interest of teachers and other education stakeholders to embrace the new data-infused culture. Consequently, we are confronted with the challenge of building a system that will meet the needs of users who often mistrust data, see little value in data use, and are not trained to use data as part of their daily routine. This chapter presents the issues that states and districts should consider as they plan strategically for a new role of data in education. What’s in it for me? This is the central question that the promoters and builders of data systems need to answer for every potential user of the system — from parents and students to teachers and administrators, to governors, chiefs, and legislators. Only when we are able to show key stakeholders in the education system that they can be more effective, efficient and successful in their efforts when they use quality data, will the sustainability and growth of these data systems be secure. Before exploring the key actions states and districts should take to
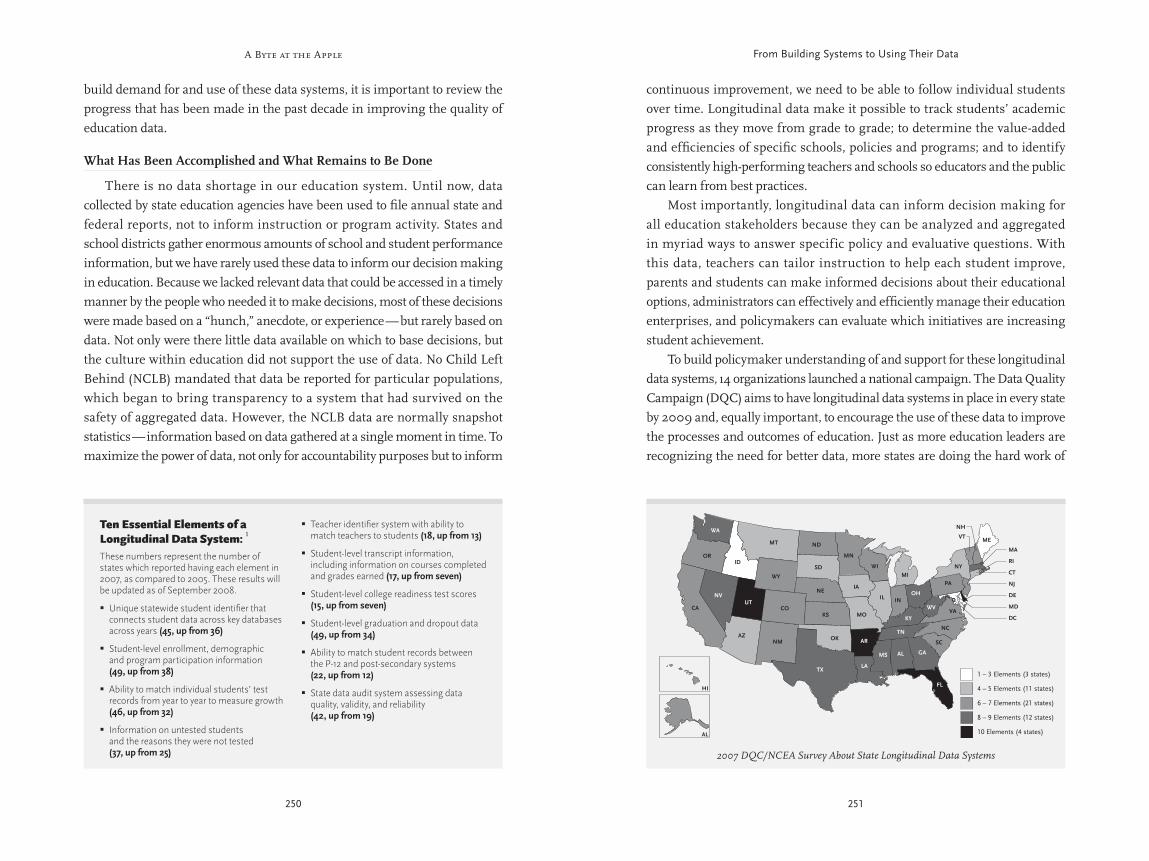
A Byte at the Apple
250 251
From Building Systems to Using Their Data
build demand for and use of these data systems, it is important to review the progress that has been made in the past decade in improving the quality of education data.
What Has Been Accomplished and What Remains to Be Done
There is no data shortage in our education system. Until now, data collected by state education agencies have been used to file annual state and federal reports, not to inform instruction or program activity. States and school districts gather enormous amounts of school and student performance information, but we have rarely used these data to inform our decision making in education. Because we lacked relevant data that could be accessed in a timely manner by the people who needed it to make decisions, most of these decisions were made based on a “hunch,” anecdote, or experience — but rarely based on data. Not only were there little data available on which to base decisions, but the culture within education did not support the use of data. No Child Left Behind (NCLB) mandated that data be reported for particular populations, which began to bring transparency to a system that had survived on the safety of aggregated data. However, the NCLB data are normally snapshot statistics — information based on data gathered at a single moment in time. To maximize the power of data, not only for accountability purposes but to inform
continuous improvement, we need to be able to follow individual students over time. Longitudinal data make it possible to track students’ academic progress as they move from grade to grade; to determine the value-added and efficiencies of specific schools, policies and programs; and to identify consistently high-performing teachers and schools so educators and the public can learn from best practices. Most importantly, longitudinal data can inform decision making for all education stakeholders because they can be analyzed and aggregated in myriad ways to answer specific policy and evaluative questions. With this data, teachers can tailor instruction to help each student improve, parents and students can make informed decisions about their educational options, administrators can effectively and efficiently manage their education enterprises, and policymakers can evaluate which initiatives are increasing student achievement. To build policymaker understanding of and support for these longitudinal data systems, 14 organizations launched a national campaign. The Data Quality Campaign (DQC) aims to have longitudinal data systems in place in every state by 2009 and, equally important, to encourage the use of these data to improve the processes and outcomes of education. Just as more education leaders are recognizing the need for better data, more states are doing the hard work of
Ten Essential Elements of a Longitudinal Data System: 1
These numbers represent the number of states which reported having each element in 2007, as compared to 2005. These results will be updated as of September 2008.
Unique statewide student identifier that �connects student data across key databases across years (45, up from 36)
Student-level enrollment, demographic �and program participation information (49, up from 38)
Ability to match individual students’ test �records from year to year to measure growth (46, up from 32)
Information on untested students �and the reasons they were not tested (37, up from 25)
Teacher identifier system with ability to �match teachers to students (18, up from 13)
Student-level transcript information, �including information on courses completed and grades earned (17, up from seven)
Student-level college readiness test scores �(15, up from seven)
Student-level graduation and dropout data �(49, up from 34)
Ability to match student records between �the P-12 and post-secondary systems (22, up from 12)
State data audit system assessing data �quality, validity, and reliability (42, up from 19)
2007 DQC/NCEA Survey About State Longitudinal Data Systems
1 – 3 Elements (3 states)
4 – 5 Elements (11 states)
6 – 7 Elements (21 states)
8 – 9 Elements (12 states)
10 Elements (4 states)
HI
AL
A Byte at the Apple
252 253
From Building Systems to Using Their Data
Connect data across systems and states;1.
Make data accessible and useful; and2.
Build capacity to use data.3.
Connect Data Across Systems and States
Since the beginning of government programs and funding streams, we have had education data systems. These systems were built for accountability and compliance reporting and were often one-way data dumps to satisfy a requirement (often with no consequences). Rarely did these data systems need to be able to communicate with a data system in another organization because the data were not being used for decision making of any sort. Now that we are entering the era of data-driven decision making, we require data systems that are able to transfer information across geographic and sector boundaries. Our data systems must catch up with the reality that students are being served by multiple agencies, programs and funding streams. Data that can be shared and linked can help ensure that all the individual programs are successful in their specific goals (e.g., Title I to support compensatory education, McKinney-Vento to help ensure homeless students have stable education opportunities, and Trio/Gear-Up to increase students’ chances of going to college) while ensuring that these programs are working to leverage each other, not duplicating efforts. Align K-12 and Postsecondary Data Systems. U.S. schools are increasingly expected to prepare all students with the knowledge and skills they need for postsecondary education and the workplace. Consequently, there is growing interest in better aligning the pre-K, K-12, and postsecondary education systems to ensure all students leave high school “college and career ready.” Critical to this alignment discussion is the need to develop links between K-12 and postsecondary data systems to ensure that these conversations are informed by high-quality data. Although 22 states report they have the ability to link K-12 and postsecondary data systems, previous surveys from Achieve, Inc., and the National Center for Higher Education Management Systems (in 2006 and 2005, respectively) find that only 11 states actually link the data across the sectors, and only ten states regularly report postsecondary data to high schools.
3
Without this two-way data sharing, secondary school systems cannot know whether their students are leaving high school prepared for the demands of postsecondary education, training and work– and why this is the case.
putting into place the DQC’s ten essential elements of a longitudinal data system. (See box for a list of the ten essential elements). While states have made great progress in building their longitudinal data infrastructure since 2005, collecting data is not an end in itself. Data are valuable insofar as they become the means by which policymakers, administrators, parents, teachers and students make informed decisions leading to improved student outcomes. The benefits of using these data are increasingly evident in the states that have invested in their longitudinal data systems. Thirty-four states are now able to identify which schools produce the strongest academic growth in their students, and 36 can calculate an accurate graduation rate — no small achievement given the poor quality of these calculations in the past.
2 Because of the increase in state data capacity,
U.S. Education Secretary Margaret Spellings issued proposed regulatory changes to allow states to use growth models as an alternative means to determine Adequate Yearly Progress and to require all states to use the longitudinal graduation rate by 2014. And yet, we have a long way to go to reap the full benefits of this infrastructure investment. Only six states are able to determine which high school indicators (enrollment in rigorous courses or performance on state tests) are the best predictors of students’ success in college or the workplace; only 19 states can follow high school graduates into higher education and determine which students take remedial courses in college; and just 13 states can identify which teacher preparation programs produce teachers whose students have the strongest academic growth. States and districts continue to build these data systems, but how do we ensure dreams are not dashed by the lack of capacity to use these data? For the most part, education players aren’t well versed in how to use data as part of their routine decision making. We have the technological know-how to build and connect these data systems, but the education culture has yet to embrace using the information produced by these systems to guide decision making at the state or local level. The challenges involve turf battles, ingrained mistrust, lack of funding and political will, inadequate governance, absence of a long-term vision, and the complexities of changing a culture. The remainder of this paper will deal with three strategic priorities that state and district policymakers need to address in order to realize the dreams made possible by our infrastructure investments. These include:
A Byte at the Apple
254 255
From Building Systems to Using Their Data
children who age out of foster care earn wages below poverty, have high arrest rates and teenage birth rates, have low participation in follow-up services, and often do have not have a drivers’ license. After learning this, state officials were able to coordinate efforts to address these deficiencies and increase basic services such as health care, food stamps, and referrals to education and job training. The data not only created the impetus to act, but also provided policymakers with the information needed to target assistance and achieve their ultimate goal of improving outcomes for this disadvantaged group.
4
Current technology enables state agencies to exchange and analyze data that historically have been housed separately and incompatibly; however, garnering the political will to clarify student privacy protections, establish interoperable data systems, and standardize data definitions has proved more difficult. While we need to ensure individuals’ privacy is protected and information is not used inappropriately, these protections need to be balanced with other needs. The tragedy at Virginia Tech highlights the danger of disconnected information. Had school officials understood that it was permissible to share mental health files between the high school and university, a horrific loss of life might have been avoided. Currently, countless agencies may be serving the same individual. Appropriately linked and shared, data on individual students from multiple agencies enable decision makers at all levels to provide better and more cost-effective services. Other countries, as well as select states and districts in this country, are already realizing the benefits of linking their child-focused data systems. Great Britain began implementing Every Child Matters, an integrated data system, after the nation was jolted by the violent death of a young girl who was being treated by multiple agencies. The system that had been set up to assist and protect at-risk children failed because information that could have served as a warning sign could not be shared among the various programs and agencies serving the child. Other types of data systems — such as those dealing with financial and management information — need to be linked to data about education processes and outcomes to better inform decisions about resource allocation and program effectiveness. Very few education accounting systems are structured to track expenditures by program and link them to student outcomes; consequently, there is very little information about the returns on various investments. This disconnection between funding and outcomes is based not on technological challenges, but rather on the fact that we haven’t valued this type of information.
As education systems become increasingly aligned — through standards, assessments, and other measures — information about successful transitions and unsuccessful ones (when students drop out or fail) is vital. Longitudinal data on student courses, grades, test scores, and remediation rates can be used to develop indicators of college readiness and to identify the cracks in the system in which we lose students. Transfer Records across Systems and States. In an increasingly mobile world, people regularly move across state borders, but it can be difficult for bureaucracies to know whether a student has dropped out or simply moved to a new state. Similarly, educators are impaired in adequately serving students that arrive in their schools without their complete education and program participation histories. Recent relocations of large numbers of students after Hurricane Katrina proved the importance of the immediate electronic transfer of student records and of having compatible ways of identifying students across state lines. At a critical moment, Florida, Louisiana, and Texas had functioning longitudinal data systems that allowed displaced students to be identified and their academic records to follow them to their new schools. Therefore, not only do education data systems need to be able to exchange information with other systems — such as postsecondary — within the state, they also need to be able to exchange information with systems in other states. The key is ensuring that data systems in different states use common data standards, definitions, and unique identifier protocols. Link Education Information with Other Critical Data Systems. No Child Left Behind has made it our shared national goal for every child to reach academic proficiency by 2014. For the first time, we have data systems that can track individual student progress toward this goal. Increased collaboration among the major systems involved with young people — especially education, child welfare, and social services — can help students reach academic proficiency. Collaboration requires the ability to share data among and within the agencies that are responding to different aspects of the student (e.g., English language learners, special education, career and technical education). If those tasked with improving the welfare of children, such as educators, case workers, and health providers, had access to pertinent information, better decisions could be made. In Utah, a policy question from the governor to the Department of Human Services about “what happens to children who age out of foster care?” led to several separate agency databases being linked. This linkage of data uncovered that
A Byte at the Apple
256 257
From Building Systems to Using Their Data
are essentially the software programs written to calculate the statistics (based on data in the warehouse) that stakeholders need to evaluate the performance of a student, school, district or state, and to produce electronic or print reports that answer stakeholder questions.
6 Thirty-six states have built or plan to build data
warehouses and 35 states have deployed web-based data analysis and reporting tools to make these data accessible and user-friendly to various audiences.
7
These warehouses and data analysis tools expedite the development of reports mandated by federal and state requirements, but they also can inform decision making throughout the system when information flows back to schools and districts for improvement purposes. For example, districts in Delaware benefit from the state’s ability to collect and link many different data systems through their data warehouse. The state is able to report district compliance with the Highly Qualified Teacher Requirements of No Child Left Behind on behalf of the districts, while also reporting back to the district and school staff (within hours of receiving it from the district) detailed information on educator hiring, licensure/certification, and NCLB compliance that can be used to inform staffing and professional development decisions.
8
While most warehouses and reporting tools can only be used by state and district staff, they could eventually deliver relevant and comprehensible data to teachers, policymakers, parents, and students. In his chapter in this volume, Bryan Hassel describes the power of information in other industries. Just as Wal-Mart is able to predict which items need to be stocked in a region preparing for a hurricane based on data in the company’s extensive data warehouse, teachers could have at their fingertips results of a benchmark assessment they administered the previous week that could help them tailor their teaching to the needs of individual students. Students would no longer have to spend the first week of school taking placement tests if their teachers had access to their individual academic histories through the data warehouse. Parents could have a sense of how their child is performing compared to students in the same class, school, district, and state. State legislators could allocate resources based on accurate and timely data rather than hypothesizing about potential impact. Today, access to the data is not limited by the technology available, but rather by issues of governance (Who decides who gets to see what data/analysis?), privacy (Are we allowed to share data?), and funding (Is there training for users to access and manipulate the data? Is the technology available to get this data on every teacher’s desk?).
Now that we are gaining momentum to use data on education outcomes, we need to focus on collecting and using information on how schools and systems are achieving (or not achieving) those outcomes, and what they cost. We need to connect data on education inputs, processes and outcomes to ensure the entire system is aligned towards meeting the goal of improving every student’s performance. (For more on this topic, see the chapter on balanced scorecards and performance management by Frederick M. Hess and Jon Fullerton.)
Make Data Accessible and Useful
States and districts can develop comprehensive data systems that collect quality data, but if this information is not shared in a timely, user-friendly and action-oriented format, it is all for naught. Everyone does not need access to all data, nor does everyone involved in education need to suddenly become a statistician. Rather, we need teachers to teach, principals to lead, parents to ask questions and make decisions in the best interest of their children, and policymakers to allocate resources. States and districts are beginning to present users with “actionable data” that can assist each of those education stakeholders with their task. The states furthest along in this effort are finding that greater access to and use of data lead to increased data quality. Previously, data typically were reported up the command chain so that the “compliance box” could be checked. Now, everyone along that chain has a vested interest in the accuracy of those data. New Mexico’s two-year-old STARS data warehouse and reporting tools system highlights this point. In the year prior to the introduction of STARS, the state education agency was forced to accept 5,000 unresolved data errors; after collecting student-level data directly from the local districts and providing opportunities for the districts to review and update their data through STARS in 2008, all of the 2,000 identified concerns were resolved.
5 Margaret Raymond’s
proposed Student Data Backpack (see her chapter in this volume) provides a way to ensure the quality of data by engaging the self-interest of parents and students themselves. Expand the Use of Data Warehouses and Data Reporting and Analysis Tools. One of the keys to storing, organizing and making data more accessible is a data warehouse. This is a storage facility for many data sets culled from a variety of source files, such as student enrollment, program participation, graduation, state-level test data, teacher data, and financial data. Reporting and analytic tools
A Byte at the Apple
258 259
From Building Systems to Using Their Data
appropriate uses of data. 9 Chrys Dougherty’s chapter in this volume provides
detailed analysis of this topic.
Build Capacity to Use Data
The DQC partners believe that every state will have in place, or have a timeline for having in place, the foundational elements of a comprehensive longitudinal data system by 2009. This is an extraordinary accomplishment given the political will, technical expertise, and resources required to build these systems. The real work is just beginning, however. For these data systems to improve student achievement, policymakers and practitioners need to focus on the next generation issue of building capacity throughout the education system to analyze, access, and use data. Improve Staff and Organizational Capacity within Education Agencies. Until recently, the state role has been to serve as a conduit of data between local and federal data systems. No Child Left Behind and the rise of state longitudinal data systems have given state education agencies a central role in the collection and dissemination of data. Most agencies, however, have not updated their structure, staffing, or resources to support these growing data demands. Often, the same handful of agency staff that previously had only to report data to the federal government for compliance purposes are now being asked also to calculate and report accountability data for NCLB, as well as to fulfill data, requests from advocacy organizations at all levels, the media, parents, legislators and researchers. The increased focus on data systems provides an opportunity for state education agencies to reinvent their roles. State agencies should ensure access to data; provide analytical tools for using the data; develop professional training around data use; promote the development of interoperable systems (making sure all the nozzles on the hoses can fit all of the hydrants, no matter the town); and support local districts in their data efforts. Doing these will require the political will to support new funding, to negotiate new staff roles and responsibilities (not only within the agency, but in relation to districts and other stakeholders), and to reorient the mission of the agency from that of regulator to that of service provider. Outside investments — from foundation grants and the federal government (including the $115 million in grants made to 27 states since 2005 through the Institute of Education Sciences at the U.S. Department of Education) — are spurring state action in building longitudinal data systems
Provide Data Access to Researchers and Analysts. Education agencies need to make the data they collect available and user-friendly for purposes of accountability, transparency, and efficiency, but they also need to make it readily available to the research community to investigate which practices are enhancing student achievement. Few agencies now have the capacity to conduct this research “in house,” though Massachusetts’s elementary and Kentucky’s higher education agencies are producing valuable reports that provide data on postsecondary outcomes for students graduating from state high schools and matriculating to state universities. At times, state data managers deny researchers or third-party advocacy groups access to data because the state is not staffed appropriately to support the work required, or they are concerned about violating the federal Family Educational Rights and Privacy Act (FERPA) and state privacy laws. These capacity and regulatory ambiguities need to be addressed, but a change in expectation is even more crucial. Promoting access to and use of this data must be part of the core mission of the agency, not just an “add on.” For example, Florida’s Department of Education has a research review board that meets weekly to consider all requests for data and determine which research projects would best serve the state’s goals. Acknowledging that the state lacks the capacity to conduct much of the research and analysis it desires, the agency is enthusiastic about making its data available to outside researchers, and asks only for the opportunity to review the research findings prior to their release. Clarify Privacy Laws. Efforts to share data across agencies, schools, and sectors must include appropriate protections for the privacy of student records. In particular, FERPA imposes limits on the disclosure of student information by educational agencies that receive funds from the U.S. Department of Education. In the 30 years since FERPA was enacted, the technology and culture around data collection and use have changed, and so has the state role in collecting and using data. This has caused some uncertainty around how FERPA relates to state agencies and state longitudinal data systems, which has led to organizations and individuals being denied appropriate access to educational data under the sometimes mistaken assertion that providing the information would be “in violation of FERPA.” Many states also have their own privacy laws that restrict the collection, sharing and use of data. To maximize the power of longitudinal data, privacy policies need to be updated to clarify
A Byte at the Apple
260 261
From Building Systems to Using Their Data
Clarify Data Governance. Control of and access to data are a proxy for power. Hence issues surrounding data governance and the relationships between data systems (Who owns the data? Where do they reside? Who gets to have access to it? What can they be used for?) are ultimately decisions about the roles and responsibilities of players from different functional areas. These questions rarely had to be dealt with in the past because data were only used for compliance reporting. Now that there is a premium on using quality data to make high-stake decisions about accountability, resource allocation, and personnel — deciding who ultimately controls access to the data is critical. This governance conversation is being played out in every state developing mechanisms to share data among the K-12 and postsecondary data and workforce systems. The K-12 systems usually rely on a unique student identifier, while higher education and labor data systems generally use social security numbers. Governance conversations are touching on issues such as which unique identifier will be used and how, in which agency’s warehouse the matching will take place, and how research processes and results that use this matched data will be reviewed and monitored. Clarifying data governance and the roles of the people, processes, and technology that govern data collection and use will improve data quality as all departments will use the same definitions and standards; increase data timeliness as data requests are processed more efficiently under a single set of business processes; and improve alignment between educational initiatives across departments under a shared data management strategy. As data are increasingly shared across states, agencies, districts, and K-12 and postsecondary sectors, common policies help to ensure data quality and make it easier to use that merged data to inform decisions. Build the Capacity of All Stakeholders to Analyze, Understand and Use Data. If we are to increase the usage of these newly available data, ongoing professional development is essential for all those charged with collecting, storing, analyzing and using the data. The local school person who inputs course grades needs to understand how his/her work fits into the broader data system, the principal needs to understand how data can affect daily school management, and policymakers need to understand how their decisions can be enhanced by high-quality data. The Kansas State Department of Education has developed a Data Quality Curriculum and Certification program for school-level staff, which shifts the emphasis toward quality at the point of data entry rather than
much faster than they would have otherwise. These investments do not cover the full cost of the data systems, nor should they. Few state legislatures have funded longitudinal data systems to be a sustainable part of the state’s infrastructure because they haven’t been convinced that ongoing funding is a valuable investment. Education agencies need to continuously demonstrate the value their data provides to every stakeholder. For example, the Florida Department of Education is now providing data analysis and reports tailored to each legislator’s district to demonstrate the power of having access to longitudinal data. Improve Coordination between Education Data Systems at the State and Local Levels. The majority of the nation’s 14,200 school districts are small and lack the capacity to develop and maintain a data system that does anything more than generate mandated data reports. However, many large districts have had more developed data systems than their state due to greater budgets and staff capacity and the de facto role of the district as the “owner” of data. Efforts to build state longitudinal data systems must take care not to undermine the established, productive district systems. States can learn from and partner with those districts furthest ahead with data systems, while also providing services and support for those smaller or less sophisticated districts. State education agency staff say that district personnel who might have been reluctant to share their data with the state have been won over by the analyses and reports that the state’s data portals and tools make possible. For example, Massachusetts has developed a state warehouse and is allowing districts to store within it not only data they report to the state, but also district-specific data. In Ohio, a state-sponsored pilot program gives educators access to data on student learning gaps identified by state tests, and then guides the teachers to educational resources and teaching tools targeted to the individual student’s needs.
10 Some of the technical challenges for states and districts working
together are to ensure common data definitions (e.g., What is retention?); to standardize the way data should be formatted, coded, and stored; and to determine how and when the data should be transferred to the state education agency. The Virginia Department of Education has bought memberships for each of its school districts in the Schools Interoperability Framework Association (SIFA) and funds SIFA-certified software for its districts so that the state and local districts are all working from the same data architecture as they build their interoperable data systems.
A Byte at the Apple
262 263
From Building Systems to Using Their Data
But while state policymakers for the most part understand the need to invest in building these systems, very real challenges remain. Making data readily available, easily understood, and widely used has the effect of decentralizing the power that the education “system” once monopolized. While this growing access to and use of data empowers stakeholders, it can also be seen as a direct threat to the status quo and those who fear change, as is seen in the following examples:
Teachers unions in New York successfully lobbied to defeat a bill in ��
the state legislature in April 2008 that would have tied a teachers’ receipt of tenure to the academic performance of his/her students. This incident demonstrates the challenge of changing how we recognize, reward and improve the teaching force now that we have access to student-level information.
Postsecondary institutions, particularly independent and private ones, ��
are wary of greater access to and use of data about their processes and outcomes. Broader use of data would open the door to an accountability discussion that higher education has, to date, skirted. Forward-thinking institutions and systems, such as the colleges of education in Louisiana and Texas, however, have welcomed studies that highlight which of their institutions are producing the teachers with the greatest impact on student achievement. The colleges of education are using that data to distinguish effective practices and promote them.
The ambiguity that abounds due to conflicting legal interpretations of ��
FERPA continues to have a chilling effect on data sharing and use. This is a case in which federal leadership is required to provide clear national guidelines that would widen access to information.
Most stakeholders tasked with changing their operating procedures and ��
daily routines to include data use have little incentive to take risks and venture into new territory. Managers and teachers need to be given the authority to make changes based on what that data tells them about the best allocation of time, money, and personnel. Only then will real change occur — what we truly mean by data-driven decision making.
To move beyond building longitudinal data systems to using them, we must build political will, consensus, and capacity beyond the policymaker
relying on the state to monitor and correct data. Culture change around data use depends on training for data managers and users that teaches all to be active consumers of the longitudinal data system. In particular, until school-level stakeholders — teachers, administrators, students and parents — embrace the use of data, we are at risk of building a field of dreams. The developers and promoters of data systems need to demonstrate that using data to inform decisions about teacher placements, curriculum selection, and resource allocation will improve the performance of schools and of individual teachers and students. Teachers and principals feel so much pressure to meet new outcome requirements that they often cannot handle thinking about “another change.” As with the state agencies that were neither created nor staffed to deal with longitudinal data systems, most schools are not currently positioned to think about infusing data into their standard operating processes. Finalists in competitions for the Broad Prize and the Baldrige Award, as well as other successful schools and systems, have taken specific steps to integrate data into their instructional and management processes. These include offering training on data use, ensuring access to data in a timely manner, embracing organization-wide measurable goals, and being transparent about progress. There is growing momentum to study and share best practices. This shift beyond anecdotes is crucial to taking effective practices to scale.
Realizing the Dreams
To meet our goal of preparing each child for the demands of an increasingly competitive, knowledge-based global economy, it is not enough to build state and local longitudinal data systems that generate data to satisfy compliance and accountability reporting requirements. Just as the American economy will increasingly rely on its ability to turn raw data into knowledge that informs continuous improvement, so too must the education sector realize the power of data to improve decision making, and ultimately, student achievement. As information continues to flatten the world, education leaders also must be prepared to embrace the power of data . This central belief that data are critical to improving student achievement was the cornerstone laid by the founding partners of the Data Quality Campaign. Governors, chief state school officers, and business leaders know that without more useful data, we will continue to produce inadequate results.
A Byte at the Apple
264 265
From Building Systems to Using Their Data
Endnotes
These data were collected from the National Center for Educational 1
Achievement/DQC survey administered to each state education agency in
September 2007. Results for 2008 will be available in November 2008.
For more information on the survey and for specific state results, visit
http://www.DataQualityCampaign.org.
These 36 states are able to calculate the longitudinal graduation rate agreed to 2
in the 2005 National Governors Association compact. Since it takes at least five
years of data to calculate this, it will be a few years before many states actually
have enough data to do the calculation.
Guidera, Aimee R. “The Data Quality Campaign at Year Two: Update on 2007 3
Survey Results.” Data Quality Campaign, November 2007.
Smith, Susan , Deborah Staub, Mary Myslewicz, and Elizabeth Laird. “Linking 4
Education and Social Services Data to Improve Child Welfare.” Data Quality
Campaign, October 2007.
Wanker, William. Email correspondence with Aimee Guidera. April 2008.5
Steiny, Julia and Nancy J. Smith, “Reporting and Analysis tools: Helping 6
Mine Education Data for Information Riches.” Data Quality Campaign,
September 2007.
Guidera, Aimee R. “The Data Quality Campaign at Year Two: Update 7
on 2007 Survey Results.” Data Quality Campaign, November 2007.
Taylor Robin. Phone interview with Aimee Guidera. April 2008.8
For more detailed information on privacy laws, FERPA and state 9
longitudinal data systems, please visit the DQC website at
http://www.dataqualitycampaign.org/policy_implication/ferpa.cfm.
Laird, Elizabeth. “Data Use Drives School and District Improvement.” 10
Data Quality Campaign, September 2006.
community and throughout the education sector to collect, share, and provide access to quality and timely data. Self- interest is key to the success and sustainability of this effort. If the users of data systems don’t see the value this data provides, then our infrastructure investments have been squandered. Private foundations’ and the federal government’s venture capital to build these data systems must continue until we have produced enough proof points to convince state legislators, teachers, administrators, parents, and students that they cannot do their jobs without the information provided by these systems. Only then will our systems be successful and sustainable. Build it and they will come? Stakeholders — policymakers, parents, students, researchers, teachers, school system leaders — are beginning to hear the whispers. To transform our education sector into one driven by information, we must make true believers of the users of these data systems, which will only happen through their own first-hand experiences that using data does actually improve processes, performance and ultimately, individual student achievement.
266 267
Education Data in 2025
Education Data in 2025
Chester E. Finn, Jr.
Chester E. Finn, Jr. is president of the Thomas B. Fordham Institute
Please join me on a short, visionary tour of American K-12 education circa 2025 so that together we can glimpse the very different roles that data have come to play in this sphere and the dramatically changed ways that the collection, analysis, and dissemination of
those data are being handled. We’ll start with individual students and, like the data themselves, aggregate outward and upward to larger institutional units. Perhaps the most profound change in education statistics since the late-medieval period around 2008 is that an individual’s achievement and attainment records no longer sit within the boundaries of a given school or school system, confined there either in old-fashioned paper files that must be physically copied and shipped when a student changes schools, moves to a different city, or graduates and goes on to college, or in unique databases constrained by interoperability barriers that are just as daunting. Now personal data are saved (with elaborate safeguards) in cyberspace and secure state databases, making it easy for them to accompany students from one education level to the next and from school to school, even district to district or state to state. Picture a fully portable information “backpack” akin to Margaret Raymond’s proposal in this volume, featuring what data expert Glynn D. Ligon calls a “cumulative education transcript” that recaps
one’s complete educational history and track record and, in Ligon’s words, “encompasses anything and everything one might need to qualify for admission, be employed, be promoted, get a scholarship, participate in NCAA athletics, take the next higher course, satisfy a community service sentence, qualify for a tax deduction, etc.” This information accumulates over time and moves with the student — a virtual backpack. The portions that, in the interests of accuracy and integrity, are legitimately “controlled” by the state — e.g., grades, test scores, diplomas and such — cannot be altered by the individual (they’re under seal, akin to “read only” files) but other parts can be updated, deleted, and edited by the individuals whose transcripts these are or (for minors) by their parents. The set-up affords students and parents the right periodically to review the state-controlled data for accuracy and to flag errors or problems. Still, the state “education data bank” is where those data are primarily lodged and anyone wanting to alter his/her own data must be able to justify the change. The guidelines and ground rules for accessing data like grades and test scores vary according to who seeks such access for what purposes. One crucial factor is whether a person’s information is identifiable or not. So long as it’s not — the key here is a secure student ID number — the data can be aggregated, analyzed, and used in a host of ways at many different levels of the education system (and by outside researchers) without the individual’s permission. Privacy rules have been modernized; just as we trust the IRS with our financial data, we need to be able to trust our child’s present school or university with his/her academic data; but we also need to be confident (as with tax returns) that while nonidentifiable data can be shared widely, any data that can be tied directly to Johnny or Mary are shared only when strictly necessary. Well safeguarded “unique student identifier” numbers (which could, but need not, be social security numbers) now make it possible both for one’s data to be readily aggregated without revealing one’s identity and also for analysts to do competent work investigating things like student learning gains in various schools and circumstances. Every state employs a data security expert whose assignment is to make sure that legitimate corrections and updates get incorporated and legitimate users can gain access according to the pertinent rules, but “leaks” don’t happen. These folks have a national group that sets model rules and best practices under the aegis of the National Education
A Byte at the Apple
268 269
Education Data in 2025
Information Strategy, chaired by the federal commissioner of education statistics (more on this later).
Charting Alexandra’s Progress
All students carry PDAs (or cell phones) that communicate with tracking devices in the school, and Alexandra, a typical student, is no different. Using these devices as well as swipe-able ID cards, the activities that fill her day are entered into the school data system — and, when warranted, flashed to teachers and parents. For example, each day the system calculates how much time Alexandra spends sitting and listening to the teacher, meeting with the teacher in small groups, doing seat work, taking formative assessments using her PDA, reading independently, doing math problems at a computer, playing outside, etc. This information can be used by teachers and analysts to determine how Alexandra might better use her time and the school’s learning resources. All manner of assessments (formative, summative, informal) are completed electronically, many of them through adaptive online programs. The resulting information is automatically analyzed by special software to create Alexandra’s very own education data dashboard, showing what she has mastered and what she still needs to work on. Most assessments are graded by computer, though teachers read essay questions themselves and occasionally offer a separate “hand-graded” score. Instant results are available — and the formal results, checked over by a data team, are available soon thereafter. Data are transmitted through special portals linking schools, districts and the state using standardized formats and interfaces so that individual results can be shared and readily aggregated. Alexandra’s cumulating education record is periodically “sifted” by an artificial intelligence software program to answer — especially for her parents, teachers, and counselors — such profound questions as whether she is on track to be ready for college when she completes high school. What are her academic strengths and weaknesses? What does the arc of her progress look like over time? Is it accelerating? Slowing down? How about compared with other kids? Any early warning signs of academic (or other) problems that may signal needed changes of direction, maybe even swift interventions? This kind of diagnostic work can be hugely informative to the adults concerned with Alexandra’s — or Anika’s or Alfredo’s — educational progress and prospects. Kids can also monitor their own progress via age-appropriate online systems.
Alexandra’s parents can log on at will to her virtual backpack’s (password-protected) cumulative report card, which is updated continually as new information becomes available, not just with test results but also with sample work, attendance information and, when warranted, teacher comments. Weekly reports are emailed to parents, as are cumulative reports (by marking period, semester, year, etc.). In response, parents can communicate with teachers (and counselors, principals, etc.) by phone, by email — the modern 2025 version of it — or via social networking websites, complete with audio and visual as well as text communications. They can also use modern means to schedule old-fashioned face-to-face conferences if necessary and practical. But a “video-conference” or “computer chat” might be just as satisfactory and practically everybody now has such capacity at both home and work. The painless, even organic capturing of so much student-level data, particularly in the realm of academic achievement, saves tons of time that used to be given over to test-administering, attendance-taking and report-writing. This has created additional time for teaching and learning and has freed teachers, counselors, and others from many hours of traditional paperwork. The use of artificial intelligence and student performance algorithms also saves much time formerly spent in staff meetings trying to make sense of youngsters’ progress and needs and determining what to do for them. Though some educators are nervous at having so many “invisible eyes” monitoring their pupils’ (and their own) performance, most are delighted to be liberated from so many non-instructional chores and non-teaching responsibilities.
Schools and Beyond
Education data serve many purposes and informing those who care about Alexandra is just one of them. Many people want to know about entire schools, too, so as to judge where to enroll their kids, where to seek (or shun) teaching jobs and what units in the systems that they lead are working well or poorly. Student achievement data are also vital for tracking and comparing the performance of schools (and their leaders), the efficacy of various programs and education strategies, the instructional prowess of teachers, and far more. Masked by those impermeable and anonymous ID numbers, information about individual student performance is aggregated across pupil populations at the classroom (and teacher), school, district, state and national levels and cumulated over time. “Change” data and value-added calculations are routine.
A Byte at the Apple
270 271
Education Data in 2025
moves automatically and instantly to teachers, to the principal’s office, to the district, and to the state unit responsible for education finance — since schools continue to receive portions of their state money on the basis of average daily attendance. (Note, though, that this arrangement is also well suited to a weighted student funding system whereby the money follows the kid to her actual school: if she changes schools, her card swipe shows her attending there rather than the previous school.) Parents or other adult caregivers worried about whether their kids are actually getting to school, whether they’re going to class, even what they’re eating for lunch, can arrange for instant email notification whenever their child swipes her card — including in the cafeteria checkout line. And ancillary service providers — the school nurse, say, or the afterschool program operator — would also know right away if Alexandra is in school that day. Yet nobody on the staff needs to “take attendance” or fill out a state reporting form. Sure, pupil attendance is an easy example because it’s normally a yes/no proposition. So is checking a book out of the library or logging onto the school’s internet server or wi-fi system. But other information can also be entered with minimal effort. Consider a teacher’s written report on the child’s performance in class during the previous week or marking period. Yes, she’ll still have to key in the words herself, but online questionnaire-type forms that suggest categories she may want to rate or comment on can save a lot of time and effort. And once that information is entered, it can flow automatically to parents and other teachers (as well as administrators, counselors, social workers, school psychologists, special ed directors, and such), and be retained in the youngster’s permanent online record. If Alexandra has an Individualized Education Program (IEP) — either the “special ed” kind or the kind that increasing numbers of schools are tailoring for every pupil — the teacher report feeds right into the system so that Alexandra’s progress can be tracked in relation to her IEP benchmarks.
Teachers and Principals
Teachers have enormous information resources regarding their pupils, the progress of their classes from week to week, the extent of interaction with parents, even their own performance this year in relation to last. Ms. Akins can see at a glance how Alexandra fared in prior grades — as well as annotations from previous teachers, counselors and administrators regarding any notable
School executives and policymakers thereby find themselves with powerful diagnostic tools that signal what is and isn’t working and what may need changing or intervening in, as well as potent accountability data. Like “CompStat” in the New York City police department, the administrative data available to school principals, district superintendents, and state officials enable them to determine which institutions, programs, divisions and individuals are on track to attain their relevant targets and benchmarks and which warrant some form of redirection. True data-driven decision making is possible, after all, only when the requisite data are comprehensive, timely and trustworthy. The public gets data, too, and can gauge the return on its education investments. Newspapers faithfully publish England-style “league tables” showing both raw scores and value-added results for every school. Not only is the academic performance of each school, district, and state rendered transparent in relation to fixed standards as well as “value added” and “change over time.” It is also easily compared across jurisdictions, thanks to the internationally benchmarked yet voluntary national standards and tests that nearly every state has embraced. The same is true of a host of key “input” and “process” measures. Thus one can determine not just how a school is doing but also how much is being spent on it and, with the help of GreatSchools.net and kindred services, how satisfied its “clients” are with various aspects of it. One can find out not only how the district’s academic achievement ranks against state standards, but also what the average cost (per teacher) of fringe benefits is compared with other districts; what the system spends on technology versus personnel; how the superintendent’s salary compares with others in similar posts; and on and on. Much of this information is published annually, like the 990 forms filed each year by nonprofit organizations, but some of it is updated more frequently.
How Data Enters the System
Rich as the data supply is, schools don’t often need to “input” data except via their routine tasks, by which the data automatically and unobtrusively enter the information system. For example, by swiping her ID card on the scanner when she enters school on Tuesday morning, Alexandra shows that she is in attendance that day — and schools worried about kids cutting classes could have them swipe again when they enter individual classrooms — or, even better, when they exit at the end of class. This attendance information
A Byte at the Apple
272 273
Education Data in 2025
to view as well as hear and read each other), increasing portions of students’ days are given over to virtual education: watching lectures, participating in online discussions, making smart use of software programs, and emailing or conversing with distant experts. What looked back in 2008 like pie-in-the-sky prophesying by Harvard business professor Clayton M. Christensen in his book, Disrupting Class, has actually come to pass — and then some. Teachers have grown accustomed to rating and commenting on materials in the online curriculum vault based on their own experiences with them. As those ratings multiply, other teachers can avail themselves of the “wisdom of crowds” when deciding which to use and how to use them. Many other items deployed in the school — textbooks, library books, handheld devices, school lunch vendors, etc. — are similarly rated by teachers, staff, principal and sometimes pupils, much as “TripAdvisor” rates hotels and Zagat rates restaurants, thus enabling anyone at any level of the education system to make better informed purchasing decisions. For their part, principals keep electronic teacher files brimming with data (as well as eyewitness impressions, student and parent and peer ratings, etc.) on pedagogical strengths and weaknesses. Linked teacher and student databases are used to generate recommended professional development activities for each teacher based on the performance of her students and the ways that they have responded to different instructional techniques. Classroom sessions are periodically videotaped and the tapes shared with online instructional mentors — some of them ed school faculty members! — who offer quick feedback to beginning or struggling teachers. Data files showing formative and summative test scores for individual students or entire classrooms are also shared electronically with specialized pupil achievement consultants, who can offer advice to teachers about what might work for a problem student or a difficult class (much as distant radiologists can today review x-rays online and offer expert advice to whomever is treating the patient on-site). Schools regularly calculate gain scores for each kid and every state has a robust Tennessee-style master evaluation system that spits out data on the effectiveness of individual teachers, schools, and districts based on these value-added scores. Researchers have perfected these value-added models, including tweaking them to control for outside factors affecting achievement. The system also allows districts and schools to generate measures of the achievement gains
“issues.” She can see which kids are doing their homework, who is attending regularly — and who missed two weeks because of illness and therefore may need extra help. She can readily determine not just how each of her pupils performed on the previous Friday’s end-of-week snapshot test, but also which children did and did not attain their own learning objectives. Ms. Akins also enters information about the instructional methods and materials that she deployed, the concepts that she covered, and the activities she led. This is coupled with the assessment data to produce information about how each kid responded to each kind of classroom experience. Ms. Akins can thereby also gauge which lessons “worked” best. It’s a simple matter to compare the progress of her fourth graders with those of her fellow fourth-grade teachers this year — and with last year’s fourth graders. With the touch of a finger, she can also track her students’ progress against the state’s latest revision of its academic standards. Teachers and principals alike are routinely trained — both pre-service and in-service — in data analysis and its applications, meaning both that they keep getting better at it and that the system employs ever-fewer old-fashioned, statistics-averse holdouts. (Incorporating data use prowess into personnel selection, promotion, and compensation decisions has accelerated this process.) Ms. Akins is comfortable with information technology and electronic communication. She easily receives and responds to electronic messages from parents and the principal. And 24/7 internet access and a plethora of special teacher websites give her abundant resources for planning lessons and obtaining supplementary materials. The online material includes a massive database of formative assessments linked to state academic standards and commonly used curricular materials. The arrival of national standards and tests has made it far easier to develop national repositories of lesson plans, curricular materials and end-of-week assessment items tied to those standards and tests. These include just about everything a teacher might need — from student readings, workbooks, assignment ideas, web links and mini-tests to audio and video snippets that can be used during class, lecture notes, sample research papers, book reviews and lab reports. For every standard or curriculum unit, multiple lesson plans are available to teachers. (Some people term this “open source curricula,” not unlike Wikipedia.) Since the online curriculum “vault” now includes thousands of videos of master teachers delivering top-notch lessons, and since interactive websites host innumerable discussion groups (most of them now enabling participants
A Byte at the Apple
274 275
Education Data in 2025
Data are easily and automatically aggregated “upward” from student to classroom to school to district to state to nation and, where appropriate, into international education databases such as those maintained by the Organization for Economic Co-operation and Development (OECD). In Washington, the National Center for Education Statistics (NCES) has undergone a rebirth. Adequately funded for the first time in history and politically insulated from Washington cross-currents, it now has four major functions: (1) aggregating local/state data across dozens of categories into intelligible, reliable and up-to-the-minute national education information from pre-K through university; (2) linking the U.S. with international data systems and linking education with other, overlapping sectors and agencies; (3) conducting certain important nationwide studies such as longitudinal tracking of child and pupil cohorts; and (4) managing the National Assessment of Educational Progress (NAEP), under the National Assessment Governing Board’s watchful policy eye. The NCES commissioner also presides over a vitally important data coordination and quality control council — every state has a representative here, as do key higher education and preschool units and major vendors — known as the National Education Information Strategy (NEIS, pronounced “nice”). NCES does not, however, evaluate programs, federal or otherwise. Its job is to ensure the existence of reliable data by which others can perform evaluations. For their part, state education data agencies have evolved from fragile, staid, and understaffed units focused mainly on the mechanics of state funding schemes into the hosts and operators of modern management information systems as well as permanent repositories of individual achievement records for current and former students. Though some were slow to make the shift, the combination of Data Quality Campaign’s nudging, federal dollars for upgrading, competitiveness among governors and chief state school officers, and savvy marketing and technical assistance by commercial vendors of data systems eventually caused every state to take the plunge — and keep plunging deeper. The aforementioned NEIS council keeps them coordinated and moving forward together, able (despite software and policy shifts) to communicate smoothly with each other and with NCES. Besides all this public-sector activity dealing with education data, the private sector is a lively, robust industry of data management systems (working off common standards and interoperability requirements imposed by their government customers), testing programs, and pedagogical products. Smart
associated with particular textbooks, teaching units, professional development activities, etc. Every principal has at his/her fingertips a full dashboard of the information essential to lead a successful “data-driven” school, information that’s sortable by class and grade, by subject and teacher, by individual student and family. Some of this information is updated daily (e.g., attendance) or weekly (e.g., pupil and classroom progress). Included here are a number of multi-year and value-added measures, such that the principal can see almost at a glance the trajectory of an individual student’s educational progress, of a teacher’s performance, of how last year’s fourth graders are faring in fifth grade, etc. Fiscal and resource information are just as accessible, which everyone finally recognizes is vital for the success of schools whose principals have been empowered with budget and personnel authority. School leaders also have rich sources of input and process data, and these are often analyzed in relation to one another. It’s possible to know what the afterschool tutoring program in your charter school costs; how many people (teachers, tutors, kids, families, etc.) are taking part in it and for how long; whether the students who need it most are participating; what students are achieving by way of added learning; whether the program is more cost effective than arranging for students to be tutored online; and how all that compares with other schools and averages. These data are also widely shared. Whether one is a school system employee, an enterprising journalist, an outside scholar, or an elected official, it’s feasible to engage in productivity, efficiency and cost-benefit studies of different educational institutions, programs and activities. It’s straightforward, for example, for a superintendent to determine how much his school system spends on, say, information technology; what that’s buying for the system by way of services and outcomes; and how this compares with other districts, state averages and so forth.
Government
State education databases are now continuous from pre-K through higher education — and compatible from state to state (as are individual transcripts) so that students who move, or who accumulate credits in more than one jurisdiction, don’t have to start over again. Interoperability is taken for granted from one district to the next, from state to state, and from one level of education to the next.
A Byte at the Apple
276 277
Education Data in 2025
Still and all, the progress in education data over the past two decades surpasses that made during the previous century. Considering the size and decentralized nature of U.S. education, the sluggishness with which it has reacted to many demands for reform, and the relatively low degree of political oomph behind such public-sector activities as data systems, the gains have been truly remarkable. The most obvious explanation seems to be that in education, as in so many spheres of modern life, millions of people in hundreds of different roles seem finally to have realized that the more you know about it, the better your odds of improving it. The great education reform bulldozer that has been inching across the United States since (at least) 1983 needed more than a simple speedometer — and at long last it’s getting a full set of essential instruments.
companies provide comprehensive curricular materials created with, among other things, smart data uses (and users) in mind. Other firms help districts and states with their information system and data management needs. As in any major industry, some succeed better than others, with quality, responsiveness, and efficiency (and, of course, economy) rising to the top as companies compete to be the industry standard. The gains since 2008 have been dramatic and the improvements impressive, but the education data world isn’t perfect and likely never can be. Needs, uses, and priorities change, as technology creates fresh opportunities, and as some people think up better ways of doing things even as others f lummox and exploit the system. Even in 2025, some traditional teachers and administrators remain ill-at-ease with “data dashboards.” Some lackluster principals and superintendents possess data that they’re not smart or brave enough to convert into decision making, even as some teachers union locals still fret that their members shouldn’t be judged by student performance. For their part, too many parents seldom focus on their children’s educational progress, and some simply never learn how to access or understand the information, even as others craftily seek to manipulate data to build a falsely rosy record for their kids. (Some have even been known to change their children’s names — at least their middle names — to cut off the previous “cumulative report card” and start a new one.) Security systems work well but glitches arise when equipment malfunctions, when inaccurate data are initially entered, and when people forget their passwords or undergo the trauma of “identity theft.” Civil liberties groups on the left, and libertarians on the right, fret that government agencies possess more individual information than is healthy for a free society. And while data systems have grown far better at tracking young people who change schools, genuine dropouts still tend to vanish from the system. Insatiable researchers are never fully satisfied with the available data, of course, no matter how ample and versatile these may be, and the upward aggregation of data from local schools and states doesn’t work for every purpose. NCES must still do occasional sample surveys and longitudinal studies to get specific information about the country that would be too burdensome to gather from the system as a whole. Researchers still carry out “randomized field trials” of various educational methods, materials, hypotheses, and interventions that cannot be easily evaluated using existing state databases.

Appendix
Author Biographies
280 281
Author Biographies
Author Biographies
RiShawn Biddle
A journalist and education policy consultant, is editor of the education policy website Dropout Nation. A co-author of Invisible Ink in Collective Bargaining Agreements (National Council on Teacher Quality, 2008), Biddle is also the author of Left Behind, an award-winning, critically-acclaimed editorial series that explored how inflated graduation rates hid the depths of America’s high school dropout crisis. He has spoken about education and other issues at conferences sponsored by such organizations as the Hechinger Institute on Education and the Media, Reason Foundation and the National Conference of Editorial Writers. A contributor to The American Spectator, his work has also appeared in Forbes, Politico, Television Week and Reason.
Chrys Dougherty
Chrys Dougherty is a senior research scientist at ACT, Inc. and the National Center for Educational Achievement (NCEA). He has written extensively on college readiness, the value of longitudinal student data, and the ten essential elements of statewide student information systems. After teaching science in an elementary school in Oakland, California, Dr. Dougherty received his master of public affairs degree from the LBJ School of Public Affairs and
PhD in Economics from Harvard University. He taught statistics, economics, econometrics, and education policy courses at the LBJ School of Public Affairs and authored Asking the Right Questions about Schools: A Parents’ Guide. Dougherty joined Just for the Kids (later NCEA) in 1997 and became a primary designer of NCEA’s innovative Just for the Kids School Reports.
Chester E. Finn, Jr.
Chester E. Finn, Jr., scholar, educator and public servant, has devoted his career to improving education in the United States. As a senior fellow at Stanford’s Hoover Institution and chairman of Hoover’s Koret Task Force on K-12 Education, president of the Thomas B. Fordham Institute, and senior editor of Education Next, his primary focus is the reform of primary and secondary schooling. Finn is also an adjunct fellow at the Hudson Institute, where he worked from 1995 through 1998. He was professor of education and public policy at Vanderbilt University from 1981 until 2002. From 1985 to 1988, he served as assistant secretary for research and improvement, and counselor to the secretary at the U.S. Department of Education. Finn serves on a number of boards including the National Council on Teacher Quality and the Philanthropy Roundtable. He also represents the Fordham Institute on the United States National Commission for UNESCO. From 1988 to 1996, he served on the National Assessment Governing Board, including two years as its chair. In 2004-05, he served on the Governor’s Commission on Quality Education in Maryland.
Jon Fullerton
Jon Fullerton is the executive director of the Project for Policy Innovation in Education at the Harvard Graduate School of Education. He has extensive experience working with policymakers and executives in designing and implementing organizational change and improvements. Before coming to Harvard, Dr. Fullerton served as the board of education’s director of budget and financial policy for the Los Angeles Unified School District. In this capacity, he provided independent evaluations of district reforms and helped to ensure that the district’s budget was aligned with board priorities. From 2002 to 2005, he was vice president of strategy, evaluation, research, and policy at the Urban Education Partnership in Los Angeles, where he worked with policymakers to ensure that they focused on high impact educational
A Byte at the Apple
282 283
Author Biographies
strategies. Prior to this, Fullerton worked for five years at McKinsey & Company as a strategy consultant.
Aimee Rogstad Guidera
As director of the Data Quality Campaign, Aimee Guidera manages a growing partnership among national organizations collaborating to improve the quality, accessibility and use of longitudinal data in education. Guidera joined the National Center for Educational Accountability (NCEA) as director of the Washington, D.C. office in 2003 to promote the vital role Just For The Kids School Reports can play in current education reform efforts of national education, business and government organizations. Prior to joining NCEA, Guidera supported the corporate community’s efforts to increase achievement throughout the education pipeline as Vice President at the National Alliance of Business. Guidera also worked at the National Governors Association and taught English in Japanese high schools. She received her AB from Princeton University’s Woodrow Wilson School of Public & International Affairs, and her Masters in Public Policy from Harvard University’s John F. Kennedy School of Government.
Bryan C. Hassel
Bryan C. Hassel is co-founder and co-director of Public Impact. He consults nationally with leading public agencies, nonprofit organizations, and foundations working for dramatic improvements in K-12 education. He is a recognized expert on charter schools, school turnarounds, education entrepreneurship and human capital in education. In addition to numerous articles, monographs, and how-to guides for practitioners, he is the co-author of Picky Parent Guide: Choose Your Child’s School with Confidence and author of The Charter School Challenge: Avoiding the Pitfalls, Fulfilling the Promise, published by the Brookings Institution Press in 1999. Dr. Hassel received his PhD in public policy from Harvard University and his master’s in politics from Oxford University, which he attended as a Rhodes Scholar. He earned his bachelor’s at the University of North Carolina at Chapel Hill, which he attended as a Morehead Scholar.
Frederick M. Hess
Rick Hess is a resident scholar and Director of Education Policy Studies at the American Enterprise Institute for Public Policy Research and executive editor of Education Next. His many books include When Education Research Matters, Common Sense School Reform, and Spinning Wheels. His work has appeared in scholarly and educational publications including Harvard Education Review, Teachers College Record, Urban Affairs Review, Phi Delta Kappan, and Educational Leadership. He is a faculty associate at the Harvard University Program on Education Policy and Governance, a member of the Research Advisory Board for the National Association of Charter School Authorizers, and serves on the Review Board for the Broad Prize in Urban Education. A former high school social studies teacher, he has also taught at the University of Virginia, the University of Pennsylvania, and Harvard University. He holds his M.Ed. in teaching and curriculum and his M.A. and Ph.D. in government from Harvard University.
Marci Kanstoroom
Marci Kanstoroom is Senior Editor at the Thomas B. Fordham Institute, where she works on a variety of national research projects. She is also Executive Editor at Education Next. Previously, as Research Director at Fordham, she wrote and edited numerous publications on charter schools, teacher quality, and federal education policy, and she testified on education issues before the U.S. House of Representatives Committee on Science and the Subcommittee on Postsecondary Education. A Maryland native, Kanstoroom holds a B.A. in political science from Yale University and a Ph.D. in government from Harvard University, where she studied political philosophy and American government.
Kornelia Kozovska
Kornelia Kozovska is a researcher at the European Commission JRC - Centre for Research on Lifelong Learning (CRELL). The core task of the CRELL is to increase the European Commission’s research capacity in terms of the development of new indicators towards reaching the Lisbon Objectives for Education and Training. Kornelia is finalizing a PhD in Lae and Economics
A Byte at the Apple
284 285
Author Biographies
America One. In June of 2002, Osberg earned a Masters in Business Administration and a Master of Arts in Education from Stanford University. He also completed a Certificate of Nonprofit Management as part of his MBA curriculum. A native of Delaware, Osberg holds both a BS in Commerce, with a concentration in Finance, and a BA in Economics from the University of Virginia.
Margaret (Macke) Raymond
Macke Raymond is the director of the Center for Research on Education Outcomes (CREDO) at Stanford University, which analyzes K-12 education reform policies and programs in the United States. CREDO’s mission is to improve the quantity and quality of evidence about the impacts of education innovations on student achievement in public K–12 education. Raymond, who has done extensive work in public policy and education reform, is currently researching the development of competitive markets and the creation of reliable performance data for management and accountability. Before joining Stanford University in 2000, Raymond held faculty positions in the Departments of Political Science and Economics at the University of Rochester.
Nancy Smith
Nancy Smith is the deputy director of the Data Quality Campaign. The Data Quality Campaign is a national, collaborative effort to encourage and support state policymakers to improve the collection, availability and use of high-quality education data and to implement state longitudinal data systems to improve student achievement. Previously at NCEA, Nancy was responsible for research and development activities for the Just for the Kids school reports and served as the director of programming and technology at JFTK/NCEA. Prior to NCEA, Dr. Smith was employed at the Texas Education Agency in the Research and Evaluation division and the Accountability and School Accreditation division. She also conducted extensive program evaluation projects and participated in large-scale changes to the management information system at the Texas Department of Human Services. She also serves on the National Forum for Education Statistics Longitudinal Data System Task Force, the CCSSO EIMAC Longitudinal Student Data Systems Task Force, the NAEP High School Transcript Study Technical Panel and the
at the University of Bologna and she holds a Master in Development Economics and Innovation from the same university.
Paul Manna
Paul Manna is an Assistant Professor in the Department of Government at the College of William and Mary, where he is also affiliated with the Thomas Jefferson Program in Public Policy. He has published a number of peer-reviewed articles and book chapters on education topics including No Child Left Behind, charter schools, and school vouchers. He is the author of School’s In: Federalism and the National Education Agenda (Georgetown University Press, 2006), which examines the evolving relationship between federal and state education policy since the 1960s. Presently, his State Education Governance Study is examining the impact of state institutions on state education policy and student performance. Manna earned his B.A. at Northwestern University and his M.A. and Ph.D. in political science from the University of Wisconsin.
Robert D. Muller
Robert D. Muller is the founder and chief executive of Practical Strategy LLC, a management and education policy consulting firm. His work focuses on bridging policy and practice for non-profit organizations and national associations, state and federal government, and school districts. Muller is adjunct professor at Georgetown University, where he teaches K-16 policy and education leadership. Formerly Deputy Assistant Secretary for Vocational and Adult Education at the U.S. Department of Education and consultant with Booz Allen Hamilton, Muller holds an Ed.D. in higher education management from the University of Pennsylvania, M.P.P. from Harvard’s Kennedy School, and B.A. from Amherst College.
Eric C. Osberg
Eric Osberg is the Vice President and Treasurer of the Thomas B. Fordham Institute. He is also a Research Fellow at the Hoover Institution. He is primarily responsible for financial and managerial issues at Fordham, and also works on policy projects related to school finance. From 1997 to 2000, Osberg worked for Capital One Financial in Vienna, Virginia, where he helped develop the company’s telecommunications line of business,
A Byte at the Apple
286
USED Institute of Education Science Statewide Longitudinal Data System Review Panel. She received her doctorate in Educational Psychology from The University of Texas at Austin in 1997 with an emphasis in Statistics, Psychometrics, and Program Evaluation.
Daniele Vidoni
Daniele Vidoni is senior economist of education for the INVALSI (Italian National Institute for Educational Evaluation). He has been involved in national and international research projects dealing with alternative structures of educational governance, the creation of school accountability systems, and school management. His work deals with comparative analysis of educational system laws and policies and is published in various Italian and international journals. He holds a Ph.D. in Economics of Education from Boston University, and he received a Master in Management from the University of Bologna (Italy). Before joining the INVALSI, from 2005 to 2008, he has worked in and coordinated the European Commission — Centre for research on Lifelong Learning (CRELL).
Kenneth K. Wong
Kenneth K. Wong holds the Walter and Leonore Annenberg Chair in Education Policy, directs the graduate program in Urban Education Policy, and chairs the Education Department at Brown University. Professor Wong is a national figure in shaping the research and policy agenda on educational reform, governance, and accountability. He is the recipient of the 2007 Deil Wright Best Paper Award given by the American Political Science Association. His recent books include The Education Mayor: Improving America’s Schools and Successful School and Educational Accountability. His research has received support from the National Science Foundation, the Institute for Education Sciences, the U.S. Department of Education, and several foundations. He previously taught at the University of Chicago and at Vanderbilt University, where he was the founding director of a national research center on school choice, competition and student achievement.