a byte at the apple rethinking education data for the post
TRANSCRIPT
A Byte at the AppleRethinking Education Data for the Post-NCLB Era
Edited by Marci Kanstoroom and Eric C. Osberg
Thomas B. Fordham InstituteNovember 2008
Copyright © 2008 by the Thomas B. Fordham Institute
Published by the Thomas B. Fordham Institute Press 1016 16th Street NW, 8th Floor Washington, D.C. 20036 www.edexcellence.net [email protected] (202) 223-5452
The Thomas B. Fordham Institute is a nonprofit organization that conducts research, issues publications, and directs action projects in elementary/secondary education reform at the national level and in Ohio, with special emphasis on our hometown of Day-ton. It is affiliated with the Thomas B. Fordham Foundation. Further information can be found at www.edexcellence.net, or by writing to the Institute at 1016 16th St. NW, 8th Floor, Washington, D.C. 20036. The report is available in full on the Institute’s website; additional copies can be ordered at www.edexcellence.net. The Institute is neither con-nected with nor sponsored by Fordham University.
Text set in Scala and Scala Sans Design by Alton Creative, Inc.
Printed and bound by Peake DeLancey Printers LLC in the United States of America
9 8 7 6 5 4 3 2 1

Contents
Foreword ........................................................................................................ixMarci Kanstoroom, Eric C. Osberg, and Robert D. Muller
Introduction: Education Data Today ...................................................................................1
Paul Manna
I. Why We Don’t Have the Data We Need
Getting FERPA Right: Encouraging Data Use While Protecting Student Privacy ......38
Chrys Dougherty
Federalism and the Politics of Data Use ...........................................................................70
Kenneth K. Wong
Political Roadblocks to Quality Data: The Case of California .........................................90
RiShawn Biddle
II. Innovations and Promising Practices
States Getting It Right: The Cases of Kansas and Virginia ..........................................116
Nancy Smith
The Student Data Backpack ............................................................................................. 142
Margaret Raymond
Balanced Scorecards and Management Data .................................................................160
Frederick M. Hess and Jon Fullerton
Circling the Education-Data Globe .................................................................................186
Daniele Vidoni and Kornelia Kozovska
Cutting-Edge Strategies from Other Sectors ..................................................................218
Bryan C. Hassel
III. The Way Forward
From Building Systems to Using Their Data .................................................................248
Aimee Rogstad Guidera
Education Data in 2025 ....................................................................................................266
Chester E. Finn, Jr.
Appendix
Author Biographies ...........................................................................................................280

1
Introduction: The Education Data Landscape
By Paul Manna
Paul Manna is an assistant professor in the Department of
Government at the College of William & Mary.
These days it seems nearly everyone in education is, or at least claims to be, guided by data. Elected representatives and agency officials seek evidence on the relationship between policy, school performance, and student success. Parents select houses based
in part on school quality in a particular neighborhood or town. Private foundations aim to support research that will reveal “what works” in education. Business leaders want to know that schools are preparing students for the workforce. Even vocal critics of test-based accountability are not necessarily anti-data. These critics suggest evaluating student, teacher, or school performance on a range of measures, rather than focusing primarily on test scores. Clearly, the No Child Left Behind Act (NCLB) has energized discussions of data, but other forces have contributed, too. The impulse for data-driven decision making is not unique to education, nor to the United States. Globally, governments have initiated management reforms to evaluate public programs based on performance.
1 It is difficult to enter a government office today
without being surveyed about one’s experience either on the spot or in a follow-up mailing.
A Byte at the Apple
2 3
Introduction: The Education Data Landscape
education data potentially available, the sources of those data, and their key uses and users.
Forms and Types Education data come in many forms that may make them useful for some purposes but not others. First, they can provide information about many different units of analysis. These could include, among others, students, parents, teachers, principals, classrooms, schools, school districts, states, or nations. An advantage of data sets with finer units of analysis (e.g., student- or teacher-level versus school-level) is that one can often aggregate more granular measures to reveal information about larger units. In other words, a government agency may have data from a specific school district with students as the unit of analysis. From that source one could create school-level and grade-level measures as long as each student record came with a school and grade identifier. Second, education data sets sometimes contain information about entire populations and other times they represent smaller samples. With the latter,
Being data-driven can mean different things to different people. Here it means making choices about what is best for students and schools based on hard (frequently quantitative) evidence, rather than anecdotes, impressionistic feelings, or prior commitments. Making those judgments begs an obvious question: Do we have the education data we need? And if not, why not? The four sections in this chapter begin a discussion about those questions, which subsequent chapters elaborate. The first section introduces key conceptual building blocks. The second identifies problems on the current education data landscape. The third section offers reasons for those problems. The fourth concludes by describing some persistent challenges and some thoughts on how to prioritize the nation’s education data needs. Before continuing, consider one useful definitional point at the outset. In colloquial terms, authors and speakers sometimes use “data” and “statistics” interchangeably even though these words represent different concepts. Data refer to pieces of information that one could gather from the world, while statistics are any quantities that one could compute from those data. For example, each year students generate thousands of data points when they take state tests in reading and math. From their individual responses one can generate a variety of statistics including test averages and standard deviations for particular classrooms, schools, districts, and states. Researchers may also merge test data with data about school characteristics, such as the number of certified teachers, dollars spent per pupil, and number of violent incidents in the school, to calculate correlations and regression coefficients. Those statistics can illustrate whether certain variables are associated with each other. This seemingly arcane technical distinction between data and statistics is important. The quality of education data is directly related to the quality of the education statistics that parents, teachers, principals, policymakers and others may calculate and then use as they make decisions. If our data are inaccurate, filled with noise, or actually measure something other than what we thought they were measuring, then the statistics we compute and the inferences we draw will not be useful, and may even do harm.
1. Dimensions of Education Data
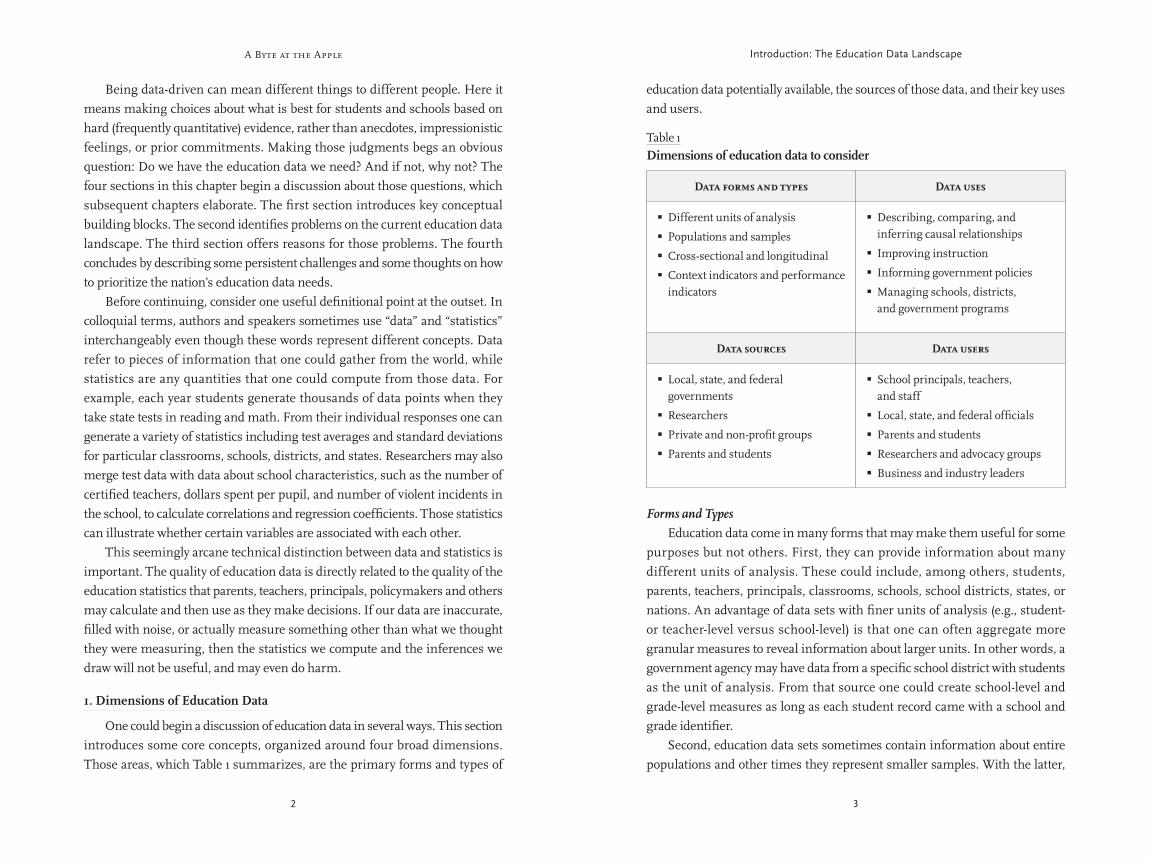
One could begin a discussion of education data in several ways. This section introduces some core concepts, organized around four broad dimensions. Those areas, which Table 1 summarizes, are the primary forms and types of
Table 1Dimensions of education data to consider
Data forms and types Data uses
Different units of analysis �
Populations and samples �
Cross-sectional and longitudinal �
Context indicators and performance �indicators
Describing, comparing, and �inferring causal relationships
Improving instruction �
Informing government policies �
Managing schools, districts, �and government programs
Data sources Data users
Local, state, and federal �governments
Researchers �
Private and non-profit groups �
Parents and students �
School principals, teachers, �and staff
Local, state, and federal officials �
Parents and students �
Researchers and advocacy groups �
Business and industry leaders �

A Byte at the Apple
4 5
Introduction: The Education Data Landscape
records, their extracurricular activities, and so on. State-level data might include indicators of state policies for teacher credentialing, the rigor of state standards for math, the amount of state aid that flows to school districts and schools, state performance on NAEP, and oodles of other measures. The National Forum on Education Statistics (NFES), a federal, state, and local effort sponsored by the National Center for Education Statistics (NCES), categorizes data elements like these into “context indicators” and “performance indicators.” Examples appear in Table 2. The first category is further broken down into two subcategories: system inputs and processes. System inputs involve policy actions like funding for classroom materials and teacher salaries, but also characteristics beyond schools themselves, including a student’s family background or economic status. Processes may include the courses students choose once they enter school, programs in which they participate, the size of their classes, the prevalence of violence in their schools, and the number of days students are absent. In practical terms, these process measures reflect a portion of the administrative or management data that schools, school districts, and states gather each day. Many of those data are generated for internal use,
usually there is some effort to draw a random sample, which, if done well, facilitates making inferences about an entire population of interest. The name of NCLB suggests a focus on entire populations, given the law’s stated desire to “leave no child behind.” In contrast, the National Assessment of Educational Progress (NAEP) uses student samples to infer how well students are doing nationwide, in individual states, and in some large school districts.
2
A third issue is whether data represent information from a particular moment or several different moments over time. The first approach, which produces cross-sectional data, is akin to taking a snapshot. Visiting all classrooms in a school in one day and documenting teachers’ practices would be an example. The second approach, more like a motion picture, produces longitudinal data and can be incremented in several different ways. In education, the school year is an obvious unit of time, but others exist, too. One could study teachers’ instructional practices by making repeated visits to a school, once every two weeks, for example. Cross-sectional data can be useful, but they have their limits. A snapshot could be misleading if it captures a non-representative moment. Also, drawing conclusions from cross-sectional data can be difficult without observations from some other moment as a basis for comparison. That impulse for comparisons has motivated calls for longitudinal data systems that measure individual student growth by tracking student progress over time. Those data can allow analysts to compute value-added scores, which measure how much students know at the beginning of the school year versus the end.
3 By measuring
individual students’ achievement at multiple points in time, parents and teachers are more likely to see whether they are improving, holding steady, or potentially regressing and in need of additional help. Despite their advantages, longitudinal data also have limitations. Most obviously, it is expensive to gather them. It also is not always clear what the best increment of time should be in a longitudinal study. Finally, longitudinal studies become less valuable if members of the target group leave the population or the sample. This is not likely when units of analysis are institutions, such as schools or school districts. But it can become a major problem in studying students, especially those in urban areas where classroom turnover can be very high. Fourth, education data capture different substantive aspects of the nation’s education system. Student-level data can include the students’ teachers, the reading programs they have used in class, their test scores, their attendance
Table 2Examples of context and performance indicators
Context IndicatorsPerformance
Indicators
Inputs Processes (short and long term)
Student racial �characteristics
Family economic �status
School expenditures �
Number of textbooks �available for courses
Student attendance �
Number of students �participating in programs
Class size �
Qualifications of �math teachers
Student achievement �on math and reading exams
School-level Adequate �Yearly Progress (AYP)
Graduation rates �
Rates of student �matriculation to college
Source: Adapted from National Forum on Education Statistics. Forum Guide to Education Indicators (NFES 2005-802). U.S. Department of Education, National Center for Education Statistics, 2005.

A Byte at the Apple
6 7
Introduction: The Education Data Landscape
including downloadable data sets, individual school report cards, published reports, and internal documents. Professional researchers are a second source of education data. These individuals may work in universities, independent firms such as RAND or Mathematica, and research and advocacy organizations such as the Education Trust. Sometimes they generate original data, though often they analyze data from government sources. Governments and private foundations spend millions of dollars each year supporting these data collection efforts. Some of their data are published for all to see, while other data, especially those that academics produce, remain proprietary, sometimes for several years until scholars publish articles or books using what they have gathered. Private sector and other nonprofit sector groups represent a third source of education data, again both as original producers and reporters of data that others generate. As part of their marketing campaigns, for example, private schools often report data showing their students’ test scores or their teachers’ qualifications. One popular education data source is the magazine US News and World Report, whose annual rankings of colleges and university programs are essentially considered required reading for college-bound students and university administrators concerned about their institutions’ reputations. Similarly, the College Board and ACT release annual reports detailing the participation and success of students taking college entrance exams. Real estate agents represent another group — important, but often overlooked — that can steer prospective homebuyers to data about neighborhood schools. Comprehensive websites, such as Greatschools.net, are also emerging that make school-level information easily available to anyone. Two final data sources are students and parents. The primary basis of a school’s Adequate Yearly Progress (AYP) status, after all, is annual student test results. Students and their parents sometimes provide systematic data to school leaders in course evaluations, school satisfaction surveys, and the general process of enrollment in school. (Macke Raymond’s chapter in this volume explores some innovative ways that these data might be gathered, maintained, and used.) Parents and students also possess anecdotal data about individual teachers and schools. That information, or “word on the street” from key parents in a neighborhood, can be incredibly valuable to other parents and students when families discuss which teachers or classes to take and which to avoid.
6
and help school leaders monitor the heartbeat of a school or district. They may also help these leaders fulfill reporting requirements that accompany state and federal education dollars.
4
In the past, those concerned with student achievement often complained that the United States had overemphasized process indicators and spent too few resources examining performance data. Before the rise of the standards and accountability movement in education, managers of education programs would spend much time documenting how much money a program spent and how many students participated, but less effort on whether students learned anything as a result. During the last two decades, and since 2000 in particular, student performance has received much more attention and more data to track it have become available.
Sources Education data come from several sources. First, the largest producers of education data are governments themselves. National governments around the world publish statistics on the state of education in their respective countries. In the United States, in fact, the federal government’s initial major role in education, other than administering land grants under the Morrill Act, was to gather and report data on education in the nation’s states and territories.
5
Within the U.S. Department of Education, the NCES and the Education Data Exchange Network (EDEN) carry on that tradition today, but other federal agencies, such as the Census Bureau, the Bureau of Labor Statistics, and the Department of Health and Human Services also gather and generate statistics relevant to education. These federal data represent the small tip of a large iceberg, though. Many of the data appearing in NCES reports are from lower levels of government. The federal government collates and aggregates those numbers into regular reports, such as the annual Digest of Education Statistics, but most data in those publications originate from some other source. States, school districts, and ultimately schools and teachers in individual classrooms produce the vast majority of education data that governments report, including how much districts spend on teacher salaries; the percentage of students attending Ms. Smith’s eighth-grade algebra class each day; the graduation rates at City High School; the number of students benefiting from Title I funding; or the proportion of K-12 education revenues that come from state sources. Those data are gathered and collected in several different media
A Byte at the Apple
8 9
Introduction: The Education Data Landscape
A second overall use of education data is to improve instruction. At the micro level, teachers constantly use data in this way. A very common tool here are grade and attendance books, which help teachers to see the trajectory of students’ performance across a marking period or semester. Short quizzes and exercises in advance of unit tests or final projects enable teachers to see which concepts are the most difficult for the entire class or individual students. Those intermediate quizzes and exercises are sometimes called “formative assessments,” while those coming at the end of a unit or major topic can be called “summative assessments.” Using data from both, teachers can make judgments about which instructional approaches might be working best, and which students could benefit most from different teaching methods or assignments. In recent years, individual schools have become more strategic in how they use formative and summative assessments to track students’ progress and improve instruction. Especially in schools with multiple teachers teaching multiple sections of the same class (e.g., three third-grade sections or four sections of advanced algebra), the use of formative and summative assessments has become increasingly systematic. In other words, schools can have teachers administer the same or similar assessments in order to obtain consistent measures of student progress. Those data can allow teachers and school administrators to determine which instructional strategies, class materials, and teachers seem to be most effective, and which children need the most additional help. When assessments are analyzed item-by-item or concept-by-concept, teachers may also begin to realize that they all are having similar difficulties teaching certain topics to certain groups of students. With those problems identified, schools can better target their professional development activities. Third, education data can inform specific policies and practices that governments and schools develop. In legislatures and school board rooms, public officials use education data as they set funding priorities and design specific programs. Sometimes education laws, such as Title I of NCLB, contain formulas that determine how money will be allocated. Data on key conditions in states and districts, such as the level of poverty and number of students, will largely determine the level of funding that these places receive. Clearly, the use of data and accompanying statistics are not the only or even necessarily the key factor in policy deliberations. Politics and ideology also assert influence, but dispassionate examinations of data can enter the
Uses and Users Many different people use education data for numerous purposes. A first broad use, which carries over to the other uses described shortly, simply is to describe, compare, and infer causal relationships between measures. How many fourth graders attend New York City Public Schools? How much money did Wisconsin spend on facilities upgrades in rural school districts? Even these seemingly straightforward questions sometimes elicit conflicting answers. The different producers of education data sometimes disagree over the appropriate way to measure a particular indicator. For example, NCLB enables parents to transfer their children from schools that their state describes as “persistently dangerous.” Given how states define that term, only 46 public schools in the nation received that label for the 2006 – 07 academic year. No doubt more schools would have made that list if parents, students, or school security officials had been surveyed to determine whether schools are “persistently dangerous.”
7
Descriptions often become especially powerful when they compare particular groups of students, teachers, schools, states, and even nations. Today, for instance, education data frequently show that white students outperform black and Hispanic students on standardized tests; that students from Asian and several European nations tend to take more rigorous mathematics and science courses than American students; and that the nation’s most disadvantaged students often have the least experienced teachers when compared with their more advantaged peers. Analyzing education data using more advanced statistical techniques, beyond simple descriptions, can enable analysts to infer causal relationships between different variables. Data show, for example, that disadvantaged students tend to have teachers with less experience and who have less training in their subjects. Does that matter? Research strongly suggests it does. When provided with experienced and knowledgeable teachers, even students who otherwise struggle can make large achievement gains.
8 Do private school
vouchers work? Here the answer depends on what one means by “work.” Much agreement exists that parents whose children use vouchers express higher levels of satisfaction with schools than parents who do not choose their children’s schools. But efforts to pinpoint gains in student achievement due to vouchers have produced hotter debates, with some sources reporting clear gains and others seeing no statistically discernible effects.
9
A Byte at the Apple
10 11
Introduction: The Education Data Landscape
home of the nation’s oldest publicly-funded school voucher program, hundreds of parents rely on data from the Milwaukee Policy Forum, a local think tank. Each year, the Forum produces a publication for parents that systematically describes basic characteristics of each Milwaukee private school participating in the voucher program.
11
Other people may be more interested in aggregate data that show the performance of individual schools, school systems, states, and the nation as a whole. Elected officials, policymakers in legislatures or government agencies, and analysts at universities and think tanks have already been mentioned here. Other individuals meriting attention are local, state, and national business leaders. Among others, groups such as Achieve, a network of governors and business leaders, and the Business Roundtable, made up of CEOs from the nation’s largest companies, have become increasingly interested in educational quality, and crave hard data to reveal how the nation is performing compared to its economic rivals.
2. Potential Problems with the Data We Have
Being data-driven requires, above all, good data. Unfortunately, as seasoned data users will attest, problems frequently exist with education data. Those problems fall into two broad categories: availability and quality. Reasons why they exist appear in the next section. For now, this section simply describes those problems in further detail.
Data Availability For most of American history, little information was available about students, schools, and school systems. Schools were classic “coping” organizations, to use Wilson’s term,
12 in which school leaders, parents, and policymakers — the
proverbial overseers of public schools — possessed little systematic information on daily classroom activities and did not know how much students were learning. As the cliché goes, once the teacher closed the door, it was anyone’s guess about what was happening inside. Stricter accountability for student and school performance has changed that in many communities, and, some would argue, has pushed things to the opposite extreme. Schools in some places now resemble Wilson’s “production” organizations, where scripted lesson plans and evidence of their completion dictate every minute of the day, and students are assessed at regular intervals.
conversation nevertheless. 10 Today there is even a growing interest in using
large scale policy experiments to evaluate the effectiveness of programs or instructional techniques. Does that reading program work? And if so how much of a benefit does it provide to students, compared with others who were not exposed to the program? Policymakers seeking to devote resources to “what works” in education are particularly interested answering those questions. Fourth, public officials at all levels gather and report data to help them manage schools, school systems, and government programs. Although descriptive data on achievement gaps may grab the education headlines, most descriptive data are used for these more mundane, yet still important, purposes. As noted earlier, local officials generate many process indicators that track the regular operations of schools and entire districts, including data such as student and teacher attendance, the size of the student body, fuel consumption of a district’s bus fleet, and weekly supply orders for school cafeterias. Other management data capture the flow of funds over time into and out of particular programs or activities. The high school debate team might spend $1,000 for weekend tournament travel, and later that month receive a $100 donation from a local business. On a larger scale, hundreds of thousands of dollars in federal Title I money may support a schoolwide Title I program. District budget offices monitor those finances and generate regular reports that help administrators assess the overall financial situation of their schools. Eventually, many of these management data are collated into reports that local districts assemble and send to state authorities for oversight purposes. Once in state capitals, some of those reports are collated again and then forwarded to various federal agencies for the same purpose. Many of these management measures are invisible to the casual observer, and even to education researchers or politicians who might otherwise follow education rather closely. As this entire section implies, the users of education data can be as diverse as their uses. Parents, like teachers and other school staff, examine data that describe their children’s performance, and even compare it with the performance of other children by examining percentile scores from state tests or college entrance exams. In choosing where to live or send their children to school, parents also can consult individual school report cards or data collections that independent groups maintain to help them make wise choices about public and private schools in a community. For example, in Milwaukee, Wisconsin,
A Byte at the Apple
12 13
Introduction: The Education Data Landscape
teachers and students, and teachers discuss results with a data coach, usually a colleague from their school. Early reviews from teachers are positive, and the assessments, known as FAST-R, which stands for Formative Assessments of Student Thinking in Reading, are undergoing a formal evaluation.
16
The NCLB requirement that schools and school districts make AYP provides another example of the timing problem. Ideally, schools not making progress based on last year’s performance would learn that fact well before the next school year begins. That way, schools and districts could better implement the remedies that NCLB requires when schools persistently fail to achieve AYP goals. Those remedies can also require parental involvement, as in schools where students qualify for NCLB-sponsored school choice, which allows a student to transfer to another public school, or in schools where students are eligible for free tutoring, called “supplemental educational services.” Parents learning of these options at the last minute as a new school year begins may be reluctant to exercise them. It could be disruptive to move their child to another school or to rearrange child care providers to accommodate a tutoring schedule. Unfortunately, most states publish their final AYP data during late summer or later.
17
Data Quality Even when data are available, they can be of questionable quality. Discussions of quality center on two main issues. First, some concepts are simply difficult to measure with much accuracy because they are multidimensional or complex. Getting good data on a student’s “innate ability” for particular subjects or even gathering measures that properly identify students with certain learning disabilities is challenging.
18 Researchers or analysts sometimes say things like “We
don’t have quality measures of X,” by which they often mean that certain concepts are simply hard to capture. Those quality problems are difficult to remedy. Second, quality may suffer if limited resources are available for data collection or data are not carefully verified for accuracy. In this instance, the concepts or topics may not be intrinsically complicated to measure, such as how many students took algebra classes last year or the professional credentials of a district’s teachers. But data still may be poor in quality if the crucial tasks of data entry and maintenance of data systems or virtual data warehouses receive little support. Data may also suffer from problems of validity and reliability.
19 “Validity”
means that an indicator actually measures what we think it measures. A
A lack of systematic data in education has had important consequences. Where data are nonexistent, decisions about instruction emerge from impressions or anecdotes about what works, or worse, folk wisdom and prior commitments to teaching strategies or ideologies that have never undergone rigorous examination. Limited or no data on student performance often left child advocates with little concrete evidence of the harm caused by persistent and glaring educational inequities. For example, in its famous school funding decision, San Antonio Independent School District v. Rodriguez (1973), the U.S. Supreme Court argued that attorneys representing local students were unable to show that funding differences across districts had an impact on student performance. Among other things, the emergence of testing data has reenergized advocates for disadvantaged children, some of whom are now using test scores to document what the lawyers in 1973 could not show.
13
Limited data availability can also hamper teachers’ efforts to design instruction to help their students master crucial content and skills. A diligent fifth-grade teacher studying the end-of-course math results of last year’s fourth graders will have some idea about each student’s preparation. But the teacher might prefer item-by-item or concept-by-concept breakdowns of student scores to help him target his instruction where students are weakest. Research has shown great value in looking behind overall scores to investigate these details. And some school districts have designed reporting systems to provide these data to teachers.
14
Timing is another dimension of the availability problem. Even when education data and statistics exist, sometimes they are unavailable when parents, teachers, and principals need them most. That can neuter their impact and sow frustration, given the huge effort required of teachers and school support staff to gather data in the first place. One reason classroom teachers sometimes complain about state-mandated testing, for example, is that students typically take tests in the spring, too late for their current teachers to use the results. Testing that provided these teachers information in real time would be more useful for nipping potential problems in the bud. As one Washington, D.C. teacher observed, “You should really give [tests] every five weeks, starting at the beginning of the year…That way, you can adapt right away, instead of saying at the end of the year: ‘Oh, I’m sorry you didn’t make proficient.’”
15 Some
schools in Boston have begun experimenting with more regular assessments for that purpose. These tests are systematic but carry no consequences for

A Byte at the Apple
14 15
Introduction: The Education Data Landscape
into individual schools. This occurs, for instance, when districts use a technique called salary cost averaging. Even though teachers in a school district can earn different salaries based on their level of experience and other factors, for accounting purposes, districts sometimes assume that all teachers in a school earn the same amount. As Hill and Roza state, “Urban districts calculate school budgets using average teacher costs. Thus, in a district where teacher salaries range from $25,000 to $65,000 annually, all teachers are assumed to earn some average amount, say, $45,000.”
24 Salary cost averaging
can foster cross-school funding inequities that are invisible to casual observers of district budgets.
3. Reasons Why Education Data Problems Exist
Improving the availability and quality of education data will require overcoming several technical, institutional, human, and political challenges. Table 3 summarizes four main interrelated obstacles that affect the United States as it struggles to produce better education data.
Capacity Limits Capacity limits are an initial reason why problems exist with education data. One should interpret the word “capacity” here in a broad sense. It includes money, but also human and organizational resources, such as the prevalence of well-trained people working in well-functioning bureaucracies, and the availability of modern computers and software systems to manage data. Often capacity is merely defined in financial terms, which is too limiting as the following examples illustrate.
school’s high score for teacher quality should mean that the school does, indeed, possess high quality teachers. The score from a math exam written in Russian but administered to an English speaker would likely not be a valid measure of the person’s math ability. Rather, it would really be demonstrating that the person does not understand the Russian language. “Reliability” refers to the ability of a measurement technique to perform consistently during repeated uses. In some states, for example, tests used to gauge the proficiency of a school or district’s students in reading and math are not reliable indicators of performance over time. That is because state policymakers have sometimes changed the cut scores needed for students to score at proficient levels, or they have kept the same cut scores but altered the difficulty level of the questions appearing on the test. Therefore, the state’s test results would not be reliable measures of performance from one year to the next. Variation in state tests across years and across states is one reason why the federal NAEP exam provides the most reliable measure of student achievement across time and across state lines.
20
At the classroom level, the proliferation of informal district- and school-designed diagnostics to gauge student progress should also raise these validity and reliability concerns. As one RAND report has concluded, policymakers “would benefit from a better understanding of the reliability and validity of progress test results, which are a popular yet relatively under-researched type of outcome data in districts across the country. Educators appear to be making fairly important decisions based on these data, yet we know very little about the quality of these tests, particularly those developed in-house by school districts.”
21
Education finance is another area where data quality complicates analysis. A common measure that public officials and researchers consider is per-pupil spending. At the school level, at least, there is much debate over whether more money produces better results. Based on examinations of case studies, though, researchers know that how schools and school districts use money can matter for the results they produce. But unless the way dollars are spent is measured consistently across schools, it is difficult to deepen our understanding of how money matters.
22
Further complicating the issue is that reported budget statistics obscure the school-level realities. Roza and Hill’s work on within-district spending inequities is instructive here.
23 Because of how school district offices calculate
and report district budgets, their figures can misstate the resources flowing
Table 3Key sources of the nation’s education data problems
Limited human, organizational, and financial capacity �
Fragmented governance, both vertically (e.g., many levels of government) and �horizontally (e.g., many different programs administered at each level)
Diverse preferences and incentives of data users and data producers �
Political disagreements, incentives, and trade-offs �
A Byte at the Apple
16 17
Introduction: The Education Data Landscape
pass more laws that create more reporting requirements for schools and state agencies. For instance, states have done an inconsistent job of monitoring and reporting performance data on NCLB supplemental services providers. It is also difficult for outsiders using state data to determine precisely how many schools are at different levels of improvement status. How many are offering public school choice or supplemental services? Of those that have entered corrective action or restructuring, what precisely have they done? Those latter two points are particularly important because NCLB allows many options at the corrective action and restructuring phases, and in many cases those labels imply more change than is actually occurring.
27 Knowing what schools have done is crucial
in order to tie policy interventions to changes in student achievement. When test scores exist, but data on school policy changes do not, then one cannot draw larger lessons about which interventions are most promising. Complicating matters is that state agency capacity is not the only factor creating problems with education data. The experiences of some states have raised questions about the nation’s more general capacity to accurately administer and score the millions of tests that students take each year. States frequently rely upon private contractors to score and compile results. Debates are now underway about whether the nation’s testing industry itself possesses the capacity to meet the needs of its state clients.
28
Facing these and other capacity challenges becomes even more difficult when local or state expectations change. It is neither cheap nor easy to develop a data collection system, train individuals in the field to use it, and then communicate adjustments along the way. Difficulties can snowball if current systems must adapt, rather than simply be built anew. State and local education agencies are presently experiencing such a transition challenge as they try to meet new data collection requirements of the Individuals with Disabilities Education Act (IDEA).
29 The 2004 reauthorization of IDEA requires performance plans and
reports in 20 different indicator areas. While some indicators represent data that states were already gathering, some do not. And further, the “new methods of analyzing the information have required a thorough overhaul of how states collect, compile, and analyze data on students with disabilities.”
30
Fragmented Governance The fragmented governance of American education is a third factor undermining the quality and availability of education data, a topic that
At the grass-roots level, schools frequently rely upon teachers themselves to collect valuable data, often the management data that monitor the daily pulse of a school. Those responsibilities can burden teachers or even clash directly with their instructional prerogatives. A classic example is the common requirement for teachers to post an attendance sheet outside their classroom doors within 15 minutes of class beginning. The goal of that data collection effort — to develop a timely record of student attendance so school offices can call parents when students miss class — can interfere with instruction during a class’ crucial start-up time. Most teachers would rather focus on building momentum for the day’s lesson than tending to this administrative task. And some, no doubt, fail to record attendance carefully and accurately because they are focusing on instruction. School secretaries, often the front-line workers in the nation’s system of education data collection, face similar pressures to juggle many tasks at once. As one source puts it:
“We want trained data-entry personnel who work in an environment that assists, not
hinders, data entry. When people are doing important work, we want them to concentrate
on the task. We do not expect, for example, the person preparing our tax returns to be eating
lunch or talking on the phone with clients while entering our itemized deductions into a
computer. However, those may be the conditions of a school secretary’s life. And remember,
bad data about a student or school can cause bigger problems than a lost tax refund.” 25
Ironically, some of the lowest-paid and most overworked school staff often perform the critical task of data entry. Everyone interested in data quality should take pause when a secretary’s daily to-do list gives data entry the same priority as scheduling custodians to change light bulbs or answering calls from vendors trying to sell the school drinks for its vending machine. At higher levels of government, state agencies have strained to meet the data demands accompanying the country’s embrace of educational accountability. One recurring problem is errors in the computation and release of state test scores. An example is the disaster that Illinois experienced in calculating scores and AYP results from testing during the 2005 – 06 school year. Students and schools received those scores in March 2007, though they were supposed to have been available well before the 2006 – 07 school year began.
26
A related, but less frequently discussed, capacity problem concerns the overwhelming number of policy variables that states might potentially track. Those variables can accumulate quickly as federal and state policymakers

A Byte at the Apple
18 19
Introduction: The Education Data Landscape
something Wyoming districts previously had not tracked. 33
This example illustrates one specific case of how the construction and method of monitoring different school processes can vary by state. That complicates matters for anyone interested in aggregating and then comparing how different programs unfold. Because not all states use the same definitions and software packages for gathering these management data, it is not surprising that efforts like the new IDEA data rules can take many months, even years, to implement. Fragmentation not only creates complicated data demands for local schools, it also fosters technical complexities. Usually there are not seamless connections between the software packages and databases that schools, districts, and states maintain. This might prevent school leaders from examining relationships between a school’s finances, teaching staff, student performance, and student family characteristics. It may be impossible, or nearly impossible without tremendous effort, to build merged data sets from these different areas of school operations because the different software systems used to manage data in each area cannot communicate. Presently, several groups are hard at work attempting to overcome these software integration problems. For example, the Schools Interoperability Framework Association (SIFA) is an umbrella group containing over 1,400 members — software vendors, school districts, state departments of education, and others — who are addressing the integration issue. The group is developing standards and procedures to facilitate the sharing of education data across different software platforms.
34
Further, the growth in use of individual student identifiers may attenuate the present fragmentation problem.
35 At a very basic level, states will be less
likely to lose track of students who move from one district to another, but identifiers will also allow districts to streamline the administrative tasks associated with incorporating new students from other districts into their data systems. (Problems associated with students moving from state to state will still remain, however.) The identifiers will also create a way to bridge gaps among program silos. In an ideal world, local and state education officials could touch a button and see a student’s complete history of program participation, test scores, teachers in each grade, and disciplinary records. Today, even schools and districts with the most advanced data systems are far from this ideal situation, but the development of identifiers is a step in the right direction for dealing with the horizontal and vertical fragmentation that plagues the system.
36
Kenneth Wong explores more deeply in his chapter. This fragmentation has two dimensions. A vertical dimension exists because the American intergovernmental system has many layers that must somehow work together to share information. One federal government, 50 states, approximately 14,200 school districts, and over 90,000 schools all play some role in producing quality data. A horizontal dimension is present due to the dozens of programs that governments have adopted to address children’s needs. Writers often use the term “silos” to characterize these different programs, which typically operate in school districts as parallel but rarely intersecting administrative systems, creating serious problems for public officials, researchers, and even school administrators themselves interested in analyzing education finance (or other) data. Roza and Hill nicely summarize the silo problem as follows:
Tracking money is a huge challenge for school districts for many reasons: Their revenues
come from many sources (state, local, federal, and philanthropic) at different times. Funders
require separate record-keeping for each program, and their rules about cost accounting differ.
Districts therefore maintain separate accounting systems for funds from different sources, and
information is often kept on separate computer systems, bought and programmed at different
times, so they cannot talk to one another. 31
Such confusion has important consequences. Superintendents struggle to know exactly how much money resides in district coffers. Accounting systems become so complex that very few, if any, individuals truly understand how they work. The vertical dimension involving many layers of government is partially to blame for delays and strained data capacity at the state level. Intergovernmental dynamics contributed to Illinois’s problem with its test scores for 2005 – 06. The state’s data system, which generates results for subgroups of students, required that local districts accurately submit student demographic data. The contractor compiling the results found that demographic information to accompany approximately 11,000 tests was either missing or incorrect.
32
Similarly, the IDEA reforms mentioned earlier have challenged some states and local districts to better coordinate their efforts. For instance, even though Wyoming had a “pretty good infrastructure in place” for data collection, according to the state’s director of special education, state officials needed at least a year to help local districts address the new reporting requirements. In particular, the IDEA data rules call for information on student suspensions,

A Byte at the Apple
20 21
Introduction: The Education Data Landscape
requirements as public schools makes some people oppose publicly-funded voucher programs. Private schools respond that it would fundamentally change the character of their institutions should they become subject to the same regulatory requirements that govern traditional public schools. Even though some private schools publish data about their internal characteristics and student performance as part of their marketing strategies, most would resist government efforts to compel them to do so. A last illustration reveals disagreements that sometimes occur between researchers on one side and school officials, parents, or elected representatives on the other. Specifically, researchers’ desires can clash with laws designed to protect student and family privacy, a topic that Chrys Dougherty addresses in his chapter. Even though researchers typically are not interested in data sets containing personal identifying information such as student names (anonymous identification numbers usually will suffice), student-, parent-, or teacher-level data often require great effort to obtain, if they are made available at all.
39 One can understand the school district’s impulse to play it safe. Why
release data that might prompt a future lawsuit from parents? A related issue is studies that attempt to gather education data from randomized field experiments. Returning to the school choice example, much ink has been spilled in methodological debates over whether the results from voucher programs are biased because of selection effects.
40 In other
words, parents opting for a voucher are typically unlike parents who would not consider one, which raises questions about whether student success in those programs is more driven by family-level variables than voucher use. A powerful way to sidestep the methodological debates about selection would be to run a large experiment involving all students in a district where some were randomly assigned to use a voucher and the others were not. The problem with such a plan, assuming that the political obstacles to it could be surmounted (a huge assumption!), is that families may not like the category to which they are assigned, and they would likely try to have their assignment changed. Unfortunately, tampering with the integrity of the treatment and control group would undermine the potential power of the experiment. Really, one could broaden that voucher discussion to include any situation in which researchers would like to run a controlled experiment to test the effects of a particular educational intervention. Not only does that raise equity questions for many people, but the entire notion of using children in research
User and Producer Preferences Education data are imperfect in part because there are so many potential data users and producers whose incentives and interests can clash. Put another way, quality and availability really have different meanings for different people. One assistant superintendent, for example, distinguished between “trailing” data, including state test results and other relatively older measures that are not very useful in real time but could be valuable to program overseers, and “leading” data, such as those from district diagnostics that a teacher or principal could use on the spot to adjust classroom practices.
37
Overall, one person’s data garbage can be another’s treasure, as an example from federal policy illustrates. Pullout programs funded through Title I of the Elementary and Secondary Education Act (ESEA) have been a popular method to address the needs of disadvantaged students. But the idea that needy students should miss time from their regular classes to participate in these programs was never clearly motivated by strong empirical evidence that the benefits would outweigh what the students would miss from their regular classrooms. So why do pullouts? A management concern of local school districts and states largely motivated the concept. School officials could more easily prove to program auditors that Title I funds supported disadvantaged students if pullouts were used because districts then had expenditure data showing that the dollars funded staff and supplies for Title I classrooms.
38
The data system and instructional model that emerged from pullouts served budget makers and grant program managers well, but had little grounding in research about what would most help disadvantaged students. To return to earlier concepts, the data system produced management data that were context indicators, but not performance indicators. Elected officials also reaped political benefits from this model because they could describe specifically how federal dollars supported hiring new teachers and purchasing materials in home districts. The question of whether students were actually learning more became lost amidst these other concerns. An overall lesson from this example is that dangers ensue when the data collection tail wags the classroom instruction dog. Debates over school choice provide additional examples of diverse preferences among data producers and users. While data concerns are not the only (or even the main) issue animating school voucher discussions, the fact that private schools are not required to abide by the same reporting

A Byte at the Apple
22 23
Introduction: The Education Data Landscape
million and $3 million dollars per state, over several years of implementation. That does not include annual maintenance of these systems at the state level, which was $360,000 in Wisconsin and $200,000 in Utah. Local districts would also incur additional costs, which, in most cases according to the study, were “absorbed by having existing staff work overtime, delaying other projects, and shifting responsibilities.”
43 Those expenses can be a difficult political sell
in states or communities where political pressures exist to funnel scarce dollars to the classroom, rather than building valuable technical capacities in state or local agencies. The unfortunate reality is that few, if any, politicians build their careers around helping government bureaucracies develop and sustain the technical capabilities to do their jobs well.
44 Politically speaking, elected officials get
more mileage out of promoting a new reading program, without mentioning, of course, that its design (engendering yet another program silo) will create more paperwork for civil servants charged with gathering data on the program’s administration and performance. Simply not wanting to know what the data show is another political calculation that can undermine the availability and accuracy of education data. For example, due to political calculations among Wisconsin Republicans and Democrats, public funds for monitoring and evaluating the Milwaukee Parental Choice Program (MPCP), the nation’s oldest publicly-funded school voucher program that began in 1990, were eliminated after 1994. That created a gap of over a decade for which no evaluation data exist on the program. Fortunately, a new comprehensive evaluation, which will gather data on several dimensions of the MPCP, is presently underway.
45
At the federal level, legislators interested in making funding decisions based on data and program performance can generate resistance when their efforts collide with otherwise popular initiatives. A proposal in 2007 to launch an experimental evaluation of the effectiveness of the federal Upward Bound program prompted such criticism from Senator Tom Harkin (D-Iowa) who said, “Young people deserve to know that programs like Upward Bound will be there for them as they climb that ladder and that they will not lose that access for the purpose of an evaluation.” Harkin formally expressed his opposition by presenting an amendment to the Higher Education Amendments Act that “would bar the department [of education] from forcing Upward Bound programs to participate in evaluations that deny services to control-group
experiments to test particular interventions would be a hard sell in many communities. Those feelings may exist despite there being no systematic evidence showing that the treatment that children in the control group are denied produces educational benefits. Creative researchers have managed to work within such constraints by identifying or helping to administer quasi-experiments that approximate the randomized control and treatment groups present in an experimental setting. Still, valuable data from true experiments are relatively few and far between in education.
Politics Political considerations are a final factor that help account for the nation’s education data problems. The case study of California in RiShawn Biddle’s chapter provides one example. The political components of data collection and use permeate the previous three sections on capacity issues, governance, and user and producer preferences. For example, the nation has such a fragmented system of education governance due to constitutional arrangements and its long political tradition of decentralization.
41 Establishing a more unitary system
with a powerful national ministry of education, common in many European and Asian countries, would help streamline the collection of education data, but would be next to impossible to implement given constitutional concerns and the nation’s aversion to a strong federal presence in K-12 education (NCLB notwithstanding).
42
Politics also contribute to the capacity problems that prevent government agencies from becoming more proficient collectors and managers of data. The political slogan that education dollars should go directly to “the classroom” and not “bloated bureaucracies” does contain a grain of truth. But taken too far, as it often is, that view can justify limiting federal, state, or local investments to modernize data systems, hire talented information technology personnel, and maintain the needed support systems to help schools and teachers gather and use education data. These are costly expenses that typically receive less attention than they deserve in legislative hearings and debate. Consider, for example, a study from the Data Quality Campaign that estimated the expense associated with creating a unique student identifier at the state level. Such a tool would allow states to track individual students from their first day of school until graduation. Based on the efforts of leading states, this study estimated that such a system would have annual costs of between $1
A Byte at the Apple
24 25
Introduction: The Education Data Landscape
data it needs. Even if creative leaders managed to corral those forces, at least four persistent challenges would remain. First, on the policy side, there will always exist more education initiatives than can be tracked systematically in great detail. In allocating scarce resources, governments, researchers, and foundations will have to decide which policies or activities most merit detailed and sustained attention. Second, on the results side, perhaps the most valuable data about students — the ultimate outcomes and accomplishments of their lives — are hardly ever available. In other words, most data collection in education resides between the bookends of a student’s kindergarten through 12th-grade worlds. Schools and school districts (and in turn, their state and federal overseers) know very little about what happens to students once they complete their studies and move on. Did students who learned from a particular curriculum or who had certain teachers eventually live happy, enriching, and productive lives? We have scant evidence on those issues in part because tracking students over their entire lifetimes is incredibly difficult and expensive.
50
Third, in terms of policy and results, education data emerge from the unfolding of human systems. Those systems are unlike data generated by an electron accelerator or in a chemist’s lab. Chemical reactions in a test tube will proceed in a predictable way regardless of whether a scientist has the flu. In contrast, a student who is upset or suffering from a nasty cold will likely perform worse on her state reading test. There will always be some degree of noise in education data because of human factors. A key for researchers and governments is to try to minimize the noise factor, or better account for it along the way.
51
Fourth, even if the nation possessed the education data it needed, individuals who matter would have to act upon those data in consequential ways.
52 Parents would have to use data to inform their discussions with school
personnel. Teachers and principals would need to use data to inform their classroom choices. Policymakers would have to make data a larger part of their policy deliberations. And voters without children in the schools would have to consider the data when they hold their representatives accountable for the performance of the public education system. There is no guarantee that simply having better data will make all or any of these things happen. Getting the education data America needs will not be easy. But it is worth noting that creative people in societies across history and the globe have successfully confronted similar problems. In 19th-century England, for
students.” In the end, Harkin won and Congress eliminated funding for the random-assignment study.
46
Greater data transparency can create political push-back when it proves embarrassing to officials who have resisted examining long-standing programs or practices more carefully. Despite some of the reasonable criticisms hurled at NCLB, for example, the law’s emphasis on releasing data by student subgroups has revealed startling facts about some schools and districts with otherwise favorable reputations. When student achievement had been evaluated considering grand averages that lumped all students together, many schools looked as if they were performing quite well. But breaking out those averages into subgroups has revealed that some of these model districts were actually failing their poor and minority students in large numbers. Now, armed with those data, public officials at all levels of government along with parents and their supporters are much better positioned to push for changes that will meet these students’ needs. The result is that these previously celebrated schools and districts are now feeling accountability pressures and are experiencing greater scrutiny.
47
In considering politics and data, one should also remember that education policy does not exist in a vacuum. Proposals to improve data collection must compete for resources with other areas including public safety, environmental protection, and health and human services. Cross-cutting issues, such as concerns over protecting personal privacy and the integrity of data systems, also affect education policy.
48 Privacy concerns are at the center of discussions
about how states and their affiliates may use student-level information that were originally generated in local schools but now reside in state-run longitudinal data systems.
49 When governments attempt to write general rules to protect
individuals’ privacy, some requirements will seem to make little sense when applied to education. Gathering research data through the use of human subjects is one such area. Many of the rules governing the use of human subjects were originally designed with medical research in mind, which involve invasive physical procedures that can be matters of life and death. While some of those rules are appropriate for the collection of education data, others are not.
4. Looking Ahead
Diverse user and producer preferences, capacity limits, fragmentation, and politics are major reasons why the nation does not have the education
A Byte at the Apple
26 27
Introduction: The Education Data Landscape
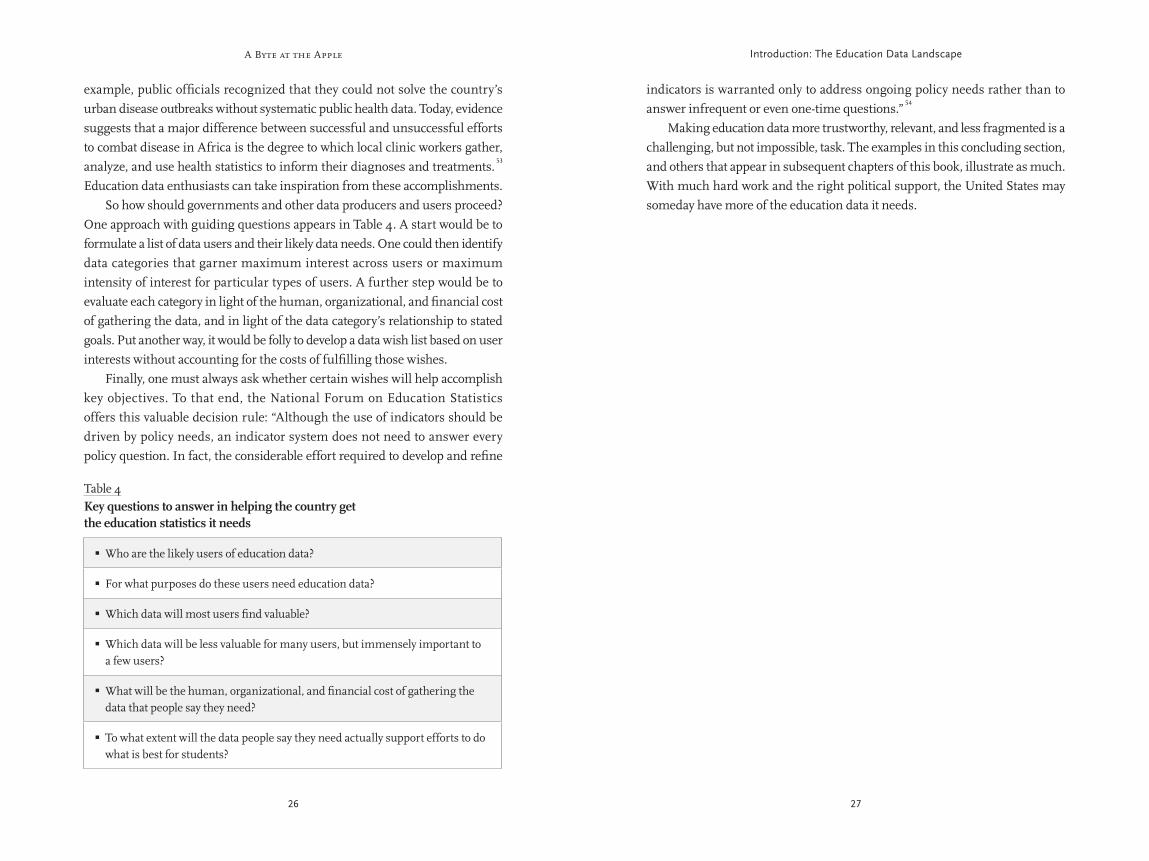
indicators is warranted only to address ongoing policy needs rather than to answer infrequent or even one-time questions.”
54
Making education data more trustworthy, relevant, and less fragmented is a challenging, but not impossible, task. The examples in this concluding section, and others that appear in subsequent chapters of this book, illustrate as much. With much hard work and the right political support, the United States may someday have more of the education data it needs.
example, public officials recognized that they could not solve the country’s urban disease outbreaks without systematic public health data. Today, evidence suggests that a major difference between successful and unsuccessful efforts to combat disease in Africa is the degree to which local clinic workers gather, analyze, and use health statistics to inform their diagnoses and treatments.
53
Education data enthusiasts can take inspiration from these accomplishments. So how should governments and other data producers and users proceed? One approach with guiding questions appears in Table 4. A start would be to formulate a list of data users and their likely data needs. One could then identify data categories that garner maximum interest across users or maximum intensity of interest for particular types of users. A further step would be to evaluate each category in light of the human, organizational, and financial cost of gathering the data, and in light of the data category’s relationship to stated goals. Put another way, it would be folly to develop a data wish list based on user interests without accounting for the costs of fulfilling those wishes. Finally, one must always ask whether certain wishes will help accomplish key objectives. To that end, the National Forum on Education Statistics offers this valuable decision rule: “Although the use of indicators should be driven by policy needs, an indicator system does not need to answer every policy question. In fact, the considerable effort required to develop and refine
Table 4Key questions to answer in helping the country get the education statistics it needs
Who are the likely users of education data? �
For what purposes do these users need education data? �
Which data will most users find valuable? �
Which data will be less valuable for many users, but immensely important to �a few users?
What will be the human, organizational, and financial cost of gathering the �data that people say they need?
To what extent will the data people say they need actually support efforts to do �what is best for students?

A Byte at the Apple
28 29
Introduction: The Education Data Landscape
Endnotes
Kettl, Donald F. “The Global Revolution in Public Management: Driving 1
Themes, Missing Links.” Journal of Policy Analysis and Management 16 no. 3,
1997; Kettl, Donald F. “Public Administration at the Millennium: The State of
the Field.” Journal of Public Administration Research and Theory 10 no. 1, 2000.
Information on NAEP is available here: http://nces.ed.gov/nationsreportcard/.2
The state of Tennessee has been a pioneer in using longitudinal data. Much 3
credit goes to researcher William Sanders and the value-added data system
he developed. See Sanders, William L. and June C. Rivers. “Cumulative and
Residual Effects of Teachers on Future Student Academic Achievement.”
University of Tennessee, Value-Added Research and Assessment Center, 1996;
and Robelen, Erik. “Tennessee Seeks to Use Students Tests to Show Teacher
Quality.” Education Week, May 7, 2003.
See http://nces.ed.gov/forum/. For the NFES’s indicator categorization 4
scheme see: “Forum Guide to Education Indicators (NFES 2005-802).” U.S.
Department of Education, National Center for Education Statistics, 2005 pp. 16-
18. The NFES notes that not all indicators fall cleanly into these categories. Their
placement can vary depending on their use.
The Organic Act of 1867 stated: “That there shall be established in the city 5
of Washington, a department of education, for the purpose of collecting such
statistics and facts as shall show the condition and progress of education in the
several states and territories, and of diffusing such information respecting the
organization and management of schools and school systems, and methods of
teaching, as shall aid the people of the United States in the establishment and
maintenance of efficient school systems, and otherwise promote the cause of
education throughout the country.” Quoted in Vought, Sabra W. “The Library of
the Federal Office of Education.” Peabody Journal of Education 12 no. 1,
1934 p. 21.
A seminal work on these parent and family discussion networks is: 6
Schneider, Mark, Paul Teske, and Melissa Marschall. Choosing Schools:
Consumer Choice and the Quality of American Schools. Princeton, NJ: Princeton
University Press, 2000.
Maxwell, Lesli A. “IG Report Questions NCLB’s Unsafe-Schools Option.” 7
Education Week, August 15, 2007.
A nice summary of this literature appears in: Haycock, Kati. “The Elephant 8
in the Living Room.” Brookings Papers on Education Policy. Ed. Diane Ravitch,
Washington, DC: Brookings Institution, 2004; and Wayne, Andrew J. and Peter
Youngs. “Teacher Characteristics and Student Achievement Gains: A Review.”
Review of Educational Research 73 no. 1, 2003.
On parent satisfaction see Gill, Brian P. et al. 9 Rhetoric Versus Reality: What We
Know and What We Need to Know About Vouchers and Charter Schools. RAND,
2001. For conflicting accounts over student achievement in Milwaukee see
Greene, Jay P., Paul E. Peterson, and Jiangtao Du. “Effectiveness of School
Choice: The Milwaukee Experiment.” Education and Urban Society 31 no. 2,
1999; Rouse Cecelia. “Private School Vouchers and Student Achievement: An
Evaluation of the Milwaukee Parental Choice Program.” Quarterly Journal of
Economics 113 no. 2, 1998; Witte, John F. The Market Approach to Education: An
Analysis of America’s First Voucher Program. Princeton, NJ: Princeton UP, 2000.
On New York see: Howell, William G. and Paul E. Peterson. The Education Gap:
Vouchers and Urban Schools. Washington, DC: Brookings Institution, 2002;
and Krueger, Alan B. and Pei Zhu. “Another Look at the New York City School
Voucher Experiment.” American Behavioral Scientist 47 no. 5, 2004.
Hess, Frederick M. Ed. 10 When Research Matters: How Scholarship Influences
Education Policy. Cambridge, MA: Harvard Education Press, 2008.
This publication from the Forum is available on line at 11
http://www.publicpolicyforum.org/issues.php?category=2.
Wilson, James Q. Bureaucracy: 12 What Government Agencies Do and Why They Do
It. New York: Basic Books, 1989 pp.168-71. On production organizations, which
appears later in the paragraph, see pp. 159-163 in the same source.
Gorman, Siobhan. “Can’t Beat ’Em? Sue ’Em!” 13 Washington Monthly, December
2001. http://www.washingtonmonthly.com. Using state test score data and
school characteristics, the Education Trust’s on-line data tool, Dispelling the
Myth, allows users to search for schools with high minority or low income
students who are nevertheless achieving at high levels. See
http://www2.edtrust.org/edtrust/dtm/.
Jacob, Brian A. “No Child Left Behind, Chicago Style.” 14 No Child Left Behind?
The Politics and Practice of School Accountability. Eds. Paul E. Peterson and
Martin R. West, Washington, DC: Brookings Institution, 2003; Datnow,
Amanda, Vicki Park, and Priscilla Wohlstetter. “Achieving with Data: How
High-Performing School Systems Use Data to Improve Instruction for

A Byte at the Apple
30 31
Introduction: The Education Data Landscape
Roza, Margeurite and Paul T. Hill. “How within-District Spending Inequities 23
Help Some Schools to Fail.” Brookings Papers on Education Policy. Ed. Diane
Ravitch, Washington, DC: Brookings Institution, 2004.
Roza, Margeurite and Paul T. Hill. “How within-District Spending Inequities 24
Help Some Schools to Fail.” Brookings Papers on Education Policy. Ed. Diane
Ravitch, Washington, DC: Brookings Institution, 2004.
“Forum Guide to Building a Culture of Quality Data: A School and District 25
Resource (NFES 2005-801).” US Department of Education, National Center for
Education Statistics, 2004 p. 3.
McNeil, Michelle. “Glitches, Data Errors Delay Illinois Test-Score Release.” 26
Education Week, December 6, 2006.
On supplemental services and schools at different levels of improvement 27
see: Hess, Frederick M. and Chester E. Finn, Jr., Eds. No Remedy Left Behind:
Lessons from a Half-Decade of NCLB. Washington, DC: AEI Press, 2007. On
restructuring see: Mead, Sara. “Easy Way Out: “Restructured” Usually Means
Little Has Changed.” Education Next, Winter 2007.
Cech, Scott J. “Florida Scoring Glitch Sparks Broad Debate.” 28 Education Week,
June 13, 2007.
Samuels, Christina A. “Special Education Official Leads Data-Collection Push.” 29
Education Week, January 10, 2007.
Samuels, Christina A. “IDEA Imposes Hefty Data Burden on States.” 30 Education
Week, January 31, 2007. One state official from Michigan quoted in this story
said that the changes from 2004 are “so big, it has redefined part of the core
work of the state education agency.”
Roza, Margeurite and Paul T. Hill. “How within-District Spending Inequities 31
Help Some Schools to Fail.” Brookings Papers on Education Policy. Ed. Diane
Ravitch, Washington, DC: Brookings Institution, 2004 p. 202.
McNeil, Michelle. “Glitches, Data Errors Delay Illinois Test-Score Release.” 32
Education Week, December 6, 2006.
Samuels, Christina A. “IDEA Imposes Hefty Data Burden on States.” 33 Education
Week, January 31, 2007.
More information is available at the SIFA website: http://www.sifinfo.org.34
Researchers affiliated with the CALDER project are taking advantage of the 35
growing number of states with individual student identifiers. See
http://www.caldercenter.org/.
Elementary Students.” Center on Educational Governance, University of
Southern California, 2007 p. 33.
Hoff, David J. “A Hunger for Data.” 15 Education Week, June 20, 2007.
Olson, Lynn. “Homegrown Tests Measure Core Critical-Reading Skills.” 16
Education Week, May 2, 2007. More information on Boston’s FAST-R initiative,
including links to evaluation reports, is available at http://www.bpe.org/
fast-r2.htm.
Manna, Paul. “NCLB in the States: Fragmented Governance, Uneven 17
Implementation.” No Remedy Left Behind: Lessons from a Half-Decade of
NCLB. Eds. Frederick M. Hess and Chester E. Finn, Jr., Washington, DC:
AEI Press, 2007.
Lyon, G. Reid et al. “Rethinking Learning Disabilities.” 18 Rethinking Special
Education for a New Century. Eds. Chester E. Finn, Jr., Andrew J. Rotherham,
and Charles R. Hokanson, Jr., Thomas B. Fordham Foundation and the
Progressive Policy Institute, 2001.
Carmines, Edward G. and Richard A. Zeller. 19 Reliability and Validity Assessment.
Newbury Park, CA: Sage Publications, 1979.
Cavanagh, Sean. “State Tests, NAEP Often a Mismatch.” 20 Education Week, June
13, 2007; “Mapping 2005 State Proficiency Standards onto the NAEP Scales
(NCES 2007-482).” US Department of Education, National Center for Education
Statistics, 2007; Fuller, Bruce et al. “Is the No Child Left Behind Act Working?
The Reliability of How States Track Achievement.” Policy Analysis for California
Education, 2006; Has Student Achievement Increased Since 2002? State Test-Score
Trends Through 2006 – 07. Center on Education Policy, 2008.
Marsh, Julie A., John F. Pane, and Laura S. Hamilton. “Making Sense of Data-21
Driven Decision Making in Education.” RAND, 2006 p. 11.
Burtless, Gary. Ed. 22 Does Money Matter? The Effect of School Resources on Student
Achievement and Adult Success. Washington, DC: Brookings Institution, 1996;
Greenwald, Rob, Larry V. Hedges, and Richard D. Laine. “The Effect of School
Resources on Student Achievement.” Review of Educational Research 66 no.
3,1996; Hanushek, Eric A. “Assessing the Effects of School Resources on
Student Performance: An Update.” Educational Evaluation and Policy Analysis 19
no. 2, 1997; Ladd, Helen F., Thomas Sobol, and Janet S. Hansen. Eds. Making
Money Matter: Financing America’s Schools. Washington, DC: National Academy
Press, 1999.
A Byte at the Apple
32 33
Introduction: The Education Data Landscape
Manna, Paul. 42 School’s In: Federalism and the National Education Agenda.
Washington, DC: Georgetown UP, 2006.
Smith, Nancy J. and Jane Armstrong. “Creating Longitudinal Data Systems: 43
Lessons Learned by Leading States.” Data Quality Campaign, 2006. p. 9.
Wilson, James Q. 44 Bureaucracy: What Government Agencies Do and Why
They Do It. New York: Basic Books, 1989; Arnold, R. Douglas. The Logic of
Congressional Action. New Haven, CT: Yale UP, 1990.
Witte, John F. 45 The Market Approach to Education: An Analysis of America’s First
Voucher Program. Princeton, NJ: Princeton UP, 2000. p. 189;
“Evaluation; a Study to Fill in the Blanks on Vouchers.” Milwaukee Journal
Sentinel, January 29, 2006. Information on the current evaluation of the
Milwaukee voucher program is available at http://www.uark.edu/ua/der/SCDP/
Milwaukee_Research.html.
Viadero, Debra. “Congress May Thwart Upward Bound Study.” 46 Education Week,
July 18, 2007. For information on the evaluation funding being eliminated,
see: Viadero, Debra. “U.S. Position on Research Seen in Flux.” Education Week,
March 5, 2008.
One example is in Fairfax County, Virginia. See Glod, Maria. “Fairfax Success 47
Masks Gap for Black Students.” Washington Post, April 14, 2006.
“Maximizing the Power of Education Data While Ensuring Compliance with 48
Federal Student Privacy Laws.” Data Quality Campaign, 2007.
Winnick, Steven Y., Scott R. Palmer, and Arthur L. Coleman. “State 49
Longitudinal Data Systems and Student Privacy Protections under the Family
Educational Rights and Privacy Act.” Data Quality Campaign, 2006.
A notable effort is the National Education Longitudinal Study ( http://nces.50
ed.gov/surveys/nels88/). Another, with a much smaller cohort of subjects, but
several more years of data is the High/Scope Perry Preschool Study
(http://highscope.org/Content.asp?ContentId=219).
Kane, Thomas J. and Douglas O. Staiger. “Volatility in School Test 51
Scores: Implications for Test-Based Accountability Systems.” Brookings Papers
on Education Policy. Ed. Diane Ravitch , Washington, DC: Brookings Institution,
2002.
For an historical treatment of this, see: Tyack, David and Larry Cuban. 52 Tinkering
toward Utopia: A Century of Public School Reform. Cambridge, MA: Harvard
University Press, 1995. For a recent and skeptical view, see: Wolk, Ronald A.
“Education Research Could Improve Schools, but Probably Won’t.” Education
Datnow, Amanda, Vicki Park, and Priscilla Wohlstetter. “Achieving with Data: 36
How High-Performing School Systems Use Data to Improve Instruction
for Elementary Students.” Center on Educational Governance, University of
Southern California, 2007 p. 66.
Datnow, Amanda, Vicki Park, and Priscilla Wohlstetter. “Achieving with Data: 37
How High-Performing School Systems Use Data to Improve Instruction
for Elementary Students.” Center on Educational Governance, University
of Southern California, 2007 p. 36. Principals and teachers also sometimes
disagree when describing the data they find most valuable. On that point see
Marsh, Julie A., John F. Pane, and Laura S. Hamilton. “Making Sense of Data-
Driven Decision Making in Education.” RAND, 2006 p. 12.
Wong, Kenneth K. and Stephen J. Meyer. “Title I Schoolwide Programs as 38
an Alternative to Categorical Practices.” Title I: Compensatory Education at the
Crossroads. Ed. Geoffrey D. Borman, Samuel C. Stringfield, and Robert E. Slavin,
Lawrence Erlbaum Associates, 2001 pp. 195-96.
In some areas the federal Family Educational Rights and Privacy Act clearly 39
does not interfere with data collection, but in others the law is more ambiguous.
For those distinctions see: Winnick, Steven Y., Scott R. Palmer, and Arthur L.
Coleman. “State Longitudinal Data Systems and Student Privacy Protections
under the Family Educational Rights and Privacy Act.” Data Quality Campaign,
2006.
Witte, John F. “The Milwaukee Voucher Experiment.” 40 Educational Evaluation
and Policy Analysis 20, no. 4, 1998; Greene, Jay P., Paul E. Peterson, and Jiangtao
Du. “Effectiveness of School Choice: The Milwaukee Experiment.” Education
and Urban Society 31, no. 2 1999; Krueger, Alan B. and Pei Zhu. “Another Look
at the New York City School Voucher Experiment.” American Behavioral Scientist
47, no. 5, 2004; Peterson, Paul E. and William G. Howell. “Efficiency, Bias, and
Classification Schemes: A Response to Alan B. Krueger and Pei Zhu.” American
Behavioral Scientist 47, no. 5, 2004.
Wirt, Frederick M. and Michael W. Kirst. 41 The Political Dynamics of American
Education. Berkeley, CA: McCutchan Publishing Corporation, 1997; Conley,
David T. Who Governs Our Schools? Changing Roles and Responsibilities. New
York: Teachers College Press, 2003; Epstein, Noel. Ed. Who’s in Charge Here?
The Tangled Web of School Governance and Policy. Denver, CO and Washington,
DC: Education Commission of the States and the Brookings Institution, 2004.
A Byte at the Apple
34
Week, June 20, 2007. Optimistic examples include: Williams, Trish, Kenji
Hakuta, and Edward Haertel. “Similar English Learner Students, Different
Results: Why Do Some Schools Do Better?” Mountain View, CA: EdSource,
2007; and Olson, Lynn. “Homegrown Tests Measure Core Critical-Reading
Skills.” Education Week, May 2, 2007.
For the England and Africa examples, see: Epstein, Helen. “Death by the 53
Numbers.” New York Review of Books, June 28, 2007.
“Forum Guide to Education Indicators (NFES 2005-802).” US Department of 54
Education, National Center for Education Statistics, 2005.