a brief history of data visualization
TRANSCRIPT
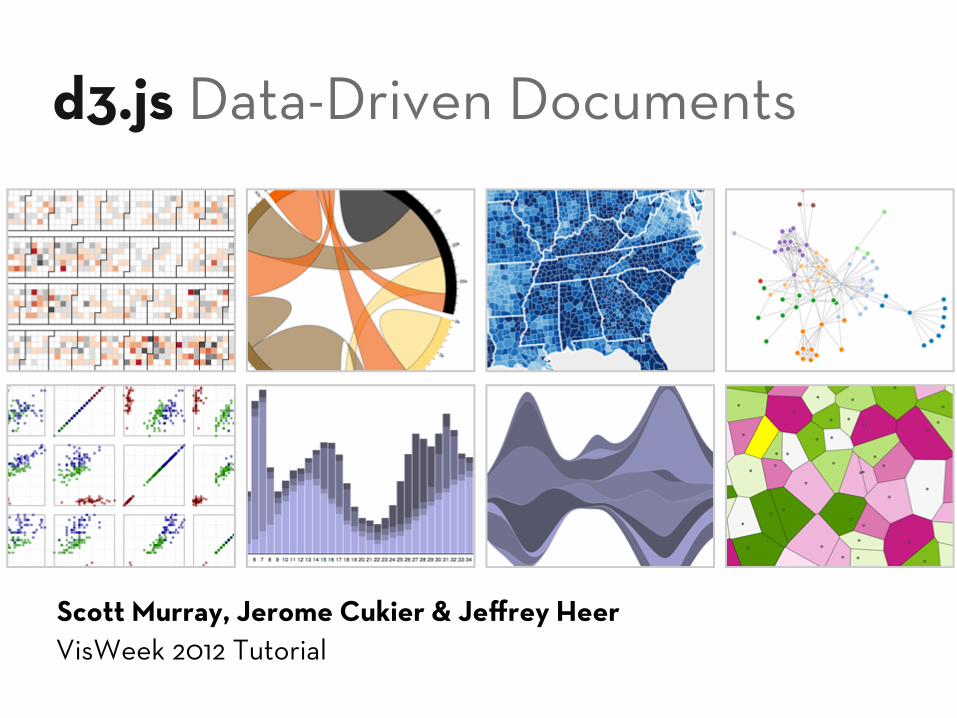
d3.js Data-Driven Documents
Scott Murray, Jerome Cukier & Je!rey HeerVisWeek 2012 Tutorial
How much data (bytes) did we produce in 2010?
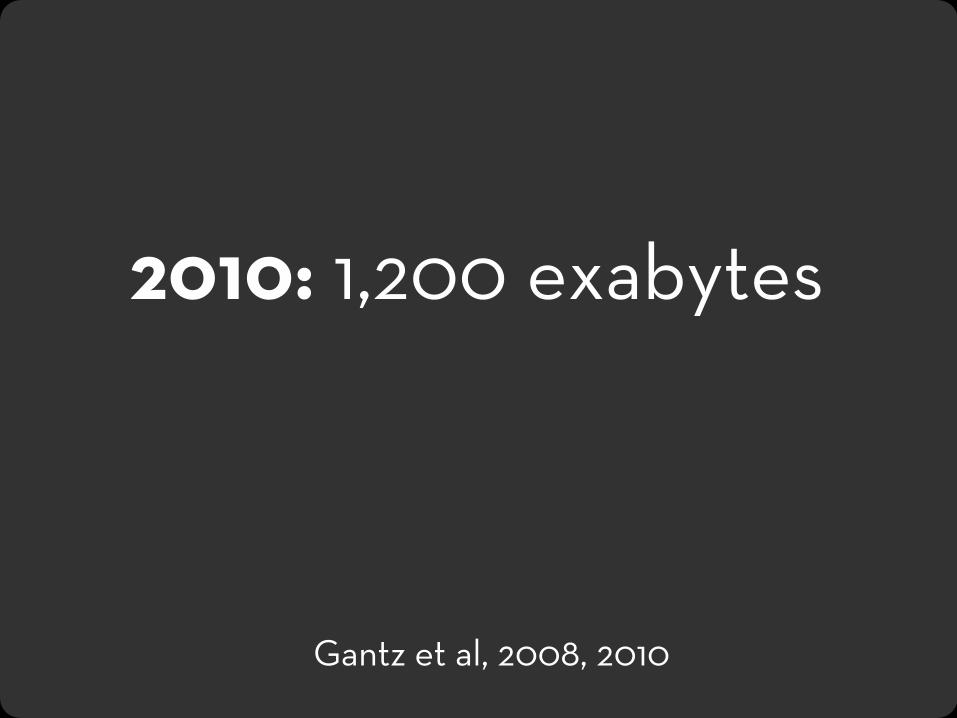
2010: 1,200 exabytes
Gantz et al, 2008, 2010
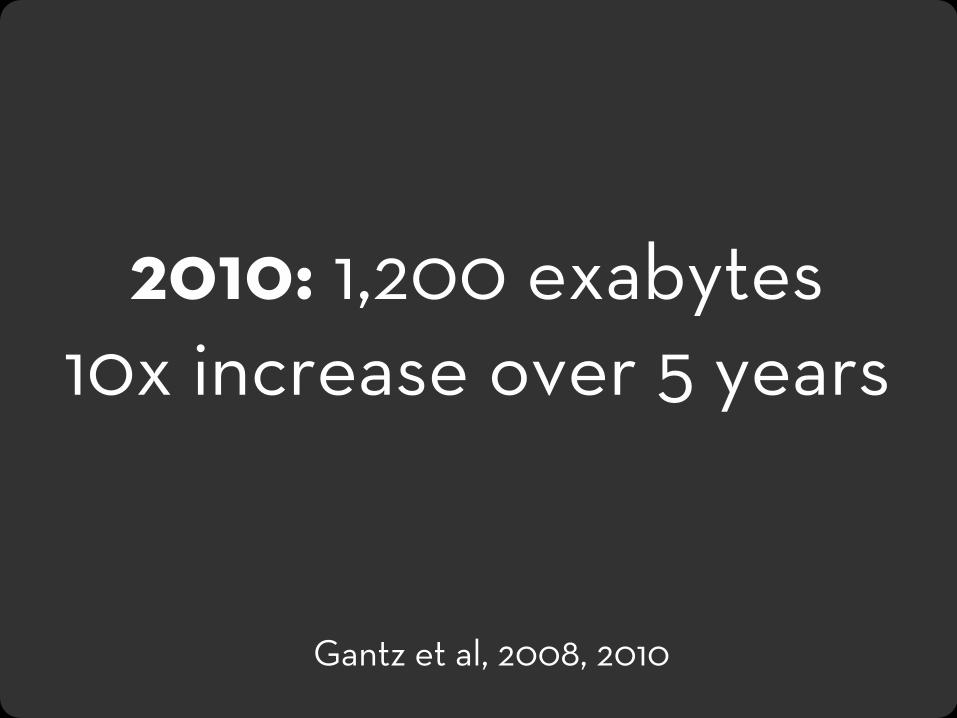
2010: 1,200 exabytes
Gantz et al, 2008, 2010
10x increase over 5 years
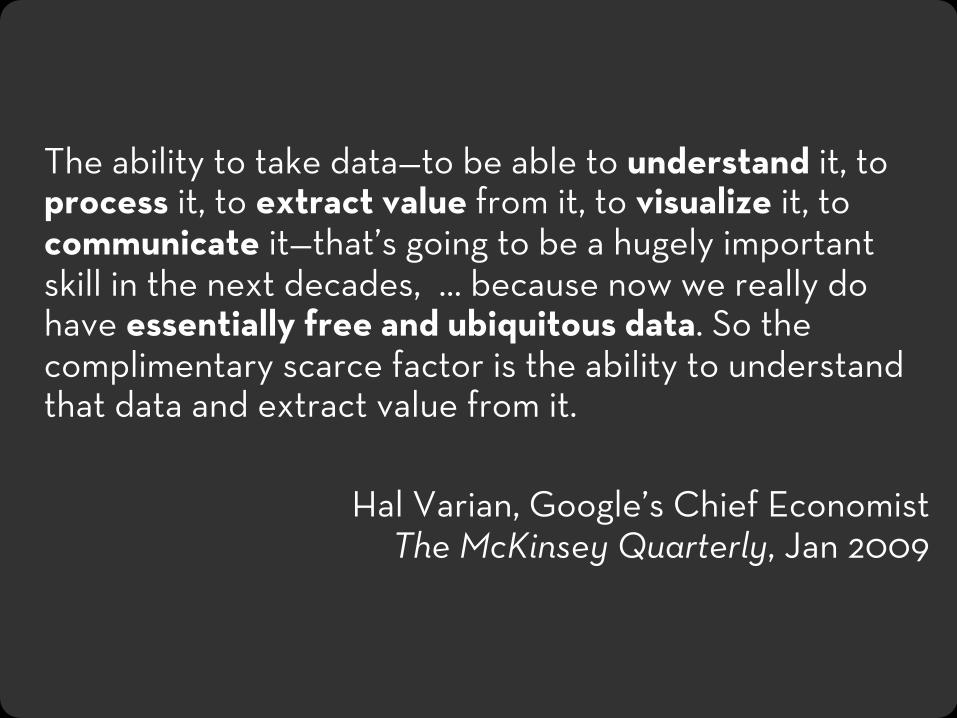
The ability to take data—to be able to understand it, to process it, to extract value from it, to visualize it, to communicate it—that’s going to be a hugely important skill in the next decades, … because now we really do have essentially free and ubiquitous data. So the complimentary scarce factor is the ability to understand that data and extract value from it.
Hal Varian, Google’s Chief EconomistThe McKinsey Quarterly, Jan 2009
How do people create visualizations?
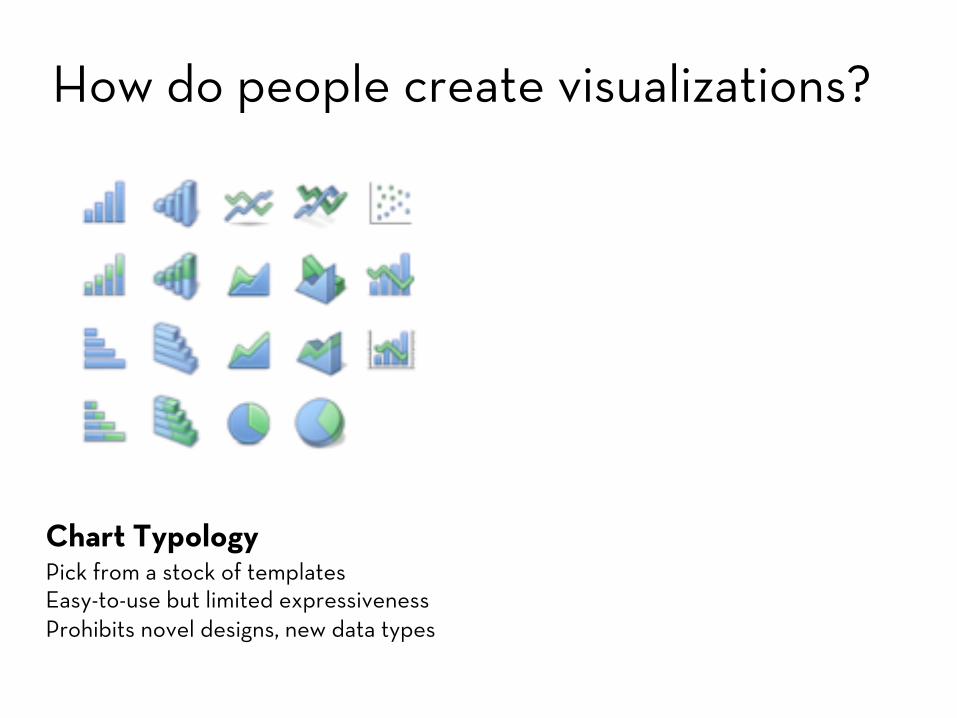
How do people create visualizations?
Chart TypologyPick from a stock of templatesEasy-to-use but limited expressivenessProhibits novel designs, new data types
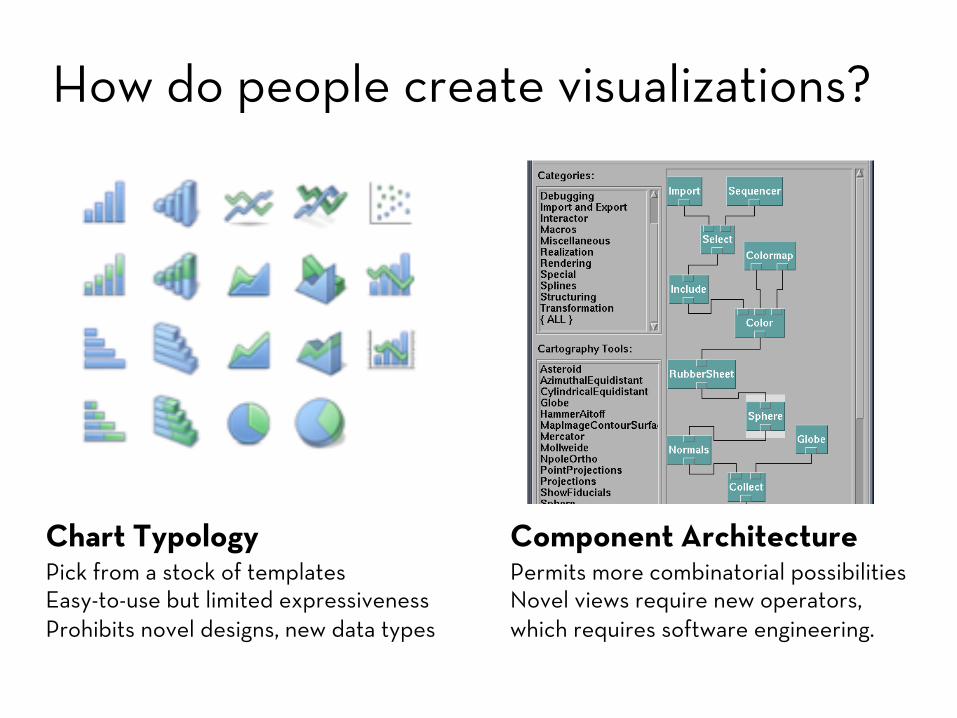
How do people create visualizations?
Chart TypologyPick from a stock of templatesEasy-to-use but limited expressivenessProhibits novel designs, new data types
Component ArchitecturePermits more combinatorial possibilitiesNovel views require new operators, which requires software engineering.

Chart TypologiesExcel, Many Eyes, Google Charts
Visual Analysis LanguagesTableau VizQL, ggplot2
?Component Model Architectures
Prefuse, Flare, Improvise
Graphics APIs OpenGL, Java2D, GDI+, Processing
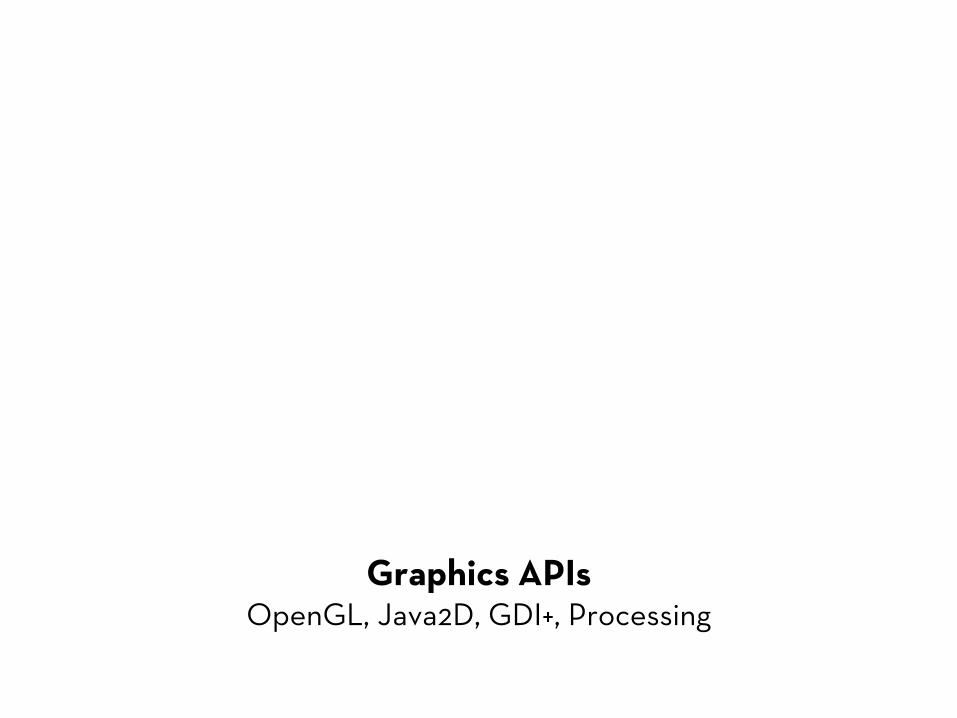
Chart TypologiesExcel, Many Eyes, Google Charts
Visual Analysis LanguagesTableau VizQL, ggplot2
?Component Model Architectures
Prefuse, Flare, Improvise
Graphics APIs OpenGL, Java2D, GDI+, Processing
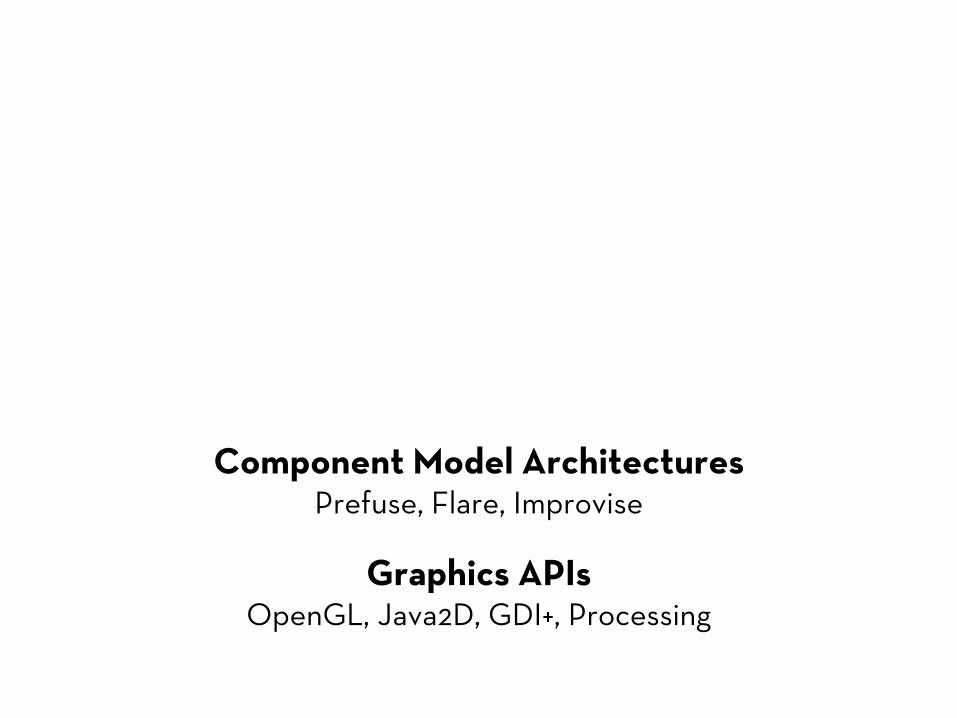
Chart TypologiesExcel, Many Eyes, Google Charts
Visual Analysis LanguagesTableau VizQL, ggplot2
?Component Model Architectures
Prefuse, Flare, Improvise
Graphics APIs OpenGL, Java2D, GDI+, Processing
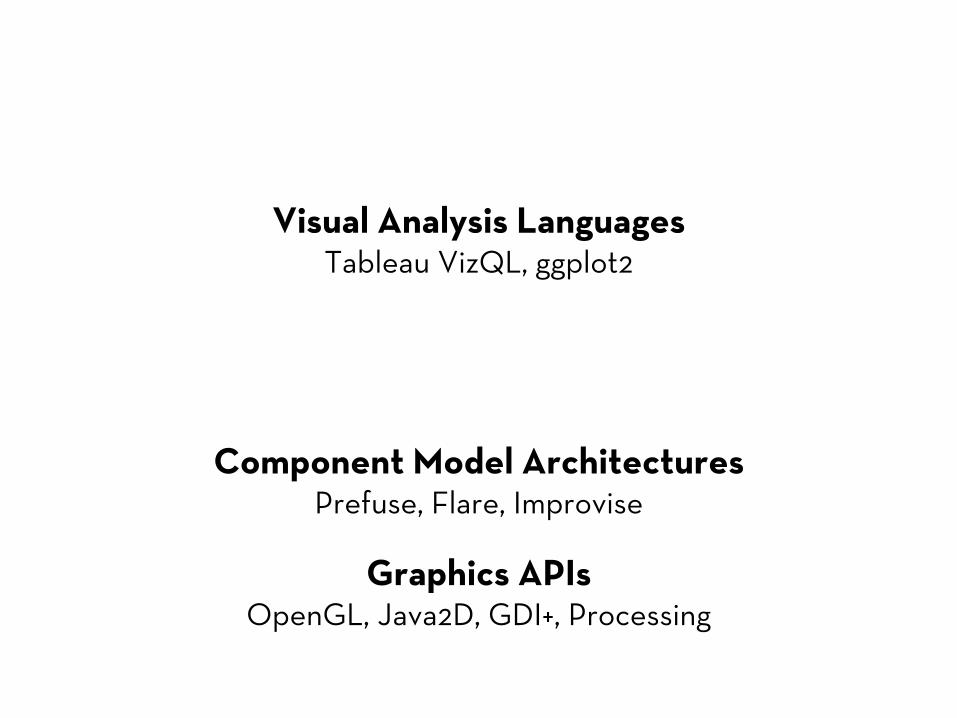
Chart TypologiesExcel, Many Eyes, Google Charts
Visual Analysis LanguagesTableau VizQL, ggplot2
?Component Model Architectures
Prefuse, Flare, Improvise
Graphics APIs OpenGL, Java2D, GDI+, Processing
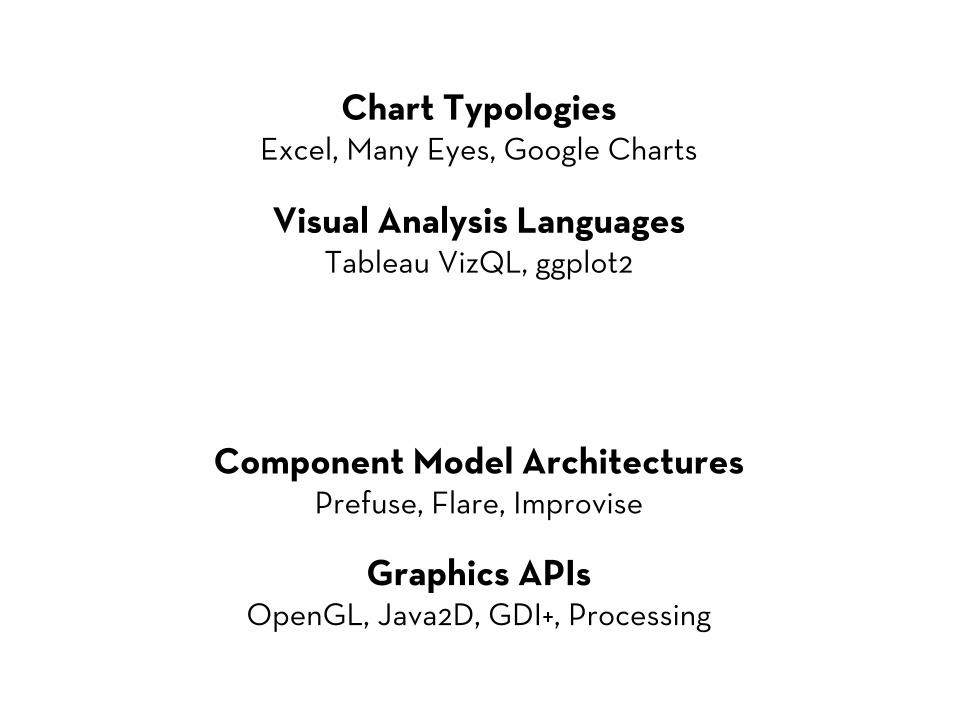
Chart TypologiesExcel, Many Eyes, Google Charts
Visual Analysis LanguagesTableau VizQL, ggplot2
?Component Model Architectures
Prefuse, Flare, Improvise
Graphics APIs OpenGL, Java2D, GDI+, Processing
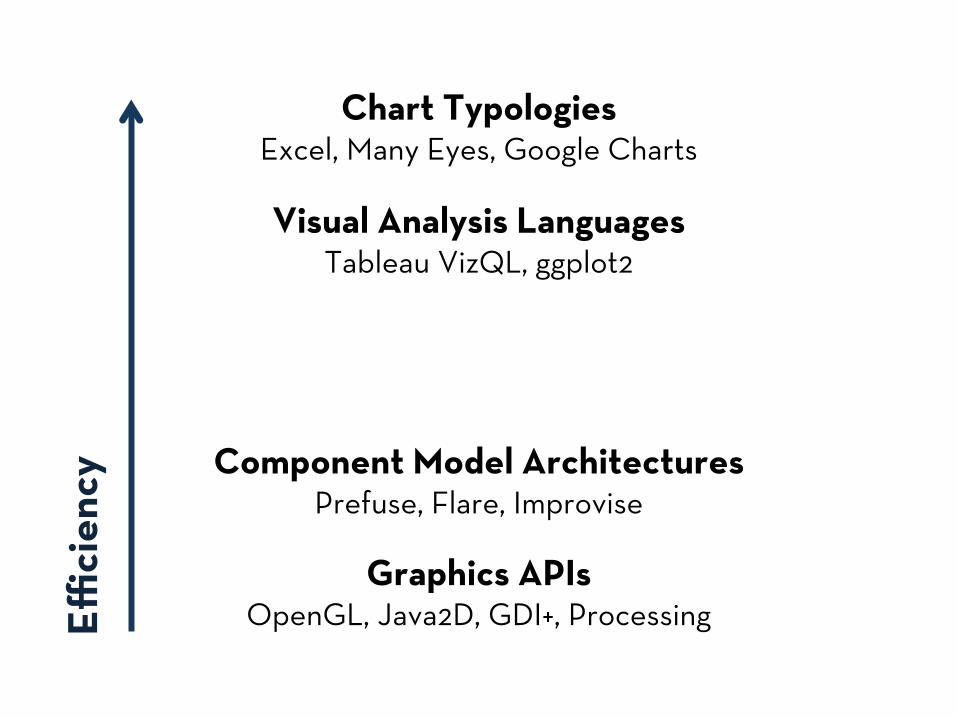
Chart TypologiesExcel, Many Eyes, Google Charts
Visual Analysis LanguagesTableau VizQL, ggplot2
?Component Model Architectures
Prefuse, Flare, Improvise
Graphics APIs OpenGL, Java2D, GDI+, ProcessingE"
cien
cy
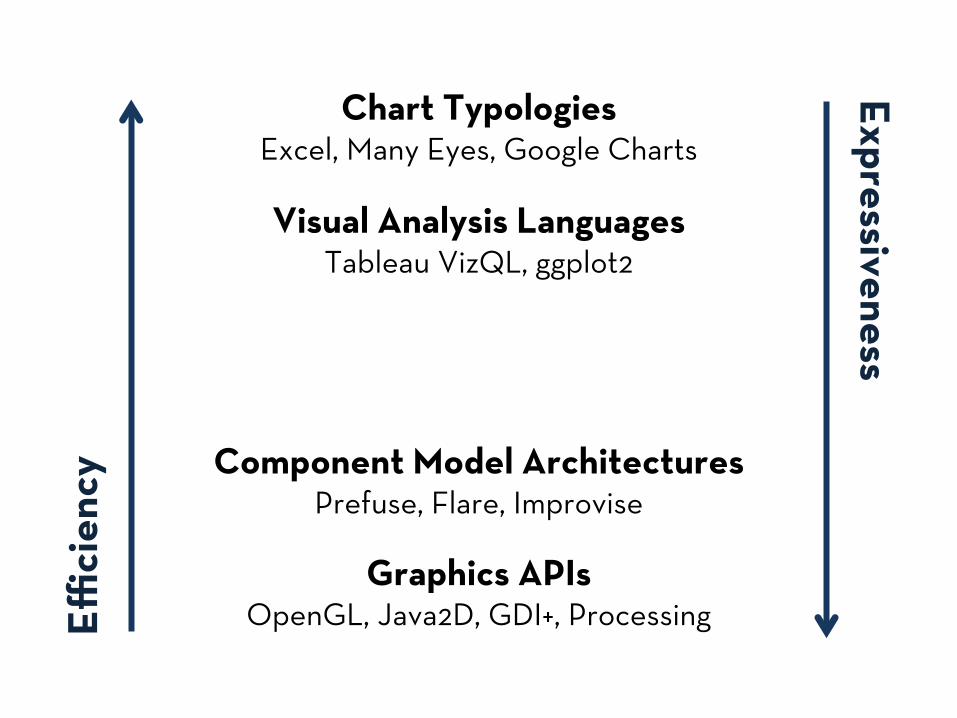
Chart TypologiesExcel, Many Eyes, Google Charts
Visual Analysis LanguagesTableau VizQL, ggplot2
?Component Model Architectures
Prefuse, Flare, Improvise
Graphics APIs OpenGL, Java2D, GDI+, ProcessingE"
cien
cyExpressiveness
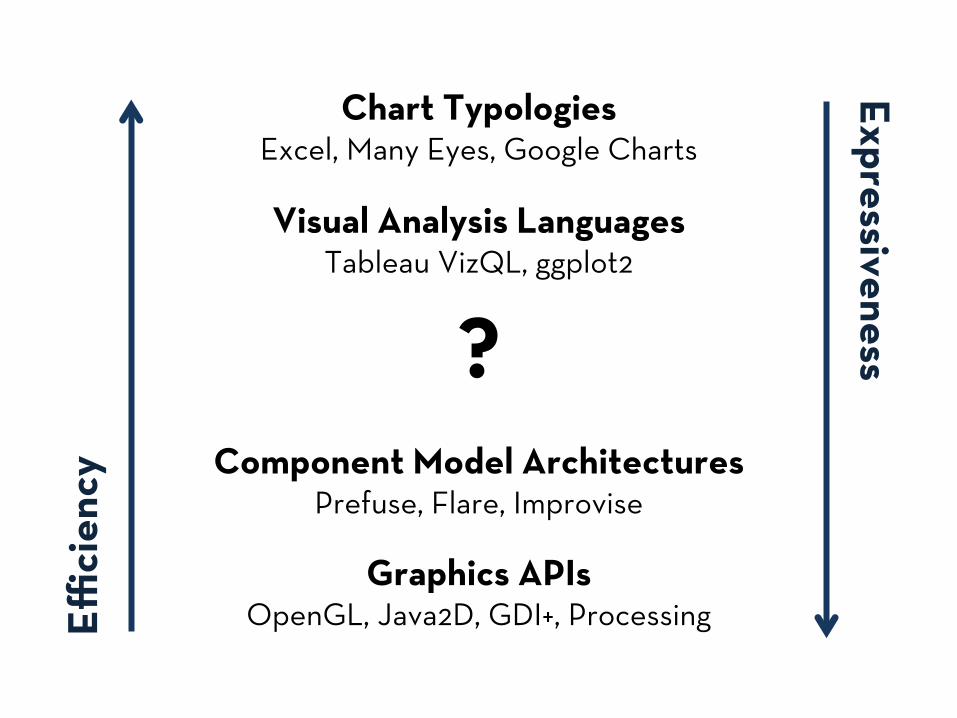
Chart TypologiesExcel, Many Eyes, Google Charts
Visual Analysis LanguagesTableau VizQL, ggplot2
?Component Model Architectures
Prefuse, Flare, Improvise
Graphics APIs OpenGL, Java2D, GDI+, ProcessingE"
cien
cyExpressiveness

d3.js Data-Driven Documents
d3.js Data-Driven Documents
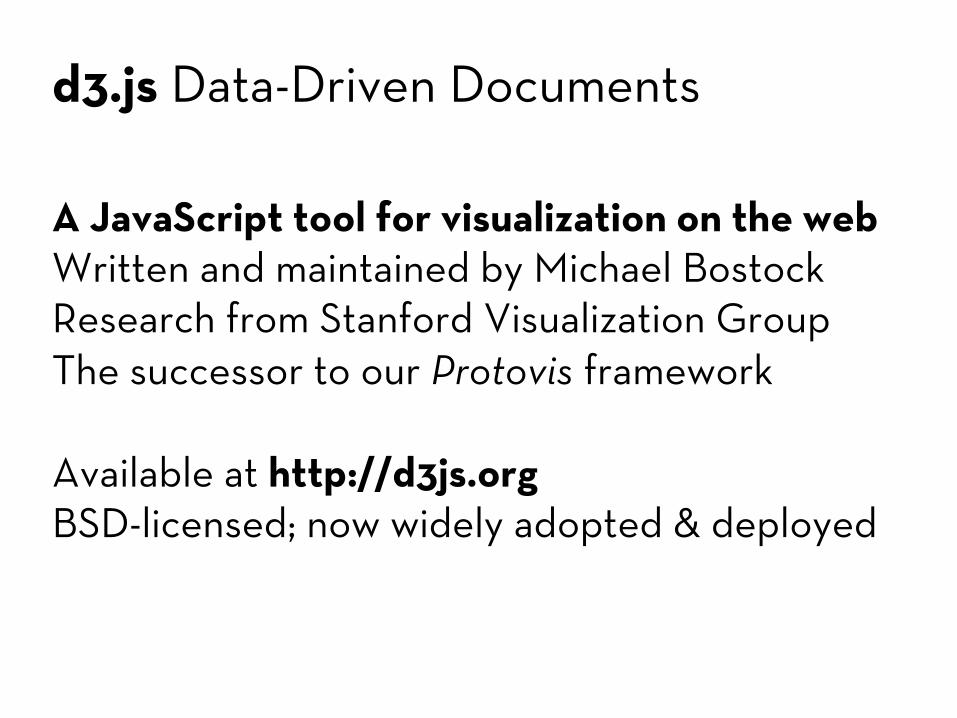
A JavaScript tool for visualization on the web
d3.js Data-Driven Documents
A JavaScript tool for visualization on the webWritten and maintained by Michael Bostock
d3.js Data-Driven Documents
A JavaScript tool for visualization on the webWritten and maintained by Michael BostockResearch from Stanford Visualization Group

d3.js Data-Driven Documents
A JavaScript tool for visualization on the webWritten and maintained by Michael BostockResearch from Stanford Visualization GroupThe successor to our Protovis framework
d3.js Data-Driven Documents
A JavaScript tool for visualization on the webWritten and maintained by Michael BostockResearch from Stanford Visualization GroupThe successor to our Protovis framework
d3.js Data-Driven Documents
A JavaScript tool for visualization on the webWritten and maintained by Michael BostockResearch from Stanford Visualization GroupThe successor to our Protovis framework
Available at http://d3js.org

d3.js Data-Driven Documents
A JavaScript tool for visualization on the webWritten and maintained by Michael BostockResearch from Stanford Visualization GroupThe successor to our Protovis framework
Available at http://d3js.orgBSD-licensed; now widely adopted & deployed
d3.js Data-Driven Documents
A JavaScript tool for visualization on the webWritten and maintained by Michael BostockResearch from Stanford Visualization GroupThe successor to our Protovis framework
Available at http://d3js.orgBSD-licensed; now widely adopted & deployed
d3.js Data-Driven Documents
d3.js Data-Driven Documents
Generate interactive web pages
d3.js Data-Driven Documents
Generate interactive web pagesBind data to elements in an HTML document

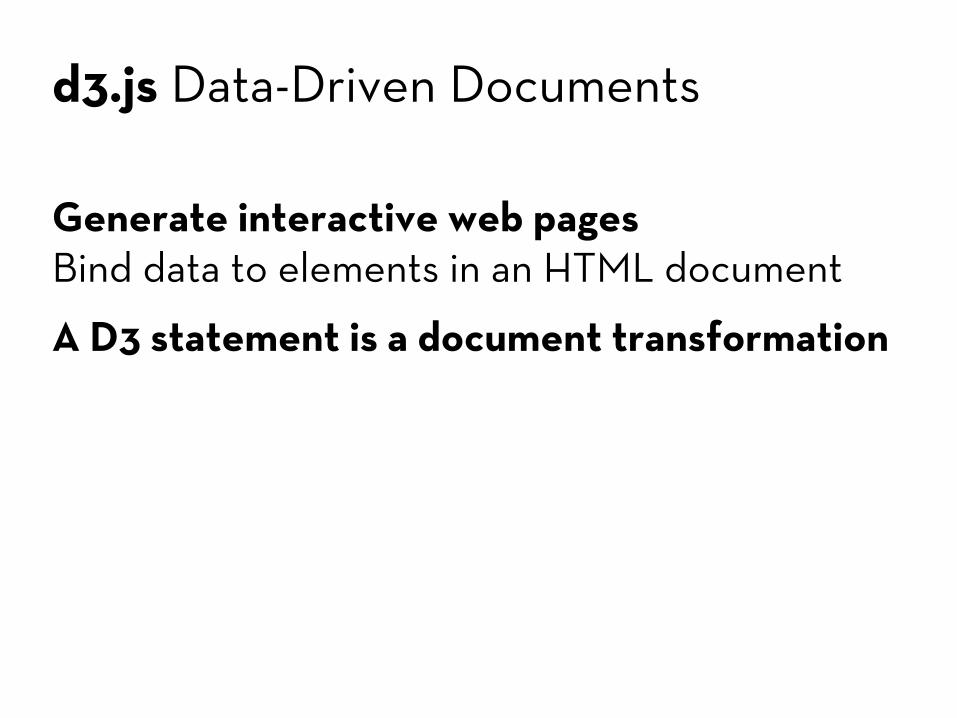
d3.js Data-Driven Documents
Generate interactive web pagesBind data to elements in an HTML document
d3.js Data-Driven Documents
Generate interactive web pagesBind data to elements in an HTML document
A D3 statement is a document transformation
d3.js Data-Driven Documents
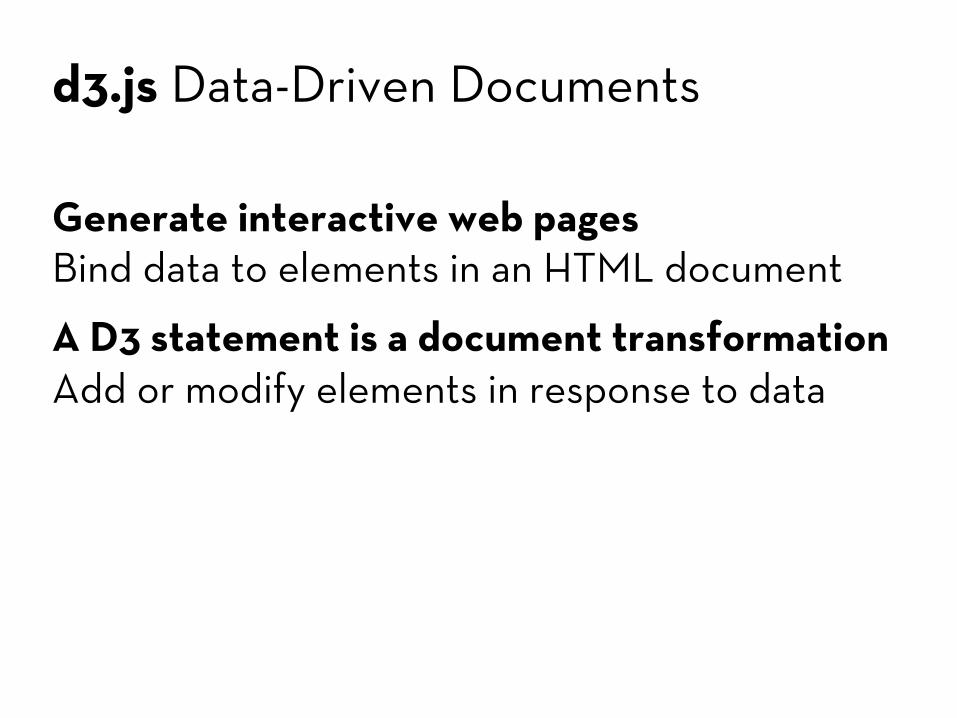
Generate interactive web pagesBind data to elements in an HTML document
A D3 statement is a document transformationAdd or modify elements in response to data
d3.js Data-Driven Documents
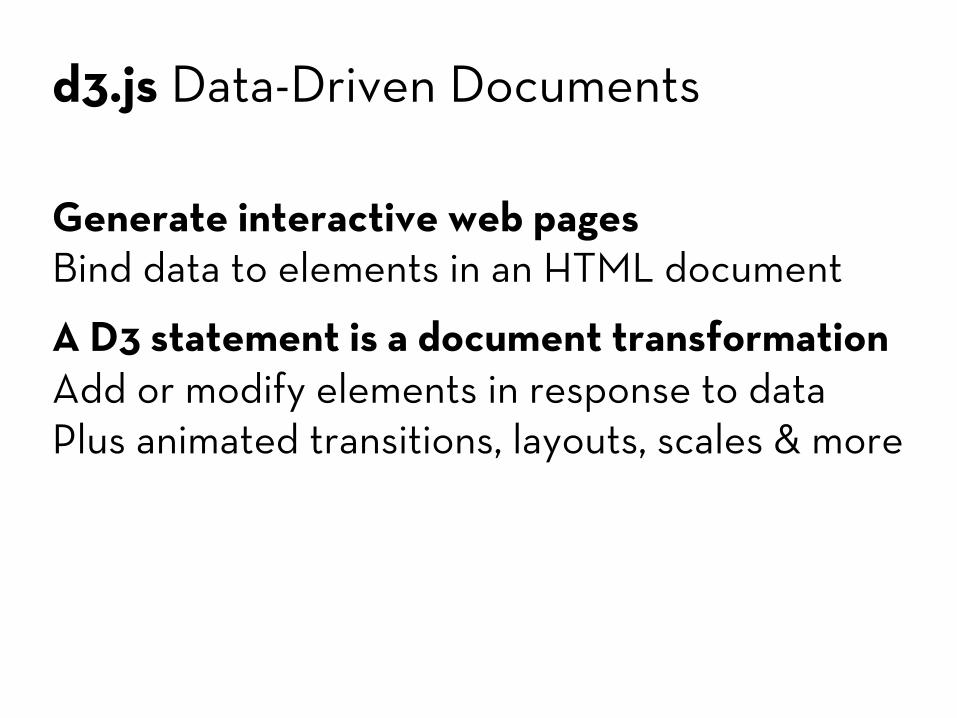
Generate interactive web pagesBind data to elements in an HTML document
A D3 statement is a document transformationAdd or modify elements in response to dataPlus animated transitions, layouts, scales & more

d3.js Data-Driven Documents
Generate interactive web pagesBind data to elements in an HTML document
A D3 statement is a document transformationAdd or modify elements in response to dataPlus animated transitions, layouts, scales & more
d3.js Data-Driven Documents
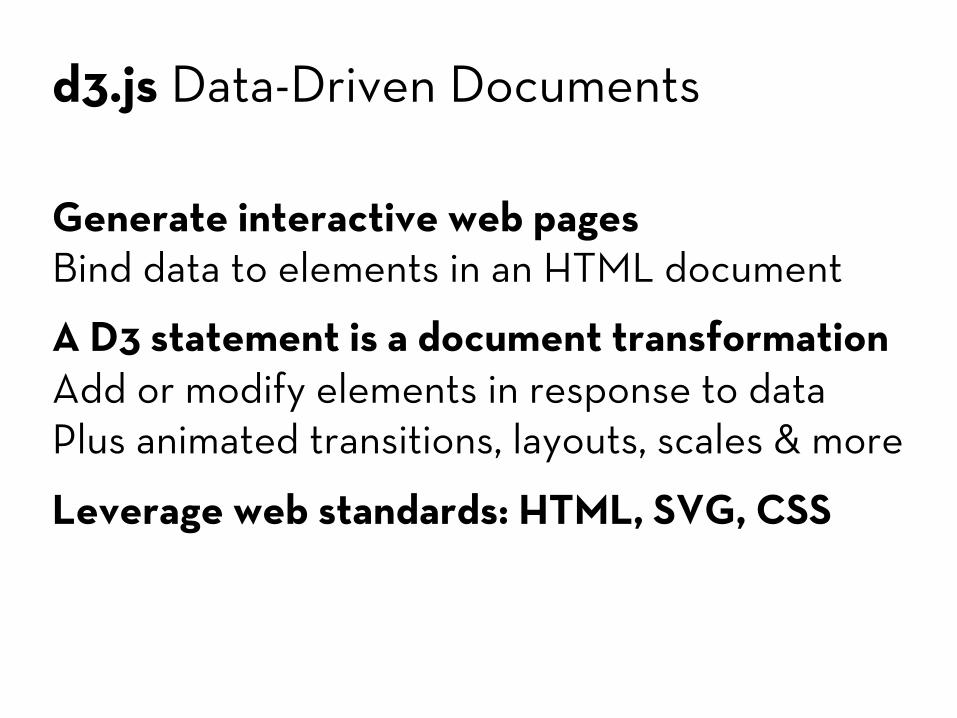
Generate interactive web pagesBind data to elements in an HTML document
A D3 statement is a document transformationAdd or modify elements in response to dataPlus animated transitions, layouts, scales & more
Leverage web standards: HTML, SVG, CSS
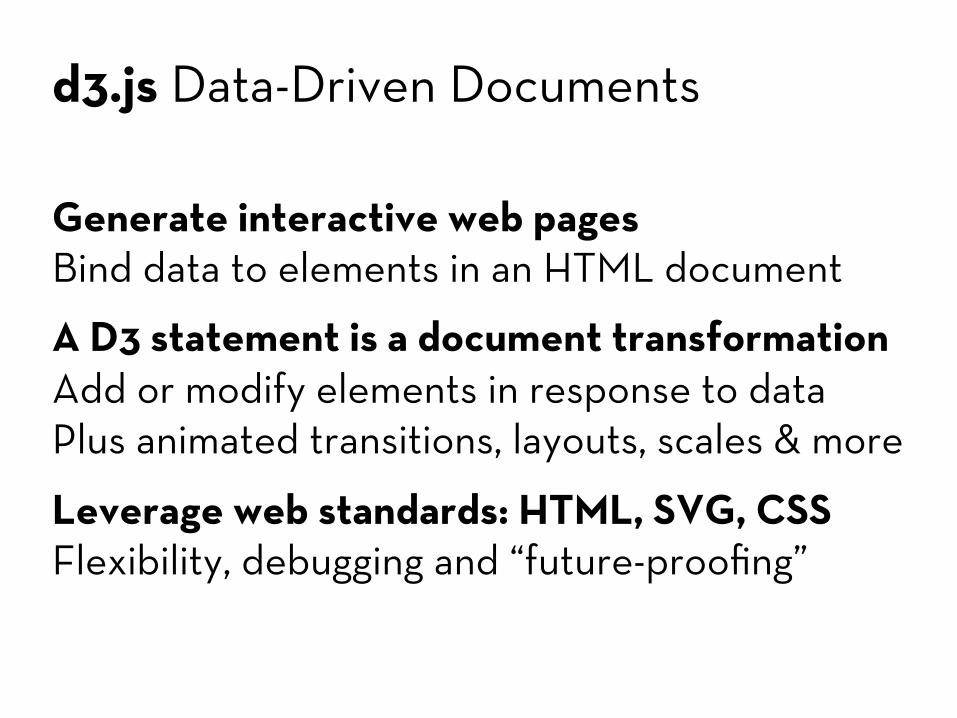
d3.js Data-Driven Documents
Generate interactive web pagesBind data to elements in an HTML document
A D3 statement is a document transformationAdd or modify elements in response to dataPlus animated transitions, layouts, scales & more
Leverage web standards: HTML, SVG, CSSFlexibility, debugging and “future-proofing”

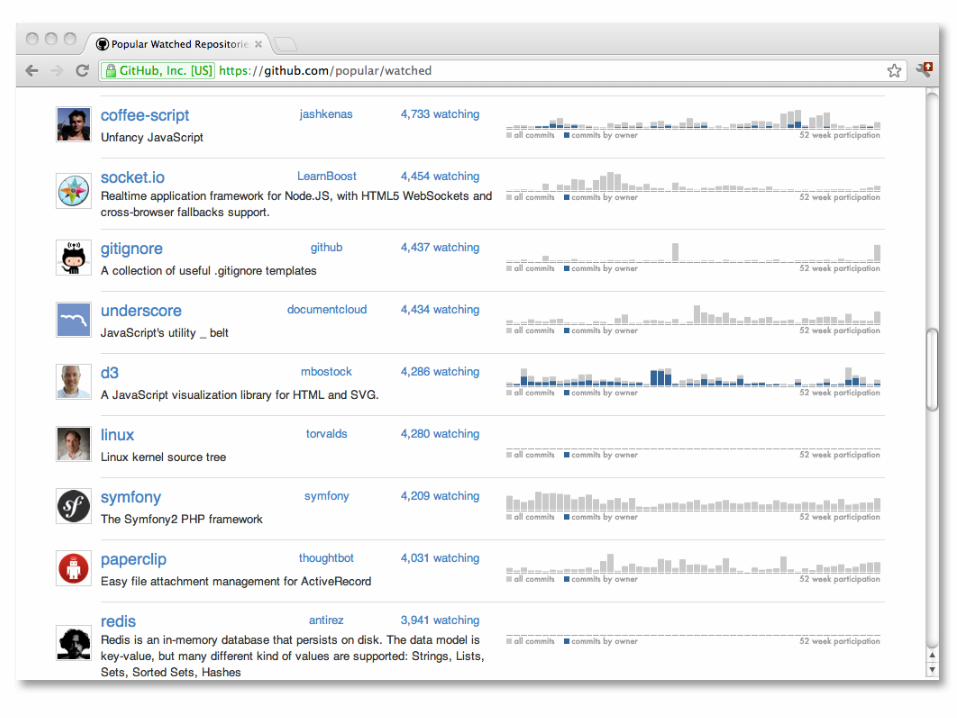
GitHub Rank…
GitHub Rank…
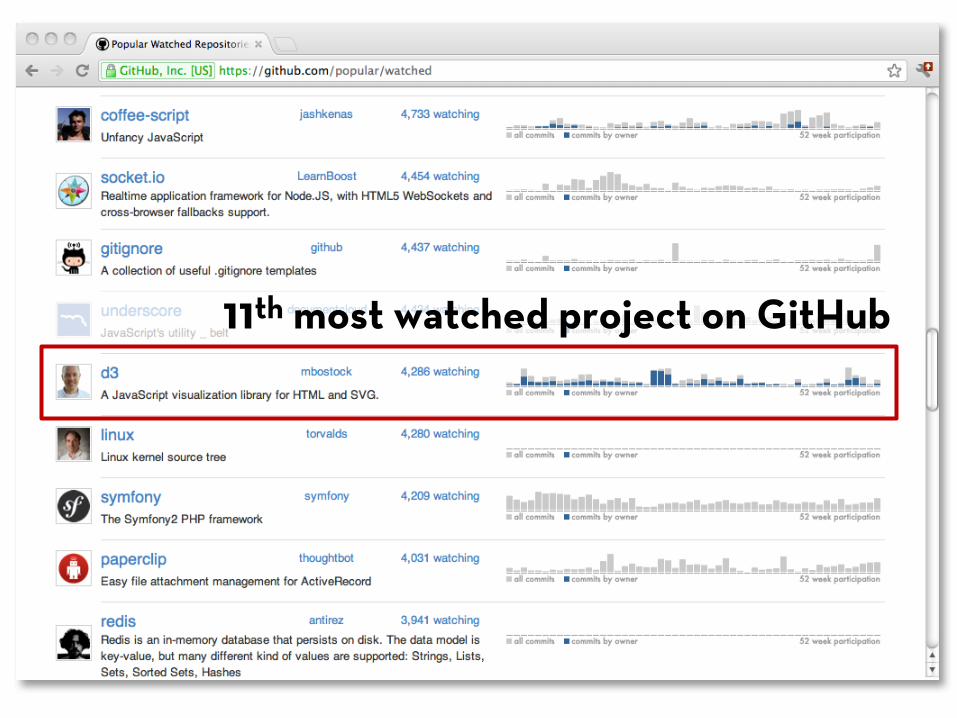
11th most watched project on GitHub

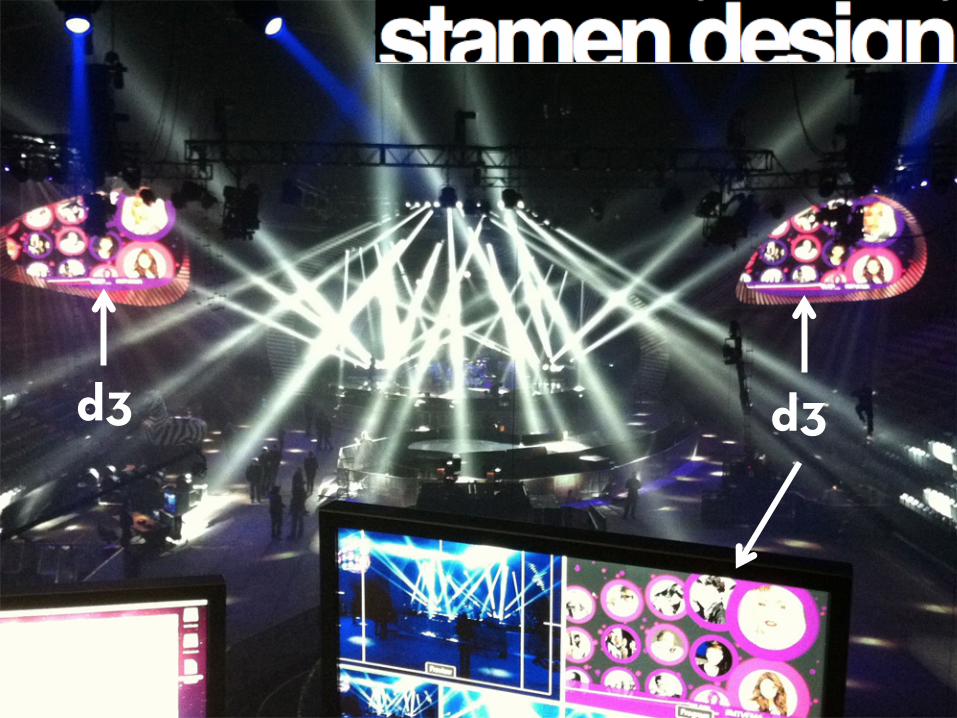
d3 d3
