a brave new world - resolution · pdf filethis publication is available in the wages &...
TRANSCRIPT
resolutionfoundation.org [email protected] +44 (0)203 372 2960 @resfoundation
BRIEFING
A brave new worldHow reduced migration could affect earnings, employment and the labour market
Stephen ClarkeAugust 2016
This publication is available in the Wages & Income section of our website @resfoundation
A brave new world: how reduced migration could affect pay, jobs and the labour market Acknowledgements 2
Acknowledgements
The author is grateful to the following people for their advice and assistance over the course of the research for this project. Max Nathan of the London School of Economics and University of Birmingham, Jonathan Wadsworth of the London School of Economics and Harvey Redgrave of Crest. We’d also like to thank the staff in the Employment, Equity and Growth Programme (EEG) at the Institute for New Economic Thinking at the Oxford Martin School, University of Oxford
for their helpful comments. All errors remain the author’s own.
This publication is available in the Wages & Income section of our website @resfoundation
3A brave new world: how reduced migration could affect pay, jobs and the labour market
Summary
In the wake of the vote to leave the European Union it seems likely that the UK will adopt a new immigration regime, moving away from the current free movement of people within the EU and possibly extending the current points-based-system that applies to those outside the European Union. While we don’t yet know what this new system will look like, it is fair to assume that it will place greater restrictions on immigration – in part as a way of moving towards the government’s renewed manifesto promise of bringing net migration down to tens of thousands by 2020, but also to allow more skilled migrants in at the expense of unskilled ones.
This note investigates the labour market effects of migration. The increase in inward migration experienced over the course of the past decade coincided with a stagnation and then a fall in earnings, which some have linked. Our analysis indicates that while it is wrong to say migration had no effect on the earnings of native workers, specifically for those in low-paying sectors, the effect was very small, and was eclipsed by the wider squeeze on earnings experienced during the period. Looking forward we find that a fall in inward migration will not significantly help boost wages, which are more likely to be suppressed by sterling’s depreciation in the short term and the wider impact of Brexit on growth in the years ahead.
However, fewer migrants will create a number of other significant challenges for the labour market. In particular some sectors could experience significant labour shortages without action. Many low-paying sectors are heavily reliant on migrant labour. In some, such as food manufacturing, clothing manufacturing and domestic personnel, over 30% of all workers are migrants. The rights of these existing workers will need to be safeguarded to avoid short term and severe damage to these sectors. Going forward recruitment is likely to be a challenge for these sectors. Given the fact that migrants in these sectors earn a lot less than average native wages it is unlikely that these sectors will be able to substitute migrant for native labour without rethinking their business models. Therefore the government will need to ensure that these sectors are central to its new industrial strategy, including looking at how they can invest in skills and labour-saving technology. Finally, because an end of Free Movement is likely to require an expansion of temporary workers, the government will need to invest in a more robust approach to labour market enforcement. At present the number of staff enforcing labour market policies like the minimum wage is scarcely enough, and a new immigration regime will throw up major new enforcement challenges.
This publication is available in the Wages & Income section of our website @resfoundation
4A brave new world: how reduced migration could affect pay, jobs and the labour market
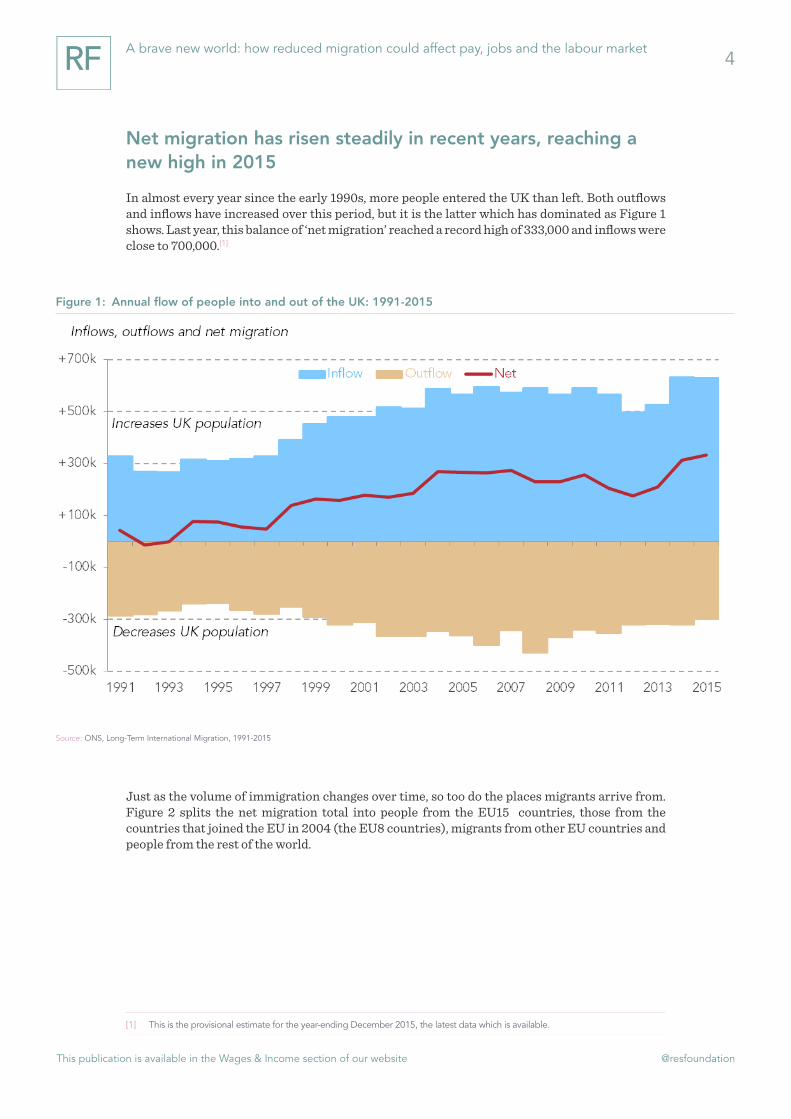
Net migration has risen steadily in recent years, reaching a new high in 2015
In almost every year since the early 1990s, more people entered the UK than left. Both outflows and inflows have increased over this period, but it is the latter which has dominated as Figure 1 shows. Last year, this balance of ‘net migration’ reached a record high of 333,000 and inflows were close to 700,000.[1]
Just as the volume of immigration changes over time, so too do the places migrants arrive from. Figure 2 splits the net migration total into people from the EU15 countries, those from the countries that joined the EU in 2004 (the EU8 countries), migrants from other EU countries and people from the rest of the world.
[1] This is the provisional estimate for the year-ending December 2015, the latest data which is available.
Figure 1: Annual flow of people into and out of the UK: 1991-2015
Technical chart info (esp y axis)
Source: ONS, Long-Term International Migration, 1991-2015

This publication is available in the Wages & Income section of our website @resfoundation
5A brave new world: how reduced migration could affect pay, jobs and the labour market
Prior to the enlargement of the EU in 2004, the majority of net inward migration into the UK could be explained by those arriving from outside the EU. From 2004 however, there was a big jump in the number of migrants from both the ‘original’ and – more significantly – the ‘accession’ EU countries. Numbers fell slightly when the global financial crisis hit in 2008, but they picked up in 2014 and 2015.
Notwithstanding all these changes however, it is worth noting that roughly half of the net migration into the UK each year originates from outside of the EU. This is despite the fact that such migrants do not have the automatic right to reside and work in the country.
Migrants currently comprise 16 per cent of the UK’s popula-tion, with the majority from outside the EU
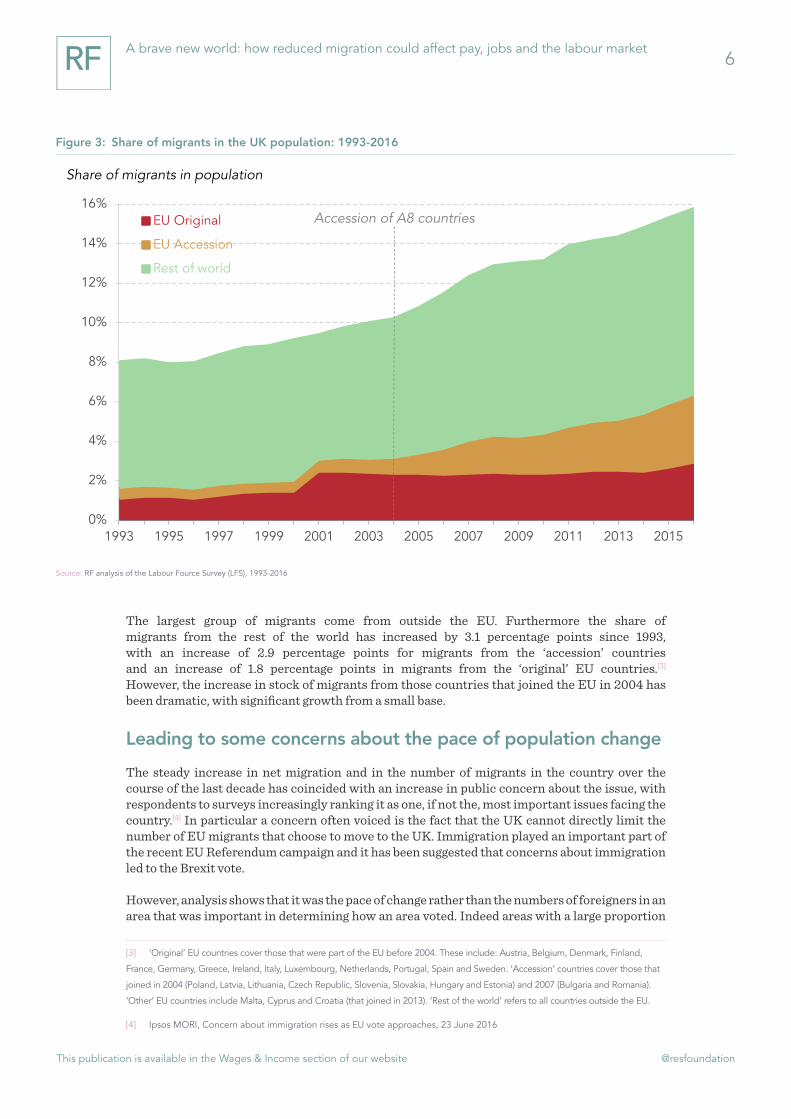
Net migration is a measure of the flow of people into the country. Inward migration by non-UK born people has increased the stock of migrants who live and work here – as highlighted in Figure 3. It is now estimated that there are approximately 8.1 million migrants (or non-UK born individuals) living in the UK, up from 3.5 million in 1993.[2] Such individuals now comprise approximately 16 per cent of the country’s population.
[2] ONS, Labour Force Survey/Annual Population Survey, January-March 2016
Figure 2: Flow of migrants into the UK: 1991-2015
Technical chart info (esp y axis)
Source: ONS, Long-Term International Migration, 1991-2015
+k
+50k
+100k
+150k
+200k
+250k
+300k
+350k
+400k
1991 1993 1995 1997 1999 2001 2003 2005 2007 2009 2011 2013 2015
EU15EU8Other EURest of world
Net migration
Accession of A8 countries
This publication is available in the Wages & Income section of our website @resfoundation
6A brave new world: how reduced migration could affect pay, jobs and the labour market
The largest group of migrants come from outside the EU. Furthermore the share of migrants from the rest of the world has increased by 3.1 percentage points since 1993, with an increase of 2.9 percentage points for migrants from the ‘accession’ countries and an increase of 1.8 percentage points in migrants from the ‘original’ EU countries.[3]
However, the increase in stock of migrants from those countries that joined the EU in 2004 has been dramatic, with significant growth from a small base.
Leading to some concerns about the pace of population change
The steady increase in net migration and in the number of migrants in the country over the course of the last decade has coincided with an increase in public concern about the issue, with respondents to surveys increasingly ranking it as one, if not the, most important issues facing the country.[4] In particular a concern often voiced is the fact that the UK cannot directly limit the number of EU migrants that choose to move to the UK. Immigration played an important part of the recent EU Referendum campaign and it has been suggested that concerns about immigration led to the Brexit vote.
However, analysis shows that it was the pace of change rather than the numbers of foreigners in an area that was important in determining how an area voted. Indeed areas with a large proportion
[3] ‘Original’ EU countries cover those that were part of the EU before 2004. These include: Austria, Belgium, Denmark, Finland,
France, Germany, Greece, Ireland, Italy, Luxembourg, Netherlands, Portugal, Spain and Sweden. ‘Accession’ countries cover those that
joined in 2004 (Poland, Latvia, Lithuania, Czech Republic, Slovenia, Slovakia, Hungary and Estonia) and 2007 (Bulgaria and Romania).
‘Other’ EU countries include Malta, Cyprus and Croatia (that joined in 2013). ‘Rest of the world’ refers to all countries outside the EU.
[4] Ipsos MORI, Concern about immigration rises as EU vote approaches, 23 June 2016
Figure 3: Share of migrants in the UK population: 1993-2016
Technical chart info (esp y axis)
Source: RF analysis of the Labour Fource Survey (LFS), 1993-2016
0%
2%
4%
6%
8%
10%
12%
14%
16%
1993 1995 1997 1999 2001 2003 2005 2007 2009 2011 2013 2015
EU Original
EU Accession
Rest of world
Share of migrants in population
Accession of A8 countries

This publication is available in the Wages & Income section of our website @resfoundation
7A brave new world: how reduced migration could affect pay, jobs and the labour market
of migrants were more likely to vote to remain in the EU.[5] This suggests that attitudes about current migration and its costs and benefits are complicated. We should also note that the UK’s recent experience is not unusual. Spain, Sweden and most recently Germany have seen similar increases in net migration and all three countries and others, such as Italy and France, have a similar number of migrants as a proportion of the population as the UK.
Post-Referendum the new government has committed to re-ducing migration levels
The new Prime Minister has made it clear that in the wake of the vote to leave the EU her intention is to reduce migration:
“I’m very clear that the Brexit vote gave us a very clear message from people, that we couldn’t allow freedom of movement to continue as it had done hitherto… We need to bring control into movement of people coming into the UK from the EU... I believe we should have that goal of bringing immigration down to sustainable levels.”[6]
The new government has also committed to fulfil its promise to bring net migration down to the tens of thousands, although there is some debate over whether this will be done by the original target of 2020. This paper looks at the possible impacts on the labour market should immigration be reduced, specifically engaging in a thought experiment of what the impact might be should it be reduced to the government’s target (an assumed arbitrary level rather than a forecast of what is likely to happen). In particular we look at the extent to which a fall in migration might increase earnings for natives and the new challenges that may arise if fewer workers are able to migrate to the UK.
Migrants have high rates of employment, with big differences in pay between ‘original’ and ‘accession’ EU migrants
Migrants form a bigger proportion of the working-age population than the total population, reflecting the fact that most groups of migrants are more likely to be of working age and in work than natives. The evidence suggests that as a result some migrants (those from the EU) contribute more in taxes than they benefit from public spending, while the opposite is true for migrants from the rest of the world.[7]
[5] See S Clarke and M Whittaker, The Importance of Place: explaining the characteristics underpinning the Brexit vote across
different parts of the UK, 2016
[6] The Spectator, Full transcript: Theresa May, Peston on Sunday, 3 July 2016
[7] Dustman, C. & Frattini, T., The fiscal effects of immigration to the UK, The Economic Journal 124 2014
This publication is available in the Wages & Income section of our website @resfoundation
8A brave new world: how reduced migration could affect pay, jobs and the labour market
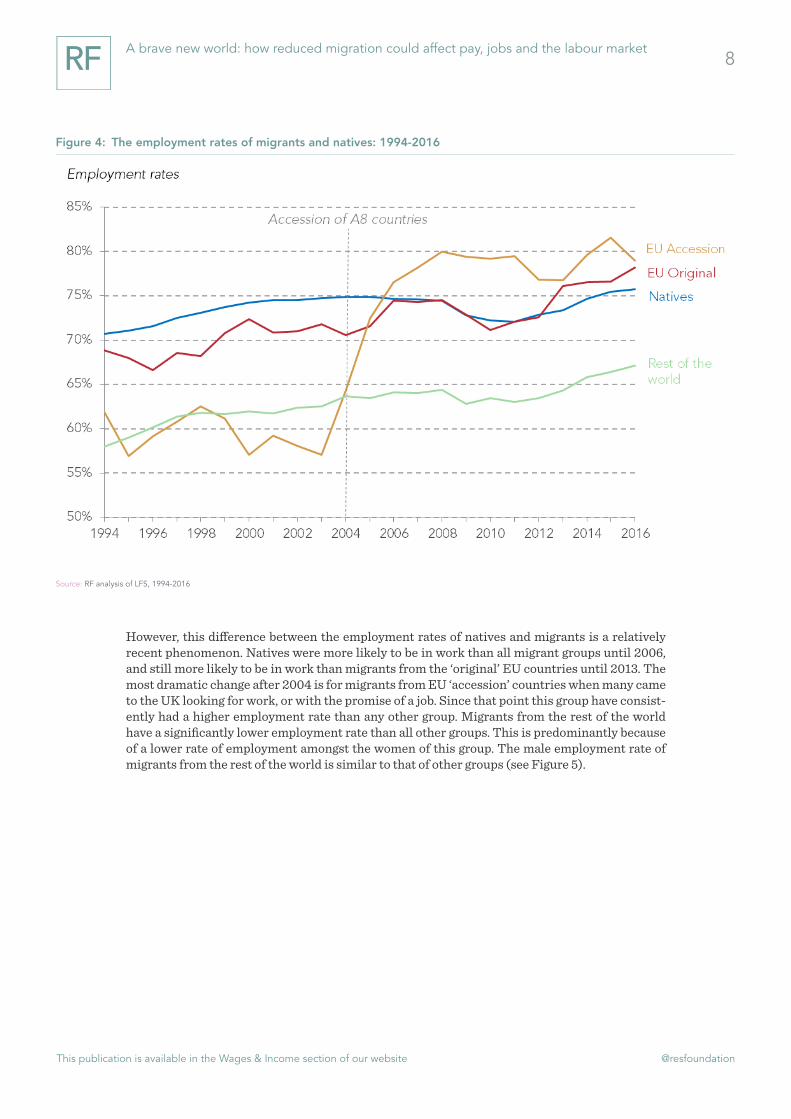
However, this difference between the employment rates of natives and migrants is a relatively recent phenomenon. Natives were more likely to be in work than all migrant groups until 2006, and still more likely to be in work than migrants from the ‘original’ EU countries until 2013. The most dramatic change after 2004 is for migrants from EU ‘accession’ countries when many came to the UK looking for work, or with the promise of a job. Since that point this group have consist-ently had a higher employment rate than any other group. Migrants from the rest of the world have a significantly lower employment rate than all other groups. This is predominantly because of a lower rate of employment amongst the women of this group. The male employment rate of migrants from the rest of the world is similar to that of other groups (see Figure 5).
Figure 4: The employment rates of migrants and natives: 1994-2016
Technical chart info (esp y axis)
Source: RF analysis of LFS, 1994-2016

This publication is available in the Wages & Income section of our website @resfoundation
9A brave new world: how reduced migration could affect pay, jobs and the labour market
On pay, migrants from the countries that joined the EU in 2004 earn around £8.30 an hour, compared to approximately £11.10 for natives. Workers from the EU ‘original’ countries earn the most, while the earnings of native workers and workers from the rest of the world are similar. Again, there is a very significant change in the earnings of EU ‘accession’ migrants after 2004. This was due not only to many more migrants coming from these countries, but also to the nature of the work they were coming to do being in predominantly low-paid roles. It is also clear that the earnings ‘premium’ enjoyed by EU Original migrants has grown since the mid-1990s.
Such differences reflect the fact that there is a significant difference between an economic migrant, of which many migrants from the EU ‘accession’ countries are, and a migrant who is looking to move to the UK for family reasons. Many economic migrants move with the promise of a job (reflecting their high employment rates) and may accept relatively low wages, they may also suffer from their wages being depressed by other recently arrived migrants who are very close substitutes for their own labour.[8]
[8] Manacorda, M., Manning, A., Wadsworth, J., The impact of immigration on the structure of wages: theory and evidence from
Britain, Journal of the European Economic Association 10 (1), 2012
Figure 5: Employment rates for males and females, natives and migrants: 2016
Technical chart info (esp y axis)
Source: RF Analysis of LFS, 2016

This publication is available in the Wages & Income section of our website @resfoundation
10A brave new world: how reduced migration could affect pay, jobs and the labour market
Differences between ‘original’ and ‘accession’ EU migrants tend to cancel each other out, meaning migration has had a limited compositional impact on aggregate employment and pay measures in recent years
The effect of migrants on the British economy has been widely researched, with papers suggesting that they have an effect on growth on public finances[9] and possibly public services.[10] This research just examines the effect of migrants on the labour market, including on earnings and employment in general and for natives in particular.
To do this we need to create a number of thought experiments or counterfactual situations in which we look at how the labour market would have evolved over the course of the last few decades had fewer people migrated to the UK. The first thought experiment looks at what effect fewer migrants would have had on aggregate earnings and employment (what we call the compo-sitional effect). The second looks at the direct effect that migrants have had on the labour market outcomes of natives in particular.
[9] Dustman, C. & Frattini, T., ‘The fiscal effects of immigration to the UK’, The Economic Journal 124, 2014
[10] Migration Advisory Committee, Analysis of the impacts of migration, 2012
Figure 6: Real median earnings (RPIJ-adjusted) natives and migrants: 1994-2016
Technical chart info (esp y axis)
Source: RF analysis of LFS, 1994-2016
This publication is available in the Wages & Income section of our website @resfoundation
11A brave new world: how reduced migration could affect pay, jobs and the labour market
If fewer or different types of migrants had come to the UK in past couple of decades average employments or earnings would have been different simply because of changes to the make-up of the UK population. However, the evidence suggests that these compositional effects would have been small.
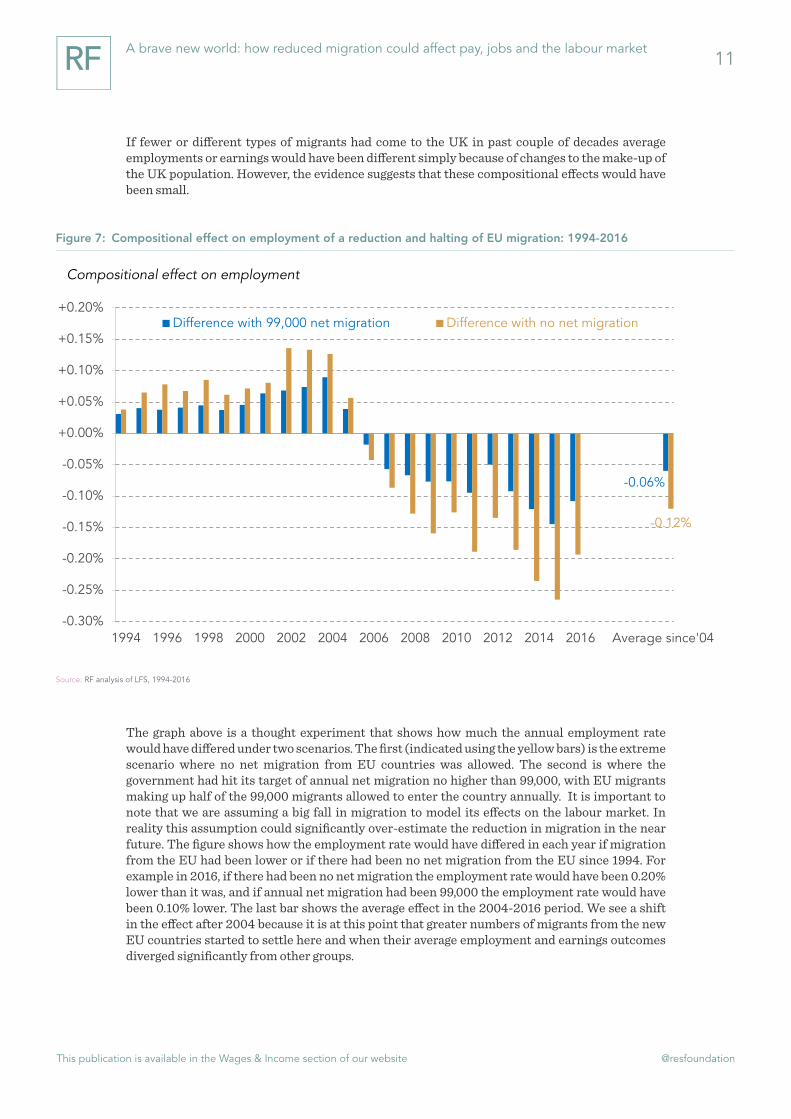
The graph above is a thought experiment that shows how much the annual employment rate would have differed under two scenarios. The first (indicated using the yellow bars) is the extreme scenario where no net migration from EU countries was allowed. The second is where the government had hit its target of annual net migration no higher than 99,000, with EU migrants making up half of the 99,000 migrants allowed to enter the country annually. It is important to note that we are assuming a big fall in migration to model its effects on the labour market. In reality this assumption could significantly over-estimate the reduction in migration in the near future. The figure shows how the employment rate would have differed in each year if migration from the EU had been lower or if there had been no net migration from the EU since 1994. For example in 2016, if there had been no net migration the employment rate would have been 0.20% lower than it was, and if annual net migration had been 99,000 the employment rate would have been 0.10% lower. The last bar shows the average effect in the 2004-2016 period. We see a shift in the effect after 2004 because it is at this point that greater numbers of migrants from the new EU countries started to settle here and when their average employment and earnings outcomes diverged significantly from other groups.
Figure 7: Compositional effect on employment of a reduction and halting of EU migration: 1994-2016
Technical chart info (esp y axis)
Source: RF analysis of LFS, 1994-2016
-0.06%
-0.12%
-0.30%
-0.25%
-0.20%
-0.15%
-0.10%
-0.05%
+0.00%
+0.05%
+0.10%
+0.15%
+0.20%
1994 1996 1998 2000 2002 2004 2006 2008 2010 2012 2014 2016 Average since'04
Difference with 99,000 net migration Difference with no net migration
Compositional effect on employment
This publication is available in the Wages & Income section of our website @resfoundation
12A brave new world: how reduced migration could affect pay, jobs and the labour market
It is important to note that the level of native employment is not affected here, rather that the proportion of overall working-age people in work is lower (reflecting the fact that EU migrants are more likely to be in work than natives). The two estimates are different because having no net migration further reduces the number of migrants from the new EU countries in the labour force and these migrants have higher employment rates than all other groups. It is important to bear in mind that this analysis just shows the effect of fewer EU migrants, if migration from the rest of the world was also reduced the results would be different. This thought experiment suggests that even very big reductions in migration would have a relatively small negative compositional effect on the average rate of employment in the short-term.
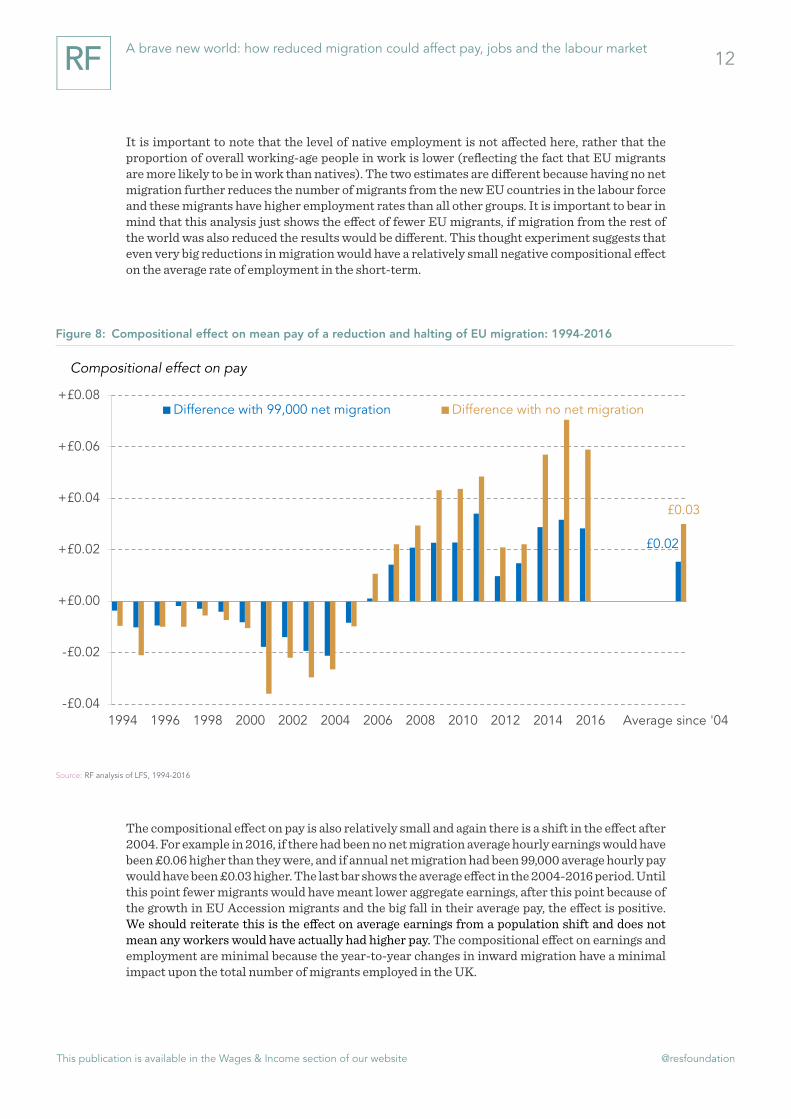
The compositional effect on pay is also relatively small and again there is a shift in the effect after 2004. For example in 2016, if there had been no net migration average hourly earnings would have been £0.06 higher than they were, and if annual net migration had been 99,000 average hourly pay would have been £0.03 higher. The last bar shows the average effect in the 2004-2016 period. Until this point fewer migrants would have meant lower aggregate earnings, after this point because of the growth in EU Accession migrants and the big fall in their average pay, the effect is positive. We should reiterate this is the effect on average earnings from a population shift and does not mean any workers would have actually had higher pay. The compositional effect on earnings and employment are minimal because the year-to-year changes in inward migration have a minimal impact upon the total number of migrants employed in the UK.
Figure 8: Compositional effect on mean pay of a reduction and halting of EU migration: 1994-2016
Technical chart info (esp y axis)
Source: RF analysis of LFS, 1994-2016
£0.02
£0.03
-£0.04
-£0.02
+£0.00
+£0.02
+£0.04
+£0.06
+£0.08
1994 1996 1998 2000 2002 2004 2006 2008 2010 2012 2014 2016 Average since '04
Difference with 99,000 net migration Difference with no net migration
Compositional effect on pay
This publication is available in the Wages & Income section of our website @resfoundation
13A brave new world: how reduced migration could affect pay, jobs and the labour market
At the aggregate level, native rates of employment and pay have been unaffected by migration – but small effects are vis-ible in specific occupations
The evidence is that the short-term compositional effects on earnings and employment of lower migration are marginal. What about the direct effect on native wages and employment?
We can estimate the likely effect of lower migration[11] on native earnings and employment by seeing how migration actually affected native wages and employment in the past. To do so we need to isolate the direct effect that migration had on the earnings and employment prospects of natives. This is very difficult to do. Following the main approach pursued in the relevant academic literature we look to see if changes in the share of migrants in an area is related to changes in the wages or employment prospects for natives in the same area, controlling for a range of other factors that may also have an effect.[12] More detail is given in the Annex.
The result of our version of this approach shows that, in aggregate, migrants have had no effect on the wages or employment prospects of natives. However it is wrong to say that migration has had no effect at all on native wages because this overall picture masks the fact that across the distri-bution of natives of different educational levels or in different occupations there has been some effect, albeit very small.
Below we look at how migration has affected native wages and employment over two time periods. The first is the annual effect of migration, the second is the cumulative effect over a number of years. In both cases we examine the effect that actual migration levels had compared to two counterfactuals: one in which annual net migration was 99,000 and the other in which annual net migration was zero.
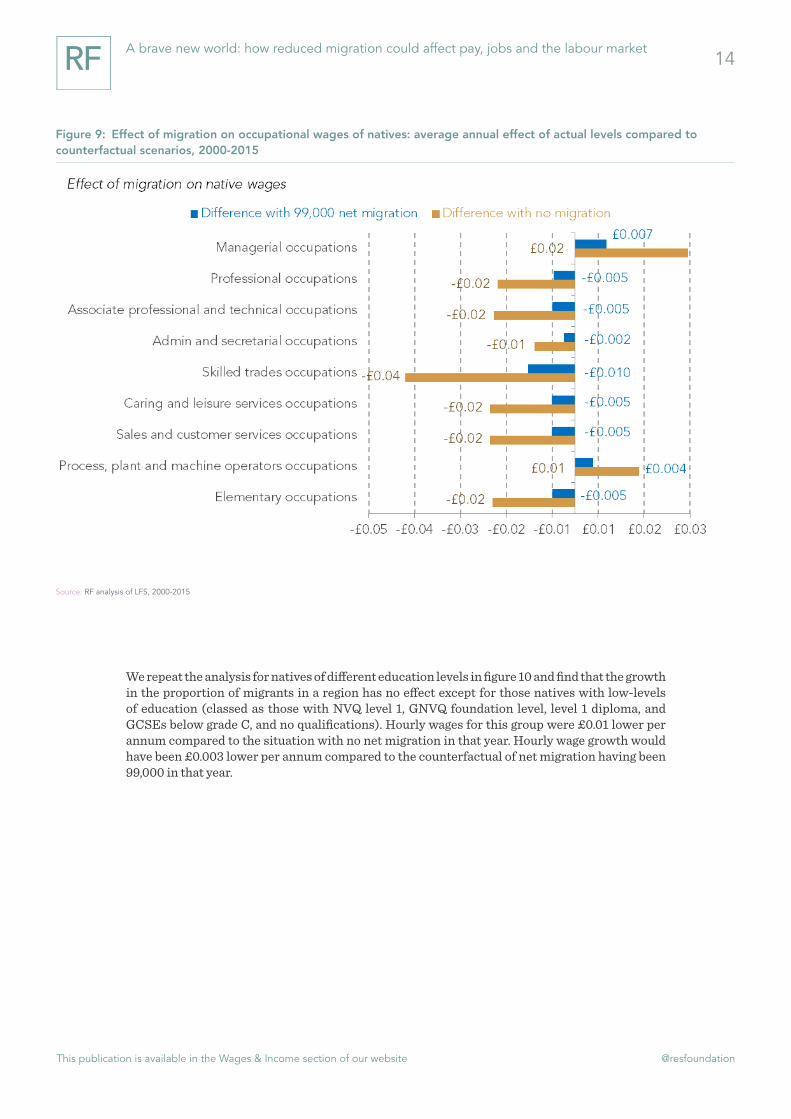
Figure 9 shows the effect that migration had on native wages on an annual basis between 2000 and 2015. It shows that the level of migration over the period resulted in an average drag on hourly wages in skilled trades occupations of £0.04 per annum. Hourly wages for these natives were on average £0.04 lower than they would have been in the absence of migration in that year, while the hourly wages in managerial occupations rose by an average of £0.02 every year. This is the effect that migration had compared to what would have happened in the absence of any net migration in each year. We can also estimate what the effect would have been had the UK experienced lower inward migration, specifically what the effect would have been had the government been able to restrict annual net migration to 99,000. Skilled trades occupations would have been an average £0.01 annual fall in hourly wages compared to a world where net migration had been reduced to 99,000 in each year. In contrast wages in managerial occupations would have increased by £0.007.
[11] In this section we model the effect that total migration had on native wages and employment not just migration from EU.
[12] Our analysis pursues an approach similar to that of S Nickell and J Saleheen, The impact of immigration on occupational
wages: evidence from Britain, Bank of England, December 2015. However, we look at the effect of migration on native wages, not
the wages of all workers.
This publication is available in the Wages & Income section of our website @resfoundation
14A brave new world: how reduced migration could affect pay, jobs and the labour market
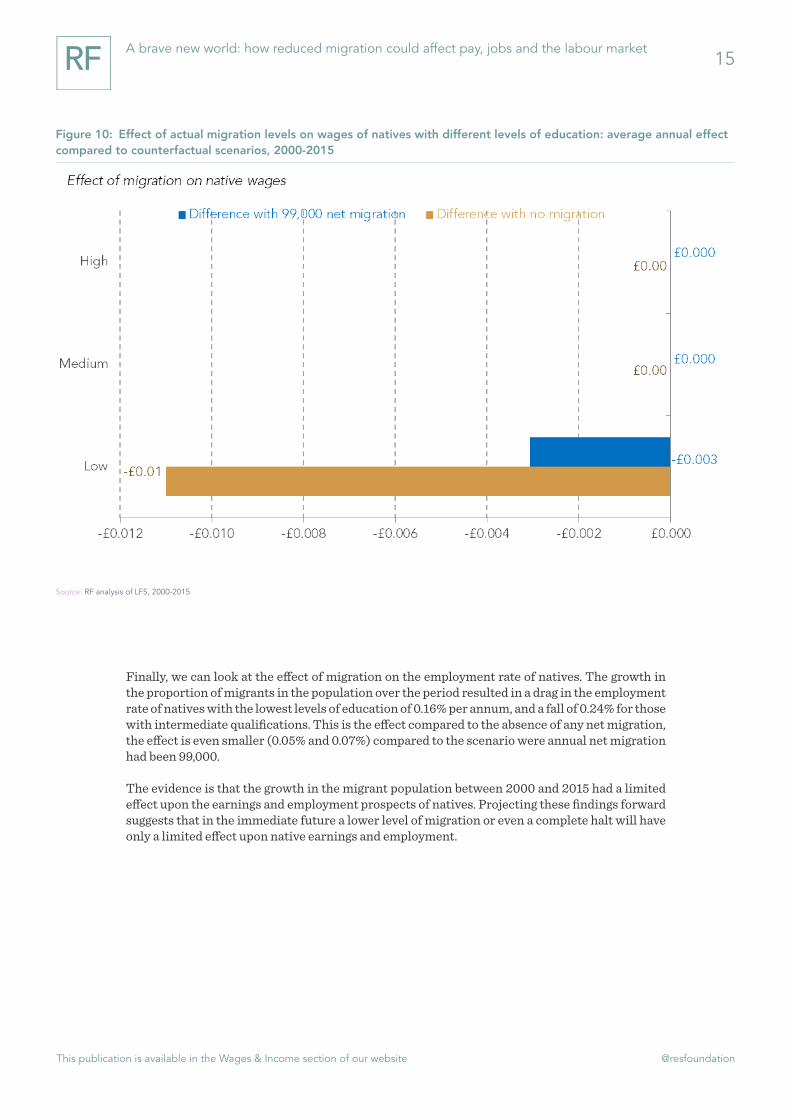
We repeat the analysis for natives of different education levels in figure 10 and find that the growth in the proportion of migrants in a region has no effect except for those natives with low-levels of education (classed as those with NVQ level 1, GNVQ foundation level, level 1 diploma, and GCSEs below grade C, and no qualifications). Hourly wages for this group were £0.01 lower per annum compared to the situation with no net migration in that year. Hourly wage growth would have been £0.003 lower per annum compared to the counterfactual of net migration having been 99,000 in that year.
Figure 9: Effect of migration on occupational wages of natives: average annual effect of actual levels compared to counterfactual scenarios, 2000-2015
Technical chart info (esp y axis)
Source: RF analysis of LFS, 2000-2015
This publication is available in the Wages & Income section of our website @resfoundation
15A brave new world: how reduced migration could affect pay, jobs and the labour market
Finally, we can look at the effect of migration on the employment rate of natives. The growth in the proportion of migrants in the population over the period resulted in a drag in the employment rate of natives with the lowest levels of education of 0.16% per annum, and a fall of 0.24% for those with intermediate qualifications. This is the effect compared to the absence of any net migration, the effect is even smaller (0.05% and 0.07%) compared to the scenario were annual net migration had been 99,000.
The evidence is that the growth in the migrant population between 2000 and 2015 had a limited effect upon the earnings and employment prospects of natives. Projecting these findings forward suggests that in the immediate future a lower level of migration or even a complete halt will have only a limited effect upon native earnings and employment.
Figure 10: Effect of actual migration levels on wages of natives with different levels of education: average annual effect compared to counterfactual scenarios, 2000-2015
Technical chart info (esp y axis)
Source: RF analysis of LFS, 2000-2015

This publication is available in the Wages & Income section of our website @resfoundation
16A brave new world: how reduced migration could affect pay, jobs and the labour market
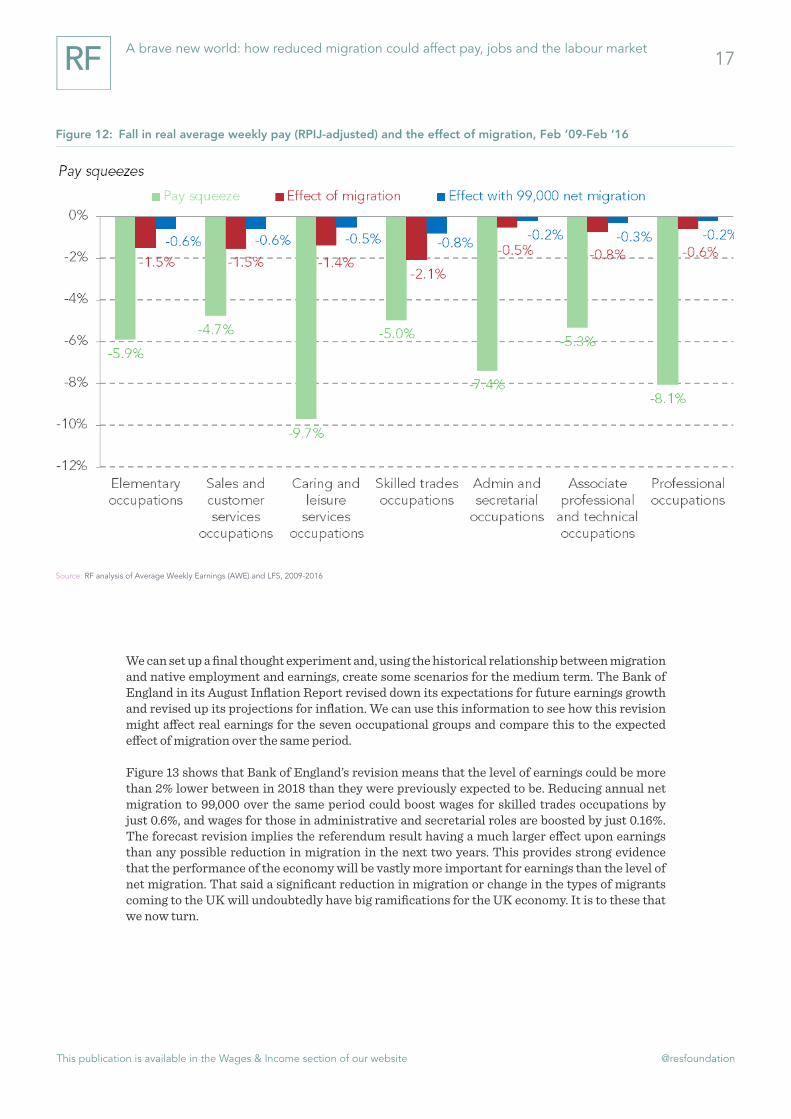
We now turn to an assessment of the cumulative effect of migration over a number of years. In particular we look at the effect of migration between February 2009 and the present. February 2009 marked the point at which native wages peaked. Figure 12 shows the percentage fall in average weekly pay from its peak for the seven occupational groups whose earnings have been negatively affected by migration. This is juxtaposed against the effect that migration had over the same period, and the estimated effect that actual migration had compared to annual net migration of 99,000. Compared to the situation with no net migration, the increase in migration over the period resulted in native wages for those in skilled trades occupations being 2.1% lower. Wages for this group have been squeezed by 0.8% compared to a world in which net migration had been 99,000. By comparison skilled trades occupations actually saw a 5% fall in their earnings over the period. The effect varied by occupation, in caring and leisure there was a 9.7% squeeze on earnings and the effect of migration was 1.4%. Wages for this group would have been squeezed by 0.5% compared to a world in which net migration had been 99,000. Across occupations, relative to the squeeze on earnings experienced, the effect of migration, though varied, was far less.
Figure 11: Effect of actual migration on employment rates of natives with different levels of education: annual effect compared to counterfactual scenarios, 2000-2015
Technical chart info (esp y axis)
Source: RF analysis of LFS, 2000-2015
This publication is available in the Wages & Income section of our website @resfoundation
17A brave new world: how reduced migration could affect pay, jobs and the labour market
We can set up a final thought experiment and, using the historical relationship between migration and native employment and earnings, create some scenarios for the medium term. The Bank of England in its August Inflation Report revised down its expectations for future earnings growth and revised up its projections for inflation. We can use this information to see how this revision might affect real earnings for the seven occupational groups and compare this to the expected effect of migration over the same period.
Figure 13 shows that Bank of England’s revision means that the level of earnings could be more than 2% lower between in 2018 than they were previously expected to be. Reducing annual net migration to 99,000 over the same period could boost wages for skilled trades occupations by just 0.6%, and wages for those in administrative and secretarial roles are boosted by just 0.16%. The forecast revision implies the referendum result having a much larger effect upon earnings than any possible reduction in migration in the next two years. This provides strong evidence that the performance of the economy will be vastly more important for earnings than the level of net migration. That said a significant reduction in migration or change in the types of migrants coming to the UK will undoubtedly have big ramifications for the UK economy. It is to these that we now turn.
Figure 12: Fall in real average weekly pay (RPIJ-adjusted) and the effect of migration, Feb ’09-Feb ‘16
Technical chart info (esp y axis)
Source: RF analysis of Average Weekly Earnings (AWE) and LFS, 2009-2016

This publication is available in the Wages & Income section of our website @resfoundation
18A brave new world: how reduced migration could affect pay, jobs and the labour market
A fall in migration will bring new labour market challenges
While it is wrong to say that migration has had no effect on specific groups of natives’ wages and employment, this effect has generally been small. Furthermore even a significant fall in migration in the medium term will have little effect on native earnings. However, the effect of reduced migration on specific industries and parts of the country could be significant. Responding to these new labour market challenges is an important task for the new government if they deliver on their intention to reduce migration levels significantly.
Migrant workers form an important part of the labour market. They bring skills, form a large part of the workforce in some sectors, and a large part of the population in some parts of the country.
Figure 13: The effect on earnings of post-Brexit economic revisions and bringing net migration down to 99,000: 2016-2018
Technical chart info (esp y axis)
Source: RF analysis of LFS and Bank of England’s August Inflation Report

This publication is available in the Wages & Income section of our website @resfoundation
19A brave new world: how reduced migration could affect pay, jobs and the labour market
Migrants from the EU do not need to possess any specific skills or qualifications to move to the UK. By contrast migrants from outside the EU generally need to have an offer of a graduate job paying a minimum of £20,800 (rising to £30,000 next year). This system has shaped the skills profile of the migrant population.
On average, although all groups of migrants are more likely to have a degree than natives, migrants from the rest of the world and the ‘original’ EU countries are far more likely to have a degree. Conversely migrants from the countries that joined the EU in 2004 are more likely to have no qualifications than natives.
Under a new immigration regime it is possible that highly-skilled or highly-educated migrants would be prioritised. This might significantly curtail low-skilled immigration, creating serious problems for sectors that rely on such labour.
The end of freedom of movement may also force the government to reconsider the immigration rules for migrants from outside the EU.
Figure 14: Qualifications held by migrants and natives: 2013-2016
Source: RF analysis of LFS

This publication is available in the Wages & Income section of our website @resfoundation
20A brave new world: how reduced migration could affect pay, jobs and the labour market
Table 1: The share of migrant workers in the total workforce for those industries where EU ‘accession’ migrants are most concentrated: 2014-2016
Source: RF analysis of LFS
These are the fifteen sectors where migrants from those countries that joined the EU in 2004 are most concentrated. Many of these sectors also have large numbers of migrants from other countries.
Given the high numbers of EU migrants in these sectors it is imperative for the government to resolve any immediate uncertainty about the residency and employment rights of these workers. In the short-term clarification will prevent any immediate shock to these sectors. Looking forward, the end of freedom of movement could make recruitment in these sectors much more difficult. Although for some of the higher-paying roles in these sectors, particularly engineering roles, workers may still be able to enter the UK through the Tier 2 visa scheme for shortage occupations that would not be the case for many low paying roles. Assuming no wider immigration system changes, there seems to be three courses of action that businesses could pursue: one; recruit more natives, two; change business models to invest in skills and/or labour-saving technology or three; reduce output in the UK.
It is unlikely that native workers will totally fill the gap at current wage rates. Pay in these sectors averages £9.32 an hour, significantly below average native wages of £11.09. We know that lots of workers in these sectors are migrants from the EU ‘accession’ countries, whose average earnings are £8.33, £2.76 below that of natives. With employment at an all-time high it is unlikely that there are large numbers of natives either looking for work that will be attracted to these sectors given the low-wages on offer. Similarly these kind of wage rates are currently not sufficient to bring those not in the labour market into participation. It seems unlikely that the simple absence of migrants would be enough to change that situation.
Therefore, another option for employers is to invest in skills and training so as to reduce their demand for labour for a given output. A positively corollary of this would be higher productivity and hopefully higher wages, attracting more natives to these sectors in time. For some businesses it may be possible to reconfigure their business model so that they employ fewer, but better paid, workers. Think for example of reversing the trend away from machine to manual car washing. The introduction and increase in the National Living Wage will add impetus to this.
Industry EU Accession EU OriginalRest of the
world All Pay
Share of total employment
Share of total
employment
Share of total
employment
Share of total
employment £,hourlyManufacture of food products 25.5% 4.2% 10.0% 39.7% £8.67Domestic personnel 15.9% 5.9% 13.1% 34.9% £7.70Undifferentiated goods 14.8% 7.4% 8.5% 30.7% £8.00Accommodation 14.6% 4.7% 9.7% 29.0% £7.17Warehousing & support for transport 12.2% 2.1% 9.2% 23.5% £10.60Services to buildings and landscape 10.8% 4.0% 10.1% 24.9% £7.50Mining of coal and lignite 10.0% 0.0% 0.0% 10.0% £11.05Manuf non-metallic mineral products 9.9% 1.3% 7.0% 18.1% £11.22Manufacture of furniture 9.8% 1.3% 4.9% 16.0% £8.82Manufacture of textiles 9.6% 1.6% 8.3% 19.6% £8.55Manufacture of wearing apparel 9.0% 2.3% 21.7% 33.0% £8.47Manufacture wood and wood products 8.6% 0.8% 4.5% 13.9% £9.70Manufacture rubber plastic products 8.3% 1.5% 3.9% 13.6% £9.75Construction of buildings 8.3% 2.3% 5.6% 16.2% £12.50Wholesale trade, except vehicles 8.2% 2.8% 8.1% 19.1% £10.05
All industries average 5% 3% 8% 16% £12.46

This publication is available in the Wages & Income section of our website @resfoundation
21A brave new world: how reduced migration could affect pay, jobs and the labour market
As well as investment in human capital, greater automation and mechanisation could be an option for some sectors. Studies suggest that some migrant-reliant sectors, such as food manufacturing, accommodation and textile manufacturing could see greater automation in the near-future.[13] Others such as domestic personnel and warehousing are unlikely to.
The government should encourage and support sectors in adapting to this new reality, especially if they plan to deliver large reductions in migrant labour. Indeed a focus on these sectors most affected by any change in migration flows should be as central to the new industrial strategy as high tech industries.
If businesses find it impossible to recruit more natives or reduce demand for labour then it is likely that many will reduce output in the UK.
Of course in reality migrant labour is unlikely to disappear entirely, even in these low-paid sectors. History and the experience of other countries tells us that the end of freedom of movement may well be accompanied by a temporary worker scheme of some kind. Indeed the existing set up of our non-EU immigration system makes provision for just such a scheme, which has lain dormant given that migration from within the EU more than met demand for low skill labour. Such a scheme may well now by made available if free movement is ended, but poses significant imple-mentation challenges.
Most importantly such a system will need to be policed if the migration it supports is genuinely to be temporary and this will require significant investment in labour market enforcement. At present most resources are spent enforcing the national minimum wage (NMW). HMRC’s enforcement team has a budget of £20 million and employs around 270 staff.[14] However it is estimated that underpayment of the NMW affects around 209,000 workers[15] with the Migration Advisory Committee noting that an average employer can expect a visit from a national minimum wage inspector just once in 250 years.[16] Other agencies are far less resourced. The GLAA has around 65 frontline staff, 27 per cent less than in 2010/11.[17] The ESAI has only nine inspectors and the number of staff has fallen by close to 50 per cent since 2009/10.[18] As a result, the three existing labour enforcement units have a combined staff of less than 350 – equivalent to one enforcement officer for every 20,000 working age migrants.
These agencies could be given responsibility for enforcing and policing any temporary workers schemes that might be set up in the future, but they are already stretched carrying out their current duties. If temporary labour migration is not to become illegal migration there would need to be significant investment in the future. Such investment will be needed at the same time as the coverage of the national living wage is expanding to cover over 3 million workers.[19] More generally this would point towards the government needing to reassess the UK’s currently light touch approach to labour market enforcement.
[13] H Bakhshi, C Frey and M Osborne, Creativity vs. robots: the creative economy and the future of employment, Nesta, 2015
[14] National Audit Office, Ensuring employers comply with National Minimum Wage regulations, May 2016
[15] ibid
[16] Migration Advisory Committee, Migrants in low-skilled work: The growth of EU and non-EU labour in low-skilled jobs and
its impact on the UK, July 2014
[17] Gangmasters Licensing Authority, Annual Report and Accounts 1 April 2014 to 31 March 2015, July 2015
[18] Employment Agency Standards, Inspectorate Annual report 2012 to 2013, November 2013
[19] See C D’Arcy, A Corlett and L Gardiner, Higher ground: who gains from the National Living Wage?, 2015

This publication is available in the Wages & Income section of our website @resfoundation
22A brave new world: how reduced migration could affect pay, jobs and the labour market
As well as sectoral differences, regions of the UK have experienced dramatically different changes in their migrant populations over the last decade. Figure 15 is a map of 405 local authorities in Great Britain. The dark green areas of the map are those that have seen large percentage increases in the proportion of migrants in the area between 2004 and 2015. Those in red have seen smaller increases or even contractions.
Figure 15: Percentage change in share of migrants in the population by local authority: 2004-2015
Source: RF analysis of Annual Population Survey (APS), 2004-2015
This publication is available in the Wages & Income section of our website @resfoundation
23A brave new world: how reduced migration could affect pay, jobs and the labour market
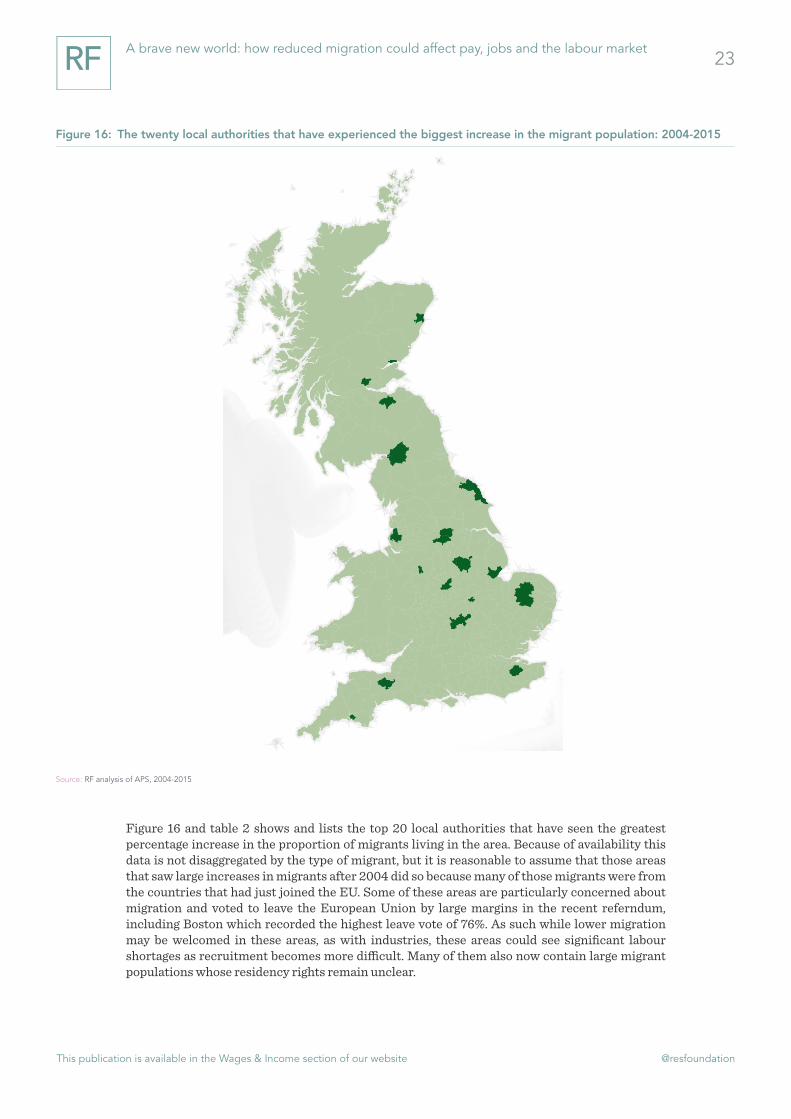
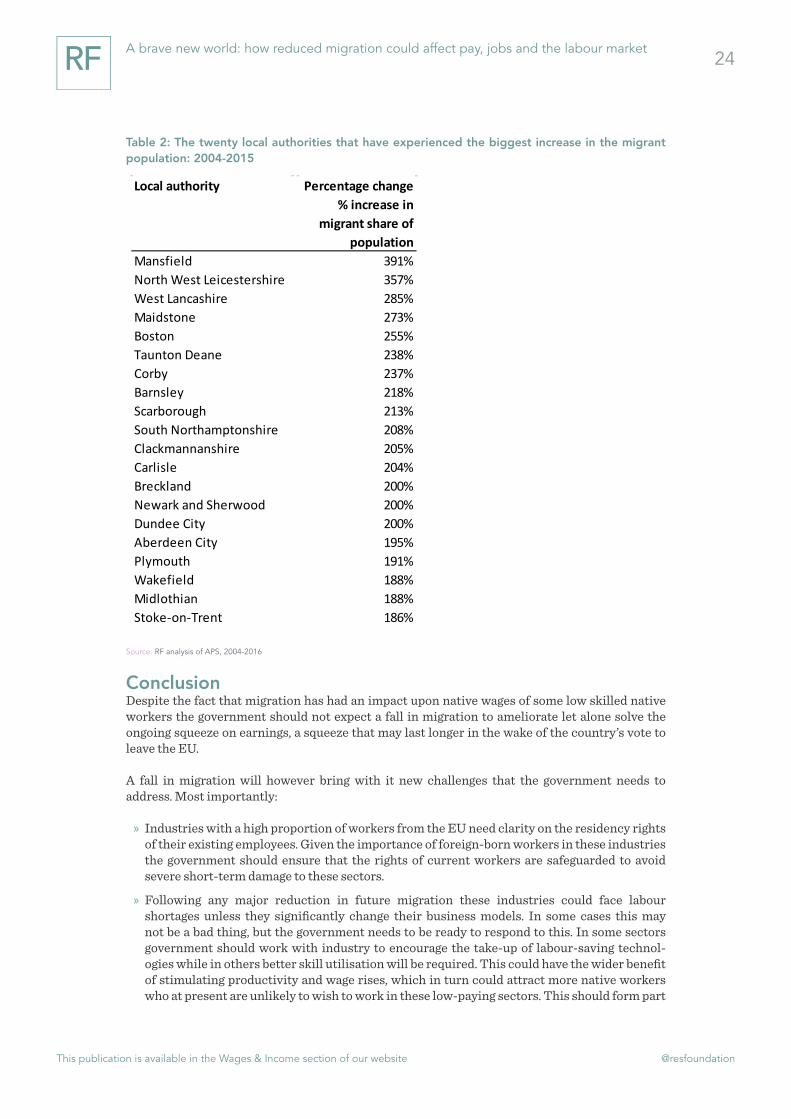
Figure 16 and table 2 shows and lists the top 20 local authorities that have seen the greatest percentage increase in the proportion of migrants living in the area. Because of availability this data is not disaggregated by the type of migrant, but it is reasonable to assume that those areas that saw large increases in migrants after 2004 did so because many of those migrants were from the countries that had just joined the EU. Some of these areas are particularly concerned about migration and voted to leave the European Union by large margins in the recent referndum, including Boston which recorded the highest leave vote of 76%. As such while lower migration may be welcomed in these areas, as with industries, these areas could see significant labour shortages as recruitment becomes more difficult. Many of them also now contain large migrant populations whose residency rights remain unclear.
Figure 16: The twenty local authorities that have experienced the biggest increase in the migrant population: 2004-2015
Source: RF analysis of APS, 2004-2015
This publication is available in the Wages & Income section of our website @resfoundation
24A brave new world: how reduced migration could affect pay, jobs and the labour market
Table 2: The twenty local authorities that have experienced the biggest increase in the migrant population: 2004-2015
Local authority Percentage change% increase in
migrant share of population
Mansfield 391%North West Leicestershire 357%West Lancashire 285%Maidstone 273%Boston 255%Taunton Deane 238%Corby 237%Barnsley 218%Scarborough 213%South Northamptonshire 208%Clackmannanshire 205%Carlisle 204%Breckland 200%Newark and Sherwood 200%Dundee City 200%Aberdeen City 195%Plymouth 191%Wakefield 188%Midlothian 188%Stoke-on-Trent 186%
Source: RF analysis of APS, 2004-2016
ConclusionDespite the fact that migration has had an impact upon native wages of some low skilled native workers the government should not expect a fall in migration to ameliorate let alone solve the ongoing squeeze on earnings, a squeeze that may last longer in the wake of the country’s vote to leave the EU.
A fall in migration will however bring with it new challenges that the government needs to address. Most importantly:
» Industries with a high proportion of workers from the EU need clarity on the residency rights of their existing employees. Given the importance of foreign-born workers in these industries the government should ensure that the rights of current workers are safeguarded to avoid severe short-term damage to these sectors.
» Following any major reduction in future migration these industries could face labour shortages unless they significantly change their business models. In some cases this may not be a bad thing, but the government needs to be ready to respond to this. In some sectors government should work with industry to encourage the take-up of labour-saving technol-ogies while in others better skill utilisation will be required. This could have the wider benefit of stimulating productivity and wage rises, which in turn could attract more native workers who at present are unlikely to wish to work in these low-paying sectors. This should form part
This publication is available in the Wages & Income section of our website @resfoundation
25A brave new world: how reduced migration could affect pay, jobs and the labour market
of the government’s new industrial strategy.
» In other industries, where increased automation is not possible, the development of temporary worker schemes may be needed or lower output will have to be accepted.
» The end of free movement and the development of a new immigration regime will probably require greater investment in labour enforcement, especially if new routes are created for temporary workers to fill low skilled labour market shortages. Although HMRC has benefitted from some increase in investment to police the NMW, the GLAA and ESAI have had their staff numbers cut. In all likelihood both agencies, HMRC and/or a new enforcement body will requirement significant investment going forward.
This publication is available in the Wages & Income section of our website @resfoundation
A brave new world: how reduced migration could affect pay, jobs and the labour market Annex 26
Annex
Datasets
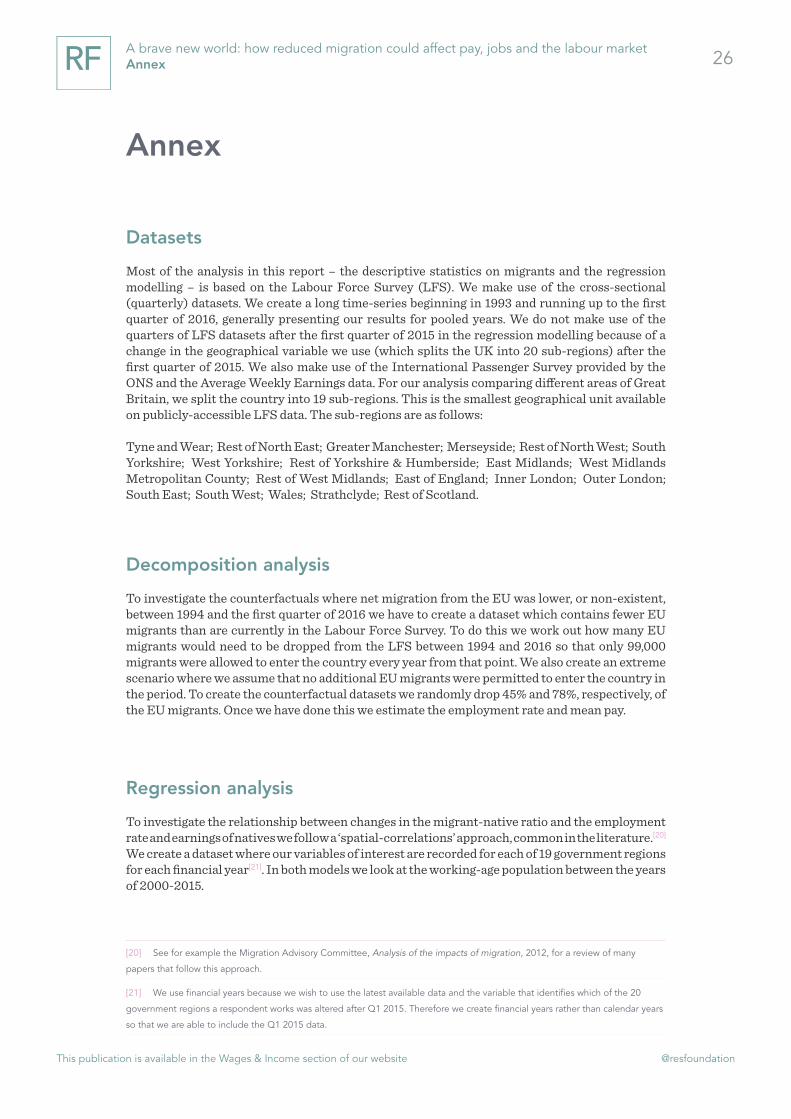
Most of the analysis in this report – the descriptive statistics on migrants and the regression modelling – is based on the Labour Force Survey (LFS). We make use of the cross-sectional (quarterly) datasets. We create a long time-series beginning in 1993 and running up to the first quarter of 2016, generally presenting our results for pooled years. We do not make use of the quarters of LFS datasets after the first quarter of 2015 in the regression modelling because of a change in the geographical variable we use (which splits the UK into 20 sub-regions) after the first quarter of 2015. We also make use of the International Passenger Survey provided by the ONS and the Average Weekly Earnings data. For our analysis comparing different areas of Great Britain, we split the country into 19 sub-regions. This is the smallest geographical unit available on publicly-accessible LFS data. The sub-regions are as follows:
Tyne and Wear; Rest of North East; Greater Manchester; Merseyside; Rest of North West; South Yorkshire; West Yorkshire; Rest of Yorkshire & Humberside; East Midlands; West Midlands Metropolitan County; Rest of West Midlands; East of England; Inner London; Outer London; South East; South West; Wales; Strathclyde; Rest of Scotland.
Decomposition analysis
To investigate the counterfactuals where net migration from the EU was lower, or non-existent, between 1994 and the first quarter of 2016 we have to create a dataset which contains fewer EU migrants than are currently in the Labour Force Survey. To do this we work out how many EU migrants would need to be dropped from the LFS between 1994 and 2016 so that only 99,000 migrants were allowed to enter the country every year from that point. We also create an extreme scenario where we assume that no additional EU migrants were permitted to enter the country in the period. To create the counterfactual datasets we randomly drop 45% and 78%, respectively, of the EU migrants. Once we have done this we estimate the employment rate and mean pay.
Regression analysis
To investigate the relationship between changes in the migrant-native ratio and the employment rate and earnings of natives we follow a ‘spatial-correlations’ approach, common in the literature.[20] We create a dataset where our variables of interest are recorded for each of 19 government regions for each financial year[21]. In both models we look at the working-age population between the years of 2000-2015.
[20] See for example the Migration Advisory Committee, Analysis of the impacts of migration, 2012, for a review of many
papers that follow this approach.
[21] We use financial years because we wish to use the latest available data and the variable that identifies which of the 20
government regions a respondent works was altered after Q1 2015. Therefore we create financial years rather than calendar years
so that we are able to include the Q1 2015 data.

This publication is available in the Wages & Income section of our website @resfoundation
A brave new world: how reduced migration could affect pay, jobs and the labour market Annex 27
We run a two-stage least squares fixed effect regression with the following parameters:
Earnings of natives/Employment of natives = migrant-native ratio + national minimum wage as a proportion of regional median pay + average age of natives + proportion of labour force educated to degree level or above i.financial year i.region
Our preferred specification includes robust standard errors to correct for heteroscedasticity and we instrument the migrant-native ratio with a ‘shift-share’ instrument of the type used by Ottaviano and Peri.[22] We construct the instrument by starting from a base year sufficiently far from the beginning of our analysis (1995) and predicting the share of migrants and natives in each region using the average national growth rate in the two populations over the subsequent two decades. This provides predicted migrant and native shares which will be correlated with the real shares. The instrument differs from the actual variable where the migrant and native shares grew at different rates in a region from the national average. As a result the instrument should be exogenous to the economic developments which occurred over the period.
We have nine different occupational groups as defined in the LFS:
» Managers, Directors And Senior Officials
» Professional Occupations
» Associate Professional And Technical
» Administrative And Secretarial
» Skilled Trades Occupations
» Caring, Leisure And Other Services
» Sales And Customer Service Occupations
» Process, Plant And Machine Operatives
» Elementary Occupations
We have three different educational groups:
» Natives with a higher degree, NVQ4, BTEC level 5 HNC/HND/BTEC higher, diploma of higher education and of further education, foundation degrees and first degrees.
» Natives with A-level or equivalent, NVQ level 3 and 2, Level 4 diploma and certificate, trade apprenticeship, and with GCSE A*-C or equivalent
» Natives with NVQ level 1, GNVQ foundation level, level 1 diploma, and GCSEs below grade C, and no qualifications
[22] Ottaviano, G. & Peri, G. The economic value of cultural diversity: evidence from US cities, Journal of Economic Geography
6, 2006

This publication is available in the Wages & Income section of our website @resfoundation
A brave new world: how reduced migration could affect pay, jobs and the labour market Annex 28
Table 3: The effect on wages and employment of changes in the migrant share of the regional population, regression results: Great Britain 2000-2015
Occupation
Coefficient on independent variable:
migrant-native ratioElementary occupations -0.486***Process, plant and machine operators occupations 0.284*Sales and customer services occupations -0.491***Caring and leisure services occupations -0.449***Skilled trades occupations -0.674**Admin and secretarial occupations -0.172**Associate professional and technical occupations -0.245***Professional occupations -0.184***Managerial occupations 0.287**All occupations -0.237
Educational levelLow -0.258**Medium -0.145High 0.0928All educational levels -0.103
Educational level
Coefficient on independent variable:
migrant-native ratioLow -0.460***Medium -0.511***High -0.0997***All educational levels -0.357
Wages
Employment
Source: RF modelling based on LFS
Using these coefficients and the change in the independent variable over different periods we can calculate what effect migration had over that period. To estimate the effect that migration would have had if annual net migration had been restricted to 99,000 we can use these coefficients in combination with ‘simulated’ changes in the migrant-native ratio. We calculate these simulated changes by seeing how a slower increase in the migrant stock in the Labour Force Survey would feed through into a slower increase in the migrant-native ratio over the period.
To estimate the effect of migration on native wages between 2016 and 2018 we need to project forward the migrant native ratio. To do this we use the ONS’ National population projections to project forward the native and migrant populations. We use the projection assuming high migration and the projection if annual net migration is 99,000 over the next three years. We then use this information in combination with the regression coefficients to estimate the effect of migration on wages in the three years between 2016 and 2018.

This publication is available in the Wages & Income section of our website @resfoundation
29A brave new world: how reduced migration could affect pay, jobs and the labour market

resolutionfoundation.org [email protected] +44 (0)203 372 2960 @resfoundation
Resolution Foundation is an independent research and policy organisation. Our goal is to improve the lives of people with low to middle incomes by delivering change in areas where they are currently disadvantaged. We do this by:
» undertaking research and economic analysis to understand the challenges facing people on a low to middle income;
» developing practical and effective policy proposals; and » engaging with policy makers and stakeholders to influence
decision-making and bring about change.
For more information on this report, contact:
Stephen ClarkeResearch & Policy [email protected] 020 3372 2953