a bmp toolbox for reducing dissolved phosphorus … · 1.12.2017 · 2 purpose of this document...
TRANSCRIPT

A Working Document for the
Development of:
A BMP Toolbox
for Reducing
Dissolved Phosphorus Runoff
From Cropland
to Lake Erie
Prepared by:
John P. Crumrine, July 29, 2011
(With edits through November 21, 2011)
Supported by Grant # 833
from the Great Lakes Protection Fund
to Heidelberg University,
National Center for Water Quality Research
Dr. David Baker, Project Director

2
Purpose of this document
This document is intended to provide background information and a framework for
discussions on ways to reduce dissolved phosphorus runoff from croplands into Lake Erie.
While this document was produced to serve as a basis for discussions among the advisory team
members for Grant #833 from the Great Lakes Protection Fund (GLPF) to Heidelberg University,
it may also be useful to other groups who are now mobilizing to address this same issue. Our
GLPF project team does include farmers from the Sandusky Watershed, soil and water district
personnel, extension agents, USDA personnel (NRCS and ARS) and their Canadian counterparts,
state agency personnel, agricultural fertilizer industry representatives, area CCAs and
cooperatives, Sandusky Watershed Coalition representatives, and university researchers from
three states.
We believe that the agricultural community needs to develop a consensus on which
BMPs hold the best prospects for reducing dissolved phosphorus loading from the various crop
production settings within the Lake Erie Watershed, based on currently available information.
While it is true that more research is needed on certain BMPs, it is also clear that pressures to
“do something about dissolved phosphorus runoff” are mounting rapidly and, as researchers
and managers, we can’t wait for new research. That consensus needs to be developed very
soon and communicated to all “stakeholders” including the agricultural, environmental,
commercial and public communities.
Because so many groups are coming to similar conclusions regarding the need for
consensus and action, we are circulating this document in draft form. We welcome feedback
from others, as well as suggestions on how this document may best serve to advance that
consensus process and subsequent actions.
David B. Baker,
National Center for Water Quality Research
July 29, 2011
3
"Toolbox" of Best Management Practices (BMP's) to Reduce Loading of
Dissolved Phosphorus (DP) to Streams and Ditches in NW Ohio
Background
Over the past decade or more, increased losses of dissolved phosphorus (DP) from agricultural
cropland in NW Ohio and resultant eutrophication of the Western Lake Erie Basin have been well
documented. The purpose of this "Toolbox" is to compile a list of BMPs that conservation planners and
farmers might use or adopt to reduce DP losses to ditches and streams as well as provide insight as to
practice function and effectiveness. This focus on DP is not to diminish the importance of BMPs for the
reduction of particulate phosphorus losses through the process of erosion and sedimentation. In fact,
many of the practices are the same. Rather, the "Toolbox" of BMPs for DP will work to complement a
nutrient management plan that addresses all cropland phosphorus loss in a comprehensive manner.
Important perspective that demands this approach is that as cropland erosion rates and related losses of
particulate phosphorus have decreased, the relative importance of dissolved phosphorus has increased.
Not only has dissolved phosphorus runoff as a percentage of total phosphorus loss increased, the total
amounts of dissolved phosphorus export have more than doubled since the mid-1990's.
Using conservation tillage to include no-till and conservation buffers, NW Ohio farmers successfully
met the challenge to reduce sediment and particulate phosphorus delivery to Lake Erie in the 1980's and
1990's. Now the challenge for farmers is to successfully adopt practices that will reduce delivery of
dissolved phosphorus to the Lake. Meeting this challenge will not only improve water in lakes but keep
fertilizer dollars in the field. "Toolbox" can help do this!
Scope of the "Toolbox"
Compilation of DP BMP's shown in Table 1 was completed within the following framework:
Focus primarily on BMP's that would reduce DP losses from commercial fertilizers and soils,
since phosphorus contributions from livestock are relatively small in NW Ohio;
Rate the BMP's according to their effectiveness to reduce DP in NW Ohio;
Provide relative practice costs and the likelihood of adoption by farmers;
Develop a suggested combination of DP BMP practices that, in conjunction with other
particulate phosphorus BMPs might prove most effective in significantly reducing runoff DP;
Exclude from the "Toolbox" BMPs that had little or no effect on DP in runoff;
Determine areas where additional research might be needed to better understand DP BMP
function and/or adoption.
How BMPs Were Selected
The "Toolbox" for phosphorus BMPs is full! The objective here was to sort through that "Toolbox"
and to put BMPs for DP in the upper tray of the "Toolbox" where they are more visible. Since many of
the practices have benefits for the reduction of both particulate and dissolved phosphorus, criteria were
needed for the purpose of BMP selection. Criteria were derived from an understanding of the processes
by which phosphorus becomes dissolved, then moves with water in cropland fields. (See References:
"Dissolved Phosphorus Sources and Movement in Agricultural Cropland.”) Essentially, when highly
4
soluble commercial phosphorus fertilizers are applied to a field surface, they begin to dissolve quickly in
the presence of moisture. If there is enough water (rainfall, snowmelt), dissolved phosphorus begins
moving downward in the soil profile via infiltration. When precipitation or snowmelt exceeds the
infiltration capacity of the soil, water begins to move as surface flow across the soil in the field. Much
greater surface flows, along with greater DP losses, happen when large storms of longer duration occur
in a day or so after fertilizer application without incorporation. While the first storm after surface
phosphorus fertilizer application results in the highest enrichment of phosphorus concentration for
runoff or release to the soil, subsequent storms can also result in DP losses from fertilizer residues on
the soil surface. Eventually, DP losses revert to release of phosphorus held by the soil. Agronomic soil
tests, or more recently, environmental soil tests, are used to assess the extent of DP loss from soils
during times of runoff or leaching.
Knowledge of this dissolved phosphorus generation and movement process has been incorporated
within numerous state and governmental "Phosphorus Indexes" which assess the risk of a particular
field for phosphorus losses to water where environmental damage may occur. Index components
address both the sources of phosphorus that contribute to losses plus the transport mechanisms by
which source material is moved from the field. Understanding relationships between these source and
transport factors lead, in turn, to BMPs to reduce phosphorus loss from a field.
For the DP BMP "Toolbox" in Table 1, sources are commercial phosphorus fertilizers and soil
phosphorus measured by soil testing. Transport factors are surface storm or snowmelt runoff and
subsurface leaching and drainage (tile). The following criteria are used to evaluate practices for DP BMP
selection:
How does the BMP influence DP concentrations within the field?
How does the BMP influence storm or surface runoff from the field?
Combining these evaluations results in an assessment of edge of field loading (Concentration X
Flow) to streams or ditches. DP BMPs selected are expected, at least overall, to have a positive effect in
the reduction of DP loading from the field.
Ample documented work by others aided the selection of the BMP's shown in Table 1. (See
References: "Agricultural Best Management Practices.”) Rating practice effectiveness proved difficult
since research sometimes gave either conflicting views or ranges of results; and much of the research
was, of course, not done specifically in NW Ohio. The BMP "Tile Drain Outlet Control" was the best
example of difficulty rating practice effectiveness. (See References: "Rating the Effectiveness of
Dissolved Phosphorus Best Management Practices.”) Even with these difficulties, patterns of practice
effectiveness did emerge based on how and to what degree a specific practice impacted either DP
concentration or storm runoff in fields representing a variety of cropland conditions across agricultural
portions of the United States and Ontario, Canada. To add perspective to the scale of practice
effectiveness, some highly effective practices, although ones that would not be adopted on a large scale
by cropland farmers, were added to the DP BMP list. "CRP Cover - Trees” is an example, but then use of
the field as cropland would be lost. The rating system used for Conservation Practice Physical Effects
(CPPE) in Section V of the Ohio NRCS Field Office Technical Guide served as a model for making practice
ratings. Other references, however, were used to more accurately rate a BMP with respect to impacts
on DP concentrations or storm runoff. OSU Fact Sheet AEX-464-91, USDA-ARS Publication 163 and the
SERA 17 Workgroup BMP publications were particularly helpful in this regard.
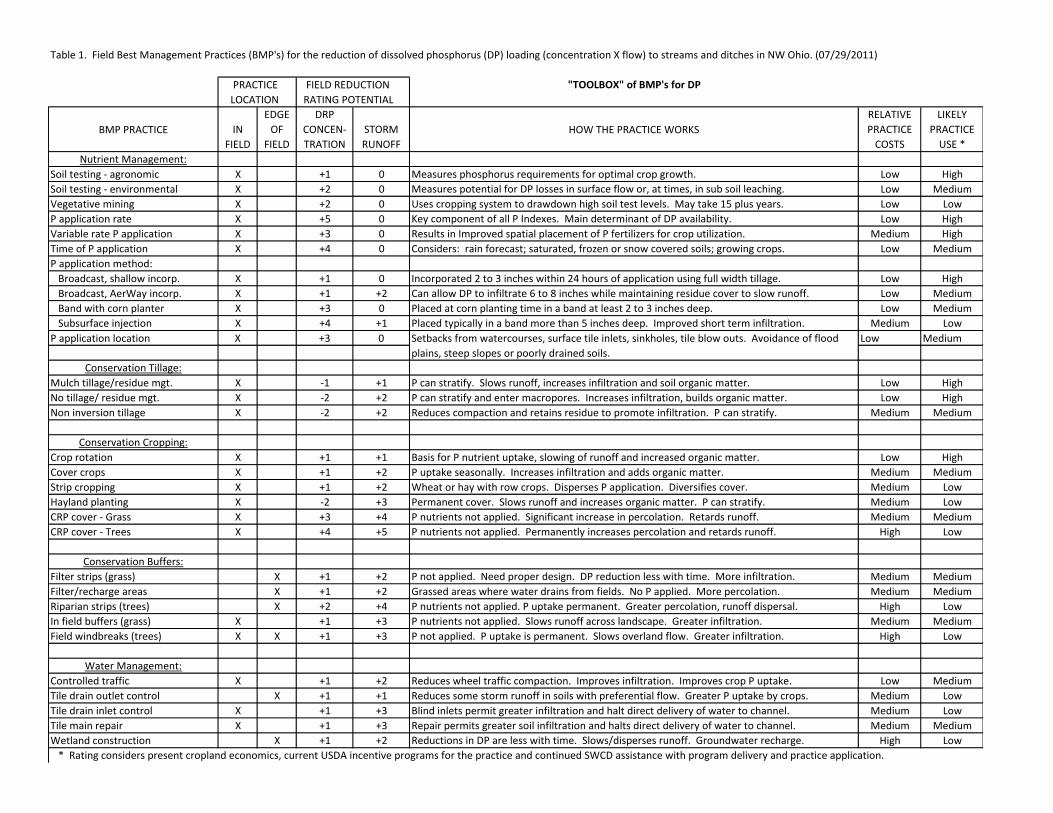
Table 1. Field Best Management Practices (BMP's) for the reduction of dissolved phosphorus (DP) loading (concentration X flow) to streams and ditches in NW Ohio. (07/29/2011)
PRACTICE FIELD REDUCTION "TOOLBOX" of BMP's for DP
LOCATION RATING POTENTIAL
BMP PRACTICE IN
FIELD
EDGE
OF
FIELD
DRP
CONCEN-
TRATION
STORM
RUNOFF
HOW THE PRACTICE WORKS
RELATIVE
PRACTICE
COSTS
LIKELY
PRACTICE
USE *
Nutrient Management:
Soil testing - agronomic X +1 0 Measures phosphorus requirements for optimal crop growth. Low High
Soil testing - environmental X +2 0 Measures potential for DP losses in surface flow or, at times, in sub soil leaching. Low Medium
Vegetative mining X +2 0 Uses cropping system to drawdown high soil test levels. May take 15 plus years. Low Low
P application rate X +5 0 Key component of all P Indexes. Main determinant of DP availability. Low High
Variable rate P application X +3 0 Results in Improved spatial placement of P fertilizers for crop utilization. Medium High
Time of P application X +4 0 Considers: rain forecast; saturated, frozen or snow covered soils; growing crops. Low Medium
P application method:
Broadcast, shallow incorp. X +1 0 Incorporated 2 to 3 inches within 24 hours of application using full width tillage. Low High
Broadcast, AerWay incorp. X +1 +2 Can allow DP to infiltrate 6 to 8 inches while maintaining residue cover to slow runoff. Low Medium
Band with corn planter X +3 0 Placed at corn planting time in a band at least 2 to 3 inches deep. Low Medium
Subsurface injection X +4 +1 Placed typically in a band more than 5 inches deep. Improved short term infiltration. Medium Low
P application location X +3 0 Low Medium
Conservation Tillage:
Mulch tillage/residue mgt. X -1 +1 P can stratify. Slows runoff, increases infiltration and soil organic matter. Low High
No tillage/ residue mgt. X -2 +2 P can stratify and enter macropores. Increases infiltration, builds organic matter. Low High
Non inversion tillage X -2 +2 Reduces compaction and retains residue to promote infiltration. P can stratify. Medium Medium
Conservation Cropping:
Crop rotation X +1 +1 Basis for P nutrient uptake, slowing of runoff and increased organic matter. Low High
Cover crops X +1 +2 P uptake seasonally. Increases infiltration and adds organic matter. Medium Medium
Strip cropping X +1 +2 Wheat or hay with row crops. Disperses P application. Diversifies cover. Medium Low
Hayland planting X -2 +3 Permanent cover. Slows runoff and increases organic matter. P can stratify. Medium Low
CRP cover - Grass X +3 +4 P nutrients not applied. Significant increase in percolation. Retards runoff. Medium Medium
CRP cover - Trees X +4 +5 P nutrients not applied. Permanently increases percolation and retards runoff. High Low
Conservation Buffers:
Filter strips (grass) X +1 +2 P not applied. Need proper design. DP reduction less with time. More infiltration. Medium Medium
Filter/recharge areas X +1 +2 Grassed areas where water drains from fields. No P applied. More percolation. Medium Medium
Riparian strips (trees) X +2 +4 P nutrients not applied. P uptake permanent. Greater percolation, runoff dispersal. High Low
In field buffers (grass) X +1 +3 P nutrients not applied. Slows runoff across landscape. Greater infiltration. Medium Medium
Field windbreaks (trees) X X +1 +3 P not applied. P uptake is permanent. Slows overland flow. Greater infiltration. High Low
Water Management:
Controlled traffic X +1 +2 Reduces wheel traffic compaction. Improves infiltration. Improves crop P uptake. Low Medium
Tile drain outlet control X +1 +1 Reduces some storm runoff in soils with preferential flow. Greater P uptake by crops. Medium Low
Tile drain inlet control X +1 +3 Blind inlets permit greater infiltration and halt direct delivery of water to channel. Medium Low
Tile main repair X +1 +3 Repair permits greater soil infiltration and halts direct delivery of water to channel. Medium Medium
Wetland construction X +1 +2 Reductions in DP are less with time. Slows/disperses runoff. Groundwater recharge. High Low
* Rating considers present cropland economics, current USDA incentive programs for the practice and continued SWCD assistance with program delivery and practice application.
Setbacks from watercourses, surface tile inlets, sinkholes, tile blow outs. Avoidance of flood
plains, steep slopes or poorly drained soils.

6
In Table 1, the numeric values in the Field Reduction Rating Potential columns should be interpreted as
follows:
-2 somewhat moderate negative effect +2 somewhat moderate positive effect
-1 minor negative effect +3 moderate positive effect
0 little or no effect +4 somewhat major positive effects
+1 minor positive effect +5 major positive effects
How the Practice Works - Details for Use in NW Ohio
For a detailed description of the BMPs shown in Table 1, review Section IV of the Ohio NRCS
Field Office Technical Guide: Practice Standards and Specifications. In some cases, the practice listed is
a component of the overall standard. For example, "Phosphorus Application Method" is a component of
"Nutrient Management", practice standard "590".
Soil Testing - Agronomic (includes grid or precision testing) Traditional soil testing, using Mehlich 3 or
similar extraction processes, is an excellent tool to measure plant available phosphorus within soil in
order to determine amounts of phosphorus fertilizers needed (or not needed) for optimal crop
production. Both appropriate soil testing and appropriate fertilizer application recommendations based
on those soil test results are important for phosphorus nutrient management. (See References:
"Phosphorus Soil Testing.”) According to researchers at Ohio State University, there is no agronomic
benefit to applying fertilizers when soil test values exceed 60 ppm Mehlich 3 P (Mullen and Dayton,
2010). At soil test levels above 60 ppm the potential for release of excess soil phosphorus to runoff or
leaching increases, which heightens the risk of environmental damage to streams and lakes. The State
of Ohio recommends that special management steps be taken to limit phosphorus application in fields
testing over 50 ppm Bray 1P and to cease application in fields testing over 150 ppm Bray 1P. These
standards use agronomic soil test values to avoid unneeded phosphorus fertilizer applications where
their use may risk damage to the environment.
Soil Testing - Environmental Environmental soil testing is intended to specifically measure amounts of
soil phosphorus available to runoff or leaching following rainfall or snowmelt. (See References:
"Phosphorus Soil Testing.”) Generally, as soil test phosphorus increases, the concentration of DP in
runoff increases. This is especially true when soil test phosphorus values climb beyond the critical
levels. Environmental soil testing approaches may differ from standard agronomic soil test methods so
that estimates of potential phosphorus losses from a field are more precise. One example would be an
extraction using only distilled water. Another might calculate degree of soil phosphorus saturation using
knowledge of soil chemistry related to iron and aluminum oxides and hydroxides present. To make even
more accurate estimates of phosphorus loss potential, environmental soil tests frequently measure the
degree of phosphorus stratification within the 0 to 8 inch surface soil profile typical of Ohio soils. A
combination of fertilizer application method, presence of decayed crop residues and a reduction in
tillage can result in the accumulation of phosphorus near the soil surface where there is a higher risk for
dissolution in runoff water. Past studies suggest that the critical zone for soil phosphorus interaction
with runoff is the 0 to 2 inch surface layer (Voss and Griffith, 1998.) More recent research shows that
7
the 0 to 2 centimeter depth may be the layer of greatest interaction (Pierzynski, 2004.) Envision
stratified phosphorus soil testing as taking the "blood pressure" of the soil. While the lower "pressure"
is important for agronomic reasons, the upper "pressure" is important for environmental reasons. A
final important value of stratified soil phosphorus testing is that it provides an integrated summary of
how phosphorus nutrients were managed in a field over recent history. Information provided by
advances in environmental soil testing will permit improved phosphorus nutrient management both
within and beyond field boundaries.
Vegetative Mining Sometimes called "crop drawdown" or "soil test drawdown,” vegetative mining is a
good option for lowering high soil test phosphorus values by the removal of crop biomass. Research
indicates that when soil test phosphorus values exceeds critical levels required for optimal crop
production, fertilizer phosphorus can be reduced or omitted without impacting yield potential. While
the production of hay or silage crops might drawdown soil test phosphorus levels more quickly, the
production of high yielding annual crops can be quite effective in "mining" as well. Drawdown occurs
more rapidly in fields where initial soil test values are well beyond critical levels and in fields with low
cation exchange capacity (CEC) or low organic matter (OM). At best, reduction in soil test values from
vegetative mining occurs in 3 to 5 years, but in some fields reductions do not occur for 15 years or more.
The fact that drawdown occurs more rapidly in fields having low organic matter indicates that BMPs
which increase amounts of soil organic matter are of key importance in retaining DP within soils.
Farmers are often reluctant to use vegetative mining and would prefer to use at least some phosphorus
fertilizers when planting crops (corn, wheat) responsive to phosphorus.
Phosphorus Application Rate Rate or amount of fertilizer applied per acre is a DP BMP of key
importance. Where no or little application is made, there is simply no or little opportunity for DP
generation from the product. Typically, new phosphorus fertilizer applications can result in runoff DP
concentrations much higher than would occur in runoff from unfertilized soils in NW Ohio.
Variable Rate Phosphorus Application This practice takes advantage of gridded field soil testing and fine
tunes application rates spatially within a field. The practice helps ensure more effective and efficient
use of any phosphorus fertilizers that are applied.
Time of Phosphorus Application Timing is a key management decision that can impact the entire DRP
generation and movement process. Avoiding application of phosphorus fertilizers prior to rain storms
on saturated soils or on frozen or snow covered soils are important examples. Applying phosphorus
nutrients closer to the time of crop or cover crop utilization is another important timing factor from the
standpoint of DP loss from fields.
Phosphorus Application Method The operating principle here is clear. When phosphorus fertilizers are
placed in a location that minimizes interaction with rainfall and runoff and maximizes uptake within soil
or crops, the potential for generation of DP is significantly reduced. As placement depth increases, the
runoff potential decreases. Broadcasting with no incorporation actually heightens the risk for
generation of high DP concentrations in both runoff water and water leaching into the soil during or
8
after a storm. Broadcasting phosphorus fertilizers on crop residues followed by use of an AerWay
aerator (vertical tillage using rolling 8 inch tines to fracture and loosen soil) or some similar tool would
to some extent permit infiltration of dissolved phosphorus and slow runoff, especially where surface
compaction may have existed. Most research with the AerWay, however, has been done with animal
manures. The banding of phosphorus fertilizers with a corn planter is an effective way to place
phosphorus fertilizers below the 0 to 2 inch zone where rapid phosphorus dissolution can occur.
Banding also places phosphorus near corn roots for efficient uptake by the crop. Currently larger farm
operations having larger fields often replace older planters with new and wider ones lacking features to
band apply phosphorus at planting time. This effective banding method is not then and option to these
farmers. Subsurface injection (5 inches or more deep in widths to match next corn crop) of phosphorus
fertilizers is the most effective method for reduction of high DP concentrations at the soil surface and
the injection tool fractures soil sufficiently to increase short term infiltration. Improved phosphorus
uptake by crop roots also occurs with placement beneath the row, when surface soils may be dry and
when soil test phosphorus is low. Retaining crop residues while using shallow incorporation, banding
with a corn planter or subsurface injection will further retard storm runoff.
Phosphorus Application Location Application location is a second key management decision that
impacts the amount of DP in runoff. Application "setbacks" from areas of concentrated flow, surface tile
inlets, tile "blow outs" or sinkholes can measurably reduce the potential for off field movement of
phosphorus fertilizers with runoff. These "setbacks" minimize direct delivery of DP to areas of surface
runoff and create distances where DP has an opportunity to infiltrate the soil and later be removed by
crops. In a similar manner, avoiding phosphorus fertilizer applications in flood plains, on steep slopes or
poorly drained soils can be of equal importance. Type of application method can work in tandem with
this practice to reduce potential for DP loss from fields.
Conservation Tillage (Residue Management) While these practices alone, or in conjunction with
fertilizer application methods, can do a great deal to speed infiltration and retard runoff, their use over
time results in an accumulation of phosphorus near the soil surface where interaction with surface
runoff occurs. Once infiltration is exceeded and runoff begins, soils under various forms of conservation
tillage can transfer greater amounts of phosphorus to surface runoff than would result from soils
without stratification. Thus, the potential for conservation tillage to increase DP concentrations in
surface runoff is high. Even in the absence of significant amounts of surface runoff, the existence of
macropores formed under conservation tillage, especially no-till, can permit DP losses to tile from
smaller rains and saturated soil conditions. Non-inversion tillage is generally done to reduce compaction
at depth (narrow straight shank rippers run at 8 inches or more deep) or near the surface (an AerWay
aerator, for example). Both tools promote infiltration and retard runoff but the effect is not permanent
and stratification of phosphorus still remains. A highly positive long term impact of conservation tillage
is to increase soil organic matter which improves greatly the capacity of soils to hold more water and
adsorb larger amounts of phosphorus nutrients. Consideration of soil as a living biological entity -- not
just "dirt" -- aids the concept of residue management.

9
Conservation Cropping This practice affords farmers options for selecting types of annual or perennial
crops and the sequence in which they are grown to maximize production and profitability. High yielding
crops not only remove large amounts of phosphorus from soils but also produce large amounts of
organic matter which improve soil tilth. Cover crops can extend these benefits during portions of the
year when production crops are not growing. Strip cropping, an option not normally used in NW Ohio,
does diversify fertilizer application methods and decrease surface runoff potential for a given field each
year. While phosphorus can stratify in soils with several years of hay land production, grass/legume
cover can significantly slow cropland runoff. A common thread among all conservation cropping
systems is their ability to uptake soil phosphorus, build organic matter and slow runoff. "CRP-grass" and
"CRP-trees" are listed as DP BMPs that are highly effective, but the cropland function with these land
use conversions is lost. CRP program modification, however, might enable establishment of
grass/legume cover for a period of 3 to 5 years within current cropping rotations.
Conservation Buffers Buffers add diversity to the agricultural landscape and by location and design
create opportunities to both decrease DP concentrations and especially slow runoff. Proper design,
installation and maintenance are required to permit buffer effectiveness over the long term. Permanent
buffers with a diversity of vegetation yield the greatest benefits. Riparian or streamside buffers that
include trees, shrubs and grass are examples. Grassed filters along ditches or streams, while highly
effective in trapping sediment, do little to remove dissolved pollutants like DP from runoff passing
through the grass. During early years of establishment, grassed filters provide some uptake of DP, but
this benefit lessens with time. Stratification of phosphorus within grassed filters can also occur as
sediments deposit and vegetative material decays. Filter recharge areas are similar in some respects to
grass filter strips but are designed and strategically located to infiltrate and slow runoff as it flows into
and through lower portions of drain ways leaving a field. Periodic harvesting or removal of grass
vegetation from filters can lessen the risk of phosphorus accumulation at the soil surface and improve
DP uptake in new vegetative growth. "In-Field Buffers" of either trees or grass are another option for
improving infiltration and retarding runoff, especially in fields with long continuous slopes. In-field
buffers of greater width would be more effective in such cases. Another benefit of most buffers is the
reduction or elimination of phosphorus fertilizer application to those runoff sensitive portions of a field.
Fertilizer rates in the field are then somewhat reduced and application setbacks are well defined.
Water Management The major functions of water management DP BMPs is to slow, delay or retard the
amounts of either surface flow or subsurface leaching in a field. Benefits to DP concentration reductions
are little or minor. Controlled traffic, which limits wheel traffic compaction to strips throughout the field
(50 percent of field area or sometimes more), slows surface runoff by improving infiltration. Improved
soil structure that results enables greater phosphorus utilization by crops. Tile drainage outlet controls
can reduce a portion of runoff, especially where preferential flow may be significant. Retaining tile or
drainage water during the growing can also serve to irrigate crops which can improve phosphorus
nutrient uptake and crop yields. Without careful management, however, this practice could result in
wet soils at the time of a runoff event and cause greater runoff amounts than a system without outlet
controls. Tile drain inlet control and tile main repair serve a similar purpose. Replacing a surface tile
inlet with a "blind" inlet (coarse stone over tile but covered with 6 to 10 inches of soil) or repairing a tile

10
"blow out" within a drain way both work to halt or delay the direct entry of surface water to tile
drainage systems. This delay permits greater infiltration and allows other edge of field DP BMPs (filter
strips, recharge areas, etc.) to function as planned. Wetland construction (enhancement, restoration or
creation) slows runoff, increases evaporation and recharge of ground water but does little to reduce DP
concentrations in storm runoff over the long term.
A Usable Combination of DP BMPs for NW Ohio
The field DP BMP table not only estimates practice effectiveness for reduction of DP concentrations
and storm runoff but also shows relative practice costs and the likelihood that practices might be used
by farmers. With this perspective, the following practices might best work to address increasing levels
of DRP in runoff from NW Ohio cropland.
Soil Testing - Agronomic (includes grid or precision testing) Adopt stratified testing as an integral part of
standard agronomic testing. Information documenting both horizontal and vertical distribution of
phosphorus within the soil profile would permit greater evaluation of past phosphorus fertilizer
management within a field and quantify soil test levels where fertilizers might better be managed in the
future from the standpoint of environmental concerns. Soil test organic matter levels will be important
in evaluating overall results of conservation cropping and tillage systems being used. Costs of this
practice are low.
Phosphorus Application Rate Carefully scrutinize the application of additional commercial phosphorus
fertilizers where soil test phosphorus exceeds critical levels for crops planned within the rotation.
Farmers can benefit economically if fertilizers are not needed for crop production. Use "Vegetative
Mining" where soil test levels well exceed critical levels.
Phosphorus Application Method Place any required additional phosphorus fertilizers at depth within
the soil to ensure product retention within the field. For example, 5 to 7 inch placement would be
better than 2 to 3 inches; but 2 to 3 inches would be better than surface application without
incorporation. This practice may pose some economic hardship to farmers, but it can make significant
improvements for water quality. Proper placement of phosphorus fertilizers at depth in the soil may
negate the need for other DP BMPs such as setback distances.
Time of Phosphorus Application Apply phosphorus fertilizers closer to the time of crop utilization.
Application at other times raises concerns with saturated soils, frozen or snow covered soils and
prolonged fertilizer exposure to runoff and leaching, often in the absence of phosphorus uptake by a
growing crop. While the apparent cost of this practice is relatively low, the practicality of applying
needed phosphorus fertilizers for all crops in a large farming operation during the growing season can
have added costs due to logistics, equipment and product storage.
Conservation Cropping/Tillage (Residue Management) Select a system that will optimize crop
production from fertilizer inputs, increase infiltration, slow runoff and raise soil organic matter levels.
Less tillage is better than more tillage; and more organic matter grown (includes cover crops) is also

11
better than less organic matter. Many of the DP BMPs in this arena are already used by most farmers
and costs of adoption are low to medium.
Conservation Buffers Utilize buffers to help define setbacks from ditches or streams and to provide
areas that slow runoff and permit infiltration. Cost of many of these practices is medium to high but
incentive payments within government programs often assist with establishment. The likelihood of
adoption is typically less for permanent "tree" buffers than for "grass" buffers.
Water Management Give added emphasis to these BMPs which will either reduce compaction or halt
direct delivery of surface water to sub surface tile systems. Positive aspect is that reducing compaction
through controlled traffic increases crop yields. Negative aspect is that slowing runoff through "blind"
inlets or tile outlet control may be viewed as impairing agricultural drainage. Most farmers would
welcome assistance or support to repair large broken tile mains or "blow outs".
An example of Phosphorus Fertilization Practices in a corn-soybean-corn-soybean-wheat rotation
under conservation tillage management
YEAR 1: Plant corn using some form of strip tillage or conservation tillage. In late summer or
early fall after YEAR 5 wheat harvest, where some form of chisel plowing or other tillage is
frequently done, broadcast but incorporate phosphorus fertilizers required for both corn
and the following soybean crop (YEAR 2). In cases where soil test buildup may be needed
for the wheat portion of the rotation, apply additional phosphorus fertilizer. Subsurface
injection would be a second option where the goal is to maintain crop residues on the soil
surface. A portion of the phosphorus required for these two corn-soybean years could be
banded with a corn planter equipped to do so.
YEAR 2: Plant soybeans using either no-till or some other form of conservation tillage.
YEAR 3: Plant corn using either no-till or fall strip tillage. In fall after YEAR 2 soybean harvest,
fall subsurface inject in bands phosphorus fertilizers required for both corn and the
following soybean crop (YEAR 4). If injection is not possible due to wet soils or lack of
equipment, band apply required phosphorus with the corn planter.
YEAR 4: Plant soybeans using either no-till or some other form of conservation tillage.
YEAR 5: No-till wheat. (NOTE: Avoid fall broadcast phosphorus fertilizer application prior to
planting wheat.)
Areas in Need of Further DP BMP Research
In the formulation of this DP BMPs list, several areas in need of additional research were
evident, especially for NW Ohio.
Soil Testing - Agronomic Updated research is needed on how current hybrid crops respond to various
soil test phosphorus levels. Also, it is important to have better knowledge of how wheat yields are
impacted when fall broadcast phosphorus applications are not made. Does the "Tri-State Fertilizer
Guide" need revision?

12
Soil Testing - Environmental There needs to be improved understanding of how soil test phosphorus
values just beyond critical levels begin to influence concentrations of DP in runoff and leaching. Should
there be an environmental concern between critical levels and the 150 ppm soil test phosphorus level
used widely (Ohio, Michigan, Indiana, Ohio NRCS) as an indicator of environmental risk?
Vegetative Mining Documentation that crop yield potential is not jeopardized when phosphorus
fertilizers are not applied above critical soil test level for specific crops is needed. Research of cropping
methods or systems that would most quickly drawdown elevated soil test phosphorus values, especially
when they are high at or near the soil surface, is needed.
Phosphorus Application Method Evidence to measure the effectiveness of the AerWay aerator (or
other vertical tillage tools that could produce similar results) for reducing DP concentrations and storm
runoff is necessary. Research should evaluate the potential of AerWay use to move phosphorus
fertilizers into the soil by improving capacity of soils to infiltrate first storm runoff. This potential might
also enable greater phosphorus leaching from soils having accumulation of phosphorus near the surface.
What impact the disruption of macropores in the 0 to 8 inch soil layer has on soil adsorption of
phosphorus also needs evaluation as part of this effort.
Conservation Cropping/Tillage Systems An improved understanding of soil organic matter trends in NW
Ohio is needed to provide perspective on the health and function of systems currently used. Such
research could also evaluate the extent current systems can retain water and nutrients. Research on
the impacts of long term continuous no-till on both DP concentrations and storm runoff amounts is
needed. Improved knowledge of DP concentration changes with movement through a soil profile under
long term no-till is important.
Conservation Buffers Better knowledge of which practices are really most effective for DRP reduction is
really needed, along with a social-economic evaluation of practice adoption relating to costs or
inconvenience.
Water Management This area is probably most in need of research in NW Ohio. The practices listed in
the area of water management do function to lessen DRP impacts on field runoff, but the entire subject
of subsurface drainage requires scrutiny in many areas. How does the current trend of increasing
subsurface drainage intensity relate to overall flow volumes and DRP movement? What fraction of
storm runoff from fields may actually be subsurface contributions? How do increases in preferential
flow as a result of less tillage impact runoff volumes through tile? How does preferential flow affect the
capacity of soils to adsorb DRP? Or does preferential flow serve primarily as transport pathway to tile
after recent phosphorus fertilizer application or when soil test phosphorus levels are great? How much
permanent vegetative cover and in what field or watershed locations is needed to measurably reduce
runoff peaks?
John P. Crumrine
13
May 30, 2011
The following individuals provided pertinent information or helpful insight during the preparation of this
document:
Steve Davis. USDA-NRCS, Retired. Western Lake Erie Basin Advisor
Cory Hohman. USDA-NRCS, Engineering Technician. Tiffin Field Office
Mary Ann Hawk. USDA-NRCS, District Conservationist. Tiffin Field Office
Frank Gibbs. USDA-NRCS, Resource Soil Scientist. Findlay Area Service Center
Lynn Eberhard. District Technician, Seneca Soil and Water Conservation District. Tiffin
Rick Wilson. Ohio EPA, Division of Surface Water. Columbus, OH
Norman Fausey. USDA-ARS. Research Soil Scientist, Soil Drainage Research Unit. Columbus, OH
Martin Shipitalo. USDA-NRCS. Research soil Scientist. Coshocton, OH