oaktrust.library.tamu.edu › bitstream › handle › 1969.1 › etd-tamu-2750 › ... · sediment...
TRANSCRIPT

SEDIMENT DYNAMICS OF AN IMPOUNDED RIVER:
YEGUA CREEK, TEXAS
A Thesis
by
ADRIANA E. MARTINEZ
Submitted to the Office of Graduate Studies of Texas A&M University
in partial fulfillment of the requirements for the degree of
MASTER OF SCIENCE
May 2008
Major Subject: Geography

SEDIMENT DYNAMICS OF AN IMPOUNDED RIVER:
YEGUA CREEK, TEXAS
A Thesis
by
ADRIANA E. MARTINEZ
Submitted to the Office of Graduate Studies of Texas A&M University
in partial fulfillment of the requirements for the degree of
MASTER OF SCIENCE
Approved by:
Chair of Committee, Anne Chin Committee Members, Andrew Klein Bruce Herbert Head of Department, Douglas Sherman
May 2008
Major Subject: Geography

iii
ABSTRACT
Sediment Dynamics of an Impounded River:
Yegua Creek, Texas. (May 2008)
Adriana E. Martinez, B.S., Texas A&M University
Chair of Advisory Committee: Dr. Anne Chin
Dams have altered flow distributions in rivers everywhere, causing a host of
changes in channel morphology and sediment dynamics. Although major changes in
flow regime have occurred along Yegua Creek, Texas, since the closure of Somerville
Dam in 1967, the issue of sediment transport has not been studied in detail. The extent
to which sediment is moving through the system remains unclear. This study addresses
the extent to which sediment is moving through and downstream of the dam. Analysis
of sediment samples collected at 23 sites in the Yegua Creek channel system showed
that coarse sand to silt-sized materials dominate the creek upstream of the dam, whereas
finer silt and clay sediments characterize the downstream portions. Calculation of the
trapping efficiency of the dam indicates that approximately 99.8% of materials from the
upper watershed are trapped behind Somerville Dam. Investigations of sediment
mobility further suggest that present flows are capable of mobilizing sediments
downstream of the dam. Although a de-coupling between the upper and lower portions
of the Yegua Creek watershed has likely occurred due to the high rate of sediment
trapping, new sediment sources that include tributaries and alluvial storage likely play a
larger role in providing materials for sediment transport downstream. Despite a reuction

iv
in peak flows, the channel morphology of Yegua Creek has apparently adjusted over the
four decades since construction of Somerville Dam to achieve a new equilibrium
characterized by sediment movement. These results are corroborated by analysis of
aerial photographs.
These findings augment our understanding of the many facets of the response of
fluvial systems to the disturbance posed by dam construction. Because Yegua Creek is a
major tributary to the Brazos River draining to the Texas coast, increased understanding
of sediment dynamics within Yegua Creek provides critical insights into the efficacy of
sediment delivery in a regional context, and ultimately to the Texas coastline. The
findings of this study also provide useful information for managing stream ecosystems
affected by impoundments.

v
DEDICATION
To my parents, Juanita and Cesar Martinez, my sister, Alejandra Martinez and my grandmother, Olivia Rodriguez

vi
ACKNOWLEDGEMENTS
I couldn’t have successfully completed this thesis without the support and
encouragement of the following people. My advisor, Dr. Anne Chin provided excellent
advice and guidance throughout this process. Without her encouraging me to pursue a
graduate career in fluvial geomorphology, I would not have realized my passion for it. I
would also like to thank my committee members. Dr. Bruce Herbert: thanks for all your
advice and encouragement. Dr. Andrew Klein: thanks for providing helpful advice,
being a mentor, and challenging me to become a better student and researcher. Also,
thanks to Dr. Vatche Tchakerian who has advised and encouraged me during my time
here at A&M.
I would not be where I am today without the support of my family. Thanks Mom
and Dad for constantly encouraging me to accomplish my dreams. I couldn’t have done
it without you. You taught me that with hard work and dedication, anything can be
accomplished. Also, I would like to thank my sister, Alejandra Martinez; it wouldn’t
have been possible without you as my sister and best friend. To Randy Laurence, who
introduced me to the wonder of rivers and inspired in me a love for the environment.
Thanks for your inspiration; you’ll never know just how much you shaped my future.
A special thanks to Dr. Dawna Cerney and Kevin Merritt for always lending an
ear, giving helpful advice, great one-liners, analogies, and just and making me laugh.
Also, thanks to Drs. Sarah and Bob Bednarz who made graduate school seem like a
family to me. And for endless advice and assistance during field work thanks to Jazmin

vii
Castillo, Adam Krutchinsky, Alisha Lombardi, Eugene Farrell, Gina Lane, Jennifer
Morris, Jessie Taylor, Joni Kincaid, Nikki Williams, Russell Meier, Tracy Smith,
Valerie Blakey, and Wansang Ryu. Specifically, I would like to thank Megan Meier for
accompanying me on every one of my field trips, braving the cold and rainy conditions
and being a great friend.
And finally thanks to the Texas Water Development Board and the Texas Natural
Resource Information System for providing needed data as well as John B. Landolt who
allowed me to sample on his property numerous times. Sediment analysis would not
have been possible without the help of the Soil Characterization Lab. Thanks to all who
work there, especially Dr. Tom Hallmark and Donna Prochaska. Thanks so much for all
of your help, advice, and the warm atmosphere you provided while I processed my
samples.

viii
TABLE OF CONTENTS
Page
ABSTRACT .............................................................................................................. iii
DEDICATION .......................................................................................................... v
ACKNOWLEDGEMENTS ...................................................................................... vi
TABLE OF CONTENTS .......................................................................................... viii
LIST OF FIGURES................................................................................................... x
LIST OF TABLES .................................................................................................... xiii
CHAPTER
I INTRODUCTION................................................................................ 1
Background .................................................................................... 1 Objectives....................................................................................... 2 Organization of the Research ......................................................... 4
II LITERATURE REVIEW..................................................................... 5
Introduction .................................................................................... 5 Hydrological Impacts ..................................................................... 5 Sedimentological Effects................................................................ 7 Morphological Changes ................................................................. 10 Ecological Impacts ......................................................................... 12 The Context for Yegua Creek ........................................................ 14
III STUDY AREA..................................................................................... 17
Regional Setting ............................................................................. 17 The Yegua Creek Watershed.......................................................... 23 Somerville Dam.............................................................................. 30 Previous Work................................................................................ 32

ix
CHAPTER Page
IV METHODS........................................................................................... 34
General Approach .......................................................................... 34 Data Acquisition and Preprocessing .............................................. 37 Field Procedures ............................................................................. 38 Laboratory Methods ....................................................................... 44 Theoretical Calculations................................................................. 49 Aerial Photograph Analysis ........................................................... 53
V RESULTS............................................................................................. 55
Sediment Characteristics ................................................................ 55 Sediment Movement through Somerville Dam.............................. 73 Sediment Movement Downstream of Somerville Dam ................. 75 Observations from Aerial Photographs .......................................... 78
VI DISCUSSION AND CONCLUSION.................................................. 89
Discussion ...................................................................................... 89 Summary of Findings ..................................................................... 100 Significance.................................................................................... 102 Limitations of Study....................................................................... 103 Suggestions for Future Research.................................................... 105 Conclusions .................................................................................... 107 REFERENCES.......................................................................................................... 108
APPENDIX A ........................................................................................................... 116
VITA ......................................................................................................................... 126

x
LIST OF FIGURES
FIGURE Page
1 Yegua Creek drainage basin....................................................................... 18 2 Washington State Park Climograph. .......................................................... 19 3 Average monthly discharge, Yegua Creek downstream of Somerville dam, 1967-1991 ....................................................................... 19 4 Yegua Creek drainage basin soil survey .................................................... 21 5 USGS gaging stations, Yegua Creek drainage basin ................................. 22 6 Annual peak discharge 1925-1991............................................................. 24 7 Flood frequency curve for Yegua Creek before and after stream impoundment.............................................................................................. 24 8 Middle Yegua Creek .................................................................................. 25
9 East Yegua Creek ....................................................................................... 25 10 West Yegua Creek...................................................................................... 26 11 Nails Creek ................................................................................................ 27 12 Cedar Creek................................................................................................ 27 13 Davidson Creek .......................................................................................... 28 14 Yegua Creek downstream Somerville Dam ............................................... 28
15 Yegua Creek, Landolt Cross section B, spring 2007. ................................ 29 16 Yegua Creek near its confluence with the Brazos River............................ 29 17 Unstable banks visible on Yegua Creek at Highway 50 crossing.............. 31 18 Somerville Dam outlet and Yegua Creek................................................... 31

xi
FIGURE Page
19 Yegua Creek study site locations ............................................................... 39 20 Placement of width, depth, and velocity measurements to
determine discharge.................................................................................... 42
21 Suspended sediment sample locations ....................................................... 43 22 Yegua Creek cumulative particle size distribution curves ......................... 57 23 Middle Yegua Creek cumulative particle size distribution curves ............ 57 24 East and West Yegua Creek cumulative particle size distribution............. 58 25 Davidson Creek cumulative particle size distribution curves .................... 58 26 Nails and Cedar Creek cumulative particle size distribution curves.......... 59
27 Median bed sediment sizes, Yegua Creek drainage basin ......................... 62 28 Median bed sediment size classifications................................................... 63 29 The 84th percentile bed sediment sizes, Yegua Creek drainage basin ....... 63 30 The 84th percentile bed sediment size classification .................................. 64 31 Median sediment size distributions upstream of Somerville Dam ............ 64 32 Davidson Creek median sediment size distribution ................................... 65
33 Yegua Creek sediment size distribution downstream of Somerville Dam. 66 34 Low flow suspended sediment concentrations........................................... 71 35 Suspended sediment concentrations upstream of Somerville Dam ........... 72
36 Yegua Creek suspended sediment concentrations downstream of Somerville Dam.......................................................................................... 72
37 Davidson Creek suspended sediment concentrations................................. 73 38 High flow suspended sediment concentration............................................ 73

xii
FIGURE Page
39 Cumulative water volume loss in Lake Somerville between 1995 and 2003 ..................................................................................................... 74 40 Methods figure ........................................................................................... 80 41 Yegua Creek depositional features at the Wolf Creek confluence............. 81 42 Yegua Creek depositional features at the Davidson Creek confluence...... 83 43 Depositional and erosional features downstream of Somerville Dam ....... 85 44 Depositional and erosional features upstream of Y50US .......................... 86 45 Yegua Creek depositional feature downstream of Somerville Dam .......... 87 46 Same location on Yegua Creek after major flood event ............................ 87 47 Y50US cross section .................................................................................. 88 48 Riparian vegetation and agricultural development on Yegua Creek near its confluence with the Brazos River.................................................. 95 49 Yegua Creek during flood event downstream of Somerville Dam ............ 99 50 Same location after flood event.................................................................. 99
xiii
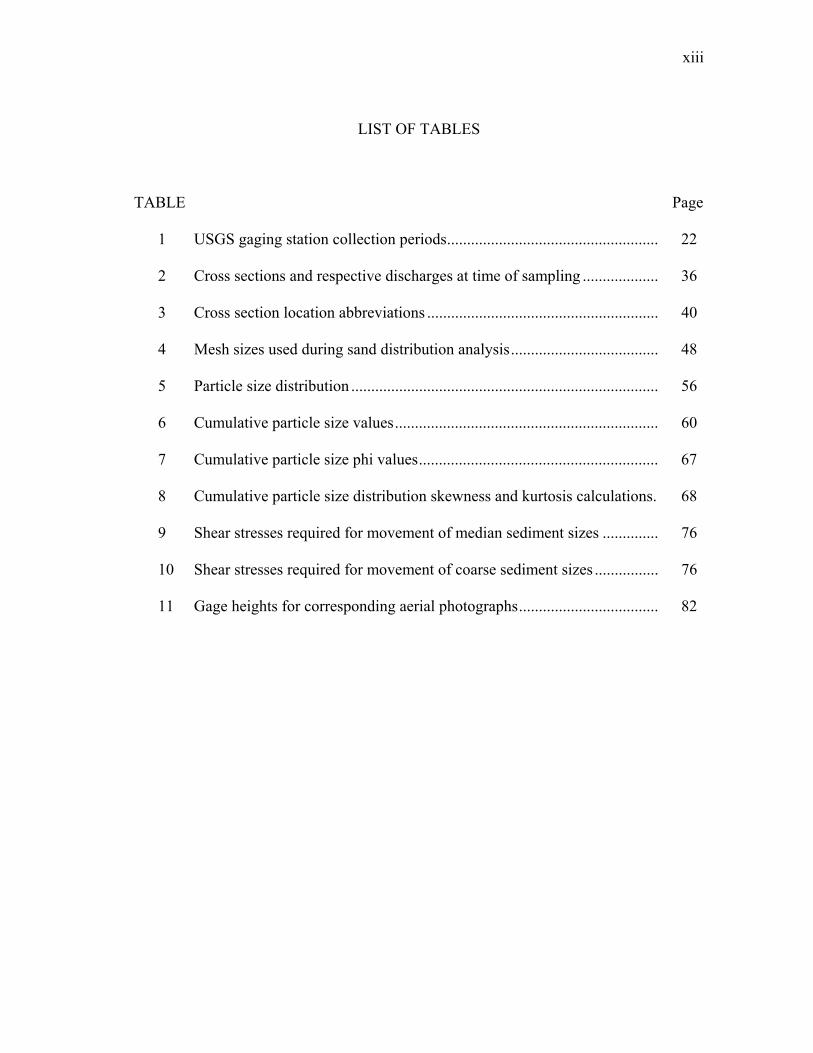
LIST OF TABLES
TABLE Page 1 USGS gaging station collection periods..................................................... 22 2 Cross sections and respective discharges at time of sampling ................... 36 3 Cross section location abbreviations .......................................................... 40
4 Mesh sizes used during sand distribution analysis..................................... 48 5 Particle size distribution ............................................................................. 56 6 Cumulative particle size values.................................................................. 60
7 Cumulative particle size phi values............................................................ 67 8 Cumulative particle size distribution skewness and kurtosis calculations. 68 9 Shear stresses required for movement of median sediment sizes .............. 76
10 Shear stresses required for movement of coarse sediment sizes ................ 76 11 Gage heights for corresponding aerial photographs................................... 82

1
CHAPTER I
INTRODUCTION
Background
Dams have changed rivers everywhere. They have altered flow distributions and
sediment transport, causing a host of adjustments in channel morphology and sediment
dynamics. Although major changes in flow regime have occurred along Yegua Creek,
Texas, since the closure of Somerville Dam in 1967, sediment transport changes have
not been studied in detail. The extent to which sediment is moving through the system
remains unclear. Because Yegua Creek is a principal tributary to the Brazos River and
an important source of water supply in the south-central region of Texas, increased
understanding of sediment dynamics within Yegua Creek is especially important. This
study evaluates the extent to which the present flow regime is transporting sediment
through Somerville Dam and downstream of the dam. Sediment characteristics are
examined in the laboratory and with theoretical calculations. First, the characteristics of
the trapping efficiency will test the hypothesis that little sediment is passing through the
dam. Second, sediment characteristics and their capability of transport will be examined
to test the hypothesis that flows are mobilizing sediment downstream of the dam. Aerial
photographic observations further evaluate the extent to which immobile sediments form
depositional features downstream of the dam. Results give insight into some of the
consequences of stream impoundment. They also increase our understanding of the
____________ This thesis follows the style of Geomorphology.

2
efficacy of sediment delivery into the Brazos River and ultimately to the Texas coastline.
Objectives
This project extends previous studies of the effects of Somerville Dam on Yegua
Creek, Texas. Yegua Creek is a principle tributary to the Brazos River and an important
water supply for the Brazos River Authority, the largest water rights holder in the region.
Previous research has documented dramatic changes in the flow regime and channel
morphology of Yegua Creek following closure of Somerville Dam in 1967 (Chin et al.,
2002; Chin and Bowman, 2005). Flow regulation has created a more equitable flow
regime due to a reduction in flood peaks (85%) and an increase in low flows (Chin and
Bowman, 2005). Furthermore, as a result of the reduction in peak flows, the channel
system has adjusted so that a 65% decrease in channel capacity (largely due to a 61%
decrease in channel depth) was found downstream of Somerville Dam by 2002 (Chin et
al., 2002). Although such changes are expected to induce, and perhaps result from,
changes in sediment movement through the river system, the sediment dynamics of
Yegua Creek have not been investigated in detail. A paucity of research has addressed
the effects of dams on Texas rivers in general (Chin et al., 2008), even though more than
7000 dams have been constructed in the state (Graf, 1999). This research is significant
because it provides insight into the efficacy of sediment delivery within a major dammed
river system to the Texas coastline. It also contributes to an increased understanding of
the impact of stream impoundment on river systems as a whole (Graf, 2006). This

3
knowledge in turn aids in determining sustainable management practices (e.g. Downs
and Gregory, 2004)
This study addresses two specific research questions. First, to what extent is
sediment moving through Somerville Dam? The working hypothesis is that insignificant
quantities of sediment passes through the dam because of sediment trapping by the dam.
This effect potentially disconnects the upper and lower watersheds and starves the
downstream portion of sediments that were delivered from the upstream basin before
impoundment. This hypothesis was developed based on studies of similar river systems
where impoundments have trapped large amounts of sediment behind the dam. For
example, 98% and 90% of the sediment load is deposited behind the High Aswan Dam
on the Nile River (Hammad, 1972) and Toledo bend reservoir along the Sabine River,
Texas, respectively (Phillips, 2003). Additionally, sediment starvation below Lake
Livingston has resulted in a similar “decoupling effect” of sediment on the Trinity River,
Texas (Phillips et al., 2004).
The second research question addressed in this thesis is: to what extent are
present flows capable of transporting sediment downstream of Somerville Dam? The
working hypothesis is that the reduction in flood peaks associated with river regulation
has decreased sediment transport capacity in Yegua Creek. This reduction in transport
capacity would decrease significantly the quantity and size of sediment moving into the
Brazos River. The hypothesis for the second objective was developed based on previous
studies elsewhere that showed that a reduction in sediment transport. For example, in
the nearby Trinity River, a reduction in sediment transport was documented to result

4
from accompanying decreased flows (Phillips 2003). In the case of Yegua Creek, peak
discharges have also been reduced as a result of flow regulation (Chin et al. 2002).
Sediment transport capacity is expected to have decreased as well. Furthermore, initial
review of aerial photographs and reconnaissance surveys showed a growth of sand bars
in the reaches downstream of Somerville Dam, suggesting that depositional processes
may have taken place. This hypothesis is also consistent with the previous finding that
channel capacity has decreased in size since construction of the dam (Chin et al., 2002).
Organization of the Research
This thesis consists of six chapters. Chapter I is an introduction that is followed
by a literature review in Chapter II outlining the effect of dams on the hydrological,
sedimentological, morphological, and ecological characteristics of streams. Chapter III
describes the study area and includes climate, vegetation, and geology. This chapter also
summarizes previous research pertaining to the effects of Somerville Dam on Yegua
Creek. Chapter IV outlines the field and laboratory methods, as well as theoretical
calculations and aerial photograph analysis methods used to answer the research
questions. Chapter V presents the results, followed by a discussion of the findings,
conclusions and avenues for future research in the final chapter (Chapter VI).

5
CHAPTER II
LITERATURE REVIEW
Introduction
Several groups of studies form the theoretical background for this research. The
first summarizes hydrological effects occurring downstream of impoundments.
Sedimentological effects comprise the second theme and include changes in basin
sediment budgets, sediment yield, bed and suspended sediment loads, and the
distribution of sediment sizes along the stream. The third group includes changes in
channel morphology associated with dam construction. A fourth group addresses
ecological effects of stream impoundment. These include altered species biodiversity,
distribution, colonization, and the ability of ecosystems to support a species population
after impoundment.
Hydrological Impacts
Each dam uniquely changes the flow characteristics of the impounded stream
according to its main purpose and local geography. For example, dams used primarily
for irrigation do not release water during some periods the year or concentrate their
releases during the growing season (Williams and Wolman, 1984; Elliot and Parker,
1997; Jennings, 1999). In contrast, hydroelectric dams that generate power release water
in pulses (Ibanez et al., 1996; Magilligan and Nislow, 2001; Phillips, 2003). Therefore,
flows can be redistributed throughout the year, resulting in more or less variable flow,

6
depending on the individual dam (Ibanez et al., 1996; Jennings, 1999; Chin et al., 2002;
Yang et al., 2004; Chin and Bowman, 2005).
Although the purpose and effects of dams may differ greatly, studies have shown
some consistent trends. Typically, peak discharges have decreased after impoundment
(e.g. Williams, 1978; Graf, 1980; Chin et al., 2002; Chin and Bowman, 2005; Singer,
2007). In one example, Andrews (1986) found that on the Green River in Utah below
Flaming Gorge Reservoir, discharges equal to, or exceeding 5,000 ft3/s that occurred
10% of the time prior to impoundment no longer occurred after impoundment.
Elsewhere, the recurrence intervals of peak discharges along the Milk River, Alberta,
and Montana, increased 2-3 times their pre-impoundment recurrence interval, meaning
that large events became rarer (Bradley and Smith, 1984). Along Yegua Creek, the site
of interest for this study, Chin and Bowman (2005) established that a more equitable
flow regime developed downstream of Somerville Dam. The post-dam flow regime
reflects an 84% decrease in annual peaks.
Impoundment also affects the frequency and magnitude of floods. Frequencies
of specific floods, especially high magnitude events, often decrease following
impoundment (Bradley and Smith, 1984; Graf, 1988; Higgs and Petts, 1988; Shields et
al., 2000; Magilligan et al., 2003; Chin and Bowman, 2005). In some cases, however,
such as when dams overspill and induce rare peak discharges, high and low flow
extremes may not be as affected. The River Mersey in Tasmania exhibited such
characteristics (Knighton, 1988a).

7
In addition, average flows (specifically mean annual and mean daily flows) are
altered on many streams after impoundment (e.g. Williams and Wolman, 1984; Surian,
1999; Maigini and Marsh, 2002; Chin and Bowman, 2005). Along the River Severn
(U.K.), Higgs and Petts (1988) found a 50% and 30% decrease in median and mean
annual flows, respectively. In addition, the mean annual discharge decreased 28% on
the Green River, Utah (Allred and Schmidt, 1999). This may be due to the intended uses
for the stored water which influence the timing and quantity of releases.
Sedimentological Effects
Decreased discharges from dams can result in decreased transport capacities
along impounded rivers. For sediment transport, stream power, not water quantity, is the
important variable to consider (Knighton, 1987). For this reason, sediment load (or
sediment transported below the dam) is often altered after stream impoundment owing to
a reduction in stream power (Chien, 1985; Graf, 1988). For example, Allred (1999)
recorded a decrease in the magnitude of discharge responsible for transporting the
majority of suspended sediment along the Green River in Utah. Therefore, suspended
sediment was less likely to be transported following impoundment. On the Green River,
Graf (1980) also found that 93% of the boulders stabilized after impoundment compared
to 62% before dam closure because of decreased transport capacities of the flow. These
decreases in entrainment capabilities may ultimately affect sediment supply to
coastlines, and therefore beach erosion (Chin et al., 2002).

8
Dams can cause coarsening of sediment downstream because, with decreased
entrainment, only fine sediments are carried away (Graf, 1980; Chien, 1985). Bed
materials also coarsen because of the clear water or “hungry water” effect (Kondolf,
1997), whereby sediment-free water erodes channels until a new equilibrium is reached.
This process leads to higher bed roughness values as the hungry water removes finer
sediment, leaving behind coarser particles. As a result, this roughness decreases the
flow velocity in the channel and ultimately, decreases stream power (Hammad, 1972;
Kellerhals, 1982; Knighton, 1987; Graf, 1988; Graf, 2005). Such was the case on the
River Rheidol, U.K., (Greenwood et al., 1999), Bear Creek, Colorado (Hadley and
Emmett, 1998), and the Nile River below the High Aswan Dam (Kashef, 1981).
Sediment coarsening eventually can lead to armoring along channel beds (Richards,
1982; Magilligan et al., 2003; Graf, 2005). As a result of sediment-free water released
from the impoundment, for example, armoring occurred below the Elwha Dams in
Washington (Pohl, 2004). These effects can diminish with increasing distance from the
dam, as well as with time (Williams and Wolman, 1984).
Dams can also cause changes in particle size distributions downstream. The
Colorado River, for example, had a uniform sediment size distribution downstream of
the impoundment before the closure of Hoover Dam. Six years after impoundment,
sediments downstream of the dam became sorted, so that a greater portion of coarser
particles were present immediately below the dam. Median particle size gradually
decreased with distance from the dam. This is likely due to the decrease in peak flows
no longer able to transport coarser material. Instead, flows present after impoundment

9
transport fine sediment present, leaving behind coarser material (Williams and Wolman,
1984).
Sediment budgets describing sediment input, output, transport and storage are
useful indicators of change after impoundment (Reid and Dunne, 2003). Using sediment
budgets, Andrews (1986) showed that equilibrium was present in the suspended
sediment characteristics along the Green River in Colorado and Utah prior to
impoundment. However, the mean annual sediment discharge since dam closure has
decreased significantly. Therefore, the amount of sediment transported into the river
reaches is currently much higher than sediment transported out of river reaches along the
Green River (Andrews, 1986). The sediment budget approach also allowed Phillips et
al. (2004) to conclude that changes in sediment input, output, transport and storage due
to impoundment on the Trinity River, Texas, did not affect sediment delivery to the
coast. Although Livingston Dam trapped 81% of sediment entering the dam, the lower
portion of the basin supplied much of the sediment supply to the coast.
The sediment trapping efficiency of a reservoir provides a useful parameter to
determine the sedimentological impacts of a dam (Williams and Wolman, 1984). A
reservoir can trap large amounts of bed and suspended sediment, disconnecting the
upstream portion. Often, the upper basin can provide greater than 75% of the sediment
load to the lower basin (Petts and Gurnell, 2005), from the downstream basin (Bonacci
et al., 1992; Phillips, 2003; Petts and Gurnell, 2005). For example, approximately 90%
of the suspended sediment load is deposited behind Toledo Bend Reservoir on the
Sabine River (Phillips, 2003). At a global scale, reservoirs trap approximately 30% of

10
the sediment flux (Vorosmarty et al., 1997; Vorosmarty et al., 2003). These changes can
significantly impact sediment supply to stream reaches downstream, and eventually, to
coastlines.
Tributaries and other downstream sediment sources can offset the effects of
impoundment (Knighton, 1987). Carling (1988) found that tributaries supplied fine
sediments along many U.K. Rivers. Tributaries also supplied a large amount of
sediment on the Gunnison River, Colorado (Elliot and Parker, 1997), the River Mersey
in Tasmania (Knighton, 1988a), and the Green River, Utah (Grams and Schmidt, 2005).
Often, the regulated discharge is unable to entrain a large amount of sediment supplied
by tributaries (Kondolf, 1997). Thus, the River Chew in Somerset changed from a
primarily gravel bed river to sand bed because of tributary inputs following
impoundment (Petts and Thoms, 1986).
Morphological Changes
Changes in flow and sediment characteristics caused by dams can induce a
variety of morphological effects downstream (Richards, 1982; Williams and Wolman,
1984; Brandt, 2000). Changes in slope may occur below impoundments as a result of
the inability of the new flow regime to entrain sediment (Chien, 1985; Brandt, 2000).
Changes in sediment size distribution caused a steeper slope to develop on the River
Rheidol, U.K. (Greenwood et al., 1999).
Channel widths commonly adjust after stream impoundment because of changes
in discharge and sediment transport (Williams and Wolman, 1984). Channel widening is

11
the most common response; it was reported for 46% of the 231 cross sections in the
classic study by Williams and Wolman (1984). Specifically, along the River Ter (UK),
channel capacity increased at three sites directly below the dam due to channel scouring
(Petts and Pratts, 1983). Conversely, channels with no change in width were found in
22% of the channels studied by Williams and Wolman (1984). In addition, 26% of the
channels narrowed (Williams and Wolman, 1984). Channel width narrowed by an
average of 10-13% after impoundment along the Green River, Utah due to decreased
effective discharge (Andrews, 1986; Allred and Schmidt, 1999; Grams and Schmidt,
2005). Five percent of the 231 cross sections studied by Williams and Wolman widened
and then narrowed, whereas 2% narrowed and then widened (1984). One example of
such an occurrence is the Green River in which Merritt and Cooper (2000) found that
after impoundment the stream first narrowed by 13% and later widened by 20%.
One study along the Missouri River explains morphological channel changes as a
result of bank composition and cohesiveness. One reach consisting of sand and a high
silt content experienced more erosion and undercutting at low flows compared to other
reaches along the same river. However, areas with silt-clay blocks prevented erosion for
some time. Therefore, cohesive banks are likely to deter channel width increases (Rahn,
1977; Williams and Wolman, 1984).
Changes in flow regime and sediment characteristics can also cause changes in
channel planform. Braiding commonly develops in areas of increased flow, whereas
meandering tends to occur in cases with decreased flow (Williams, 1978; Graf, 1988;
Brandt, 2000; Wellmeyer et al., 2005). The Piave River in Italy, for example, became

12
less braided after impoundment (Surian, 1999). In addition, meander rates decreased
downstream of an impoundment as a result of a reduction in flow and sediment transport
capacities. Along the Milk River in Alberta and Montana, meander rates downstream of
the impoundment were found to be much lower compared to those occurring upstream
(Bradley and Smith, 1984). The Snake River below Jackson Lake Dam in Wyoming
also became more sinuous, increasing meander rates. Channels actively migrated
downstream of tributaries that provided adequate sediment supplies and effective
discharge (Marston et al., 2005).
River bed changes have also been reported after stream impoundment (Brandt,
2000). Degradation below impoundments (Graf, 2001) was documented in all 21 cross
sections outlined in Williams and Wolman (1984). Degradation can switch to
aggradation some time after dam closure or at some distance downstream of the
impoundment (Wolman, 1967; Chien, 1985). In one dramatic example, the Skokomish
River in Washington, impounded in the late 1920s, experienced incision between 1932
and 1938. The river then aggraded from 1939 to 1944. Later, between 1964 to 1997 the
channel began to aggrade rapidly (Stover and Montgomery, 2001). Thus, channel
adjustments vary greatly from river to river.
Ecological Impacts
Changes in channel form and flow and sediment characteristics associated with
stream impoundments may ultimately affect stream ecosystems and the ability of
streams to support organisms (Ligon et al., 1995; Magilligan et al., 2003). Adjustments

13
in channel shape can influence vegetation establishment by providing open areas for
vegetation to flourish (e.g. Bradley and Smith, 1984; Williams and Wolman, 1984;
Carling, 1988; Elliot and Parker, 1997; Fergus, 1997; Greenwood et al., 1999; Marston
et al., 2005; Petts and Gurnell, 2005). In Yegua Creek (Texas), a 25% increase in
riparian woodland was noted between 1958 and 1980 (Jennings, 1999). In addition,
90% of the active bars on the Green River near Browns Park had been populated by
vegetation only 10 years after impoundment (Merritt and Cooper, 2000).
Stream impoundment can alter vegetation biodiversity downstream of the dam.
Along the Snake River, Wyoming, Marston et al. (2005) discovered that unstable parts
of the channel increased in biodiversity, whereas biodiversity decreased on the stable
sections between 1945 and 1989. Unstable channel reaches prove difficult to colonize
and therefore give a wider variety of new species a chance to colonize the area. On the
other hand, stable reaches allow developed species to flourish. The proliferation of these
developed species, therefore, do not allow the colonization of new species (Marston et
al., 2005). Furthermore, channel scouring below a dam can create fewer opportunities
for seedlings to germinate. This can lead to a decrease vegetation growth, thus
decreasing vegetation biodiversity (Williams and Wolman, 1984).
Water quality, and specifically water chemistry, can change as a result of
impoundment. Often, this is due to changes in the chemical and biological processes
taking place within the reservoir (Pozo et al., 1997). These changes are translated to the
water released into the stream. Any changes in water quality affect the life cycles of
organisms (Graf, 1980; Magilligan and Nislow, 2005). Along the River Rheidol, U.K.,

14
macroinvertebrates were affected due to changing flows and siltation. An increase in the
number of taxa in reaches that were regulated and still adjusting in channel change was
apparent (Greenwood et al., 1999). In another study, Petts (1986) emphasized the
possibility of eutrophication if adequate flows are not available to flush away nutrients.
The Context for Yegua Creek
The effects of stream impoundment are gradually being uncovered as more
research is conducted on the hydrological, morphological, sedimentological, and
ecological impacts of impoundment. Along Yegua Creek, Texas, the impoundment of
Somerville dam has resulted in an 85% decrease in peak flows and a more equitable flow
regime (Chin and Bowman, 2005). This decrease in peak flows and increase in low
flows is common among streams after impoundment. These changes in flow regime are
accompanied by a reduction in channel capacities, after several decades, averaging 65%.
The changes in channel morphology occurred principally due to depth reductions,
whereas no significant changes in channel width were found (Chin et al., 2002). This
decrease in channel capacity, and specifically changes in depth, has been attributed to
decreased flows in similar studies along the Rio Grande (New Mexico) and the Peace
River, Canada (Williams and Wolman, 1984). These decreased flows no longer have the
ability to entrain available sediment and therefore, the sediment remains in the channel.
In addition, an increase in riparian vegetation was found likely due to the decrease in
peak flows that no longer have the ability to disturb vegetation establishment (Jennings
1999).

15
The background provided by previous investigations of Yegua Creek presents a
unique opportunity to add insight into the overall response of river systems to dam
construction. Having documented the hydrological and morphological changes (Chin
and Bowman, 2005, Chin et al., 2002), what, if any, are the sedimentological responses?
Is sediment moving through the dam and downstream of the dam? In light of the
reduction in peak flows, has sediment transport been altered such that the presence,
number, and size of depositional features along Yegua Creek have grown? What are the
possible roles of tributary inputs of sediments? Has sediment coarsening accompanied
other changes? Understanding the sedimentological effects will ultimately provide
insights toward linking the responses in system components. An integrated
understanding of system response for Yegua Creek is expected to add significantly to
our knowledge of the impacts of dams in general.
Increased understanding of sedimentological effects of Somerville Dam on
Yegua Creek is also important in a regional context. Because Yegua Creek is a major
tributary to the Brazos River, changes in sedimentological processes will ultimately
affect sediment delivery to the coast. Phillips et al. (2004) have documented
sedimentological changes on the Trinity River, approximately 100 km east of the Brazos
River. The authors reported that alluvial storage downstream of Livingston Dam is such
that little change has occurred in sediment supply to the Texas coast. Similar results
from Yegua Creek will enable broader generalizations regarding the impact of
impoundments on streams. With construction of more dams planned for the state of
Texas, as described in “Water for Texas: Highlights of the 2007 State Water Plan”

16
(2006), increased understanding of the overall potential effects of these dams is critical.
In addition, the present study will aid in developing improved release practices in dam
management to maintain sustainable, healthy river systems. Furthermore, his study
provides a unique opportunity to gain insight about the interrelationships among the
hydrological, morphological and sedimentological components of an impounded stream.
This insight offers potential to augment our understanding of complex responses within
environmental systems (Schumm, 1973).

17
CHAPTER III
STUDY AREA
Regional Setting
Yegua Creek, a tributary of the Brazos River, is located in south central Texas on
the Gulf Coastal Plain (Fig. 1). The region has rolling to hilly topography with mildly to
moderately alkaline clay and loam soils (Chervenka et al., 1981; Larkin and Bomar,
1983; Alvarez et al., 2004). Drainage basin elevation ranges from 51-199 m (Chin et al.,
2002). The creek and its tributaries are underlain by recent alluvial floodplain deposits
of clay, silt, sand and gravel which are crosscut northeast to southwest by the following
formations beginning at the headwaters of Middle Yegua Creek: the Sparta Sand, Cook
Mountain Formation, Yegua Formation, the Cadell Formation near Lake Somerville, the
Manning Formation and the Catahoula Formation near the Brazos River (Proctor et al.,
1974).
Yegua Creek drainage basin climate is similar to other surrounding areas. The
region has a Subtropical humid, warm, temperate, climate. Annual temperatures (Fig. 2)
average 20.2°C and range from 28.6°C to 8.9°C in July and January, respectively
(Larkin and Bomar, 1983; Jennings, 1999; Chin and Bowman, 2005). Precipitation
peaks in September and May with a mean annual of 1022.6 mm (Fig. 2). In addition,
discharge peaks in May and June (Fig. 3).

18
Fig. 1. Yegua Creek drainage basin.

19
Fig. 2. Washington State Park Climograph (from Jennings, 1999).
Fig. 3. Average monthly discharge, Yegua Creek downstream of Somerville dam. 1967- 1991 (USGS, 2007).
0
100
200
300
400
500
600
Janu
ary
Febru
aryMar
chAp
rilMay
June Ju
ly
Augu
st
Sept
embe
r
Octobe
r
Novem
ber
Decem
ber
Month
Dis
char
ge (
cfs)
20
Soil surveys of Washington County (southeast of Lake Somerville) and Lee
County (west of Lake Somerville) show Kaufman soils, primarily consisting of clay and
loam, surrounding Yegua Creek and all of its tributaries (Fig. 4). Upstream of
Somerville Dam, Kaufman soils are surrounded primarily by fine sandy loam soils and
loamy sand. Downstream of the dam, excessively fine, clayey soils surround the
Kaufman soils (Burgess and Lyman, 1906; Chervenka et al., 1981).
The land uses in the area include agriculture and pasture. Broadleaf forests and
Post Oak Savannah species surround Yegua Creek in areas that remain undisturbed
(Jennings, 1999). Dominant species throughout the watershed include: Quercus stellata
(Post Oak), Q. marilandica (Blackjack Oak), Ilex vomitoria (Yaupon), Cephalanthus
occidentalis (Button Bush), Planera aquatica (Water Elm), Ulmus occidentalis (Ceder
Elm) and Carya aquatica (Water Hickory) (Correll and Johnston, 1979; Chin et al.,
2002).
Gaging stations provide information regarding flow data throughout the drainage
basin. The United States Geological Survey (USGS) is an organization that provides
information regarding geography, geology, geospatial information, biology and water.
In the Water Resources division, USGS provides data and maps of surface and
groundwater. The surface water database contains information regarding gaging
stations. Four such gaging stations are located within Yegua Creek drainage basin.
These gaging station are: 08110000, 08109800, 08110100 and 08109700 (Fig. 5). The
primary purpose for these gaging stations is to provide flow data. Table 1 provides
stations located throughout Yegua Creek drainage basin. Data from gaging station

21
Fig. 4. Yegua Creek drainage basin soil survey.

22
Fig. 5. USGS gaging stations, Yegua Creek drainage basin .
Table 1 USGS gaging station collection periods (USGS, 2007).
USGS Hydrologic Unit Code
(HUC) Location Initial Data
Collection Date Final Data
Collection Date 8109700 Middle Yegua Creek near Dimebox, Texas August 1, 1962 ongoing 8109800 East Yegua Creek near Dimebox, Texas August 1, 1962 ongoing 8110100 Davidson Creek near Lyons, Texas October 1, 1962 ongoing 8110000 Yegua Creek near Somerville, Texas March 24, 1924 September 30, 1991

23
information regarding dates of discharge and stage height collections at the four gaging
08110000, located just downstream of Somerville Dam are used to evaluate the effects
of Somerville Dam on the sediment transport of Yegua Creek.
Analysis of changes in flow regime conducted by Chin et al. (2002) showed an
85% decrease in annual peak discharge after stream impoundment. Average annual peak
flows decreased from 10,810 cfs (18,366 cms) before stream impoundment to 1,623 cfs
(xxx cms) after impoundment (Fig. 6). Furthermore, flood frequency analysis revealed
a decrease in flood magnitude for floods with return periods over 10 years (Fig. 7).
Therefore, floods with the same recurrence interval before and after stream
impoundment have reduced in magnitude (Chin et al., 2002).
The Yegua Creek Watershed
Yegua Creek is created by several major tributaries. Yegua Creek drainage basin
area is 2,605.44 km2. The upstream portion of the Yegua Creek drainage basin (Fig. 1)
consists of Middle Yegua Creek (Fig. 8) and includes the tributaries East Yegua Creek
(Fig. 9) and West Yegua Creek (Fig. 10). Nails Creek (Fig. 11) and Cedar Creek
(Fig.12) south of Lake Somerville are the remaining main tributaries upstream of
Somerville Dam. Downstream of Somerville Dam, Davidson Creek (Fig. 13) is the
major tributary of Yegua Creek (Fig. 14-16), which joins with the Brazos River
approximately 20 km downstream of Somerville Dam.

24
Fig. 6. Annual peak discharge 1925-1991 (after Chin et al., 2002).
0.001
0.01
0.1
1
10
100
1000
1.0 1.3 1.4 1.7 2.0 2.5 3.2 4.0 6.7 20.0
Recurrence Interval (years)
Dai
ly m
ean
disc
harg
e (c
ms)
1924-1966 1967-1991
Fig. 7. Flood frequency curve for Yegua Creek before and after stream impoundment (after Chin et al., 2002).
Post Dam
0
10000
20000
30000
40000
50000
60000
1925 1935 1945 1955 1965 1976 1986
Year
Ann
ual P
eak
Dis
char
ge
(cfs
)

25
Fig. 8. Middle Yegua Creek.
Fig. 9. East Yegua Creek.
26
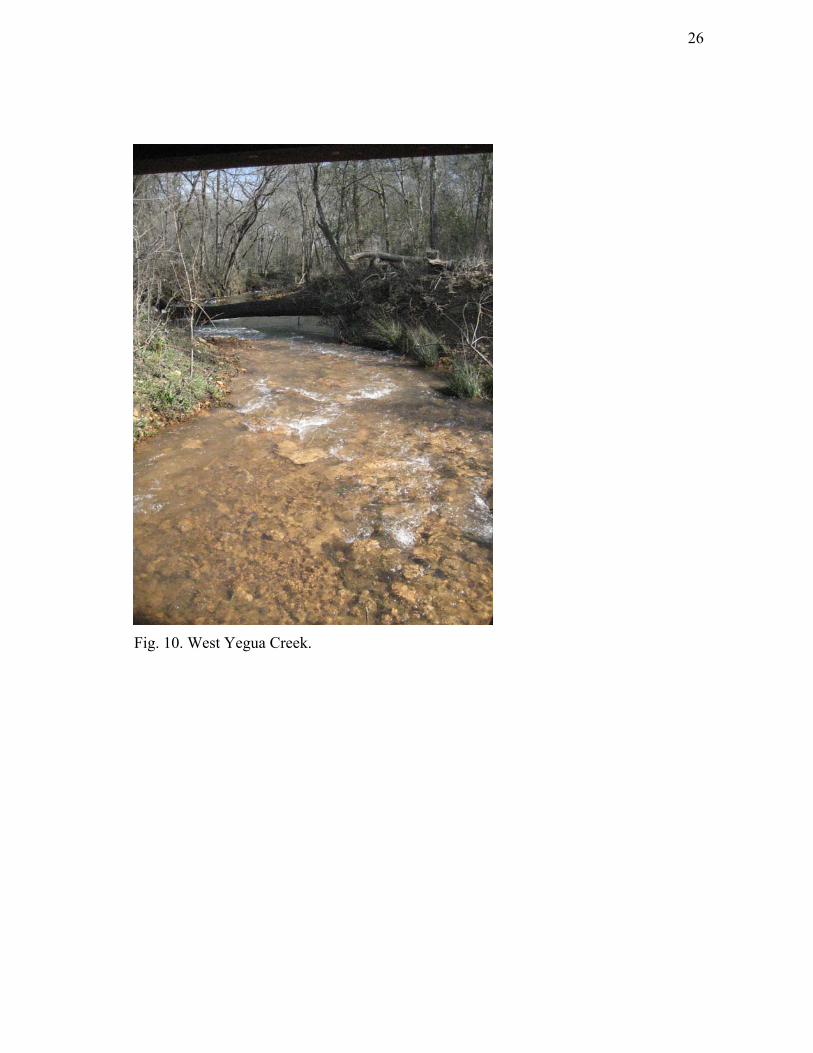
Fig. 10. West Yegua Creek.

27
Fig. 11. Nails Creek.
Fig. 12. Cedar Creek.

28
Fig. 13. Davidson Creek.
Fig. 14. Yegua Creek downstream Somerville Dam.

29
Fig. 15. Yegua Creek, Landolt Cross section B (Fig. 17), Spring 2007.
Fig. 16. Yegua Creek near its confluence with the Brazos River.
30
The characteristics of the channel morphology of Yegua Creek are as follows.
The average channel slope throughout the basin is 0.0001. This slope value is consistent
with coastal plain streams. Upstream of Lake Somerville, average width and depth are
13.1 m and 0.36 m, respectively. Downstream of Lake Somerville, the width and depth
average 22.4 m and 0.65 m, respectively. The bed material consists of primarily fine
grained, cohesive sediment (Chin et al., 2002). Field observations provided preliminary
evidence of substantially coarser bed material throughout West Yegua Creek (Fig. 10),
Nails Creek (Fig. 11) and lower Middle Yegua Creek (Fig. 8). Banks along Yegua
Creek and its tributaries throughout Yegua Creek drainage basin are primarily stable.
One notable exception is the eroding banks near the intersection of Yegua Creek and
Highway 50 downstream of Somerville Dam (Fig. 17).
Somerville Dam
Construction of Somerville Dam on Yegua Creek began in early 1963; the dam
started impounding water in 1967 (Fig. 18). The chief purposes of the dam are to
control flooding on Yegua Creek, conserve water, and attract visitors to the area
(Schaffer, 1974; Chin and Bowman, 2005). The dam has a life expectancy of 50 years, a
conservation storage capacity of 177,498,000 m3 (143,900 ac-ft), and a flood control
storage capacity of 416,547,000 m3 (337,700 ac-ft) (Chin et al., 2002). Somerville Dam
is a large dam in the classification of the National Inventory of Dams (Chin et al., 2008).

31
Fig. 17. Unstable banks visible on Yegua Creek at Highway 50 crossing.
Fig. 18. Somerville Dam outlet and Yegua Creek.

32
Previous Work
Previous studies of Yegua Creek have documented the hydrological (Chin et al.,
2002), morphological (Chin and Bowman, 2005), and ecological (Jennings, 1999)
effects of Somerville Dam. A more equitable flow regime had developed after
impoundment owing to a decrease in flood peaks (85%) and an increase in low flows.
Furthermore, a 65% decrease in channel capacity, largely due to a 61% decrease in
channel depth, was found downstream of Somerville Dam. Minimal change, only a 9%
decrease, in channel width was apparently a result of increased bank stabilization
through the development of riparian vegetation due to increased summer low flows
(Chin et al., 2002). Jennings (1999) further documented increases in riparian vegetation
along the banks in areas downstream of the dam.
Climatic differences before and after stream impoundment studied in previous
research have been insignificant. Jennings (1999) found no difference in the mean
annual precipitation before and after stream impoundment. Little difference was also
found in the mean monthly precipitation. December was the only month to have a
significant statistical difference. Therefore, precipitation has not changed significantly
since impoundment. However, a significant change in the relationship between
precipitation and discharge has occurred. Changes in precipitation were reflected in
discharge before impoundment meaning increases or decreases in precipitation were
reflected in discharge records. After impoundment, precipitation events had less
influence on stream discharge (Jennings, 1999). This disconnection is likely caused by
Lake Somerville which now retains any precipitation that would have previously altered
33
stream discharge. Instead now, changes in discharge previously due to precipitation are
masked by the dam. A comprehensive history on the creek and the construction of
Somerville Dam was also reported in Chin and Bowman (2005). This study adds to
those efforts by examining sedimentological effects of Somerville Dam.

34
CHAPTER IV
METHODS
General Approach
To answer the first question of whether sediment is passing through Somerville
Dam, sedimentation rates of Lake Somerville (Fig. 1) between 1995 and 2003 were
analyzed. These data are available from the U.S. Army Corp of Engineers (USACE,
Lauderdale, personal communication). The sedimentation rates are derived from depth
surveys of Lake Somerville in which the USACE determined the water volume capacity
of the lake. These surveys were conducted in 1995 and in 2003. The water volume
capacity loss is then computed to reveal the amount of sedimentation taking place
between survey periods. All volume loss was assumed to be a result of sedimentation
taking place behind Somerville Dam. Survey results for this study were preformed by
the USACE in 1995 and 2003. In addition, the trap efficiency was calculated based on
reservoir capacity and catchment area (Brune, 1953; Verstraeten and Poesen, 2000).
Trap efficiency indicates the percentage of sediment no longer being transported through
the dam. Instead, sediment supplied from the upstream portions of the basin and
deposited in Lake Somerville is retained by the dam.
Field, laboratory, and aerial photograph analysis, as well as theoretical
calculations, yield answers to the second research question: determine the extent to
which present flows are capable of transporting sediment downstream of the dam.
Analysis of bed and suspended sediment samples collected in the field at low flows

35
forms the core of this portion of the study. In this study, low flows are defined as flows
occupying approximately 25% of channel capacity and with a recurrence interval of
three years or less, based on flood frequency analysis after (Fig. 7). Discharges were
calculated by measuring cross sectional area and multiplying by measured velocity
(Edwards and Glysson, 2005). Discharges for low flows averaged 0.31 cms and ranged
from 0.02 cms to 0.6 cms (Table 2). Additional suspended sediment samples were
collected at higher flows to gain insight into transport conditions during these events.
Discharges for higher flow events (hereafter called “high”) were selected as flows
approximately bankfull and those with recurrence intervals of approximately 6 years.
High flow discharges averaged 15.64 cms with a range from 10.44 cms to 20.52 cms
(Table 2). The high flows sampled represented the highest discharge measurable with
conventional equipment under safe conditions.
Differences between the upstream and downstream sediment characteristics
were documented. Laboratory analysis determined the sediment size distribution of the
bed sediment as well as the suspended sediment concentration. The threshold of
entrainment was calculated and compared against existing flow records to determine if
effective flows capable of transporting sediment have occurred over the period of
interest. Thus, movement of sediment can be inferred.
Finally, available aerial photographs provided additional evidence of the
changes in size, location, and number of depositional and erosional features since
impoundment. These aerial photographs corroborate mathematical calculations and field
measurements.

36
Table 2 Cross sections and respective discharges at time of sampling.
Discharge (cms) Cross Section Low Flow Date High Flow Date
Y36US 0.02 March 5, 2007 20.52 January 30, 2007 Y36DS 0.28 March 5, 2007
Landolt A 0.36 February 17, 2007 10.44 May 18, 2007 Landolt B 0.31 February 17, 2007
YC50 0.60 March 3, 2007 15.96 May 18, 2007 Average 0.31 15.64

37
Data Acquisition and Preprocessing
The U.S. Army Corps of Engineers (USACE) and the United States Geological
Survey (USGS) provided flow data for this study. These include gage height and
discharge. Gaging station 08110000, the primary gaging station records used in this
study is located downstream of Somerville Dam (Fig. xx). This station collected
discharge and gage height between 1924 and 1991.
The USACE records of sedimentation rates for Somerville Dams for 1995-2003
were determined through lake volume surveys. Information regarding sedimentation
rates is therefore limited to the time of surveying, which was conducted most recently in
1995 and again in 2003.
The Texas Natural Resource Information System (TNRIS) provided aerial
photographs of Yegua Creek from their online database. TNRIS is a component of the
Texas Water Development Board (TWDB) that provides the public with digital maps,
aerial photographs and images of Texas. Photographs from the years 1995 and 2004
were determined appropriate for comparison, representing a nearly 10-year span. The
TNRIS historical archives further provided images of Yegua Creek from 1958 and 1988.
Images were not available for other dates. Furthermore, images for 1958 were only
available for Yegua Creek near its confluence with the Brazos River and not near the
dam site. Therefore, changes near the dam site and immediately downstream of the dam
could not be interpreted. These photographs enabled the comparison of depositional and
erosional features over time.

38
The aerial photographs required pre-processing as follows. First, the images
were georeferenced into the same datum and projection (North American Datum 1983),
preparing the images for analysis. These included the historical images obtained from
TNRIS for the dates before 1995. These historical images were scanned at 1,000 dots
per inch (dpi) and rectified to the 1995 and 2004 images already projected by TNRIS
with 1 meter resolution. All images were projected into the Texas State Plane projection
Zone 14N because it is the recognized projection of the state of Texas. It also provides
the least amount of distortion in direction and distance for the study area (Dean, 2006).
After georeferencing, these images were imported into a geographic information system
[ESRI 9.1 (2005)] for analysis.
Field Procedures
Bed sediment and suspended sediment samples were collected at selected
locations upstream and downstream of Somerville Dam during January, February and
March 2007 for low flows and January and May 2007 for high flows. Twenty three
cross sections along Yegua Creek represented the length of the channel (Fig. 19, Table
3). These were selected to be as evenly distributed as possible and to match those of
previous studies on Yegua Creek (Chin et al., 2002). Because much of the study area is
located on private property, the study sites were also constrained by accessibility.
Thirteen of these cross sections are located upstream of the dam along Middle Yegua
Creek and four of its tributaries: West Yegua Creek, East Yegua Creek, Nails Creek and
Cedar Creek. An additional ten cross sections, six along Yegua Creek and four on
39
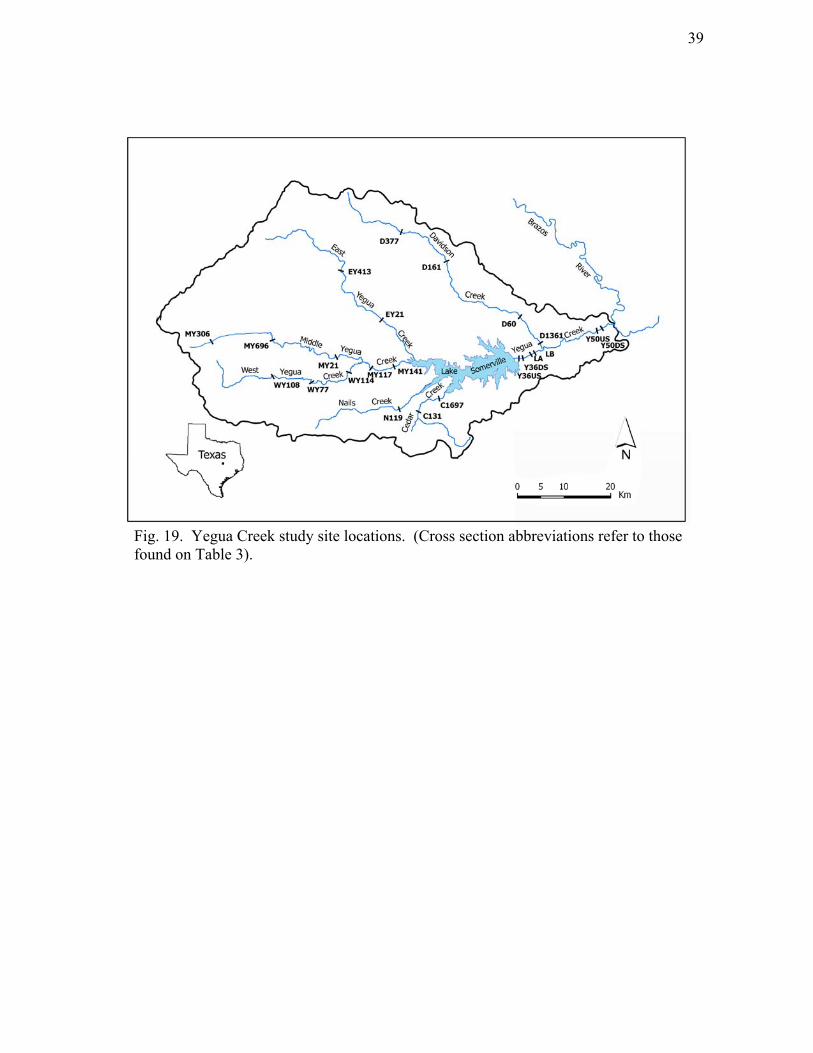
Fig. 19. Yegua Creek study site locations. (Cross section abbreviations refer to those found on Table 3).

40
Table 3 Cross section location abbreviations.
Cross Section Abbreviation Cross Section Name
D377 Davidson Creek Hwy 377 D161 Davidson Creek Hwy 161 D60 Davidson Creek Hwy 50
D1361 Davidson Creek Hwy 1361 EY413 East Yegua Creek Hwy 413 EY21 East Yegua Creek Hwy 21
WY108 West Yegua Creek Hwy 108 WY77 West Yegua Creek Hwy 77 WY114 West Yegua Creek Hwy 114 N119 Nails Creek Hwy 119 C131 Cedar Creek Hwy 131 C1697 Cedar Creek Hwy 1697 MY306 Middle Yegua Creek Hwy 306 MY696 Middle Yegua Creek Hwy 696 MY21 Middle Yegua Creek Hwy 21 MY117 Middle Yegua Creek Hwy 117 MY141 Middle Yegua Creek Hwy 141 Y36US Middle Yegua Creek Hwy 36 Upstream of Bridge Y36DS Middle Yegua Creek Hwy 36 Downstream of Bridge
LA Landolt Cross Section A LB Landolt Cross Section B
Y50US Yegua Creek Hwy 50 Upstream of Ramp Y50DS Yegua Creek Hwy 50 Downstream of Ramp
41
Davidson Creek (a tributary of Yegua Creek), are located downstream of the dam. Field
work was conducted at low and high flows.
At each site a stable cross section was identified and the channel width and depth
were measured. A tape measure was placed across the channel and depth was measured
every few meters, depending on the width of the channel. Wider channels required more
depth measurements to more accurately determine channel geometry. There were at
least three depth measurements per channel cross section.
Velocity measurements were then taken at 0.6 of the depth at each respective
location with a Marsh McBirney electromagnetic flow meter (Fig. 20). This enabled the
determination of equal increments of discharge within the cross section to carry out the
equal-discharge-increment (EDI) method. The EDI method enables representative
suspended sediment sampling for each cross section. Equal increments of discharge are
required to sample suspend sediment at intervals that would yield the average amount of
suspended sediment throughout the crossection (Edwards and Glysson, 2005):
1. First the discharge of each width subsection was calculated by multiplying width,
depth and velocity.
2. Next, the total discharge of the cross section was determined by totaling each
subsections discharge. The total discharge was then divided by four. This would
create four subsets of equal discharge from which to sample suspended sediment
concentration (Edwards and Glysson, 2005).
3. Next, the width location for each equal discharge was interpolated using the
initial discharge measurements and their respective sample location (Fig. 21).

42
Fig. 20. Placement of width, depth, and velocity measurements to determine discharge (after Edwards and Glysson, 2005).

43
Fig. 21. Suspended sediment sample locations (after Edwards and Glysson, 2005).

44
Finally, suspended sediment samples were gathered with an integrating
suspended sediment sampler (DH 48). These were sampled at the center of the width of
each of the four interpolated subsections along the stream cross section. The DH 48 was
lowered at a constant rate to the bottom of the channel and then lifted at the same
constant rate to gain a representative suspended sediment sample. A total of 108
suspended sediment samples were gathered throughout the drainage basin.
An average of three bed sediment samples from each cross section were collected
using a hand core sediment sampler every 1-3 meters across the channel depending on
the width of the channel. One bed sediment sample was obtained from the thalweg of
the channel and two an equal distance from the thalweg to the bank on both the left edge
and right edge of water. Each bed sediment sample cored sediment approximately six
inches into the bed. A total of 76 bed sediment samples were taken throughout the
drainage basin. A Global Positioning System provided additional locational
information.
Laboratory Methods
Suspended sediment samples were processed in the Texas A&M Geography
Department Sediment Lab. To determine suspended sediment concentration, each
sample was filtered and weighed. The concentrations of the suspended sediment above
and below Somerville Dam were then compared to infer the effects of the dam.

45
Suspended sediment analysis followed procedures outlined in the American
Society for Testing and Materials (ASTM) “Standard Test Methods for Determining
Sediment Concentration in Water Samples” (ASTM, 2006), as follows:
1. The empty sample bottles were first weighed to obtain their tare weight, or
their weight prior to sediment filtration.
2. Sample bottles were then weighed after obtaining the sample to determine
their gross weight. Subtracting the tare weight (from step 1) from the gross
weight of the sample yielded the net weight of the sample.
3. Then, to filter the sample, oven dried (for one hour at 100°C, 25 mm glass
microfiber filters were placed in Gooch Crucibles and weighed to determine
their tare weight.
4. The Gooch Crucibles and filters were then used to filter the suspended
sediment sample.
5. After oven drying the filters and Gooch Crucibles again, the filters, sediment
and crucible were weighed to determine the gross weight. The tare weight of
the crucible and filter obtained in step 3 was subtracted from the gross weight
to determine the net weight of the sediment.
6. Finally, the following equation yielded the concentration of suspended
sediments in parts per million (ppm):
Concentration (ppm) = 0000001 ,, sampleof weightnet
sedimentof weightnet× (1)

46
Bed sediment samples were processed in the Soil Characterization Lab at Texas
A&M University. Analysis proceeded along the guidelines outlined in Steele and
Bradfield (1934) and Kilmer and Alexander (1949), and summarized recently in Kondolf
and Piegay (2003). Bed sediment samples obtained from the field were first air dried for
approximately 1 week, ground and catalogued. Separate procedures were required to
determine the size distribution for particles larger than 2 mm (coarse fragments),
particles between 0.05 mm and 2 mm (sand) and those smaller than 0.05 mm (silt and
clay). First, particles larger than 2 mm were separated out. In order to process sediment
smaller than 2mm the following procedures were preformed:
1. Ten gram samples of the remaining sediment were placed each in separate
sedimentation bottles. These ten gram samples were then mixed with 5 mL of a
dispersing agent (calgon) and filled with distilled water. They were placed in a
reciprocating shaker for 24 hours.
2. After 24 hours, a magnetic spin bar was added and the temperature of each
bottle was recorded.
3. Sedimentation bottles were then placed on a magnetic stirring plate and stirred
for exactly two minutes.
4. After the two minute time period, bottles were placed in a water bath and the
sediment mixture was allowed to settle for approximately 2 minutes. The exact
settling time was determined using stokes law and the measured temperature of
the mixture prior to stirring. After the appropriate time, 5 mL was pipetted out
and placed in a crucible.

47
5. Three hours later, the pipet procedure was repeated. Again, the precise settling
time was determined based on the temperature of the sediment mixture in the
bottles.
6. Crucibles were oven dried and weighed. These procedures yield the size
distribution of the sediments finer than 0.05 mm.
The remaining sample in the sedimentation bottles, that greater than 0.05 mm
(sand) was processed using the procedures outlined by Ward and Harr (1990) to
determine the sediment size distribution:
1. Sediments were first washed and sieved through a size 300 mesh sieve. This
discarded any silt and clay still left in the sediment sample in order to determine
sand size distribution.
2. The remaining sand was oven dried and sieved with a ro-tap shaker using the
mesh sizes found on Table 4 (Folk, 1980). The mass of sediment in each sieve
was recorded.
Finally, the sediment fraction larger then 2mm (coarse fragments) was weighed
and these weights recorded to determine the percentage of coarse fragments at each cross
section.

48
Table 4. Mesh sizes used during sand distribution analysis.
Mesh # Sediment Size
Phi (Φ)
#18 1 mm
0
#35 0.5 mm
1
#60 0.25 mm
2
#140 0.10 mm
3.25
#300 0.05 mm
4.395

49
Theoretical Calculations
To calculate the sediment trap efficiency of Lake Somerville, the following
equation was calculated used. It is developed by Brown (1943) and reported in
Verstraeten and Poesen (2000).
TE = ⎥⎥⎥
⎦
⎤
⎢⎢⎢
⎣
⎡
+−
)(1
11100
WCD
(2)
TE = trap efficiency (%)
D = constant
Can range from 0.046 to 1 with a mean of 0.1. A constant of 1 applies for
regions with variable runoff and reservoirs that store flood flows.
Therefore, 1 was used to determine the trap efficiency of Somerville Dam
(Brown, 1943; Brune and Allen, 1941; Heinemann, 1984; Verstraeten and
Poesen, 2000)
C = reservoir capacity (ac-ft)
W = catchment area (miles2)
The trap efficiency equation was developed using 23 reservoirs from Texas to Ohio as
the core of the Brown (1943) study. Factors that may influence reservoir sedimentation
include the following: the rate of sediment delivery based on erosion, the ratio of
capacity to drainage area of the reservoir, the range of sediment particle sizes, shape of
the reservoir, and reservoir purpose. Brune and Allen (1941) stated that the most
important factor among these was the ratio capacity to drainage area. Furthermore,

50
Brown (1943) suggested plotting reservoir sedimentation against catchment area because
it is an easily determinable variable. Therefore, the equation relates trap efficiency to
the capacity-catchment area ratio.
Phillips (2003) and Phillips et al. (2004) developed the following equation for
sediment yield based on reservoir surveys obtained from the Texas Water Development
Board (TWDB). The bulk density of sediments deposited in to the lake is assumed to be
1 Mg/m3 (Welborn, 1967; Williams, 1991; Smith et al., 2002; Phillips et al., 2004). The
loss of water volume was assumed to be a decrease in lake capacity due to sedimentation
(Phillips, 2003). Reservoir surveys were conducted in 1995 and again in 2003 by
determining the elevation of the lake bottom at specific, fixed locations. These
differences in elevation were noted and volume loss inferred. No survey has been
conducted since 2003.
Sediment Yield = SurveysBetween YearsArea Drainage
Loss Volume×
(3)
Sediment Yield = m3/km2/yr
Volume Loss = total amount of water volume loss between surveys (m3)
Drainage Area = km2
Years Between Surveys = 1995-2003 (9 years)
After determining the particle size distribution through laboratory procedures, the
median grain size (d50) at each cross section was obtained by plotting the cumulative
particle size distribution frequency. The median grain size is the particle size diameter in

51
which 50% of the sediment by weight is larger, and 50% is smaller (Gordon et al.,
2004). In other words, it is the median diameter of the sediment sample. In addition, d84,
d16, d90, d10, d75 and d25 were determined. The d84 value, for example, is the 84th
percentile, or the particle size diameter in which 84% of the sediment by weight is
smaller and is one standard deviation away from the mean (Gordon et al., 2004).
To calculate the standard deviation, mean, skewness, and kurtosis of the particle
size distribution at each cross section these values were converted into standardized phi
(φ) scale values (Table 5) using the following equation (Gordon et al., 2004):
Phi (φ ) = )2log()log(n (4)
n = particle size (mm)
Finally, the standard deviation, mean, skewness and kurtosis were calculated
using the following equations (Gordon et al., 2004):
Mean = 2
1684 φφ + (5)
Standard Deviation = 2
1684 φφ − (6)
Skewness = 10901050
16845084
φφφφ
φφφφ
−−
−−− (7)
Kurtosis = )2575(9.1
1090φφφφ−− (8)

52
The following calculations yield the shear stresses required for entrainment at each cross
section. The shield’s equation yields the critical shear stress (λ c ) required to move a
particle of a specific size (Shields, 1936, Gordon et al., 2004):
λ c=θcgd(ρs-ρ) (9)
θc= Shield’s parameter, 0.056
g=gravity, 9.8 m/s2
d=diameter of particle (m)
ρs= particle density, 2650 kg/m3
ρ=density of water, 1000 kg/m3
The value for the Shield’s parameter (θc) indicates flow conditions that are either
hydraulically smooth or rough. For hydraulically smooth conditions, laminar flow is
presumably occurring whereas the hydraulically rough conditions correspond to
turbulent flows. The Shield’s parameter ranges between 0.04 and 0.06 with an average
of 0.044. A value of 0.056 was elected for this study. This value is considered a
“transition zone” between hydraulically smooth and hydraulically rough conditions
(Gordon et al., 2004). Because the Shield’s parameter is dependent on sediment particle
cohesiveness, imbrication and sediment armoring, it may underestimate the shear
stresses required to move clay sized particles (Gordon et al., 2004). The critical shear
stress required to move a particle was calculated for both median (d50) and coarse (d84)
particle sizes at each of the cross sections downstream of Somerville Dam.

53
To determine the shear stresses of the flows at USGS gaging station 08110000
(Fig. 5, Table 2), the following equation was used:
λ =ρgdS (10)
ρ= density of water, 1000 kg/m3
g=gravity, 9.8 m/s2
d= stage height (m)
S=slope = 0.0001
The flow data from USGS reports gage heights, which represent d in the
equation. The shear stress for each respective stage height was then compared against
the shear stress needed to entrain d50 and d84 sediment particles found using equation 9.
This determined how often shear stresses capable of transporting sediment were present.
Aerial Photograph Analysis
Aerial photographs were analyzed within a Geographic Information System
(GIS) for evidence of erosional and depositional processes and features. Depositional
features (such as sand bars, aggredations and cutbanks) clearly identifiable in the aerial
photographs were digitized. First, a criteria based on pixel digital number values for all
bands supplied within the aerial photograph was developed for each year for consistent
digitizing of features. This identified a threshold to define depositional features as areas
that are absent of vegetation and thus have a higher reflectance than surrounding
vegetated areas and water. To accomplish this, aerial photographs were reviewed and, in
conjunction with field observations, depositional features were identified. The pixel

54
digital number values for these depositional features were determined and used as a
criteria to identify other bars along the creek for the same year of aerial photographs.
Due to the low resolution in the historical photographs and varying stage heights, only
qualitative changes in features were ultimately able to be recorded. These observations
nevertheless corroborate the quantitative results obtained from field and laboratory
analyses.

55
CHAPTER V
RESULTS
Sediment Characteristics
Bed Sediment
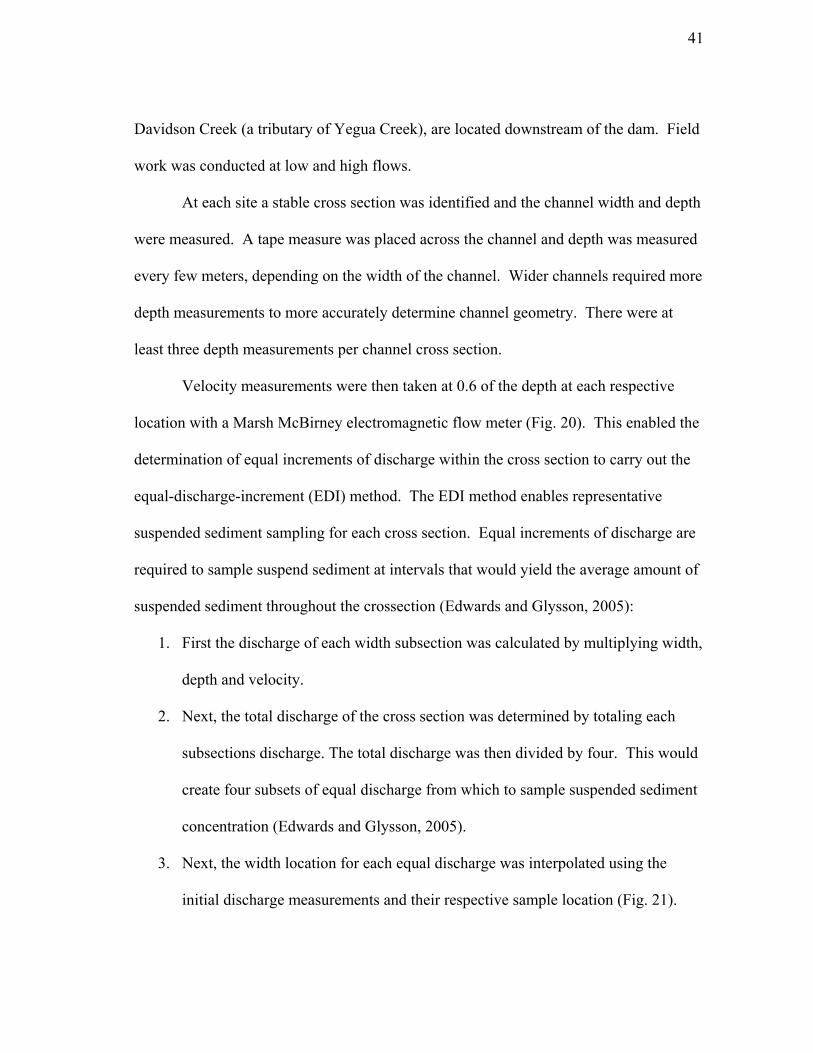
The size distributions of bed sediment from Yegua Creek upstream and
downstream of Somerville Dam are reported in Table 5. These results were plotted on a
cumulative particle size distribution curve to determine the median particle size (50th
percentile, d50), and coarse particle size (84th percentile, d84), as well as d10, d16, d25, d75,
d90 (Fig. 22-26). Values for each of the percentiles are shown on Table 6. Median
sediment sizes throughout the drainage basin were primarily sands, with the exception of
just below Somerville Dam, where clays dominated channel bed sediment. Coarse (d84)
sediment sizes show a concentration of very coarse sediment in West Yegua Creek and
lower Middle Yegua Creek.
Middle Yegua Creek had an average median sediment size of 0.65 mm and
sediment range from 1.49 mm to 0.07 mm (Fig. 27). This is classified as very coarse
sands to very fine sands (Fig. 28). Coarse sediment sizes at this location average 1.26
mm and range from 0.20 mm to 2mm (Fig. 29), or fine sands to very coarse sands (Fig.
30). Middle Yegua Creek sediment size distributions also show an increase with
distance from headwaters. This is followed by a gradual decrease (Fig. 31).

56
Table 5. Particle size distribution.
Particle Size
Total Clay Fine Silt
Coarse Silt
Very Fine Sand
Fine Sand
Medium Sand
Coarse Sand
Very Coarse Sand
Coarse Fragments
<0.002 0.002-0.02 0.02-0.05 0.05-0.1 0.1-0.25 0.25-0.5 0.5-1.0 1.0-2.0 >2.0
Cross Section
Location
(mm) (mm) (mm) (mm) (mm) (mm) (mm) (mm) (mm) D377 2.80 0.88 0.56 4.78 34.50 7.11 2.99 2.39 44.00 D161 13.86 6.26 3.49 11.99 37.52 9.81 2.42 1.98 12.67 D60 7.53 4.32 3.76 15.24 46.79 12.76 2.15 0.75 6.67
D1361 5.30 2.44 2.11 8.04 40.05 11.60 2.16 3.62 24.67 EY413 26.47 18.45 8.28 6.04 24.32 11.88 2.24 1.32 1.00 EY21 18.14 6.08 4.30 14.81 43.20 8.76 0.97 0.74 3.00
WY108 12.19 6.63 5.43 11.62 22.78 10.27 5.25 3.85 22.00 WY77 4.33 1.69 0.76 2.60 12.67 18.05 9.92 6.99 43.00
WY114 2.00 0.89 0.97 2.11 10.98 17.88 15.18 6.99 43.00 N119 3.49 1.10 0.69 3.06 9.85 8.75 5.71 2.69 64.67 C131 3.67 1.46 0.24 1.16 5.92 33.18 16.86 5.51 32.00 C1697 5.03 1.07 0.35 3.49 22.04 40.18 16.60 5.57 5.67 MY306 15.73 9.34 6.93 18.59 32.83 9.15 2.16 0.57 4.67 MY696 2.72 1.03 0.73 2.35 32.02 55.92 4.40 0.17 0.67 MY21 2.38 1.25 1.30 2.37 10.67 14.00 8.06 8.61 51.33
MY117 4.49 2.09 1.63 5.47 14.91 9.04 7.75 5.61 49.00 MY141 8.92 3.76 4.34 9.33 19.13 23.93 9.17 3.79 17.67 Y36US 55.60 25.30 2.95 5.45 6.55 2.25 1.05 0.80 0.00 Y36DS 53.70 26.45 3.30 6.10 7.75 2.05 0.50 0.15 0.00
LA 31.20 11.40 2.40 3.30 26.90 22.60 2.00 0.20 0.00 LB 26.88 8.94 2.39 12.39 38.64 9.17 0.90 0.40 0.33
Y50US 16.50 5.70 4.20 18.60 49.10 5.50 0.30 0.10 0.00 Y50DS 11.85 3.94 1.39 1.42 16.65 47.18 15.73 1.16 0.67

57
Fig. 22. Yegua Creek cumulative particle size distribution curves (Cross Section abbreviations refer to those found on Table 3).
Fig. 23. Middle Yegua Creek cumulative particle size distribution curves (Cross Section abbreviations refer to those found on Table 3).
0.00
10.00
20.00
30.00
40.00
50.00
60.00
70.00
80.00
90.00
100.00
<.002 .002-.02 .02-.05 .05-.1 .1-.25 .25-.5 .5-1 1.0-2.0 >2
Particle Size Range
Cum
mu
lati
ve P
erce
nt
(%)
Y36US Y36DS LA LB Y50US Y50DS
0.00
10.00
20.00
30.00
40.00
50.00
60.00
70.00
80.00
90.00
100.00
<.002 .002-.02 .02-.05 .05-.1 .1-.25 .25-.5 .5-1 1.0-2.0 >2Particle Size Range
Cu
mm
ula
tive
Per
cen
t(%
)
MY306 MY696 MY21 MY117 MY141
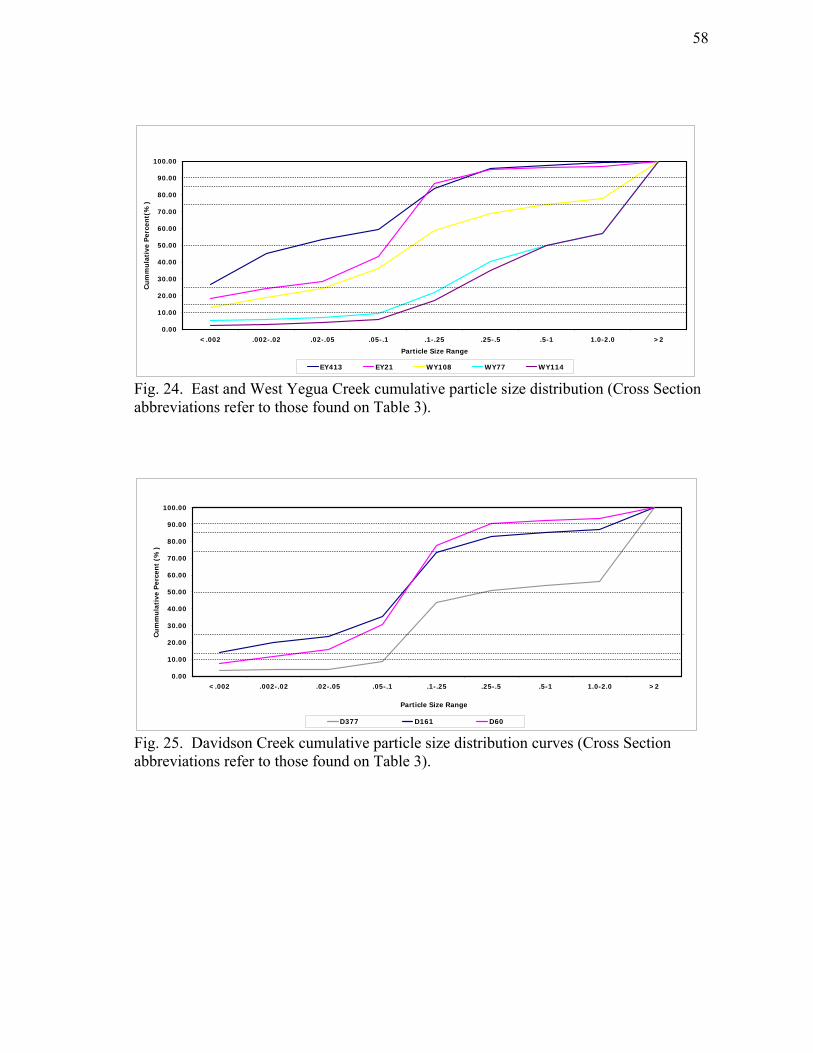
58
Fig. 24. East and West Yegua Creek cumulative particle size distribution (Cross Section abbreviations refer to those found on Table 3).
Fig. 25. Davidson Creek cumulative particle size distribution curves (Cross Section abbreviations refer to those found on Table 3).
0.00
10.00
20.00
30.00
40.00
50.00
60.00
70.00
80.00
90.00
100.00
<.002 .002-.02 .02-.05 .05-.1 .1-.25 .25-.5 .5-1 1.0-2.0 >2
Particle Size Range
Cu
mm
ula
tive
Per
cen
t (%
)
D377 D161 D60
0.00
10.00
20.00
30.00
40.00
50.00
60.00
70.00
80.00
90.00
100.00
<.002 .002-.02 .02-.05 .05-.1 .1-.25 .25-.5 .5-1 1.0-2.0 >2
Particle Size Range
Cu
mm
ula
tive
Per
cen
t(%
)
EY413 EY21 WY108 WY77 WY114

59
Fig. 26. Nails and Cedar Creek cumulative particle size distribution curves (Cross Section abbreviations found on Table 3).
0.00
10.00
20.00
30.00
40.00
50.00
60.00
70.00
80.00
90.00
100.00
.002-.02 .02-.05 .05-.1 .1-.25 .25-.5 .5-1 1.0-2.0 >2
Particle Size Range
Cum
mu
lati
ve P
erce
nt(
%)
N119 C131 C1697

60
Table 6. Cumulative particle size values (Cross Section abbreviations refer to those found on Table 3).
Diameter Values Cross section d10 d16 d25 d50 d75 d84 d90
(mm) (mm) (mm) (mm) (mm) (mm) (mm) D377 0.075 0.086 0.09 0.34375 1.9 2 2 D161 0.0003 0.0015 0.038 0.094 0.2125 0.6875 1.68 D60 0.004 0.035 0.05 0.095 0.16 0.3 0.375
D1361 0.035 0.04 0.82 0.1375 1.5 2 2 EY413 0.0001 0.00001 0.0015 0.022 0.11875 0.19 0.25 EY21 0.00001 0.04 0.013 0.82 0.135 0.17 0.23125
WY108 0.00001 0.004 0.035 0.109 0.09 1.75 2 WY77 0.08 0.11 0.19 0.6875 2 2 2
WY114 0.09 0.175 0.24 0.6875 2 2 2 N119 0.08 0.145 0.3125 1.625 2 2 2 C131 0.115 0.19 0.22 0.4375 1.625 2 2 C1697 0.075 0.089 0.115 0.24 0.42 0.625 0.75 MY306 0.00001 0.001 0.007 0.06875 0.1375 0.2 0.3 MY696 0.08 0.09 0.12 0.2 0.29 0.33 0.33 MY21 0.085 0.17 0.25 1.49 0.9 2 2
MY117 0.05 0.08 0.1375 1.3 2 2 2 MY141 0.0015 0.006 0.068 0.2 0.6 1.75 1.85 Y36US 0.00001 0.00001 0.00001 0.000625 0.008 0.0425 0.08 Y36DS 0.00001 0.00001 0.00001 0.000625 0.008 0.0425 0.08
LA 0.00001 0.00001 0.00001 0.075 0.18 0.22 0.27 LB 0.00001 0.00001 0.0009 0.07 0.115 0.145 0.19
Y50US 0.00001 0.001 0.02 0.08 0.115 0.1375 0.145 Y50DS 0.0005 0.012 0.09 0.22 0.33 0.43 0.5

61
West Yegua Creek, a tributary of Middle Yegua Creek, has an average of 0.49
mm sediment sizes (Fig. 27). These range from 0.11 mm to 0.69 mm, and are classified
as coarse sands (Fig. 28). Coarse sediment sizes (d84) average 1.92 mm and range from
1.75 mm to 2mm (Fig. 29), or very coarse sands (Fig. 30). The sediment sizes in West
Yegua Creek increase with distance from the headwaters (Fig. 31).
Other tributaries of Lake Somerville include East Yegua Creek, Nails Creek, and
Cedar Creek. Average median sediment size on East Yegua Creek is 0.42 mm, with a
range of 0.02 mm to 0.08 mm, or fine sands to coarse sands (Fig. 27 and 28). Coarse
(d84) sediment sizes along East Yegua Creek average 0.18 mm and range from 0.19 mm
to 0.17 mm, and are classified as fine sands (Fig. 32 and 33). East Yegua Creek
sediment sizes show a slight increase with distance downstream (Fig. 31). Sediment
analysis on Nails Creek showed a median sediment size classification of very coarse
sands, or 1.63 mm (Fig. 27 and 28). Coarse (d84) sediment sizes on Nails Creek was 2
mm, or very coarse sand (Fig. 32 and 33). Median sediment size on Cedar Creek
averaged 0.34 mm and ranged from 0.44 mm to 0.24 mm (Fig. 27). These sediment
sizes are classified as medium sands to fine sands (Fig. 28). Coarse sediment sizes
average 1.31 mm and range from 0.63 mm to 2 mm and is classified as very coarse sands
to coarse sands (Figures 32 and 33). Cedar Creek sediment sizes show a decrease with
distance from headwaters (Fig. 31).
The average sediment size of Davidson Creek is 0.18 mm and ranges from 0.09
mm to 0.34 mm (Fig. 27). These are classified from medium sand to very coarse sand

62
Fig. 27. Median (d50) bed sediment sizes (mm), Yegua Creek drainage basin.
Fig. 28. Median (d50) bed sediment size classifications (VCS= very coarse sand, CS= coarse sand, MS= medium sand FS= fine sand, VFS= very fine sand, C=Clay).

63
Fig. 29. The 84th percentile (d84) bed sediment sizes (mm), Yegua Creek drainage basin.
Fig. 30. The 84th percentile (d84) bed sediment size classification (VCS= very coarse sand, CS= coarse sand, MS= medium sand FS= fine sand, VFS= very fine sand, C=Clay).

64
Fig. 31. Median sediment size distributions upstream of Somerville Dam.
Fig. 32. Davidson Creek median sediment size distribution.
0
0.2
0.4
0.6
0.8
1
1.2
1.4
1.6
1.8
5 20 35 42 47Distance from Headwaters (km)
Bed
Sed
imen
t S
ize
(mm
)
Middle Yegua Creek West Yegua Creek East Yegua Creek
Cedar Creek Nails Creek
0
0.05
0.1
0.15
0.2
0.25
0.3
0.35
0.4
1 1.5 2 2.5
Distance from Headwaters (km)
Bed
Sed
imen
t Si
ze (
mm
)

65
Fig. 33. Yegua Creek sediment size distribution downstream of Somerville Dam.
0
0.05
0.1
0.15
0.2
0.25
1 1.5 2 2.5 20 20.5
Distance from Headwaters (km)
Be
d Se
dim
ent
Siz
e (m
m)
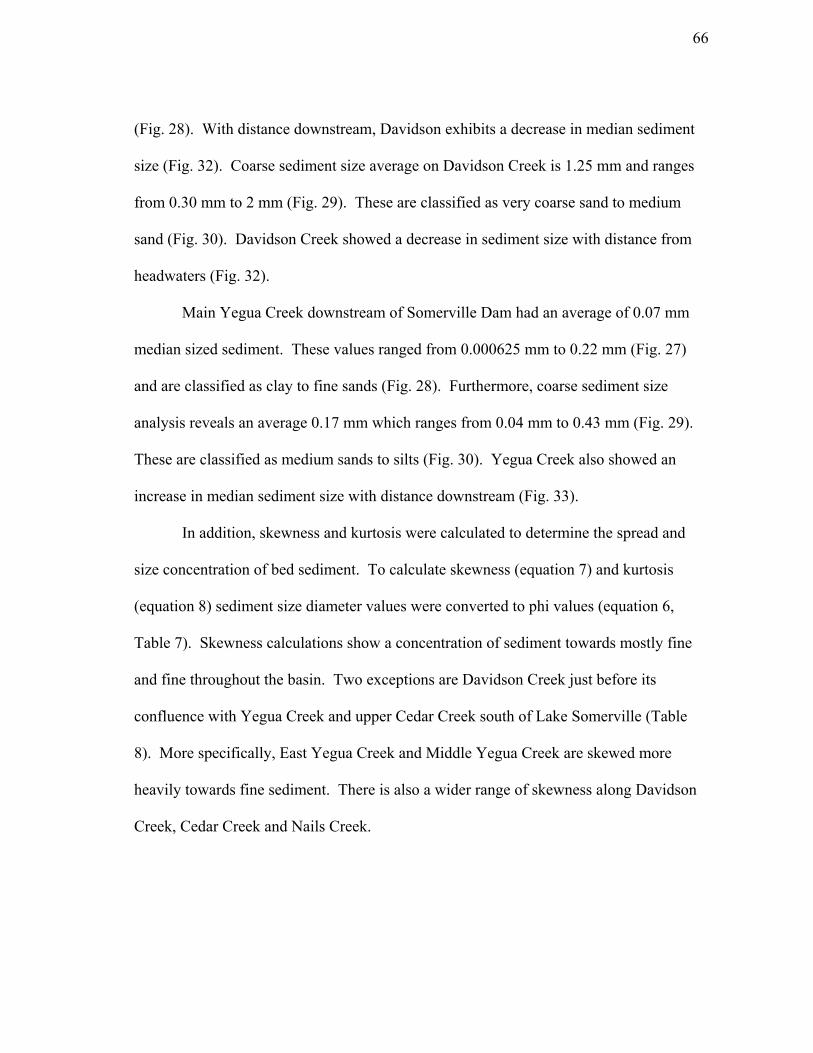
66
(Fig. 28). With distance downstream, Davidson exhibits a decrease in median sediment
size (Fig. 32). Coarse sediment size average on Davidson Creek is 1.25 mm and ranges
from 0.30 mm to 2 mm (Fig. 29). These are classified as very coarse sand to medium
sand (Fig. 30). Davidson Creek showed a decrease in sediment size with distance from
headwaters (Fig. 32).
Main Yegua Creek downstream of Somerville Dam had an average of 0.07 mm
median sized sediment. These values ranged from 0.000625 mm to 0.22 mm (Fig. 27)
and are classified as clay to fine sands (Fig. 28). Furthermore, coarse sediment size
analysis reveals an average 0.17 mm which ranges from 0.04 mm to 0.43 mm (Fig. 29).
These are classified as medium sands to silts (Fig. 30). Yegua Creek also showed an
increase in median sediment size with distance downstream (Fig. 33).
In addition, skewness and kurtosis were calculated to determine the spread and
size concentration of bed sediment. To calculate skewness (equation 7) and kurtosis
(equation 8) sediment size diameter values were converted to phi values (equation 6,
Table 7). Skewness calculations show a concentration of sediment towards mostly fine
and fine throughout the basin. Two exceptions are Davidson Creek just before its
confluence with Yegua Creek and upper Cedar Creek south of Lake Somerville (Table
8). More specifically, East Yegua Creek and Middle Yegua Creek are skewed more
heavily towards fine sediment. There is also a wider range of skewness along Davidson
Creek, Cedar Creek and Nails Creek.

67
Table 7. Cumulative particle size phi (φ ) values (Cross Section abbreviations refer to those found on Table 3).
Phi Values Cross Section phi50 phi84 phi16 phi90 phi10 phi75 phi25 D377 1.54 -1.00 3.54 -1.00 3.74 -0.93 3.47 D161 3.41 0.54 9.38 -0.75 11.70 2.23 4.72 D60 3.40 1.74 4.84 1.42 7.97 2.64 4.32
D1361 2.86 -1.00 4.64 -1.00 4.84 -0.58 0.29 EY413 5.51 2.40 16.61 2.00 13.29 3.07 9.38 EY21 0.29 2.56 4.64 2.11 16.61 2.89 6.27
WY108 3.20 -0.81 7.97 -1.00 16.61 3.47 4.84 WY77 0.54 -1.00 3.18 -1.00 3.64 -1.00 2.40 WY114 0.54 -1.00 2.51 -1.00 3.47 -1.00 2.06 N119 -0.70 -1.00 2.79 -1.00 3.64 -1.00 1.68 C131 1.19 -1.00 2.40 -1.00 3.12 -0.70 2.18 C1697 2.06 0.68 3.49 0.42 3.74 1.25 3.12 MY306 3.86 2.32 9.97 1.74 16.61 2.86 7.16 MY696 2.32 1.60 3.47 1.60 3.64 1.79 3.06 MY21 -0.58 -1.00 2.56 -1.00 3.56 0.15 2.00 MY117 -0.38 -1.00 3.64 -1.00 4.32 -1.00 2.86 MY141 2.32 -0.81 7.38 -0.89 9.38 0.74 3.88 Y36US 10.64 4.56 16.61 3.64 16.61 6.97 16.61 Y36DS 10.64 4.56 16.61 3.64 16.61 6.97 16.61
LA 3.74 2.18 16.61 1.89 16.61 2.47 16.61 LB 3.84 2.79 16.61 2.40 16.61 3.12 10.12
Y50US 3.64 2.86 9.97 2.79 16.61 3.12 5.64 Y50DS 2.18 1.22 6.38 1.00 10.97 1.60 3.47

68
Table 8. Cumulative particle size distribution skewness and kurtosis calculations (Cross Section abbreviations refer to those found on Table 3).
Cross section Location
Standard Deviation Mean Skewness Kurtosis
D377 2.27 1.27 0.10 0.57 D161 4.42 4.96 -0.34 2.64 D60 1.55 3.29 -0.16 2.05
D1361 2.82 1.82 0.35 3.53 EY413 7.11 9.50 -0.47 0.94 EY21 1.04 3.60 -2.21 2.26
WY108 4.39 3.58 -0.31 6.80 WY77 2.09 1.09 -0.30 0.72 WY114 1.76 0.76 -0.22 0.77 N119 1.89 0.89 -0.86 0.91 C131 1.70 0.70 0.18 0.75 C1697 1.41 2.08 -0.01 0.94 MY306 3.82 6.14 -0.66 1.82 MY696 0.94 2.54 -0.26 0.85 MY21 1.78 0.78 -0.79 1.30 MY117 2.32 1.32 -0.75 0.73 MY141 4.09 3.29 -0.31 1.72 Y36US 6.03 10.58 0.04 0.71 Y36DS 6.03 10.58 0.04 0.71
LA 7.21 9.40 -0.77 0.55 LB 6.91 9.70 -0.82 1.07
Y50US 3.55 6.41 -0.83 2.88 Y50DS 2.58 3.80 -0.69 2.80

69
Kurtosis values show a wide variety of concentrations throughout the drainage
basin (Table 8). Sediment sizes are concentrated in the median values along Middle
Yegua Creek, Davidson Creek, East Yegua Creek and West Yegua Creek. Nails and
Cedar exhibit a wider range of values. A wide range of sediment sizes characterizes the
area of Yegua Creek immediately below the dam. Downstream of the dam, values
concentrate around the mean.
Suspended Sediment
West Yegua Creek, a tributary of Middle Yegua Creek has an average suspended
sediment concentration of 8.28 ppm and ranges from 6.32 ppm to 9.28 ppm at low flows
(Fig. 34). The suspended sediment of Middle Yegua Creek upstream of the dam
averages 14.82 ppm and ranges from 7.87 ppm to 23.21 ppm (Fig. 34). East Yegua
Creek averages 10.46 ppm with a range from 5.59 ppm to 15.23 ppm in suspended
sediment concentration. Nails Creek, and Cedar Creek average suspended sediment
concentrations are 10.21 ppm and 10.00 ppm, respectively. Furthermore, Cedar Creek’s
suspended sediment concentration ranges from 9.90 ppm to 10.09 ppm (Fig. 34). Trends
with distance downstream are displayed in Fig. 35-37. While sediment concentrations
are variable, a trend is detected whereby concentrations decreased with distance from
headwaters.
Suspended sediment concentrations occurring at high flows upstream of
Somerville Dam were 37.00 ppm on Middle Yegua Creek before the West Yegua
confluence (Fig. 38). Downstream of the West Yegua Creek confluence, suspended

70
Fig. 34. Low flow suspended sediment concentrations.

71
Fig. 35. Suspended sediment concentrations upstream of Somerville Dam.
Fig. 36. Yegua Creek suspended sediment concentrations downstream of Somerville Dam.
0
5
10
15
20
25
5 20 35 42 47
Distance From Headwaters (km)
Con
cent
rati
on (
ppm
)
Middle Yegua Creek West Yegua Creek East Yegua Creek Nails Creek Cedar Creek
0
510
15
2025
30
3540
45
1 1.5 2 2.5 20
Distance from Headwaters (km)
Co
nce
ntr
ati
on
(p
pm
)

72
Fig. 37. Davidson Creek suspended sediment concentrations .
Fig. 38. High flow suspended sediment concentration.
0
5
10
15
20
25
30
35
40
15 36 56 61
Distance from Headwaters (km)
Con
cent
rati
on (
ppm
)

73
sediment concentration was 32.83 ppm. Downstream of the dam, concentrations
averaged 25.99 ppm. These concentrations ranged from 18.20 ppm to 30.96 ppm (Fig.
38).
Sediment Movement Through Somerville Dam
The trap efficiency is the percentage of sediment deposited and trapped by a
reservoir (Verstraeten and Poesen, 2000). Using catchment area and reservoir capacity,
the trap efficiency of Somerville Dam was determined to be 99.8% based on Equation 2.
Therefore, 99.8% of the sediment that enters Lake Somerville is deposited and
presumably, does not pass through the dam.
Lake volume changes, assumed to be a result of sedimentation, can also give
insight into basin sediment yield (Phillips, 2003). According to the Texas Water
Development Board (TWDB), Lake Somerville has lost a total of 7543.6 acre feet of
water volume to sedimentation over the nine year period between reservoir surveys (Fig.
39). Taking into account the drainage area of 2,605.44 km2, as well as the total volume
loss between the years of 1995 and 2003, a total of 396.8 m3/km2/yr of sediment yield
has been deposited into the lake. Therefore, approximately 400 m3/km2/yr of sediment is
deposited into Lake Somerville.
According to TWDB, the loss in water volume in Lake Somerville is a 3.2%
decrease in storage capacity since the last survey (1967) conducted (TWDB, 2005). In
addition, sediment storage prior to dam construction was estimated at 16,200 acre feet in
50 years. Water volume loss based on surveying, however, show a substantial amount of

74
Fig. 39. Cumulative water volume loss in Lake Somerville between 1995 and 2003.
0.0
1000.0
2000.0
3000.0
4000.0
5000.0
6000.0
7000.0
8000.0
203 205 207 209 211 213 215 217 219 221 223 225 227 229 231 233 235 237
Elevation (m)
Acr
e Fe
et

75
sedimentation. Sedimentation has resulted in a 7,543 ac ft of water volume loss in Lake
Somerville between 1995 and 2003. In addition, a previous survey on Lake Somerville
reported in Phillips et al. (2004) a 50,538 ac ft loss in water volume due to sedimentation
between 1967 and 1995. Combined, these yield an average of 1,570 ac ft loss each year.
This loss, in addition to projected average loss for the next ten years yields a 78,489 ac ft
loss to sedimentation in 50 years of impoundment. This is much greater than the 16,200
acre feet predicted (USACE, 2007a). Therefore, sedimentation is occurring at a much
higher rate than anticipated by the USACE when the dam was constructed.
Sediment Movement Downstream of Somerville Dam
Calculations using the Shield’s equation (equation 9) for median (d50) sediment
sizes yield the shear stress required to mobilize present sediment (Table 9). The average
shear stress needed to move the current sediment present in channel reaches downstream
of the dam is 0.0673 N/m2. Shear stress values range from 0.0006 N/m2 to 0.1992 N/m2
to move particles 0.000625 mm and 0.22 mm, respectively. These particles are located
at Y36US (Fig. 19) just downstream of the dam and near Yegua Creek’s confluence with
the Brazos River at the Y50DS cross section (Fig. 19). Particle size and the shear stress
required to mobilize these particles increased with distance from the dam.
Shear stress required to mobilize coarse sediment sizes (d84) downstream of
Somerville Dam averaged 0.1536 N/m2 and ranged from 0.0385 N/m2 to 0.3894 N/m2.
These occurred at the Y36US cross section with 0.0425 mm and the Y50DS cross
section with 0.43 mm in sediment size, respectively (Table 10). Particle size and the

76
Table 9. Shear stresses required for movement of median sediment sizes (Cross sections refer to those listed in Table 3).
Particle Size Particle Size Critical Shear Stress Cross Section (mm) Category N/m2 Y36US 0.000625 Clay 0.0006 Y36DS 0.000625 Clay 0.0006
LA 0.075 Very fine sand 0.0679 LB 0.07 Very fine sand 0.0634
Y50US 0.08 Very fine sand 0.0724 Y50DS 0.22 Fine sand 0.1992
Table 10. Shear stresses required for movement of coarse (84th percentile) sediment sizes (Cross sections refer to those listed in Table 3).
Particle Size Particle Size Critical Shear Stress Cross Section (mm) Category N/m2 Y36US 0.0425 Silt 0.0385 Y36DS 0.0425 Silt 0.0385
LA 0.22 Fine sand 0.1992 LB 0.145 Fine sand 0.1313
Y50US 0.1375 Fine sand 0.1245 Y50DS 0.43 Medium Sand 0.3894

77
shear stress required to mobilize these particles increased with distance from the dam as
well.
In addition, flow records acquired from USGS gaging station 08110000 (Fig. 5)
for the period of record (1967 -1992) provided insight into sediment movement after
stream impoundment. The stage heights reported in the discharge data associated with
these flows enabled the shear stress to be determined. (Equation 10, Appendix A).
These were then compared against the critical shear stress needed to entrain the sediment
present downstream of Somerville Dam (Tables 9 and 10).
The results show that both median and coarse sediment sizes were mobilized by
the majority of the flows recorded after stream impoundment (Appendix A). The check
marks in the appendix indicate the events when the shear stress produced by that flow
exceeded critical stream stresses required for entrainment. Thus, the flows were capable
of mobilizing sediment most of the time. Because sediment sizes in both the median and
coarse categories increased with distance from the dam, the critical shear stress required
to mobilize sediment increased downstream as well. Therefore, instances where stage
height and its respective stress was not capable of moving the present sediment occurred
more often at sites located farther from Somerville Dam. These instances are depicted in
Appendix A where blanks are located. In all, median and coarse sediment sizes were
mobilized almost all of the times stage height was measured after stream impoundment
between 1967 and 1992.

78
Observations from Aerial Photographs
Aerial photos of Yegua Creek from 1995 and 2003 provided qualitative
information regarding depositional features downstream of Somerville Dam. Because of
differing aerial photograph resolutions and stage heights however, quantitative
comparisons regarding the size and distribution of depositional features were not reliable
ultimately. Table 11 presents the stage heights at the time aerial photographs were
taken. The gage heights for 1995 and 2004 occurred after the discontinuation of gaging
station 08110000 (Fig. 5). Therefore the gage heights for Davidson Creek, a major
tributary of Yegua Creek downstream of Somerville Dam, were used.
One example of digitizing is illustrated in Figure 40. The sand bar is digitized as
a polygon in 1988, 1995 and 2004. Flooding is apparent in the 1958 photograph and
stage height is substantially lower in 2004. The increase in sand bar size in 2004 is
likely due to the decreased stage height, making more of the sand bar visible in this
photograph. In addition, the low resolution of the 1958 and 1988 photographs make
digitizing difficult for this period of time.
Qualitative analysis of aerial photographs give indication of erosional and
depositional processes and features downstream of Somerville Dam. Immediately
downstream its confluence with Wolf Creek, 5.5 km downstream of Somerville Dam
(Fig. 19), Yegua Creek developed some depositional features that remain evident until
its confluence with the Brazos River (Fig. 41). The most prominent appearance of these
depositional features occurred in 2004 where stage height was substantially lower than

80
Fig. 40 Methods figure.
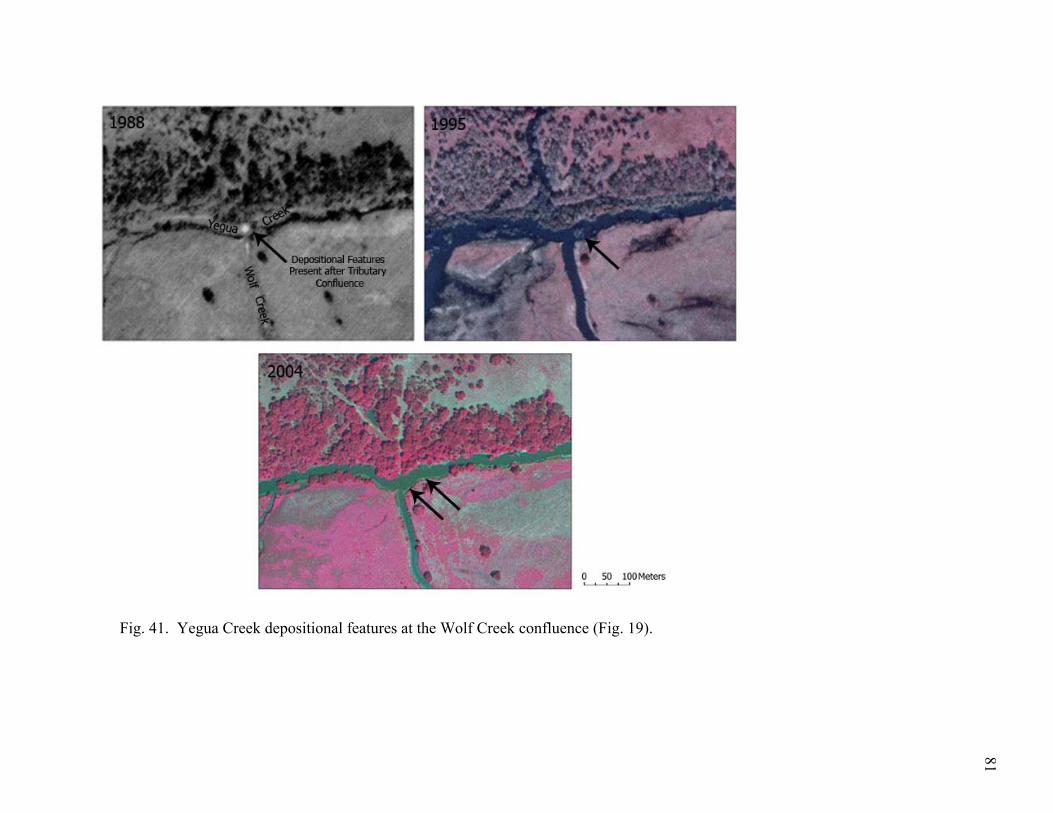
81
Fig. 41. Yegua Creek depositional features at the Wolf Creek confluence (Fig. 19).

82
Table 11. Gage heights for corresponding aerial photographs. Asterisk (*) denotes gage height from Davidson Creek.
Date Yegua Creek
Gage Height (m) Davidson Creek Gage Height (m)
February 28, 1958 1.285 Not Available January 17, 1988 0.18 0.72
January 17-March 6, 1995 Not Available 2.21* July 27- September 7, 2004 Not Available 0.72*

83
Fig. 42. Yegua Creek depositional features at the Davidson Creek confluence (Fig. 19).

84
in previous years (Table 11). This increase in depositional features was also evident
near Davidson Creek’s confluence (Fig. 42) in the 2004 photograph, although more
depositional features may be visible in 2004 due to a lower stage height. In addition, the
low resolution of the 1988 image near Davidson Creek makes it difficult to see
depositional features present at that time.
Qualitative analysis of the 2004 aerial photograph shows active deposition and
erosion occurring downstream of Somerville Dam. Fig. 43, located 355 m upstream of
Davidson Creek (Fig. 19), clearly shows areas of significant deposition and erosion
along several Yegua Creek meanders. Fig. 44, 3.3 km upstream Y50US (Fig. 19),
indicates erosion and deposition as well. The actively developing depositional bar is
noted on the far right meander, accompanied by erosion on the opposite bank. The same
is true for the meander in the top left of the figure.
Field observations corroborate evidence of deposition and erosion provided by
the aerial photographs. Figures 45 and 46 show the same location (Y50DS, Fig. 19),
before and after a summer of 2007 flood event. Fig. 45 clearly shows a sand bar on the
left edge of water. After a flood event, the absence of the sand bar is clear. This
location is depicted in Fig. 47 as an aerial photograph. The sand bar is the depositional
feature found in Fig. 45. In addition, the unstable bank showing active erosion is the
feature depicted in Fig. 17. Therefore, aerial photographs and field observations support
the conclusion that Yegua Creek is actively eroding and depositing sediment
downstream of Somerville Dam and is not dominated by one single process regime.

85
Fig. 43. Depositional and erosional features downstream of Somerville Dam.
86
Fig. 44. Depositional and erosional features upstream of Y50US (Fig. 19).

87
Fig. 45. Yegua Creek depositional feature downstream of Somerville Dam.
Fig. 46. Same location on Yegua Creek after major flood event. Note absence of depositional feature.

88
Fig. 47. Y50US cross section.

89
CHAPTER VI
DISCUSSION AND CONCLUSIONS
Discussion
Sediment Characteristics
Although much variability is expected, undisturbed stream reaches typically
show a decrease instead in median (d50) and coarse (d84) sediment sizes with increasing
distance downstream (Graf, 1980; Chien, 1985; Knighton, 1987). For example, The Aya
River and the Colorado River both exhibited a decrease in particle size with distance
from Huchu Dam and Hoover Dam, respectively (Williams and Wolman, 1984).
Davidson Creek, Cedar Creek, and Middle Yegua Creek downstream of its confluence
with West Yegua Creek exhibited this expected decrease in median sediment sizes
(Figures 29 and 30). In addition, Cedar Creek and East Yegua Creek showed a decrease
in the coarser (d84) sediment sizes with distance downstream. These trends are
consistent with those of most natural streams.
This trend was not found on Yegua Creek below Somerville Dam, however.
Downstream of Somerville Dam, Yegua Creek experiences an increase in sediment size
with distance from the dam (Fig. 31), unlike the decrease found in previous studies on
impounded streams. The absence of this phenomenon can be attributed to the
characteristics of this particular basin, in which most of the tributaries upstream of Lake
Somerville experienced a coarsening with distance from it’s headwaters. This is likely
due to an increase in discharge with increase catchment area common in most basins that

90
transports fine sediment and deposits coarser sediment. East Yegua, Middle Yegua, and
West Yegua Creek showed significant coarsening in median sediment sizes with
distance downstream as well.
The soil surveys of Washington County (southeast of Lake Somerville) and Lee
County (west of Lake Somerville) show Kaufman soils, primarily consisting of clay and
loam, surrounding Yegua Creek and all of its tributaries. However, these Kaufman soils
are surrounded by fine sandy loam soils and loamy sand above Somerville Dam,
whereas Kaufman soils are surrounded by excessively fine, clayey soils downstream of
the dam (Burgess and Lyman, 1906; Chervenka et al., 1981). These characteristics may
explain the concentration of coarse materials upstream of the dam, as well as their
absence downstream of the dam.
Changes in sediment characteristics over time can also occur after stream
impoundment. In some instances, coarsening can occur downstream of a dam. This
coarsening can appear due to the “hungry water” effect immediately downstream of the
dam that carries away fine sediment, leaving coarse sediment behind (Kondolf, 1997).
On the other hand, some research suggests a decrease in median sediment sizes directly
downstream of impoundments over time. This can be a result of fine sediment supplied
from upstream of the impoundment, tributary sediment contributions, or the exposure of
fine sediments due to channel scouring (Williams and Wolman, 1984). Specifically,
locations immediately downstream of Hoover Dam on the Colorado experienced a
decrease in sediment size after impoundment (Williams and Wolman, 1984).
91
Initial coarsening can reverse to fining of sediment downstream of an
impoundment after some time. Studies on the Missouri River downstream of Gavins
Point Dam and the Colorado River downstream of Davis and Parker Dams show an
initial increase in median sediment sizes before stabilizing 1-10 years after impoundment
(Williams and Wolman, 1984). This reversal of sediment coarsening is less likely to
propagate with increasing distance from the dam (Williams and Wolman, 1984). A
similar reversal trend evident along the Colorado occurred 1.1 km downstream of Davis
Dam and 26 km downstream of Parker Dam where sediment decreased in size
approximately 10 and 30 years after impoundment, respectively (Williams and Wolman,
1984). Forty years after impoundment, the same could be true downstream of
Somerville Dam.
Sediment Movement through Somerville Dam
The 99.8% trap efficiency of Somerville Dam is higher than the 81% found at the
nearby Livingston Dam on the Trinity River (Phillips et al., 2005). However, Williams
and Wolman reported an average of approximately 99% for large reservoirs (1984). In
addition, Canton Dam in Oklahoma has a trap efficiency of 99.5% and Denison Dam on
the Red River (Texas and Oklahoma) traps 99.2% of sediment. Therefore, Somerville
Dam has a trap efficiency similar to large impoundments and those in east Texas.
Sediment yield for Somerville Dam, approximately 396.8 m3/km2/yr, is similar to
other Texas impoundments. According to Phillips et al. (2004), the average sediment
yields for impoundments is 284.9 m3/km2/yr and can range from 5.8 m3/km2/yr, found at

92
Lake Houston to 1002.7 m3/km2/yr at Lake Aquilla. Phillips et al. (2004) estimated the
sediment yield of Lake Somerville at 853.7 m3/km2/yr in the previous sediment survey
conducted between 1967 and 1995, which represents a 28 year span. One reason to
explain differences in sediment yields concerning the 1967-1995 and 1995-2003 surveys
is the likelihood of higher magnitude floods present in the survey conducted within a
longer time span (Phillips et al., 2004). These sediment yields give insight into the
amount of sediment trapped by their respective dams. If trap efficiency is not
overestimated, the majority of this sediment is not passing through Somerville Dam.
However, varying sediment characteristics over time and differences in release patterns
can alter the sediment trap efficiency over time. Overestimation is unlikely based on
reservoir surveys which determined sedimentation.
Furthermore, sediment storage exceeds that planned for Somerville Dam prior to
impoundment. The life expectancy, therefore, could be shorter than estimated.
Problems associated with decreasing storage capacity, including limitations in water
storage, could occur sooner than expected. If so, Somerville Dam will no longer have
the ability to serve its original purpose.
Finally, sediment trapping by the dam may have caused a “decoupling” of the
upper and lower basin on Yegua Creek, similar to the Trinity River (Phillips et al.,
2004). This decoupling could prevent sediment interaction between the upper and lower
basin, creating sediment characteristics independent of each other.

93
Movement of Bed Sediment Downstream of Somerville Dam
According to the theoretical calculations of entrainment based on Shield’s
equation presented in the previous chapter, median sediment downstream of Somerville
Dam is capable of mobilization during the majority of the flows recorded after stream
impoundment (Appendix A). In addition, coarse (d84) sediment sizes are also capable of
being mobilized after impoundment (Appendix A). However, some possible sources of
error are included in these calculations. For instance, sediment was sampled in the 2007
and the latest flow data was recorded in 1991. Any changes in flows ability to transport
sediment after 1991 are not reflected in the results.
Theoretical transport calculations are highly dependent on the Shield’s parameter
(φ) which quantifies imbrication. The value used in this study, 0.056, may
underestimate imbrication. In addition, Wilcock and McArdell (1993) found that the
stream power calculated to transport sediment can be as little as half the actual power
required to move sediments of a specific size in their environment (Elliot and Parker,
1997).
These results corroborate field observations. Figures 45 and 46 how Yegua
Creek near its confluence with the Brazos River (Y50DS, Fig. 18 Table 2). Figure 44
shows the creek prior to a flooding event. Note the sand bar located on the left edge of
water. Figure 45 is this same location after a flood event. During this June 2007 flood
event, dam gates were opened 3 feet, releasing an average of 1,119.1 cfs from the dam
(USACE, 2007b). Average discharge released from the dam in 2007 was 568 cfs and

94
ranged from 2 cfs to 1638 cfs. The absence of the sand bar is clear after the flood event.
Therefore, current discharges are capable of transporting sediment.
Complete mobilization of sediment is unlikely however, due to vegetated banks
along stream channels. Riparian vegetation has been found to decrease erosion and
increase sedimentation (Elliot and Parker, 1997; Friedman et al., 1998; Gordon and
Meentemeyer, 2006). Other studies conducted on reaches downstream of impoundments
have found an increase in riparian vegetation along banks, likely resulting from a
decrease in peak flows that would normally discourage vegetation establishment (Elliot
and Parker, 1997; Gordon and Meentemeyer, 2006).
For example, decreased peak flows encouraged sediment deposition and the
establishment of vegetation on the Gunnison River (Elliot and Parker, 1997). Jennings
(1999) reported a similar situation along Yegua Creek in which riparian vegetation along
the stream banks increased 25% in the 20 year study period due to decreased peak
discharges which now rarely hinder vegetation establishment. This is illustrated in Fig.
48 where vegetation along Yegua Creek’s banks underwent significant development
between 1958 and 1988, the period in which impoundment began. In addition,

95
Fig. 48. Riparian vegetation and agricultural development on Yegua Creek near its confluence with the Brazos River.

96
conditions along Yegua Creek’s banks differ from conditions in the surrounding area.
The appearance of vegetation in streams is likely to make Shield’s calculations
unreliable and may account for the overestimation of sediment movement downstream
of Somerville Dam (Elliot and Parker, 1997).
Evidence of this phenomenon is found along Yegua Creek as well. Banks at the
Highway 36 cross section of Yegua Creek are highly vegetated and unlikely to be
erosive (Fig. 14). However, banks along the Landolt cross sections, where suspended
sediment is highest, are mostly free of vegetated material (Fig. 15). The lack of
vegetation could account for easily erodable banks and therefore, an increase in
suspended sediment concentrations.
In addition, tributaries can have a substantial influence on sediment supply in a
stream, and therefore depositional features. Elliot and Parker (1997) found that
tributaries supplied a great deal of alluvial material in the Gunnison Gorge. In addition,
tributaries were found to supply a significant amount of sediment to the River Mersey in
Tasmania (Knighton, 1988b) and the Green River, Utah (Grams and Schmidt, 2005).
This increase in sediment supply, coupled with a decrease in discharges due to
regulation, can cause an increase in depositional features that can no longer be
transported by available flows (Kondolf, 1997). This seems to be the case on Yegua
Creek where depositional features are evident downstream of the first tributary until its
confluence with the Brazos River.
Furthermore, the shear stresses produced by recorded stage heights show a
reduction in the ability to entrain sediment present in the lower reaches of Yegua Creek

97
near the Brazos River. This is due to an increase in sediment size with increasing
distance from the dam. It is likely that Davidson Creek (Fig. 17), Yegua Creek’s major
tributary downstream of Somerville Dam provides much of the coarse sediment found
downstream of the confluence. The sediment load supplied by this unregulated tributary
increases sediment size downstream of its confluence. Shield’s calculations then show
that flows released from the dam are less capable of transporting this sediment.
However, in addition to sediment supply, Davidson Creek may provide
significant stream power because it is an unregulated stream. The absence of a gaging
station downstream of Davidson’s confluence makes determining the exact stage height
between 1967 and 1992 impossible. Therefore, Yegua Creek’s stream power with the
addition to stream power provided from Davidson Creek may still be capable of
transporting available sediment.
Movement of Suspended Sediment Downstream of Somerville Dam
Suspended sediment concentration in an undisturbed basin typically increases
with distance downstream and with increasing basin size (Knighton, 1987). In the
Yegua Creek drainage basin upstream of Lake Somerville, this is the case for East
Yegua Creek, Middle Yegua Creek after its confluence with West Yegua Creek, and
Cedar Creek. It is not true for Davidson Creek, Middle Yegua Creek, and West Yegua
Creek. Impounded streams can also exhibit a decrease in suspended sediment. For
example, Hoover Dam and Glen Canyon Dam decreased the suspended sediment load

98
variability and concentration of the Colorado River due to sediment trapping (Williams
and Wolman, 1984).
Yegua Creek downstream of Lake Somerville shows an increase in suspended
sediment followed by a decrease. One possible reason is the increased importance of the
input of tributaries influencing sediment availability after Yegua Creek’s impoundment
(Williams and Wolman, 1984). Approximately one half of a kilometer downstream of
the Highway 36 cross sections, Wolf creek enters Yegua Creek (Fig. 19, Fig. 41). This
input could cause the increase in suspended sediment concentrations at both Landolt (LA
and LB) cross sections (Fig. 18, Table 2). Davidson Creek, another tributary of Yegua
Creek supplies a substantial amount of suspended sediment concentration and discharge
(Fig. 41).
In addition, an adequate amount of sediment may be available downstream of the
dam despite sediment trapping. According to Phillips (2003), reworked pre-dam
alluvium is a possible source, although unlikely along the Sabine River, Texas. Pre-dam
alluvium, therefore could be a sediment source along Yegua Creek.
Suspended sediment concentrations at high flows along Yegua Creek reiterate
the finding that sediment is being transported downstream of Somerville Dam. Fig. 49
and 50 show Yegua Creek at high and low flows, respectively. Sediment concentrations

99
Fig. 49. Yegua Creek during flood event downstream of Somerville Dam.
Fig. 50. Same location after flood event (Note: Sign suffered some damage during event).

100
averaged 26 ppm downstream of Somerville Dam at high flows. These concentrations
occurred at an average discharge of 15.48 cms. Therefore, high flows produced by the
dam have the ability to transport sediment.
Therefore, the characteristics observed in the present channel system reflect a
system in balance where erosional and depositional processes downstream of the dam
are both occurring and not dominated by one regime, as was likely the case during the
period of adjustment.
Summary of Findings
Analyses of sediment characteristics upstream and downstream of Somerville
Dam permit the following major findings. The bed sediments upstream of Lake
Somerville were generally coarser than those found downstream of the dam. Once
deposited behind the dam, results of this study show that sediments are unlikely to be
transported through the dam to the downstream reaches of Yegua Creek. An increase in
sediment size with distance from the dam was also found on Yegua Creek, although this
is not typical of most streams. However, tributary inputs, fine sediment supplied from
the dam, erosional processes in surrounding areas and local sediment characteristics
could account for these differences.
The first objective of this study was to determine to what extent sediment is
passing through Somerville Dam. According to Lake Somerville Surveys, 396.8
m3/km2/yr is being deposited into the reservoir. Furthermore, the reservoir traps 99.8%,
a large majority of this sediment. These results support the working hypothesis that an

101
insignificant quantity of sediment passes through the dam. Thus, the sediment trapping
has resulted in disconnecting the upper and lower portions of the Yegua Creek
watershed.
The second research objective addressed in this thesis was to determine the
extent present flows are mobilizing downstream of Somerville Dam. Suspended
sediment measurements show an increase in suspended sediment concentration
downstream of Somerville Dam, which is unusual for natural streams.
In addition, analysis of bed sediment characteristics, coupled with theoretical
calculations of entrainment, determined sediment mobilization. Median sediment sizes
are capable of mobilization by the majority of flows provided by releases from
Somerville Dam. However, a decrease in flows with the ability to entrain coarser
sediment sizes occurred after dam closure. Therefore, river regulation has decreased
coarse (d84) sediment transport capacity in Yegua Creek. The working hypothesis was
that the reduction in flood peaks owing to river regulation has decreased sediment
transport capacity in Yegua Creek which no longer allows sediment to move
downstream of the dam and into the Brazos River. However, little difference in shear
stresses before and after impoundment capable of moving present sediment was found in
this study.
Ultimately, results regarding suspended sediment concentrations and sediment
entrainment, in conjunction with previous findings along Yegua Creek, support the
interpretation that Yegua Creek has reached a new equilibrium following impoundment
by Somerville Dam. In response to a large decrease in peak flows after impoundment,

102
channel adjustments resulted in a 65% decrease in channel capacity (Chin et al., 2002)
was the channels response to the new flow regime. In other words, channels reduced in
size as a result of incompetent flows causing deposition within channels. The site
reduction occurred primarily in the depth dimensions. After several decades, however,
the channel adjustments have apparently produced a new regime that enables sediment
transport. This was evidenced in the 9% decrease in channel width and 61% decrease in
channel depth (Chin et al., 2002).
Significance
This study provides insight about the interrelationships among the different
system components. Previous research has shown that impoundment has caused a
decrease in peak flows along Yegua Creek. This, in turn, has caused a reduction in
stream capacity because smaller flows no longer had the ability to entrain available
sediment. A reduction in channel capacity is consistent with growth of vegetation,
which was able to establish along the banks due to a decrease in disturbance by peak
flows. The results of this study suggest that these morphologic adjustments have, over
time, enabled transport capacity to be reestablished. Despite reduced peak flows,
smaller channels enable greater velocities for sediment transport. Therefore, after the
adjustment period following impoundment, Yegua Creek has apparently established a
new equilibrium in which current channel dimensions are maintained by the sediment
transport capacity.

103
The overall objective of this study was to improve the theory and understanding
of the impact of dams on sediment dynamics. Because river sediments form the physical
substrate upon which biological organisms function, enhanced understanding of
sediment dynamics within dammed rivers is important in sustaining aquatic habitats
along these streams. This study provides practical information for aiding dam
management and for potential improvements in release practices to help maintain a
healthy river system. The sediment downstream of the dam is substantially finer than
that found upstream. Suspended sediment concentrations show that sediment is being
mobilized downstream of the dam. In addition, shear stresses present are capable of
moving the available sediment. Thus, current flows have the potential to mobilize
available sediment.
These results are important considering that plans for more dams are in place
throughout Texas. If additional dams are planned for the area, a better understanding of
sediment dynamics following impoundment is important. In addition, plans for dam
removal are increasing. In order to gain a full understanding of what impacts these dams
may have, information regarding the effect current dams have on their streams is
imperative.
Limitations of Study
The results of this study are considered in the context of several limitations.
First, the selection of sample sites was constrained by access. The sites near bridge
crossings could also have been impacted by construction materials, which could have

104
affected the characteristics of sediment. Potential bias was avoided to the extent
possible by choosing cross sections at reasonable distances from the bridges, although,
this could not be completely avoided.
In addition, the samples were taken within a reasonable time frame in an effort to
keep discharges similar. The timing of sampling could not be completely controlled,
however, due to weather conditions and stream accessibility. In addition, stream access
was limited to only those sites with public access, with the exception of one landowner
(Landolt, Fig. 18).
Detailed suspended sediment samples at set intervals over a long period of time
(like those supplied at various USGS gaging stations) could have aided in this study.
However, because suspended sediment samples were not gathered at gaging station
08110000 (Fig. 5), this information was not available. Furthermore, stage and discharge
downstream of the dam were not measured by the USGS after 1991. Additional stage
and discharge measurements could have given insight into the current flow regime of
Yegua Creek.
Transport calculations relied on accurate assessment of Shield’s parameter (Eq.
9), which could be over or underestimated based on imbrication and cohesion. In other
words, transport calculations determine the capacity for mobilization and not the actual
transport taking place under those conditions and sediment sizes. Furthermore, data
regarding current stage heights was not available past 1991. This is significant because
sediments were sampled in 2007 and could vary from those found at the time stage
height was measured.

105
Finally, an attempt to use aerial photographs to quantitatively determine the
presence and size of depositional features was only partly successful due to the
inadequate resolution of the 1958 and 1988 photographs and any differences in stage
height at the time the aerial photographs were taken. In addition, only photos near the
Brazos River, and not the area surrounding Somerville dam were available for the 1958
series.
.
Suggestions for Future Research
Future research along Yegua Creek could focus on several issues. Information
regarding the influence of tributaries downstream of dams is limited and should be
studied further. For example, downstream of Somerville Dam, do tributaries provide a
significant amount of sediment to Yegua Creek? What is the difference in sediment
characteristics upstream and downstream of tributary confluences? Is sediment supply
from tributaries entrained at Yegua Creek’s reduced peak flows?
Furthermore, changes in sediment supply and suspended sediment concentration
on the Brazos River directly downstream of Yegua Creek could be examined to ascertain
potential impacts of Somerville Dam on the Brazos River, and ultimately the Texas
coastline. Also, continued monitoring of suspended sediment concentration is necessary
to develop a sediment rating curve and determine sediment transport at a range of
discharges.
In order to maintain a healthy river system, further investigation of the impact of
the effect of riparian vegetation communities on sediment imbrication and entrainment

106
must be examined. With this information, a flow regime that would mimic a pre-dam
pattern could be developed. This pattern would limit vegetation encroachment, allowing
sediment movement similar to pre dam conditions. To accomplish this, measurement
and calculation of imbrication must be carried out. Developing and implementing a
pattern similar to the pre-dam flow regime would help maintain a healthy river system
and counter the effects of Somerville Dam.
In addition, a sediment budget should be computed to determine the specific
effects of Somerville Dam on sediment supply and transport throughout Yegua Creek
drainage basin. Similar to Phillips et al. (2004) study on the Trinity River, a sediment
budget could clearly determine whether decoupling is taking place. This sediment
budget could determine areas of significant alluvial storage and further determine the
influence of Somerville Dam on sediment transport to the Brazos River.
Future research must be conducted on the overall impact of dams in the region.
For example, what impact has the impoundment of streams providing sediment to the
Texas coastline had on sediment availability? With the possibility of the closure of
dams in the near future, in addition to the possibility of new impoundments, the effects
of dams in the area must be examined. This can help develop practices that manage
impoundments and mimic current conditions so healthy river systems are maintained.
Most importantly, further insight must be gained on the interrelationships of the
hydrological, morphological, sedimentological and ecological effects of dams.
Organism’s habitats along the stream are highly dependent on the hydrological regime,
morphological and sedimentological characteristics of a stream. Changes in any of these

107
components will affect the type of organisms that inhabit the stream. Significant
changes can therefore affect sensitive species that may not have the ability to survive
elsewhere. Therefore, careful consideration and evaluation of these impacts is
important.. Only then will we know precisely the additive impact and feedbacks
impoundments have had on our environment.
Conclusion
In conclusion, the effects of dams on their streams can vary widely. Somerville
Dam has had a significant impact on the hydrological, morphological, and vegetation
characteristics of Yegua Creek. Accordingly, the sedimentological effects of Somerville
Dam are significant. Results from this study add to the growing knowledge of the
effects of stream impoundment and serve as a link to future research conducted along
Yegua Creek and other streams impacted by dams. These studies will add further
knowledge to the effects of dams. They can also help to develop sustainable practices to
maintain streams, particularly to the Texas coast.

108
REFERENCES
Allred, T.M. and Schmidt, J.C., 1999. Channel narrowing by vertical accretion along the
Green River near Green River, Utah. Geological Society of America Bulletin 111, 1757-1772.
Alvarez, E.C., Plocheck, R., Shumann, S. and Palmer, A. (Eds.), 2004. Texas Almanac.
Dallas Morning News: distributed by Texas A&M University Press Consortium Dallas, Texas.
Andrews, E.D., 1986. Downstream effect of Flaming Gorge Reservoir on the Green
River, Colorado and Utah. Geological Society of America Bulletin 97, 1012-1023.
ASTM, 2006. American Society for Testing and Materials: Standard test methods for
determining sediment concentration in water Samples D 3977-97 Test Method B-Filtration, 11.02. ASTM International, West Conshohocken, PA.
Bonacci, O., Tadic, Z. and Trninic, D., 1992. Effects of dams and reservoirs on the
hydrological characteristics of the Lower Drava River. Regulated Rivers: Research and Management 7, 349-357.
Bradley, C. and Smith, D.G., 1984. Meandering channel response to altered flow regime:
Milk River, Alberta and Montana. Water Resources Research 20, 1913-1920. Brandt, S.A., 2000. Classification of geomorphological effects downstream of dams.
Catena 40, 375-401. Brown, C.B., 1943. Discussion of Sedimentation in Reservoirs. Proceedings of the
American Society of Civil Engineers 69, 1493-1500. Brune, G.M. and Allen, R.E., 1941. A consideration of factors influencing reservoir
sedimentation in the Ohio Valley region. Transactions, American Geophysical Union, 34(407-418).
Brune, G.M., 1953. Trap efficiency of reservoirs. Transactions-American Geophysical
Union 34, 407-418. Burgess, J.L. and Lyman, W.S., 1906. Soil suvey of Lee County, Texas. United States
Department of Agriculture Soil Conservation Service, Washington D.C. Carling, P.A., 1988. Channel change and sediment transport in regulated U.K. Rivers.
Regulated Rivers: Resource Management 2, 369-387.

109
Chervenka, W.G., Castille, J.J., Jurena, M.R. and Stewart, S.C.S., 1981. Soil survey of
Washington County, Texas. United States Department of Agriculture Soil Conservation Service, Washington, D.C.
Chien, N., 1985. Changes in river regime after the construction of upstream reservoirs.
Earth Surface Processes and Landforms 10, 143-159. Chin, A. and Bowman, J.A., 2005. Changes in Flow Regime Following Dam
Construction, Yegua Creek, South-Central Texas. Water for Texas. Texas A&M University Press, College Station, pp. 166-177.
Chin, A., Harris, D.L., Trice, T.H. and Given, J.L., 2002. Adjustment of stream channel
capacity following dam closure, Yegua Creek, Texas. Journal of the American Water Resources Association 38(6), 1521-1531.
Chin, A., Laurencio, L.R. and Martinez, A.E., 2008. The hydrologic importance of
small- and medium- sized dams: examples from Texas. The Professional Geographer, In Press.
Correll, D.S. and Johnston, M.C., 1979. Manual of the vascular plants of Texas.
University of Texas at Dallas, Richardson. Dean, D.J., 2006. Texas State Plane Coordinate System, NR502 -- Geodesy,
Cartography and Map Reading, Colorado State University, Fort Collins, Colorado.
Downs, P.W., Gregory, K.J., 2004. River Channel Management: Towards Sustainable
Catchment Hydrosystems. Arnold, London. Edwards, T.K. and Glysson, G.D., 2005. Field methods for measurement of fluvial
sediment. Techniques of water-resources investigations, Book 3, Chapter C2, 2005. United States Geological Survey, Washington D.C.
Elliot, J.G. and Parker, R.S., 1997. Altered streamflow and sediment entrainment in the
Gunnison Gorge. Journal of American Water Resources Association 33, 1041-1054.
ESRI. Environmental Systems Research Institute, Inc. ArcMap, 2005. Version 9.1.
Redlands, California. Fergus, T., 1997. Geomorphological response of a river regulated for hydropower:
River Fortun, Norway. Regulated Rivers: Research and Management 13, 449-461.

110
Folk, R.L., 1980. Petrology of sedimentary rocks. Hemphill Publishing Company, Austin, Texas.
Friedman, J.M., Osterkamp, W.R., Scott, M.L. and Auble, G.T., 1998. Downstream
effects of dams on channel geometry and bottomland vegetation: regional patterns in the Great Plains. Wetlands 18, 619-633.
Gordon, E. and Meentemeyer, R.K., 2006. Effects of dam operation and land use on
stream channel morphology and riparian vegetation. Geomorphology 82, 412-429.
Gordon, N.D., McMahon, T.A., Finlayson, B.L., Gipel, C.J. and Nathan, R.J., 2004.
Stream Hydrology: An Introduction for Ecologists. Wiley, West Sussex, England.
Graf, W.L., 1980. The effect of dam closure on downstream rapids. Water Resource
Research 16, 129-363. Graf, W.L., 1988. Fluvial Processes in Dryland rivers. Springer-Verlag, New York. Graf, W.L., 1999. Dam Nation: A geographic census of american dams and their large
scale hydrologic impacts. Water Resources Research 35, 1305-1311. Graf, W.L., 2001. Damage Control: Restoring the physical integrity of America's rivers.
Annals of the Association of American Geographers 97, 1-27. Graf, W.L., 2005. Geomorphology and American dams: The scientific, social, and
economic context. Geomorphology 71, 3-26. Graf, W.L., 2006. Downstream hydrologic and geomorphic effects of large dams on
American rivers. Geomorphology 79, 336-360. Grams, P.E. and Schmidt, J.C., 2005. Equilibrium or indeterminate? Where sediment
budgets fail: Sediment mass balance and adjustment of channel form, Green River downstream from Flaming Gorge Dam, Utah and Colorado. Geomorphology 7, 156-181.
Greenwood, M.T., Bickerton, M.A., Gurnell, A.M. and Petts, G., 1999. Channel changes
and invertebrate faunas Below Nant-Y-Moch Dam, River Rheidol, Wales, UK: 35 Years On. Regulated Rivers: Research and Management 15, 99-112.
Hadley, R.F. and Emmett, W.W., 1998. Channel changes downstream from a dam.
Journal of the American Water Resources Association 34, 629-637.

111
Hammad, H.Y., 1972. River bed degradation after closure of dams. Journal of Hydraulics Division, HY4(8814), 591-607.
Heinemann, G.G., 1984. Reservoir trap efficiency. In: R.F. Hadley and D.E. Walling
(Editors), Erosion and Sediment Yield: Some Methods of Measurement and Modelling GeoBooks, Beltsville, MD.
Higgs, G. and Petts, G., 1988. Hydrological changes and river regulation in the U.K.
Regulated Rivers: Resource Management 2, 349-368. Ibanez, C., Prat, N. and A., C., 1996. Changes in the hydrology and sediment transport
produced by large dams on the lower Ebro River and its estuary. Regulated Rivers: Research and Management 12, 51-62.
Jennings, S., 1999. Implications of stream impoundment on Yegua Creek, Texas.
Environmental Systems 27, 299-316. Kashef, A.I., 1981. Technical and ecological impacts of the High Aswan Dam. Journal
of Hydrology 53, 73-84. Kellerhals, R., 1982. Effect of river regulation on channel stability. In: R.D. Hey, J.C.
Bathurst and C.R. Thorne (Eds.), Gravel-bed Rivers. John Wiley & Sons, New York.
Kilmer, V.H. and Alexander, L.Z., 1949. Methods for making mechanical analyses of
soil. Soil Science 68, 15-24. Knighton, A.D., 1987. River channel adjustment-the downstream dimension. In: K.
Richards (Ed.), River Channels-Environment and Process. Basil Blackwell, Oxford.
Knighton, A.D., 1988. The impact of the Parangana Dam on the River Mersey,
Tasmania. Gemorphology 1, 221-237. Kondolf, G.M., 1997. Hungry water: effects of dams and gravel mining on river
channels. Environmental Management 21, 533-551. Kondolf, G.M. and Piegay, H., 2003. Tools in Fluvial Geomorphology. Wiley, West
Sussex, England. Larkin, T.J. and Bomar, G.W., 1983. Climatic atlas of Texas. Texas Department of
Water Resources, Austin.

112
Ligon, F.K., Dietrich, W.E. and Trush, W.J., 1995. Downstream ecological effects of dams: A geomorphic perspective. Bioscience 45, 183-192.
Magilligan, F.J. and Nislow, K.H., 2001. Long term changes in regional hydrologic
regime following impoundment in a humid climate watershed. Journal of American Water Resources Association 37, 1551-1569.
Magilligan, F.J. and Nislow, K.H., 2005. Changes in hydrologic regime by dams.
Gemorphology 71, 61-78. Magilligan, F.J., Nislow, K.H. and Graber, F.J., 2003. A scale independent assessment
of discharge reduction and riparian disconnectivity following flow regulation by dams. Geology 31, 569-572.
Maigini, J.K. and Marsh, S.E., 2002. Quantifying hydrologic impacts following dam
construction along the Tana River, Kenya. Journal of Arid Environments 50, 53-79.
Marston, R.A., Mills, J.D., Wrazien, D.R., Bassett, B. and Splinter, D.K., 2005. Effects
of Jackson Lake Dam on the Snake River and its floodplain, Grand Teton National Park, Wyoming, USA. Geomorphology 71, 79-98.
Merritt, D.M. and Cooper, D.J., 2000. Riparian vegetation and channel change in
response to river regulation: A comparative study of regulated and unregulated streams in the Green River Basin, USA. Regulated Rivers: Research and Management 16, 543-564.
Petts, G., 1986. Water quality characteristics of regulated rivers. Progress in Physical
Geography 10, 492-516. Petts, G.E. and Gurnell, A.M., 2005. Dams and geomorphology: Research progress and
future directions. Geomorphology 71, 27-47. Petts, G.E. and Pratts, J.D., 1983. Channel changes following reservoir construction on a
lowland English river. Catena 10, 77-85. Petts, G.E. and Thoms, M.C., 1986. Channel aggradation below Chew Valley Lake,
Somerset, England. Catena 13, 305-320. Phillips, J.D., 2003. Toledo Bend Reservoir and geomorphic response in the lower
Sabine River. River Research and Applications 19, 137-159. Phillips, J.D., Slattery, M.C. and Musselman, Z.A., 2004. Dam-to-delta sediment inputs
and storage in the lower Trinity River, Texas. Geomorphology 62, 17-34.

113
Phillips, J.D., Slattery, M.C. and Musselman, Z.A., 2005. Channel adjustments of the
lower Trinity River, Texas, downstream of Livingston Dam. Earth Surface Processes and Landforms 30, 1419-1439.
Pohl, M., 2004. Channel bed mobility downstream from the Elwha Dams, Washington.
The Professional Geographer 56, 422-431. Pozo, J., Orive, E., Fraile, H. and Basaguren, A., 1997. Effects of the Cernadilla-
Valparaiso reservoir system on the River Tera. Regulated Rivers: Research and Management 13, 57-73.
Proctor, C.V., Brown, T.E., McGowen, J.H. and Waechter, N.B., 1974. Geologic Atlas
of Texas, Austin Sheet. University of Texas, Bureau of Economic Geology, Austin.
Rahn, P.H., 1977. Erosion below main stem dams on the Missouri River: Bulletin of the
Association of Engineering Geologists 14, 157-181. Reid, L.M. and Dunne, T., 2003. Tools in Fluvial Geomorphology. Wiley, West Sussex,
England. Richards, K., 1982. Rivers: Form and Process in Alluvial Channels. Methuen & Co.,
New York. Schaffer, R.C., 1974. Sociological analysis of dam impact: A study of twenty-two large
dams in Texas. Reservoir impact study, final report. to the Office of Water Resources Research, U.S. Dept. Interior. Texas A&M University, College Station.
Schumm, S.A., 1973. Geomorphic thresholds and complex response of drainage
systems. In: Morisawa, M. (Ed.), Fluvial Geomorphology. New York State Univ. Pub. Geomorph, Binghamton, pp. 299-310.
Shields, A. 1936. Anwendung der Ahnlichkeitsmechanik und der Turbulenzforschung
auf die Geschiebebewegung. Mitteilung der preussischen Versuchsanstalt fur Wasserbau und Schiffbau. 26, Berlin.
Shields, F.D.J., Simon, A. and Steffen, L.J., 2000. Reservoir effects on downstream river
channel migration, Environmental Conservation 27, 54-66. Singer, M.B., 2007. The influence of major dams on hydrology through the drainage
network of the Sacramento River Basin, California. River Resource Applications, 23: 55-72.

114
Smith, S.V., Renwick, W.H., Bartley, J.D. and Buddemeier, R.W., 2002. Distribution and significance of small, artificial water bodies across the United States landscape. The Science of the Total Environment 299, 21-36.
Steele, J.G. and Bradfield, R., 1934. The significance of size distribution in the clay
fraction. Report of the 14th Annual Meeting, Am. Soil Science. Assn., Bull., 15: 88-93.
Stover, S.C. and Montgomery, D.R., 2001. Channel change and flooding, Skokomish
River, Washington. Journal of Hydrology, 243: 272-286. Surian, N., 1999. Channel changes due to river regulation: The case of the Piave River,
Italy. Earth Surface Processes and Landforms, 24: 1135-1151. TWDB, 2005. Reservoir volumetric surveys. Texas Water Development Board, Austin,
Texas. TWDB, 2006. Water for Texas: Highlights of the 2007 state water plan. In: Texas
Water Development Board (Ed.). Texas Water Development Board, Austin, Texas.
USACE, 2007a. Pertinent data on Ft Worth District lakes. http://www.swf-
wc.usace.army.mil/pertdata/somt2.pdf, accessed 10/07/07. USACE, 2007b. Query hydrologic data on Ft Worth District lakes. http://www.swf-
wc.usace.army.mil/cgi-bin/rcshtml.pl?page=Hydrologic, accessed 10/04/07 USGS, 2007. USGS Surface-Water Data for Texas. http://waterdata.usgs.gov/
tx/nwis/sw, accessed 07/11/07. Verstraeten, G. and Poesen, J., 2000. Estimating trap efficiency of small reservoirs and
ponds: methods and implications for the assessment of sediment yield. Progress in Physical Geography 24, 219-251.
Vorosmarty, C.J., Meybeck, M., Fekete, B. and Sharma, K. (Editors), 1997. The
potential impact of neo-Castorization on sediment transport by the global network of rivers. Human Impact on Erosion and Sedimentation. Proceedings of the Rabat Symposium, Wallingford, England.
Vorosmarty, C.J. Maybeck. M., Fekete, B., Sharma, K., Green, P., Syvitski, J. P. M.,
2003. Anthropogenic sediment retention: major global impact from registered river impoundments. Global and Planetary Change, 39: 169-190.

115
Ward, J.R. and Harr, C.A., 1990. Methods for collection and processing of surface-water and bed-material samples for physical and chemical analyses. U.S. Geological Survey Open-File Report 90-140, pp. 71.
Welborn, C.T., 1967. Comparative results of sediment sampling with the Texas sampler
and the depth-integrating samplers and specific weight of fluvial sediment deposits in Texas. Texas Water Development Board, Austin.
Wellmeyer, J.L., Slattery, M.C. and Phillips, J.D., 2005. Quantifying downstream
impacts of impoundment on flow regime and channel planform, lower Trinity River, Texas. Geomorphology, 69: 1-13.
Wilcock, P.R. and McArdell, B.W., 1993. Surface-based fractional transport rates:
mobilization thresholds and partial transport of a sand-gravel sediment. Water Resources Research 29, 1297-1312.
Williams, G.P., 1978. The case of the shrinking channels-the North Platte and Platte
Rivers in Nebraska. U.S. Geological Survey Circular, 781. Williams, G.P. and Wolman, M.G., 1984. Downstream effects of dams on alluvial rivers.
U.S. Geological Survey Professional Paper 1286, 1-61. Williams, H.F.L., 1991. Character and growth of deltaic deposits in Lewisville Lake,
Texas. Texas Journal of Science 43, 377-389. Wolman, M.G., 1967. Two problems involving river channel changes and background
observations. Quantitative Geography 11, 67-017. Yang, D., Ye, B. and Kane, D.L., 2004. Streamflow changes over Siberian Yenisei River
Basin. Journal of Hydrology 296, 59-80.

Table A1 continued
116
Cross Section Cross Section
APPENDIX A
Table A1 Sediment movement downstream of Somerville Dam. Check marks indicate sediment capable of movement for median (d50) and coarse (d84) sediment size. Movement is indicated by the shear stresses of the flows exceeded the critical shear stresses for movement.
Median Sediment Sizes (d50) Coarse Sediment Sizes (d84)
Date
Gage Height
Critical Shear Stress Y36US Y36DS LA LB Y50US Y50DS Y36US Y36DS LA LB Y50US Y50DS
m N/m2 1/4/1967 0.689 0.675 √ √ √ √ √ √ √ √ √ √ √ √ 1/5/1967 0.634 0.621 √ √ √ √ √ √ √ √ √ √ √ √ 1/6/1967 0.613 0.600 √ √ √ √ √ √ √ √ √ √ √ √ 2/8/1967 0.393 0.385 √ √ √ √ √ √ √ √ √ √ √ √
3/16/1967 0.259 0.254 √ √ √ √ √ √ √ √ √ √ √ 4/17/1967 0.335 0.329 √ √ √ √ √ √ √ √ √ √ √ 5/24/1967 0.347 0.341 √ √ √ √ √ √ √ √ √ √ √ 1/26/1968 0.393 0.385 √ √ √ √ √ √ √ √ √ √ √ √ 2/12/1968 0.491 0.481 √ √ √ √ √ √ √ √ √ √ √ √ 2/20/1968 0.518 0.508 √ √ √ √ √ √ √ √ √ √ √ √ 4/4/1968 0.588 0.576 √ √ √ √ √ √ √ √ √ √ √ √
5/13/1968 2.685 2.632 √ √ √ √ √ √ √ √ √ √ √ √ 5/17/1968 1.890 1.852 √ √ √ √ √ √ √ √ √ √ √ √ 5/31/1968 2.079 2.037 √ √ √ √ √ √ √ √ √ √ √ √ 6/18/1968 0.454 0.445 √ √ √ √ √ √ √ √ √ √ √ √ 7/5/1968 2.405 2.357 √ √ √ √ √ √ √ √ √ √ √ √
7/11/1968 2.466 2.417 √ √ √ √ √ √ √ √ √ √ √ √ 8/14/1968 1.676 1.643 √ √ √ √ √ √ √ √ √ √ √ √ 8/15/1968 1.250 1.225 √ √ √ √ √ √ √ √ √ √ √ √ 8/16/1968 0.969 0.950 √ √ √ √ √ √ √ √ √ √ √ √ 8/17/1968 0.725 0.711 √ √ √ √ √ √ √ √ √ √ √ √ 9/23/1968 2.057 2.016 √ √ √ √ √ √ √ √ √ √ √ √

Table A1 continued
117
Median Sediment Sizes Coarse Sediment Sizes
Date
Gage Height
Critical Shear Stress Y36US Y36DS LA LB Y50US Y50DS Y36US Y36DS LA LB Y50US Y50DS
m N/m2 11/21/1968 0.774 0.759 √ √ √ √ √ √ √ √ √ √ √ √ 12/11/1968 2.112 2.070 √ √ √ √ √ √ √ √ √ √ √ √ 1/8/1969 0.567 0.556 √ √ √ √ √ √ √ √ √ √ √ √
1/29/1969 0.488 0.478 √ √ √ √ √ √ √ √ √ √ √ √ 2/18/1969 2.018 1.977 √ √ √ √ √ √ √ √ √ √ √ √ 4/1/1969 2.259 2.213 √ √ √ √ √ √ √ √ √ √ √ √
5/12/1969 2.393 2.345 √ √ √ √ √ √ √ √ √ √ √ √ 6/14/1969 0.530 0.520 √ √ √ √ √ √ √ √ √ √ √ √ 7/30/1969 0.512 0.502 √ √ √ √ √ √ √ √ √ √ √ √ 10/6/1969 0.655 0.642 √ √ √ √ √ √ √ √ √ √ √ √ 11/10/1969 0.759 0.744 √ √ √ √ √ √ √ √ √ √ √ √ 12/15/1969 0.762 0.747 √ √ √ √ √ √ √ √ √ √ √ √ 1/21/1970 0.738 0.723 √ √ √ √ √ √ √ √ √ √ √ √ 3/3/1970 1.835 1.798 √ √ √ √ √ √ √ √ √ √ √ √ 4/2/1970 2.118 2.076 √ √ √ √ √ √ √ √ √ √ √ √ 5/7/1970 0.561 0.550 √ √ √ √ √ √ √ √ √ √ √ √
6/10/1970 2.265 2.219 √ √ √ √ √ √ √ √ √ √ √ √ 7/13/1970 0.637 0.624 √ √ √ √ √ √ √ √ √ √ √ √ 8/24/1970 0.518 0.508 √ √ √ √ √ √ √ √ √ √ √ √ 9/24/1970 0.616 0.603 √ √ √ √ √ √ √ √ √ √ √ √ 11/2/1970 0.616 0.603 √ √ √ √ √ √ √ √ √ √ √ √ 11/30/1970 0.698 0.684 √ √ √ √ √ √ √ √ √ √ √ √ 1/12/1971 0.671 0.657 √ √ √ √ √ √ √ √ √ √ √ √ 2/16/1971 0.722 0.708 √ √ √ √ √ √ √ √ √ √ √ √ 3/10/1971 0.582 0.571 √ √ √ √ √ √ √ √ √ √ √ √ 4/19/1971 0.418 0.409 √ √ √ √ √ √ √ √ √ √ √ √ 8/3/1971 0.719 0.705 √ √ √ √ √ √ √ √ √ √ √ √

Table A1 continued
118
Median Sediment Sizes Coarse Sediment Sizes
Date
Gage Height
Critical Shear Stress Y36US Y36DS LA LB Y50US Y50DS Y36US Y36DS LA LB Y50US Y50DS
m N/m2 12/1/1971 0.555 0.544 √ √ √ √ √ √ √ √ √ √ √ √ 1/10/1972 0.640 0.627 √ √ √ √ √ √ √ √ √ √ √ √ 2/9/1972 0.625 0.612 √ √ √ √ √ √ √ √ √ √ √ √
3/15/1972 0.561 0.550 √ √ √ √ √ √ √ √ √ √ √ √ 4/7/1972 0.530 0.520 √ √ √ √ √ √ √ √ √ √ √ √
4/19/1972 0.497 0.487 √ √ √ √ √ √ √ √ √ √ √ √ 5/18/1972 0.567 0.556 √ √ √ √ √ √ √ √ √ √ √ √ 6/26/1972 0.991 0.971 √ √ √ √ √ √ √ √ √ √ √ √ 7/31/1972 0.628 0.615 √ √ √ √ √ √ √ √ √ √ √ √ 9/8/1972 0.646 0.633 √ √ √ √ √ √ √ √ √ √ √ √
10/4/1972 0.765 0.750 √ √ √ √ √ √ √ √ √ √ √ √ 11/13/1972 0.808 0.792 √ √ √ √ √ √ √ √ √ √ √ √ 12/18/1972 0.771 0.756 √ √ √ √ √ √ √ √ √ √ √ √ 1/26/1973 0.701 0.687 √ √ √ √ √ √ √ √ √ √ √ √ 2/20/1973 2.012 1.971 √ √ √ √ √ √ √ √ √ √ √ √ 3/2/1973 0.622 0.609 √ √ √ √ √ √ √ √ √ √ √ √
3/29/1973 2.362 2.315 √ √ √ √ √ √ √ √ √ √ √ √ 3/30/1973 2.368 2.321 √ √ √ √ √ √ √ √ √ √ √ √ 4/9/1973 1.881 1.843 √ √ √ √ √ √ √ √ √ √ √ √ 5/7/1973 0.616 0.603 √ √ √ √ √ √ √ √ √ √ √ √
6/14/1973 1.049 1.028 √ √ √ √ √ √ √ √ √ √ √ √ 7/17/1973 1.567 1.535 √ √ √ √ √ √ √ √ √ √ √ √ 8/22/1973 0.280 0.275 √ √ √ √ √ √ √ √ √ √ √ 10/3/1973 0.305 0.299 √ √ √ √ √ √ √ √ √ √ √ 10/24/1973 2.554 2.503 √ √ √ √ √ √ √ √ √ √ √ √ 10/26/1973 2.847 2.790 √ √ √ √ √ √ √ √ √ √ √ √ 11/5/1973 2.768 2.712 √ √ √ √ √ √ √ √ √ √ √ √

Table A1 continued
119
Median Sediment Sizes Coarse Sediment Sizes
Date
Gage Height
Critical Shear Stress Y36US Y36DS LA LB Y50US Y50DS Y36US Y36DS LA LB Y50US Y50DS
m N/m2 11/6/1973 2.627 2.575 √ √ √ √ √ √ √ √ √ √ √ √ 11/7/1973 2.481 2.431 √ √ √ √ √ √ √ √ √ √ √ √ 11/8/1973 2.280 2.234 √ √ √ √ √ √ √ √ √ √ √ √ 11/9/1973 1.935 1.897 √ √ √ √ √ √ √ √ √ √ √ √ 12/4/1973 1.862 1.825 √ √ √ √ √ √ √ √ √ √ √ √ 1/15/1974 0.402 0.394 √ √ √ √ √ √ √ √ √ √ √ √ 2/1/1974 2.621 2.569 √ √ √ √ √ √ √ √ √ √ √ √
2/27/1974 0.320 0.314 √ √ √ √ √ √ √ √ √ √ √ 4/9/1974 0.506 0.496 √ √ √ √ √ √ √ √ √ √ √ √
5/21/1974 0.421 0.412 √ √ √ √ √ √ √ √ √ √ √ √ 7/2/1974 0.326 0.320 √ √ √ √ √ √ √ √ √ √ √
8/13/1974 0.442 0.433 √ √ √ √ √ √ √ √ √ √ √ √ 9/24/1974 2.792 2.736 √ √ √ √ √ √ √ √ √ √ √ √ 11/5/1974 0.393 0.385 √ √ √ √ √ √ √ √ √ √ √ √ 11/14/1974 2.658 2.605 √ √ √ √ √ √ √ √ √ √ √ √ 12/17/1974 2.661 2.608 √ √ √ √ √ √ √ √ √ √ √ √ 1/28/1975 0.363 0.355 √ √ √ √ √ √ √ √ √ √ √ 3/11/1975 2.097 2.055 √ √ √ √ √ √ √ √ √ √ √ √ 4/22/1975 0.439 0.430 √ √ √ √ √ √ √ √ √ √ √ √ 6/2/1975 2.563 2.512 √ √ √ √ √ √ √ √ √ √ √ √ 6/5/1975 2.707 2.652 √ √ √ √ √ √ √ √ √ √ √ √
7/16/1975 2.103 2.061 √ √ √ √ √ √ √ √ √ √ √ √ 8/26/1975 0.262 0.257 √ √ √ √ √ √ √ √ √ √ √ 10/8/1975 0.430 0.421 √ √ √ √ √ √ √ √ √ √ √ √ 11/17/1975 0.430 0.421 √ √ √ √ √ √ √ √ √ √ √ √ 1/5/1976 0.439 0.430 √ √ √ √ √ √ √ √ √ √ √ √
2/10/1976 0.387 0.379 √ √ √ √ √ √ √ √ √ √ √
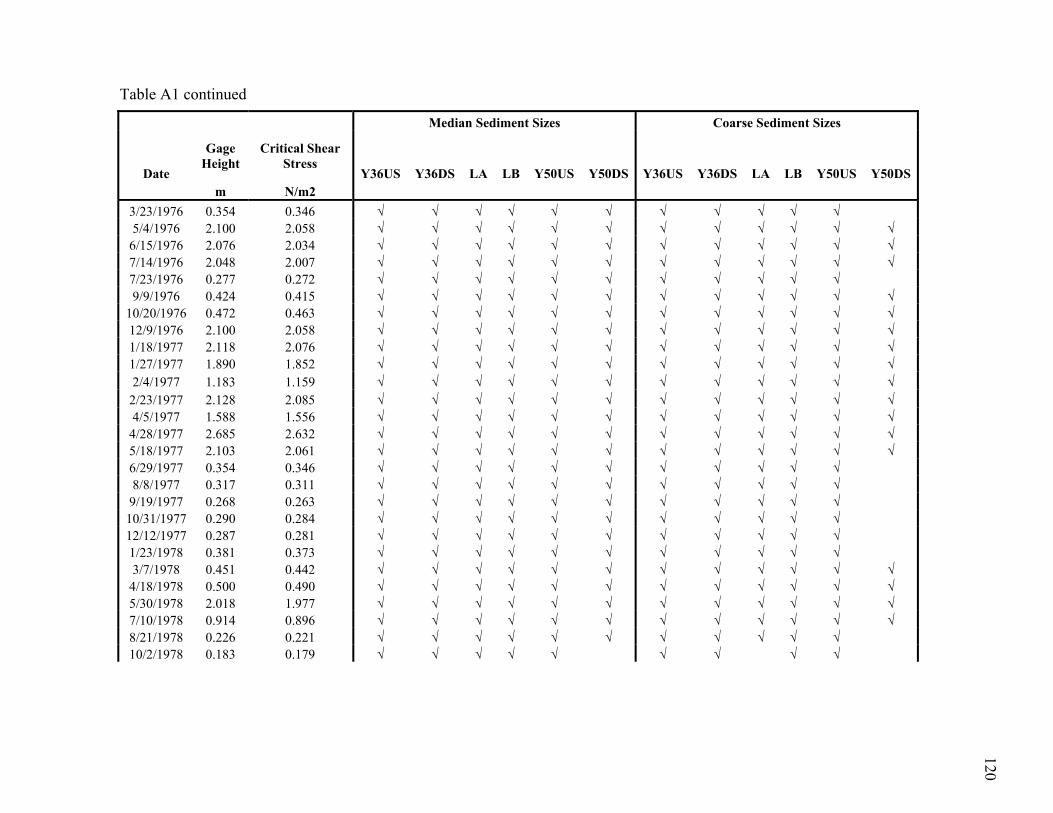
Table A1 continued
120
Median Sediment Sizes Coarse Sediment Sizes
Date
Gage Height
Critical Shear Stress
Y36US Y36DS LA LB Y50US Y50DS Y36US Y36DS LA LB Y50US Y50DS m N/m2
3/23/1976 0.354 0.346 √ √ √ √ √ √ √ √ √ √ √ 5/4/1976 2.100 2.058 √ √ √ √ √ √ √ √ √ √ √ √
6/15/1976 2.076 2.034 √ √ √ √ √ √ √ √ √ √ √ √ 7/14/1976 2.048 2.007 √ √ √ √ √ √ √ √ √ √ √ √ 7/23/1976 0.277 0.272 √ √ √ √ √ √ √ √ √ √ √ 9/9/1976 0.424 0.415 √ √ √ √ √ √ √ √ √ √ √ √
10/20/1976 0.472 0.463 √ √ √ √ √ √ √ √ √ √ √ √ 12/9/1976 2.100 2.058 √ √ √ √ √ √ √ √ √ √ √ √ 1/18/1977 2.118 2.076 √ √ √ √ √ √ √ √ √ √ √ √ 1/27/1977 1.890 1.852 √ √ √ √ √ √ √ √ √ √ √ √ 2/4/1977 1.183 1.159 √ √ √ √ √ √ √ √ √ √ √ √
2/23/1977 2.128 2.085 √ √ √ √ √ √ √ √ √ √ √ √ 4/5/1977 1.588 1.556 √ √ √ √ √ √ √ √ √ √ √ √
4/28/1977 2.685 2.632 √ √ √ √ √ √ √ √ √ √ √ √ 5/18/1977 2.103 2.061 √ √ √ √ √ √ √ √ √ √ √ √ 6/29/1977 0.354 0.346 √ √ √ √ √ √ √ √ √ √ √ 8/8/1977 0.317 0.311 √ √ √ √ √ √ √ √ √ √ √
9/19/1977 0.268 0.263 √ √ √ √ √ √ √ √ √ √ √ 10/31/1977 0.290 0.284 √ √ √ √ √ √ √ √ √ √ √ 12/12/1977 0.287 0.281 √ √ √ √ √ √ √ √ √ √ √ 1/23/1978 0.381 0.373 √ √ √ √ √ √ √ √ √ √ √ 3/7/1978 0.451 0.442 √ √ √ √ √ √ √ √ √ √ √ √
4/18/1978 0.500 0.490 √ √ √ √ √ √ √ √ √ √ √ √ 5/30/1978 2.018 1.977 √ √ √ √ √ √ √ √ √ √ √ √ 7/10/1978 0.914 0.896 √ √ √ √ √ √ √ √ √ √ √ √ 8/21/1978 0.226 0.221 √ √ √ √ √ √ √ √ √ √ √ 10/2/1978 0.183 0.179 √ √ √ √ √ √ √ √ √

Table A1 continued
121
Median Sediment Sizes Coarse Sediment Sizes
Date
Gage Height
Critical Shear Stress
Y36US Y36DS LA LB Y50US Y50DS Y36US Y36DS LA LB Y50US Y50DS m N/m2
11/15/1978 0.183 0.179 √ √ √ √ √ √ √ √ √ 1/4/1979 0.271 0.266 √ √ √ √ √ √ √ √ √ √ √ 2/1/1979 1.030 1.010 √ √ √ √ √ √ √ √ √ √ √ √
3/20/1979 0.357 0.349 √ √ √ √ √ √ √ √ √ √ √ 4/30/1979 2.109 2.067 √ √ √ √ √ √ √ √ √ √ √ √ 6/12/1979 2.505 2.455 √ √ √ √ √ √ √ √ √ √ √ √ 7/26/1979 2.042 2.001 √ √ √ √ √ √ √ √ √ √ √ √ 9/4/1979 0.402 0.394 √ √ √ √ √ √ √ √ √ √ √ √
10/16/1979 0.418 0.409 √ √ √ √ √ √ √ √ √ √ √ √ 11/27/1979 0.427 0.418 √ √ √ √ √ √ √ √ √ √ √ √ 1/15/1980 0.408 0.400 √ √ √ √ √ √ √ √ √ √ √ √ 2/22/1980 0.570 0.559 √ √ √ √ √ √ √ √ √ √ √ √ 4/8/1980 2.134 2.091 √ √ √ √ √ √ √ √ √ √ √ √
5/19/1980 1.747 1.712 √ √ √ √ √ √ √ √ √ √ √ √ 6/23/1980 1.859 1.822 √ √ √ √ √ √ √ √ √ √ √ √ 8/6/1980 0.732 0.717 √ √ √ √ √ √ √ √ √ √ √ √
9/18/1980 0.311 0.305 √ √ √ √ √ √ √ √ √ √ √ 10/27/1980 0.277 0.272 √ √ √ √ √ √ √ √ √ √ √ 12/11/1980 0.293 0.287 √ √ √ √ √ √ √ √ √ √ √ 1/20/1981 0.457 0.448 √ √ √ √ √ √ √ √ √ √ √ √ 3/3/1981 0.293 0.287 √ √ √ √ √ √ √ √ √ √ √
4/22/1981 1.588 1.556 √ √ √ √ √ √ √ √ √ √ √ √ 5/21/1981 0.128 0.125 √ √ √ √ √ √ √ √ 7/9/1981 1.250 1.225 √ √ √ √ √ √ √ √ √ √ √ √
8/13/1981 0.110 0.108 √ √ √ √ √ √ √ 9/23/1981 0.244 0.239 √ √ √ √ √ √ √ √ √ √ √ 11/5/1981 1.984 1.945 √ √ √ √ √ √ √ √ √ √ √ √

Table A1 continued
122
Median Sediment Sizes Coarse Sediment Sizes
Date
Gage Height
Critical Shear Stress Y36US Y36DS LA LB Y50US Y50DS Y36US Y36DS LA LB Y50US Y50DS
m N/m2 12/17/1981 0.317 0.311 √ √ √ √ √ √ √ √ √ √ √ 1/28/1982 0.305 0.299 √ √ √ √ √ √ √ √ √ √ √ 3/18/1982 0.265 0.260 √ √ √ √ √ √ √ √ √ √ √ 4/23/1982 0.445 0.436 √ √ √ √ √ √ √ √ √ √ √ √ 6/7/1982 2.088 2.046 √ √ √ √ √ √ √ √ √ √ √ √ 7/7/1982 0.232 0.227 √ √ √ √ √ √ √ √ √ √ √
8/19/1982 0.216 0.212 √ √ √ √ √ √ √ √ √ √ √ 9/28/1982 0.326 0.320 √ √ √ √ √ √ √ √ √ √ √ 11/12/1982 0.411 0.403 √ √ √ √ √ √ √ √ √ √ √ √ 12/27/1982 0.241 0.236 √ √ √ √ √ √ √ √ √ √ √ 2/2/1983 1.366 1.338 √ √ √ √ √ √ √ √ √ √ √ √
3/16/1983 1.792 1.756 √ √ √ √ √ √ √ √ √ √ √ √ 4/26/1983 1.884 1.846 √ √ √ √ √ √ √ √ √ √ √ √ 7/8/1983 2.362 2.315 √ √ √ √ √ √ √ √ √ √ √ √
7/20/1983 0.427 0.418 √ √ √ √ √ √ √ √ √ √ √ √ 8/31/1983 0.296 0.290 √ √ √ √ √ √ √ √ √ √ √ 10/12/1983 0.341 0.335 √ √ √ √ √ √ √ √ √ √ √ 11/10/1983 0.351 0.344 √ √ √ √ √ √ √ √ √ √ √ 12/12/1983 0.351 0.344 √ √ √ √ √ √ √ √ √ √ √ 2/2/1984 0.314 0.308 √ √ √ √ √ √ √ √ √ √ √
3/16/1984 0.354 0.346 √ √ √ √ √ √ √ √ √ √ √ 5/1/1984 0.317 0.311 √ √ √ √ √ √ √ √ √ √ √
5/16/1984 1.875 1.837 √ √ √ √ √ √ √ √ √ √ √ √ 6/11/1984 0.265 0.260 √ √ √ √ √ √ √ √ √ √ √ 11/30/1984 0.107 0.105 √ √ √ √ √ √ √ 1/10/1985 2.094 2.052 √ √ √ √ √ √ √ √ √ √ √ √ 2/14/1985 0.195 0.191 √ √ √ √ √ √ √ √ √

Table A1 continued
123
Median Sediment Sizes Coarse Sediment Sizes
Date
Gage Height
Critical Shear Stress Y36US Y36DS LA LB Y50US Y50DS Y36US Y36DS LA LB Y50US Y50DS
m N/m2 3/28/1985 2.057 2.016 √ √ √ √ √ √ √ √ √ √ √ √ 5/10/1985 1.250 1.225 √ √ √ √ √ √ √ √ √ √ √ √ 6/18/1985 0.332 0.326 √ √ √ √ √ √ √ √ √ √ √ 8/2/1985 0.610 0.597 √ √ √ √ √ √ √ √ √ √ √ √
9/10/1985 0.442 0.433 √ √ √ √ √ √ √ √ √ √ √ √ 9/26/1985 0.104 0.102 √ √ √ √ √ √ √ 11/6/1985 0.174 0.170 √ √ √ √ √ √ √ √ √ 12/18/1985 2.134 2.091 √ √ √ √ √ √ √ √ √ √ √ √ 1/30/1986 1.439 1.410 √ √ √ √ √ √ √ √ √ √ √ √ 2/20/1986 1.923 1.885 √ √ √ √ √ √ √ √ √ √ √ √ 4/17/1986 0.332 0.326 √ √ √ √ √ √ √ √ √ √ √ 6/4/1986 0.924 0.905 √ √ √ √ √ √ √ √ √ √ √ √
7/24/1986 2.201 2.157 √ √ √ √ √ √ √ √ √ √ √ √ 9/11/1986 0.213 0.209 √ √ √ √ √ √ √ √ √ √ √ 10/24/1986 0.524 0.514 √ √ √ √ √ √ √ √ √ √ √ √ 12/9/1986 2.006 1.965 √ √ √ √ √ √ √ √ √ √ √ √ 1/27/1987 2.289 2.243 √ √ √ √ √ √ √ √ √ √ √ √ 3/17/1987 2.256 2.210 √ √ √ √ √ √ √ √ √ √ √ √ 5/5/1987 0.296 0.290 √ √ √ √ √ √ √ √ √ √ √
6/23/1987 2.387 2.339 √ √ √ √ √ √ √ √ √ √ √ √ 8/10/1987 2.073 2.031 √ √ √ √ √ √ √ √ √ √ √ √ 9/29/1987 0.335 0.329 √ √ √ √ √ √ √ √ √ √ √ 11/17/1987 0.296 0.290 √ √ √ √ √ √ √ √ √ √ √ 12/9/1987 0.323 0.317 √ √ √ √ √ √ √ √ √ √ √ 1/26/1988 0.372 0.364 √ √ √ √ √ √ √ √ √ √ √ 3/16/1988 0.357 0.349 √ √ √ √ √ √ √ √ √ √ √ 5/5/1988 1.079 1.057 √ √ √ √ √ √ √ √ √ √ √ √

Table A1 continued
124
Median Sediment Sizes Coarse Sediment Sizes
Date
Gage Height
Critical Shear Stress Y36US Y36DS LA LB Y50US Y50DS Y36US Y36DS LA LB Y50US Y50DS
m N/m2 5/10/1988 1.088 1.066 √ √ √ √ √ √ √ √ √ √ √ √ 6/23/1988 0.424 0.415 √ √ √ √ √ √ √ √ √ √ √ √ 8/8/1988 0.137 0.134 √ √ √ √ √ √ √ √ √ 9/8/1988 1.795 1.759 √ √ √ √ √ √ √ √ √ √ √ √
9/12/1988 0.954 0.935 √ √ √ √ √ √ √ √ √ √ √ √ 9/29/1988 0.122 0.119 √ √ √ √ √ √ √ 11/15/1988 0.183 0.179 √ √ √ √ √ √ √ √ √ 1/3/1989 0.219 0.215 √ √ √ √ √ √ √ √ √ √ √
2/22/1989 0.174 0.170 √ √ √ √ √ √ √ √ √ 4/11/1989 0.113 0.111 √ √ √ √ √ √ √ 6/5/1989 0.119 0.116 √ √ √ √ √ √ √
6/21/1989 1.844 1.807 √ √ √ √ √ √ √ √ √ √ √ √ 7/13/1989 1.000 0.980 √ √ √ √ √ √ √ √ √ √ √ √ 7/19/1989 0.162 0.158 √ √ √ √ √ √ √ √ √ 9/7/1989 0.244 0.239 √ √ √ √ √ √ √ √ √ √ √
10/23/1989 0.320 0.314 √ √ √ √ √ √ √ √ √ √ √ 12/1/1989 0.384 0.376 √ √ √ √ √ √ √ √ √ √ √ 1/18/1990 0.174 0.170 √ √ √ √ √ √ √ √ √ 3/7/1990 0.280 0.275 √ √ √ √ √ √ √ √ √ √ √ 5/2/1990 1.722 1.688 √ √ √ √ √ √ √ √ √ √ √ √
5/10/1990 2.039 1.998 √ √ √ √ √ √ √ √ √ √ √ √ 6/18/1990 0.265 0.260 √ √ √ √ √ √ √ √ √ √ √ 8/2/1990 0.259 0.254 √ √ √ √ √ √ √ √ √ √ √
9/18/1990 0.262 0.257 √ √ √ √ √ √ √ √ √ √ √ 10/30/1990 0.137 0.134 √ √ √ √ √ √ √ √ √ 11/20/1990 0.076 0.075 √ √ √ √ √ √ √ 1/9/1991 0.219 0.215 √ √ √ √ √ √ √ √ √ √ √

Table A1 continued
125
Median Sediment Sizes Coarse Sediment Sizes
Date
Gage Height
Critical Shear Stress Y36US Y36DS LA LB Y50US Y50DS Y36US Y36DS LA LB Y50US Y50DS
m N/m2 1/14/1991 1.804 1.768 √ √ √ √ √ √ √ √ √ √ √ √ 2/26/1991 2.579 2.527 √ √ √ √ √ √ √ √ √ √ √ √ 7/22/1991 0.110 0.108 √ √ √ √ √ √ √ 8/13/1991 0.037 0.036 √ √ 9/10/1991 0.034 0.033 √ √ 1/13/1992 2.682 2.629 √ √ √ √ √ √ √ √ √ √ √ √ 3/9/1992 2.966 2.906 √ √ √ √ √ √ √ √ √ √ √ √
4/23/1992 2.630 2.578 √ √ √ √ √ √ √ √ √ √ √ √ 6/8/1992 2.316 2.270 √ √ √ √ √ √ √ √ √ √ √ √
7/27/1992 2.524 2.473 √ √ √ √ √ √ √ √ √ √ √ √ 9/14/1992 0.085 0.084 √ √ √ √ √ √ √

126
VITA
Name: Adriana E. Martinez Address: Department of Geography, College of Geosciences, Texas A&M
University, College Station, TX 77843-3147 Email Address: [email protected] Education: B.S., Environmental Geosciences, Texas A&M University, 2005
M.S., Geography, Texas A&M University, 2008 Professional Experience: 2006-2008 Graduate Fellow, National Science Foundation GK-12 Advancing
Geospatial Skills in Science and Social Science, Department of Geography, Texas A&M University
2006 Graduate Teaching Assistant, Hydrology and Environment Laboratory,
Department of Geography, Texas A&M University Publications:
Chin, A., Laurencio, L., and Martinez, A., 2008. The Hydrologic Impacts of Small- and Medium-sized Dams: Examples from Texas. The Professional Geographer. (In Press).
Professional Presentations:
Martinez, A. Sediment Dynamics of an Impounded River: Yegua Creek, Texas. Association of American Geographers Annual Meeting, San Fransisco, April 17-21, 2007.
Simms, M., Kincaid, J., Martinez, A., Prouhet, T., Williams, N., Rushing, R., Ward, M., Whitaker, T., Bednarz, R., Bednarz, S., Filippi, A., Klein, A. Profiles in Spatial Literacy: How Young Americans Think Spatially. National Science Foundation Graduate K12 Conference, Washington, DC, March 9-11, 2007.
Martinez, A. Sediment Dynamics of an Impounded River: Yegua Creek, Texas. Southwest Association of American Geographers (SWAAG) Annual Meeting, Texas A&M University, November 1-3, 2007.