a biogeochemical and molecular … constituents of the nitrogen (n) cycle ... simplified schematic...
TRANSCRIPT

A BIOGEOCHEMICAL AND MOLECULAR ECOLOGICAL STUDY OF AEROBIC
METHANE OXIDATION AND NITRIFICATION IN MONO LAKE CALIFORNIA, USA
by
STEPHEN A. CARINI
(Under the Direction of Samantha B. Joye)
ABSTRACT
Methane (CH4) and ammonia (NH3) oxidation play key roles in the biogeochemical
cycles of carbon (C) and nitrogen (N). In this dissertation, biogeochemical and molecular
analyses were combined to elucidate environmental and microbiological controls on these
processes and link specific activity with microbial community composition in Mono Lake, CA, a
hypersaline, alkaline lake located just east of the Sierra Nevada range in northern California.
Aerobic CH4 oxidation varied spatially and temporally coincident with a shifting microaerophilic
zone associated with seasonal stratification. Sequence analysis indicated slight shifts in
methanotroph community composition and stable absolute cell numbers. Variable CH4 oxidation
rates in the presence of a relatively stable methanotroph population suggested that zones of high
CH4 oxidation resulted from an increase in activity of a sub-set of the existing methanotroph
population. Nitrification activity and NH3 oxidizer community composition were also assessed.
Geochemical profiles and rate measurements indicated nitrifying activity. Bacterial NH3 oxidizer
abundance varied seasonally but absolute cell numbers remained consistent over depth for each
sample date while Crenarchaeota abundance was strongly correlated between with rate
measurements. However, the lack of verifiable archaeal amoA gene copies and the presence of
sufficient AOB cell numbers to physiologically account for all measured nitrification preclude

specific assignment of nitrifying activity to Mono Lake Crenarchaeota, although a potential
AOA contribution to nitrification in Mono Lake cannot be ruled out.
Enrichment experiments identified interactions between methane oxidation and
nitrification. The highest CH4 oxidation rates occurred in the NH4++CH4 enrichment, inferring
that methanotrophs benefited from nitrogen (N) addition. FISH and DGGE analysis
demonstrated that the methanotrophs in the CH4-only enrichment were able to take advantage of
elevated CH4 through community composition adaptation. Crenarchaeota abundance correlated
with NOX accumulation and nitrification activity while AOB abundance decreased, suggesting
that ammonia-oxidizing archaea (AOA) may have contributed to nitrification in the NH4+-only
enrichment. In contrast, there was a decrease in crenarchaeal abundance and an increase in AOB
abundance in the CH4+NH4+ enrichment that correlated with increased nitrification activity. The
reversal in the correlation between AOB and nitrification relative to that observed in the NH4+-
only enrichment plus the significant decline in crenarchaeal abundance in the CH4+NH4+
enrichment suggests that AOB were likely more active in nitrification in the presence of CH4
and/or methanotrophs.
INDEX WORDS: Biogeochemistry, Mono Lake, Methane oxidation, Type I methanotrophs,
Type II methanotrophs, Nitrification, Ammonia oxidation, Ammonia-
oxidizing bacteria, Archaeal oxidizers of ammonia, Molecular, Phylogeny,
Abundance, PCR, DGGE, FISH

A BIOGEOCHEMICAL AND MOLECULAR ECOLOGICAL STUDY OF AEROBIC
METHANE OXIDATION AND NITRIFICATION IN MONO LAKE CALIFORNIA, USA
by
STEPHEN A. CARINI
B.A., University of Colorado, 1997
B.A., Saint Michael’s College, 1984
A Dissertation Submitted to the Graduate Faculty of The University of Georgia in Partial
Fulfillment of the Requirements for the Degree
DOCTOR OF PHILOSOPHY
ATHENS, GEORGIA
2007

© 2007
Stephen A. Carini
All Rights Reserved

A BIOGEOCHEMICAL AND MOLECULAR ECOLOGICAL STUDY OF AEROBIC
METHANE OXIDATION AND NITRIFICATION IN MONO LAKE CALIFORNIA, USA
by
STEPHEN A. CARINI
Major Professor: Samantha B. Joye
Committee: James T. HollibaughMary Ann MoranMing-Yi SunWilliam B. Whitman
Electronic Version Approved:
Maureen GrassoDean of the Graduate SchoolThe University of GeorgiaMay 2007

iv
DEDICATION
If not for the devotion and commitment of my family, especially my wonderful parents Paul and
Judy, I would not be in a position to offer this work, which epitomizes what has been and what is
still to come, as a small tribute to their boundless love and support.
Thank You

v
ACKNOWLEDGEMENTS
I would like to thank the National Science Foundation for supporting my work through
grant MCB 99-7786 and companion grant MCB 997901. I am also grateful to the University of
Georgia for paying me for the privilege of sharing my passion with so many eager minds and
allowing me to learn as much from my students as from my own experience.
There are many people without whom this journey would have been much more work
and much less fun. I would like to thank the Joye lab, in particular Marshall Bowles, Rosalynn
Lee, Beth! Orcutt, Bill Porubsky, Vladimir Samarkin, and Nat Weston. I would like to say a
special thanks to the entire Mono Lake group from both GA and CA especially Nasreen Bano,
Gary LeCleir. Bob Jellison, and Sandi Roll. I also would like to thank John Bushnell, who did
everything but drive me to Woods Hole all those years ago, for my life changing REU
experience with Chuck, Anne, Jane, and Hap (not to mention my twelve roommates).
And, of course, here’s to my dissertation committee: Mandy Joye, Tim Hollibaugh, Mary
Ann Moran, Ming-Yi Sun, and Barny Whitman who have been so patient and supportive,
especially Mandy - who’d have ever thought I wouldn’t have the words…I would be remiss if I
didn’t also thank all the people in the Marine Science Department who I have pestered over the
years. There are too many of you to mention but special medals should be awarded to Wendy
and Jennifer from the Moran lab and an encore hats off to Nasreen, Hopefully your nightmares
are beginning to fade.

vi
TABLE OF CONTENTS
Page
ACKNOWLEDGEMENTS ........................................................................................................v
CHAPTER
1 INTRODUCTION AND LITTERATURE REVIEW.................................................1
2 PATTERNS OF AEROBIC METHANE OXIDATION AND METHANOTROPH
COMMUNITY COMPOSITION DURING SEASONAL STRATIFICATION IN
MONO LAKE......................................................................................................... 15
3 NITRIFICATION IN MONO LAKE, CA: INTERANNUAL VARIATIONS IN
RATES AND A POSSIBLE ROLE FOR ARCHAEAL AMMONIA
OXIDIZERS............................................................................................................ 51
4. THE EFFECTS OF RELATIVE SUBSTRATE AVAILABILITY ON METHANE
OXIDATION, NITRIFICATION, AND ASSOCIATED MICROBIAL
COMMUNITY DYNAMICS IN MONO LAKE (CA, USA)……………………….98
5 CONCLUSIONS ................................................................................................... 146

1
CHAPTER 1
INTRODUCTION
Methane- and ammonia-oxidizing bacteria play key roles in the biogeochemical cycles of
carbon and nitrogen (Cicerone and Oremland, 1988). Methane-oxidizing bacteria (MOB) convert
methane (CH4) to carbon dioxide (CO2) providing a significant link between the reduced and
oxidative phases of the carbon (C) cycle (equation 1.1). Similarly, ammonia-oxidizing bacteria
(AOB) convert ammonia (NH3) to nitrite (NO2-), a central component linking the reduced and
oxidized constituents of the nitrogen (N) cycle (equation 1.2).
(1.1) CH4 + O2 CH3OH HCHO HCOOH CO2
(abbreviations above the reaction arrows indicate the catalytic enzymes methane
monooxygenase (MMO), methanol dehydrogenase (MDH), formaldehyde dehydrogenase
(FADH), and formate dehydrogenase (FDH))
(1.2) NH3 + H2O NH2OH + H2O NO2- + H2O + H+
(abbreviations above the reaction arrows indicate the catalysts ammonia monooxygenase
(AMO) and hydroxylamine oxidoreductase (HAO)).
MMO MDH FADH FDH
AMO HAO
Methane Methanol Formaldehyde Formate
Ammonia Hydroxylamine Nitrate
2
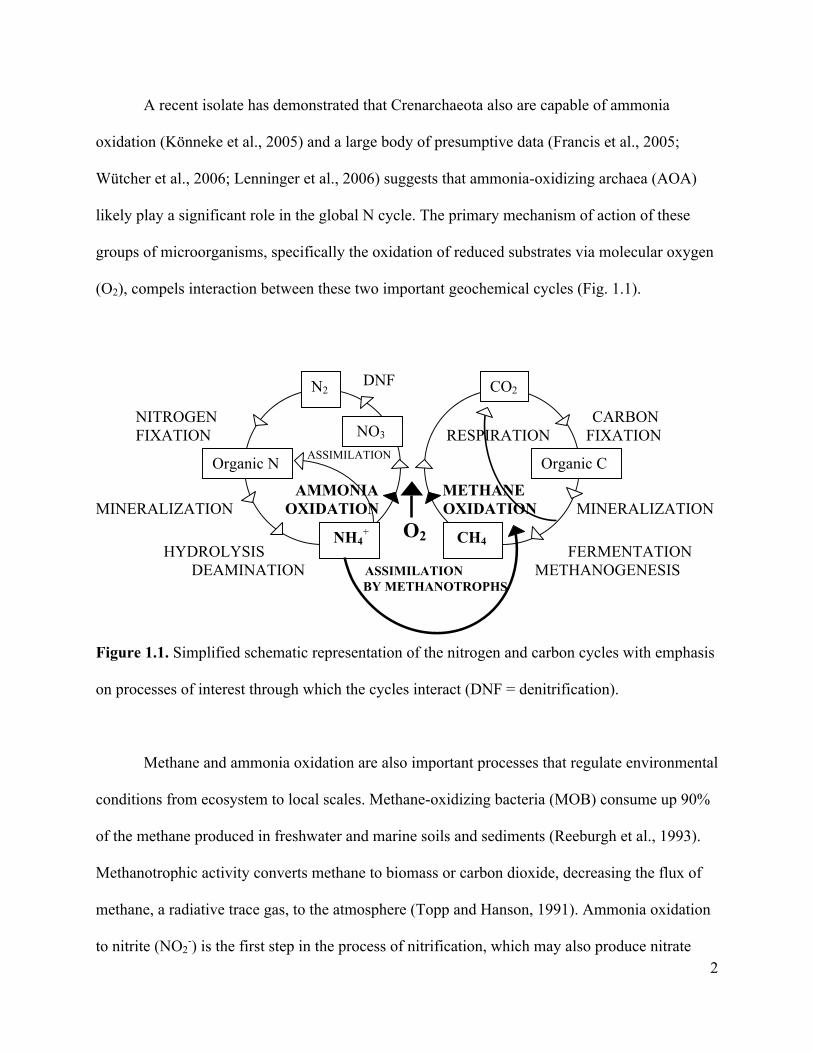
A recent isolate has demonstrated that Crenarchaeota also are capable of ammonia
oxidation (Könneke et al., 2005) and a large body of presumptive data (Francis et al., 2005;
Wütcher et al., 2006; Lenninger et al., 2006) suggests that ammonia-oxidizing archaea (AOA)
likely play a significant role in the global N cycle. The primary mechanism of action of these
groups of microorganisms, specifically the oxidation of reduced substrates via molecular oxygen
(O2), compels interaction between these two important geochemical cycles (Fig. 1.1).
DNF
NITROGEN CARBON FIXATION RESPIRATION FIXATION ASSIMILATION (O2)
AMMONIA METHANEMINERALIZATION OXIDATION OXIDATION MINERALIZATION
O2 HYDROLYSIS FERMENTATION DEAMINATION ASSIMILATION METHANOGENESIS BY METHANOTROPHS
Figure 1.1. Simplified schematic representation of the nitrogen and carbon cycles with emphasis
on processes of interest through which the cycles interact (DNF = denitrification).
Methane and ammonia oxidation are also important processes that regulate environmental
conditions from ecosystem to local scales. Methane-oxidizing bacteria (MOB) consume up 90%
of the methane produced in freshwater and marine soils and sediments (Reeburgh et al., 1993).
Methanotrophic activity converts methane to biomass or carbon dioxide, decreasing the flux of
methane, a radiative trace gas, to the atmosphere (Topp and Hanson, 1991). Ammonia oxidation
to nitrite (NO2-) is the first step in the process of nitrification, which may also produce nitrate
N2 CO2
Organic N Organic C
NH4+ CH4
NO3

3
(NO3-) via the coupled action of nitrite-oxidizing bacteria (Prosser, 1989). Ammonia oxidation
provides critical links to other nitrogen cycling processes (e.g. denitrification and anammox) that
regulate concentrations and bioavailability of N in specific systems.
The data presented here focus on the occurrence, magnitude, and controls on methane
and ammonia oxidation. Biogeochemical methods were combined with molecular techniques to
elucidate environmental and microbiological controls on these processes and link specific
activity with microbial community composition in Mono Lake, CA. Mono Lake is a closed
basin, alkaline salt lake located just east of the Sierra Nevada range in northern California (38°
N, 119° W). Saline lakes are numerous, geographically widespread, and comprise a significant
part of the world’s inland aquatic ecosystems (Fig. 1.2). In fact, although the vast majority of the
Figure 1.2. Shaded areas indicate the global distribution of slat lakes (From Williams, W.D.,
2002).

4
earth’s water is contained in the oceans, about half of the accessible liquid water on the planet is
contained in salt lakes (Table 1.1). Many salt lakes, such as Mono Lake, are terminal basins
(with no outlets) and limnological conditions in Mono Lake undergo periodic changes in lake-
wide mixing regimes due to climactic trends and the resulting hydrological balance between
inflow and evaporation.
Table 1.1. Partitioning of water in the various inland aquatic compartments (Williams, W.D.,
1996). Emphasis on comparable Freshwater and Saline lakes percentages added.
Vertical mixing in Mono Lake is predominantly driven by a seasonal cycle of summer
thermal stratification and winter turnover (once per year = monomixis). However, periodic
freshening of the epilimnion can create a chemical density stratification that results in
meromixis. During periods of meromixis, the development of a steep salinity gradient

5
(chemocline) isolates a portion of bottom water (monimolimnion) and prevents seasonal
holomixis (Romero et al, 1998; MacIntyre and Romero, 2000). Meromictic periods may persist
for years and dramatically change limnological and geochemical conditions in the lake.
However, meromixis brings an accompanying stability inherent in a stratified system.
Stratification creates layers that lead to gradients and fluxes. Gradients exert a powerful
influence on microbial activity and community structure.
During this study, Mono Lake was meromictic and the monimolimnion had been isolated
below the pycnocline since 1995 (Melack and Jellison, 1998). We selected station 6 (Fig. 1.3) a
relatively deep, mid-lake site to examine patterns of methanotroph activity and associated
community composition during the development of seasonal stratification in Mono Lake
(CHAPTER 2).
Figure 1.3. Mono Lake bathymetric map depicting the position of station 6.
1
11
6

6
Aerobic methane-oxidizing bacteria (methanotrophs) are distinguished by their ability to
use methane (CH4) as their sole source of metabolic energy and structural carbon. Biological
CH4 oxidation is the predominant sink mitigating the flux of CH4, an important radiative trace
gas, to the atmosphere (Topp and Hanson, 1991). Methanotrophic bacteria consume CH4
produced in freshwater and marine environments and may be a significant CH4 sink in saline and
alkaline lakes (Iverson et al., 1987; Joye et al., 1999; Khmelenina et al., 2000). Culture
independent molecular genetic techniques have become an important tool for quantifying the
dominant organisms and diversity of natural microbial communities (Pace, 1997). Methanotroph
populations and community structure in different environments have been examined using PCR
(McDonald et al., 1995; Holmes et al., 1995; Henckel et al., 1999), PCR/DGGE (Wise et al.,
1999), and PCR/TRFLP (Costello and Lidstrom, 1999; Horz et al., 2001) analyses.
Fluorescence in situ hybridization (FISH) permits the direct enumeration of individual
cells in a sample and can provide quantitative information complimentary to DGGE and
sequence data. Methanotroph family-specific probes have been used to identify and enumerate
methanotroph cells in estuarine sediment slurry enrichment cultures (Bourne et al., 2000) and in
rice paddy soils (Eller and Frenzel, 2001). The data gathered during this study support three
major conclusions. CH4 oxidation rate and geochemical measurements demonstrated that zones
of peak CH4 oxidation activity migrated through the water column during seasonal stratification
and consistently occurred in the microaerophilic zone at the bottom of the oxycline.
Methanotroph abundance determined by FISH analysis revealed a stable number of both type I
and type II methanotrophs at all sample depths over the course of the study. The combination of
rate measurements, FISH analysis, and DGGE community profiles suggest that changes in

7
activity and/or ratios of sub-sets of the existing methanotroph population, rather than a change in
overall methanotroph numbers, drove the observed shifts in zones of elevated CH4 oxidation.
Interannual patterns of nitrification and the relative contributions of AOB and AOA to
nitrification were examined in CHAPTER 3. Ecological ramifications of nitrification include the
production and efflux of a radiative trace gas (nitrous oxide, N2O) to the atmosphere, alteration
of the concentrations and distributions of biologically available N, and loss of fixed N via
coupling to denitrification (Ward, 1986). Nitrification can be coupled with other N processes to
remove fixed N from a system, e.g., the nitrate and nitrite produced by nitrification may serve as
e- acceptors for denitrifiers or anaerobic ammonium oxidizers. Denitrifying bacteria transform
NO3- and NO2
- to nitrogen gas (N2); thus, coupled nitrification-denitrification can remove fixed
N (Jenkins and Kemp, 1984; Codispoti and Christiansen, 1985). Nitrite produced by nitrification
may also be used as an oxidant for anaerobic ammonium oxidation (anammox), which also
results in N2 loss (Mulder et al., 1998). In alkaline ecosystems, however, nitrification may
reduce the loss of fixed N from a system. By converting NH3 to NO2- and NO3
-, N losses due to
NH3 volitalization are curtailed (Joye et al, 1999). These various biogeochemical transformations
of N determine local concentrations and distributions of biologically available N and can have a
profound impact on ecosystem primary production (Jellison and Melack, 1993).
Geochemical profiles reflected depletion or production of nitrification substrates and
products that were indicative of nitrifying activity. Nitrification rate data demonstrated that peak
activity occurred between 13 and 14 m throughout the year and depth-integrated rates were
highest in November 2002. Phylogenetic analysis revealed a shift from a nitrifying population
previously dominated by N. europaea and N. eutropha strains, to nitrosonomads predominantly
affiliated with alkaline and saline environments. Bacterial ammonia oxidizer abundance varied

8
seasonally but absolute cell numbers remained consistent over depth for each sample date.
Crenarchaeota abundance varied over time and depth and maximum cell numbers correlated with
peaks in nitrification activity. Although correlations between nitrification and Crenarchaeota and
AOB abundance followed a pattern similar to patterns demonstrated in other studies that have
suggested significant AOA activity, the lack of verifiable archaeal amoA gene copies and the
presence of sufficient AOB cell numbers to physiologically account for all measured nitrification
in Mono Lake leaves open the question as to whether AOA contribute significantly to
nitrification in Mono Lake.
Physiological, biochemical, and ecological similarities between aerobic methane- and
ammonia-oxidizing bacteria promote interactions that may significantly affect methane and
ammonia oxidation rates. These interactions were investigated in CHAPTER 4 using aerobic
enrichment cultures. The mono-oxygenase systems of methane and ammonia oxidizers are
evolutionarily related (Holmes et al., 1995). Methane- and ammonia-oxidation co-occur in
sediments near the oxic-anoxic boundary where both oxygen and reduced substrate are available.
Both inhibition (King and Schnell 1994) and stimulation (Bodelier et al., 2000) of methane
oxidation by ammonia availability have been documented. Similarly, methanotroph activity may
enhance (Bodelier and Frenzel 1999) or retard nitrification (Megraw and Knowles 1987; Roy
and Knowles 1994). Moreover, methanotrophic demand for N during periods of increased
activity can actually suppress NH3 oxidation activity and influence AOB community
composition by sequestering available nitrogen. Galveston Bay, TX sediment enrichments that
received supplemental CH4+NH4+ had the highest pMOX rates observed, no detectable
nitrification activity, and DIN concentrations similar to the control (e.g. very low NH4+ NO2
- and
9
NO3-). Furthermore, DGGE analysis revealed a different nitrifier population in the CH4+NH4
+
enrichment than that observed in the NH4+ -only enrichment (Carini et al., 2003).
The Mono Lake enrichment experiments demonstrated that both CH4 and NH3 oxidation
rates increased over time in enrichments amended with their primary substrate. Community
composition data from our CH4 enrichments suggest a combination of additional methanotroph
abundance and increased activity of the initial in situ methanotroph population likely contributed
to the higher CH4 oxidation rates observed in those treatments. The rate of NH3 oxidation
increased in the NH4+-only enrichment relative to the control, demonstrating that nitrification
was N limited. Significant changes in both crenarchaeal and AOB abundance in the NH4+-only
enrichment provided stronger correlative data supporting potential AOA activity in Mono Lake
relative to in situ observations. Crenarchaeota abundance increased significantly as the
nitrification rate increased, while AOB abundance decreased. Clearly, members of the
Crenarchaeota proliferated over the AOB population under N-replete conditions and were
strongly correlated with nitrifying activity. Due to the significant decrease in AOB abundance,
AOB cell specific nitrification rates in the NH4+-only enrichment were generally higher than cell
specific rates reported for pure cultures (Nitrosospira) and amended soils were generally less
than 10 fmol cell-1 hr-1 indicating that the AOB population may not have had the physiological
capacity to account for all the measured nitrification in the NH4+-only enrichment. Taken
together, these findings, while still correlative in nature, are more suggestive of an AOA
contribution to nitrification in the NH4+-only enrichment.
Methanotrophic activity and community composition reacted differently dependent on
the presence or absence of additional NH4+. The methanotroph population of the CH4 + NH4
+
enrichment had a higher potential for CH4 oxidation due to readily available NH3. However, the

10
methanotroph population in the CH4-only enrichment was also able to take advantage of higher
CH4 availability even without supplemental N through community composition adaptation.
Nitrification activity was not significantly affected by supplemental CH4; however, nitrifier
community composition reacted differently dependent on the presence or absence of additional
CH4. Contrary to the response in the NH4+-only enrichment, Crenarchaeota abundance decreased
and AOB increased in the CH4 + NH4+ enrichment suggesting that AOB were likely more active
in nitrification in the CH4+NH4+ enrichment.
LITERATURE CITED
Bodelier, P.L.E and Peter Frenzel. 1999. Contribution of methanotrophic and nitrifying bacteria
to CH4 and NH4+ oxidation in the rhizosphere of rice plants as determined by new
methods of discrimination. Appl. Envir. Microbiol. 65: 1826-1833.
Bodelier, P. L., P. Roslev, T. Henckel, and P. Frenzel. 2000. Stimulation by ammonium-based
fertilizers of methane oxidation in soil around rice roots. Nature 403:421–424.
Bourne, D.G., A.J. Holmes, N. Iverson, and J.C. Murrell. 2000. Fluorescent Oligonucleotide
rDNA probes for specific detection of methane oxidizing bacteria. FEMS Microbiol.
Ecol.31:29-38.
Carini, S., B. Orcutt, and S.B. Joye. 2003. Interactions between methane oxidation and
nitrification in coastal sediments. Geomicrobiol. J. 20:355-374
Cicerone, R.J., and R.S. Oremland. 1988. Biogeochemical aspects of atmospheric methane.
Global Biogeochem. Cycles. 1:61-86.
Codispotti, L.A., and J.P. Christensen. 1985. Nitrification, denitrification, and nitrous oxide
cycling in the eastern tropical South Pacific Ocean. Mar. Chem. 16:277-300.

11
Costello, A.M., and M.E. Lidstrom. 1999. Molecular characterization of functional and
Phylogenetic genes from natural populations of methanotrophs in freshwater sediments.
Appl. Environ. Microbiol. 65:5066-5074.
Eller, G. and P. Frenzel. 2001. Changes in activity and community structure of methane-
oxidizing bacteria over the growth period of rice. Appl. Environ. Microbiol.
67:2395–2400.
Francis, C. A., Roberts, K. J., Beman, J. M., Santoro, A. E. & Oakley, B. B. 2005. Ubiquity and
diversity of ammonia-oxidizing Archaea in water columns and sediments of the ocean.
Proc. Natl. Acad. Sci. USA 102, 14683–14688. Hanson, R.S. and T.E. Hanson, 1996.
Methanotrophic bacteria. Microbiol. Rev. 60, pp. 439-471.
Henckel, T., M. Friedrich, and R. Conrad. 1999. Molecular analysis of the methane-oxidizing
microbial community in rice field soil by targeting the genes of the 16s rRNA, particulate
methane monooxygenase, and methanol dehydrogenase. Appl. Environ. Microbiol. 65:
1980-1990.Holmes, A.J., N.J.P. Owens, and J.C. Murrell. 1995. Detection of novel
marine methanotrophs using phylogenetic and functional gene probes after methane
enrichment. Microbiology (UK) 141:1947-1955.
Holmes, A.J., N.J.P. Owens, and J.C. Murrell. 1995. Detection of novel marine methanotrophs
using phylogenetic and functional gene probes after methane enrichment. Microbiology
(UK) 141:1947-1955.
Horz, H.P., M.T. Yimga, and W. Liesack. 2001. Detection of methanotroph diversity on roots of
submerged rice plants by molecular retrieval of pmoA, mmoX, mxaF, and 16S rRNA and
ribosomal DNA, including pmoA-based terminal restriction fragment length
polymorphism profiling. Appl. Environ. Microbiol. 67:4177-4185.

12
Iverson, N., R.S. Oremland, and M.J. Klug. 1987. Big Soda Lake (Nevada). 3. Pelagic
methanogenesis and anaerobic methane oxidation. Limnol. Oceanogr. 32:804-814.
Jellison, R and J.M. Melack. 1993. Meromixis in hypersaline Mono Lake, California. 1.
Stratification and vertical mixing during the onset, persistence, and breakdown of
meromixis. Limnol. Oceanogr. 38: 1008-1019.
Jenkens, M.C. and W.M. Kemp. 1984. The coupling of nitrification and denitrification in two
estuarine sediments. Limnol. Oceanogr. 29:609-619.
Joye, S. B., T.L. Connell, L. G. Miller, R.S. Oremland and R. S. Jellison. 1999. Oxidation of
ammonia and methane in an alkaline, saline lake. Limnol. Oceanogr. 44: 178-188.
Khmelenina, V.N., B. Eshinimaev, M.G. Kalyuzhnaya, and Y.A. Trotsenko. 2000. Potential
activity of methane and ammonium oxidation by methanotrophic communities from the
soda lakes of Southern Transbaikal. Mikrobiologiya (English translation) 69:460-465.
King, G. M., and S. Schnell. 1994. Effect of increasing atmospheric methane concentration on
ammonium inhibition of soil methane consumption. Nature 370:282–284.
K!o!!!n!n!e!k!e!,! !M!.!,! !B!e!r!n!h!a!r!d!,! !A!.! !E!.!,! !d!e! !l!a! !T!o!r!r!e!,! !J!.! !R!.!,! !W!a!l!k!e!r!,! !C!.! !B!.!,! !W!a!t!e!r!b!u!r!y!,! !J!.! !B!.! !&! !S!t!a!h!l!,! !D!.! !A!.!
!2!0!0!5!. Isolation of an autotrophic ammonia-oxidizing marine archaeon. !N!a!t!u!r!e! !4!3!7!: !5!4!3-
!5!4!6!.!
Leinineger, S., T. Urich, M.Scholter, L Schwark, et al. 2006. Archaea predominate among
ammonia-oxidizing prokaryotes in soils. Nature Letters 442: 806.
MacIntyre, S., and J. R. Romero. 2000. Predicting upwelling, boundary mixing and nutrient
fluxes in lakes. Verh. int. Ver. Limnol. 27: 246-250.
McDonald, I.R., E.M. Kenna, and J.C. Murrell. 1995. Detection of methanotrophic bacteria in
environmental samples with the PCR. Appl. Environ. Microbiol. 61:116-121.

13
Megraw, S. R., and R. Knowles. 1987. Active methanotrophs suppress nitrification in a humisol.
Biol. Fertil. Soils 4:205–212.
Melack, J.M. and R. Jellison. 1988. Limnological conditions in Mono Lake: Contrasting
monomixis and meromixis in the 1990’s. Hydrobiologia 384:21-39.
Mulder, A., A. A. van de Graaf, L. A. Robertson, and J. G. Kuenen. Anaerobic ammonium
oxidation discovered in a denitrifying fluidized bed reactor. 1998. FEMS Microbiology
Reviews 22: 421-431.
Pace, N.R. 1997. A molecular view of microbial diversity and the biosphere. Science 276:734-
740.
Prosser, J. I. 1989. Autotrophic nitrification in bacteria. Adv. Microb. Physiol. 30: 125-181.
Reeburgh, W. S., S. C. Whalen, and M. J. Alperin. 1993. The role of methylotrophy in the global
methane budget, p. 1–14. In J. C. Murrell and D. P. Kelly (ed.), Microbial growth on C1
compounds. Intercept Ltd, Andover, United Kingdom.
Romero, J.R., R. Jellison, and J.M. Melack. 1998. Stratification, mixing, and ammonia flux in a
hypersaline lake. Arch. Hydrobiol. 142: 283-315.
Roy, R., and R. Knowles. 1994. Effects of methane metabolism on nitrification and nitrous oxide
production in polluted freshwater sediment. Appl. Environ. Microbiol. 60:3307–3314.
Topp, E. and R.S. Hanson. 1991. Metabolism of radiatively important trace gases by methane-
oxidizing bacteria, p. 71-90. In J.E. Rogers and W.B. Whitman (ed.), Microbial
production and consumption of greenhouse gases: methane nitrogen oxides, and
halomethanes. American Society for Microbiology, Washington, D.C.
Ward, B. B. 1986. Nitrification in marine environments. In: Nitrification (Prosser, J. I. Ed.) pp
157-184. IRL Press, Oxford.
14
Williams, W. D. 2002. Environmental Threats to salt lakes and the likely status of inland saline
ecosystems in 2025. Environ Conserv. 29:154-167.
Wise, M.G., J.V. McArthur, and L.J. Shimkets. 1999. Methanotroph diversity in landfill soil:
isolation of novel type I and type II methanotrophs whose presence was suggested by
culture-independent 16S ribosomal DNA analysis. Appl. Environ. Microbiol. 65:4887-
4897.
Wuchter, C., B. Abbas, M.J.L. Coolen, L. Herfort et al. 2006. Archaeal nitrification in the ocean.
Proc. Natl. Acad. Sci. USA 103: 12317-12322.

15
CHAPTER 2
PATTERNS OF AEROBIC METHANE OXIDATION AND METHANOTROPH
COMMUNITY COMPOSITION DURING SEASONAL STRATIFICATION IN MONO
LAKE1
_______________________
1 Carini, S.A., N. Bano, G. LeCleir, and S.B. Joye. 2005 Environmental Microbiology 7 (8): 1127-1138.
Reprinted here with permission of the publisher.

16
ABSTRACT
Patterns of aerobic methane (CH4) oxidation and associated methanotroph
community composition were investigated during the development of seasonal stratification
in Mono Lake, California (USA). CH4 oxidation rates were measured using a tritiated CH4
radiotracer technique. Fluorescence in situ hybridization (FISH), denaturing gradient gel
electrophoresis (DGGE), and sequence analysis were used to characterize methanotroph
community composition. A temporally shifting zone of elevated CH4 oxidation (59-123 nM
d-1) was consistently associated with a sub-oxycline, microaerophilic zone that migrated
upwards in the water column as stratification progressed. FISH analysis revealed stable
temporal and spatial numbers of type I (4.1-9.3 x 10⁵ cells ml-1) and type II (1.4-3.4 x 10⁵
cells ml-1) methanotrophs. DGGE and Sequence analysis indicated slight shifts in
methanotroph community composition despite stable absolute cell numbers. Variable CH4
oxidation rates in the presence of a relatively stable methanotroph population suggested
that zones of high CH4 oxidation resulted from an increase in activity of a sub-set of the
existing methanotroph population. These results challenge existing paradigms suggesting
that zones of elevated CH4 oxidation rates result from the accumulation of methanotrophic
biomass and illustrate that type II methanotrophs may be an important component of the
methanotroph population in saline and/or alkaline pelagic environments.
INTRODUCTION
Aerobic methane-oxidizing bacteria (methanotrophs) are distinguished by their ability to
use methane (CH4) as their sole source of metabolic energy and structural carbon.
Methanotrophs inhabit a variety of terrestrial and aquatic habitats and play an important role in

17
global carbon, oxygen, and nitrogen cycling (Cicerone and Oremland, 1988). Biological CH4
oxidation is the predominant sink mitigating the flux of CH4, an important radiative trace gas, to
the atmosphere (Topp and Hanson, 1991). Methanotrophic bacteria consume up to 80% of the
CH4 produced in freshwater and marine environments (Reeburgh et al., 1993) and may be a
significant CH4 sink in saline and alkaline lakes (Iverson et al., 1987; Joye et al., 1999;
Khmelenina et al., 2000).
Methanotrophs are grouped into two families based primarily on internal membrane
arrangement and on the carbon assimilation pathway employed. Type I methanotrophs have
disc-shaped membrane bundles distributed throughout the cytoplasm, assimilate carbon as
formaldehyde via the RuMP pathway, and comprise a distinct cluster within the gamma subclass
of the Proteobacteria (γ-Proteobacteria). Type II methanotrophs possess paired internal
membrane structures aligned with the periphery of the cell, assimilate formaldehyde via the
serine pathway, and form a distinct cluster in the α-Proteobacteria (Hanson and Hanson, 1996).
Type I methanotrophs have been described as the dominant or exclusive family of
methanotrophs observed in estuarine, marine, and hypersaline environments (Bourne et al.,
2000; Holmes et al., 1996; Khmelenina et al., 2000). Although type II methanotrophs are
reported to be a significant component of the methanotroph populations in freshwater sediments
(Costello and Lidstrom, 1999), peat bogs (Deydysh et al., 2000), and rice paddy soils (Henckel et
al., 1999; Eller and Frenzel, 2001), these organisms have not been observed previously in saline
and/or alkaline environments such as Mono Lake.
Saline lakes are numerous, geographically widespread, and comprise a significant part of
the world’s inland aquatic ecosystems (Williams, 2002). Mono Lake is an alkaline salt lake
located just east of the Sierra Nevada range in northern California (38°N, 119°W). During this

18
study, the lake was meromictic and the monimolimnion (bottom water) had been isolated below
the pycnocline since 1995. This isolation resulted in persistent anoxia and accumulation of high
concentrations of dissolved CH4 (50-100 µM). During winter, the lake was isothermal to the
pycnocline. Increased solar heating in the spring and summer generated thermal stratification.
As seasonal thermal stratification progressed, the oxycline migrated upward in the water column.
Thus, over time, discrete depths were exposed to different concentrations of dissolved oxygen
and fluxes of methane and nutrients. Seasonal stratification provided an ideal in situ
environment for examining the effects of changing geochemical conditions on CH4 oxidation
rates and methanotroph community and population dynamics using biogeochemical and
molecular techniques.
Culture independent molecular genetic techniques have become an important tool for
quantifying the dominant organisms and diversity of natural microbial communities (Pace,
1997). Methanotroph populations and community structure in different environments have been
examined using PCR (McDonald et al., 1995; Holmes et al., 1995; Henckel et al., 1999),
PCR/DGGE (Wise et al., 1999), and PCR/TRFLP (Costello and Lidstrom, 1999; Horz et al.,
2001) analyses. Fluorescence in situ hybridization (FISH) permits the direct enumeration of
individual cells in a sample and can provide quantitative information complimentary to DGGE
and sequence data. Methanotroph family specific probes have been used to identify and
enumerate methanotroph cells in estuarine sediment slurry enrichment cultures (Bourne et al.,
2000) and in rice paddy soils (Eller and Frenzel, 2001). Here, we report results of methanotroph
specific FISH, DGGE, and sequence analysis in a pelagic system. Combining molecular
approaches with rate assays may elucidate the relationship between methane oxidation activity

19
and methanotroph abundance and community structure (Auman et al., 2000; Eller and Frenzel,
2001; Carini et al., 2003).
METHODS
Sample Collection
Water samples were collected from 10-20 discrete depths near a permanently moored
buoy in the central basin of Mono Lake (station 6; 37° 57.822' N, 119° 01.305' W). Water
samples were obtained using a 5 L Niskin bottle and were stored appropriately (see below) for
methane oxidation rate, diversity, abundance, dissolved gas, and chemical analyses.
Limnology and Geochemistry
Temperature (°C) and density profiles over depth were measured using a Seabird SeaCat
profiler. Dissolved oxygen (O2) concentration was determined using a YSI O2 sensor.
Ammonium (NH4+) concentrations were determined using a phenol, hypochlorite method
(Solaranzo, 1969). Ammonium standards were prepared using filtered, helium (He) purged (to
remove NH3) Mono Lake water to account for matrix effects. In situ dissolved CH4
concentrations were determined using a headspace extraction – gas chromatography technique
(Oremland and Des Marais, 1983). Briefly, sub-samples (10 ml) from each Niskin bottle were
transferred, via gas tight syringe, to a 20 ml He purged headspace vial containing a NaOH pellet.
The base pellet served to arrest biological activity. To account for solubility effects, standards
were prepared using He purged filtered Mono Lake water treated identically as the samples.
Appropriate volumes of a certified standard (10% CH4 in balance of ultra-pure He: Scott
Specialty gas mix 875) were added to the standard bottles to achieve concentrations ranging from

20
1 to 80 µM. The CH4 concentration in samples and standards was quantified using a Shimadzu
14-A gas chromatograph equipped with a Porpak® T column and a flame ionization detector.
Methane Oxidation Rates
Methane oxidation rates were measured using a tritiated (3H) CH4 radiotracer technique
(Sandbeck and Reeburgh, 1989). Briefly, 10 ml gas tight syringes (n=3 live samples plus 1
filter-sterilized control per depth) were filled to overflowing at each depth with water from the
Niskin bottle. The syringes were sealed by inserting a plunger into the barrel and closing the hub
end with modified luer lock tips fitted with gas tight butyl rubber septa (Joye et al., 1999). A
C3H4 stock solution was prepared by equilibrating 38 ml of filtered, degassed, Mono Lake water
with 1 ml C3H4 in a gas tight serum bottle. A 100 to 200 µl aliquot of C3H4 tracer solution was
injected into each syringe through the butyl septa in the luer tip yielding a tracer activity of
~30,000 dpm/ml. Sample syringes were incubated at in situ temperature for 48 hours. Rates
were linear for over 48 hours (checked during time courses; data not shown). Incubations were
terminated by dispensing the contents of each syringe into a glass scintillation vial containing a
NaOH pellet, which served to halt biological activity. Labeled C3H4 was expelled by purging the
sample with water saturated CH4 (5 min.), vortexing, and venting the vials on a shaker table (50
rpm for 30 min.). Scintillation cocktail (Scintiverse BD, Fisher Scientific) was added and
samples were counted for 3H2O activity using a Beckman 6500 liquid scintillation counter.
Methane oxidation rate constants (k) were calculated (k = [α(A 3H2O / AC3H4 + A3H2O)] / t where
α = isotopic fractionation factor, A = activity, and t = time) and multiplied by in situ CH4
concentrations to determine methane oxidation rates.

21
Fluorescence In Situ Hybridization (FISH)
Oligonucleotide probes Mγ84, Mγ705, and Mα450 were used to detect Type I and Type
II methanotrophs, respectively (Eller et al., 2001). Probes were synthesized by MWG Biotech
(Ebersberg, Germany) and labeled with fluorochromes Oregon green (Mα450) and Texas Red
(Mγ84 and Mγ705). Sub-samples (10 ml) from each Niskin cast were fixed at room temperature
with 4% formaldehyde (in PBS) for 35 min then stored at -20°C until the hybridization reaction
(Pernthaler et al., 2001). Samples were thawed and mixed well, then 500 µl of sample was added
to a sterile centrifuge tube containing 15 ml PBS. The resulting mixture was filtered through a
0.2 µm polycarbonate membrane filter (Osmonics Inc). Typical Mono Lake methanotrophs
range in size from 0.5 – 3 um suggesting the retention of all methanotrophs in the sample. The
tube was then rinsed with PBS (2 x 15 ml) and this material was also passed through the filter to
assure that all cells were transferred to the filter. The filter was washed with 15-20 ml of sterile
water and allowed to air dry in a petri dish. Sections of individual filters were separated for
DAPI-only staining and dual hybridization with methanotroph probes and DAPI counter-
staining. Hybridization reactions were performed based on the technique of Pernthaler et al.
(2001) modified for optimum formamide concentrations (Eller and Frenzel, 2001). Filter sections
were rinsed in DI, air dried, and counterstained with DAPI (50 µl of 2 mg ml–1 per filter) for 3
min. Total microbial and hybridized methanotroph cells were counted using epifluorescence
microscopy by enumerating the cells in each of 40 squares in 50 randomly selected fields for
each sample (n=2000 grid squares per sample filter section). Total cell counts from the DAPI-
only stained filter sections and DAPI counts from counterstained, hybridized filters to verify that
no loss of cells from the filters occurred during hybridization. Images were obtained using
confocal laser scanning microscopy with a Leica TCS SP2 microscope, a 63x oil immersion lens,

22
and LCS software® capable of producing overlay images that illustrated simultaneous detection
of both type I and type II methanotrophs.
Statistical Methods
Spatial and temporal differences in CH4 oxidation rates were compared using two-sample
t-Tests assuming unequal variances (n = 3). Differences between types of methanotroph and
spatial and temporal methanotroph ell numbers derived from FISH data were compared using a
combination of ANOVA and Tukey’s analysis.
Cell Specific Methane Oxidation
Cell specific rates of CH4 oxidation were calculated by dividing the moles of CH4
oxidized per volume by the total number of methanotroph cells per volume as determined by
FISH at each depth.
DNA Collection and Extraction
Water samples for DNA extraction (1 to 4 liters) were collected from each Niskin cast
and stored in clean sample-rinsed polycarbonate bottles or LDPE cubitainers in a cooler (at 4°C)
until processing (within 4 hrs). Microorganisms were collected on a Sterivex filter cartridge
(0.22 µm; Millipore) and total community DNA was extracted from the filters (Ferrari and
Hollibaugh 1999). Briefly, after addition of 40 µl of lysozyme (50 mg ml –1), cartridges were
incubated for 60 min at 37°C. Then, 50 µl of proteinase K (20 mg ml –1) and 100 µl of SDS
(20% wt/vol) were added and the cartridges were incubated at 55°C for 2 h. The lysate was
transferred to 15 ml tubes and combined with 1 ml of lysis buffer that was used to rinse the
23
cartridge. DNA for community analysis was purified from 800 µl of lysate by sequential
extraction with 800 µl of phenol-chloroform-isoamyl alcohol (25:24:1), chloroform-isoamyl
alcohol (24:1) and finally n-butanol. The aqueous phase was removed, placed in a Centricon-
100 concentrator (Amicon), mixed with 500 µl of TE buffer (10 mM Tris, 1 mM EDTA [pH
8.0]), and centrifuged at 1,000 x g for 10 min. Then, 500 µl of TE was added to the Centricon
and it was centrifuged for another 10 min. Blanks were prepared from Sterivex cartridges
through which no water had been filtered.
PCR Amplification
Previously characterized oligonucleotide primers were used to examine patterns of
methanotroph community composition. Samples were screened to evaluate the presence or
absence of methane oxidizing bacteria using primer pairs MethT1dF / MethT1bR (Wise et al.,
1999) and F27 / type2b (Costello and Lidstrom, 1999) which target regions of 16S rDNA
specific for type I and type II methane-oxidizers, respectively. Methanotroph amplicons were
isolated by agrose electrophoresis. Bands with the correct electrophoretic mobility (compared to
bands generated using a 1 kb DNA ladder; Promega) were excised, purified (OIAquick Gel
Extraction Kit, Quiagen), and used as template for subsequent PCRs to produce amplicons
suitable for DGGE analysis. The primer pair 341f / 534r (Muyzer et al., 1993) was modified
with a GC clamp, labeled with fluoroscein, and used to amplify the variable 3 region of the
methanotroph template DNA (Murray et al., 1996). For all PCR reactions a “master mix” was
prepared containing sterile water, 1x buffer (Promega), 2.5 mM MgCl, 2 µM forward and
reverse primers, and 200 µM dNTPs. One hundred µl of the master mix was then dispensed into
individual 0.2 ml reaction tubes. Template DNA (4-10 ng) was added and after 5 min at 95° C in

24
the thermocycler (MJ Research DNA Engine®), 2.5 units of Taq DNA polymerase (Promega)
was added while the reaction tubes were held at 80° C. A touchdown thermal cycling program
(Don et al., 1991), optimized for initial and final temperature, was used for each of the primer
pairs and each PCR was run for 30 cycles. All reactions were run with type I (Methylococcus
capsulatus Bath, Methylobacter leuteus ACM 3304, Methylomicrobium album BG8, and
Methylomonas methanica S1) or type II (Methylosinus trichosporium OP3b and Methylocystis
parvus OBBP) culture extract as positive controls (obtained from The Savannah River Ecology
Lab culture collection via Dr. Mark Wise). Negative controls consisted of opposing type primer
sets and culture (i.e., type I primer pairs with type II culture template and vise versa). The PCR
product was verified for amplification and fragment size by agrose gel electrophoresis.
DGGE Analysis
DGGE analysis was performed using a CBS Scientific (Del Mar, CA) system (Ferrari and
Hollibaugh, 1999). Denaturing gels were 6.5% polyacrylamide with a denaturant gradient
ranging from 40 to 70%. The denaturants in a 100% solution were 40% deionized formamide
and 7M urea. PCR products were concentrated by ethanol precipitation and resuspended.
Samples (250 ng DNA) were mixed 1:1 with neutral loading dye and loaded onto the gel. Gels
were run at 80 V for 15 hrs in a 60° C, 1x TAE buffer and visualized on a Hitachi FMBIO III
scanner equipped for fluorescein detection. Multiple DGGE gels were run from independent
PCR reactions to confirm accurate band numbers and relative electrophoretic mobility for
community fingerprint analysis and for clones chosen for sequencing. True replicate analysis
from separate filters was not conducted. However, the samples collected from 3 discrete depths
in February may be viewed as replicates by proxy due to the homogeneity of the mixolimnion

25
during this sampling. DGGE patterns for both families of methanotrophs were identical for all
depths suggesting no sampling bias.
Cloning and Phylogenetic Analysis
Samples from Feb 2002 (13 m) and June 2002 (13 m) contained all the major bands
observed in both Type I and Type II methanotroph DGGE analyses from bulk water samples and
were chosen to generate clone libraries. PCR products from both MethT1dF / MethT1bR and
F27 / type2b primer pairs were isolated by agarose gel electrophoresis, extracted from the agrose
(QIAquick® Gel Extraction Kit; Qiagen), purified using Wizard® PCR preps (Promega), ligated
into pCR4-TOPO plasmid vector (Invitrogen), and transformed into chemically competent
One Shot TOP10 E. coli cells (Invitrogen). Transformed cells were plated on Luria-Bertani
(LB) plates (n=2 for each methanotroph type) containing ampicilin (100 µg ml-1) and incubated
overnight at 37°C. Forty colonies were chosen at random from each of the 4 plates, and cultured
(overnight at 37°C) in 3 ml of LB medium containing ampicilin (100 mg ml–1).
PCR / DGGE analysis was used to identify unique clones for sequencing. Bands from
specific clones were cut out, re-amplified with the PCR, and re-run using DGGE. Cut out bands
that did not have the same electrophoretic mobility as the original bands (based on multiple lanes
of standard distributed across the gel) or re-PCRs that produced more than 1 DGGE band were
discarded.
Six type I and 11 type II methanotroph clones had DGGE mobility that corresponded to
bands of interest observed on DGGE gels from bulk water samples and these clones were chosen
for sequencing. Plasmid DNA containing PCR products from both MethT1dF / MethT1bR and
F27 / MethT2R primer pairs from selected clones was extracted and purified using a QIAprep®

26
spin Miniprep Kit (Quiagen). DNA sequencing was carried out by the Molecular Genetics
Instrumentation Facility (MGIF) at the University of Georgia. Plasmids were sequenced using
the primer M13 forward, which resulted in the retrieval of the entire 883 bp (Type I) or 902 bp
(Type II) fragment sequence. Sequences were then compared to known sequences using BLAST
(National Center for Biotechnology Information). Sequences from the data library exhibiting the
highest similarities (closest relatives) were aligned with clone sequences using the Genetics
Computer Group (GCG) package (Madison Wisc.) Phylogenetic trees were constructed using
the neighbor-joining method and Jukes-Cantor distances (PHYLIP package v. 3.5).
RESULTS
Three depths, 13, 15, and 23 m, were selected for detailed analysis based on geochemical
and CH4 oxidation activity data. These depths represent discrete zones of aerobic methanotrophy
are associated with changing geochemical regimes due to seasonal stratification. Three time
points were selected: February, April, and June 2002. These time points marked the temporal
transition from well mixed to stratified conditions.
Limnology and Geochemistry
In February the Mono Lake water column was divided into two distinct layers. Anoxic
bottom water was separated from the oxygenated upper water column by a sharp pycnocline at
26 m. The upper layer was well mixed and dissolved O2 concentrations > 5 mg l–1 persisted to
the pycnocline (Fig. 2.1). CH4 and NH4+ concentrations were generally less than 1 µM in the
mixed layer but increased sharply at the pycnocline.

27
The development of thermal stratification was evident in April (Fig. 2.1). The oxycline
separated and migrated upwards from the pycnocline creating a microaerophilic zone between
15-16 m. Dissolved O2 decreased to zero between 16 and 17 m creating a seasonal anoxic zone
that extended to the pycnocline (Fig. 2.1). The CH4 concentrations were twice as high in the
upper water column and oxycline regions compared to February. In the seasonally anoxic zone,
CH4 concentrations increased 4 to 6 fold and concentrations remained high (~60 µM) below the
pycnocline. NH4+ concentrations remained low in the upper water column but increased in the
seasonally anoxic zone (Fig. 2.1).
Stratification progressed into June with the oxycline becoming sharper and more defined
at 12 m. The microaerophilic zone broadened, shifted up slightly in the water column, and
encompassed an area between 12 and 15 m. June CH4 and NH4+ concentrations in the upper
water column were similar to concentrations measured in April. Concentrations in the seasonally
anoxic and microaerophilic zones continued to increase suggesting greater flux of these reduced
species across the gradient created at the oxycline (Fig. 2.1).
Methane Oxidation Activity
CH4 oxidation activity was observed throughout the Mono Lake water column during the
entire course of the study (anaerobic CH4 oxidation rates are presented elsewhere; Joye et al. in
preparation). However, methanotroph activity at discrete depths varied significantly over time
(paired t-Tests; with the exception of 13 and 15m in February all p < 0.01). In February, low
rates (1-2 nmol l-1 day–1; hereafter denoted as nM day-1) of CH4 oxidation were uniformly
distributed throughout the mixolimnion with the exception of a zone of higher activity (3-5 nM
day–1) between 22 and 24 m (Fig. 2.2). By April CH4 oxidation rates increased at 13 m and 15 m

28
(from 1 to 5 nM day-1 and 2 to 123 nM day-1, respectively). Aerobic CH4 oxidation ceased below
20 m due to a lack of molecular O2 (Fig. 2.2). As stratification progressed into June, the zone of
peak activity migrated upwards in the water column coincident with the microaerophilic zone at
the base of the oxycline. The highest rate of CH4 oxidation remained at 15 m (87 nM day–1) but
also increased at 13 m by a factor of 6 compared to April rates (Fig. 2.2).
Methanotroph Abundance and Distribution
Probes Mγ84, Mγ705, and Mα450 are specific and detect all known type I and type II
methanotrophs (Eller et al., 2001). Due to the unique chemistry of Mono Lake water, a variety of
tests were conducted using various methanotroph cultures added to bulk water samples to
confirm the performance and specificity of the probes and to optimize dual hybridization
conditions. The combination of these probes demonstrated simultaneous identification of both
type I and type II methanotrophs (data not shown). The fluorescence intensity of bound probes
allowed methanotroph cells to be easily distinguished from background- and auto-fluorescence
in Mono Lake samples. Hybridization with non-sense probe NON338 indicated no non-specific
probe binding under optimized hybridization conditions (data not shown). Both type I and type
II specific probes hybridized with cells collected from Mono Lake bulk water samples.
FISH analysis revealed relatively stable numbers of both populations of methanotrophs at
all sample depths. Type I methanotrophs were more abundant (ANOVA, p <0.05) in almost all
(>95%) samples examined (Fig. 2.3). Type I cell counts ranged from 5-9 x 10 5 cells ml–1 and
they accounted for 3 to 5% of the total microbial community. Type II methanotrophs were less
abundant throughout the water column with cell numbers ranging between 1.5-3.5 x 10 5 cells

29
ml–1, accounting for about 2 % of the microbial community (Fig. 2.3). Absolute methanotroph
cell numbers did not vary significantly between depths over time (ANOVA, p > 0.05; Table 1).
Cell Specific Methane Oxidation
Rates of CH4 oxidation calculated on a per cell basis were extremely low compared to
rates calculated in culture and various environments. In February cell specific rates were 9-25 x
10-5 fmol CH4 cell-1 hr-1. In zones of high activity in April (15 m) and June (13 and 15 m) cell
specific oxidation ranged from 0.5-6.0 x 10⁻³ fmol CH4 cell-1 hr-1 (Table 2.1).
Methanotroph Community Analysis and Phylogeny
PCR amplification of 16S rDNA with type I and type II methanotroph specific primers
consistently yielded products in all samples (data not shown) confirming that both families of
methanotrophs were present at all sample depths. Subsequent DGGE analyses revealed diverse
communities of both type I and type II methanotrophs.
In February, bulk water samples produced identical banding patterns at all depths
consistent with a well-mixed water column (Figs. 2.4 and 2.5). The major bands obtained from
amplifications using the type I primer set (TI-317 and TI-34) were related to sequences from
Methylococcus and Methylomicrobium spp. respectively (Fig. 2.4; accession nos. X72771 and
D89279). Minor bands were closely related to major bands displaying similar electrophoretic
mobility with the exception of band T1-316 that was most closely related to an uncultured γ-
Proteobacteria and Dechloromarinus chlorophilius (Fig. 2.6). DGGE banding patterns
generated from April and June samples suggested changes in type I methanotroph community
structure over time and between depths. The banding pattern in samples from 23 m remained
30
relatively constant over time while a general trend of decreasing diversity was apparent at 13 and
15 m (Fig. 2.4). Band T1-316 became more prominent at 15 m in April and at 13 m in June
while bands T1-38 and T1-712 were less evident in April and absent in June.
Banding patterns generated using the type II primer set also demonstrated changes in
community structure over time. In February, identical banding patterns occurred at all depths in
the mixolimnion (Fig. 2.5). Major bands T2-38 and T2-39 were most closely related to a
Methylobacterium spp. (accession no. D32236) while T2-32 and T2-36 were most closely related
to Methylosinus spp. (accession nos. AJ458474 and Y18947 respectively). Minor bands were
most closely related to Methylosinus spp. with the exception bands T2-29 and T2-25 that were
related to sequences from Methylobacterium and Rhodobaca spp. respectively (Fig. 6; accession
nos. D32236 and AF384205). The number of bands decreased at all depths in April and at 15
and 23 m in June. These changes in banding patterns consisted mainly of the disappearance of
band T2-25 and T2-31. However, diversity appeared to increase at 13 m in June with the
appearance of bands T2-38, T2-29, T2-34, and the reappearance of band T2-31 (Fig. 2.5). Our
sequence data have been submitted to the GenBank database under accession numbers
AY682725-AY682741.
DISCUSSION
The data gathered during this study support three major conclusions:
1. CH4 oxidation rate and geochemical measurements demonstrated that zones of peak CH4
oxidation activity migrated through the water column during seasonal stratification and
consistently occurred in the microaerophilic zone at the bottom of the oxycline.

31
2. Methanotroph abundance determined by FISH analysis revealed a stable number of both
type I and type II methanotrophs at all sample depths over the course of the study.
3. The combination of rate measurements, FISH analysis, and DGGE community profiles
suggest that changes in activity and/or ratios of sub-sets of the existing methanotroph
population, rather than a change in overall methanotroph numbers, drove the observed
shifts in zones of elevated CH4 oxidation.
Patterns of CH4 Oxidation Activity
Aerobic CH4 oxidation activity in Mono Lake exhibited spatial and temporal variation
consistent with previous results from Mono Lake (Joye et al., 1999) and other alkaline and/or
hypersaline lakes (Iverson et al., 1987; Khmelenina et al., 2000). Rates of aerobic CH4 oxidation
ranged from 2-123 nM day –1 (Fig. 2.2). These rates were greater than rates observed in marine
environments such as the Black Sea (Reeburgh et al., 1991), the Southern California Bight
(Ward and Kilpatrick, 1993), and the Eel River Basin (Valentine et al., 2001) which are
generally < 1nM day-1. Maximum aerobic CH4 oxidation rates in seasonally stratified freshwater
lakes have been observed to be 10-100 fold higher (Rudd et al., 1974; Harrits and Hanson,
1980). Patterns of CH4 oxidation in Mono Lake demonstrated zones of high methanotrophic
activity in sub-oxycline microaerophilic zones, similar to findings in stratified lake water
columns (Rudd et al., 1974; Rudd and Hamilton, 1978; Harrits and Hanson, 1980; Joye et al.,
1999). The microaerophilic zones had O2 concentrations ≤ 2 mg l-1 and were coincident with a
distinct CH4 gradient (Rudd et al., 1974; Rudd and Hamilton, 1978; Harrits and Hanson, 1980).
The migration of the microaerophilic zone through the Mono Lake water column during seasonal
stratification exposed discrete depths to comparable O2 concentrations (< 2 mg l-1) and gradients

32
of CH4. Elevated rates of CH4 oxidation in Mono Lake were associated with these geochemical
conditions (Fig. 2.2).
Zones of increased CH4 oxidation in the water column of lakes during summerlake may
result from accumulation of methanotrophic bacterial biomass at a specific depth (Rudd et al.,
1974; Harrits and Hanson, 1980). Increased methanotroph abundance has correlated with higher
CH4 oxidation rates in soils and freshwater sediments (Bender and Conrad, 1994; Henckel et al.,
2000). However, the molecular data presented here suggests that absolute methanotroph
abundance in Mono Lake is stable over time. Therefore, the changes in activity that were
observed are hypothesized to have resulted from increased activity of a sub-set of the existing
methanotroph population and that higher CH4 oxidation rates were induced by changes in the
local geochemical regime. Unfortunately, we cannot determine which fraction of the population
increased their activity but it is clear from FISH and DGGE data that the bulk response stemmed
from a sub-set of the population rather than an overall increase in methanotroph biomass.
Stability of Methanotroph Cell Numbers and Cell Specific CH4 Oxidation
The FISH data demonstrated that methanotroph numbers in Mono Lake did not change
significantly over time (Table 2.1). The spatial and temporal stability of methanotroph cell
numbers observed throughout the mixolimnion would require that Mono Lake methanotrophs
tolerate variable and dynamic geochemical conditions. Methanotroph populations at discrete
depths were exposed to a wide range of CH4 (< 1-10 µM) and O2 (0-8 mg l-1) concentrations as
well as temperature (2-20°C). In February, the mixolimnion exhibited the lowest CH4 oxidation
rates (Fig. 2.2). Low CH4 activity resulted from high dissolved O2 concentrations, low
temperatures, and low CH4 concentrations (Hanson and Hanson, 1996; Fig. 2.1). Low CH4

33
concentrations (< 5 µM) resulting in negligible CH4 oxidation rates may decrease methanotroph
numbers via energy limitation (Harrits and Hanson, 1980).
However, stable numbers of methanotroph cells were observed throughout the Mono
Lake water column regardless of local geochemical conditions or CH4 oxidation activity
suggesting that methanotroph populations were maintained even under the adverse conditions
typical of winter in Mono Lake (Fig. 2.3). Methanotrophs adapted to low in situ CH4
concentrations are found in many natural environments (Bender and Conrad, 1994), suggesting
that they may persist even when CH4 is limiting. Such persistence assures that the
methanotrophic population is subsequently able to take advantage of favorable geochemical
regimes when such conditions occur locally during stratification.
A stable population of methanotrophs throughout the Mono Lake water column also
requires aerobic methanotrophs to survive periods of seasonal anoxia at depth in the
mixolimnion. Methanotrophs can tolerate periods of anoxia. Anoxic peat and anoxic sediment
subsequently incubated under oxic conditions displayed immediate and substantial potential for
aerobic CH4 oxidation (King et al., 1990). The lack of O2 and associated oxygen radicals and
peroxides may make exposure to anaerobic conditions less stressful to aerobic methanotrophs
than starvation (King, 1996). Constant methanotroph cell numbers at 23 m during anoxic
conditions in April and June demonstrated that aerobic methanotrophs may persist in seasonally
anoxic zones in Mono Lake. Constant numbers of methanotroph cells persisted in anoxic rice
paddy soils where no aerobic methanotrophic growth or activity was possible leading the authors
to hypothesize that methanotrophs persisted for extended periods as vegetative cells in a state of
anaerobic dormancy (Eller and Frenzel, 2001).

34
Methanotroph cell numbers also remained constant in the upper water column even in
zones of increased CH4 oxidation rates demonstrating that cell numbers were not driven by
increased activity (or vise versa). Based on our observations and those cited above, we
hypothesize that stable numbers of methanotrophs are maintained throughout the mixolimnion of
Mono Lake via physiological adaptation to chronically low CH4 concentrations in the upper
water column and the ability to survive periods of anoxia in deeper, seasonally anoxic waters.
Cell specific CH4 oxidation rates calculated for the Mono Lake methanotroph population
provide a compelling reason for methanotrophs to adopt a strategy of maintaining a stable
population that persists through time rather than growing in under favorable conditions. In
culture, reports of methanotroph cell specific CH4 oxidation averaged ~0.2 fmol cell-1 hr-1
(Hanson and Hanson, 1996). In soils and freshwater sediments, cell specific rates calculated for
viable cells agreed well with rates obtained in cultures ranging from 0.2 to 0.3 fmol cell-1 hr-1
(Bender and Conrad, 1994). Cell specific rates in Mono Lake were extremely low (2-3 orders of
magnitude lower than rates reported for cultures; Table 1). Given relatively slow
chemoautotrophic growth rates and the observed cell specific CH4 oxidation rates cited above,
methanotroph populations in Mono Lake would be unable to “grow in” in time to take advantage
of favorable geochemical conditions that appear on a time scale of days - weeks during seasonal
stratification.
Methanotroph Distribution and Community Analysis
Surprisingly, both type I and type II families contributed to the methanotroph abundance
observed in Mono Lake (Fig. 2.3). Type I methanotrophs have been described as the exclusive
or dominant methanotrophs observed in marine, estuarine, and hypersaline environments

35
(Holmes et al., 1996; Bourne et al., 2000; Khmelenina et al., 2000). Although type II
methanotrophs are reported to be a significant component of the methanotroph populations in
freshwater sediments (Costello and Lidstrom, 1999), peat bogs (Deydysh et al., 2000), and rice
paddy soils (Henckel et al., 1999; Eller and Frenzel, 2001), these organisms have not been
observed in saline environments. The FISH data presented here demonstrates that type II
methanotrophs comprise a substantial fraction of the total methanotroph population in the Mono
Lake water column, illustrating that ecotypes of type II methanotrophs may be adapted to saline
habitats. Presumptive evidence that type II methanotrophs were present in a marine enrichment
cultures has been reported recently (Rockne and Strand, 2003). Those results, along with our
observations, suggest that type II methanotrophs may be more common in saline habitats than
previously thought.
Community profiles from DGGE analysis indicated a dynamic population of type I and
type II methanotrophs. A general trend of decreasing diversity in type I methanotrophs occurred
at certain sample depths during the course of stratification. A Methyloccocus-like sp. became a
more dominant component of the population in zones of high CH4 oxidation activity (Figs. 2.2
and 2.4). This suggests that Methylococcus-like species may have out competed other species
under geochemical conditions associated with increased methanotrophic activity such as low O2
tension and increased CH4 flux. Type II methanotrophs also demonstrated changes in diversity.
However, no general trend was apparent and changes in diversity were not associated with
changes in activity (Figs. 2.2 and 2.5). Similar results were obtained in rice paddy soils where a
change in type I methanotroph community structure was associated with changes in CH4
oxidation while type II community composition did not correlate directly with in situ activity
(Eller and Frenzel, 2001).

36
The species-level shifts in type I methanotroph community structure in response to the
changing environmental conditions observed were associated with increased CH4 oxidation rates.
Methylococcus-like species appeared to be better adapted to take advantage of favorable
geochemical conditions. Whether the increased dominance of the Type-I methanotroph
community by Methylococcus-like species resulted from their ability to out-compete other
methanotrophs for substrates (e.g., O2 or CH4) or because they are more efficient energetically
and hence, grow faster, is presently unknown. Laboratory experiments are underway to evaluate
how geochemical factors influence the community composition of aerobic methanotrophs in
Mono Lake.
LITERATURE CITED
Abrams, E.S. and V.P. Stanton Jr. 1992. Use of denaturing gradient gel electrophoresis to study
conformational transitions in nucleic acids. Meth. In Enzym. 212:71-104.
Anthony, C. 1982. The biochemistry of methylotrophs. Academic Press Inc., London.
Auman, A.J., S. Stolyar, A.M. Costello, and M.E. Lidstrom. 2000. Molecular characterization of
methanotroph isolates from freshwater lake sediment. Appl. Environ. Microbiol.
66:5259-5266.
Auman, A.J., C.C. Speake, and M.E. Lidstrom. 2001. nifH sequences and nitrogen fixation in
type I and type II methanotrophs. Appl. Environ. Microbiol. 67:4009-4016.
Bourne, D.G., A.J. Holmes, N. Iverson, and J.C. Murrell. 2000. Fluorescent Oligonucleotide
rDNA probes for specific detection of methane oxidizing bacteria. FEMS Microbiol.
Ecol. 31:29-38.
37
Bender, M., and R. Conrad. 1994. Methane oxidation activity in various soils and freshwater
sediments: Occurrence, characteristics, vertical profiles, and distribution on grain size
fractions. J. Geophys. Res. 99:16531-16540.
Carini, S., B. Orcutt, and S.B. Joye. 2003. Interactions between methane oxidation and
nitrification in coastal sediments. Geomicrobiol. J. 20:355-374
Cicerone, R.J., and R.S. Oremland. 1988. Biogeochemical aspects of atmospheric methane.
Global Biogeochem. Cycles. 1:61-86.
Costello, A.M., and M.E. Lidstrom. 1999. Molecular characterization of functional and
Phylogenetic genes from natural populations of methanotrophs in freshwater sediments.
Appl. Environ. Microbiol. 65:5066-5074.
Deydysh, S.N., W. Liesack, V.N. Khmelenina, N.E. Suzina, Y.A. Trorsenko, J.D. Semrau, A.M.
Bares, N.S. Panikov, and J.M. Tiedje. 2000. Methylocella palustrtris gen. nov., sp. nov., a
new methane-oxidizing acidophilic bacterium from peat bogs, representing a novel
subtype of serine-pathway methanotrophs. Int. J. Syst. Evol. Microbiol. 50:955-969.
Don R. H., P.T. Cox, B.J. Wainwright, K. Baker, and J.S. Mattick. 1991 'Touchdown' PCR to
circumvent spurious priming during gene amplification. Nucleic Acids Res. 19:4008.
Egert, M. and M.W. Friedrich. 2003. Formation of pseudo-terminal restriction fragments, a PCR
bias affecting terminal restriction fragment length polymorphism analysis of microbial
community structure. Appl. Environ. Microbiol. 69:2555-2562.
Eller, G. and P. Frenzel. 2001. Changes in activity and community structure of methane-
oxidizing bacteria over the growth period of rice. Appl. Environ. Microbiol.
67:2395–2400.

38
Eller, G., S. Stubner, and P. Frenzel. 2001. Group specific 16S rRNA targeted probes for the
detection of type I and type II methanotrophs by fluorescence in situ hybridization.
FEMS Microbiol. Lett. 198:31-37.
Ferrari, V.C., and J.T. Hollibaugh. 1999. Distribution of microbial assemblages in the central
Arctic Ocean basin studied by PCR/DGGE: analysis of a large data set. Hydrobiologia
401:55-68.
Graham, D.W., J.A. Chaudhary, R.S. Hanson, and R.G. Arnold. 1993. Factors affecting
competition between type I and type II methanotrophs in continuous flow reactors.
Microb. Ecol. 25:1-17.
Hanson, R.S. and T.E. Hanson, 1996. Methanotrophic bacteria. Microbiol. Rev. 60, pp. 439-471.
Harrits, S.M., and R.S. Hanson. 1980. Stratification of aerobic methane-oxidizing organisms in
Lake Mendota, Wisconsin. Limnol. Oceanogr. 25:412-421.
Henckel, T., M. Friedrich, and R. Conrad. 1999. Molecular analysis of the methane-oxidizing
microbial community in rice field soil by targeting the genes of the 16s rRNA, particulate
methane monooxygenase, and methanol dehydrogenase. Appl. Environ. Microbiol. 65:
1980-1990.
Henckel, T. M., U. Jackel, S. Schnell, and R. Conrad. 2000. Molecular analysis of novel
methanotrophic communities in forest soil that oxidize atmospheric methane. Appl.
Environ. Microbiol. 66: 1801-1812.
Holmes, A.J., N.J.P. Owens, and J.C. Murrell. 1995. Detection of novel marine methanotrophs
using phylogenetic and functional gene probes after methane enrichment. Microbiology (UK)
141:1947-1955.
39
Holmes, A.J., N.J.P. Owens, and J.C. Murrell. 1996. Molecular enrichment cultures of marine
methane oxidizing bacteria. J Exp. Mar. Biol. Ecol. 203:27-38.
Horz, H.P., M.T. Yimga, and W. Liesack. 2001. Detection of methanotroph diversity on roots of
submerged rice plants by molecular retrieval of pmoA, mmoX, mxaF, and 16S rRNA and
ribosomal DNA, including pmoA-based terminal restriction fragment length
polymorphism profiling. Appl. Environ. Microbiol. 67:4177-4185.
Iverson, N., R.S. Oremland, and M.J. Klug. 1987. Big Soda Lake (Nevada). 3. Pelagic
methanogenesis and anaerobic methane oxidation. Limnol. Oceanogr. 32:804-814.
Joye, S. B., T.L. Connell, L. G. Miller, R.S. Oremland and R. S. Jellison. 1999. Oxidation of
ammonia and methane in an alkaline, saline lake. Limnol. Oceanogr. 44: 178-188.
Khmelenina, V.N., B. Eshinimaev, M.G. Kalyuzhnaya, and Y.A. Trotsenko. 2000. Potential
activity of methane and ammonium oxidation by methanotrophic communities from the
soda lakes of Southern Transbaikal. Mikrobiologiya (English translation) 69:460-465.
King, G.M. 1996. Physiological limitations of methanotrophic activity in situ, p. 17-32. In J.C.
Murrell and K.P. Kelly (ed.), Microbiology of atmospheric trace gases: sources, sinks,
and global change processes, Springer-Verlag, Berlin.
King, G.M., H. Skovgaard, and P. Roslev. 1990. Methane oxidation in sediments and peats of a
sub-tropical wetland, the Florida Everglades. Appl. Environ. Microbiol. 56:2902-2911.
McDonald, I.R., E.M. Kenna, and J.C. Murrell. 1995. Detection of methanotrophic bacteria in
environmental samples with the PCR. Appl. Environ. Microbiol. 61:116-121.
Moeseneder, M.M., J.M. Arrieta, G. Muyzer, C. Winter, and G. Herndl. Optimization of
terminal-restriction fragment length polymorphism analysis for complex marine

40
bacterioplankton communities and comparison with denaturing gradient gel
electrophoresis. Appl. Environ. Microbiol. 65:3518-3525.
Murray, A.E., J.T. Hollibaugh, and C. Orrego. 1996. Phylogenetic compositions of
bacterioplankton from two California estuaries compared by denaturing gradient gel
electrophoresis of 16S rDNA fragments. Appl. Environ. Microbiol. 62:2676-2680.
Murrell, J.C., and H. Dalton. 1983. Nitrogen fixation in obligate methanotrophs. J. Gen.
Microbiol. 129:3481-3486.
Muyzer, G., E.C.D. Wall, and A.G. Uitterlinden. 1993. Profiling of complex microbial
populations by denaturing gradient gel electrophoresis analysis of PCR-amplified genes
coding for 16s rRNA. Appl. Environ. Microbiol. 59: 695-700.
Oremland, R.S. and D.J. Des Marais. 1983. Distribution, abundance, and carbon isotopic
composition of gaseous hydrocarbons in Big Soda Lake, Nevada – an alkaline,
meromictic lake. Geochim. Cosmochim. Acta 47:2107-2114.
Pace, N.R. 1997. A molecular view of microbial diversity and the biosphere. Science 276:734-
740.
Pernthaler, J., F.O Glöckner, W. Schönhuber, and R. Amann. 2001. Fluorescence in situ
hybridization (FISH) with rRNA-targeted Oligonucleotide probes, p. 207-226. In J. Paul
(ed.), Methods in Microbiology: Marine Microbiology, Vol. 30, Academic Press Ltd.,
San Diego.
Reeburgh, W. S., S. C. Whalen, and M. J. Alperin. 1993. The role of methylotrophy in the global
methane budget, p. 1–14. In J. C. Murrell and D. P. Kelly (ed.), Microbial growth on C1
compounds. Intercept Ltd, Andover, United Kingdom.

41
Reeburgh, W. S., B.B. Ward, S.C. Whalen, K.A. Sandbeck, K.A. Kilpatrick, and L.J. Kerkhof.
1991. Black Sea methane geochemistry. Deep-Sea Res. 38:S1189-S1210.
Rockne, K.J and S.E. Strand. 2003. Amplification of marine methanotrophic enrichment DNA
with 16S rDNA PCR primers for type II α Proteobacteria methanotrophs. J. Environ.
Scien. Health. 38:1877-1887.
Rudd, J.W., and R.D. Hamilton. 1978. Methane cycling in a eutrophic shield lake and its effects
on whole lake metabolism. Limnol. Oceanogr. 23:337-348.
Rudd, J.W., R.D. Hamilton, and N.E. Campbell. 1974. Measurement of microbial oxidation of
methane in lake water. Limnol. Oceanogr. 19:519-524.
Sandbeck, K.A. and W.S. Reeburgh. 1989. Microbiological preparation of H-3-labelled methane.
J. Labeled Compound. Rad. 27:1285-1291.
Solaranzo, L. 1969. Determination of ammonia in natural waters by the phenol hypochlorite
method. Limnol. Oceanogr. 14:799-801.
Topp, E. and R.S. Hanson. 1991. Metabolism of radiatively important trace gases by methane-
oxidizing bacteria, p. 71-90. In J.E. Rogers and W.B. Whitman (ed.), Microbial
production and consumption of greenhouse gases: methane nitrogen oxides, and
halomethanes. American Society for Microbiology, Washington, D.C.
Valentine, D.L., D.C. Blanton, W.S. Reeburgh, and M. Kastner. 2001. Water column methane
oxidation adjacent to an area of active hydrate dissociation, Eel River Basin. Geochim.
Cosmochim. Acta 65:2633-2640.
Ward, B.B. and K.A. Kilpatrick. 1993. Methane oxidation associated with mid depth methane
maxima in the Southern California Bight. Cont. Shelf Res. 13:1111-1122.

42
Williams, W. D. 2002. Environmental Threats to salt lakes and the likely status of inland saline
ecosystems in 2025. Environ Conserv. 29:154-167.
Wise, M.G., J.V. McArthur, and L.J. Shimkets. 1999. Methanotroph diversity in landfill soil:
isolation of novel type I and type II methanotrophs whose presence was suggested by
culture-independent 16S ribosomal DNA analysis. Appl. Environ. Microbiol. 65:4887-
4897.
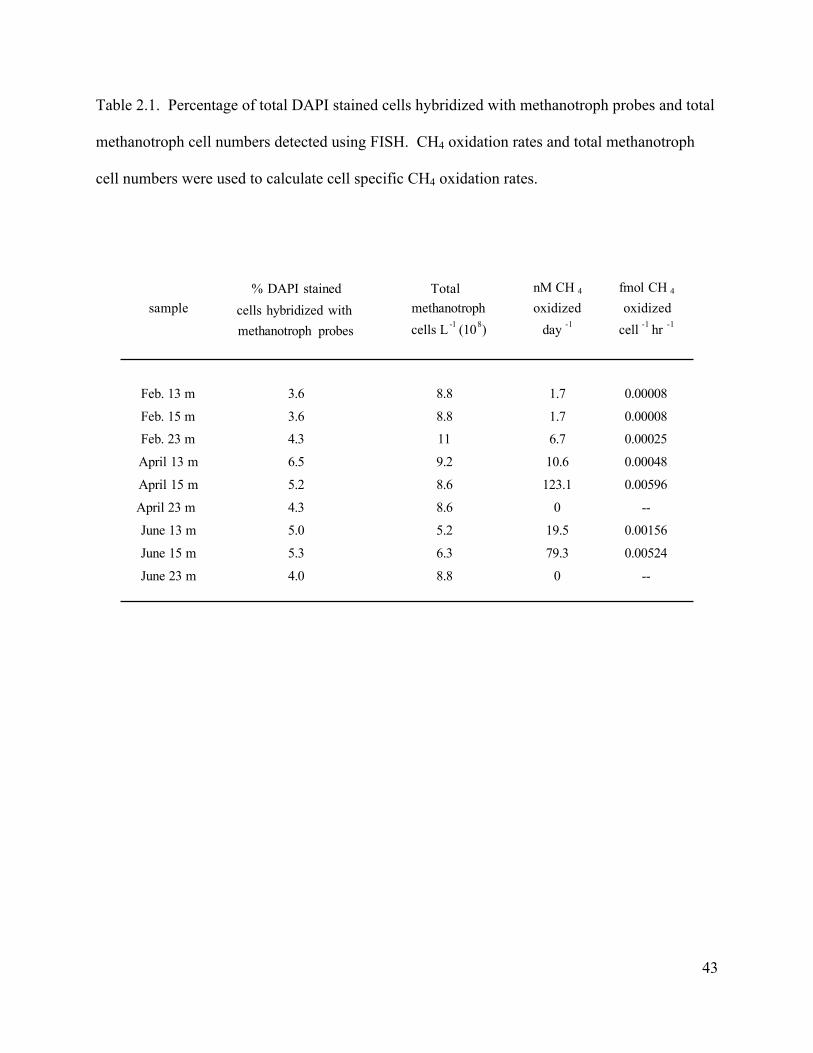
43
Table 2.1. Percentage of total DAPI stained cells hybridized with methanotroph probes and total
methanotroph cell numbers detected using FISH. CH4 oxidation rates and total methanotroph
cell numbers were used to calculate cell specific CH4 oxidation rates.
% DAPI stained Total nM CH 4 fmol CH 4
sample cells hybridized with methanotroph oxidized oxidized
methanotroph probes cells L -1 (108) day -1 cell -1 hr -1
Feb. 13 m 3.6 8.8 1.7 0.00008
Feb. 15 m 3.6 8.8 1.7 0.00008
Feb. 23 m 4.3 11 6.7 0.00025
April 13 m 6.5 9.2 10.6 0.00048
April 15 m 5.2 8.6 123.1 0.00596
April 23 m 4.3 8.6 0 --
June 13 m 5.0 5.2 19.5 0.00156
June 15 m 5.3 6.3 79.3 0.00524
June 23 m 4.0 8.8 0 --

44
FIGURE LEGENDS
Figure 2.1. Vertical profiles of CH4, O2, NH4+, and temperature in Mono Lake for (A) February,
(B) April, and (C) June 2002.
Figure 2.2. Vertical profiles of CH4, O2, and CH4 oxidation rates (nM day-1) in Mono Lake for
(A) February, (B) April, and (C) June 2002.
Figure 2.3. Cell counts of total DAPI stained cells, type I methanotroph cells, and type II
methanotroph cells in Mono Lake for (A) February, (B) April, and (C) June 2002. Error bars
represent the SD of the mean.
Figure 2.4. Representative DGGE banding pattern obtained from Mono Lake bulk water
samples using type I methanotroph specific primers. Bands that corresponded to DGGE bands
produced by individual clones that were subsequently sequenced are indicated.
Figure 2.5. Representative DGGE banding pattern obtained from Mono Lake bulk water
samples using type II methanotroph specific primers. Bands that corresponded to DGGE bands
produced by individual clones that were subsequently sequenced are indicated.
Figure 2.6. Phylogenetic relationship of type I and type II methanotroph 16S clone sequences
from the Mono Lake water column. The tree was constructed using the neighbor-joining method
and Jukes-Cantor distances. Bootstrap values > 50% (100 iterations) are indicated at the
appropriate nodes. The scale bar represents 5% sequence divergence

45
Figure 2.1.

46
Figure 2.2.
0 10 20 30 40 50 60
0 20 40 60 80 100 120
0
5
10
15
20
25
30
0 10 20 30 40 50 60
0 20 40 60 80 100 120
0 10 20 30 40 50 60
0 20 40 60 80 100 120
0 2 4 6 8 100 2 4 6 8 10 0 2 4 6 8 10
CH4 CH4 oxidation rateO2
A. B. C.O2 (mg L-1) O2 (mg L-1) O2 (mg L-1)
CH4 (µM) CH4 (µM) CH4 (µM)
nM CH4 day-1 nM CH4 day-1 nM CH4 day-1
depth (m)

47
Figure 2.3
A. B. C.
DAPI stained cells (106) Type I methanotroph cells (105) Type II methanotroph cells (105)
0
5
10
15
20
25
13 m 15 m 23 m 13 m 15 m 23 m 13 m 15 m 23 m

48
Figure 2.4.
13m 15m 23m 13m 15m 23m 13m 15m 23m
February A p r i l June
T1-34
T1-317
T1-316
T1-313
T1-712
T1-38
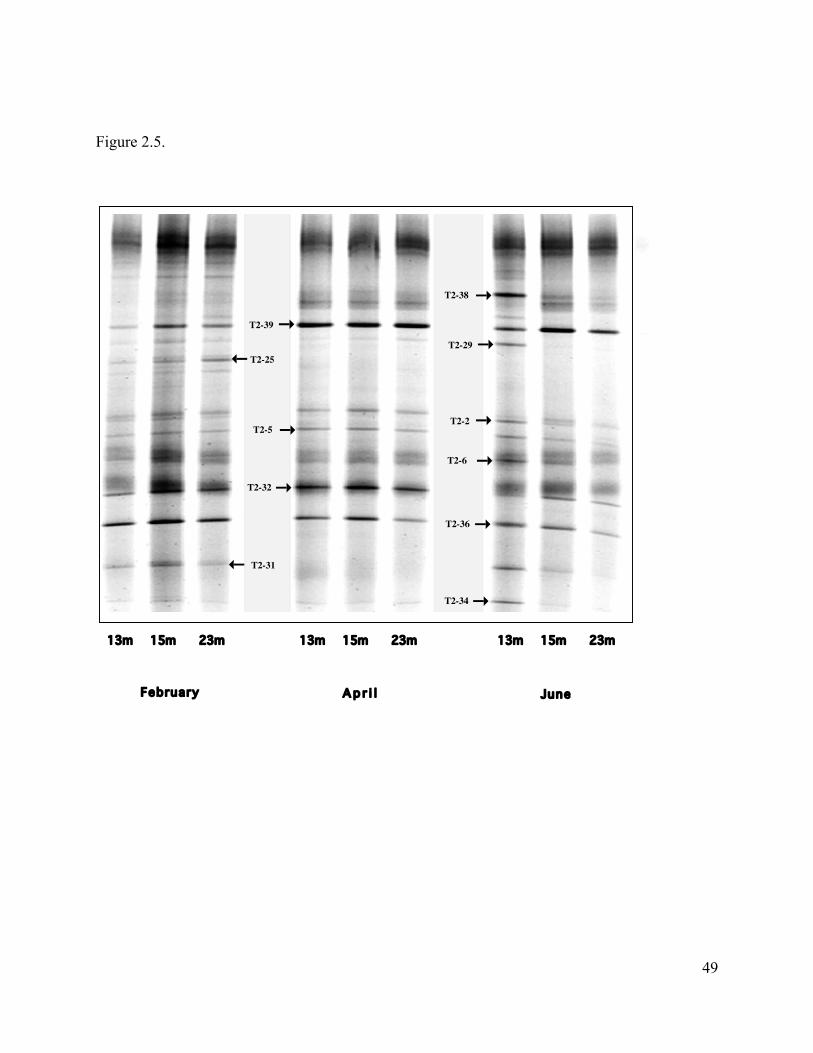
49
Figure 2.5.
T2-38
T2-34
T2-36
T2-31
T2-32
T2-6
T2-2T2-5
T2-25T2-29
T2-39
13m 15m 23m 13m 15m 23m 13m 15m 23m
February A p r i l June

50
Figure 2.6.

51
CHAPTER 3
NITRIFICATION IN MONO LAKE, CA: INTERANNUAL VARIATIONS IN RATES AND A
POSSIBLE ROLE FOR ARCHAEAL AMMONIA OXIDIZERS1
_______________________
1 Carini, S.A. and S.B. Joye. Prepared for submission to Applied and Environmental Microbiology

52
ABSTRACT
Patterns of geochemical variables, nitrification rates, and the associated ammonia oxidizer
microbial community were investigated between August 2002 and August 2003 in Mono
Lake, California (USA). Ammonia (NH3) oxidation rates were measured at four time points
using a 15N stable isotope tracer technique. 16S rDNA as well as functional gene analysis,
and fluorescence in situ hybridization (FISH) were used to characterize the ammonia
oxidizer population. Ammonia oxidation activity was observed throughout the oxic portion
of the water column at each time point and was correlated with profiles of nitrogenous
geochemical species (e.g., nitrate and nitrous oxide). Maximum activity occurred
consistently between 12 and 14 m. Depth integrated nitrification rates were highest in
November 2002. 16S sequence analysis identified an ammonia-oxidizing bacterial (AOB)
community that was dominated by nitrosomonads, with sequences most closely related to
Nitrosomonas-like sequences retrieved from a Greenland alkaline tufa column, Mongolian
soda lakes, and a Chinese salt lake. The observed AOB phylogeny was significantly
different from a previously documented population and the transition between AOB
populations coincided with a shift in Mono Lake mixing regimes. Samples were also
analyzed for ammonia-oxidizing archaea (AOA) using previously described PCR primers
specific for archaeal ammonia monooxygenase (amoA). Despite FISH analysis that revealed
a substantial population of Crenarchaeota (the phylum that encompasses all known AOA),
no archaeal amoA sequences were obtained. In fact, no archaeal sequences of any type were
obtained even using general 16S archaeal PCR primers. We hypothesize that the lack of
archaeal DNA recovered from water column samples is likely due to sequence divergence
of archaea in Mono Lake and other similar exotic environments. Although correlations

53
between nitrification and Crenarchaeota and AOB abundance followed a pattern similar to
patterns demonstrated in other studies that have suggested significant AOA activity, the
lack of verifiable archaeal amoA gene copies and the presence of sufficient AOB cell
numbers to physiologically account for all measured nitrification in Mono Lake leaves open
the question as to whether AOA contribute significantly to nitrification in Mono Lake.
INTRODUCTION
Nitrification plays an important role in the nitrogen (N) cycle in freshwater and marine
aquatic environments, as well as in soils and sediments (Hastings et al. 1998; Ward 1986;
McDonald 1979). Ecological ramifications of nitrification include the production and efflux of a
radiative trace gas (nitrous oxide, N2O) to the atmosphere, alteration of the concentrations and
distributions of biologically available N, and loss of fixed N via coupling to denitrification
(Ward, 1986). Nitrous oxide, a byproduct of nitrification (Ritchie and Nicholas, 1972), is a
potent greenhouse gas that contributes to radiative forcing and stratospheric ozone destruction
(Crutzen, 1970). Nitrification can be coupled with other N processes to remove fixed N from a
system, e.g., the nitrate (NO3- ) and nitrite (NO2
- ) produced by nitrification may serve as
substrates for denitrifiers or anaerobic ammonium oxidizers. Denitrifying bacteria transform
NO3- and NO2
- to nitrogen gas (N2); thus, coupled nitrification-denitrification can remove fixed
N from an ecosystem (Jenkins and Kemp, 1984; Codispoti and Christensen, 1985). Nitrite
produced by nitrification may also be used as an oxidant for anaerobic ammonium oxidation
(anammox), which also results in N2 loss (Mulder et al., 1998). In alkaline ecosystems, however,
nitrification may reduce the loss of fixed N from a system. By converting NH3 to NO2- (and
ultimately NO3-), N losses due to NH3 volatilization are curtailed (Joye et al., 1999). These
various biogeochemical N transformations determine local concentrations and distributions of

54
biologically available N and can have a profound impact on ecosystem primary production
(Jellison and Melack, 1993).
Nitrification is an obligate aerobic chemolithotrophic process by which ammonia is
converted to nitrate (Prosser, 1989). Ammonia oxidation, the first step in the nitrification
process, is catalyzed by ammonia monooxygenase (amo). Ammonia-oxidizing bacteria (AOB)
fix inorganic carbon via the Calvin Benson cycle (Watson et al., 1989) using energy derived
from the oxidation of ammonia (NH3) to nitrite (NO2-). Ammonia oxidizers are grouped in the γ-
and β- subdivisions of the Proteobacteria and consist primarily of Nitrosococcus and
Nitrosomonas species, respectively (Head et al., 1997). Nitrite-oxidizing bacteria (NOB) convert
NO2- to nitrate (NO3
-) thereby completing the nitrification of NH3. Nitrite oxidation is carried out
primarily by Nitrobacter species that belong to the α subdivision of the Proteobacteria (Prosser,
1989).
Ammonia-oxidizing bacteria and, to a minor extent, the NH3 co-metabolizing
methanotrophs were long considered the sole contributors to aerobic NH3 oxidation (Bock and
Wagner 2001). However, recent evidence indicates that certain members of the domain Archaea
are also chemoautotrophic nitrifiers (hereafter, Ammonia Oxidizing Archaea or AOA).
Sequences affiliated with marine Crenarchaeota retrieved from a genomic diversity survey in the
Sargasso Sea revealed a gene encoding for a unique ammonia monooxygenase sub-unit (amoA)
that suggested the potential for archaeal oxidation of ammonia (Venter et al., 2004). Discovery
of a Sargasso Sea-like amoA homolog in soil Crenarchaeota indicated that archaea from diverse
environments might nitrify (Schleper et al., 2005). Confirmation of a direct link between
archaeal amoA and nitrification was provided by the isolation of a pure culture (SCM1) from the
marine 1 group of the Crenarchaeota; the growth curve of SCM1 correlated with near

55
stoichiometric conversion of NH3 to NO2- (Konneke et al., 2005). Unique PCR primers based on
alignments of archaeal amoA genes and deduced amino acid sequences from the Sargasso Sea
and German soil Crenarchaeota amplified amoA sequences in diverse areas of the ocean
including the base of the euphotic zone, suboxic water columns, and in estuarine and coastal
sediments (Francis et al., 2005). New studies continue to demonstrate the ubiquitous distribution
of AOA (Leinineger et al., 2006; Park et al., 2006), yet data from hyper-saline and/or alkaline
environments are lacking.
Mono Lake is an alkaline (pH 9.8), saline (68-79 g kg-1) lake located just east of the
Sierra Nevada range in northern California (38°N, 119°W). Like many closed-basin saline lakes,
Mono Lake’s hydrological regime alternates between periods of mero- and monomixis
depending on inter-annual variations in freshwater inflow (Melack and Jellison, 1998). During
monomictic conditions, the lake undergoes a seasonal cycle of thermal stratification followed by
overturn and complete lake-wide mixing (holomixis). During summer, temperature differences
between warmer surface water (epilimnion) and the cooler water below create a thermal density
barrier (thermocline) that isolates the lower water column (hypolimnion) from the effects of
wind driven mixing. Biological processes (e.g., respiration) in the isolated hypolimnion create a
seasonally anoxic zone where reduced geochemical species (e.g., nutrients and redox
metabolites) accumulate. During this time mixing only occurs in the epi- or mixolimnion and
biological activity in this zone quickly depletes the nutrient supply. When the surface water cools
sufficiently in the fall, the thermal density gradient degenerates and the lake undergoes
holomixis. Nutrients accumulated in the hypolimnion are entrained throughout the water column,
and O2 from the mixolimnion aerates the entire lake.

56
During meromictic periods, freshwater inflows create a chemical density barrier
(pycnocline). The hypolimnion (referred to as the monimolimnion during periods of meromixis)
is permanently isolated below the pycnocline and reduced geochemical species accumulate to
high concentrations (Miller et al., 1993). Mono Lake also experiences seasonal thermal
stratification during meromictic periods. Fall mixing is not strong enough to penetrate the
pycnocline, and the reduced species and regenerated nutrients remain primarily in the
monimolimnion, reaching the mixolimnion only via diffusion. This combination of factors
makes Mono Lake an ideal habitat for examining the distribution and activity of microbes in a
seasonal series of varying geochemical regimes or between contrasting periods of whole lake
mixing patterns.
The understanding of nitrogen dynamics in Mono Lake (Jellison et al., 1993; Miller et al.,
1993; MacIntyre et al., 1999) derives mainly from studies on NH3 concentration and flux and the
effect of N availability on primary production (PP). Due to low external N inputs and thermal or
chemical stratification, dissolved inorganic nitrogen (DIN) concentrations in the upper water
column are low (but periodically replenished due to turnover) during monomictic cycles or
chronically low throughout periods of meromixis. Dissolved inorganic phosphorous (DIP)
concentrations are high (> 400 µM; Jellison et al., 1993) resulting in extremely low DIN to DIP
ratios (<< 0.5), indicating chronic nitrogen limitation in the mixolimnion (Joye et al., 1999).
The activity and phylogeny of ammonia-oxidizing bacteria (AOB) in Mono Lake have
been examined (Joye et al., 1999; Ward et al., 2000). Although ammonia-oxidizing bacteria are
generally ubiquitous in freshwater and marine environments, they account for a very small
proportion of the total bacterial population in natural environments (Voytek and Ward 1995;
Phillips et al., 2000). However, nitrifiers may contribute significantly to total primary production

57
(30 – 80%) in saline and/or alkaline environments with similar nutrient and/or stratification
regimes (Indrebø et al., 1979; Cloern et al., 1983). In Mono Lake, the AOB community
accounted for a smaller fraction (1–7%) of PP but was still estimated to be an important link to
other N cycling processes (Joye et al., 1999).
Previous activity and phylogenetic analyses related to nitrification in Mono Lake were
performed at the end of an extended period of monomixis (1988-1995). The bacterial ammonia-
oxidizing community in 1995 was dominated by sequences with a very close affinity to N.
europaea and to a lesser extent, N. eutropha. Primers specific for γ-Proteobacteria did not
produce amplicons from any samples; only sequences associated with the β-Proteobacteria were
identified (Ward et al., 2000). Subsequent phylogenetic analyses were undertaken following the
transition to meromixis that occurred in 1996. Samples from August 1997 and April 1998 were
screened for ammonia- and nitrite-oxidizing bacterial (NOB) sequences using a wide variety of
general and nitrifier specific16S and functional gene primers, molecular probing, DGGE and
clone library analyses (Hovanec, 1998). Results were negative for all analyses except for one
ambiguous positive result for a Nitrosospira-like NOB. The author concluded that the AOB and
NOB populations were below detection limits and that NH3 consumption was more likely due to
phytoplankton uptake than nitrification (Hovanec, 1998). AOB are notoriously slow growing and
recovery from environmental perturbations (such as a transition from mono- to meromixis) may
proceed slowly. The current study was conducted from August 2002 to August 2003 after an
extended period of persistent meromixis. The lake had not experienced holomixis for 8 years,
with the monimolimnion continually isolated below the pycnocline.
We employed a combination of biogeochemical and molecular ecological methods to
investigate nitrification activity and ammonia oxidizer community composition and abundance

58
and to compare the results with previous data obtained during monomixis and early meromixis
(Joye et al., 1999; Ward et al., 2000; Hovanec, 1998). We hypothesized that prolonged
meromixis created a new set of relatively stabile geochemical and hydrological regimes that may
have facilitated a revival of nitrification. Subsequent to the discovery of AOA in culture and
other environments, this study also provided the opportunity to investigate possible AOA
populations and their potential contribution to nitrification in Mono Lake.
METHODS
Study site
Field sampling was conducted over the course of a year and encompassed seasonal time
points of Aug. 2002, Nov. 2002, May 2003, and Aug. 2003. Depth profiles for each time point
were obtained near a permanently moored buoy in the central basin of Mono Lake (station 6;
37°57.822’ N, 119°01.305’ W). The entire water column was sampled for nutrients, dissolved
gasses, and molecular composition. Sample collection depths for nitrification measurements
spanned the epilimnion from the upper oxic layer through the bottom of the oxycline. The data
presented here corresponds to the depths sampled for nitrification rate assays.
Sample Collection and Geochemical Analyses
Geochemistry
Temperature (T) and conductivity profiles were obtained using a SeaBird SeaCat CTD
profiler. Oxygen concentrations were determined using a polarographic (YSI) oxygen sensor
equipped with a Clark-type electrode. Samples were collected from discrete depths using a 5 L
Niskin water sampler and were stored appropriately (see below) for ensuing analyses.

59
Dissolved gas samples (10 ml) were transferred from the Niskin sampler into 20 ml helium (He)
purged headspace vials via gas tight syringe. The vials contained a NaOH pellet to arrest
biological activity. After introduction of the sample, the vial was closed with a stopper and
crimp sealed. Dissolved N2O concentrations were measured using a headspace extraction-gas
chromatographic technique (Joye and Pearl, 1994). The sealed headspace vials contained 10 ml
of aqueous sample and 10 ml of “headspace” (He plus dissolved gasses stripped from the
sample). Eight ml of headspace from each sample was collected into a gas tight syringe by
injecting an equal volume of NaCl saturated brine solution into the headspace vial. The gas
sample was injected subsequently into a Shimadzu GC-8 gas chromatograph equipped with
electron capture detection (ECD). Multiple aliqouts (n=3) of a single point standard (Scott
specialty gas mix 447: N2O 100 ppm in a balance of He) were injected into the ECD at the
beginning and end of each set of samples (Joye and Paerl 1994).
Samples for nutrient analysis were filtered (Millipore Acrodisc, 0.2 µm) and stored at
4°C without headspace, which was necessary to avoid volatilization of NH3 in these high pH
(~9.8) samples. Ammonium samples were analyzed at the field laboratory within 6 hrs.
Ammonium concentrations were determined using the phenol-hypochlorite method (Solarzano,
1969). To account for matrix effects, standards were prepared using He purged Mono Lake
surface water and internal standards were run. Concentrations in samples were calculated from
linear regressions of standard data (5 concentrations).
Nitrite and nitrate concentrations were quantified at the UGA lab ~7 to 14 days later.
Nitrate (NO3-) and nitrite (NO2
-) were measured cumulatively as NOx using an Antek®745
Nitrate/ Nitrite Reducer (vanadium reduction assembly) inline with an Antek ®7050
chemiluminescent nitric oxide detector (Álvarez-Salgado & Miller 1998). Reduction efficiency

60
checks of the vanadium solution were run after every 10 samples. Nitrite concentrations were
determined by spectrophotometry (Bendschneider and Robinson, 1952) modified for Mono Lake
water chemistry. Standards for these analyses were made using artificial Mono Lake Water that
reproduced in situ ionic strength and pH conditions to account for matrix effects (Oremland et
al., 2002). Samples and standards were adjusted to ~pH 7 with concentrated HCl before addition
of reagents.
Nitrification Rates
Water for nitrification rate measurements was transferred to 500 ml rectangular PETG
plastic media bottles (Nalgene), and the bottles were sealed without headspace. Nitrification
rates were measured using a 15NH3 tracer technique (adapted from Ward, 1987). Water samples
from each depth (n= 3) were amended with a 15NH4+ solution (Cambridge Isotope 99.9 atom %
15N) for a final tracer concentration equal to 10% of the in situ NH4+ concentration. Ammonia
(NH3) is the actual substrate for nitrification and is also the dominant form of the NH4+/ NH3
equilibrium pair in alkaline environments such as Mono Lake. Therefore the NH3 nomenclature
will be used subsequently except when the species referred to is specifically NH4+ (such as the
initial tracer salt). The bottles were incubated for 24 hrs at in situ temperature in the dark after
which the sample was filter sterilized (GF/F) to halt biological activity and remove biologically
incorporated label.
The atom % enrichment of the NOX pools resulting from oxidation of 15NH3 was
determined using a modified ammonia diffusion technique (Sigman et al., 1997). The sample
volume was first reduced by 66% in a 65 °C incubator (Sigman et al., 1997). Elevated
temperature facilitated sample volume reduction and the decomposition of labile dissolved

61
organic nitrogen (DON). The high pH of Mono Lake water combined with decreased gas
solubility due to salt concentration and increased temperature drove off the remaining 15NH3 /
15NH4+ label. Filter sterilized Mono Lake water samples, with and without 15NH4
+ additions just
prior to the sample volume reduction step, were treated in the same manner as the samples to
evaluate the potential for residual 15N tracer; tracer free additions permitted us to determine
initial (natural abundance) 15NOX values.
Diffusion packets consisting of acidified (25 µl 5N H2SO4) pre-combusted (400 °C)
Whatman GF/D filters (1 cm diameter) sandwiched between two 25 mm Teflon membranes
(Millipore) were assembled, and 1 packet was floated in each sample bottle. Three hundred mg
of Devarda’s alloy was then added to each sample and the bottles were immediately sealed.
Samples were incubated at 65°C for 4 days to facilitate NOX reduction to NH3 catalyzed by
Devarda’s alloy. The samples were then shaken at room temperature (10 days @75 rpm) to trap
converted NH3 as NH4+ on the filter packets (Sigman et al., 1997). Filters were subsequently
removed from the packet, dried, and analyzed using a Carlo Erba CHN (Model NA 1500)
Combustion Analyzer (Milan, Italy) coupled to a Finnigan Delta C Isotope Ratio Mass
Spectrometer (Bremen, Germany) via a Finnigan Conflo II interface (UGA Ecology Analytical
Laboratory).
Nitrification (NTR) rates were calculated by determination of the atom % enrichment of
the NOX pool in each sample. Sample blanks (described above) indicated that initial 15NOX atom
% was at natural abundance levels (0.0036) and that there was no 15NH4+ tracer carry-over. Final
15NOX atom % was determined by EA-irMS analysis of each filter. Controls were run to correct
for N blanks associated with DON and Devarda’s alloy (Sigman et al., 1997). The differences in
atom % between initial and final 15NOX pools in each sample were converted to nitrification rates

62
(nmol NO3- l-1 per unit time; equation 3.1) and corrected for 15NH3 isotope tracer dilution
(equation 3.2).
(3.1) nmol 15NO3- l-1day-1 = ([atom%15NO3
-(f)-atom%15NO3
- (i)] *NO3
- (f) ] / 1 day])
Where 15NO3-(f) and 15NO3
- (i) are the final and initial concentrations of 15NO3
- in the
sample, respectively and NO3-
(f) is the final NO3- concentration in the sample.
(3.2) Corrected Rate = nmol 15NO3- day-1 / (α*0.1)
Where α is the %15NH3 in the 15NH4+ tracer pool (equilibrium determined by sample pH
and T). Since the 15NH4+ tracer addition equaled 10% of in situ NH3 concentrations, the
total nitrification rate must be corrected by a factor of 10.
Molecular Analyses
Water samples for molecular analyses were transferred into 1-4 liter acid cleaned, sample
rinsed containers and stored at 4°C until processing. Within 4-6 hours back at the field
laboratory, a 10 ml sub-sample for FISH analysis was taken, fixed with formalin (final
concentration of 4%) for 30 minutes and then stored frozen at –20°C until analysis (modified
from Pernthaler et al., 2001). The remaining water from each depth was passed through
individual Millipore Sterivex filter cartridges (0.2 µm) to collect microbial biomass for
subsequent DNA extraction. Excess water in the filter cartridge was replaced with an extraction
buffer and stored at -70°C until processed (Ferrari and Hollibaugh, 1999).

63
DNA was extracted from Sterivex filters using a modified technique of Murray et al.
(1996) and Ferrari and Hollibaugh (1999). Filter cartridges containing extraction buffer (1.5 M
NaCl, 5 mM MgCl2, 100 mM Tris HCl - pH 7, 100 mM EDTA - pH 8, 100 mM Na2HPO4 - pH
8) w"e"r"e" "t"h"a"w"e"d" "a"t" "r"o"o"m" t"e"m"p"e"r"a"t"u"r"e." Forty µl of "l"y"s"o"z"y"m"e" "(""5"0" "m"g"/"m"l")" was "a"d"d"e"d" and the
cartridges were incubated at 37°C for 30 min on an orbital shaker (25 rpm). Lysate was expelled
from the cartridge "and then the cartridge was rinsed with extraction buffer to ensure maximum
yield.
DNA was further liberated from the lysate using bead-mill homogenization (method
adapted from the MO BIO Ultraclean Soil DNA kit protocol). Seven hundred µL of raw extract
combined with glass beads (100 µl), 100 µl proteinase K (10 mg/ml), and 100 µl SDS (20%) was
vortexed at high speed for 10 min. After centrifugation (12,000 x g for 5 min), the supernatant
was treated with 250 µl potassium acetate (4 M, pH 5) and centrifuged (12,000 x g) for 5 more
min. The supernatant was then added to 750 µL of 6 M guanadine thiocyanate and 1 mg sterile
diatomaceous earth and mixed by inversion. The diatomaceous earth-bound DNA was trapped
on a GF/F filter, washed twice with 0.5 ml guanadine thiocyanate (6M), twice with 0.5 ml
isopropanol solution (25 % isopropanol, 25 % ethanol, 100 mM NaCl, and 10 mM Tris HCl, pH
8), and once with 0.5 ml ethanol (95%). Washing steps were all performed by adding the
appropriate solution to the spin column and centrifuging at 12,000xg for 1 min. DNA was eluted
from the filter with 60 µl sterile water (pH 8). The DNA obtained was suitable for the PCR and
no subsequent purification was necessary.
Previously characterized oligonucleotide primers were chosen to analyze for ammonia-
oxidizing bacteria (16S), general archaea (16S), and ammonia-oxidizing archaea (amoA gene).
Samples were screened for β-Proteobacteria ammonia-oxidizers using a nested approach: the
64
EUB1/EUB2 primer pair (Liesack et al. 1991) was used to amplify total bacterial rDNA, and that
product was subjected to a second amplification using the Nit-A/Nit-B primer pair (NitAB;
Voytek and Ward 1995; Ward et al., 2000). This nested approach was used because previous
work has shown this to be more sensitive for detecting less abundant sequences (Voytek and
Ward, 1995). A nested approach was also used with the NOC1 and NOC2 primer pair to screen
for members of the γ-Proteobacteria ammonia-oxidizers (Voytek, 1996). DNA extract was
screened for the presence of ammonia-oxidizing archaea using the primer sets Cren-amo1F /
Cren-amo1R (Konneke et al., 2005) and Arch-amoAF / Arch-amoAR (Francis et al., 2005),
which targets the putative archaeal ammonia monooxygenase (amoA) gene. The universal
archaeal primer set Arch 21F and 1492R was also used to screen for general archaeal populations
(Delong, 1992). Because of the unique environment of Mono Lake several different
modifications were made to the standard, published archaeal PCR protocols to try and optimize
results. These included adjustments of template, primer, and magnesium concentrations as well
as several different annealing temperature gradients.
PCR products were isolated by agarose gel electrophoresis, extracted from the agarose
(QIAquick® Gel Extraction Kit; Qiagen), inserted into the pCR®4-TOPO® plasmid vector and
transformed into chemically competent One Shot®TOP10 Escherichia coli cells as per the
manufacturer’s instructions (Invitrogen Corp). Transformed cells were plated on Luria–Bertani
(LB) plates containing ampicilin (100 mg ml -1) and incubated overnight at 37 °C. Colonies were
chosen at random from replicate plates and cultured overnight at 37 °C in 1.2 ml of LB medium
containing ampicilin (100 mg ml-1). PCR/DGGE analysis was used to identify unique clones for
sequencing. Bands suggestive of unique clones were cut out, re-amplified with the PCR and re-
run using DGGE. Clones that produced bands which did not have the same electrophoretic

65
mobility as the original bands (based on multiple lanes of standard distributed across the gel) or
that produced more than one DGGE band were discarded. Frozen, glycerol preserved whole -cell
clone cultures (2x96 well micro-titer plates) were sequenced (primer M13F) by SeqWright
(Houston, TX) and yielded robust sequence fragments of 550-800 bp. The obtained sequences
were then compared with published sequences using BLAST (National Center for
Biotechnology Information). Sequences from the data library exhibiting the highest similarities
(closest relatives) were aligned with clone sequences using the Genetics Computer Group (GCG)
package (Madison, WI). A phylogenetic tree was constructed using the neighbor-joining method
and Jukes-Cantor distances (PHYLIP package v. 3.5).
Fluorescence in situ hybridization (FISH) was used to determine the abundance of AOB
and Crenarcheota, a proxy for AOA (Konneke et al., 2005; Wuchter et al., 2006). FISH probes
specific for AOA have not yet been developed, but all sequences recovered from putative AOA
have been associated with the Crenarchaeota (Venter et al., 2004; Schleper et al., 2004; Konneke
et al., 2005; Francis et al., 2005; Wuchter et al., 2006; Leininger et al., 2006; Hallum et al.,
2006). Although it is almost certain that not all crenarchaeotes oxidize NH3, their enumeration
does provide valuable information about the potential involvement of AOA in nitrification.
Ammonia-oxidizing bacteria were enumerated using previously described
oligonucleotide probes NEU, Nso190, and Nsm156, designed to detect halophilic/halotolerant
Nitosomonas spp., ammonia-oxidizing β-Proteobacteria, and some Nitosococcus spp.
respectively (Mobarry et al, 1996). The probes were synthesized by MWG Biotech (Ebersberg,
Germany) and labeled with Texas Red. Formalin-preserved samples were thawed and mixed
well. Then 500 µl of sample was added to a sterile centrifuge tube containing 15 ml of
phosphate-buffered saline (PBS) solution, mixed well, and then filtered through a 0.2 µm

66
polycarbonate membrane filter (Osmonics). The tube was then rinsed with PBS (2 x 15 ml), and
this material was also passed through the filter to assure that all cells were transferred to the
filter. The filter was washed with 15 ml of sterile water (2x) and allowed to air dry in a Petri
dish. Sections of individual filters were separated for DAPI only staining as well as hybridization
with specific probes and DAPI counterstaining. AOB hybridization reactions were performed in
succession on single filter sections to accommodate optimum formamide concentrations for each
of the 3 probes (Mobarry et al., 1996). Filter sections were then washed, rinsed in milliQ water,
air dried and counterstained with DAPI for 3 min (50 µl of 2 mg ml-1 solution). Enumeration of
Crenarchaeota was carried out in the same manner, using probe Cren537 as described by Herndl
et al. (2005).
Total microbial and hybridized nitrifier and Crenarchaeota cells were counted using
epifluorescence microscopy by enumerating cells in each of 40 squares in 50 randomly selected
fields for each sample (n = 2000 grid squares per sample filter section). Cells ml-1 in each sample
were calculated by taking the mean number of cells counted in the 50 selected fields per filter
section multiplied by a conversion factor derived from a combination of the counting grid area
(GA), the percentage of the grid utilized (% Grid), the surface area of the filter (SAF), and the
volume of water filtered (vol.; equation 3.3).
(3.3) Cells ml-1 = (mean counted cells*[SAF/ (GA*%Grid)]) / vol.
Total-cell counts from the DAPI-only stained filter sections and DAPI counts from
counterstained, hybridized filters were compared to control for loss of cells from the filters that
may have occurred during hybridization.

67
AOB Cell Specific Nitrification
Cell specific rates of NH3 oxidation were calculated by dividing the moles of NH3 oxidized per
volume by the total number of AOB cells per volume as determined by FISH at each depth.
Statistics
Linear regression and/or Pearson’s Correlation Coefficient (r) analyses were used to
evaluate correlations between nitrification rates, pertinent geochemical variables, and group-
specific abundances. Spatial and temporal differences in NH3 oxidation rates were compared
using paired t-tests assuming unequal variances (n = 3). Differences between the spatial and
temporal AOB and Crenarchaeota cell numbers derived from FISH data were compared using a
combination of ANOVA and Tukey’s analyses.
RESULTS
Geochemical Profiles
Oxygen and temperature (T) profiles displayed distinct seasonal patterns while excess
density, calculated from conductivity measurements (Jellison et al., 1999), remained relatively
constant throughout the study period. The lake remained isohaline (averaging 69.4 mg l-1) in the
mixolimnion with spatial and temporal variation of less then 5 % (Fig. 3.1). Temperature (2-20
°C) and O2 (<1 –7 mg l-1) profiles in Aug. 2002, May 2003, and Aug. 2003 were strongly
correlated (r = 0.99, 0.95, and 0.98, respectively) and demonstrated seasonal stratification with
discrete oxyclines between 9 and 15 m (Fig. 3.1). Stratification was not well defined in

68
November as O2 concentrations became less variable and penetrated to 20 m and temperatures
remained constant, at about 14 °C, through the mixolimnion (Fig. 3.1).
Ammonia concentrations in the Mono Lake water column varied over depth during each
of the sample dates. During Aug. 2002, May 2003, and Aug. 2003, NH3 concentration in the
mixolimnion were generally low (< 1µM). However, NH3 increased dramatically (up to 20-fold)
through the oxycline (Fig. 3.2). In contrast, the November 2002 profile showed elevated NH3
concentrations (9 to 11 µM) in the surface water (Fig 3.2) and less of an increase through the
oxycline. All NH3 profiles displayed a concave distribution between 11 and 15 m (Fig. 3.2b).
Similar NOX concentrations and profile shapes were observed during August 2002 and
May 2003. Low concentrations (66 to 89 nM) in the surface water slowly increased to peak
levels of 490 and 400 nM, respectively, at about 13 m. Concentrations then decreased on each
sample date to ~90 nM by16 m (Fig. 3.2). The highest upper water column NOX concentration
(204 nM) occurred in November 2002. November NOX concentrations peaked (350 nM) at 13 m
and then gradually decreased with depth to 180 nM at 20 m (Fig. 3.2). The August 2003
sampling produced a quite different profile. Concentrations of NOX remained relatively low (<
60 nM) throughout the upper water column (Fig. 3.2). A sharp peak (441 nM) developed
between 13 and 14 m before the concentration decreased to 190 nM at 16 m (Fig. 3.2).
Nitrous oxide profiles followed the same general spatial patterns as NOX profiles.
August 2002 and May 2003 had relatively low concentrations in the surface water (15 and 11
nM, respectively) and gradually increased to peak levels of 30 and 35 nM N2O respectively at 13
m (Fig. 3.2). Concentrations for both profiles then decreased to about 8 nM. The November 2002
N2O profile had the highest concentrations throughout, ranging from 25 nM in the upper water
column to 41 nM (at 13 m). The N2O concentration then gradually decreased to 20 nM at 20 m
69
(Fig. 3.2d). August 2003 N2O concentrations remained constant at 20 nM between 3 and 10 m.
Below 10 m the concentration increased to a peak level (40 nM) at 14 m and then returned to 20
nM at 16m (Fig. 3.2). The concentration of N2O in Mono Lake water was extremely saturated
with respect to equilibrium with atmospheric N2O concentrations (expected to be between 0.3and
0.8 nM; calculated using the Bunsen solubility coefficients from Weiss and Price, 1980).
Nitrification Rates
Nitrification activity was observed throughout the oxic portion of water column on all 4
sampling dates. Profiles in August 2002, May 2003, and August 2003 exhibited relatively low
activity (< 60 nM day-1) in both the upper water column and proximate to the bottom of the
oxycline (O2 vs. NTR is depicted in Fig. 3.4) while distinct peaks of activity (350 to 480 nM
day-1) occurred consistently between 13 and 14 m (Fig. 3.2). Rates measured in November 2002
displayed a much different profile. Activity in the upper water column was ~4 times higher (230
to 335 nM day-1) than during the other sampling dates. Peak activity (370 nM day-1) coincided
spatially with the other samples but exhibited a much broader profile (Fig. 3.2).
Molecular analysis
A total of 92 AOB sequences were obtained from Mono Lake water samples. Eight
clones dominated the bacterial ammonia-oxidizing community. All recovered sequences were
affiliated with AOB from the β-Proteobacteria. Approximately 48% of the clone library was
represented by a single Nitrosomonas sequence (ML_AOB_A2) that was most closely related
(98%) to an uncultured Nitrosomonas sp. recovered from a Greenland alkaline tufa column
(Stougaard et al., 2002). The remaining 7 unique sequences each comprised between 3and 15 %
of the total AOB population. Sequences from clones ML_AOB_H1, ML_AOB H3,
70
MLAOB_G4, and ML_AOB_A3 clustered together (Fig. 3.3) and were most closely related (86
– 89 %) to a Nitrosomonas sp. recovered from a Chinese saline lake (Dong et al., 2006). Clones
ML_AOB_D4 and ML_AOB _E1 clustered with the dominant ML_AOB _A2 sequence and
were most closely related (97-99 %) to AOB clone ANs5 from a Mongolian soda lake (Sorokin
et al., 2001, direct submission). ML_AOB_E4 was slightly more divergent but still most closely
related to AOB clone ANs5 (Fig. 3.3).
Results of PCR with the NOC primer set were negative and suggested a lack of
detectable AOB in Mono Lake affiliated with the γ-Proteobacteria. It is possible that the nested
amplification procedure might have missed N. oceanus if it were rare and if it were selected
against by the EUB primers in the initial amplification (Ward et al., 2000). In addition, our FISH
analysis was designed to enumerate total AOB abundance rather than to distinguish between
individual clades of AOB. Therefore, we cannot rule out completely the presence of N. oceanus
in Mono Lake at some low level.
All water samples screened during the course of the study tested negative for putative
amoA genes. In fact, no archaeal sequences were obtained using the general archaeal 21F /
1492R primer set. However, FISH analysis using probe Cren537 indicated the presence of
Crenarchaeota, the phylum that encompasses the known archaeal ammonia oxidizers.
Crenarchaeotes were present in all samples examined. Crenarchaeal abundance varied over space
and time (Fig. 3.4). Absolute Crenarchaeota cell numbers ranged from 1 to 9x10⁵ cells ml-1
(Table 3.1) and comprised between 2 and 10 % of total cells (determined by DAPI enumeration).
Abundance profiles for all sampling dates were similar with significant peaks between 13 and 14
m (Fig. 3.4).
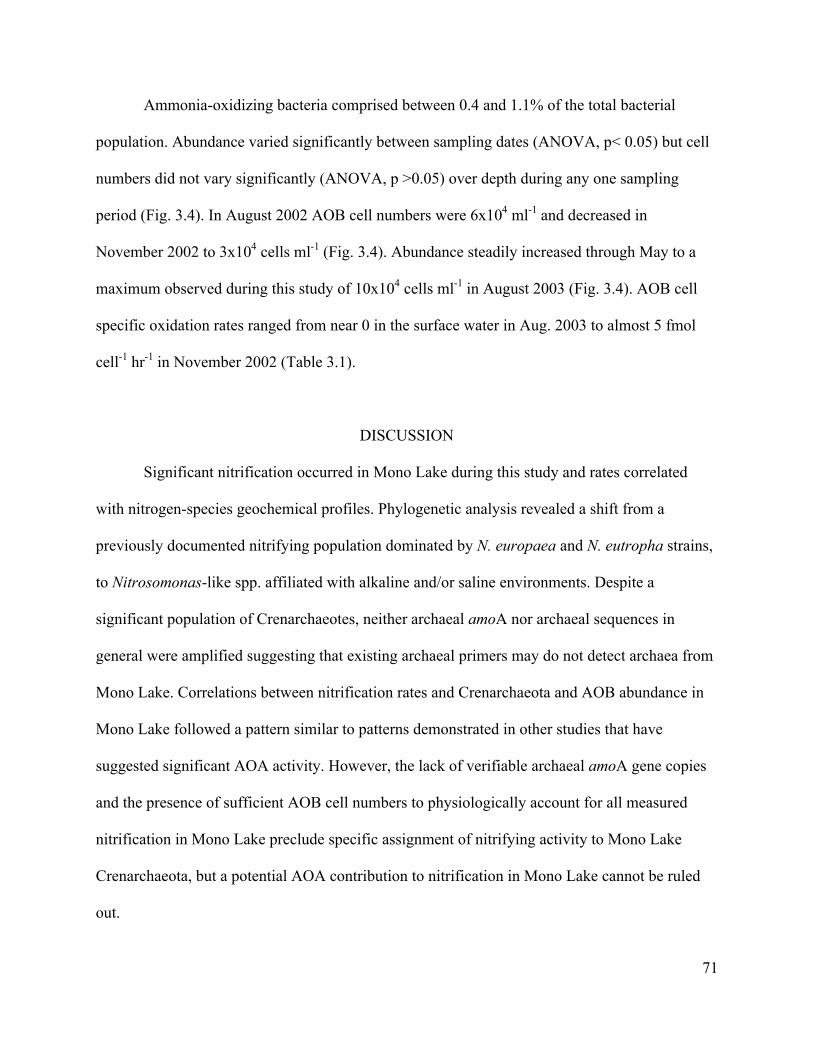
71
Ammonia-oxidizing bacteria comprised between 0.4 and 1.1% of the total bacterial
population. Abundance varied significantly between sampling dates (ANOVA, p< 0.05) but cell
numbers did not vary significantly (ANOVA, p >0.05) over depth during any one sampling
period (Fig. 3.4). In August 2002 AOB cell numbers were 6x10⁴ ml-1 and decreased in
November 2002 to 3x10⁴ cells ml-1 (Fig. 3.4). Abundance steadily increased through May to a
maximum observed during this study of 10x104 cells ml-1 in August 2003 (Fig. 3.4). AOB cell
specific oxidation rates ranged from near 0 in the surface water in Aug. 2003 to almost 5 fmol
cell-1 hr-1 in November 2002 (Table 3.1).
DISCUSSION
Significant nitrification occurred in Mono Lake during this study and rates correlated
with nitrogen-species geochemical profiles. Phylogenetic analysis revealed a shift from a
previously documented nitrifying population dominated by N. europaea and N. eutropha strains,
to Nitrosomonas-like spp. affiliated with alkaline and/or saline environments. Despite a
significant population of Crenarchaeotes, neither archaeal amoA nor archaeal sequences in
general were amplified suggesting that existing archaeal primers may do not detect archaea from
Mono Lake. Correlations between nitrification rates and Crenarchaeota and AOB abundance in
Mono Lake followed a pattern similar to patterns demonstrated in other studies that have
suggested significant AOA activity. However, the lack of verifiable archaeal amoA gene copies
and the presence of sufficient AOB cell numbers to physiologically account for all measured
nitrification in Mono Lake preclude specific assignment of nitrifying activity to Mono Lake
Crenarchaeota, but a potential AOA contribution to nitrification in Mono Lake cannot be ruled
out.

72
Geochemical Profiles and Patterns of Nitrification Activity
Ammonium, NOX, and N2O profile contours were consistent with the distribution of
nitrification activity throughout the water column on all sampling dates. Ammonium, the primary
substrate for the first step in nitrification (Prosser, 1989), regularly displayed profiles indicating
consumption (Martens and Berner, 1977); the minimum NH3 concentrations were associated
with the maximal nitrification rates (Fig. 3.2). Production of NOX and N2O also correlated with
NTR activity (p < 0.01). These data suggest that geochemical profiles of these species are a
reasonable indicator of the actively nitrifying zone. Mono Lake ammonia profiles from April and
July 1995 also indicated consumption associated with measured ammonia oxidation rates (Joye
et al., 1999).
In a study that sampled Mono Lake during August 1997 and April 1998, no AOB or
NOB sequences retrieved and geochemical data were not suggestive of nitrification (Hovanec,
1998). Ammonia concentrations were consistently low (1-2 µM) in the epilimnion, and it was
difficult to discern a zone that may have indicated consumption associated with nitrification.
Nitrate + nitrite concentrations were relatively low (< 200 nM), variable, and profiles did not
demonstrate a peak consistent with nitrification-associated production in the oxic portion of the
water column (Hovanec, 1998). The data from these previous studies indicates that nitrification
was occurring in 1995 (Joye et al., 1999; Ward et al., 2000) and 2002-2003 (this study), but
suggests that activity may have ceased in the period following the transition from mono- to
meromixis in 1996 (Hovanec, 1998).
Profiles of ammonia oxidation rates were distinctly different between this study and that
from 1995. Although the biogeochemical data from the present study and that of Joye et al.
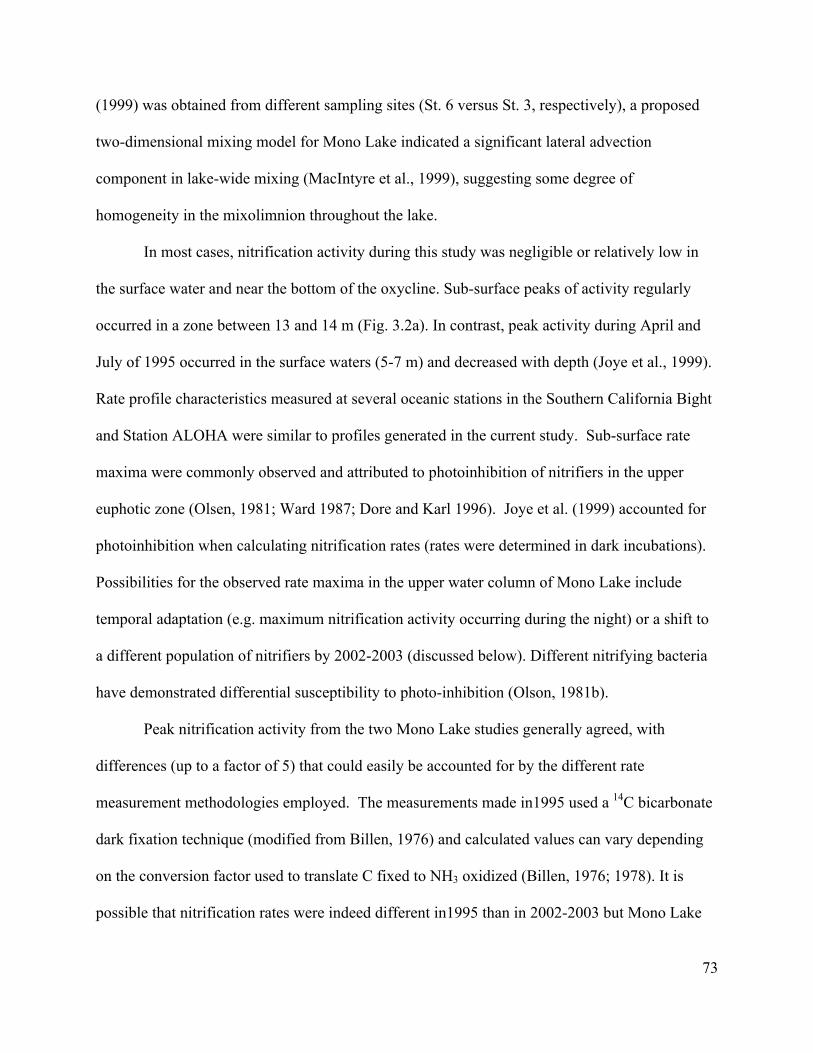
73
(1999) was obtained from different sampling sites (St. 6 versus St. 3, respectively), a proposed
two-dimensional mixing model for Mono Lake indicated a significant lateral advection
component in lake-wide mixing (MacIntyre et al., 1999), suggesting some degree of
homogeneity in the mixolimnion throughout the lake.
In most cases, nitrification activity during this study was negligible or relatively low in
the surface water and near the bottom of the oxycline. Sub-surface peaks of activity regularly
occurred in a zone between 13 and 14 m (Fig. 3.2a). In contrast, peak activity during April and
July of 1995 occurred in the surface waters (5-7 m) and decreased with depth (Joye et al., 1999).
Rate profile characteristics measured at several oceanic stations in the Southern California Bight
and Station ALOHA were similar to profiles generated in the current study. Sub-surface rate
maxima were commonly observed and attributed to photoinhibition of nitrifiers in the upper
euphotic zone (Olsen, 1981; Ward 1987; Dore and Karl 1996). Joye et al. (1999) accounted for
photoinhibition when calculating nitrification rates (rates were determined in dark incubations).
Possibilities for the observed rate maxima in the upper water column of Mono Lake include
temporal adaptation (e.g. maximum nitrification activity occurring during the night) or a shift to
a different population of nitrifiers by 2002-2003 (discussed below). Different nitrifying bacteria
have demonstrated differential susceptibility to photo-inhibition (Olson, 1981b).
Peak nitrification activity from the two Mono Lake studies generally agreed, with
differences (up to a factor of 5) that could easily be accounted for by the different rate
measurement methodologies employed. The measurements made in1995 used a 14C bicarbonate
dark fixation technique (modified from Billen, 1976) and calculated values can vary depending
on the conversion factor used to translate C fixed to NH3 oxidized (Billen, 1976; 1978). It is
possible that nitrification rates were indeed different in1995 than in 2002-2003 but Mono Lake

74
rates, in both cases (0-2,800 and 5-480 nM day-1, respectively), were comparable to rates
reported in estuarine habitats (Enoksson, 1986; Bernounsky and Nixon, 1993) and up to an order
of magnitude higher than those reported in pelagic oceanic nitrification studies. Rates in
Washington coastal waters (Ward et al., 1984), the Southern California Bight (Olsen, 1981a;
Ward, 1987), and at station ALOHA (Dore and Karl, 1996) ranged between 2 and 137 nM day-1.
Integration of the nitrification rate profiles revealed an unexpected winter maximum in
Mono Lake nitrification activity. Because of the parallel physiological and ecological
characteristics of methane oxidizers and nitrifiers (Bedard and Knowels, 1989; Holmes et
al.1995; Bodelier and Frenzel, 1999), we expected a similar pattern of nitrification and methane
oxidation activity. Integrated methane oxidation rate profiles in Mono Lake displayed steadily
increasing rates from winter to summer (Carini et al., 2005; Chapter 2) with the highest overall
activity occurring in September (unpublished data). In contrast, nitrification rates integrated over
depth indicated peak activity occurred during November (5.3 µmol m2 d-1) with the lowest rates
measured in the summer (the average Aug. integrated nitrification rate was 1.2 µmol m2 d-1).
A review of the literature suggests that a consistent seasonal pattern of NTR has failed to
emerge. Studies of NTR in marine systems (both water column and sediment) such as the Tay
Estuary in Scotland and the mid-Narragansett Bay have reported summer rate maxima
(Henrickson et al., 1981; Seitzinger et al., 1984). A positive correlation between rates and
seasonal temperatures indicated that temperature might be the major force driving NTR in those
systems (Herbert, 1999). However, reports of nitrification rates in Danish coastal waters, the
upper- Narragansett Bay, and Chesapeake Bay described summer NTR minima. The authors
hypothesized that reduced O2 concentrations and competition for NH3 inhibited activity during
the summer at those sites (Hansen et al., 1981; Ward, 1984). Physio-chemical and biological

75
factors that may influence nitrification activity have been derived, by and large, from culture
studies. Furthermore many of these parameters, such as those mentioned above, are
interdependent to varying degrees and it is difficult to extrapolate the role of individual affects
between systems (Herbert, 1999). For example, increases in temperature may stimulate enzymes
associate with nitrification (Hansen, 1980) but could also decrease O2 solubility, which could
indirectly reduce nitrification rates. Similarly interdependent variables that can affect activity
may explain some of the apparent contradictory data reported. We hypothesize that maximal
nitrification rates observed in November resulted from increased NH3 availability due to the
breakdown of seasonal stratification.
AOB Phylogenetic Succession
The bacterial ammonia-oxidizing community in Mono Lake documented during this
study was dominated by AOB affiliated with nitrosomonads and consisted mainly of
Nitrosomomas species. Only sequences associated with the β-Proteobacteria were identified (Fig.
3.3). Screening of Mono Lake water samples with the NOC primer pair indicated a lack of
detectable AOB affiliated with the γ-Proteobacteria. These results are counterintuitive because it
would appear likely that ammonia-oxidizing γ-Proteobacteria and Nitrosospira species from the
β-Proteobacteria could better adapt to the hypersaline conditions in Mono Lake. The first AOB
isolated from a saline (marine) environment, Nirosococcus oceani, is affiliated with the γ-
Proteobacteria (Watson, 1965) and related species are widely distributed in marine environments
(Ward and O’Mullan, 2002). Nitrosospira species outnumber Nitrosomonas species (by a factor
of 2-3) in marine environments (Stephen et al., 1996; Bano and Hollibaugh, 2000; Hollibaugh et
al., 2002). However, the genus Nitrosomonas does include some marine species identified in the

76
polar oceans (Bano et al., 2000; Hollibaugh et al., 2002), and other halotolerant species including
N. halophila and some N. europaea strains (Koops et al., 1991),
In fact, Nitrosomonas sequences dominated the Mono Lake AOB population in 1995
(Ward et al., 2000). The bacterial ammonia-oxidizing community in 1995 consisted of sequences
with very high affinity to N. europaea and N. eutropha sequences (Ward et al., 2000). Thirty-
four unique sequences derived from NitAB amplifications were most closely related to N.
europaea (> 95% similarity) and 5 were not differentiable (< 2.5% different) from the sequence
of N. eutropha (Stackebrandt and Goebel, 1994; Ward et al., 2000). Primers specific for γ-
Proteobacteria did not produce amplicons from any samples and only sequences associated with
the β-proteobacteria were identified (Ward et al., 2000).
The robustness of results from Mono Lake in 1995 was tested by the authors using
multiple, independent PCR reactions with several different primer sets at two separate
laboratories and combined with DGGE analysis. They concluded that environmental parameters
such as salinity and temperature most likely exerted greater selection on functional rather than
ribosomal genes that may have accounted for physiological diversity that could have allowed
sub-species of N. europaea to become acclimated to alkaline, high-salinity environments such as
Mono Lake (Ward et al., 2000). These results suggest that N. europaea- and N. eutropha-like
bacteria were present and most likely the dominant members of the AOB population of Mono
Lake in 1995.
Although the phylogenetic data from this study and the data presented in Ward et al.
(2000) were collected from different sampling sites (see above), general cross-site phylogenetic
comparisons between these two stations revealed very similar population distributions
(Hollibaugh et al. 2001; Humayoun et al., 2003) with minor differences resulting more from

77
improved methodology than to true differences between the sites or sampling times. Sequence
data from this study relative to 1995 Mono Lake data indicated a decrease in diversity and a shift
in community composition at the species level. Only 8 unique clone sequences were retrieved
during 2002-2003 and a single Nitrosomonas sequence accounted for approximately 48% of the
nitrifier clone library. While the population was still dominated by Nitrosomonas species (Fig.
3.3), none of the sequences were most closely related to N. europaea strains (7-11% difference).
Re-examination of the phylogenetic affiliations of the 1995 sequences (using BLAST) confirmed
the original results (Ward et al., 2000) ensuring that new additions to the sequence database were
not responsible for the observed phylogenetic differences between the two studies. Pair-wise
sequence alignments also established that sequences retrieved during the current study were
distinct from 1995 sequences. The possibility that the observed difference in nitrifier phylogeny
between the two studies was due to the different sampling locations cannot be ruled out.
However, it seems highly unlikely that two divergent populations with no detectable common
affiliations could co-exist within the proximity of these sites given the hydrological mixing
model referenced above.
The combination of geochemical profiles, nitrification rate measurements, and
phylogenetic information all suggest a discontinuity in Mono Lake nitrification activity and
nitrifier populations between 1995 and 2003-2003. Contrasting hydrological mixing regimes
resulting in differential NH3 availability in the mixolimnion may have contributed to the
observed pattern. The 1995 study was conducted at the end of an extended period of monomixis
during which the annual fall turnover redistributes nutrients (NH3) that have been
compartmentalized by seasonal stratification. Ammonium concentrations in Mono Lake
generally increase in late November as nutrient-rich bottom water is entrained into the upper

78
water column. Elevated NH3 concentrations (20-40 µM) decline slowly throughout the winter
(due mostly to the efflux of volatile NH3) until the spring algal bloom in March (Melack and
Jellison, 1998). Ammonia concentrations during 1995 decreased to 1.3 µM during the March
algal bloom but then increased (likely due to Artemia excretion) through June and July to a peak
concentration of 5.5 µM. As a result of this annual cycle, mixolimion NH3 concentrations during
monomictic periods (and in particular 1995) were > 3 µM for up to 60 % of the year (Melack
and Jellison, 1998).
The transition to a meromictic regime in 1996 changed the nitrogen dynamics in the
mixolimnion considerably. Ammonium that accumulated in the monimolimnion remained
confined there due to a strong pycnocline. Mixolimion NH3 concentrations were limited by
diffusion across the pycnoline, which drastically reduced NH3 availability to the upper water
column. Ammonium concentrations became chronically low and by 1997 mixolimnetic
concentrations were < 1µM throughout the year (Melack and Jellison, 1998). Nitrifier
populations became undetectable in the first few years (1997-1998) following the transition to
meromixis (Hovanec, 1998). It is possible that the previous population dominated by
N.europaea-like sequences was unable to adapt to meromictic conditions and the resulting
change in mixolimion NH3 availability. Ammonia-oxidizing bacteria are notoriously slow
growing (Prosser, 1989) and recovery from environmental perturbations may proceed slowly.
The observed shift in nitrifier phylogeny from 1995 to 2002-2003 may reflect the development
of a nitrifier population more adapted to meromictic conditions and the associated decrease in
NH3 availability.
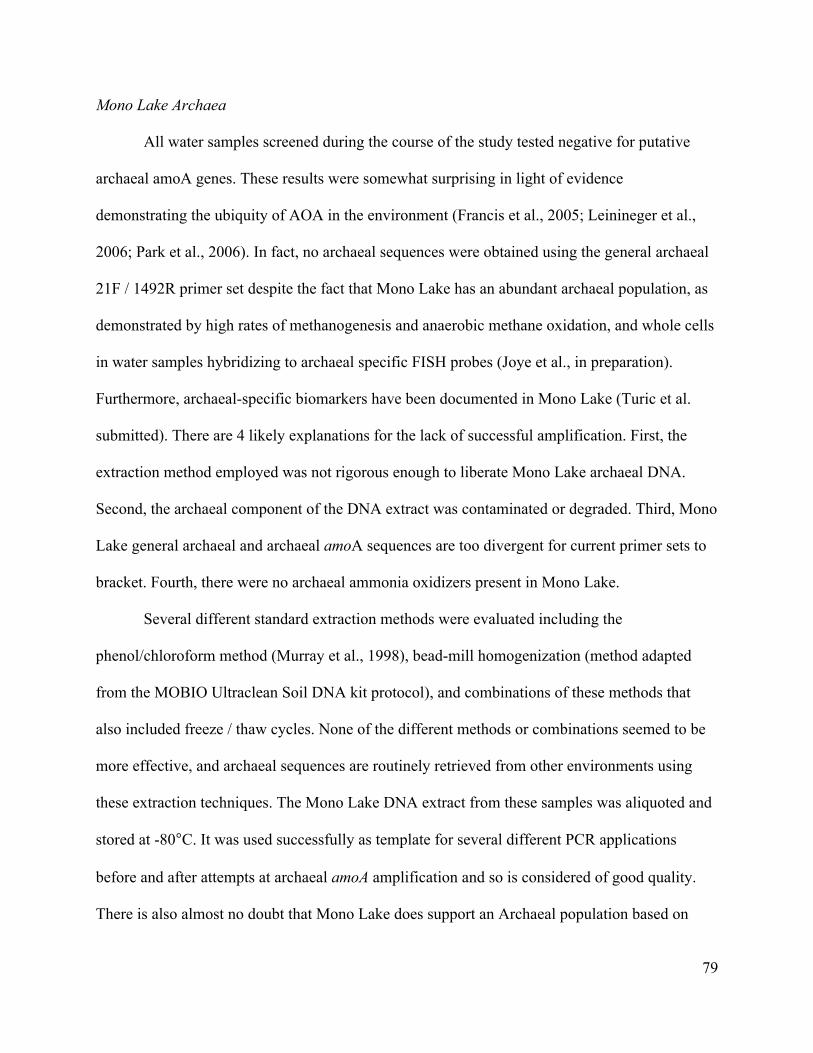
79
Mono Lake Archaea
All water samples screened during the course of the study tested negative for putative
archaeal amoA genes. These results were somewhat surprising in light of evidence
demonstrating the ubiquity of AOA in the environment (Francis et al., 2005; Leinineger et al.,
2006; Park et al., 2006). In fact, no archaeal sequences were obtained using the general archaeal
21F / 1492R primer set despite the fact that Mono Lake has an abundant archaeal population, as
demonstrated by high rates of methanogenesis and anaerobic methane oxidation, and whole cells
in water samples hybridizing to archaeal specific FISH probes (Joye et al., in preparation).
Furthermore, archaeal-specific biomarkers have been documented in Mono Lake (Turic et al.
submitted). There are 4 likely explanations for the lack of successful amplification. First, the
extraction method employed was not rigorous enough to liberate Mono Lake archaeal DNA.
Second, the archaeal component of the DNA extract was contaminated or degraded. Third, Mono
Lake general archaeal and archaeal amoA sequences are too divergent for current primer sets to
bracket. Fourth, there were no archaeal ammonia oxidizers present in Mono Lake.
Several different standard extraction methods were evaluated including the
phenol/chloroform method (Murray et al., 1998), bead-mill homogenization (method adapted
from the MOBIO Ultraclean Soil DNA kit protocol), and combinations of these methods that
also included freeze / thaw cycles. None of the different methods or combinations seemed to be
more effective, and archaeal sequences are routinely retrieved from other environments using
these extraction techniques. The Mono Lake DNA extract from these samples was aliquoted and
stored at -80°C. It was used successfully as template for several different PCR applications
before and after attempts at archaeal amoA amplification and so is considered of good quality.
There is also almost no doubt that Mono Lake does support an Archaeal population based on

80
measurements of processes known to be mediated by archaea and whole cell hybridizations of
several different archaeal specific FISH probes. Yet, to date, no evidence of archaeal DNA
recovered from Mono Lake water column samples has been reported. It is certainly possible that
there are no AOA in Mono Lake; however, FISH analysis described below indicated the
presence of Crenarchaeota, the phylum that encompasses known archaeal ammonia oxidizers.
Crenarchaeotes were present in all samples examined and their abundance correlated with peak
nitrifying activity suggesting some AOA may occur in Mono Lake and therefore archaeal amoA
gene sequences should be present. It follows from this reasoning that sequence divergence is the
most likely candidate for the inability to retrieve archaeal 16S or functional gene (amoA)
sequences from Mono Lake and that further investigation and methods development is needed to
address the distribution of archaea in Mono Lake.
Potential Importance of Archaeal vs. Bacterial Ammonia Oxidizers
The relationship between AOB distribution and nitrification rates demonstrated a
negative correlation between AOB abundance and nitrification activity. Absolute AOB cell
numbers between the two August samplings (2002 and 2003) were not significantly different
from each other but did differ significantly from the November and May cell numbers (ANOVA,
p < 0.01). However, AOB abundance did not vary significantly (ANOVA, p > 0.05) over depth
on specific dates (Fig. 4.4). Ammonium, O2, and DOC concentrations are key factors that may
control AOB distribution (Kowalchuk et al., 1998; Bothe et al., 2000; Okabe et al., 2003). AOB
in this study were exposed to a range of NH3 and O2 concentrations over time and depth (Fig.
3.4) and their distributions did not correlate with either NH3 or O2 concentrations (regression p >
0.05). DOC concentrations may indirectly affect AOB abundance and distribution. Previous

81
studies have shown that heterotrophic bacteria have a higher affinity for O2 and may out-compete
AOB under conditions of high DOC and low O2 concentrations (Macfarlane and Herbert, 1984).
DOC concentrations (10-80 mg l-1) in Mono Lake are consistently high (Domagalski et al., 1989;
Hollibaugh et al., 2001; Humayoun et al., 2003; Giri et al., 2004), including through the oxycline
where O2 falls below detection limits, yet AOB abundance remains constant over depth for every
sample period.
Regression analysis was used to evaluate the correlation between temperature (T) and
AOB abundance. However, analysis based on T vs. AOB cell numbers did not suggest any
pattern (regression p > 0.05 for each sampling and the sum of all data points). However, when
cell numbers were plotted against season, a linear regression yielded an R2 value of 0.992 (p <
0.05) indicating that AOB cell numbers followed a seasonal progression with the highest
abundance occurring during August (Fig. 3.4). However, this seasonality is inversely correlated
with the seasonal pattern of integrated nitrification activity, driving a negative correlation
between AOB abundance and nitrification activity.
FISH analysis using probe Cren537 indicated that Crenarchaeotes were present in all
samples and their abundance varied over space and time (Fig. 3.4). Absolute Crenarchaeota cell
numbers exhibited a strong correlation with NTR rate measurements (regression p < 0.05 for
Aug, 2002 and May 2003 and p < 0.01 for the sum of all data points excluding Nov. 2002; Table
3.1). Similarly, an enrichment culture of Crenarchaeota from North Sea water demonstrated that
Crenarchaeota abundance, but not that of AOB, correlated with NTR (Wuchter et al. 2006). A
similar time series study also revealed that the abundance of the gene encoding for the archaeal
amoA was strongly correlated with a decline in ammonium concentrations and with the
abundance of Crenarchaeota (Wuchter et al., 2006). The North Sea data provides robust

82
presumptive evidence that Crenarchaeota provide a good proxy for AOA. Although an AOA
contribution to nitrification in Mono Lake cannot be ruled out, the correlative nature of the data
and the lack of archaeal amoA amplification make it impossible to assess the relative
contribution to nitrification of archaeal and bacterial ammonia oxidation in Mono Lake.
SUMMARY
Geochemical profiles and 15N tracer experiments demonstrated that significant
nitrification activity was occurring in Mono Lake during this study. Biogeochemical and
phylogenetic data indicated that nitrification was also occurring in Mono Lake in 1995.
However, evidence from a study conducted during1997 and 1998 suggests a discontinuity in
Mono Lake nitrification activity and nitrifier populations occurred between 1995 and 2003-2003.
Contrasting hydrological mixing regimes resulting in differential NH3 availability in the
mixolimnion may have contributed to the observed shift in AOB phylogeny. FISH data revealed
that AOB cell numbers followed a seasonal progression inversely correlated with the seasonality
observed in integrated nitrification rates suggesting a negative correlation between AOB
abundance and nitrification activity. Crenarchaeota cell numbers exhibited a strong correlation
with NTR rate measurements but in itself did not provide enough evidence to attribute any
quantifiable nitrification activity to AOA.
LITERATURE CITED
Álvarez-Salgado, X. A. and A. E. J. Miller 1998. Simultaneous determination of dissolved
organic carbon and total dissolved nitrogen in seawater by high temperature catalytic
oxidation: conditions for precise shipboard measurements. Mar. Chem. 62: 325-333.

83
Bernounsky, V. M. and S. W. Nixon, 1993. Rates of nitrificationalong an estuarine gradient in
Narragansett Bay. Estuaries, 16: 718-730.
Bano, N. and J. T. Hollibaugh, 2000. Diversity and distribution of DNA sequences with affinity
to ammonia-oxidizing bacteria of the b sub-division of the class Proteobacteria in the
Artic Ocean. Appl. Environ. Microbiol. 66: 1960-1969.
Bédard, C and R. Knowles. 1989. Physiology, biochemistry, and specific inhibitors of CH4,
NH4+, and CO oxidation by methanotrophs and nitrifiers. Microbiol Mol Biol Rev. 53:
68-84.
Bendschneider, K., and R. J. Robinson. 1952. A new spectrophotometric method for the
determination of trite in sea water. J. Mar. Res. 11:87-96
Bock, E. and M.Wagner 2001. Oxidation of inorganic nitrogen compounds as an energy source.
in The Prokaryotes eds. Dworkin, M. et al. Springer New York.
Bodelier, P.L.E and Peter Frenzel. 1999. Contribution of methanotrophic and nitrifying bacteria
to CH4 and NH4+ oxidation in the rhizosphere of rice plants as determined by new
methods of discrimination. Appl. Envir. Microbiol. 65: 1826-1833.
Bothe, H., G. Jost, M. Schloter, B. B. Ward, and K-P Witzel. 2000. Molecular analysis of
ammonia oxidation and denitrification in natural environments. FEMS Microbiol. Rev.
24: 673-690.
Carini, S. A., N. Bano, G. LeCleir, and S. B. Joye. 2005. Aerobic methane oxidation and
methanotroph community composition during seasonal stratification in Mono Lake,
California (USA). Environ. Microbiol. doi:10.1111/j.1462-2920.2005.00786.x
Codispoti, L. A. and J. P. Christensen. 1985. Nitrification , denitrification and nitrous oxide
cycling in the eastern tropical North Pacific ocean. Mar. Chem. 16: 277-300.
84
Cloern, J. E., B. E. Cole, and R. S. Oremland. 1983. Autotrophic processes in Meromictic Big
Soda Lake, Nevada. Linol. Oceanog. 28:1049-1061.
Crutzen, P. J. 1970. Influence on nitrogen oxides on atmospheric ozone content. Quart. J. Royal
Meterol. Society. 96: 320-328.
Delong, E. F. 1992. Archaea in coastal marine environments. Proc. Natl. Acad. Sci. USA 89:
5685-5689.
Domagalski, J. L., W. H. Orem, and H. P. Eugster. 1989. Organic geochemistry and brine
composition in Great Salt, Mono, and Walker Lakes. Geochim. Cosmochim. Acta
53:2857–2872.
Dore, J. E. and D. M. Karl 1996. Nitrification in the euphotic zone as a source for nitrite, nitrate,
and nitrous oxide at Station ALOHA. Limnol. Oceanogr. 41: 1619-1628.
Enoksson, V. 1986. Nitrification rates in the Baltic Sea: Comparison of three isotope techniques.
Appl. Environ. Microbiol. 51: 244-250
Ferrari, V. C., and J. T. Hollibaugh. 1999. Distribution of microbial assemblages in the central
Arctic Ocean basin studied by PCR/DGGE: analysis of a large data set. Hydrobiologia
401:55–68.
Francis, C. A., Roberts, K. J., Beman, J. M., Santoro, A. E. & Oakley, B. B. 2005. Ubiquity and
diversity of ammonia-oxidizing Archaea inwater columns and sediments of the ocean.
Proc. Natl. Acad. Sci. USA 102, 14683–14688.
Giri, B. J., N. Bano, and J. T. Hollibaugh. 2004. Distribution of RuBisCO genotypes along a
redox gradient in Mono Lake, California. Appl. Environ. Microbiol. 70: 3443-3448.
Hansen, J. I. 1980. Potential nitrification in marine sediments. MSc. University of Aarhus,
Denmark.

85
Hansen, J. I., K. Henricksen, and T.H. Blackburn. 1981. Seasonal distribution of nitrifying
bacteria and rates of nitrification in coastal marine sediments. Microb. Ecol. 7: 297-304.
Hallam SJ, Mincer TJ, Schleper C, Preston CM, Roberts K, et al. 2006. Pathways of carbon
assimilation and ammonia oxidation suggested by environmental genomic analyses of
marine Crenarchaeota. PLoS Biol 4(4): e95.
Hastings, R. C., J. R. Saunders, G. H. Hall, R. W. Pickup, and A. J. McCarthy. 1998. Application
of molecular biological techniques to a seasonal study of ammonia oxidation in a
eutrophic freshwater lake. Appl. Environ. Microbiol. 64:3674–3682.
Head, I. M., W. D. Hiorns, T. M. Embley, A. J. McCarthy, and J. R. Saunders. 1993. The
phylogeny of autotrophic ammonia-oxidizing bacteria as determined by analysis of 16S
ribosomal RNA gene sequences. J. Gen. Microbiol. 139: 1147-1153.
Herbert, R. A. 1999. Nitrogen cycling in coastal marine ecosystems. FEMS Microbiol. Rev. 22:
421-437.
Henricksen, K., J. I. Hansen, and T.H. Blackburn. 1981. Rates of nitrification, distribution of
nitrifying bacteria, and nitrate fluxes in different types of sediment from Danish waters.
Mar. Biol. 61: 299-304.
Herndl, G. J., Reinthaler, T., Teira, E., van Aken, H., Veth, C., Pernthaler, A. & Pernthaler, J.
2005. Contribution of archaea to total prokaryotic production in the deep Atlantic Ocean.
Appl. Environ. Microbiol. 71, 2303–2309.
Hollibaugh, J. T., P. S. Wong, N. Bano, S. K. Pak, E. M. Prager, and C. Orrego. 2001.
Stratification of microbial assemblages in Mono Lake, California, and response to a
mixing event. Hydrobiologia 466:45–60.

86
Hollibaugh, J. T., N. Bano, and H. W. Ducklow. 2002. Widespread distribution in Polar oceans
of a 16S rRNA gene sequence with affinity to Nitrosospira-like ammonia-oxidizing
bacteria. Appl. Environ. Microbiol. 68: 1478-1484.
Holmes, A. J., et al. .1995. Evidence that particulate methane monooxygenase and ammonia
monooxygenase may be evolutionarily related. FEMS Microbiol. Lett. 132: 203-208.
Hovanec, T.A. 1998. Ph.D. Dissertation. Characterization of the Nitrifying Bacteria in Aquaria
and Mono Lake, California, Using Molecular Methods. University of California, Santa
Barbara. 203p.
Humayoun S. B., N Bano, J. T. Hollibaugh. 2003. Depth distribution of microbial diversity in
Mono Lake, a meromictic soda lake in California. Appl. Environ. Microbiol. 69: 1030-
1042.
Indrebø, G., B. Pengerund, and I. Dundas. 1979. Microbial activities in a permanently stratified
Estuary. 2. Microbial activities at the oxic-anoxic interface. Marine Biol. 51: 305-309.
Jellison, R., and J. M. Melack. 1993. Meromixis in hypersaline Mono Lake, California. 1.
Stratification and vertical mixing during the onset, persistence, and breakdown of
meromixis. Limnol. Oceanogr. 38:1008–1019
Jellison, R., S. Macintyre and F.J. Millero. 1999. Density and conductivity properties of Na-CO3-
Cl-SO4 brine from Mono Lake, California, USA International Journal of Salt Lake
Research 8: 41–53.
Jenkens, M.C. and W.M. Kemp. 1984. The coupling of nitrification and denitrification in two
estuarine sediments. Limnol. Oceanogr. 29:609-619.
Joye, S. B., T. L. Connell, L. G. Miller, R. S. Oremland, and R. S. Jellison. 1999. Oxidation of
ammonia and methane in an alkaline, saline lake. Limnol. Oceanogr. 44:178–188.

87
Joye, S. B. and H. W. Pearl. 1994. Nitrogen cycling in microbial mats – rates and patterns of
denitrification and nitrogen fixation. Mar. Biol. 119: 285-295.
K"o"""n"n"e"k"e"," "M"."," "B"e"r"n"h"a"r"d"," "A"." "E"."," "d"e" "l"a" "T"o"r"r"e"," "J"." "R"."," "W"a"l"k"e"r"," "C"." "B"."," "W"a"t"e"r"b"u"r"y"," "J"." "B"." "&" "S"t"a"h"l"," "D"." "A"."
"2"0"0"5". Isolation of an autotrophic ammonia-oxidizing marine archaeon. "N"a"t"u"r"e" "4"3"7": "5"4"3-
"5"4"6"."autotrophic ammonia-oxidizing marine archaeon. Nature 437: 543-546.
Koops, H.-P., B. Bottcher, U. C. Moller, A. Pommerening-Roser, and G. Stehr. 1991.
Classification of eight new species of ammonia-oxidizing bacteria: Nitrosomonas
communis sp. nov., Nitrosomonas ureae sp. nov., Nitrosomonas aestuarii sp. nov.,
Nitrosomonas marina sp. nov., Nitrosomonas nitrosa sp. nov., Nitrosomonas eutropha
sp. nov., Nitrosomonas oligotropha sp. nov. and Nitrosomonas halophila sp. nov. J. Gen.
Microbiol. 137:1689–1699.
Kowalchuk, G. A., P. L. E. Bodelier, et al. 1998. Community analysis of ammonia-oxidizing
bacteria in relation to oxygen availability in soils and root-oxygenated sediments, using
PCR, DGGE, and oligonuleotide probe hybridization. FEMS Microb. Ecol. 27: 339-350.
Leinineger, S., T. Urich, M.Scholter, L Schwark, et al. 2006. Archaea predominate among
ammonia-oxidizing prokaryotes in soils. Nature Letters 442: 806.
Liesack, W., H. Weyland, and E. Stackebrandt. 1991. Potential risks of gene amplification by
PCR as determined by 16s rDNA analysis of a mixed-culture of strict barophilic bacteria.
Microb. Ecol. 21: 191-198.
Macfarlane, G. T. and R. A. Herbert. 1984. Dissimilatory nitrate reduction and nitrification in
estuarine sediments. J. General Microbiol. 130: 2301-2308.
MacIntyre, S., K. M. Flynn, R. Jellison, and J. R. Romero. 1999. Boundary mixing and nutrient
fluxes in Mono Lake, California. Limnol. Oceanogr. 44: 512-529.

88
Martens, C.S. and R.A. Berner and Berner, 1977. Interstitial water chemistry of anoxic Long
Island Sound sediments 1. Dissolved Gases, L&O 22:10-25
McDonald, R. M. L. 1979. Nitrification in soil: an introductory history, p. 1-16. In J. I. Prosser
(ed.), Nitrification. IRL Press, Oxford, United Kingdom.
Melack, J. M., and R. Jellison. 1998. Limnological conditions in Mono Lake: contrasting
monomixis and meromixis in the 1990s. Hydrobiologia 384: 21–39.
Miller, L. G., R. Jellison, R. S. Oremland, and C. W. Culbertson. 1993. Meromixis in hypersaline
Mono Lake, California. 3. Biogeochemical response to stratification and overturn.
Limnol. Ocean. 38: 1040-1051.
Mobarry, B. K., M. Wagner, V. Urbain, B. E. Rittmann, and D. A. Stahl. 1996. Phylogenetic
probes for analyzing abundance and spatial organization of nitrifying bacteria. Appl.
Environ. Microbiol. 62: 2156-2162
Mulder, A., A. A. van de Graaf, L. A. Robertson, and J. G. Kuenen. Anaerobic ammonium
oxidation discovered in a denitrifying fluidized bed reactor. 1998. FEMS Microbiology
Reviews 22: 421-431.
Murray, A.E., C. M. Preston, R. Massana, L. T. Taylor, A. Blakis, K. Wu, and E. F. DeLong.
1998. Seasonal and Spatial Variability of Bacterial and Archaeal Assemblages in the
Coastal Waters near Anvers Island, Antarctica. Appl. Environ. Microbiol. 64: 2585-2595.
Murray, A. E., Hollibaugh, J. T., and C. Orrego. 1996. Phylogentetic compositions of
bacterioplankton from two California Estuaries compared by denaturing gradient gel
electrophoresis of 16S rDNA fragments. Appl. Environ. Microbiol. 62: 2979-2680.
Okabe, S ., T. Kindaichi, Tsukasa Ito, Hisashi Satoh. 2003. Analysis of Size Distribution and
Areal Cell Density of Ammonia-Oxidizing Bacterial Microcolonies in Relation to

89
Substrate Microprofiles in Biofilms Published online 25 November 2003 in Wiley
InterScience (www.interscience.wiley.com). DOI: 10.1002/bit.10864
Olson, R. J. 1981 a. 15N tracer studies of the primary nitrite maximum. J. Mar. Res. 39:
203-226.
Olson R. J. 1981 b. Differential photoinhibition of marine nitrifying bacteria: a possible
mechanism for the formation of the primary nitrite maximum. Journal of Marine
Research, 39,227-238.
Park, H-D, G. F. Wells, H. Bae, C. S. Criddle, and C. S. Francis. 2006. Occurrence of ammonia-
oxidizing archaea in wastewater treatment plant bioreactors. Appl. Environ. Microbiol.
72: 5643-5647.
Pernthaler, J., F.O Glöckner, W. Schönhuber, and R. Amann. 2001. Fluorescence in situ
hybridization (FISH) with rRNA-targeted Oligonucleotide probes, p. 207-226. In J. Paul
(ed.), Methods in Microbiology: Marine Microbiology, Vol. 30, Academic Press Ltd.,
San Diego.
Phillips, C.J., E.A. Paul, and J.I. Prosser. 2000. Quantitative analysis if ammonia oxidizing
bacteria using competitive PCR. FEMS Microbiol. Ecol. 32: 167-175.
Prosser, J. I. 1989. Autotrophic nitrification in bacteria. Adv. Microb. Physiol. 30: 125-181.
Ritchie, G. A. F. and D.J. Nicholas, 1972. Identification of sources of nitrous oxide produced by
oxidative and reductive processes in Nitrosomonas euopaea. Biochem. J. 126: 1181-1189.
Schleper, C., Jurgens, G. & Jonuscheit, M. 2005. Genomic studies of uncultivated archaea. Nat.
Rev. Microbiol. 3: 479–488.
Seitzinger, S. P., M. E. Pilson, and S. W. Nixon. 1983. N2O production in nearshore marine
sediments. Science 222: 1244-1246.

90
Seitzinger, S. P., S. W. Nixon, and M. E. Q. Pilson. 1984 Denitrification and nitous oxide
production in a coastal marine ecosystem. Linmol. Oceanog. 29: 73-83.
Sigman , D. M., M. A Altabet, R. Michener, D.C. McCorckle, B. Fry, and R. M. Holmes. 1997.
Natural abundance-level measurement of the nitrogen isotopic composition of oceanic
nitrate: an adaptation of the ammonia diffusion method. Marine Chem. 57: 227-242.
Stackebrandt, E. and B. M. Goebel 1994. A place for DNA-DNA rassociation and 16S
ribosomal-RNA sequence analysis in the present species definition of bacteriology.
Intern. J. System. Bateriol. 44: 846-849.
Stephen, J. R., A. E. McCaig, Z. Smith, J. I. Prosser, and T. M. Embley. 1996. Molecular
diversity of soil and marine 16S rRNA gene sequences related to -subgroup ammonia-
oxidizing bacteria. Appl. Environ. Microbiol. 62:4147– 4154.
Venter, J. C., Remington, K., Heidelberg, J. F., Halpern, A. L., Rusch, D., Eisen, J. A., Wu, D.
Y., Paulsen, I., Nelson, K. E., Nelson, W., et al. 2004. Environmental genome shotgun
sequencing of the Sargasso Sea. Science 304, 66–74.
Voytek, M. A., and B. B. Ward. 1995. Detection of ammonium-oxidizing bacteria of the beta-
subclass of the class Proteobacteria in aquatic samples with the PCR. Appl. Environ.
Microbiol. 61:1444–1450.
Ward, B. B. 1987. Nitrogen transformations in the Southern California Bight. Deep-Sea Res.
34:785–805.
Ward, B. B. 1986. Nitrification in marine environments. In: Nitrification (Prosser, J. I. Ed.) pp
157-184. IRL Press, Oxford.
91
Ward B. B., M. C. Talbot And M. J. Perry. 1984. Contributions of phytoplankton and nitrifying
bacteria to ammonium and nitrite dynamics in coastal waters. Continental Shelf
Research, 3,383-398.
Ward, B. B., D. P. Martino, M. C. Diaz, and S. B. Joye. 2000. Analysis of ammonia-oxidizing
bacteria from hypersaline Mono Lake, California, on the basis of 16S rRNA sequences.
Appl. Environ. Microbiol. 66:2873–2881.
Ward, B. B. and G. D. O’Mullen. 2002. Worldwide distribution of Nitrosococcus oceani, a
marine ammonia-oxidizing gamma-proteobacterium, detected by PCR and sequencing of
16S rRNA and amoA genes. Appl. Environ. Microbiol. 68: 4153-4157.
Weiss, R. F. and B.A. Price, 1980. Nitrous oxide solubility in water and seawater. Mar. Chem. 8:
347-359.
Wuchter, C., et al. 2003. Bicarbonate uptake by marine Crenarchaeota. FEMS Microbiol.
Lett.219: 203-207
Wuchter, C., et al. 2006. Archaeal nitrification in the ocean. Proc. Natl. Acad. Sci. USA. 103:
12317-12322.

92
Table 3.1. Regression R2 values and statistical significance of NH3 oxidation rates versus AOB
abundance, Crenarchaeota abundance, and NH4+, NO3
-, and N2O concentrations. Values are
presented for individual sampling dates as well as the sum of all data points. AOB cell specific
nitrification rates are also listed.
Depth Rate AOB Cren fmol NH3 NH4+ NO3
- N2O
Sample (m) (nM NH3 d-1) (104 ml-1) (10 5 ml-1) h-1 AOB-1 (µM) (nM) (nM)
Aug. 2002 3 26.6 1.1 88.8 10.95 62.7 5.8 3.6 0.05 1.3 208.8 17.710 86.8 5.8 5.8 0.06 1.0 421.8 28.011 141.3 1.5 448.0 29.512 208.1 3.4 471.7 30.213 459.2 5.7 8.2 0.34 5.9 482.7 25.5
13.5 219.3 7.9 302.2 19.614 140.9 5.6 3.6 0.10 9.5 237.2 17.515 76.0 14.6 175.7 14.9
* P < 0.05 16 30.3 5.8 3.0 0.02 20.6 82.8 9.1
R2 0.25 0.76 * 0.02 0.49 * 0.28
Nov. 2002 3 228.9 3.2 4.4 0.30 10.9 204.0 25.28 336.6 3.0 4.0 0.46 8.2 300.0 32.813 370.6 3.2 6.2 4.84 4.5 350.0 41.315 357.2 3.2 2.8 0.47 4.8 340.0 32.718 322.8 3.3 2.5 0.41 5.4 210.0 25.5
* P < 0.05 20 55.5 9.8 180.0 19.0R2 0.01 0.0 0.55 0.61 0.69 *
May-03 3 20.8 1.1 66.0 15.85 54.8 4.6 5.1 0.05 1.1 174.2 22.810 90.9 4.4 6.5 0.09 1.2 356.5 33.012 204.0 1.6 431.2 34.813 320.7 4.6 8.5 0.29 2.1 439.1 27.014 417.3 4.7 9.4 0.37 4.2 257.0 17.815 205.6 10.5 146.0 9.3
* P < 0.05 16 29.6 4.6 6.5 0.03 16.1 94.2 7.2R2 0.48 0.89 * 0.02 0.29 0.03
Aug. 2003 3 4.57 1.0 59.2 20.35 3.95 5.8 5.6 0.00 0.8 57.0 20.710 14.71 5.8 6.1 0.01 1.5 37.9 20.411 28.53 1.5 36.2 23.312 44.02 1.4 36.2 25.813 70.93 6.2 8.2 0.05 1.2 58.6 31.7
13.5 279.57 1.2 164.0 36.414 479.98 6.1 9.4 0.33 2.2 441.4 39.7
** P < 0.01 15 356.92 6.8 406.9 34.8* P < 0.05 16 62.83 6.2 8.1 0.04 24.0 190.9 19.2
R2 0.13 0.6 0 0.86 ** 0.80 **
Total R2 0.18 0.06 0.004 0.48 ** 0.32 **w/o Nov. 0.45 **

93
FIGURE LEGENDS
Figure 3.1. Vertical depth profiles of temperature (- -), oxygen (-O-), and excess density (--)
in Mono Lake from August 2002 (a), November 2002 (b), May 2003 (c), and August 2003 (d).
Temperature and excess density values are scaled down by a factor of 10.
Figure 3.2. Vertical depth profiles of nitrification rate (NTR) and biogeochemical parameters in
Mono Lake from August 2002, November 2002, May 2003, and August 2003: Nitrification
Rates (a), Ammonium concentration (b), Nitrate +nitrite, (c), and nitrous oxide (d).
Figure 3.3. Phylogenetic relationship of ammonia-oxidizing bacterial clone sequences from the
Mono Lake water column. The tree was constructed using the neighbor-joining method and
Jukes-Cantor distances. Bootstrap values > 50% (100 iterations) are indicated at the appropriate
nodes. The scale bar represents 5% sequence divergence.
Figure 3.4. Vertical profiles of ammonia-oxidizing bacterial, Crenarchaeota abundance, and
corresponding nitrification rates. Error bars are standard deviations around the mean. (a) August
2002, (b) November 2002, (c) May 2003, (d) August 2003.

94
Figure 3.1.
0
5
10
15
20
0 2 4 6 8
Aug. 2002
Dep
th (m
)
T (C)/10
Excess Density(mg/l)/10
O2 (mg/l)
0
2
4
6
8
10
12
14
16
18
20
0 2 4 6 8
Nov. 2002
0
2
4
6
8
10
12
14
16
18
20
0 2 4 6 8
May 2003
0
2
4
6
8
10
12
14
16
18
20
0 2 4 6 8
Aug. 2003
a. b. c. d.
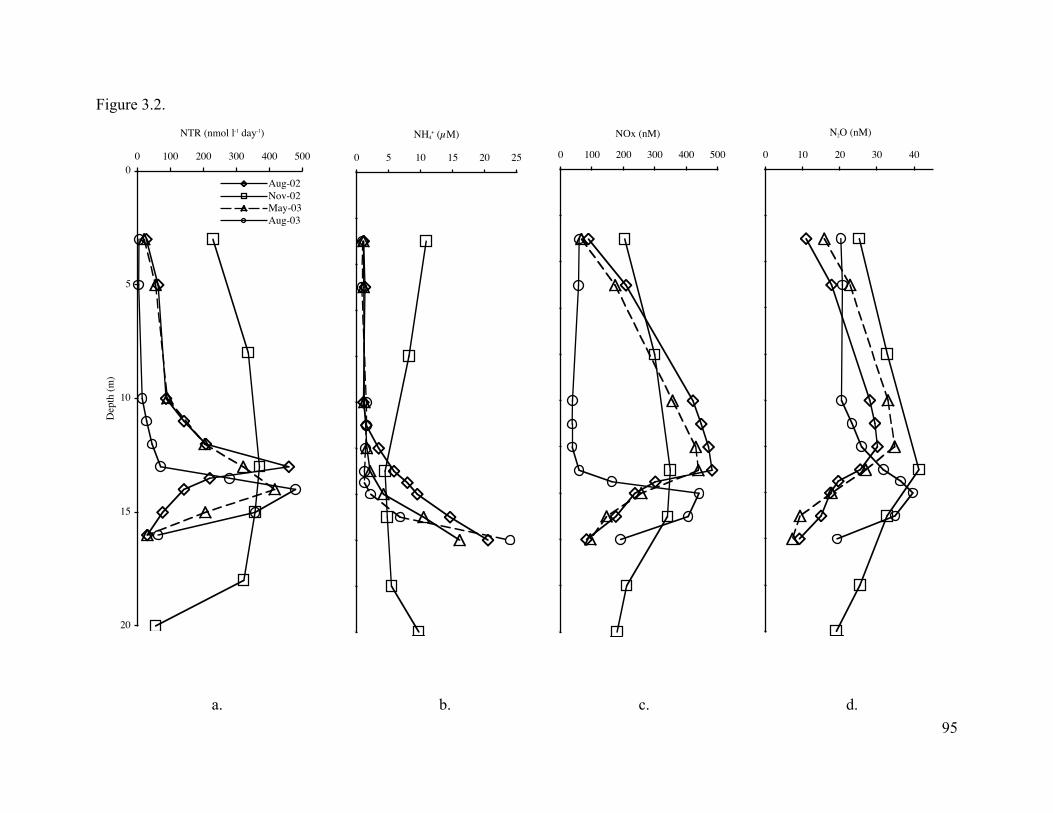
95
Figure 3.2.
0
5
10
15
20
0 100 200 300 400 500
NTR (nmol l-1 day-1)
Dep
th (m
)
Aug-02Nov-02May-03Aug-03
0
2
4
6
8
10
12
14
16
18
20
0 5 10 15 20 25
NH4+ (µM)
0
2
4
6
8
10
12
14
16
18
20
0 100 200 300 400 500
NOx (nM)
0
2
4
6
8
10
12
14
16
18
20
0 10 20 30 40
N2O (nM)
a. b. c. d.

96
Figure 3.3.
0.05
98
100
96
96

97
Figure 3.4.
Abundance CREN (cells x 105 ml-1); AOB (cells x 104 ml-1)
NTR Rate (nM d-1 / 25) NH3 (µM)
98
CHAPTER 4
INTRACTIONS BETWEEN METHANE OXIDATION AND NITRIFICATION ACTIVITY
AND COMMUNITY COMPOSITION IN MONO LAKE1
_______________________
1 Carini, S.A., L. Jorrel, M. Bowles, and S.B. Joye, Prepared for submission to Applied and Environmental
Microbiology

99
ABSTRACT
We examined the effects of relative substrate availability on methane oxidation,
nitrification, and associated microbial community dynamics using aerobic enrichment
cultures. Methane and ammonia oxidation activity and associated geochemistry were
compared between an un-amended control and cultures that were amended with methane
(CH4), ammonium (NH4+), or methane and ammonium (CH4+NH4
+) to determine how
group-specific diversity and abundance were affected by enrichment conditions and
whether the differential responses of group-specific populations may have correlated with
measured oxidation rates. Microbial community composition and relative group-specific
abundance in each enrichment was monitored using denaturing gradient gel
electrophoresis (DGGE), sequence analysis, and fluorescence in situ hybridization (FISH).
Methane and NH4+ oxidation rates increased over time in enrichments amended with CH4
and NH4+, respectively. The highest CH4 oxidation rates occurred in the NH4
++CH4
enrichment, inferring that methanotrophs benefited from nitrogen (N) addition. However,
FISH and DGGE analysis demonstrated that the methanotroph population in the CH4-only
enrichment was able to take advantage of elevated CH4 absent supplemental NH4+ through
increased overall methanotroph abundance and a shift in dominance of specific type II
methanotroph species. Ammonia oxidation occurred in both NH4+-only and CH4 + NH4
+
enrichments. Crenarcheota abundance correlated with NOX accumulation and nitrification
activity in the NH4+-only enrichment while AOB abundance decreased, suggesting that
ammonia-oxidizing archaea (AOA) contributed to nitrification under N-replete conditions.
In contrast, there was a decrease in crenarchaeal abundance and an increase in AOB
abundance in the CH4+NH4+ enrichment that correlated with increased nitrification

100
activity. The reversal in the correlation between AOB and nitrification relative to that
observed in the NH4+-only enrichment plus the significant decline in crenarchaeal
abundance suggests that AOB were likely more active nitrifiers in the CH4+NH4+
enrichment. We suspect that methanotrophs may have out-competed Crenarcheotes for
NH4+ in the CH4+NH4
+ enrichment.
INTRODUCTION
Methane- and ammonia-oxidation occur extensively in terrestrial and aquatic habitats and
play key roles in global carbon (C), nitrogen (N), and oxygen (O) cycles (Cicerone and
Oremland, 1988). The biochemistry, ecology, and molecular biology of methane- and ammonia-
oxidizing bacteria (hereafter referred to as MOB and AOB, respectively) have been documented
previously (Hanson and Hanson, 1996; Kowalchuk and Stephen, 2001). Biological CH4
oxidation by methanotrophs is the predominant sink mitigating the flux of CH4, a radiative trace
gas, to the atmosphere (Topp and Hanson, 1991). Ammonia oxidation to nitrite (NO2-) is the first
step in the process of nitrification, which ultimately generates nitrate (NO3-) via the coupled
action of nitrite-oxidizing bacteria (Prosser, 1989). Nitrification provides critical links to other
nitrogen cycling processes (e.g. denitrification and anammox) that regulate concentrations and
bioavailability of N in the environment.
Ammonia-oxidizing bacteria were long considered the predominant prokaryotic
contributors to aerobic ammonia oxidation (Bock and Wagner, 2001). However, a marine group I
Crenarchaeota (SCM1), possessing a unique archaeal ammonia monooxygenase subunit (amoA)
and the capacity for growth with ammonium chloride and bicarbonate as the sole energy and
carbon sources, has demonstrated the existence of ammonia-oxidizing archaea (AOA; Könneke

101
et al., 2005). More over, correlations between the abundance of amoA, Crenarchaeota, and
ammonia oxidation in the North Sea suggests that AOA may play a significant role in N cycling
in the environment (Wütcher et al., 2006). Although a direct link between amoA, Crenarchaeota,
and nitrification in the environment remains to be shown (Nicole and Schleper, 2006), the
widespread recovery of archaeal amoA sequences from diverse aquatic and terrestrial
environments (Francis et al., 2005; Lenninger et al., 2006) highlights the need to document their
role in the nitrogen cycle. What about the Lam et al paper that I sent you? That is pretty
convincing.
Physiological, biochemical, and ecological similarities between aerobic methane and
ammonia oxidizers provide opportunities for interactions that may significantly affect process
rates and group-specific population dynamics. Both MOB and AOB are obligate aerobes that
mediate contributory or predominant processes that link the reduced and oxidative phases of the
C and N cycles, respectively (Hanson and Hanson, 1996; Prosser, 1989). Methane-oxidizing
bacteria use methane as their sole source of structural carbon as well as energy. Methanotrophs
were initially grouped into two families characterized by their internal membrane arrangements
and specific C assimilation pathways. Phylogenetic relationships, derived mostly from 16S
rRNA analysis, have generally validated the original phenotypic and physiochemical taxonomy
and type I and type II methanotrophs are now recognized as distinct assemblages in the γ- and α-
Proteobacteria, respectively (Hanson and Hanson, 1996). Ammonia-oxidizing bacteria fix CO2
using energy derived from the conversion of ammonia to nitrite and are classified as members of
the β- or γ-Proteobacteria (Prosser, 1989; Head et al., 1993). Although AOA are taxonomically
divergent from MOB and AOB, they demonstrate a predominantly chemoautotrophic

102
metabolism deriving energy from the oxidation of reduced N compounds to fix inorganic C
(Wuchter et al., 2003; Könneke et al., 2005; Ingalls et al., 2006).
Substantial sequence identity exists between the genes encoding the mono-oxygenase
systems of methane (pmmo) and ammonia (amo) oxidizers. Predicted amino acid sequences of
these genes revealed substantial conservation within and between sub-classes of the
Proteobacteria and suggest that bacterial pmmo and amo are evolutionarily related (Holmes et al.
1995). Although there is no significant nucleotide homology between AOB and AOA amoA
sequences, 25% sequence identity and 40% sequence similarity at the protein level suggests that
AOB and AOA amo enzymes may share an evolutionary history with respect to amino acid
residues that influence particular enzymatic metal co-factors (Nicol and Schleper, 2006).
As a result of physiological and biochemical similarities, MOB, AOB, and AOA co-
occur where both oxygen and reduced substrates (CH4 and NH3) are available, virtually ensuring
interaction through competition for substrates. Although many studies have focused on the
metabolism of CH4 or NH3 oxidation or the effect of NH3 concentrations on CH4 oxidation and
vice versa, few have focused on the interaction between these processes (Megraw and Knowles,
1987; Roy and Knowles, 1994; Carini et al., 2003) and none have incorporated AOA in the
analyses.
Laboratory enrichment experiments provide a means to elucidate interactions between
methane and ammonia oxidation and the organisms responsible. We used samples from the
Mono Lake water column for the enrichment cultures described here. Mono Lake is an alkaline
salt lake located just east of the Sierra Nevada range in northern California (38°N, 119°W). At
the time of water collection (see methods), conditions in Mono Lake were hydrologically and
biogeochemically conducive for methane and ammonia oxidation activity and microbial

103
interactions. The lake was meromictic and the monimolimnion (bottom water) had been isolated
below the chemocline (i.e. salinity gradient or pycnocline) since 1995. This isolation resulted in
persistent anoxia and accumulation of high concentrations of dissolved CH4 (50-100 µM) and
NH3 (60-113 µM) in the monimolimnion.
Seasonal stratification resulted in a mixolimnion that penetrated to the thermocline at
approximately 12 m. The oxycline created a microaerophilic zone that encompassed an area
between 13 and 15 m at which point the O2 concentration dropped below detection limits.
Methane and NH3 concentrations in the upper water column were similar (~ 1 µM) to
concentrations measured earlier in the year. However, concentrations in the seasonally anoxic
zone (between the pycnocline and the bottom of the oxycline) and microaerophilic zone
increased, suggesting greater flux of these reduced species from the monimolimnion. Mono Lake
also has a very high dissolved inorganic carbon (DIC) concentration (~ 400 mM) ensuring AOB
and AOA would not be C limited during the enrichment. In addition, in situ methane and
ammonia oxidation activity and microbial population data are available (Joye et al., 1999; Ward
et al., 2000; Carini et al., 2005 – Chapter 2; Carini and Joye, in prep. – Chapter 3) to provide
context for relating aspects of the enrichment study results to process activity and population
interactions in the environment.
Molecular techniques provide phylogentic and population information that facilitates the
elucidation of group-specific responses to the varying experimental conditions. Denaturing
Gradient Gel Electrophoresis (DGGE) has been used to compare different community
“fingerprints” (Muyzer et al. 1997; Murrell et al. 1998) as well as to obtain specific phylogenetic
information by identifying specific clones of interest for subsequent sequencing (Carini et al.,
2005 – Chapter 2). Overall community analysis via DGGE traditionally employs PCR primers

104
that target the variable 3 region of the 16S rDNA (Muyzer et al. 1993). Group-specific diversity
has been investigated by nesting the variable 3 primer set within template from primer pairs
designed to target group-specific regions of 16S rDNA such as nitAB for AOB (Voytek and
Ward, 1995; Bano and Hollibaugh, 2000) and MethT1F/R and MethT2F/R for MOB (Wise et al.,
1999). Diversity of AOA has been investigated by phylogentic alignment of sequences of the
functional archaeal ammonia monooxygenase gene (amoA) detected using the primer sets Cren-
amo1F/Cren-amo1R (Konneke et al., 2005) and Arch-amoAF/Arch-amoAR (Francis et al, 2005).
Quantitative information complimentary to the DGGE and sequence data has been
obtained using fluorescently labeled group-specific probes (FISH) to enumerate individual MOB
(Bourne et al., 2000), AOB (Mobarry et al., 1996), and Crenachaeota. FISH probes specific for
AOA have not as yet been developed. However, correlations between Crenarchaeota , archaeal
amoA gene abundance, and ammonia oxidation rates have led others to use FISH probe Cren 537
(Herndl et al., 2005) as a general proxy for AOA abundance (Könneke et al., 2005; Wuchter et
al., 2006).
We used ammonium and/or methane enrichments to examine the impact of relative
substrate availability on rates of ammonia and methane oxidation and on patterns of associated
group-specific microbial community composition. Molecular techniques enabled us to examine
whether group-specific diversity and abundance was affected by enrichment conditions and how
the differential responses of group-specific populations may have correlated with measured
oxidation rates.

105
METHODS
Study Site and Enrichment Culture Preparation
Water for the enrichment cultures was collected at station 6 in Mono Lake's central basin
(37°57.822'N, 119°01.305'W) on August 8, 2003. When the samples were collected Mono Lake
was meromictic and the monimolimnion (bottom water) had been isolated below the pycnocline
since 1995. The lake was also seasonally stratified with an oxycline and thermocline spanning 14
to 16 m. The surface water was 19.2°C with an O2 concentration of 5.52 mg l-1 and an excess
density of 70.1 mg l-1. Ammonia and CH4 concentrations were <1 µM above the oxycline but
increased through the base of the oxycline to 17.2 and 5.5 µM respectively (Carini and Joye, in
prep - Chapter 3). Six depths ranging from the surface to the bottom of the oxycline were chosen
to contribute to a homogenized water-mix that was used to prepare the different enrichment
treatments. The water was collected with a Niskin sampler at approximately 3 m intervals
between 2 to 17 meters. Water samples from each depth were transferred via a funnel, equipped
with a screen to exclude Artemia, into acid cleaned, sample rinsed 1 liter PETG media bottles
(n=3 per depth) and stored at 4°C for shipment to the UGA lab where the experiment was run.
The individual samples were combined in a clean (acid soaked, milliQ water rinsed and
then air-dried) 20 L carboy and mixed well to create a homogenized blend that integrated
chemical and biological elements representative of the upper water column above the base of the
oxycline. Sub-samples were collected from the homogenized water to determine initial potential
methane and ammonia oxidation rates, nutrient and dissolved gas concentrations and community
structure (sampling and analyses described below). One liter of the mixture was then placed into
each of twelve PETG media bottles (1.3 L volume) and sealed with gas-tight septa screw caps

106
(Nalgene). The samples were amended to create four enrichment regimes (n=3 each). One set
was used as a control and received no amendment. A second set was amended with CH4 (80
µmol l-1 dissolved CH4), a third set was amended with NH4+ (80 µmol l-1 using NH4Cl), and a
fourth set was amended with both CH4 and NH4+ (80 µmol l-1 each). All treatments were
incubated in the dark and maintained at 20°C. The enrichments were kept aerated (O2 ~ 4 mg l-1)
by daily venting of the headspace followed by resealing and gentle mixing. Amendments of CH4
(daily) and NH4+ (every second day until day 22, then daily) were made following aeration to
approximate a steady substrate flux (changes in headspace and enrichment culture volume were
accounted for when re-amending). Weekly time series sub-samples from each treatment were
analyzed for potential methane and ammonia oxidation rates and dissolved inorganic nitrogen
(DIN) concentrations (e.g. NH4+, NO2
-, and NO3-) for a total of 35 days. Concurrent samples
were taken from each enrichment for molecular analyses to determine microbial community
compositions.
Methane and Ammonia Oxidation Rates
Potential methane oxidation rates were determined by measuring the consumption of CH4
over time. A three ml sub-sample of enrichment culture from each bottle was transferred to an 8
ml headspace vial. The vial was closed with a butyl rubber stopper and aluminum crimp seal. A
10% CH4 standard was injected into the headspace through the stopper using a gas tight syringe
to achieve 300 µM headspace CH4. An initial, time = 0 headspace CH4 concentration was
determined after a 12-hour equilibration period (to account for solubility induced concentration
changes in the headspace) and a second measurement was made 24 hrs later. Bottles were shaken
gently at 75 rpm and maintained at 20°C during the incubation. Methane concentrations were

107
determined using a Shimadzu 14-A gas chromatograph equipped with a Porpak® T column and a
flame ionization detector (Joye et al. 1999).
Potential ammonia oxidation rates were measured by quantifying the production of
nitrate (NO3-) + nitrite (NO2
-) (hereafter NOX= NO3- + NO2
-) following a 24 hour incubation
(Joye and Hollibaugh, 1995). A three ml sub-sample of water from each enrichment bottle was
transferred to individual 10 mL serum vials and amended to 300 µM NH4+. The serum vials were
kept in the dark, shaken gently at 75 rpm, and maintained at 20°C during the incubation.
Ammonia oxidation rates were calculated as the difference between final and initial NOX
concentrations (quantification described below).
Dissolved Inorganic Nitrogen (DIN)
Nutrient samples from each enrichment bottle were filtered (Millipore Acrodisc, 0.2 µm)
and stored at 4°C. Ammonium concentrations were quantified within 4 hrs using the phenol-
hypochlorite method (Solarzano, 1969). To account for matrix effects, standards were prepared
using He purged Mono Lake surface water and internal standards were run. Ammonia
concentrations in samples were calculated from linear regressions of known standard
concentrations. Nitrite and NO3- concentrations were quantified within 48 hrs. The
concentration of NOX was determined using an Antek®745 Nitrate/ Nitrite Reducer (vanadium
reduction assembly) inline with an Antek ®7050 chemiluminescent nitric oxide detector
(Álvarez-Salgado & Miller 1998). Reduction efficiency checks of the vanadium solution were
run after every 10 samples. Nitrite concentrations were determined by spectrophotometry
(Bendschneider and Robinson, 1952) modified for Mono Lake water chemistry (samples and
standards were adjusted to ~pH 7 with concentrated HCl before reagent addition). Nitrate

108
concentrations were calculated as the difference between NOX and NO2-. Standards for these
analyses were made using artificial Mono Lake Water that reproduced in situ ionic strength and
pH conditions (Oremland et al., 2002) to account for matrix effects.
Molecular Analyses
Samples for molecular analyses were collected at four time points during the experiment.
Following an initial time point (t0), sub-samples were collected on days 15, 22, and 35. Each of
those days corresponded with a potential rate assay and geochemical sampling. Microbial
biomass was collected for community profiles (DGGE), sequence analysis and phylogeny, and
whole cells were fixed for enumeration using fluorescence in situ hybridization (FISH).
DNA Collection and Extraction
Sub-samples (150 ml) from each treatment replicate were pooled (total volume = 450 ml)
and the microbial biomass from each treatment was collected with individual Sterivex filter
cartridges (0.2 µm). Excess water in the filter cartridge was replaced with an extraction buffer
and stored at -70°C until processed (Ferrari and Hollibaugh, 1999).
DNA was extracted from Sterivex filters using a modified technique of Murray et al.
(1996) and Ferrari and Hollibaugh (1999). F"i"l"t"e"r" "c"a"r"t"r"i"d"g"e"s" "containing extraction buffer (1.5 M
NaCl, 5 mM MgCl2, 100 mM Tris HCl - pH 7, 100 mM EDTA - pH 8, 100 mM Na2HPO4 - pH
8) w"e"r"e" "t"h"a"w"e"d" "a"t" "r"o"o"m" t"e"m"p"e"r"a"t"u"r"e." Forty µl of "l"y"s"o"z"y"m"e" "(""5"0" "m"g"/"m"l")" was "a"d"d"e"d" and the
cartridges were incubated at 37°C for 30 min on an orbital shaker (25 rpm). Lysate was expelled
from the cartridge and then the cartridge was rinsed with extraction buffer to ensure maximum
yield. DNA was further liberated from the lysate using bead-mill homogenization (method

109
adapted from the MO BIO Ultraclean Soil DNA kit protocol; Carini and Joye, in prep – Chapter
3). The DNA obtained was suitable for the PCR and no subsequent purification was necessary.
PCR Amplification of Microbial Community DNA
Previously designed oligonucleotide primers were used to characterize group specific
community composition over time. Methane-oxidizing bacteria were detected using
MethT1dF/MethT1bR and F27/MethT2b primers that target type I and type II methane oxidizer
specific regions of 16S rDNA respectively (Wise et al., 1999). Bacterial ammonia-oxidizers were
identified using a nested approach: EUB1/EUB2 (Liesack et al. 1991) was used to amplify total
bacterial rDNA and the product was subjected to a second amplification using Nit-A/Nit-B
(NitAB; Voytek and Ward 1995). NitAB is internal to the EUB primers, targets a region of 16S
rDNA specific for ammonia oxidizing β-Proteobacteria, and this nested approach has been
shown to be more sensitive when screening for less abundant microorganisms (Voytek and
Ward, 1995). Archaeal ammonia oxidizer sequences were detected using the primer sets Cren-
amo1F/Cren-amo1R (Konneke et al., 2005) and Arch-amoAF/Arch-amoAR (Francis et al., 2005)
that target a putative archaeal ammonia monooxygenase (amoA) gene. The primer pair 341f and
534r (E.coli position) was used to amplify the variable 3 region of rDNA from bacterial group-
specific amplicons for subsequent DGGE analysis (Muyzer et al., 1993). The DGGE primers
were modified with a GC clamp and labeled with fluorescein.
All PCR reactions were prepared in a UV sterilized laminar flow hood. 4-10 ng of
genomic template was added to a master-mix (adjusted to 1µl of PCR product for nested
amplifications) and a “hot start” procedure was followed: after 5 min at 95° C in the
thermocycler (MJ Research DNA Engine®), 2.5 units of Taq DNA polymerase was added while

110
the reaction tubes were held at 80° C. A “touchdown” thermal cycling program (Don et al.
1991) was used for each of the primer pairs and each PCR was run for 30 cycles. All reactions
were run with appropriate positive and negative controls and the PCR product was verified for
amplification and fragment size by agrose gel electrophoresis.
DGGE, Cloning, and Sequencing
DGGE was used to monitor the group specific community composition of the
methanotroph and ammonia-oxidizing bacterial populations over the course of the incubation.
Denaturing gels were 6.5% polyacrylamide with a denaturant gradient ranging from 40 to 70%.
The denaturants in a 100% solution were 40% deionized formamide and 7 M urea. PCR
products were concentrated by ethanol precipitation and resuspended. Samples (250 ng DNA)
were mixed 1:1 with neutral loading dye and loaded onto the gel. Gels were run at 80 V for 15
hrs in a 60° C, 1x TAE buffer and visualized on a Hitachi FMBIO III scanner equipped for
fluorescein detection.
A clone library was constructed using the original PCR product generated by the group
specific primer pairs. PCR products were isolated by agarose gel electrophoresis, extracted from
the agarose (QIAquick® Gel Extraction Kit; Qiagen), inserted into the pCR®4-TOPO® plasmid
vector and transformed into chemically competent One Shot®TOP10 Escherichia coli cells as per
the manufacturer’s instructions (Invitrogen Corp). Transformed cells were cultured and a portion
of each individual culture was re-extracted for PCR using DGGE primers. DGGE was then run
to identify unique clones for sequencing of the original PCR product.
Bands suggestive of unique clones were cut out, re-amplified with the PCR and re-run
using DGGE. Clones that produced bands which did not have the same electrophoretic mobility

111
as the original bands (based on multiple lanes of standard distributed across the gel) or that
produced more than one DGGE band were discarded. Frozen, glycerol preserved whole-cell
clone cultures (2x96 well micro-titer plates) were sequenced (primer M13F) by SeqWright
(Houston, TX) and yielded robust sequence fragments of 550-800 bp. The obtained sequences
were then compared with published sequences using BLAST (National Center for
Biotechnology Information). Sequences from the data library exhibiting the highest similarities
(closest relatives) were aligned with clone sequences using the Genetics Computer Group (GCG)
package (Madison, WI). A phylogenetic tree was constructed using the neighbor-joining method
and Jukes-Cantor distances (PHYLIP package v. 3.5).
Fluorescence in situ Hybridization
Fluorescence in situ hybridization (FISH) was used to determine the abundance of both
type I and type II methanotrophs, AOB and Crenarcheota. FISH probes specific for AOA have
not yet been developed, but all sequences recovered from putative AOA have been associated
with the Crenarchaeota (Venter et al., 2004; Schleper et al., 2004; Konneke et al., 2005; Francis
et al., 2005; Wüchter et al., 2006; Leininger et al., 2006; Hallum et al., 2006). Although it is
almost certain that not all crenarchaeotes oxidize NH3, their enumeration is used as a proxy for
AOA and may provide valuable information about the potential involvement of AOA in
nitrification (Wüchter et al., 2006; Carini and Joye, in prep – Chapter 3).
Formalin (4%) preserved samples were thawed and mixed well, then 500 µl of sample
was added to a sterile centrifuge tube containing 15 ml of phosphate-buffered saline (PBS)
solution, mixed well, and then filtered through a 0.2 µm polycarbonate membrane filter
(Osmonics). The tube was then rinsed with PBS (2 x 15 ml) and this wash solution was also
112
passed through the filter to assure that all cells were transferred to the filter. The filter was
washed with 15 ml of sterile water (2x) and allowed to air dry in a Petri dish. Sections of
individual filters were separated for DAPI only staining as well as hybridization with specific
probes and DAPI counterstaining (50 µl of 2 mg ml-1 solution for 3 min).
Oligonucleotide probes Mγ84, Mγ705, and Mα450 were used to detect type I and type II
methanotrophs, respectively (Eller et al., 2001). Probes were synthesized by MWG Biotech
(Ebersberg, Germany) and labeled with fluorochromes Oregon green (Mα450, type II) and
Texas Red (Mγ84 and Mγ705, Type I). Simultaneous hybridization with these three probes on a
single filter section allowed for differentiation between type I (red) and type II (green)
abundance and total methanotroph cell counts (red + green). Ammonia-oxidizing bacteria were
enumerated using Texas Red labeled oligonucleotide probes NEU, Nso190, and Nsm156 (MWG
Biotech) designed to detect halophilic/halotolerant Nitosomonas spp., ammonia-oxidizing β-
Proteobacteria, and Nitosococcus spp. respectively. Successive hybridization reactions were
performed on single filter sections with hybridization solutions (formamide concentrations)
optimized for each particular probe (Mobarry et al., 1996). Enumeration of Crenarchaeota was
carried out using probe Cren537, which specifically targets marine group I Crenarchaeota, as
described by Herndl et al. (2005).
Total microbial (DAPI stained) and hybridized methanotroph, nitrifier, and
Crenarchaeota cells were counted using epifluorescence microscopy by enumerating cells in
each of 40 squares in 50 randomly selected fields for each sample (n = 2000 grid squares per
sample filter section). The number of cells per milliliter (cells ml-1) in each sample was
calculated by taking the mean number of cells counted in the 50 selected fields per filter section
multiplied by a conversion factor derived from a combination of the counting grid area, the
113
percentage of the grid utilized, the surface area of the filter, and the volume of water filtered.
Total-cell counts from the DAPI-only stained filter sections and DAPI counts from
counterstained, hybridized filters were compared to control for loss of cells from the filters that
may have occurred during hybridization.
AOB Cell Specific Nitrification rates
Cell specific rates of NH3 oxidation were calculated by dividing the moles of NH3
oxidized per liter of sample by the total number of AOB cells per liter of sample as determined
by FISH at each time point and in each treatment.
Statistical Analyses
Differences in NH3 and CH4 oxidation rates between treatments and over time were
compared using paired t-tests assuming unequal variances (n = 3). Differences in MOB, AOB,
and Crenarchaeota abundance between treatments and over time were compared using a
combination of ANOVA and Tukey’s analyses. Correlations between oxidation rates and
associated microbial abundances were assessed by linear regression.
RESULTS
Enrichment Culture Methane Oxidation and Nitrification Activity
The potential CH4 oxidation (pMOx) rate in the initial (t0) homogenized Mono Lake
water used to prepare enrichment cultures was 12.6 (±1.8) µmol CH4 l-1 day-1 (hereafter noted as
µM CH4 d-1). Potential CH4 oxidation rates in the control (no enrichment) generally decreased
throughout the experiment with no detectable activity on days 28 and 35. The NH4+-only
enrichment had slightly increased pMOx activity through day 8, then declined and maintained

114
relatively low rates between 6.0 and 9.7 µM CH4 d-1. Treatments amended with CH4-only and
CH4 + NH4+ exhibited significant (p < 0.05) increases in pMOX activity by day 8 (Fig. 4.1). The
pMOx rates in both the CH4-only and CH4 + NH4+ enrichment increased steadily through day 35
to a maximum of 142.3 and 196.4 µM CH4 d-1, respectively. From day 15 through the end of the
time course, the CH4 + NH4+ enrichment demonstrated consistently higher (p < 0.05) pMOX
rates relative to the CH4-only treatment (Fig. 4.1).
The potential NH3 oxidation (pNTR) rate in the initial (t0) homogenized Mono Lake
water used to prepare the enrichment cultures was 0.9 (±0.6) µmol NH3 l-1 d-1 (µM NH3 d
-1).
Rates of pNTR in the control (no enrichment) and the CH4-only enrichment did not differ
significantly (p > 0.05) from the initial (t0) pNTR rate throughout the experiment. The pNTR
rates in NH4+-only and NH4
+ + CH4 enrichment both showed higher NH3 oxidation activity by
day 15 (Fig. 4.1). The pNTR rates in those two treatments increased through the course of the
experiment to a maximum of 22.3 and 24.8 µM NH3 d-1, respectively, and were only
significantly different on day 22, when the pNTR rate was significantly higher (p = 0.004) in the
NH4+ + CH4 enrichment (Fig. 4.1).
Time-Course of Dissolved Inorganic Nitrogen (DIN) Concentrations
The initial NH4+ concentration in the homogenized Mono Lake water-mix was 11.2 (±
0.9) µM. Ammonium concentrations in the control and CH4-only enrichment steadily declined
over the course of the incubation to 4.2 and 1.3 µM, respectively. Ammonium concentrations in
the NH4+-only and NH4
+ + CH4 enrichments decreased rapidly from 75 (±3.7) µM after the initial
enrichment to 48 (±2.6) µM by day 8 (Fig. 4.2a). Between day 8 and day 35, NH4+
concentrations in both NH4+ enrichments were about 43 (± 4.1) µM, with the exception day 22
115
when the NH4+ concentration for the NH4
+-only and NH4+ + CH4 enrichments decreased to 2.9
and 0.6 µM, respectively (Fig. 4.2).
There was no detectable NO2- in the initial homogenized Mono Lake water-mix. Nitrite
concentrations remained below detection limits in all treatments until day 22 (Fig. 4.2). On day
22, NO2- concentrations had increased to 1.1 µM in both the NH4
+-only and NH4+ + CH4
enrichments. Nitrite concentrations remained low throughout the time-course (< 0.6 µM) in the
control and CH4-only enrichment but increased in both the NH4+-only and NH4
+ + CH4
enrichments to 1.7 and 1.9 µM, respectively by day 35 (Fig. 4.2).
The initial NO3- concentration in the homogenized Mono Lake water-mix was 0.7 (± 0.2)
µM. Nitrate concentrations in all treatments remained low (< 2 µM) through day 15 (Fig. 4.2).
Nitrate concentrations in the NH4+-only and NH4
+ + CH4 enrichments increased rapidly between
days 15 and day 28 to over 100 µM. By day 35, NO3- concentrations in the control and CH4-only
enrichments had increased slightly to an average of 22.5 µM but NO3- concentrations in the
NH4+-only and NH4
+ + CH4 enrichments had increased 3 fold to 348 and 310 µM respectively
(Fig. 4.2).
Microbial Community Structure
The initial (t0) type I methanotroph community was represented by six distinct bands with
relatively similar intensity (Fig. 4.3). Three of the bands (ML_MI_1, ML_MI_2, and ML_MI_4,)
represented sequences most closely related to Methylomicrobium species. Two additional bands
that displayed slightly greater electrophoretic mobility (ML_MI_7, and ML_MI_8) had
sequences that were most closely related to Methylobacter species (Fig. 4.3).

116
On day 15, the type I community profile in the control was unchanged. However,
observable differences had developed in the type I community structure in the enrichments. The
type I community in the CH4-only enrichment was less diverse and was dominated by band
(ML_MI_4) representing a sequence most closely related to Methylomicrobium sp. ML1
(Accession No. DQ496231). Bands ML_MI_1 and ML_MI_2, representing sequences most
closely related to other Methylmicrobium spp., and bands ML_MI_7, and ML_MI_8, affiliated
with Methylobacter spp. became less apparent (Fig. 4.3a). The NH4+-only enrichment retained
more of the diversity from t0 relative to the other enrichments but band ML_MI_8, representing a
sequence most closely related to Methylobacter, displayed increased intensity (Fig. 4.3).
By day 22, the diversity of type I methanotrophs in the control had decreased. Bands
ML_MI_1, ML_MI_2 most closely related to Methylomicrobium species became less distinct in
all treatments. Band ML_MI_4 had become dominant in all enriched treatments. Minor bands
representing other Methylomicrobium-like sequences were still somewhat apparent but
substantially less intense and by day 35, the Methylomicrobium-like bands were no longer
apparent in enriched treatments. Diversity at the species level was nevertheless apparent on day
35 as a minor Methylobacter-like band ML_MI_7 was still observable (Fig. 4.3).
The initial (t0) type II methanotroph community was represented by five distinct bands
(Fig. 4.3b). Three bands appeared to show greater intensity and represented sequences most
closely related to Methylobacterium (ML_MII_2 and ML_MII_3) and Methylosinus species
(ML_MII_10). Minor bands represented sequences that were also most closely related to
Methylobacterium (ML_MII_1) and Methylosinus (ML_MII_7, 8, 9, and10) species (Fig. 4.3).
On day 15, the type II community profile of the control appeared unchanged. However,
observable type II methanotroph community differences had developed in the enrichments since

117
t0 and differences between treatments were noted. Banding patterns in the CH4-only and NH4+-
only treatments were similar to each other but band ML_MII_3 was no longer evident in either
enrichment and bands ML_MII_7, 8, 9, and 10 had increased in intensity (Fig. 4.5). The CH4 +
NH4+enrichment maintained the same diversity as the t0 profile but bands ML_MII_3, 7, 8, 9,
and 10 appeared more intense (Fig. 4.3).
By day 22, the type II community displayed differences from day 15 as well as more
differences between treatments. The bands (ML_MII_3, 7, 8, 9, and 10) representing
Methylosinus species that exhibited increased intensity on day 15 were less intense (Fig. 4.3b).
While the CH4-only enrichment maintained similar diversity to the control, new bands appeared
in the NH4+-only (ML_MII_5 and 6) enrichment (Fig. 4.3). By day 35, the type II community
profiles demonstrated additional shifts. Most of the bands in the control had become
considerably less apparent and the three different enrichments each displayed unique profiles.
The CH4-only enrichment was dominated by band ML_MII_3 representing a Methylobacterium-
like species and band ML_MII_8 was more intense. The three bands ML_MII_3, 6, and 7 were
most prominent in the NH4+-only enrichment while in the CH4+NH4
+ enrichment, Methylosinus-
like bands ML_MII_10 and 12 showed the most intensity (Fig. 4.3).
The initial (t0) ammonia-oxidizing bacterial community was represented by five distinct
bands. No dominant bands were apparent with each band exhibiting relatively similar intensity.
All bands were representative of sequences most closely related to Nitrosomonas-like microbes
from hyper-saline and/or alkaline environments (Fig. 4.3). The AOB community profile in the
control did not vary significantly over the course of the experiment. There was, however,
variation between the other treatments over time (Fig. 4.3).

118
On day 15, diversity had decreased in the CH4-only and NH4+-only enrichment with the
loss of bands ML_AOB_2, 7, and 8. AOB community profiles in the CH4 + NH4+ enrichment
indicated decreased diversity by day 15 with band ML_AOB_8 becoming less apparent (Fig.
4.3). On day 22, all three enrichments displayed almost identical profiles. The only difference
may have been a slight increase in intensity in band ML_AOB_9 in the NH4+-only and CH4 +
NH4+ enrichments (Fig. 4.3). By day 35 the AOB profile from the CH4-only enrichment
displayed the most diversity with all 9 bands apparent and with band ML_AOB_9 showing the
greatest intensity. The NH4+-only and CH4 + NH4+ enrichments displayed further decreases in
diversity and were very similar with only bands ML_AOB_1, 4, and 9 apparent (Fig. 4.3).
Microbial Abundance
The initial (t0) abundance of type I and type II methanotrophs, AOBs, and Crenarchaeota
was 6.04 (± 3.07) x 104 cells ml-1, 4.60 (± 2.33) x 104 cells ml-1, 9.60 (± 1.63) x 104 cells ml-1,
and 3.70 (± 0.25) x 105 cells ml-1, respectively (Fig. 4.4). Crenarchaeota represented 5.2% of the
total (DAPI stained) population. Methane- and ammonia-oxidizing bacteria represented 2.1 and
1.3 % of the total population, respectively. In the control (no enrichment), DAPI stained cells
decreased significantly (p = 0.031) by day 8 but did not change significantly through the end of
the incubation. Crenarchaeota abundance decreased significantly (p = 0.002) between day 8 and
day 15 but remained the same for the remainder of the incubation. In contrast, the abundance of
both types of methanotrophs and the AOB in the control did not change significantly over time
(Fig. 4.4).
In the CH4-only enrichment, the total number of methanotrophs increased through day 22
but did not change significantly thereafter. However, the ratio of type I to type II methanotroph

119
abundance decreased significantly over time (p < 0.05), a trend observed in each type of
enrichment. Type II methanotrophs were less abundant at t0 but increased rapidly, out
numbering type I methanotrophs by day 15, and increasing to a maximum of 8.8 x 10⁴ cells ml-1
on day 22. Type I methanotroph abundance declined to a minimum at day 22 and then increased
slightly to 5.3 x 10⁴ cells ml-1 on day 35 (Fig. 4.5). Ammonia-oxidizing bacteria and
Crenarchaeota abundance also varied inversely to each other. Crenarchaeal cell numbers
decreased drastically (by approx. 85%) between t0 and day 15 and their abundance remained low
through the end of the experiment. In contrast, AOB abundance increased 40% by day 22 and
continued to increase slightly by day 35 (Fig. 4.5).
The relative crearchaeal and AOB abundance observed in the NH4+-only enrichment was
opposite that observed in the CH4-only enrichment. Crenarchaeota abundance increased
significantly (p < 0.05) between days 15, 28, and 35 while AOB abundance decreased over the
same time period. Also, similar to the pattern observed in the CH4-only enrichment, there was an
inversion of relative type I and type II methanotroph abundance. However, in the NH4+-only
enrichment, both type I and type II methanotrophs decreased between t0 and day 15 and type II
methanotrophs did not out number type I methanotrophs until day 22 (Fig. 4.5).
In the CH4 + NH4+ enrichment, type I methanotroph cell numbers decreased as type II
methanotrophs increased, however, reversal of type specific abundance occurred on a time scale
intermediate to that observed in the CH4-only and NH4+-only enrichments. Type I methanotrophs
decreased while type II methanotrophs increased between t0 and day 15 but did not outnumber
type I methanotrophs until day 22 (Fig. 4.5). Creanarchaeal and AOB abundances also
demonstrated a pattern similar in relative abundance to the CH4-only enrichment. Crenarchaeota
cell numbers decreased by ~70% on day 15 (compared to 85% in the CH4-only enrichment) and

120
their abundance remained relatively low for the remainder of the experiment. AOB abundance
increased slightly but significantly (p < 0.05) by day 15 but did not increase significantly after
that point (Fig. 4.5).
DISCUSSION
Enrichment Cultures and the Control
The homogenized nature of the Mono Lake water used to prepare the enrichment cultures
and incubation and sampling of the different treatments under identical conditions ensured that
variations in process rates and population dynamics observed between treatments were a result of
the enrichment regime to which the samples had been exposed. Nonetheless, “bottle effects” are
an unavoidable consequence of long-term incubations and may complicate data interpretation.
Bottle effects stem from isolation of the water sample, which alters material exchange as well as
grazing pressure and/or viral induced mortality. Thus, the changes in oxidation activity and
population dynamics observed in the different enrichment regimes were evaluated in light of
trends noted in the un-amended control.
Potential CH4 and NH3 oxidation activity in the control remained comparatively low and
variations in pMOx and pNTR were negligible relative to changes in oxidation rates observed in
amended treatments (Fig. 4.1). MOB and AOB cell numbers remained constant in the control
throughout the entire incubation with type I methanotrophs being more abundant than type II
methanotrophs (Fig. 4.3). This same trend of relative abundance and persistence of these two
groups of methanotrophs in the control is typical of in situ Mono Lake conditions (Carini et al.,
2005 – Chapter 2). Also consistent with reported data, AOB abundance comprised a relatively
small percentage of the initial bacterial population (Ward et al., 2000; Carini and Joye - Chapter

121
3) and total methanotroph abundance in the control was generally higher than AOB throughout
the experiment. Furthermore, both MOB and AOB diversity in the control, characterized by
group- specific DGGE fingerprints, remained relatively unchanged (Fig. 4.3). Consequently, the
changes we observed in those group’s activity, abundance, and diversity in the various
enrichment cultures can be attributed largely to the effects of variable substrate availability.
There were, however, changes in total microbial and Crenarchaeota abundance in the
control treatment. Overall microbial abundance (DAPI counts) decreased significantly by day 15
while Crenarchaeota abundance remained unchanged for the first two weeks before decreasing
significantly between days 15 and 22. These patterns may have resulted from either bottle
influenced viral activity and/or altered grazing pressures. Viral abundance in Mono Lake is
among the highest reported in any natural aquatic system (Jiang, et al., 2004). Both strong viral
seasonality and related host specificity in Mono Lake (Sabet et al., 2006) suggest that the rapid
decrease and subsequent stability in overall microbial cell numbers in the control may represent a
new host-phage equilibrium based on a decrease in host abundance and degradation of a large
portion of host specific viral progeny (Furman, 1999). The time lag preceding the decrease in
Crenarchaeota abundance was more suggestive of an alteration in grazing pressures. Protists are
present in Mono Lake and proliferate during periods when Artemia abundance is low (R.
Jellison, pers. comm.). An increase in protozoan abundance and grazing following the removal
of Artemia from the water used for the enrichments (by screening) may have differentially
affected Crenarchaeota abundance based on size selective grazing coupled with the frequency of
suitable prey encounters (Jürgens et al., 1999). Fortunately the shifts in Crenarchaeota abundance
observed in the enrichments were both temporally and quantitatively very different than the
changes noted in the control. Decreased crenarchaeal abundance in the CH4-only and CH4 +

122
NH4+ enrichments occurred more rapidly and were of significantly greater magnitude than in the
control. Moreover there was an increase in Crenarchaeota abundance observed in the NH4+- only
treatment that was contrary to the trend documented in the control. Therefore we maintain that,
as with the MOB and AOB, the changes in Crenarchaeota abundances observed in the
enrichments may also be attributed to the varying treatment regimes.
Substrate Induced Stimulation of CH4 Oxidation and Associated Methanotroph Population
Dynamics
Methane oxidation rates in enrichments amended with CH4 increased significantly
throughout the incubation relative to the control (Fig. 4.1). Increased CH4 oxidation rates often
correlate with increased CH4 availability in the environment. Methane oxidation rates increased
in landfill soils (Whalen et al., 1990; Jones and Nedwell, 1993), rice planted microcosms
(Bodelier and Frenzel, 1999), and estuarine sediment (Carini et al., 2003) when exposed to
elevated CH4 concentrations. Increased CH4 oxidation rates may result from an accumulation of
methanotrophic biomass as a consequence of exposure to elevated CH4 concentrations during
seasonal lake stratification (Rudd et al., 1974; Harrits and Hanson, 1980). Observed increases in
methanotroph abundance also correlated with higher CH4 oxidation rates in soils (Bender and
Conrad, 1994) and rice paddies (Henckel et al., 2000). However, other evidence has suggested
that stable methanotroph populations may persist under taxing conditions such as extended
periods of very low CH4 concentrations (Holmes et. al., 1999; Knief et. al., 2003) or anoxia
(King, 1996). In these cases, standing stocks are able to increase activity during transitory
periods of favorable geochemical conditions without a corresponding increase in abundance
(Eller and Frenzel, 2001; Carini et al., 2005 – Chapter 2). Community composition data from our

123
CH4 enrichments suggest a combination of additional methanotroph abundance and increased
activity of the initial in situ methanotroph population likely contributed to the higher CH4
oxidation rates observed in those treatments.
Methanotroph diversity and abundance in Mono Lake samples varied between the control
and enriched treatments. In the control, diversity and relative type abundance remained constant
over time; the DGGE fingerprints of both types remained very similar relative to their respective
t0 fingerprints throughout the incubation and type I methanotroph abundance was consistently
higher than that of type II methanotrophs. In contrast, as CH4 oxidation activity increased in the
CH4 amended treatments, diversity and abundance of type I methanotrophs decreased while
different type II methanotrophs became more dominant and overall type II methanotroph
abundance increased (Fig. 4.5). This data is consistent with the hypothesis that type I
methanotrophs generally outnumber type II methanotrophs in environments with low CH4
concentrations, such as the control (< 0.5 µM dissolved CH4), while type II methanotrophs tend
to dominate environments with high CH4 concentrations, such as our CH4 enriched cultures
(Amaral and Knowles, 1995; Henckel et al., 2000; Macalady et al., 2002).
However, it is unlikely that the increases in type II abundance were entirely responsible
for the observed increase in CH4 oxidation activity in the CH4 amended treatments. Although
type II abundance increased significantly (nearly doubled), CH4 oxidation rates in the CH4
amended treatments increased on a much larger scale (12 to 16 fold). Moreover, the greatest
increase in type II abundance (in the CH4-only enrichment) did not coincide with the highest
recorded CH4 oxidation rate (in the CH4+NH4+ enrichment). CH4 oxidation rates in both CH4
enriched treatments also increased significantly during periods when methanotroph abundance
remained constant (Fig. 5.5). Furthermore, the incorporation of C from isotopically labeled CH4
124
into family specific lipid biomarkers (PFLAs) has revealed that methanotroph abundance does
not necessarily correlate with activity (Henckel et al., 2000; Macalady et al., 2002) and that the
generally accepted paradigm concerning the distribution and activity of type I vs. type II
methanotrophs based solely on environmental parameters may be too broad (Knief et al., 2006).
Therefore, it is likely that increased activity of a portion of the initial methanotroph population
(including type I methanotrophs) in addition to type II biomass accumulation contributed to the
increase in overall CH4 oxidation rates observed in the CH4 amended enrichments.
The Effects of Supplemental Ammonia on Nitrification Rates and the Relative Contributions of
Ammonia-Oxidizing Bacteria and Crenarchaeota
The rate of NH3 oxidation increased in the NH4+-only enrichment relative to the control
(Fig. 4.1), demonstrating that nitrification was N limited. The Mono Lake mixolimnion has an
extremely low N:P ratio (<0.01), indicating chronic nitrogen limitation (Joye et al., 1999).
Increased NH3 availability in the NH4+-only enrichment should have benefited an existent
nitrifying population as observed previously in soils (Mendum et al., 1999; Bruns et. al., 1999)
and sediments (Carini et al., 2003) that demonstrated increased nitrification coincident with
increased NH3 availability. However, detectable nitrification rates and production of NO2- and
NO3- in our NH4
+ amended treatment were temporally offset from high initial NH4+ consumption
(Fig 4.2), indicating fierce competition for available NH3. Nevertheless, the detection of NH3
oxidation activity and eventual NOX production in the NH4+-only amended treatment revealed
the presence of a viable nitrifying population. Mono Lake supports nitrification in situ and
populations of both AOB and Crenarchaeota are present. While the pattern of AOB abundance
and correlation between crenarchaeal abundance and nitrification profiles suggests that AOA

125
may contribute to NH3 oxidation in Mono Lake, the lack of verifiable archaeal ammonia
monooxygenase genes and the sufficient abundance of AOB to account for all of the measured
nitrification activity leaves open the question of relative contributions between AOA and AOB in
situ (Carini and Joye, 2007 – Chapter 3).
Significant changes in both crenarchaeal and AOB abundance in the NH4+-only
enrichment provided stronger correlative data supporting potential AOA activity in Mono Lake
relative to in situ observations. Crenarchaeota abundance increased by 91% as the nitrification
rate increased, while AOB abundance decreased by 46% (Fig. 4.5). The gross increase in
crearchaeal abundance was likely even higher if adjusted for the decreased abundance observed
in the control. Regression analysis between nitrification rates and AOB and Crenarchaeota
abundance yielded R2 values of 0.99 and 0.98, respectively (p < 0.01 for each; Table 4.1).
Clearly, members of the Crenarchaeota proliferated over the AOB population under N-replete
conditions and were strongly correlated with nitrifying activity. AOB cell specific nitrification
rates in the NH4+-only enrichment were ~ 8 to 18 fmol cell-1 hr-1 by the end of the incubation
(Table 4.1). Cell specific rates reported for pure culture (Nitrosospira) and amended soils were
generally less than 10 fmol cell-1 hr-1 (Belser and Schmidt, 1978; Jiang and Bakken, 1999; Okano
et al., 2004) indicating that the AOB population may not have had the physiological capacity to
account for all the measured nitrification in the NH4+-only enrichment. Taken together, these
findings suggest an AOA contribution to nitrification in the NH4+-only enrichment.

126
Patterns of Group Specific Activity and Microbial Interactions Under CH4+NH4+ Enriched
Conditions
To this point the discussion has been limited to the effect of primary substrate enrichment
on a specific group’s oxidation activity and population dynamics. Simultaneous enrichment with
both CH4 and NH4+ elicited particular variations in specific oxidative activities and associated
populations relative to the responses observed in the individual substrate enrichments. Methane
oxidation potential increased in response to NH4+ addition but was primarily regulated by CH4
availability. Potential CH4 oxidation rates in the NH4+-only enrichment were not significantly
different from the control demonstrating that nitrifiers did not contribute to CH4 oxidation and
suggesting that the stimulation of CH4 oxidation in the CH4+NH4+ treatment was due to the
effect of supplemental N on the methanotrophic community. A comparison of CH4 oxidation
trends and methanotroph community population dynamics between the different CH4-augmented
treatments suggested two distinct responses to supplemental N and the respective mechanisms
involved.
A more rapid onset of increased CH4 oxidation appeared to be the initial, relatively short-
term effect triggered by additional N availability. The CH4 + NH4+ enrichment was the only
treatment that experienced significantly higher CH4 oxidation during the first week of the
incubation. Moreover, by day 15, CH4 oxidation in the CH4 + NH4+ enrichment was 89% higher
than in the CH4-only enrichment. Similar methanotroph diversity and relative family abundance
in both treatments during this time period suggests that the initial increase of CH4 oxidation rates
in the CH4 + NH4+ enrichment was due to the alleviation of N limitation of the existing
methanotroph population. Recent studies have also demonstrated a similar stimulatory effect of

127
N availability on CH4 oxidation (Bodelier et al., 2000; Eller and Frenzel, 2000; Carini et al.,
2003).
As the incubation progressed, relative CH4 oxidation activity and methanotroph
community structure between the CH4 + NH4+ and CH4-only enrichments shifted. Although
methane oxidation rates remained significantly higher (p = 0.0001-0.0003) in the CH4+NH4+
enrichment, the magnitude of increased CH4 oxidation attributed to the initial N induced surge of
activity lessened. The 89% higher CH4 oxidation activity in the CH4+NH4+ enrichment relative
to the CH4-only enrichment on day 15 decreased to <38% by day 35 (ANOVA p < 0.05). During
the same time frame, significant differences developed between treatments in the magnitude of
relative type abundance, overall methanotroph abundance, and type II community species
dominance.
Although type II methanotroph cells grew to outnumber that of type I methanotrophs in
both treatments, type I methanotroph abundance declined approximately the same amount as
type II methanotrophs increased in the CH4 + NH4+ enrichment, resulting in a relatively steady
total methanotroph abundance in that treatment over time. In contrast, type I methanotroph
abundance decreased only slightly in the CH4-only enrichment while type II methanotrophs
increased substantially, resulting in an overall methanotroph increase in that treatment of 33%.
Type II specific methanotroph diversity also responded differently to the particular mode of
enrichment applied. By the end of the incubation, type II methanotrophs displayed different
DGGE fingerprints between treatments. Bands ML_MII_3 and _8, representing sequences
affiliated with Methylosinus-like species, were more dominant in the CH4-only enrichment. In
contrast, bands ML_MII_7 and _10 (significantly different but also most similar to
Methylosinus-like species) were more dominant in the CH4 + NH4+ enrichment (Fig. 4.3).

128
Thus, the Mono Lake microbial populations exposed to increased CH4 concentrations
reacted differently depending on whether additional N was available. Clearly, the methanotroph
population of the CH4 + NH4+ enrichment had a higher potential for CH4 oxidation due to readily
available NH3. However, the methanotroph population in the CH4-only enrichment was also able
to take advantage of higher CH4 availability even without supplemental N through community
composition adaptation. Specifically, higher overall methanotroph abundance developed and a
different set of type II methanotrophs, presumably those microbes more able to take advantage of
particular N pools available in the un-amended enrichment dominated the CH4-only enrichment.
The concentration of dissolved organic nitrogen (DON) in Mono Lake is approximately 145 µM
(Joye et al., 1999) and DON conversion of NH4+ could contribute additional N to support
increased CH4 oxidation of specific type II methanotrophs without supplemental NH4+
enrichment.
A comparison with other group’s specific activity and population dynamics revealed
little, if any interaction or influence on CH4 oxidation and methanotroph populations in any of
the enrichments. Methanotrophs appeared to be able to adapt to their benefit regardless of the
activity or population dynamics of the other microbial groups examined here. In fact,
methanotrophs or methanotrophic activity seemed to have a detrimental effect on the
Crenarchaeota (discussed below). AOB activity and/or population dynamics may have had some
slight effect on the methanotrophic activity or populations in the CH4-only enrichment, however
no consistent trends of interaction or influence were evident between treatments. For example,
although there was a significant increase in AOB abundance in the CH4-only treatment, there
was little pNTR and both methanotroph abundance and CH4 oxidation rates increased. In
contrast, a smaller increase in AOB abundance in the CH4+NH4+ enrichment supported a

129
significant increase in pNTR yet CH4 oxidation achieved the highest rates observed in the
experiment.
Quite the opposite was true of nitrification. While activity was consistently elevated
concurrent with NH4+ enrichment or negligible in treatments not amended with NH4
+,
Crenarchaeota and AOB population dynamics varied significantly between the different
treatments. Although there was minimal pNTR activity in the CH4-only enrichment, crenarchaeal
abundance experienced an immediate and considerable decrease (-89%) while AOB abundance
increased 77%. In contrast to the population data from the NH4+-only enrichment, there was a
decrease in crenarchaeal abundance and an increase in AOB abundance in the CH4+NH4+
enrichment that correlated with increased nitrification activity (r = -0.73 and 0.69 for
Crenarchaeota and AOB, respectively). However, the change in abundance of both groups in the
CH4+NH4+ enrichment was mitigated in relation to the CH4-only enrichment (16% less of a
decrease in Crenarchaeota and 56% less increase in AOB). While the data suggests that AOA
may have been involved in nitrification in the NH4+-only enrichment, the relationship between
the different nitrifier populations and activity in the CH4+NH4+ enrichment is more ambiguous.
The reversal in the correlation between AOB and nitrification relative to that in the NH4+-only
enrichment and the significant decline in crenarchaeal abundance suggest that AOB were likely
more active in nitrification in the CH4+NH4+ enrichment. However, because crenarchaeal
abundance did not decrease as drastically in the CH4+NH4+ enrichment and absolute
crenarchaeal and AOB cell numbers were similar, an AOA contribution to nitrification in the
CH4+NH4+ enrichment cannot be ruled out.

130
SUMMARY AND CONCLUDING REMARKS
Methane and NH3 oxidation rates increased over time in enrichments amended with their
primary substrate. Community composition data from our CH4 enrichments suggest a
combination of additional methanotroph abundance and increased activity of the initial in situ
methanotroph population likely contributed to the higher CH4 oxidation rates observed in those
treatments. The rate of NH3 oxidation increased in the NH4+-only enrichment relative to the
control, demonstrating that nitrification was N limited. Trends in community composition data
together with data from previous studies of AOA suggested AOA may have contributed to
nitrification in the NH4+-only enrichment.
Methanotrophic activity and community composition reacted differently dependent on
the presence or absence of additional NH4+. The methanotroph population of the CH4 + NH4
+
enrichment had a higher potential for CH4 oxidation due to readily available NH3. However, the
methanotroph population in the CH4-only enrichment was also able to take advantage of higher
CH4 availability even without supplemental N through community composition adaptation.
Nitrification activity was not significantly affected by supplemental CH4, however, nitrifier
community composition reacted differently dependent on the presence or absence of additional
CH4. Contrary to the response in the NH4+-only enrichment, Crenarchaeota abundance decreased
and AOB increased in the CH4 + NH4+ enrichment suggesting that AOB were likely more active
in nitrification in the CH4+NH4+ enrichment.
The integration of results from individual enrichments with the responses elicited in the
dually enriched CH4 + NH4+ treatment are crucial to beginning to understand the interactions
between these ecologically intertwined processes and populations, particularly in light of the

131
widespread potential for archaeal involvement in NH3 oxidation and concomitant influence on
global N, C, and O cycles.
Literature Cited
Auman, A.J., C.C. Speake, and M.E. Lidstrom. 2001. nifH sequences and nitrogen fixation in
type I and type II methanotrophs. Appl. Environ. Microbiol. 67:4009-4016.
Bano, N. and J.T. Hollibaugh. 2000. Diversity and distribution of DNA sequences with affinity
to ammonia-oxidizing bacteria of the β subdivision of the class Proteobacteria in the
Artic Ocean. Appl. Environ. Microbiol. 66:1960-1969.
Blackburn, T.H. and J Sørensen. 1988. Nitrogen cycling in coastal marine environments, SCOPE
33. John Wiley & Sons, New York.
Bedard, C., and R. Knowles. 1989. Physiology, biochemistry and specific inhibitors of CH4,
NH4, and CO oxidation by methanotrophs and nitrifiers. Microbiol. Rev. 53:68-84.
Bock, E. and M.Wagner 2001. Oxidation of inorganic nitrogen compounds as an energy source.
in The Prokaryotes eds. Dworkin, M. et al. Springer New York.
Bodelier, P. L., P. Roslev, T. Henckel, and P. Frenzel. 2000. Stimulation by ammonium-based
fertilizers of methane oxidation in soil around rice roots. Nature 403:421–424.
Bodelier, P.L.E and Peter Frenzel. 1999. Contribution of methanotrophic and nitrifying bacteria
to CH4 and NH4+ oxidation in the rhizosphere of rice plants as determined by new
methods of discrimination. Appl. Envir. Microbiol. 65: 1826-1833.
Bosse, U., P. Frenzel, and R. Conrad. 1993. Inhibition of methane oxidation by ammonium in the
surface layer of a littoral sediment. FEMS Microbiol. Ecol. 13:123–134.
132
Bourne DG, McDonald IR, Murrell JC. 2001. Comparison of pmoA PCR primer sets as tools for
investigating methanotroph diversity in three Danish soils. Appl. Environ. Microbiol. 67
(9): 3802-3809.
Bowman, J. P., L. I. Sly, P. D. Nichols, and A. C. Hayward. 1993. Revised taxonomy of the
methanotrophs: description of Methylobacter gen. nov., recommendation of
Methylococcus, validation of Methylosinus and Methylocystis species, and a proposal
that the family Methylococcaceae includes only the group I methanotrophs. Int. J. Syst.
Bacteriol. 43:735-753.
Bruns, M.-A., J. R. Stephen, G. A. Kowalchuk, J. I. Prosser, and E. A. Paul. 1999. Comparative
diversity of ammonia oxidizer 16S rRNA gene sequences in never-tilled, tilled, and
successional soils. Appl. Environ. Microbiol. 65:2994-3000.
Chandler, D. P., J. K. Fredrickson, and F. J. Brockman. 1997. Effect of PCR template
concentration on the composition and distribution of total community 16S rDNA clone
libraries. Mol. Ecol. 6:475-482.
Cheng, Y.S., J.L. Halsy, K.A. Fode, C.C. Remsen, and M.L.P. Collins. 1998. Detection of
methanotrophs in groundwater by PCR. Appl. Environ. Microbiol. 65: 648-651.
Cicerone, R.J., and R.S. Oremland. 1988. Biogeochemical aspects of atmospheric methane.
Global Biogeochem. Cycles. 1:61-86.
Diez, B., C. Pedros-Alio, T.L. Marsh, and R. Massana. 2001. Application of denaturing gradient
gel electrophoresis (DGGE) to study the diversity of marine picoeukaryotic assemblages
and comparison of DGGE with other molecular techniques. Appl. Environ. Microbiol.
67: 2942-2951.
133
Don R. H., P.T. Cox, B.J. Wainwright, K. Baker, and J.S. Mattick. 1991 'Touchdown' PCR to
circumvent spurious priming during gene amplification. Nucleic Acids Res. 19:4008.
Dunfield, P., and R. Knowles. 1995. Kinetics of inhibition of methane oxidation by nitrate,
nitrite, and ammonium in a humisol. Appl. Environ. Microbiol. 61:3129–3135.
Eller, G. and P. Frenzel. 2001. Changes in activity and community structure of methane-
oxidizing bacteria over the growth period of rice. Appl. Environ. Microbiol.
67:2395–2400.
Farrelly, V., F. A. Rainey, and E. Stackebrandt. 1995. Effect of genome size and rrn gene copy
number on PCR amplification of 16S rRNA genes from a mixture of bacterial species.
Appl. Environ. Microbiol. 61:2798-2801.
Ferris, M. J., G. Muyzer, and D. M. Ward. 1996. Denaturing gradient gel electrophoresis profiles
of 16S rRNA-defined populations inhabiting a hot spring microbial mat community.
Appl. Environ. Microbiol. 62:340–346.
Ferris, M. J., and D. M. Ward. 1997. Seasonal distributions of dominant 16S rRNA-defined
populations in a hot spring microbial mat examined by denaturing gradient gel
electrophoresis. Appl. Environ. Microbiol. 63:1375-1381.
Graham, D.W., J.A. Chaudhary, R.S. Hanson, and R.G. Arnold. 1993. Factors affecting
competition between type I and type II methanotrophs in continuous flow reactors.
Microb. Ecol. 25:1-17.
Grimes, D.J., C.R. Woese, M.T. MacDonell and R.R. Colwell. 1997. Systematic study of the
genus Vogesella gen. nov. and its type species, Vogesella indigofera comb. nov. Int. J.
Syst. Bacteriol., 47, 19-27.

134
Gulledge, J., Schimel, J. P. 1998. Low-concentration kinetics of atmospheric CH4 oxidation in
soil and mechanism of NH4+ inhibition. Appl. Environ. Microbiol. 64: 4291-4298.
Hanson, R.S. and T.E. Hanson, 1996. Methanotrophic bacteria. Microbiol. Rev. 60, pp. 439-471.
Head, I.M., W.D. Hiorns, T.M. Embley, A.J. McCarthy, and J.R. Saunders. 1993. The phylogeny
of autotrophic ammonia-oxidizing bacteria as determined by analysis of 16s ribosomal
RNA gene sequences. J. Gen. Microbiol. 139:1147-1153.
Henckel, T., M. Friedrich, and R. Conrad. 1999. Molecular analysis of the methane-oxidizing
microbial community in rice field soil by targeting the genes of the 16s rrna, particulate
methane monooxygenase, and methanol dehydrogenase. Appl. Environ. Microbiol. 65:
1980-1990.
Hiorns, W. D., R. C. Hastings, I. M. Head, A. J. McCarthy, J. R. Saunders, R. W. Pickup, and G.
H. Hall. 1995. Amplification of 16S ribosomal RNA genes of autotrophic ammonia-
oxidizing bacteria demonstrates the ubiquity of Nitrosospiras in the environment.
Microbiology 141:2793–2800.
Holmes, A. J., A. Costello, M. E. Lidstrom, and J. C. Murrell. 1995. Evidence that particulate
methane monooxygenase and ammonia monooxygenase may be evolutionarily related.
FEMS Microbiol. Lett. 132:203–208.
Jenkens, M.C. and W.M. Kemp. 1984. The coupling of nitrification and denitrification in two
estuarine sediments. Limnol. Oceanogr. 29:609-619.
Jones, H. A., and D. B. Nedwell. 1993. Methane emission and methane oxidation in landfill
cover soil. FEMS Microbiol. Ecol. 102:185–195.

135
Joye, S. B., and S. An. 1999. Denitrification in Galveston Bay: A final project report to the Texas
Water Development Board. pp. 86.
Joye, S. B., T.L. Connell, L. G. Miller, R.S. Oremland and R. S. Jellison. 1999. Oxidation of
ammonia and methane in an alkaline, saline lake. Limnol. Oceanogr. 44 (1): 178-188.
Joye, S. B., and J. T. Hollibaugh. 1995. Influence of sulfide inhibition of nitrification on nitrogen
regeneration in sediments. Science 270:623-625.
King, G. M. and S. Schnell, 1994. Ammonium and nitrite inhibition of methane oxidation by
methylobacter albus bg8 and methylosinus trichosporium OB3b at low methane
concentrations. Appl. Environ. Microbiol. 60: 3508-3513.
King, G. M., and S. Schnell. 1994. Effect of increasing atmospheric methane concentration on
ammonium inhibition of soil methane consumption. Nature 370:282–284.
Liesack, W., H. Weyland, and E. Stackebrandt. 1991. Potential risks of gene amplification by
PCR as determined by 16s rDNA analysis of a mixed-culture of strict barophilic bacteria.
Microb. Ecol. 21: 191-198.
McDonald, I. R., and J. C. Murrell. 1997. The particulate methane monooxygenase gene pmoA
and its use as a functional gene probe for methanotrophs. FEMS Microbiol. Lett.
156:205-210.
Megraw, S. R., and R. Knowles. 1987. Active methanotrophs suppress nitrification in a humisol.
Biol. Fertil. Soils 4:205–212.
Mendum, T. A., R. E. Sockett, and P. R. Hirsch Use of molecular and isotopic techniques to
monitor the response of autotrophic ammonia-oxidizing populations of the subdivision of

136
the class Proteobacteria in arable soils to nitrogen fertilizer Appl. Envir. Microbiol. 1999
65: 4155-4162.
Murrell, J. C., I. R. McDonald, and D. G. Bourne. 1998. Molecular methods for the study of
methanotroph ecology. FEMS Micriobiol. Ecol. 27:103-114.
Muyzer, G., T. Brinkhoff, U. Nübel, C. Santegoeds, H. Schäfer, and C. Wawer. 1997.
Denaturing gradient gel electrophoresis (DGGE) in microbial ecology, p. 1-27. In A. D.
L. Akkermans, J. D. van Elsas, and F. J. de Bruijn (ed.), Molecular microbial ecology
manual, vol. 3.4.4.. Kluwer Academic Publishers, Dordrecht, The Netherlands.
Muyzer, G., E.C.D. Wall, and A.G. Uitterlinden. 1993. Profiling of complex microbial
populations by denaturing gradient gel electrophoresis analysis of PCR-amplified genes
coding for 16s rRNA. Appl. Environ. Microbiol. 59: 695-700.
Phillips, C. J., D. Harris, S.L. Dollhopf, K.L. Gross, J.I. Prosser, E.A. Paul. 2000. Effects of
agronomic treatments on structure and function of ammonia-oxidizing communities.
Appl. Environ. Microbiol. 66: 5410-5418
Prosser, J. I. 1989. Autotrophic nitrification in bacteria. Adv. Microbiol. Physiol. 30:125–181.
Reeburg, W. S., S. C. Whalen, and M. J. Alperin. 1993. The role of methylotrophy in the global
methane budget, p. 1–14. In J. C. Murrell and D. P. Kelly (ed.), Microbial growth on C1
compounds. Intercept Ltd, Andover, United Kingdom.
Roy, R., and R. Knowles. 1994. Effects of methane metabolism on nitrification and nitrous oxide
production in polluted freshwater sediment. Appl. Environ. Microbiol. 60:3307–3314.
Schimel, J. P., E. A. Holland, and D. Valentine. 1993. Controls on methane flux from terrestrial
ecosystems, p. 167-182. In D. E. Rolston, L. A. Harper, A. R. Mosier, and J. M. Duxbury

137
(ed.), Agricultural ecosystem effects on trace gases and global climate change. American
Society of Agronomy, Madison, Wis.
Schnell, S., and G. M. King. 1994. Mechanistic analysis of ammonium inhibition of atmospheric
methane consumption in forest soils. Appl. Environ. Microbiol. 60:3514-3521.
Stephen, J. R., G. A. Kowalchuk, M-A. V. Bruns, A. E. McCaig, C. J. Phillips, T. M. Embley,
and J. I. Prosser. 1998. Analysis of β-subgroup proteobacterial ammonia oxidizer
populations in soils by denaturing gradient gel electrophoresis analysis and hierarchical
phylogenetic probing. Appl. Environ. Microbiol. 64:2958-2965
Topp, E. and R.S. Hanson. 1991. Metabolism of radiatively important trace gases by methane-
oxidizing bacteria, p. 71-90. In J.E. Rogers and W.B. Whitman (ed.), Microbial
production and consumption of greenhouse gases: methane nitrogen oxides, and
halomethanes. American Society for Microbiology, Washington, D.C.
Von Wintzingerode, F., U. B. Goebel, and E. Stackebrandt. 1997. Determination of microbial
diversity in environmental samples: pitfalls of PCR-based rRNA analysis. FEMS
Microbiol. Rev. 21:213-229.
Voytek, M.A. and B.B. Ward. 1995. Detection of ammonium-oxidizing bacteria of the β-
subclass of the class Proteobacteria in aquatic samples with the PCR. Appl. Environ.
Microbiol. 61: 1444-1450.
Ward, B. B., M. A. Voytek, and K.P. Witzel. 1997. Phylogenetic diversity of natural populations
of ammonia oxidizers investigated by specific PCR amplification. Microb. Ecol.
33:87–96.
Whalen, S. C., W. S. Reeburgh, and K. A. Sandbeck. 1990. Rapid methane oxidation in a landfill
cover soil. Appl. Environ. Microbiol. 56:3405–3411.

138
Wise, M.G., J.V. McArthur, and L.J. Shimkets. 1999. Methanotroph diversity in landfill soil:
isolation of novel type I and type II methanotrophs whose presence was suggested by
culture-independent 16S ribosomal DNA analysis. Appl. Environ. Microbiol. 65:4887-
4897.
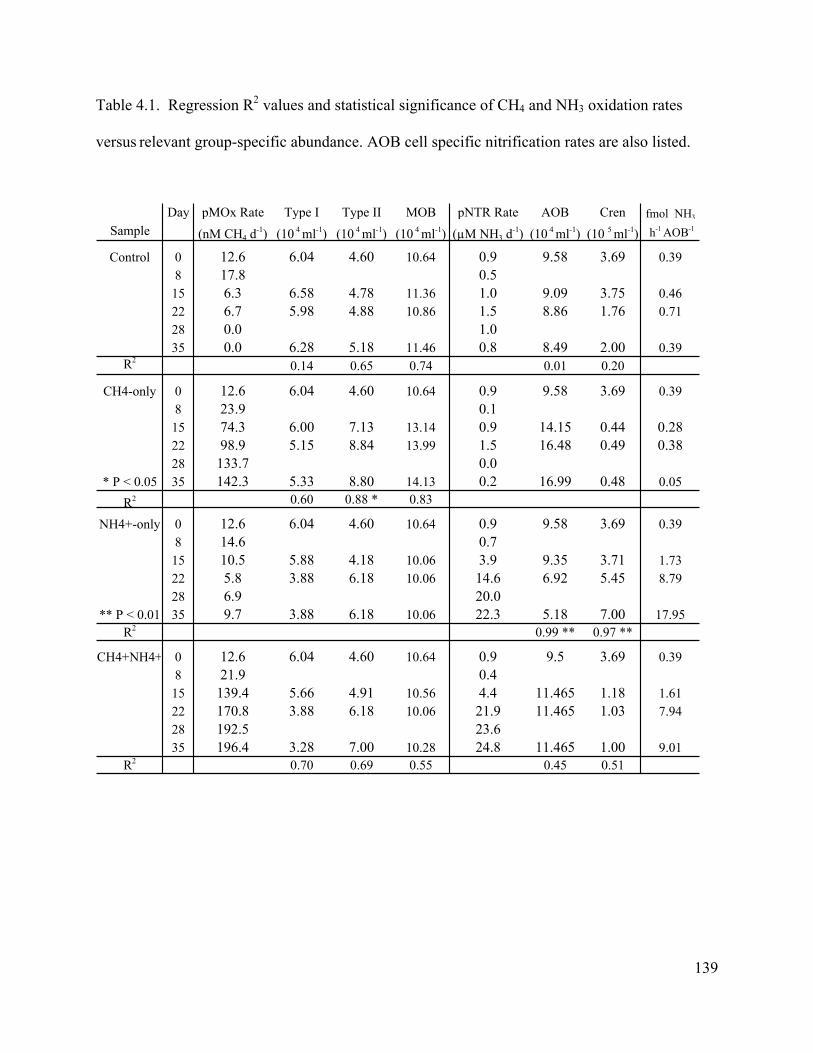
139
Table 4.1. Regression R2 values and statistical significance of CH4 and NH3 oxidation rates
versus relevant group-specific abundance. AOB cell specific nitrification rates are also listed.
Day pMOx Rate Type I Type II MOB pNTR Rate AOB Cren fmol NH3
Sample (nM CH4 d-1) (10 4 ml-1) (10 4 ml-1) (10 4 ml-1) (µM NH3 d
-1) (10 4 ml-1) (10 5 ml-1) h-1 AOB-1
Control 0 12.6 6.04 4.60 10.64 0.9 9.58 3.69 0.398 17.8 0.515 6.3 6.58 4.78 11.36 1.0 9.09 3.75 0.4622 6.7 5.98 4.88 10.86 1.5 8.86 1.76 0.7128 0.0 1.035 0.0 6.28 5.18 11.46 0.8 8.49 2.00 0.39
R2 0.14 0.65 0.74 0.01 0.20
CH4-only 0 12.6 6.04 4.60 10.64 0.9 9.58 3.69 0.398 23.9 0.115 74.3 6.00 7.13 13.14 0.9 14.15 0.44 0.2822 98.9 5.15 8.84 13.99 1.5 16.48 0.49 0.3828 133.7 0.0
* P < 0.05 35 142.3 5.33 8.80 14.13 0.2 16.99 0.48 0.05
R2 0.60 0.88 * 0.83
NH4+-only 0 12.6 6.04 4.60 10.64 0.9 9.58 3.69 0.398 14.6 0.715 10.5 5.88 4.18 10.06 3.9 9.35 3.71 1.7322 5.8 3.88 6.18 10.06 14.6 6.92 5.45 8.7928 6.9 20.0
** P < 0.01 35 9.7 3.88 6.18 10.06 22.3 5.18 7.00 17.95R2 0.99 ** 0.97 **
CH4+NH4+ 0 12.6 6.04 4.60 10.64 0.9 9.5 3.69 0.398 21.9 0.415 139.4 5.66 4.91 10.56 4.4 11.465 1.18 1.6122 170.8 3.88 6.18 10.06 21.9 11.465 1.03 7.9428 192.5 23.635 196.4 3.28 7.00 10.28 24.8 11.465 1.00 9.01
R2 0.70 0.69 0.55 0.45 0.51

140
FIGURE LEGENDS
Figure 4.1. Time course of potential methane (A) and ammonia (B) oxidation rates from sub-
samples of Mono Lake enrichment cultures. Error bars are standard deviation around the mean
(n=3).
Figure 4.2. Time-course measurements of Mono Lake enrichment culture DIN concentrations:
ammonia (A), nitrite (B), and nitrate (C).
Figure 4.3. Bar graph representation of total and group specific absolute cell counts in the un-
amended control over the course of the incubation. Total (DAPI stained) and Crenarchaeota cells
(A) and comparative functional group-specific abundance (B).
Figure 4.4. Time-course DGGE analysis of the variable 3 region of PCR products from Mono
Lake enrichment culture DNA amplicons produced using: MethT1 (A), MethT2 (B) and NitAB
(C) primer sets.
Figure 4.5. Time course measurements of potential rate measurements and corresponding
functional group abundance from Mono Lake enrichment cultures: CH4-only (A), NH4+-only
(B), and both NH4++CH4 (C). Group specific cell numbers are scaled with retained proportion.
See Fig. 4.3 for absolute initial abundance.

141
Figure 4.1.

142
Figure 4.2.
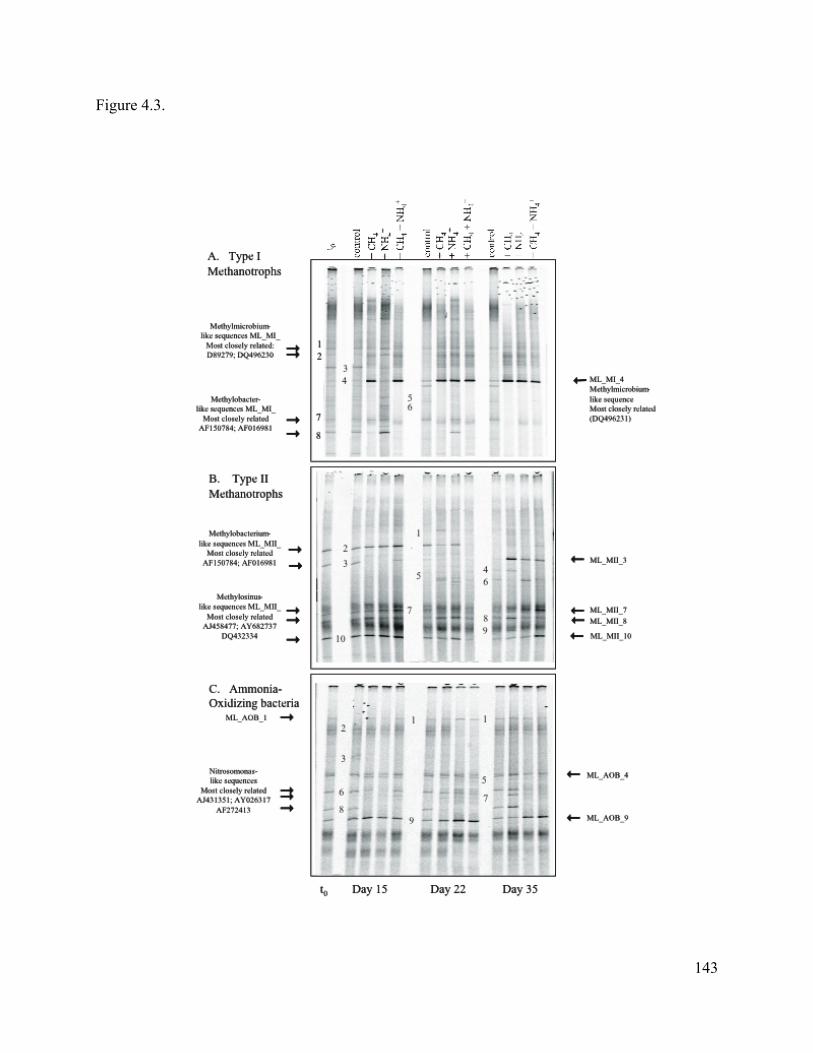
143
Figure 4.3.
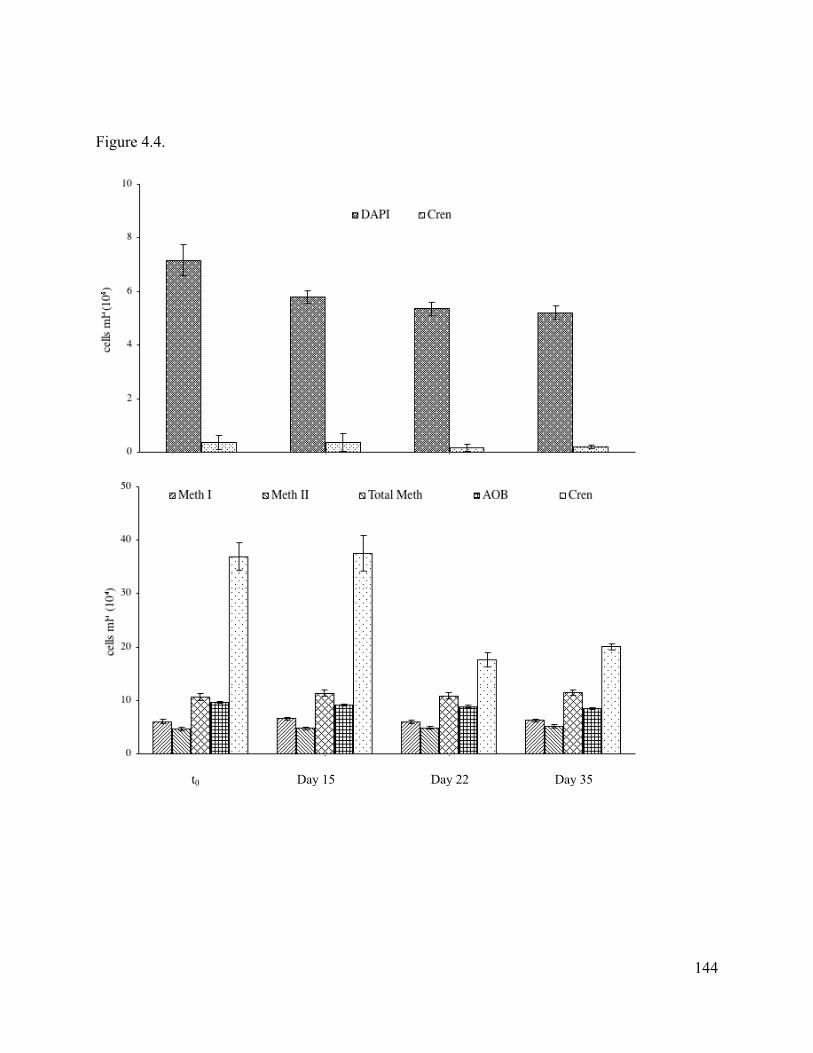
144
Figure 4.4.
t0 Day 15 Day 22 Day 35

145
Figure 4.5.
0 7
0
5
10
15
20
0 7 14 21 28 35
pNTR
; pM
eOx
(µM
day
-1);
cells
(ml-1
scal
ed)
pMOx
p
CREN
AOB
Meth I
Meth II
CONTROL
MOB
pNTR
0
60
120
0 7 14 21 28 35
pMeO
x (µ
mol
CH
4 l-1 d
ay-1);
cells
(ml-1
scal
ed)
AOB
pMOx
CREN
Meth II
Meth I
+CH4MOB
pNTR
0
5
10
15
20
25
0 7 14 21 28 35pNTR
(µm
ol N
H3 l
-1 da
y-1);
cells
(ml-1
scal
ed)
AOB
pNTR
Meth I
Meth II
+NH4+
pMOx
CREN
MOB
0
50
100
150
200
0 7 14 21 28 35
Days
pNTR
; pM
eOx
(µM
day
-1);
cells
(ml-1
scal
ed)
pMOx
CRENAOB
Meth I
Meth II
+CH4 + NH4+
pNTR
MOB

146
CHAPTER 5
CONCLUSIONS
The data presented here has furthered our understanding of the ecology of methanotrophs
and ammonia oxidizer populations. We addressed controls on both activity and community
composition in situ (Chapters 2 & 3) and under conditions of manipulated substrate availability
designed to illicit interactions through competition for mutually required metabolites (Chapter
4). While some of the data provided support for generally accepted physiological and
populational paradigms, a surprising wealth of novel information was uncovered (Chapters 2, 3,
& 4).
In situ Mono Lake CH4 oxidation measurements confirmed a widely held tenet of
methanotroph preference for low O2 tension. Peak CH4 oxidation activity was maintained in the
microaerophilic zone proximal to the bottom of the oxycline even as it migrated upward through
the water column during seasonal stratification. On the other hand, community abundance data
supported a small but growing body of evidence suggesting a widespread strategy of stable
methanotroph populations persisting through adversity and subsequently taking advantage of
ephemeral advantageous conditions vs. population growth-induced activity only during periods
optimal growth conditions (Chapter 2). We also expanded the range of environments
(hypersaline lakes) where type II methanotrophs may be expected to be found.
Nitrification in hypersaline Mono Lake by nitrosomonads was reconfirmed following a
discontinuity in activity that occurred between 1995 and 2003-2003. Contrasting hydrological
mixing regimes resulting in differential NH3 availability in the mixolimnion may have

147
contributed to the observed pattern. However, the consequences of the transition to a monomictic
mixing regime likely shifted nitrosomonad species composition from N. europea-like organisms
to nitrosomonads most closely related to alkaline/hypersaline-adapted species (Chapter 3). AOB
abundance was inversely correlated with the seasonality observed in integrated nitrification rates
and indicated a negative correlation between AOB abundance and nitrification activity. In
contrast, Crenarchaeota cell numbers exhibited a strong correlation with NTR rate
measurements. While the pattern of AOB abundance and correlation between crenarchaeal
abundance and nitrification profiles suggests that AOA may contribute to NH3 oxidation in
Mono Lake, the lack of verifiable archaeal ammonia monooxygenase genes and the sufficient
abundance of AOB to account for all of the measured nitrification activity leaves open the
question of relative contributions between AOA and AOB in situ (Chapter 3).
Manipulation of substrate availability in individual enrichment cultures facilitated the
elucidation of controls and interactions between methanotroph and nitrifier populations and
activity (Chapter 4). Consistent with previous results, methane and NH3 oxidation rates
increased over time in enrichments amended with their primary substrate. While additional
methanotroph abundance and increased activity of the initial in situ methanotroph population
likely contributed to the higher CH4 oxidation rates observed in those treatments, NH3 oxidation
rates likely increased due to the alleviation of N limitation. Trends in community composition
data in the NH4+-only enrichment provided more compelling support for potential AOA
contribution to nitrification relative to the in situ data.
The presence or absence of additional NH4+ influenced the response in methanotrophic
activity and community composition. The methanotroph population of the CH4 + NH4+
enrichment had a higher potential for CH4 oxidation due to readily available NH3. However, the
148
methanotroph population in the CH4-only enrichment was also able to take advantage of higher
CH4 availability through community composition adaptation. Nitrification activity was not
significantly affected by supplemental CH4, however, Crenarchaeota abundance decreased and
AOB increased in the CH4 + NH4+ enrichment suggesting that AOB were likely more active in
nitrification in the CH4+NH4+ enrichment.
The integration of results from individual enrichments with the responses elicited in the
dually enriched CH4 + NH4+ treatment provided preliminary insight into the interactions between
these ecologically mingled processes and populations which may prove significant to the current
reassessment of relative influences on global N, C, and O cycles in light of the widespread
potential for archaeal involvement in NH3 oxidation.