a bilevel model for preventive healthcare facility network design with congestion
TRANSCRIPT

This article was downloaded by: [University of Pennsylvania]On: 22 February 2013, At: 10:34Publisher: Taylor & FrancisInforma Ltd Registered in England and Wales Registered Number: 1072954 Registered office: Mortimer House,37-41 Mortimer Street, London W1T 3JH, UK
IIE TransactionsPublication details, including instructions for authors and subscription information:http://www.tandfonline.com/loi/uiie20
A bilevel model for preventive healthcare facilitynetwork design with congestionYue Zhang a , Oded Berman b , Patrice Marcotte c & Vedat Verter da College of Business Administration, University of Toledo, 2801 W. Bancroft Street, Toledo,OH, 43606, USAb Rotman School of Management, University of Toronto, 105 St. George Street, Toronto,Ontario, M5S 3E6, Canadac DIRO, Universite de Montreal, C.P. 6128, Succursale Centre-Ville, Montreal, Quebec, H3C3J7, Canadad Desautels Faculty of Management, McGill University, 1001 Sherbrooke Street West,Montreal, Quebec, H3A 1G5, CanadaVersion of record first published: 09 Oct 2010.
To cite this article: Yue Zhang , Oded Berman , Patrice Marcotte & Vedat Verter (2010): A bilevel model for preventivehealthcare facility network design with congestion, IIE Transactions, 42:12, 865-880
To link to this article: http://dx.doi.org/10.1080/0740817X.2010.491500
PLEASE SCROLL DOWN FOR ARTICLE
Full terms and conditions of use: http://www.tandfonline.com/page/terms-and-conditions
This article may be used for research, teaching, and private study purposes. Any substantial or systematicreproduction, redistribution, reselling, loan, sub-licensing, systematic supply, or distribution in any form toanyone is expressly forbidden.
The publisher does not give any warranty express or implied or make any representation that the contentswill be complete or accurate or up to date. The accuracy of any instructions, formulae, and drug doses shouldbe independently verified with primary sources. The publisher shall not be liable for any loss, actions, claims,proceedings, demand, or costs or damages whatsoever or howsoever caused arising directly or indirectly inconnection with or arising out of the use of this material.

IIE Transactions (2010) 42, 865–880Copyright C© “IIE”ISSN: 0740-817X print / 1545-8830 onlineDOI: 10.1080/0740817X.2010.491500
A bilevel model for preventive healthcare facility networkdesign with congestion
YUE ZHANG1, ODED BERMAN2, PATRICE MARCOTTE3 and VEDAT VERTER4,∗
1College of Business Administration, University of Toledo, 2801 W. Bancroft Street, Toledo, OH 43606, USAE-mail: [email protected] School of Management, University of Toronto, 105 St. George Street, Toronto, Ontario, Canada, M5S 3E6E-mail: [email protected], Universite de Montreal, C.P. 6128, Succursale Centre-Ville, Montreal, Quebec, Canada, H3C 3J7E-mail: [email protected] Faculty of Management, McGill University, 1001 Sherbrooke Street West, Montreal, Quebec, Canada, H3A 1G5E-mail: [email protected]
Received April 2009 and accepted April 2010
Preventive healthcare aims at reducing the likelihood and severity of potentially life-threatening illnesses by protection and earlydetection. The level of participation in preventive healthcare programs is a critical determinant in terms of their effectivenessand efficiency. This article presents a methodology for designing a network of preventive healthcare facilities so as to improveits accessibility to potential clients and thus maximize participation in preventive healthcare programs. The problem is formu-lated as a mathematical program with equilibrium constraints; i.e., a bilevel non-linear optimization model. The lower levelproblem which determines the allocation of clients to facilities is formulated as a variational inequality; the upper level is afacility location and capacity allocation problem. The developed solution approach is based on the location–allocation frame-work. The variational inequality is formulated as a convex optimization problem, which can be solved by the gradient projectionmethod; a Tabu search procedure is developed to solve the upper level problem. Computational experiments show that large-sized instances can be solved in a reasonable time. The model is used to analyze an illustrative case, a network of mammog-raphy centers in Montreal, and a number of interesting results and managerial insights are discussed, especially about capacitypooling.
Keywords: Preventive healthcare, network design, bilevel, congestion, equilibrium, variational inequality
1. Introduction
Preventive healthcare programs can save lives and con-tribute to a better quality of life by reducing the need forradical treatments, such as surgery or chemotherapy. Flushots, blood tests, mammograms, and anti-smoking adviceare among the most well-known preventive services. Thesubstantial savings in the costs of diagnosis and therapyas well as the lower capital investment associated with pre-ventive healthcare programs have been recognized for threedecades (Walker, 1977). For example, studies show thatmammograms taken on a regular basis have the potentialto reduce deaths from breast cancer for women between theages of 50 and 69 by up to 40% (Health Canada, 2005). Gor-nick et al. (2004) found that 36% of breast cancer patientswithout a mammogram received the diagnosis of late stage
∗Corresponding author
cancer, whereas this rate was 20% for the patient group whohad mammograms.
In contrast with sick people who need urgent medicalattention, the potential clientele of preventive healthcareoften do not feel the necessity to receive these servicesand may not participate in preventive programs offeredin their region. For instance, by 2003 every province inCanada had an organized program offering biennial mam-mography screening to asymptomatic women between theages of 50 and 69 with no previous history of breast can-cer. Although the proportion of women participating inthe screening has increased over time, reaching 34% na-tionally in 2002, none of the organized programs haveachieved the nationally established target of 70% partic-ipation (Public Health Agency of Canada, 2006). Theachievement of desired participation level continues to be achallenge to many preventive healthcare programs. Accord-ing to many empirical studies, such as McNoe et al. (1996),Zimmerman (1997), and Facione (1999), the ease of
0740-817X C© 2010 “IIE”
Dow
nloa
ded
by [
Uni
vers
ity o
f Pe
nnsy
lvan
ia]
at 1
0:34
22
Febr
uary
201
3

866 Zhang et al.
access to the facilities is a crucial factor that influencespeople’s decision to participate.
Recognizing the significance of accessibility, this articlepresents a methodology for designing a network of preven-tive healthcare facilities so as to maximize participation topreventive programs. The number of facilities to be estab-lished, the location of each facility, and the capacity at eachfacility are the main determinants of the configuration ofthe healthcare facility network. We represent the capacityat each facility by the number of service teams and use thetotal time needed to receive preventive services at a facilityas a proxy for its accessibility. The total time comprises thetime spent during transportation to the facility as well asthe time spent at the facility while waiting and receivingservices. Typically, the level of participation in a preventiveprogram decreases with the expected total time to receivethe services. In order to ensure service quality, however,the preventive healthcare facilities cannot be operated un-less the size of their clientele fulfills a minimum workloadrequirement.
The methodology presented in this article incorporatesthe differentiating features of preventive healthcare. First,the number of people who seek the services at each facilityis not controlled by the policy maker: preventive healthcareis a user choice environment in terms of the allocation ofclients to facilities. Second, if the wait times are extensivedue to congestion at the facilities, then clients’ willingnessto participate in a preventive program could decrease sig-nificantly. That is, the demand for preventive care is elasticwith respect to the configuration of the facility network.The third distinguishing factor of preventive healthcare isthe apparent link between volume and quality of care; i.e.,the previously mentioned minimum workload requirement.In Canada, for example, a radiologist is required to inter-pret at least 4000 mammograms annually.
To the best of our knowledge, there are only two earlierpapers that study the preventive healthcare facility networkdesign problem. Verter and Lapierre (2002) used travel dis-tance as a proxy for the accessibility of a facility by assum-ing that people would only go to the closest facility to seekpreventive services. Their model maximizes participationby determining the number of facilities to be established aswell as the location of each facility. Recently, Zhang et al.(2009) modeled each facility as an M/M/1 queue to incor-porate the limited service capacity of preventive healthcarefacilities and the resulting congestion. They used the total(travel, waiting, and service) time as a proxy for accessibil-ity and assumed that clients at the same population zonewould patronize the same facility; i.e., the one with theminimum expected total time. This assumption may not berealistic in the context of preventive care, and it also pre-vents Zhang et al. (2009) from identifying an equilibriumallocation of clients to facilities for many of the probleminstances they studied.
This article extends the state of the art in preventivehealthcare facility network design by: (i) determining the
optimal number of servers at each facility as well as thenumber and locations of the facilities; and (ii) incorporatingthe possibility that people from the same population zonecan patronize different facilities, which usually guaranteesthe existence of an allocation equilibrium. These requirea completely different modeling approach (and solutionmethodology) than the earlier papers. In representing theproblem, we adopt a bilevel formulation, where the lowerlevel model captures the user choice nature of the allocationdecisions, whereas the number, locations, and capacities ofthe facilities are determined at the upper level. The lowerlevel finds a user equilibrium recognizing that the poten-tial clients choose the facility that minimizes their expectedtotal time. At equilibrium, everyone is content with the fa-cility they patronize i.e., people from the same populationzone expect to spend the same total time even if they go todifferent facilities. We formulate the lower level problem viaa variational inequality. To the best of our knowledge, thisis the first article that incorporates a user equilibrium in afacility network design model with congestion. Our resultsdemonstrate that this new model framework for the consid-erations on user choice and capacity reallocation leads to asignificant improvement in the accuracy of the solution aswell as in the level of accessibility and participation.
We also note that, consistent with Zhang et al. (2009), thearticle primarily aims at a non-appointment or “walk-in”system, which applies to many routine preventive health-care services (e.g., flu shots, anti-smoking advice, drug andalcohol use, nutrition, etc.) and runs in many countries orareas. Since we could not find a more suitable case withavailable data, the network of mammography centers inMontreal is used here as an illustrative example to showhow our model and methodology can be applied and todiscuss a number of managerial insights.
The remainder of this article is organized as follows. Thenext section provides an overview of the relevant litera-ture. Section 3 describes the problem and formulates it as abilevel programming model. A location–allocation frame-work is proposed in Section 4 to solve the problem. Section5 presents computational results for the model. An illustra-tive case, based on the network of mammography centersin Montreal, is studied in Section 6. In the final section,conclusions and future research directions are provided.
2. Related literature
Although the design of healthcare facilities has beenstudied for a long time, few models incorporate the dis-tinguishing features of preventive healthcare, which havebeen discussed in Zhang et al. (2009). The recent review byDaskin and Dean (2004) on the location of healthcare fa-cilities, for example, makes no reference to preventive care.Similarly, more general literature reviews by Berman andKrass (2002) and Marianov and Serra (2002), which focuson public facility location problems with stochastic demand
Dow
nloa
ded
by [
Uni
vers
ity o
f Pe
nnsy
lvan
ia]
at 1
0:34
22
Febr
uary
201
3

Preventive healthcare networks with congestion 867
and congestion in the context of fixed versus mobile servers,do not cite any articles on preventive healthcare. As men-tioned earlier, Verter and Lapierre (2002) and Zhang et al.(2009) are the only papers that study the network design ofpreventive healthcare facilities.
A number of facility location and capacity allocation pa-pers, based on a Mathematical Program with EquilibriumConstraints (MPEC) structure, are related to ours. Chaoet al. (2003) developed a system optimization model for aresource allocation problem in a multiple facility system;i.e., allocating capacity and demand to facilities by a centralauthority in order to maximize average customer waitingtime. They proved that the optimal solution of their modelis incentive compatible for customers. However, theirmodel does not consider travel distance, thus resulting ina solution structure of “one large and many small.” Mari-anov (2003) presented a model for locating multiple-serverfacilities to maximize the overall demand. The demand ata node that is elastic to travel time and congestion is rep-resented by the number of clients in the system. Similar toChao et al. (2003), this is also a system optimization modeland the assignment of demand to facilities is determinedby a central authority, while the demand at each node isdetermined by an equilibrium constraint. Marianov et al.(2005) extended Marianov (2003) by allowing allocationof servers to facilities. Marianov et al. (2008) proposeda competitive facility location problem, in which clientschoose a facility based on travel time and waiting time.User choice is probabilistic by using a logit formulation,and an equilibrium allocation of clients to facilities can beidentified by solving a set of non-linear equations.
We note that the user choice behavior addressed in ourmodel is different from the ones discussed above. Instead ofassigning clients to facilities or letting clients choose whereto shop probabilistically, our model not only allows clientsto select the facility with the minimum expected total timebut also allows the possibility that clients from the samepopulation zone go to different facilities (they spend thesame total time even if they go to different facilities). To ac-complish this, we develop a completely different modelingapproach and solution methodology.
The user equilibrium model has been extensively studiedin the Spatial Price Equilibrium Problem (SPEP) and theTraffic Network Equilibrium Problem (TNEP). The SPEPseeks to determine the commodity supply prices demandprices and trade flows satisfying the equilibrium conditionthat demand price is equal to supply price plus transporta-tion cost. Studies in this area include Samuelson (1952),Takayama and Judge (1964, 1971), Marcotte et al. (1992),etc. These models have also been used to study equilibriumproblems in agriculture, energy markets, and finance, suchas in Judge and Takayama (1973), Nagurney (1992), andNolte (2008). In a congested transportation network, theTNEP aims at finding clients’ travel paths with minimalcost from their origins to destinations. In particular, thenetwork design problem associated with the traffic equilib-
rium is to optimize the capacities of the network links, soas to balance the transportation, investment, and mainte-nance costs of a network subject to congestion. This prob-lem has been studied by Dafermos (1968) and Abdulaaland LeBlanc (1979). Magnanti and Wong (1984), Marcotte(1986), and Florian and Hearn (1995). Interested readersmay also refer to Nagurney (1999) for a detailed review ofuser equilibrium models.
Despite the similar bilevel structure, the current articlediffers from the mentioned TNEP models in several aspects.First, congestion in the TNEP occurs on links, whereasin our problem it occurs at facilities where waiting timesare modeled based on queueing theory. Second, the upperlevel of our problem is to select an undetermined numberof locations and to make the capacity decisions at theselocations, which is a combinatorial problem by itself. Third,our bilevel problem cannot be easily simplified to a single-level problem due to a minimum workload requirement.
3. The model
In this section, we model the problem of preventive health-care facility network design by a bilevel formulation. Theobjective of the problem is to maximize the level of partic-ipation, by locating an undetermined number of facilitiesat the population zones over the network and allocating agiven number of servers to open facilities. We incorporatethe congestion at the facilities in the model and assume thatclients patronize the facility with the minimum expected to-tal time, which comprises the travel time to the facility andthe expected time spent at the facility for possibly waitingand receiving the service (system waiting time). We alsoassume that the number of clients at each population zonewho request service is a linearly decreasing function of theexpected total time. In order to ensure service quality, facil-ities cannot be established unless their client base exceedsa minimum workload requirement.
An overwhelming majority of the healthcare budgetsaround the globe are spent on responding to acute prob-lems, urgent needs of patients, and pressing concerns. Mostpreventive healthcare programs aim at improving the ef-ficiency of the regional healthcare systems with limitedresources rather than making major investments into in-creasing the resource infrastructure. Therefore, the policiesto increase the number of people receiving preventive ser-vices has been an integral part of many reform programs.For example, the Montreal breast cancer screening pro-gram studied in Section 6 involved accrediting some ofthe existing mammography facilities in the city rather thanbuilding new ones. The accreditation criterion is incorpo-rated in the model via the minimum workload requirement,which ensures a certain quality of care at each accreditedpreventive care facility. As originally noted by Verter andLapierre (2002), a radiologist at each accredited facilityneeds to read a certain number of mammograms in order
Dow
nloa
ded
by [
Uni
vers
ity o
f Pe
nnsy
lvan
ia]
at 1
0:34
22
Febr
uary
201
3

868 Zhang et al.
not to lose their skills. In 1998, this minimum number wasestablished as 4000 mammograms per year by the QuebecMinistry of Health. During the same time period, the U.S.Food and Drug Administration required a radiologist tointerpret at least 960 mammograms and a radiology tech-nician to perform at least 200 mammograms in 24 monthsto retain their accreditation (U.S. Food and Drug Admin-istration, 1999). Note that when there is more than onemammography machine at a facility, it is very common tohave a single radiologist on staff who reads all the collectedimages (which applies to all centers in Montreal). Hence,the minimum workload requirement applies to each facilityrather than each server in the model. Although we do notconsider fixed setup costs in the article, we investigate theoptimal resource allocation strategy. To this end, the totalnumber of servers to be allocated to open facilities is fixed.Therefore, the number of facilities that could be opened islimited, mainly due to the minimum workload requirementas well as the total number of available servers.
Let G = (N, L) be a network with a set of nodes N(|N| =n) and a set of links L. The nodes represent the neighbor-hoods of a city or the population zones, and the links are themain transportation arteries. The fraction of clients resid-ing at node i is denoted by hi . We assume that the numberof clients who require preventive care over the entire net-work is Poisson distributed with a rate of λ per unit of time,and thus from each node i at a rate λhi . We assume thatthere is a finite set of potential locations M(|M| = m) in Gfor facilities. Let S ⊂ M be a set of open facilities.
We assume that there are Qmax available servers and eachcan provide an average of µ services per unit of time, andone or more servers can be allocated to each open facility.As in Gunes et al. (2004), we assume that the service timeis exponentially distributed.
We define three sets of decision variables:
yj ={
1 if facility is located at node j,0 otherwise;
s j = number of servers at facility j ;xi j = fraction of clients from population node
i who request service from facility j.
Denote by a j the arrival rate of clients at facility j ; thatis,
a j = λ
n∑i=1
hi xi j, j ∈ S. (1)
Note that a facility cannot be established at node j unlessa j exceeds a minimum workload requirement denoted byRmin. This requirement may apply to the whole facility orto each server, depending on the type of preventive carebeing offered. Here, we assume that a minimum workloadis required for each facility.
We also denote by T̄i j the average total time that clientsfrom node i spend in order to receive service at facility j .The average total time T̄i j is composed of two components:
(i) the travel time from node i to facility j through theshortest path denoted by ti j ; and (ii) the average time clientsspend at the facility possibly waiting and receiving service,which we denote by W̄(a j , s j ); that is,
T̄i j = ti j + W̄(a j , s j ), i ∈ N, j ∈ S. (2)
Representing facility j as an M/M/s j queue, the generalformula for the mean waiting time is (Kleinrock, 1975):
W̄(a j , s j ) = C(s j , u j )s j
1µ(1 − ρ j )
+ 1µ
, j ∈ S, (3)
where
u j = a j
µ, ρ j = a j
s jµ,
C(s j , u j ) = 1 − K(u j )1 − ρ j K(u j )
,
K(u j ) =∑s j −1
l=0 u jl/
l!∑s j
l=0 u jl/
l!.
Denote the total participation rate (fraction) at node iby pi ; that is,
pi =∑j∈S
xi j , i ∈ N. (4)
As we assume that clients choose the facility with the min-imum expected total time, denote by Ti this shortest timeincurred by clients at node i . We assume that the total par-ticipation rate pi at node i is a decreasing function of theshortest time Ti (participation function). For simplicity, weassume that it is a linear function with an intercept Ai and aslope γ (although it can be generalized to other decreasingfunctions, such as an exponential function); that is,
pi (Ti ) = Ai − γ Ti , i ∈ N. (5)
Denote by Ti (pi ) the inverse participation function; that is,
Ti (pi ) = Ai − pi
γ, i ∈ N. (6)
In fact, Ti (pi ) represents a threshold time; i.e., the total timeclients at node i are willing to incur in order to participatein the service, while the actual time incurred by clients atnode i to facility j is T̄i j .
As mentioned earlier, given facility locations yj and thenumber of servers at each open facility s j , the lower levelproblem involves the clients’ facility choices so as to min-imize their expected total time. This is a user equilibriumproblem, and at equilibrium, no client wants to change herchoice. This equilibrium condition can be stated as: givenS and s j , j ∈ S, for all pairs of (i, j ), i ∈ N, j ∈ S:
T̄i j = ti j + W̄(a∗j , s j )
{= Ti (p∗i ) if x∗
i j > 0,≥ Ti (p∗
i ) if x∗i j = 0,
(7)
Dow
nloa
ded
by [
Uni
vers
ity o
f Pe
nnsy
lvan
ia]
at 1
0:34
22
Febr
uary
201
3

Preventive healthcare networks with congestion 869
Equation (7) states that if there is a flow of clients from nodei to facility j , then the actual time incurred by clients atnode i to facility j must be equal to the threshold time (thelongest time that clients would accept to go to the facility);and if the actual time exceeds the threshold time, there isno flow.
To find x∗i j in Equation (7), we have to solve the following
non-linear complementarity problem:
ti j + W̄(a j , s j ) − Ti (pi ) ≥ 0, i ∈ N, j ∈ S,
xi j [ti j + W̄(a j , s j ) − Ti (pi )] = 0, i ∈ N, j ∈ S,
xi j ≥ 0, i ∈ N, j ∈ S.
(8)
Note that we expect that pi ≤ Ai , i ∈ N, and the stabilityof the queue a j < s jµ, j ∈ S, can be naturally satisfied inEquation (8).
Alternatively, using vector–matrix notation, we canrewrite the complementarity problem (8) as a variationalinequality problem. Group yj , s j , xi j , ti j , a j , pi , W̄(a j , s j ),and Ti (pi ), i ∈ N, j ∈ M, respectively, into column vec-tors y ⊂ Rm, s ⊂ Rm, x ⊂ Rmn, t ⊂ Rmn, a ⊂ Rm, p ⊂ Rn,W̄(a, s) ⊂ Rm, and T(p) ⊂ Rn. Then, given y and s, the vari-ational inequality problem is to find a vector x∗ ∈ X(y) ⊂Rmn such that:
〈t, x∗ − x〉 + 〈W̄(a∗, s), a∗ − a〉 − 〈T(p∗), p∗ − p〉 ≤ 0,
∀x ∈ X(y), (9)
where the feasible set X(y) is defined as
X(y) = {x : xi j ≥ 0, j ∈ S; xi j = 0, j ∈ M − S},S = { j : yj = 1},
and 〈·, ·〉 represents the inner product (i.e., for two columnvectors x and y, 〈x, y〉 = ∑
i xi yi ). We note that since botha and p can be expressed by x as in Equations (1) and (4),whose elements xi j indeed are the only variables of the vari-ational inequality problem (9). For the ease of exposition,we keep a and p in the following expressions.
Theorem 1 proves that given y and s, the solution to thevariational inequality problem (9) is the equilibrium of thisproblem (7).
Theorem 1. Given y and s, the flow pattern x∗ ∈ X(y) is inequilibrium if, and only if, it satisfies the variational inequal-ity problem (9).
The proof for Theorem 1 is given in Appendix 1.Therefore, the bilevel formulation of our preventive
healthcare facility network design problem is
maxy,s,x
λ
n∑i=1
hi
m∑j=1
xi j , (10)
subject to
s j ≥ yj , j ∈ M, (11)
m∑j=1
s j = Qmax, (12)
λ
n∑i=1
hi xi j ≥ Rmin yj , j ∈ M (13)
yj ∈ {0, 1}, s j = Integer, j ∈ M, (14)
xi j ≥ 0, i ∈ N, j ∈ M, (15)
t′i j = ti j + B(1 − yj ), i ∈ N, j ∈ M, (16)
〈t′, x − x′〉 + 〈W̄(a, s), a − a′〉 − 〈T(p), p − p′〉 ≤ 0,
∀x′ ≥ 0, (17)
where in Equation (17), t′ ⊂ Rmn is a column vector associ-ated with t′
i j , i ∈ N, j ∈ M, and x′ ⊂ Rmn, a′ ⊂ Rm, p′ ⊂ Rn
are column vectors, in which
a′j = λ
n∑i=1
hi x′i j , j ∈ M,
p′i =
m∑j=1
x′i j , i ∈ N,
and W̄(a j , s j ) and Ti (pi ) are expressed in Equation (3) andEquation (6), respectively.
The objective (10) is to maximize the level of total par-ticipation. Constraints (11) ensure that at least one serverwill be assigned to each open facility. Constraint (12) limitsthe total available servers to Qmax. Constraints (13) guar-antee the minimum workload requirement at each openfacility. Constraints (16), where B represents a big num-ber, stipulate that clients can obtain service only fromopen facilities; i.e., the travel time to a location wherethere is no open facility is set to a large number. Con-straints (16) and (17) together are equivalent to Equation(9). Again, the constraints pi ≤ Ai , i ∈ N, and the stabilityof the queue a j < s jµ, j ∈ M, can be naturally satisfied inEquation (17).
Since the variational inequality in the model is highlynon-linear and the decision variables of the upper levelproblem are binary or integer, the entire problem is ex-tremely difficult to solve. Thus, the focus of the study is ondeveloping an efficient heuristic.
4. Solution methodology
Our solution approach is based on the location–allocationframework:
Allocation (Alloc P): the lower level problem: Given a setof facility locations and the associated capacities, identifyequilibrium flows of clients to the facilities.Location (Loc P): the upper level problem: Determine thebest set of locations and and the associated capacities.
Dow
nloa
ded
by [
Uni
vers
ity o
f Pe
nnsy
lvan
ia]
at 1
0:34
22
Febr
uary
201
3
870 Zhang et al.
In the algorithm, (Alloc P) serves as a sub-routine for(Loc P) for any set of locations, with (Alloc P) the numberof participants at each location and the objective functionvalue can be determined. The next section provides an exactsolution algorithm for (Alloc P) for s j ≤ 2. Section 4.2presents an approximation method to solve the allocationproblem for s j > 2. A Tabu search procedure for (Loc P) isdeveloped in Section 4.3.
4.1. Allocation algorithm for s j ≤ 2
For the ease of exposition, we first introduce a solutionalgorithm for s j = 1, i.e., we drop capacity decisions, andthen we extend the algorithm to solve the up-to-two-servercase; i.e., s j ≤ 2.
When s j = 1, each open facility becomes an M/M/1queueing system. Thus, the mean waiting time inEquation (3) reduces to
W̄(a j ) = 1µ − a j
, j ∈ S, (18)
and the variational inequality (17) reduces to
〈t′, x − x′〉 + 〈W̄(a), a − a′〉 − 〈T(p), p − p′〉 ≤ 0,
∀x′ ≥ 0, (19)
where W̄(a j ) and Ti (pi ) are expressed in Equation (18) andEquation (6), respectively.
According to Nagurney (1999), there are several ap-proaches to solve a variational inequality. One of themis to reformulate it as an optimization problem, which canbe solved by a variety of optimization methods. Accordingto Theorem 1.1 in Nagurney (1999), for a general varia-tional inequality problem VI(F(x),X), if F(x) is continu-ously differentiable on X and the Jacobian matrix ∇F(x)is symmetric and positive semi-definite, then solving thisVI(F(x),X) is equivalent to solving a convex optimizationproblem defined as
min f (x),subject tox ∈ X, (20)
where ∇ f (x) = F(x).We employ this method to solve our user equilibrium
problem (Alloc P). For the sake of brevity, let zi j = λhi xi j ,representing the actual number of clients traveling fromnode i to facility j . Group zi j into a column vector z ⊂Rmn. Replacing a, p, and x by z, Equation (19) can bereformulated as
〈F(z), z − z′〉 ≤ 0, ∀z′ ∈ Z, (21)
where Z = {z : z ≥ 0} and
Fi j (z) = 1µ − ∑n
i=1 zi j+ t′
i j − Ai
γ+
∑mj=1 zi j
λhiγ,
i ∈ N, j ∈ M. (22)
It is obvious that F(z) is continuously differentiable onZ, and in Theorem 2, we show that the Jacobian matrix∇F(z) can satisfy the above conditions.
Theorem 1. The Jacobian matrix ∇F(z) is symmetric andpositive semi-definite.
The proof for Theorem 2 is given in Appendix 1.Therefore, we can reformulate our variational inequal-
ity problem as a convex optimization problem (recall that∇ f (z) = F(z)):
min f (z) = −m∑
j=1
ln
(µ −
n∑i=1
zi j
)+
n∑i=1
m∑j=1
(t′i j − Ai
γ
)zi j
+n∑
i=1
12λhiγ
(m∑
j=1
zi j
)2
,
subject to
zi j ≥ 0, i ∈ N, j ∈ M. (23)
Since this is almost an unconstrained problem, we usethe gradient projection method (Kelley, 1999) to solve thisconvex optimization problem. According to Theorem 1.4in Nagurney (1999), the existence of equilibrium can beguaranteed. Since ∇F(z) may not be positive definite, theequilibrium in general may not be unique. One simple ex-ample with multiple equilibrium solutions is a network withtwo client zones and two facilities, where all the parametersare symmetric. However, in practice, almost all of the caseswe face have precisely one equilibrium.
We attempt to generalize the above solution methodol-ogy to solve the general case. Unfortunately, due to thecomplex mean waiting time formula for an M/M/C queue(3), we can only prove that the above solution methodologycan be applied when s j ≤ 2. This is primarily because themean waiting time formula for an M/M/2 queue can bewritten as
W̄(a j ) = 12µ − a j
+ 12µ + a j
, (24)
which means that there are two additive items, each ofwhich has the same structure as the one in Equation (18).Therefore, F(z) in Equation (21) is still continuously differ-entiable, and its Jacobian matrix ∇F(z) is still symmetricand positive semi-definite. For the sake of brevity, we omitthe proof, which is quite easy to prove. In contrast, whens j > 2, the Jacobian matrix ∇F(z) may not be symmetricand positive semi-definite. As for the case with s j = 1, thevariational inequality (17) for s j ≤ 2 can be transformed toa convex optimization problem and solved by the gradientprojection method.
4.2. Allocation algorithm for s j > 2
As mentioned earlier, the complex mean waiting time for-mula for an M/M/C queue (3) makes the method hard to
Dow
nloa
ded
by [
Uni
vers
ity o
f Pe
nnsy
lvan
ia]
at 1
0:34
22
Febr
uary
201
3

Preventive healthcare networks with congestion 871
be directly generalized to solve the variational inequalitywhen s j > 2. One direction to overcome this difficulty isto replace this exact formula by an approximation. We in-vestigated several approximations, such as in Kontogiorgisand Tibbs (2005), and we found that all of them are all toocomplicated to be applied here.
Motivated by the mean waiting time formula for anM/M/2 queue (24), we develop an approximation for themean waiting time formula for an M/M/C queue as fol-lows:
W̃(τ, C) = a(µ, C)Cµ − τ
+ b(µ, C)Cµ + d(µ, C)τ
, (25)
where τ denotes the arrival rate at a facility, and
a(µ, C), b(µ, C), d(µ, C) = arg min∑0<τi <Cµ
[W̄(τi , C) − W̃(τi , C)]2, C ≥ 3. (26)
The idea of this method is to select a number of discretepoints τi between zero and Cµ and then to choose a(µ, C)b(µ, C), and d(µ, C) to minimize the squared sum of theerrors between the exact values and the approximate valuesat these discrete points, just as in a least square estimation.
Note that this approximation may not be very accuratewhen the arrival rate at a certain facility τ is very close tozero or the total capacity Cµ. However, for our facility net-work design problem, since at equilibrium τ is typically notclose to the two ends, this approximation formula worksvery well. Several instances with the performance of theapproximation are shown in Appendix 2, in which the ap-proximation error is usually within 2%. The performanceof the approximation can be improved a lot if the rangeof τi is chosen around the equilibrium arrival rate, whichusually can be roughly estimated in advance.
Clearly, this simple yet accurate approximation formulahas the same structure as the one for an M/M/2 queue, andthus the solution methodology developed in Section 4.1 isapplicable.
4.3. Location algorithm
We develop a Tabu search procedure to solve the upperlevel problem (Loc P). Tabu search (Glover, 1986) is one ofthe most successful metaheuristics, and it is designed so asto avoid local optima and instead explore other regions ofthe solution space.
Suppose that M is the set of potential locations for afacility and smax is the maximum number of servers allowedto be allocated to each facility. Define SM = {M, . . . , M}as the set of potential locations for an individual server; i.e.,cloning the potential facility set smax times. In other words,we divide each potential facility into smax pseudo-facilities.We call a pseudo-facility open if a server is allocated to it.
The Tabu search heuristic starts from a given initial so-lution with Qmax servers. Then, each iteration of the Tabu
search focuses on a “neighborhood” of the current solu-tion. We define two types of neighborhood moves: “Re-move” and “Add.” The main reason why we do not use“Exchange” is that a very large number of neighborhoodmoves need to be evaluated in each iteration for this type.“Remove” results from removing a pseudo-facility fromthe set of open pseudo-facilities, which leads to the small-est decrease in the overall participation rate; “Add” resultsfrom adding an additional pseudo-facility to the set of openpseudo-facilities, which leads to the largest improvement inthe overall participation rate. In each iteration, “Remove”and “Add” are executed successively. The procedure repeatsuntil no feasible solution that improves the objective func-tion can be identified within a given number of iterationsdenoted by Nite. Eventually, the heuristic outputs the bestfeasible solution found so far.
When moves are selected, Tabu restrictions are used toprevent moving back to previously investigated solutions.In this article, we define a Tabu list in which each valueis associated with a pseudo-facility to represent its Tabustatus. Once removed or added to the set of open pseudo-facilities, a node is classified as Tabu with a length equal toTlen, which represents the number of iterations in which thenode typically will not be selected for removing or adding.However, even for a Tabu node, it can still be selected foradding, if an aspiration criteria is satisfied. We use the typi-cal criterion which states that if a move produces a feasiblesolution that is better than the best known feasible solu-tion, then the Tabu status is disregarded and the move isexecuted.
5. Computational experiments
The purpose of this section is to examine the computationalperformance of the solution approach. The gradient projec-tion method for solving the convex optimization problemand the Tabu search algorithm for solving the upper levelproblem were coded in C. All runs were performed on aPentium IV PC with 3.2 GHz of CPU and 1 GB of RAM.
For the computational experiments, the number of po-tential facilities (m) was set to 10, 20 and 40, and the num-ber of population zones (n) was set to 100, 200, and 400.In total, there were nine problem sets. In each problem set,ten instances were generated. For each instance, the de-mand rate at each zone (λhi ) was randomly generated inthe interval [0, 2.4(m/n)] per hour. The travel times wererandomly generated in the interval [0, 1.25] hours, and thefollowing parameter values were used.
Problem parameters:
(a) the service rate at each facility: µ = 2.5 clients/hour;
(b) the intercept of the demand decay function:Ai = 1;
Dow
nloa
ded
by [
Uni
vers
ity o
f Pe
nnsy
lvan
ia]
at 1
0:34
22
Febr
uary
201
3
872 Zhang et al.
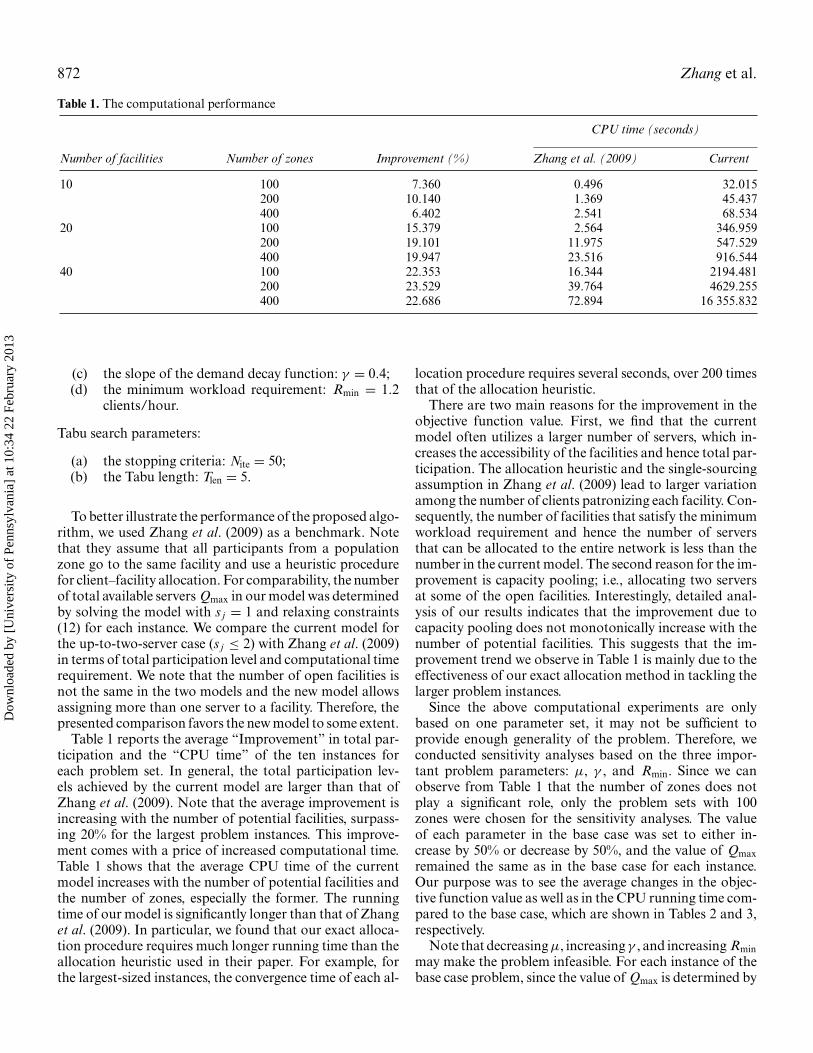
Table 1. The computational performance
CPU time (seconds)
Number of facilities Number of zones Improvement (%) Zhang et al. (2009) Current
10 100 7.360 0.496 32.015200 10.140 1.369 45.437400 6.402 2.541 68.534
20 100 15.379 2.564 346.959200 19.101 11.975 547.529400 19.947 23.516 916.544
40 100 22.353 16.344 2194.481200 23.529 39.764 4629.255400 22.686 72.894 16 355.832
(c) the slope of the demand decay function: γ = 0.4;(d) the minimum workload requirement: Rmin = 1.2
clients/hour.
Tabu search parameters:
(a) the stopping criteria: Nite = 50;(b) the Tabu length: Tlen = 5.
To better illustrate the performance of the proposed algo-rithm, we used Zhang et al. (2009) as a benchmark. Notethat they assume that all participants from a populationzone go to the same facility and use a heuristic procedurefor client–facility allocation. For comparability, the numberof total available servers Qmax in our model was determinedby solving the model with s j = 1 and relaxing constraints(12) for each instance. We compare the current model forthe up-to-two-server case (s j ≤ 2) with Zhang et al. (2009)in terms of total participation level and computational timerequirement. We note that the number of open facilities isnot the same in the two models and the new model allowsassigning more than one server to a facility. Therefore, thepresented comparison favors the new model to some extent.
Table 1 reports the average “Improvement” in total par-ticipation and the “CPU time” of the ten instances foreach problem set. In general, the total participation lev-els achieved by the current model are larger than that ofZhang et al. (2009). Note that the average improvement isincreasing with the number of potential facilities, surpass-ing 20% for the largest problem instances. This improve-ment comes with a price of increased computational time.Table 1 shows that the average CPU time of the currentmodel increases with the number of potential facilities andthe number of zones, especially the former. The runningtime of our model is significantly longer than that of Zhanget al. (2009). In particular, we found that our exact alloca-tion procedure requires much longer running time than theallocation heuristic used in their paper. For example, forthe largest-sized instances, the convergence time of each al-
location procedure requires several seconds, over 200 timesthat of the allocation heuristic.
There are two main reasons for the improvement in theobjective function value. First, we find that the currentmodel often utilizes a larger number of servers, which in-creases the accessibility of the facilities and hence total par-ticipation. The allocation heuristic and the single-sourcingassumption in Zhang et al. (2009) lead to larger variationamong the number of clients patronizing each facility. Con-sequently, the number of facilities that satisfy the minimumworkload requirement and hence the number of serversthat can be allocated to the entire network is less than thenumber in the current model. The second reason for the im-provement is capacity pooling; i.e., allocating two serversat some of the open facilities. Interestingly, detailed anal-ysis of our results indicates that the improvement due tocapacity pooling does not monotonically increase with thenumber of potential facilities. This suggests that the im-provement trend we observe in Table 1 is mainly due to theeffectiveness of our exact allocation method in tackling thelarger problem instances.
Since the above computational experiments are onlybased on one parameter set, it may not be sufficient toprovide enough generality of the problem. Therefore, weconducted sensitivity analyses based on the three impor-tant problem parameters: µ, γ , and Rmin. Since we canobserve from Table 1 that the number of zones does notplay a significant role, only the problem sets with 100zones were chosen for the sensitivity analyses. The valueof each parameter in the base case was set to either in-crease by 50% or decrease by 50%, and the value of Qmaxremained the same as in the base case for each instance.Our purpose was to see the average changes in the objec-tive function value as well as in the CPU running time com-pared to the base case, which are shown in Tables 2 and 3,respectively.
Note that decreasing µ, increasing γ , and increasing Rminmay make the problem infeasible. For each instance of thebase case problem, since the value of Qmax is determined by
Dow
nloa
ded
by [
Uni
vers
ity o
f Pe
nnsy
lvan
ia]
at 1
0:34
22
Febr
uary
201
3

Preventive healthcare networks with congestion 873
Table 2. The change in objective function value (in percentage) with respect to the three parameters
µ γ Rmin
Number of facilities 1.25 3.75 0.2 0.6 0.6 1.8
10 70.609 109.791 120.952 79.653 101.123 100.00020 55.433 117.493 119.591 82.336 100.239 99.66340 57.008 117.442 118.385 84.448 100.068 99.809
solving the model with s j = 1 and relaxing constraints (12),this always makes the base case problem feasible. However,in either of the studied three cases, it may not be possible tofind enough open facilities that satisfy the minimum work-load requirement, especially when Qmax is an odd number.Thus, the values shown in Tables 2 and 3 are calculated byexcluding these infeasible instances.
Both tables suggest that decreasing µ by 50% has thelargest effect. When there are sufficient potential clients,capacity becomes the primary constraint for participation.Thus, the average objective function value declines most.Moreover, an interesting finding is that the running timealso declines significantly. We note that the number of it-erations during the Tabu search does not change much,whereas the running time for each allocation procedure de-creases significantly. In other words, the convergence to theallocation equilibrium by the gradient projection methodbecomes much faster. In contrast, although increasing γ by50% (i.e., raising people’s sensitivity to time) also leads toreduced participation, participation only declines around20%.
Second, the two tables show that increasing µ by 50%and decreasing γ by 50% seem to result in similar effects.With regards to the objective function value, participationincreases around 20% in both cases. For the former case,this is because the travel time remains the same, whereas themean waiting time declines. For the latter case, althoughmore potential clients are willing to participate, capacitybecomes the constraint. In both cases, more CPU runningtime is required on average. Again, this is mainly due to theconvergence speed of the allocation procedure.
Finally, both increasing and decreasing Rmin by 50% donot have a significant impact on either the objective func-tion value or the running time. The primary reason for thisis that, in the base case solutions, most of the open facilitiesalready have two servers. Thus, for each instance, increas-
ing or decreasing Rmin does not make the optimal solutionchange much, as long as the problem is still feasible.
6. An illustrative case
In this section, we use the data from the network of mam-mography centers in Montreal to illustrate the applicationof our model and methodology. The problem is motivatedby the decision of the Quebec Ministry of Health to sub-sidize mammograms for women between the ages of 50and 69. The National Cancer Institute of Canada reportsthat breast cancer is the most common cancer diagnosedin Canadian women and is second only to lung cancer asthe most common cause of cancer deaths among women(National Cancer Institue of Canada, 2006). Accordingly,screening recommendations in Canada include a mam-mogram of the breast and clinical breast examination inasymptomatic women aged between 50 and 69 years ofage. As of 1996, there were 194 475 women in Montreal inthis age group and 36 facilities with mammography ma-chines. The Ministry made a policy decision to require aminimum of 4000 mammographies per year for facilities tobe accredited. The problem is determine which facilities tobe accredited so as to maximize participation.
There are 497 population zones in Montreal, which weuse for representing spatial distribution of the potentialclients. Following Zhang et al. (2009), we assume that themaximum participation rate Ai is 0.95 and the slope ofthe demand function γ is 0.55; i.e., women will spend amaximum of 1.75 hours for a mammography. Assuming250 days per year and 8 hours per day, the number ofpotential clients in Montreal per hour λ = 194 475/250/8= 97.24, and the minimum workload requirement Rmin =4000/250/8 = 2 clients per hour. We also assume that the
Table 3. The change in CPU time (in percentage) with respect to the three parameters
µ γ Rmin
Number of facilities 1.25 3.75 0.2 0.6 0.6 1.8
10 13.463 198.059 168.115 64.249 114.045 99.19020 21.535 144.065 142.216 86.977 137.381 102.86840 9.588 217.651 285.966 101.681 111.774 109.794
Dow
nloa
ded
by [
Uni
vers
ity o
f Pe
nnsy
lvan
ia]
at 1
0:34
22
Febr
uary
201
3
874 Zhang et al.
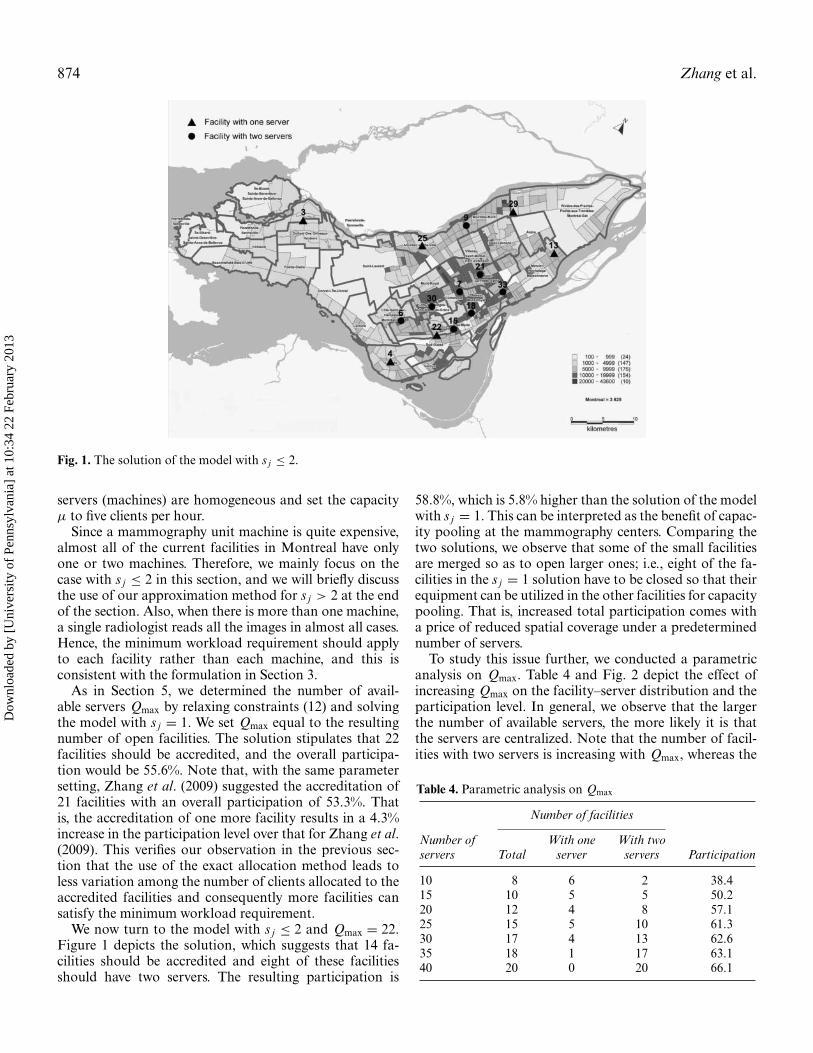
Fig. 1. The solution of the model with s j ≤ 2.
servers (machines) are homogeneous and set the capacityµ to five clients per hour.
Since a mammography unit machine is quite expensive,almost all of the current facilities in Montreal have onlyone or two machines. Therefore, we mainly focus on thecase with s j ≤ 2 in this section, and we will briefly discussthe use of our approximation method for s j > 2 at the endof the section. Also, when there is more than one machine,a single radiologist reads all the images in almost all cases.Hence, the minimum workload requirement should applyto each facility rather than each machine, and this isconsistent with the formulation in Section 3.
As in Section 5, we determined the number of avail-able servers Qmax by relaxing constraints (12) and solvingthe model with s j = 1. We set Qmax equal to the resultingnumber of open facilities. The solution stipulates that 22facilities should be accredited, and the overall participa-tion would be 55.6%. Note that, with the same parametersetting, Zhang et al. (2009) suggested the accreditation of21 facilities with an overall participation of 53.3%. Thatis, the accreditation of one more facility results in a 4.3%increase in the participation level over that for Zhang et al.(2009). This verifies our observation in the previous sec-tion that the use of the exact allocation method leads toless variation among the number of clients allocated to theaccredited facilities and consequently more facilities cansatisfy the minimum workload requirement.
We now turn to the model with s j ≤ 2 and Qmax = 22.Figure 1 depicts the solution, which suggests that 14 fa-cilities should be accredited and eight of these facilitiesshould have two servers. The resulting participation is
58.8%, which is 5.8% higher than the solution of the modelwith s j = 1. This can be interpreted as the benefit of capac-ity pooling at the mammography centers. Comparing thetwo solutions, we observe that some of the small facilitiesare merged so as to open larger ones; i.e., eight of the fa-cilities in the s j = 1 solution have to be closed so that theirequipment can be utilized in the other facilities for capacitypooling. That is, increased total participation comes witha price of reduced spatial coverage under a predeterminednumber of servers.
To study this issue further, we conducted a parametricanalysis on Qmax. Table 4 and Fig. 2 depict the effect ofincreasing Qmax on the facility–server distribution and theparticipation level. In general, we observe that the largerthe number of available servers, the more likely it is thatthe servers are centralized. Note that the number of facil-ities with two servers is increasing with Qmax, whereas the
Table 4. Parametric analysis on Qmax
Number of facilities
Number of With one With twoservers Total server servers Participation
10 8 6 2 38.415 10 5 5 50.220 12 4 8 57.125 15 5 10 61.330 17 4 13 62.635 18 1 17 63.140 20 0 20 66.1
Dow
nloa
ded
by [
Uni
vers
ity o
f Pe
nnsy
lvan
ia]
at 1
0:34
22
Febr
uary
201
3

Preventive healthcare networks with congestion 875
Fig. 2. Parametric analysis on Qmax.
number of facilities with one server is decreasing. At theextreme, all the facilities have two servers when Qmax = 40.We identify two main causes for this result. As mentionedearlier, capacity pooling may raise participation, by re-ducing the mean waiting time. Meanwhile, the minimumworkload requirement may also favor centralization, sinceit may not be feasible to accredit many single-server facili-ties. In particular, we note that the impact of Rmin increaseswith Qmax.
Another main result is that with a medium or large num-ber of total available servers, centralizing capacity at thefacilities in high-density areas is a better strategy than de-centralizing capacity to smaller facilities. In contrast, ifthere are only limited servers available (e.g., ten), insteadof adding one additional server to an existing facility ina high-density area, it is better to locate a new facility inanother high-density area so as to increase the spatial cover-age. Figure 1 also shows the map of the population densityof Montreal in 2001 (Ville de Montreal, 2008), from whichwe can clearly see that the facilities with two servers arelocated in the high-density areas and the facilities with oneserver are typically located in the medium-density areas.
Interestingly, during the computations, we found thatit takes a very long time to find a feasible solution whenQmax = 35. In fact, the final solution shows that there isone server at facility 3 and all the other facilities have twoservers. However, the solutions with Qmax = 25, 30, and40, all show that there are two servers allocated to facility3. After investigation, we realized that it is very difficultto open a facility with a single server that can satisfy theminimum workload requirement at a place close to otherfacilities in a well-developed network. Therefore, in thiscase, only one server is allocated to facility 3, around whichthere is no other open facility, and this allows all the other17 facilities with two servers to satisfy more easily the min-imum workload requirement. In other words, if a numberof additional servers can be added to a balanced network,it would be a good plan to allocate the servers to exist-ing facilities or to open new facilities with more than oneserver.
In addition, Fig. 2 demonstrates that total participationis close to a concave function, increasing with Qmax. Evenwith 40 servers, the participation rate is 66.1%, still belowthe national target of 70%. Therefore, it seems necessaryto support capacity expansion projects with initiativesto increase people’s awareness about the significance ofpreventive care (i.e., to reduce their sensitivity to the totaltime) in order to achieve the target participation levels.
Since the values of Ai and γ are not estimated based onreal data or survey, we therefore conducted another para-metric analysis on these two parameters. Table 5 shows thecorresponding values of the objective function (participa-tion) with different values of Ai and γ when Qmax = 22.In particular, participation almost linearly increases withthe increase in Ai , while it almost linearly decreases withthe increase in γ , when the values of the two parame-ters are within those ranges. Moreover, by investigatingthe facility–server distribution, we find that the lower theparticipation level, the more likely the servers are central-ized together. This is mainly due to the minimum workloadrequirement.
The above discussion is based on the case of s j ≤ 2. Tostudy the impact of this restriction, we use the approxima-tion method devised for the allocation problem. Figure 3displays the solution of our model with s j ≤ 3 on the mapof the population density of Montreal in 2001. In this so-lution, 11 facilities are accredited, three of them with threeservers and five of them with two servers. The three facilitieswith three servers are all located in the very-high-density
Table 5. Participation levels (in percentage) as a function Aiand γ
γ
Ai 0.35 0.45 0.55 0.65 0.75
0.95 69.9 64.2 58.8 53.9 46.80.85 61.6 56.0 50.2 43.7 39.30.75 52.8 45.9 40.2 36.2 31.3
Dow
nloa
ded
by [
Uni
vers
ity o
f Pe
nnsy
lvan
ia]
at 1
0:34
22
Febr
uary
201
3

876 Zhang et al.
Fig. 3. The solution of the model with s j ≤ 3.
areas, and this supports our previous observation aboutthe strategy of capacity pooling. The total participation is59.5%; i.e., only a 1.2% improvement on the previous solu-tion. This small increase suggests that the current policy ofhaving up to two mammography machines at the facilitiesis reasonable, and it would not pay off to centralize capacityfurther.
7. Conclusions and future research
This article presents a model for the problem of preventivehealthcare facility network design and provides a solutionmethodology. We formulate the problem as an MPEC; i.e.,a bilevel non-linear optimization model. The lower levelproblem determines the allocation of clients to facilitiesand it is formulated as a variational inequality; the upperlevel is a facility location and capacity allocation problem.Our solution approach is based on the location–allocationframework. The variational inequality is formulated as aconvex optimization problem, which can be solved by thegradient projection method; we develop a Tabu search pro-cedure to solve the upper level problem. Our computa-tional experiments indicate that large-sized instances canbe solved in reasonable time. Based on the analysis of anillustrative case, the network of mammography centers inMontreal, we derive managerial insights with regards to theimpact of capacity pooling on the level of participation andthe trade-off between capacity pooling and spatial coverageprovided by the facility network.
Our model can be generalized or extended in a number ofways. First, although the model aims at a non-appointment
or “walk-in” system, it is possible to calibrate the model torepresent the presence of an appointment system at eachfacility. Under an appointment system, one of the mostsignificant client attraction factors is the waiting time forthe appointment rather than the waiting time at the fa-cility. Assuming that clients always take the first availableappointment and there are no cancelations or no-shows, anM/M/C queue can be used for approximating an appoint-ment system. To calibrate the travel time and the waitingtime for an appointment, we can replace Equation (2) bythe following weighted time function,
T̄i j = αti j + W̄(a j , s j ), i ∈ N, j ∈ S, (27)
where α is a constant to balance travel time and wait timeand it can be estimated empirically. Also, the slope γ inEquation (5) needs to be calibrated accordingly. The otherelements of the model remain the same. During preliminaryexperiments, however, we found out that the computationalrequirements of the allocation algorithm drastically in-crease as the participation function becomes flatter (cor-responding to longer appointment waiting times due tohigh congestion). Thus, the development of an efficientallocation algorithm for dealing with preventive care fa-cilities that use appointment systems remains a challengefor future research. Alternatively, the use of simulation formodeling an appointment system seems to be a promisingresearch direction.
Second, the model presented here can also be appliedto other service environments, such as in the context ofnetworks of banks and post offices. The incorporationof congestion in modeling clients’ decision making inthese service sectors is also crucial. Although the detailed
Dow
nloa
ded
by [
Uni
vers
ity o
f Pe
nnsy
lvan
ia]
at 1
0:34
22
Febr
uary
201
3

Preventive healthcare networks with congestion 877
formulations may be different, the overall structure of thebilevel model and especially the user equilibrium problemremain the same, and our solution methodology can beeasily adapted for solving the arising problems.
Third, although we only use the accessibility of a facility(i.e., the total time spent in getting service) as a determinantof client attraction, other factors of attractiveness could beincluded as well. Fundamentally, these factors can be di-vided into two categories, static and dynamic. The staticfactors of attractiveness such as travel time, service time,facility type, and facility reputation typically will not be in-fluenced by the allocation of clients. In contrast, dynamicfactors, including the mean waiting time and the averagenumber of clients in the system, depend on the collectiveoutcome of the decisions of all clients, and the resultinguser equilibrium needs to be determined. This article mod-els a user equilibrium based on a single dynamic factor inthe context of preventive healthcare facility network de-sign. The incorporation of a user equilibrium with multipledynamic factors needs further work.
Finally, this article studies the issue of capacity optimiza-tion from the perspective of allocating a given number ofservers. Under the presence of technology alternatives, itmay be relevant to optimize the service rate or the through-put at each facility, subject to a budget constraint. Thisextension constitutes a fruitful avenue for future research.
Acknowledgements
This research was supported in part by a Discovery Grantfrom the Natural Sciences and Engineering Research Coun-cil of Canada (NSERC grant 183631). The authors ac-knowledge the comments and suggestions of the associateeditor and two anonymous referees, which were helpful inimproving the article.
References
Abdulaal, M. and LeBlanc, L.J. (1979) Continuous equilibrium networkdesign models. Transportation Research B, 13, 19–32.
Berman, O. and Krass, D. (2002) Facility location problems with stochas-tic demands and congestion, in Facility Location: Applications andTheory, Drezner, Z. and. Hamacher, H.W. (eds.), Springer, NewYork, NY, pp. 331–373.
Chao, X., Liu, L. and Zheng, S. (2003) Resource allocation in multisiteservice systems with intersite customer flows. Management Science,49(12), 1739–1752.
Dafermos, S.C. (1968) Traffic assignment and resource allocation intransportation networks. Ph.D. Dissertation, Johns Hopkins Uni-versity, Baltimore, MD.
Daskin, M.S. and Dean, L.K. (2004) Location of health care facilities,in Operations Research and Health Care: A Handbook of Methodsand Applications, Brandeau, M.L., Sainfort, F. and Pierskalla, W.P.(eds.), Kluwer, New York, NY, pp. 43–76.
Facione, N.C. (1999) Breast cancer screening in relation to access tohealth services. Oncology Nursing Forum, 26, 689–696.
Florian, M. and Hearn, D. (1995) Network equilibrium models and algo-rithms, in Handbooks in Operations Research and Management Sci-
ence: Volume 8 Network Routing, Elsevier, New York, NY, pp. 485–550.
Glover, F. (1986) Future paths for integer programming and links toartificial intelligence. Computers & Operations Research, 13, 533–549.
Gornick, M.E., Eggers, P.W. and Riley, G.F. (2004) Associations of race,education, and patterns of preventive service use with stage of cancerat time of diagnosis. Health Services Research, 39, 1403–1427.
Gunes, E.D., Chick, S.E. and Zeynep, A.O. (2004) Breast cancer screeningservices: trade-offs in quality, capacity, outreach, and centralization.Health Care Management Science, 7, 291–303.
Health Canada. (2005) Mammography, available at http://www.hc-sc.gc.ca/hl-vs/iyh-vsv/med/mammog-eng.php, accessed August19, 2010.
Judge, G.G. and Takayama, T. (1973) Studies in Economic Planning overSpace and Time, North-Holland, Amsterdam, The Netherlands.
Kelley, C.T. (1999) Iterative Methods for Optimization, SIAM, Philadel-phia, PA.
Kleinrock, L. (1975) Queueing System I: Theory, Wiley, New York, NY.Kontogiorgis, S. and Tibbs, R.W. (2005) An efficient approximation to
wait time in M/M/c queues with application to staffing planning,in Proceedings of the 43rd Annual ACM Southeast Regional Con-ference, volume 2, Association for Computing Machinery (ACM),New York, NY, pp. 98–102.
Magnanti, T.L. and Wong, R.L. (1984) Network design and transporta-tion planning: models and algorithms. Transportation Science, 18,1–55.
Marcotte, P. (1986) Network design problem with congestion effects: acase of bilevel programming. Mathematical Programming, 34, 142–162.
Marcotte, P., Marquis, G. and Zubieta, L. (1992) A Newton-SOR methodfor spatial price equilibrium. Transportation Science, 26, 36–47.
Marianov, V. (2003) Location of multiple-server congestible facilities formaximizing expected demand, when services are non-essential. An-nals of Operations Research, 123, 125–141.
Marianov, V., Rios, M. and Barros, F.J. (2005) Allocating servers tofacilities, when demand is elastic to travel and waiting times. RAIROOperations Research, 39, 143–162.
Marianov, V., Rios, M. and Icaza, M.J. (2008) Facility location for marketcapture when users rank facilities by shorter travel and waiting times.European Journal of Operational Research, 191, 32–44.
Marianov, V. and Serra, D. (2002) Location problems in the publicsector, in Facility Location: Applications and Theory, Drezner, Z.and Hamacher, H.W. (eds.), Springer, New York, NY, pp. 119–150.
McNoe, B., Richardson, A.K. and Elwood, J.M. (1996) Factors affectingparticipation in mammography screening. New Zealand MedicalJournal, 109, 359–362.
Nagurney, A. (1992) The application of variational inequality theory tothe study of spatial equilibrium and disequilibrium, in Readings inEconometric Theory and Practice: A Volume in Honor of GeorgeJudge, Grinths, W.E., Lutkepohl, H. and Bock, M.E. (eds.), North-Holland, Amsterdam, The Netherlands, pp. 327–355.
Nagurney, A. (1999) Network Economics: A Variational Inequality Ap-proach, Kluwer, Norwell, MA.
National Cancer Institute of Canada. (2006) Progress in can-cer control: screening. Annual statistics special report, avail-able at http://www.phac-aspc.gc.ca/publicat/prccc-relccc/pdf/F244 HC Cancer Rpt English.pdf, accessed August 19, 2010.
Nolte, S. (2008) The future of the world suger market—a spatial priceequilibrium analysis. Working paper, University of Ghent, Belgium.
Public Health Agency of Canada. (2006) Organized breast cancerscreening programs in canada—report on program performance in2001 and 2002, available at http://www.phac-aspc.gc.ca/publicat/obcsp-podcs01/index-ena.php, accessed August 19, 2010..
Samuelson, P.A. (1952) Spatial price equilibrium and linear program-ming. American Economic Review, 42, 283–303.
Dow
nloa
ded
by [
Uni
vers
ity o
f Pe
nnsy
lvan
ia]
at 1
0:34
22
Febr
uary
201
3

878 Zhang et al.
Takayama, T. and Judge, G.G. (1964) An intertemporal price equilibriummodel. Journal of Farm Economics, 46, 477–484.
Takayama, T. and Judge, G.G. (1971) Spatial and Temporal Price andAllocation Models, North-Holland, Amsterdam, The Netherlands.
U.S. Food and Drug Administration. (1999) The Mammography QualityStandards Act Final Regulations, available at http://www.fda.gov/downloads/MedicalDevices/DeviceRegulationandGuidance/GuidanceDocuments/ucm094441.pdf, accessed August 19, 2010.
Verter, V. and Lapierre, S.D. (2002) Location of preventive health carefacilities. Annals of Operations Research, 110, 123–132.
Ville de Montreal. 2008. Theme maps: sociodemographic and economicatlas for Montreal, Available at http://ville.montreal.qc.ca/portal/page? pageid=2077, 2455180& dad=portal& Schema=PORTAL,accessed August 19, 2010.
Walker, K. 1977. Current issues in the provision of health care services.Journal of Consumer Affairs, 11, 52–62.
Zhang, Y., Berman, O. and Verter, V. (2009) Incorporating congestion inpreventive healthcare facility network design. European Journal ofOperational Research, 198, 922–935.
Zimmerman, S. (1997) Factors influencing hispanic participation inprostate cancer screening. Oncology Nursing Forum, 24, 499–504.
Appendices
Appendix 1
Proof of Theorem 1. First, it is shown that if x∗ ∈ X(y)satisfies Equation (7) then it also satisfies Equation (9).
Note that given s, for a fixed pair (i, j ), i ∈ N, j ∈ S, onemust have that:
(W̄(a∗j , s j ) + ti j − Ti (p∗
i )) × (xi j − x∗i j ) ≥ 0, (A1)
for any non-negative xi j . Hence, summing over all pairs,one has that,
n∑i=1
∑j∈S
(W̄(a∗j , s j ) + ti j − Ti (p∗
i )) × (xi j − x∗i j ) ≥ 0,
∀xi j ≥ 0. (A2)
Using Equations (1), (4) and some algebra, Equation (A2)yields:
n∑i=1
∑j∈S
ti j (xi j − x∗i j ) +
∑j∈S
W̄(a∗j , s j )(a j − a∗
j )
−n∑
i=1
Ti (p∗i )(pi − p∗
i ) ≥ 0, ∀xi j ≥ 0, (A3)
which, in vector natation, gives us Equation (9).
Now it is shown that if x∗ ∈ X(y) satisfies Equation (9)then it also satisfies Equation (7). For simplicity, utilizeEquation (9) expanded as Equation (A2). For any pair(k, l), let xi j = x∗
i j , ∀(i, j ) �= (k, l), i ∈ N, j ∈ S, and thenEquation (A2) simplifies to
(W̄(a∗l , sk) + tkl − Tk(p∗
l )) × (xkl − x∗kl ) ≥ 0, (A4)
from which Equation (7) follows for this (k, l) and conse-quently for every pair. �Proof of Theorem 2. The Jacobian matrix can be rep-resented as ∇F(z) = JA + JB, where JA and JB, twomn × mn matrices, are defined as
JA =
⎡⎢⎢⎢⎢⎣
JA1 0 · · · 00 JA2 · · · 0...
. . ....
0 0 · · · JAn
⎤⎥⎥⎥⎥⎦ , JB =
⎡⎢⎢⎢⎢⎣
JB1 JB1 · · · JB1
JB1 JB1 · · · JB1
.... . .
...JB1 JB1 · · · JB1
⎤⎥⎥⎥⎥⎦ .
JA j is a n × n matrix in which all elements are equal to
1(µ − ∑n
i=1 zi j)2 ,
and JB1 is a n × n diagonal matrix as
JB1 =
⎡⎢⎢⎢⎢⎢⎣
1λh1γ
0 · · · 0
0 1λh2γ
· · · 0...
. . ....
0 0 · · · 1λhmγ
⎤⎥⎥⎥⎥⎥⎦ .
We can also obtain that:
vTJAv =m∑
j=1
⎡⎢⎣ 1(
µ − ∑ni=1 zi j
)2
⎛⎝ jn∑
k=( j−1)n+1
vk
⎞⎠
2⎤⎥⎦ ≥ 0
∀v ∈ Rmn,
vTJBv =n∑
i=1
⎡⎣ 1
λhiγ
(m∑
k=1
v(k−1)n+i
)2⎤⎦ ≥ 0 ∀v ∈ Rmn.
Therefore, ∇F(z) is symmetric and positive semi-definite,since JA and JB are both positive semi-definite. �
Dow
nloa
ded
by [
Uni
vers
ity o
f Pe
nnsy
lvan
ia]
at 1
0:34
22
Febr
uary
201
3

Preventive healthcare networks with congestion 879
Appendix 2The performance of the approximation
Table A1. The performance of the approximation
µ = 5, C = 4 µ = 2, C = 10 µ = 1, C = 20a = 0.998, b = 3.159, d = 0.709 a = 0.983, b = 9.524, d = 0.393 a = 0.957, b = 19.854, d = 0.234
τ Exact Approximation Error (%) Exact Approximation Error (%) Exact Approximation Error (%)
2.0 0.200 0.203 1.44 0.500 0.513 2.57 1.000 1.023 2.312.5 0.200 0.202 1.00 0.500 0.510 2.02 1.000 1.019 1.913.0 0.200 0.201 0.62 0.500 0.508 1.51 1.000 1.015 1.533.5 0.200 0.201 0.31 0.500 0.505 1.03 1.000 1.012 1.164.0 0.201 0.201 0.05 0.500 0.503 0.60 1.000 1.008 0.814.5 0.201 0.201 0.17 0.500 0.501 0.19 1.000 1.005 0.475.0 0.201 0.201 0.34 0.500 0.499 0.17 1.000 1.002 0.165.5 0.202 0.201 0.47 0.500 0.498 0.49 1.000 0.999 0.146.0 0.203 0.202 0.56 0.500 0.496 0.77 1.000 0.996 0.416.5 0.204 0.202 0.62 0.500 0.495 1.00 1.000 0.993 0.667.0 0.205 0.203 0.66 0.500 0.494 1.19 1.000 0.991 0.897.5 0.206 0.205 0.67 0.500 0.494 1.34 1.000 0.989 1.098.0 0.208 0.206 0.66 0.501 0.493 1.45 1.000 0.987 1.268.5 0.209 0.208 0.63 0.501 0.494 1.51 1.000 0.986 1.409.0 0.212 0.210 0.58 0.502 0.494 1.52 1.000 0.985 1.509.5 0.214 0.213 0.53 0.503 0.495 1.50 1.000 0.984 1.5710.0 0.217 0.216 0.46 0.504 0.496 1.44 1.000 0.984 1.6010.5 0.221 0.220 0.39 0.505 0.498 1.34 1.001 0.985 1.5911.0 0.225 0.224 0.31 0.507 0.501 1.20 1.001 0.986 1.5411.5 0.230 0.230 0.23 0.509 0.504 1.04 1.002 0.987 1.4412.0 0.236 0.236 0.15 0.513 0.508 0.85 1.003 0.990 1.3012.5 0.243 0.242 0.07 0.517 0.513 0.64 1.005 0.994 1.1113.0 0.251 0.251 0.01 0.522 0.520 0.41 1.007 0.998 0.8813.5 0.260 0.260 0.08 0.529 0.528 0.16 1.011 1.004 0.6214.0 0.271 0.272 0.15 0.537 0.537 0.09 1.016 1.012 0.3214.5 0.285 0.286 0.21 0.548 0.549 0.33 1.022 1.023 0.0115.0 0.302 0.303 0.25 0.561 0.565 0.57 1.032 1.036 0.3615.5 0.323 0.324 0.29 0.579 0.584 0.79 1.045 1.053 0.7116.0 0.349 0.350 0.31 0.602 0.608 0.98 1.064 1.075 1.0616.5 0.383 0.385 0.32 0.633 0.641 1.13 1.090 1.105 1.3717.0 0.430 0.431 0.31 0.677 0.685 1.21 1.128 1.147 1.6417.5 0.495 0.497 0.28 0.739 0.748 1.21 1.185 1.207 1.8018.0 0.594 0.595 0.23 0.834 0.844 1.10 1.275 1.298 1.7918.5 0.759 0.760 0.15 0.997 1.005 0.83 1.432 1.454 1.5119.0 1.091 1.092 0.05 1.326 1.330 0.35 1.755 1.769 0.7619.5 2.090 2.089 0.08 2.321 2.311 0.44 2.745 2.721 0.87
Biographies
Yue Zhang is an Assistant Professor at the College of Business Admin-istration, the University of Toledo. He holds a Ph.D. degree in Oper-ations Management from Desautels Faculty of Management, McGillUniversity. He also holds a Master’s degree in Management Science andEngineering and a Bachelor’s degree in Management Information Sys-tems from the School of Economics and Management, Tsinghua Uni-versity in China. Prior to joining the University of Toledo, he was aPost-Doctoral Fellow at the Sauder School of Business, the Universityof British Columbia. His research interests include healthcare operationsmanagement, supply chain design, logistics, optimization and simulation.
Oded Berman is the endowed Sydney Cooper Chair in Business andTechnology and a former Associate Dean of Programs at the Joseph L.Rotman School of Management, the University of Toronto. He receivedhis Ph.D. (1978) in Operations Research from the Massachusetts Instituteof Technology. He had been with the Electronic Systems Lab at MIT, theUniversity of Calgary, and the University of Massachusetts at Boston,where he was also the Chairman of the Department of ManagementSciences. He has published over 200 refereed articles and has contributedto several books in his field. His main research interests include operationsmanagement in the service industry, location theory, network models, andstochastic inventory control. He served as an Area Editor for OperationsResearch and as an Associate Editor for Management Science. He is
Dow
nloa
ded
by [
Uni
vers
ity o
f Pe
nnsy
lvan
ia]
at 1
0:34
22
Febr
uary
201
3

880 Zhang et al.
currently an Associate Editor for Transportation Science and a memberof the Editorial Board for Computers & Operations Research.
Patrice Marcotte is currently chairman of the Computer Science and Op-erations Research Department of the University of Montreal. Author ofmore than 70 papers in international journals, his research is mainly con-cerned with the algorithmic aspects of convex and nonconvex program-ming, including variational inequalities and equilibrium programming,with a special focus on transportation planning.
Vedat Verter is a Professor of Operations Management at DesautelsFaculty of Management, McGill University. He is also an Adjunct Pro-fessor at the University of Ottawa M.Sc. in Health Systems Program andMIT-Zaragoza International Logistics Program. His research focuses onsupply chain design, hazardous materials logistics, sustainable supplychains, and healthcare operations management. His work in these fourareas is well recognized through top-tier journal publications as well asinvited presentations around the globe. He is the Founding Presidentof the POMS College of Healthcare Operations Management. Recently,he has been appointed as director of a six-university Ph.D. program onhealthcare that is funded by NSERC. He is the incoming Editor-in-Chiefof Socio-Economic Planning Sciences.
Dow
nloa
ded
by [
Uni
vers
ity o
f Pe
nnsy
lvan
ia]
at 1
0:34
22
Febr
uary
201
3