a behavioral theory of firm growth
TRANSCRIPT

A BEHAVIORAL THEORY OF FIRM GROWTH:SEQUENTIAL ATTENTION TO SIZE AND
PERFORMANCE GOALS
HENRICH R. GREVEINSEAD
According to the behavioral theory of the firm, managers pay sequential attention togoals and apply aspiration levels to each goal. Although many goals have beenproposed for organizations, research has so far concentrated on profitability. Here it isproposed that managers form an aspiration level for size through social comparison.This proposal leads to predictions on how performance and size goals jointly affectgrowth. Supporting this sequential attention hypothesis, evidence from the generalinsurance industry shows that firms grow more when they are below the aspirationlevel for size, especially when performance goals are satisfied.
Organizational researchers have long been inter-ested in the determinants and consequences of or-ganizational size (Kimberly, 1976), and many con-sequences of size are now well known. Internally,larger organizations have more elaborate structuresfor managing employees (Bridges & Villemez, 1991;Sutton & Dobbin, 1996), more bureaucratic deci-sion making (Baker & Cullen, 1993; Kimberly,1976), and greater inertia (Chen & Hambrick, 1995;Delacroix & Swaminathan, 1991). Externally, largerorganizations enjoy greater market power (Boone,Carroll, & Witteloostuijn, 2004; Haveman, 1993b)and are more influential in the spread of innova-tions (Haunschild & Miner, 1997; Haveman,1993a).
The causes of organizational size have seen lessinvestigation. One explanation is that productiontechnologies constrain organizational sizes by mak-ing very small or very large organizations ineffi-cient. Cost data support this size-efficiency relationat the establishment level (Edmunds, 1981; Good-ing & Wagner, 1985), but it does not impose a tightconstraint on organizational size because the inef-ficiencies associated with large establishment sizecan be overcome by operating multiple establish-
ments (Scherer, Beckenstein, Kaufer, Murphy, &Bougeon-Massen, 1975) and the inefficiencies asso-ciated with small size can be countered by marketdifferentiation (Carroll & Swaminathan, 2000). An-other explanation, emphasizing top managers’ in-centive to grow their organizations to gain greaterprestige and job rewards (Berle & Means, 1965;Dalton & Kesner, 1985), has been applied to recentmerger waves (Matsusaka, 1993; Palmer, Barber,Zhou, & Soysal, 1995). This explanation has lostsome of its force in view of shareholder resistanceagainst large and complex corporations (Davis,Diekmann, & Tinsley, 1994; Zuckerman, 2000), butit remains a potential account of why organizationsgrow to be very large.
Here, a different explanation of organizationalsize is offered. Managers make decisions to expandor contract organizations and decisions on marketparticipation that cause the expansion or contrac-tion of the organizations. When the relation be-tween organizational size and performance is notwell known, they have to make such growth deci-sions without clear economic guidance. As a sub-stitute, managers use an aspiration level, which is“the smallest outcome that would be deemed satis-factory by the decision maker” (Schneider, 1992:1053). They form aspiration levels through socialcomparison (Festinger, 1954) with similar organi-zations, which are easily available and relevantsources of information for judging the firm size.Uncertainty triggers a need to make social compar-isons to establish expectations of firm size, andthese expectations affect aspirations for firm sizebecause managers believe that the sizes of otherfirms contain information on what firm sizes othermanagers view as beneficial. Thus, social aspira-tion levels are created by the same social judgment
The article was greatly improved by comments fromPhil Anderson, Pino Audia, Xavier Castaner, Vinit Desai,Rodolphe Durand, Avi Fiegenbaum, John Freeman,Javier Gimeno, Heather Haveman, Jim March, and semi-nar participants at the Haas School of Business, INSEAD,and HEC. Nandini Rajagopalan and three anonymousreviewers gave very helpful feedback. Research supportfrom the Norwegian Research Council (project 161318/V10) and the Norwegian School of Management BI isgratefully acknowledged. Hans-Christian Hustad andAnne Fossum provided valuable research assistance.
� Academy of Management Journal2008, Vol. 51, No. 3, 476–494.
476
Copyright of the Academy of Management, all rights reserved. Contents may not be copied, emailed, posted to a listserv, or otherwise transmitted without the copyright holder’s expresswritten permission. Users may print, download or email articles for individual use only.

processes that underlie mimetic adoption of inno-vations (DiMaggio & Powell, 1983; Strang & Soule,1998) and convergence of strategies (Fiegenbaum &Thomas, 1995), and that affect behavior such aspursuit of mergers and acquisitions (Haunschild,1993; Westphal, Seidel, & Stewart, 2001). Once anaspiration level for size has been set, failure toreach it triggers “problemistic search” (Cyert &March, 1963) that leads to attempts to grow.
Growth decisions are not based solely on aspira-tion levels for size, however, but are also affectedby aspiration levels on other organizational goalvariables. First, managers implement many strate-gic changes in response to organizational perfor-mance that falls below the aspiration level (Bolton,1993; Greve, 1998; Haleblian, Kim, & Rajagopalan,2005; Lant, Milliken, & Batra, 1992), including ex-pansion of production facilities (Audia & Greve,2006; Greve, 2003b). Second, managers may haveaspiration levels for the rate of organizationalgrowth because they view growth as a form of per-formance (Armstrong & Collopy, 1996; Smith, Fer-rier, & Grimm, 2001).
When an organization pursues multiple goalvariables, the question of how they interact comesto the fore. Here, three possible answers are exam-ined. The first is a parsimonious model in whicheach goal has a separate and independent effect onmanagerial actions. The second is a sequential at-tention model in which high performance on onegoal shifts attention toward the next, making organ-izations pursue one goal at a time. The third is anactivation model in which low performance on onegoal reinforces the effect of low performance onanother, making organizations pursue one goalmore vigorously when another is not met. Thesecontrasting models rely on different assumptionsabout managerial attention, and a novel empiricaltest is needed to distinguish between them.
This article develops theory on how aspirationlevels for size and performance affect organization-al revenue growth and tests the predictions on datafrom the general insurance industry. It makes fourcontributions. First, it introduces managerial aspi-ration levels for size as a mechanism affecting or-ganizational growth. Such theory is important be-cause it may inspire further research on thedeterminants of organizational size. Second, it de-velops the theory of how managerial attentionshifts between goal variables. Such theory isneeded because many organizational goals are re-lated either through competition for attention, inwhich fulfillment of one goal makes another moresalient, or through means-end relations, in whichfailure to fulfill one goal suggests a need to addressunderlying goals. Third, it presents a new approach
for testing hypotheses on how multiple goals affecta single outcome through interaction variables.Fourth, it presents new evidence on the causes oforganizational revenue growth that facilitates eval-uation of the claim that aspiration levels affect or-ganizational growth.
THEORY AND HYPOTHESES
Aspiration Levels and Problemistic Search
According to the behavioral theory of the firm,organizational decision makers pursue multiplegoals that result from internal bargaining, and com-parisons of realized goal variables with aspirationlevels determine organizational actions (Cyert &March, 1963: 26–43). In this theory, a goal consistsof an aspiration level on a measurable organization-al outcome (the goal variable). The realized out-come on a goal variable is often called performance,but for clarity it is useful to reserve that term foroutcomes on goal variables that measure firm prof-itability. When an organization falls below the as-piration level of a goal variable, decision makersinitiate problemistic search for actions that mayproduce outcomes above the aspiration level (Cyert& March, 1963: 120–123). In addition, researchershave later argued that failure to meet an aspirationlevel motivates decision makers to accept the risksinherent in changing their organization (Bromiley,1991; Fiegenbaum & Thomas, 1988; Greve, 2003c;Lant et al., 1992). Thus, aspiration levels affectorganizational change through adjustment of prob-lemistic search and acceptance of risk.
Aspiration levels are constructed from sourcessuch as an organization’s experience and its obser-vation of other organizations (Cyert & March, 1963:123–124). Managers form reference groups of otherorganizations that they view as similar to theirs(Lant & Baum, 1995; Porac, Thomas, & Baden-Fuller, 1989), and they display greater awareness ofthe behaviors of organizations in these referencegroups and greater likelihood of imitating them(Baum & Haveman, 1997; Fiegenbaum & Thomas,1995; Porac, Thomas, Wilson, Paton, & Kanfer,1995). Such comparisons are similar to the socialcomparison processes in which individuals com-pare themselves with reference groups of otherswho are similar on salient attributes (Festinger,1954; Miller, 1982; Wood, 1989).
Organizations are thought to have a wide range ofgoals, including profitability, sales, and production(Cyert & March, 1963: 40–43). Some goals are usedto assess organizational performance, and othersare introduced through the efforts of stakeholdersand interest groups to persuade organizations to
2008 477Greve

pursue their interests (Donaldson & Preston, 1995;Hoffman, 1999). Among the different variables rep-resenting the goals that organizations might pursue,profitability measures such as return on assets havereceived the most attention (Audia, Locke, & Smith,2000; Bromiley, 1991; Greve, 2003a, 2003b; Lant etal., 1992; Miller & Chen, 2004). Studies on aspira-tion levels for research productivity and sales (Au-dia & Sorenson, 2001) and market share and status(Baum, Rowley, Shipilov, & Chuang, 2005) have,however, used other goal variables.
Profitability goals are often tied to concrete man-agerial incentives, and they affect a manager’svalue in the job market (Fama, 1980). In that re-spect, profitability goals for top managers are sim-ilar to goals that managers set for their subordinateworkers and work groups, because such intraorgan-izational goals often have career consequences (Me-zias, Chen, & Murphy, 2002). There is ample evi-dence that organization members seek to meet goalsset by their managers (Locke & Latham, 1990).There is also ample evidence that individuals aremore willing to accept risk in loss situations, suchas falling below the aspiration level on a goal vari-able (Heath, Larrick, & Wu, 1999; Kahneman &Tversky, 1979; Kuehberger, 1998). In keeping withthis theory, many studies have shown that profit-ability affects managerial risk taking and the likeli-hood of strategic changes (Audia et al., 2000;Fiegenbaum & Thomas, 1988; Greve, 2003a; Lant etal., 1992; Nickel & Rodriguez, 2002), which subse-quently affect profitability (Audia et al., 2000; Bro-miley, 1991).
Although profitability goals are clearly importantfor explaining organizational behaviors and out-comes, it is worthwhile to also consider other or-ganizational goals. Theoretically, the role of goalsin directing the attention of decision makers be-comes more important the more numerous thegoals are, so it is a key research task to investigatewhether other goals exist. Empirically, work show-ing that firms in the same strategic group becomesimilar on measures reflecting resource allocationand market position (Fiegenbaum & Thomas, 1995)has suggested that managers also make social com-parisons with respect to other organizationalattributes.
One reason to doubt whether goals other thanprofitability affect organizational behaviors is thatmany organizational goals do not have such clearcareer consequences as profitability. For example,intermediate goals such as production efficiencyand defect rates have weaker relations to top man-ager career outcomes than final goals such asprofitability, and organizational efforts to ad-dress problems such as pollution (Hoffman, 1999)
or homelessness (Dutton & Dukerich, 1991) haveeven less clear rewards. However, experimentalwork has shown that aspiration levels also guidebehaviors related to goals that are not associatedwith rewards (Locke & Latham, 1990). Indeed, ac-cording to the behavioral theory of the firm, man-agers seek to meet aspiration levels on a broad rangeof goals to avoid struggle among constituencies withpotentially conflicting goals (Cyert & March, 1963).Hence, it is fruitful to extend investigation of or-ganizational behavior directed by goals that go be-yond profitability.
Size Goals
Aspiration levels for organizational size arefounded on managerial beliefs that size affects or-ganizational efficiency or legitimacy. Organiza-tional size is related to efficiency in many in-dustries, and organizations gain legitimacy byappearing similar to other organizations, so bothbeliefs are plausible (Deephouse, 1996; DiMaggio &Powell, 1983; Edmunds, 1981; McNamara, Deep-house, & Luce, 2003). Size goals are important be-cause of their potential influence on firm strategies.Problemistic search that results from falling belowthe aspiration level for organizational size triggerscompetitive moves to increase the growth rate andresults in actual growth if competing firms do notcounter them effectively. Firms can realize revenuegrowth through competitive attacks such as pricereductions, product development, and sales cam-paigns (Smith, Ferrier, & Ndofor, 2001). Competi-tors fail to respond to such attacks because of in-difference when an attack is on a peripheral marketand because of risk aversion when they themselvesare profitable (Chen & Hambrick, 1995; Chen &MacMillan, 1992; Hambrick, Cho, & Chen, 1996),and thus there are often opportunities for organiza-tions to achieve growth if their managers are will-ing to take risks. Hence, revenue growth is expectedto be more rapid the further an organization isbelow its aspiration level, all else being equal.
The effect of size above an aspiration levelshould be considered separately. Researchers havegenerally assumed that problemistic search changesas a continuous function of performance level (Bro-miley, 1991; Lant et al., 1992) and that the strengthof the reaction varies depending on whether per-formance is above or below an organization’s aspi-ration level (Greve, 1998). This treatment parallelsthe treatment of goals as reference points in indi-vidual psychology (Heath et al., 1999) and differsfrom the view that performance above and perfor-mance below aspiration level are separate con-structs. Given this assumption, the main issue to
478 JuneAcademy of Management Journal

address is whether the effect of size is the sameabove and below aspiration level. One scenario isthat the effect of size above an organization’s aspi-ration level is the reverse of that below, becausemanagers adjust downwards toward the aspirationlevel. This scenario is unlikely because managersare aware of the flat region in the size-efficiencyrelation that allows organizations to grow largerthan the minimum efficient size without incurringan efficiency penalty, so managers of organizationsabove their aspiration levels do not seek to shrinkthem. They are, however, in a gain situation andthus less willing to take risk (Kahneman & Tversky,1979) and will only seek growth to the extent thatprofitability can be maintained. Thus, the size goalis less likely to be active in firms with size aboveaspiration level, so the relation between size andgrowth becomes weaker. The following predictionsare made:
Hypothesis 1. For firms below their aspirationlevel for size, firm size is negatively related togrowth.
Hypothesis 2. For firms above their aspirationlevel for size, the relation of firm size to growthis weaker than for firms below the aspirationlevel and not positive.
Performance Goals
Organizations respond to low performance bymaking a broad range of strategic and operationalchanges, including entering new market niches, ac-quiring resources, and increasing R&D and innova-tiveness (Audia et al., 2000; Audia & Greve, 2006;Bolton, 1993; Greve, 1998, 2003a; Hambrick &D’Aveni, 1988; Lant et al., 1992). Similarly, higherorganizational growth can be a result of low perfor-mance because problemistic search leads to discov-ery of actions that can increase growth, and man-agers are more willing to accept the heightened riskof such actions. Acceptance of risk is importantbecause competitive moves to increase growth cantrigger retaliation from competitors and can alsoinvolve operational risks. For example, growinginsurance firms need to be alert to the possibilitythat newly acquired customers are sloppy ormalfeasant.
Again, it is valuable to consider whether the ef-fect will be the same above and below an organiza-tion’s aspiration level. First, consider the “satisfic-ing” argument that was applied to size in theprevious section. Organizational size is subject tosatisficing because efficiency and legitimacy do notjustify a very large size, but goals for organizationalperformance do not have upward bounds. Also,
performance goals have clearer career rewards formanagers than size goals because they produce in-ternal rewards and increase the managers’ worth inthe external job market. Thus, although managershave aspiration levels for performance goals as wellas for size goals, there is less justification for pos-iting that an organization pursues performancegoals more weakly when it is above its aspirationlevel for performance. Instead, managers will bemotivated to lock in high organizational perfor-mance by avoiding risky actions.
Next, consider organizational inertia. Researchon performance effects on organizational changehas specified that organizational inertia reduces thereaction to performance that is below aspirationlevel (Greve, 1998, 2003a, 2003b). This theory hasbeen applied to predictions about changed marketniche, investments in production technology, andintroductions of innovative product technologies,which are behaviors that alter a firm’s organization-al core and thus are subject to inertial forces (Han-nan & Freeman, 1984). Organizational size is not apart of the organizational core, and thus the inertiaprediction does not apply to this outcome.1 Follow-ing these arguments, one concludes that perfor-mance is negatively related to growth and is notmade nonlinear by shifting attention or organiza-tional inertia, leading to:
Hypothesis 3. Performance is negatively re-lated to growth.
Performance and Size Goal Interactions
Having posited that both size and performancegoals affect growth, I now consider interactionsbetween these goals. Earlier work has addressedthis issue in different ways. Some has investigatedthe effects of multiple goals side by side, as whenaccounting and stock market measures of profit-ability are used to predict risk taking (Miller &Chen, 2004). This approach treats the goals as al-ternative measures of the same construct, which isappropriate for closely related goals, but not forqualitatively different goals such as performanceand size. Other work has included multiple goals ina single model, applying the usual regression as-sumption of additive effects. This work has shownthat two goals can jointly influence a single out-come, as when goals for market share and network
1 However, some of the actions that organizations maytake to initiate growth may affect the organizational core(such as entering new market niches), making differencesin the reaction to performance above and below the as-piration level possible.
2008 479Greve

status both affect network tie initiation (Baum etal., 2005), and that goals have a greater effect onmore relevant outcomes, as when technologicalperformance affects innovations but sales perfor-mance affects product introductions (Audia & So-renson, 2001). This is a parsimonious approach formodeling different goals, and it should be preferredin the absence of good theoretical reasons to expectinteractions between the goals.
Here, some reasons to expect goal interactionsexist. Work contrasting individual and organiza-tional goals has shown effects of organizationalgoals (McNamara & Bromiley, 1997) but has alsoshown that individuals may have reactive re-sponses that reverse the intended effects of organ-izational goals (McNamara, Moon, & Bromiley,2002). One study showed that a self-enhancementbias makes individuals facing two divergent goalsprone to accept the one they exceed, and thus tohave a bias toward inaction (Audia & Brion, 2007).However, my study analyzing the effects of twodifferent organizational aspiration levels yieldedno interactions (Greve, 1998), and a study analyz-ing two different organizational goals indicatedthat failure to fulfill one was enough to increaserisk taking (Baum et al., 2005). The sparse evidencesuggests a need for further research.
Here, two alternative interaction effects are pro-posed. The first is a sequential attention rule, stat-ing that decision makers attend to one goal at a timeand move on to the next goal when performance onthe first is above the aspiration level (Cyert &March, 1963: 117–119). Sequential attention is aform of quasi-resolution of conflict that lets deci-sion makers treat different goals as constraints to besatisfied in some order of priority rather than astrade-offs that have to be weighed against eachother. It reduces cognitive effort and political strifeand thus yields easier, but possibly suboptimal,organizational decision making.
When goals are attended to sequentially, fulfill-ment of an active goal shifts the attention to thenext goal. The order in which goals are attended tois not uniform among organizations and over timebut may differ according to the preferences of the“dominant coalition” of each organization (Cyert &March, 1963: 26–32). It is still reasonable to expectthat goals closely associated with the survival of anorganization, such as performance, will have highpriority, and hence that size goals gain attentionwhen performance goals are satisfied. The gain inattention to size goals may occur without a corre-sponding reduction in attention to performancegoals, as it is possible for organizations to pursuemultiple goals, unless a high-priority goal such asperformance attracts all decision maker attention.
These arguments imply that size relative to aspira-tion level has a negative relation to growth regard-less of performance level, but the relation isweaker, and possibly close to zero, when perfor-mance is below aspiration level. The prediction is:
Hypothesis 4a (sequential attention). The (neg-ative) effect of firm size on growth is weaker infirms with low performance than in firms withhigh performance.
Sequential attention is not the only rule thathas been proposed, however, and in the case ofperformance and size a plausible alternative hy-pothesis exists. Some goals are causally linked ingoal hierarchies in such a way that fulfillment ofone goal helps an actor fulfill the next (March &Simon, 1958). All else being equal, an organiza-tion below the efficient size for its type of busi-ness will have low performance and can improveits performance by growing to the efficient size.Revenue growth can increase efficiency in theshort run by allowing a more optimal utilizationof current production capacity and can justifyacquisition of larger and more specialized pro-duction assets that increase efficiency in the longrun (Penrose, 1959). Although such effects havebeen documented best in manufacturing indus-tries (Scherer et al., 1975), efficient scale is alsoimportant in service industries such as insurance(Johnson, Flanigan, & Weisbart, 1981; Khaled,Adams, & Pickford, 2001). Service delivery isbacked by a production system, consisting ofphysical assets and human resources, that hasbeen designed for a given capacity, so it is rea-sonable for a manager of a service firm to alsoassume that size is related to performance andthus to activate size goals when performance isbelow aspiration level. As noted earlier, uncer-tainty about efficient size makes it difficult todirectly assess whether growth will improve per-formance. Managers may make this judgment byusing the efficiency logic in reverse: if an organ-ization has high performance, then it probablyhas efficient size as well, but if it has low perfor-mance, then growth may be a solution. This for-mulation implies that the size-growth relation isstronger when performance is low, contrary toHypothesis 4a, but it is negative in both the highand low performance range:
Hypothesis 4b (size goal activation). The (neg-ative) effect of firm size on growth is strongerfor firms with low performance than for firmswith high performance.
480 JuneAcademy of Management Journal

DATA AND METHODOLOGY
General Insurance
Size is a potential goal variable for any indus-try, and especially one in which managers be-lieve that it is consequential for efficiency orlegitimacy, so investigation of size goals hasbroad generalizability. The data used here arefrom the Norwegian general insurance industry.“General insurance” means all forms of insuranceexcept life insurance and is also referred to as“property-liability insurance.” Insurance firmstake on customer risk for a fee, which they can doprofitably by pooling the risk of many customers(Ehlrich & Becker, 1972; Venezian, 1984). Al-though sufficient revenue is essential for poolingrisk, too much revenue is also problematic. Ageneral insurance firm needs to economicallygain customers, correctly price their risk, andmonitor their behavior, which limits the efficientsize. Pricing is made complicated by the adverseselection problem of bad risks seeking insurancewhile good risks stay away, and monitoring isneeded because insured actors become less cau-tious (Rotschild & Stiglitz, 1976).
The problems of economic customer acquisition,pricing, and monitoring operate both at the nicheand the firm levels, and the industry has a mix ofspecialists that are large in their niche and gener-alists that are large overall, as well as firms that arelarge neither overall nor in their niche. Reinsuranceis available as a financial mechanism for poolingrisks over firms, so if a reinsurance firm prices itsservices cheaply, efficient pooling of risks can beobtained at small firm sizes (Phifer, 1996). Insurersthus have a complex task of choosing size and levelof specialization in their product offerings. Investi-gations of the size-efficiency relation for insurancefirms have shown that small firms have high costs,but also that growth above the average size canincrease costs (Johnson et al., 1981; Khaled et al.,2001).
In general insurance, increasing revenuesthrough low prices is a possible but potentiallycostly strategy. Insurance differs from manufactur-ing in that most costs are incurred after sales; thischaracteristic blunts the short-term disincentiveagainst winning market share by lowering prices.Also, because much of the production system usedin insurance is easily scalable, such as staff for salesand claims processing, capacity constraints ongrowth are weak. Indeed, if indivisible assets suchas sales outlets, expert damage assessors, and testfacilities are underutilized, the incentive to grow islarge. These factors make a “deep pocket” strategy
of growing through low prices a clear possibility inthe insurance industry.
The insurance industry has both joint stockcompanies and mutual firms, or “mutuals.” Mu-tuals do not distribute dividends from their prof-its but may instead build reserves or reduce theirprices. Their lack of access to the equity marketand their control by customer-owners constrainstheir growth. Mutuals with widely dispersedownership closely resemble managerialist firmsin control but lack the ability to fund rapidgrowth, which has led to many conversions ofmutuals to joint stock companies in the UnitedStates (Viswanathan & Cummins, 2003). In Nor-way, tight control of mutuals by concentratedowners has been common, however, and “demu-tualizations” have not occurred.
The mutuals in the data introduced a complica-tion because these firms do not seek to maximizeprofitability, so the usual profitability measures ofperformance are not suitable for them. Instead ofmaximizing profitability, mutuals seek to minimizeadministrative costs and insurance losses (damagespaid out). Of these, the latter is the largest costcomponent, and they are also important to insur-ance firms with a joint-stock company form. Thus,the loss ratio, defined as the proportion of ownpremiums paid out in damages, is used as a perfor-mance measure in the insurance industry(Viswanathan & Cummins, 2003). It is a reverse-coded performance measure because managersseek to minimize losses.
Data Sources
Accounting data from general insurance firms inNorway operating between 1911 and 1996 werecoded from the annual reports of the NorwegianInsurer’s association from 1912 (volume 1) through1997 and were supplemented with data from firmannual reports. The accounting data were coded byone research assistant and checked by another.Data on economic conditions were obtained fromthe Norwegian Central Bureau of Statistics. Thedata have previously been used to examine compe-tition and experience effects on firm survival(Greve & Rao, 2006).
The data set contained 4,842 firm-year observa-tions from 161 firms. An additional 96 firms ex-isted in this time period but did not enter the anal-ysis because of missing data. Many of the firmswith missing data were short-lived, such as firmsthat offered maritime insurance during World WarI and failed soon after it ended. Some observationswere lost because of the lagging of all independentvariables by a year and the use of an additional lag
2008 481Greve

to construct the aspiration level for the loss ratio.One year of observations was lost because account-ing data were not given for the year 1943.
Size and Performance Variables
Organizational size was the logarithm of ownpremiums, which equals total premiums minuspremiums reinsured (i.e., sold to reinsurancefirms or other direct insurers). Own premiums,the standard sales measure in the insurance in-dustry, is nearly always reported in firm ac-counts. I took the logarithm of these values be-cause individuals tend to think of size andgrowth on a scale of proportional differences,which corresponds to a logarithmic scale. Withthis scaling, a manager whose firm is 20 percentbelow the firm’s aspiration level for size experi-ences the same size shortfall regardless of theabsolute size of the organization. I tested thisassumption by also estimating models with a lin-ear specification of own premiums, whichshowed poorer fit to the data than the logarithmicspecification used in the analyses reported in thetables presented here.
Prior research has suggested that organizationaldecision makers construct aspiration levels fromorganizational reference groups using multiple cri-teria (Fiegenbaum & Thomas, 1995; Porac &Thomas, 1990; Reger & Huff, 1993) and that marketparticipation is particularly important for choosingmembers of a reference group (Clark & Montgom-ery, 1999). Despite these findings, studies on socialaspiration levels have simply used the mean ormedian, which implies that all organizations areequally influential on a focal organization (e.g., Au-dia et al., 2000; Fiegenbaum & Thomas, 1988;Greve, 1998). One study showed that aspirationlevels weighting firms by similarity gave strongerfindings than those using the unweighted mean(Baum, Rowley, Shipilov, & Chuang, 2005), sug-gesting that similar organizations influence one an-other more than dissimilar organizations do. Ac-cordingly, I adjusted the size of each sampledorganization by subtracting a social aspiration leveldefined as a weighted average of the size of all othersampled firms. The formula for the weighting factorwas w � 1 � w1 � w2, where w1 equaled 1 if bothfirms had the same corporate form (joint-stock ormutual) and 0 otherwise, and w2 equaled the pro-portion of the focal firm’s market niches in whichthe other firm was represented. This weighting letcorporate form and market niche overlap affectsimilarity judgments in such a way that a maxi-mally similar firm (same form and complete nicheoverlap) had triple the weight of a maximally dif-
ferent firm (different form and no niche overlap).To verify the weights, I tried smaller and highervalues of w1 and w2. This procedure yieldedequally good fit to the data for small changes andpoorer fit for larger changes in either direction,suggesting that the chosen weights were optimal.2
The difference between actual size and the aspira-tion level for size was entered as a spline specifi-cation (Greene, 1993: 235–238), which means thatseparate variables were entered when size wasabove aspiration level and when it was below.
Performance was operationalized as the loss ra-tio, which equals the losses on own premiums di-vided by own premiums. In preliminary analyses,various aspiration levels were entered, and an as-piration level equal to last year’s loss ratio wasfound to have good fit, so I adjusted the loss ratiofor the aspiration level by subtracting the previous-year loss ratio and included this value as loss ratioincrease. Previous work has also used aspirationlevels formed from past performance levels but of-ten shown effects of multiple years of past perfor-mance (Greve, 1998; Lant, 1992; Mezias et al.,2002). I also included an indicator variable set to 1when the loss ratio was higher than the prior year’s.This variable was the main effect for the interactionvariables used to test whether the reactions to sizewere different when performance was below theaspiration level (i.e., losses were increasing).
Control Variables
Initially, a broad range of economic indicatorswere considered for inclusion as control variables,as such variables affect insurance both directly,through the ability of firms to have insurance, andindirectly, through the ability of employees to have
2 In preliminary runs, approaches that only consideredone weighting criterion were also used: These used (1)specialist or generalist organization, (2) mutual or stockfirm, (3) and multimarket contact. Other runs used (4) thesize of the nearest-sized firm, (5) the unweighted mean, and(6) the median size of all firms. Of these specifications, 1, 2,3, and 4 had worse fit than the models displayed based onthe Bayesian information criterion, and 5 and 6 had modelfits that could not be statistically distinguished from thoseof the model displayed. Thus, single-criterion weightingwas inferior to the multicriterion weighting used in themodels displayed and to the mean or median of all otherfirms in an industry. In models 3 and 4, the size above theaspiration level had a positive effect that contradicted Hy-pothesis 2, but otherwise the alternative models gave fullsupport to the hypotheses. Hence, the results appear robustagainst most alternative specifications of the aspirationlevel.
482 JuneAcademy of Management Journal

insurance. Variables such as fish catch, timber ex-port, and total industrial employment did not havemeasurable effects, however, and were omittedfrom the final specification. The following vari-ables were retained: GDP growth was the ratio ofcurrent-year to last-year gross domestic product(GDP), with fixed-price numbers for GDP used tocontrol for inflation. Ship tonnage was the grosstons of all ships registered in Norway and wasincluded because of the key role of shipping in theNorwegian economy in general and the insuranceindustry specifically. The market concentration ofthe insurance industry was computed as the Her-findahl concentration index (the sum of squaredproportions) of market shares. Firms in a concen-trated industry may adopt a strategy of not provok-ing price wars through such means as not seekingto grow faster than their peers. Initially, the densityof insurance firms was also entered as a first- andsecond-order term, but I dropped these variablesbecause they were collinear with other variables inthe specification and could be omitted without af-fecting the results.
The bond yield of long-term (eight years andmore) government bonds was obtained from histor-ical statistics published by the Bank of Norway andincluded as a control for the investment opportu-nities available to the insurers. Although generalinsurers do not have an explicit investment rolesuch as life insurance firms have, they keep theirreserves invested in interest-bearing and equity in-struments. In years with a high rate of return in thebond market, they can grow more easily thanks tothis side business. Stock market yields were notavailable as far back as needed, so only bond yieldswere entered.
The following firm-level control variables wereincluded: Age was the logarithm of the years (plus1) since a firm’s founding. Niche count was thenumber of niches in which an insurer offered prod-ucts and was calculated by coding the descriptionsof activities that each insurer gave in the yearbookof the Insurer Association into 34 different niches.The highest number of niches simultaneously oc-cupied by a firm in the data is 16. Diversified firmsmay compete less aggressively in each marketniche than firms that are committed to few niches(Chen, 1996). To take this effect into account, Ientered the firm level of diversification as one mi-nus a Herfindahl index of its distribution of ownpremiums across the niches. Similarly, firms maycompete less aggressively when they have a highlevel of contact with other firms in multiple mar-kets (Gimeno, 1999; Gimeno & Woo, 1996). To con-trol for this effect, the model has the average mul-timarket contact of the focal firm with all its
competitors (Baum & Korn, 1996). I formed thismeasure by taking, for each multimarket competi-tor (each firm a focal firm meets in at least twomarkets), the proportion of focal firm markets inwhich the competitor is also present. This propor-tion was averaged over all multimarket competitorsto yield the average multimarket contact of thefocal firm. Finally, the firm’s growth minus aspira-tion level was entered. It was calculated as thegrowth in the past year minus an aspiration levelequal to the growth of the year before.
Table 1 displays the descriptive statistics. Noindicator for mutual organization is shown becausethis variable was constant within firms and so can-cels out in the fixed-effect model, but a little morethan one-third of the observations in the data werefrom mutual firms. Market concentration was lowon average and never became particularly high (amaximum of 0.21 was observed in 1997). The cor-relation table yielded no surprises, with the highestcorrelations being seen in predictable places, suchas the intersection of the current and lagged valuesof premiums and the intersections of these two andpremiums adjusted by aspiration level. As the anal-ysis shows, these correlations did not affect thestability of the coefficient estimates.
Models and Hypothesis Tests
In this study’s model, firm growth is the ratio ofnext-period and current-period size, and firmgrowth rate is this ratio minus 1. The Gibrat modelof size-independent growth, which uses the as-sumption that firms have the same growth rate re-gardless of size, is extended with a parameter � thatlets growth be size-dependent, because previousanalyses have shown that large firms grow moreslowly than small ones (Barnett & Carroll, 1987;Barron, West, & Hannan, 1995). The size-depen-dent growth model is specified as:
St�1
St� St
y exp(�Xt � �).
Here, S is firm size, the left- side expression,St�1
St, is
growth, and the right-side expression is the size-dependence factor St
y multiplied with a set of co-variates Xt with associated coefficients � and anerror term �. This is made into a linear model bytaking the logarithm of both sides and rearrangingterms:
ln(St�1) � (1 � �)ln(St) � �Xt � �.
Now the model specifies that the logarithm of thesize at time t � 1 is a linear function of the covari-
2008 483Greve

ates and the logarithm of the size at time t. Hence,the model contains the lagged dependent variableas a way to account for the size dependence of thegrowth rate.
I entered fixed effects for firms to control forstable firm differences in growth. Estimates with noeffects, random effects, and fixed effects gavesimilar results on the hypothesis tests, but theHausman test showed statistically significant dif-ferences of the coefficient magnitudes. The ran-dom-effects model was rejected because of signifi-cant correlation of firm effects and the covariatematrix, leaving the fixed-effects model as the bestavailable control.
Because some of the hypothesis tests involvedcomparison of coefficient estimates, a combina-tion of t-tests for the significance of individualcoefficients and F-tests of coefficient differenceswere used. Hypothesis 1, stating a greater growthfor firms below the aspiration level for size, wastested by the significance level of the coefficientof size below the aspiration level. Hypothesis 2,stating a decreased effect of size above the aspi-ration level, was evaluated by an F-test ofwhether the coefficient estimates of size aboveand below the aspiration level were equal. Hy-pothesis 3, stating greater growth when perfor-mance is low, was tested by the significance levelof the performance variable.
To test Hypotheses 4a and 4b, I formed interac-tion variables between the size variables and anindicator set to 1 when a firm had an increasingloss ratio. If high losses draw attention away fromthe size goal, as Hypothesis 4a specifies, then theinteraction variables will have signs opposite thesigns of the main effects of size, and will thusweaken the main effects. If high losses draw atten-tion toward the size goal, as Hypothesis 4b speci-fies, then they will have the same signs as themain effects of size and thus will strengthen themain effects. The hypotheses concern both inter-action variables rather than each individually, sothey were evaluated by an F-test of their jointsignificance.
Although these hypothesis tests would seem suf-ficient, one more test was needed. Recall that in amodel with interaction variables, the significanceof the main effects depends on the level of theinteraction variable (Aiken & West, 1991). Accord-ingly, in the model with interaction variables, Hy-potheses 1 and 2 had to be tested separately for thecondition of increasing losses. I evaluated Hypoth-esis 1 for increasing losses using an F-test ofwhether the sum of this coefficient and its interac-tion with the increasing loss indicator equaled 0and evaluated Hypothesis 2 for increasing losses byadding the size variable above the aspiration levelto its interaction for size and computing an F-test of
TABLE 1Means, Standard Deviations, and Correlationsa
Variable Mean s.d. 1 2 3 4 5 6 7 8 9 10 11 12 13
1. Own premiumsb 7.25 2.622. Own premiums,
laggedb7.18 2.60 .99
3. Ageb 3.62 0.73 .38 .384. Niche count 3.96 4.02 .40 .40 .275. Diversification 0.25 0.29 .28 .28 .06 .576. Multimarket
contact0.45 0.43 .17 .17 �.06 .43 .78
7. Marketconcentration
0.07 0.03 .49 .49 .29 .02 �.13 �.20
8. Ship tonnage 11.62 7.92 .47 .47 .34 .05 �.00 �.05 .579. GDP growth 1.04 0.03 .04 .03 .03 .02 .06 .05 .13 .11
10. Bond yield 5.74 2.85 .42 .43 .20 �.05 �.15 �.16 .43 .51 �.1011. Loss ratio increase 1.01 0.69 .00 �.01 �.02 .00 .00 �.00 .04 .02 .01 .0212. Growth minus
aspiration level�0.0002 4.33 �.01 �.01 .00 .00 �.01 �.01 �.01 .00 �.01 .00 �.05
13. Own premiumsminus aspirationlevel
�0.48 2.12 .66 .67 .13 .41 .37 .29 �.16 �.21 �.02 �.14 �.04 �.01
14. Loss ratio increasegreater than 0(indicator variable)
0.43 0.50 .10 .10 .02 .02 .05 .02 .11 .13 .01 .10 .27 �.02 �.01
a The data have 4,842 observations. Coefficients greater in magnitude than .03 are significant at the .05 level.b Logarithm.
484 JuneAcademy of Management Journal

whether this sum was equal to the sum of the sizevariable below the aspiration level and its interac-tion for size.
Alternative Explanations
I specified models to control for various alterna-tive explanations of organizational growth. First,per ecological theory, organizational growth is lessthan proportional to size because of inertia andregression to the mean (Barnett & Carroll, 1987;Barron et al., 1995). In the size-dependent model ofgrowth used here, this prediction was measuredthrough the parameter �, which is negative ifgrowth is less than proportional. The same param-eter also captures other explanations related to theabsolute size of an organization, such as the predic-tion that firm growth is a function of the distancefrom the minimum efficient size.
Second, according to managerialist theory, firmsgrow to the extent allowed by their owners, whichmeans that when control has been separated fromownership, a firm grows more rapidly (Berle &Means, 1965). Managerialist theory does not indi-cate an effect of size relative to aspiration level ongrowth, however, and is thus not a plausible alter-native explanation of findings on this variable.Managerialist theory does suggest that growth islower in firms with an ownership form that givesgreater owner control. This prediction can be as-sessed by comparing firms with a joint-stock and amutual form of ownership, as mutuals have strictercontrol by owners and thus should grow moreslowly.
Third, the integration of search theory and inertiatheory I have proposed in earlier work (Greve,1998) implies that the effect of a goal variable onorganizational change is weaker below the aspira-tion level than above it, which differs from thepredictions made above. This prediction relies onan assumption that inertial forces counteractchange with increasing strength as performancefalls below aspiration level, partially canceling outthe increase in the likelihood of change caused byorganizational search for solutions. Though this ar-gument is suitable for some outcomes, it seems lessapplicable in this study. Inertia theory applies tocore features of an organization, which are itsstated goals, forms of authority, core technology,and marketing strategy (Hannan & Freeman, 1984).Organizational size is not part of the core, and thusnot subject to strong inertial forces. If size is subjectto inertia, however, then the effect should beweaker below aspiration level than above it, con-trary to Hypotheses 2 and 3, so this study offers a
critical test contrasting the hypothesized relationand an inertia effect.
Fourth, managers may view growth as a perfor-mance measure and have aspiration levels forgrowth as well as for size (Armstrong & Collopy,1996; Smith et al., 2001). Growth goals would alsobe consistent with managerial decision making us-ing aspiration levels, though growth goals are lessjustifiable from the viewpoints of efficiency or le-gitimacy than size goals are. To ensure that unmea-sured effects of growth goals would not influencethe analysis, I also included growth relative to anaspiration level in the model.
RESULTS
Table 2 shows the estimates of the growth mod-els. Model 1 contains only the control variables; inmodels 2 and 3 the hypothesis-testing variableswere entered one at a time, and in model 4 theywere entered simultaneously. The findings of thesemodels do not differ, so model 4 is interpreted.Model 4 is the parsimonious specification in whichsize and performance jointly affect growth but donot interact. In model 5 the indicator variable forloss ratio increase and its interactions with the sizevariables were added, and the model tests the hy-potheses in which performance affects the reactionto size (Hypotheses 4a and 4b).
In model 4, the coefficient estimate for premiums(size) is negative and significantly different from 0below aspiration level, in support of Hypothesis 1.The coefficient estimate above aspiration level isbetween 0 and the coefficient estimate below aspi-ration level, as Hypothesis 2 predicts, and the valueof F (4.03, p � .05) shows that it is significantlydifferent from the coefficient estimate below 0. Hy-potheses 1 and 2 are thus supported. Organizationsgrow faster the further they are below aspirationlevel for size, and the size-growth relation isweaker above the aspiration level for size. Thesefindings contradict the idea that inertia prevailsbelow the aspiration level, which would lead to asmaller coefficient estimate below the aspirationlevel than above it. As argued earlier, inertia shouldnot apply to a dependent variable of revenuegrowth.
The coefficient for loss ratio increase is positiveand significant and thus supports the prediction inHypothesis 3 that organizational growth increaseswhen performance is below aspiration level (recallthat high losses are worse). This model adds asingle variable for loss ratio, as Hypothesis 3 pre-dicts, rather than separate variables above and be-low aspiration level, as inertia would imply (Greve,1998). In a model with separate loss ratio variables
2008 485Greve

above and below aspiration level, the result of anF-test for equality of the coefficients above andbelow aspiration level was not significant (1.30,n.s.), which validates the specification with a sin-gle coefficient estimate. There is a linear relationbetween loss ratio and growth, as is expected ifproblemistic search leads to growth as a solution tolosses and is not moderated by organizationalinertia.
Next, in model 5 I entered the interaction vari-ables testing Hypotheses 4a and 4b, which statethat size goals are either deactivated (4a) or acti-vated (4b) when performance is below aspiration
level. The first step in assessing these hypotheses isto examine the joint significance of the two inter-action variables of premiums relative to aspirationlevel with the indicator variable for loss ratio in-crease. The result of this test is significant (F �4.39, p � .05), which shows that the loss ratiomoderates the response to size relative to aspirationlevel. The coefficient estimates of the interactionvariables are opposite to the main effects in sign,showing that the size goal becomes less importantwhen a firm has losses. This finding is consistentwith Hypothesis 4a, predicting sequential attentionwith performance as the higher priority, and is
TABLE 2Models of Premium Growtha
Variables Model 1 Model 2 Model 3 Model 4 Model 5
Premiumsb 0.92** (0.01) 0.92** (0.01) 0.98 (0.02) 0.98 (0.02) 0.98 (0.02)Age 0.13** (0.02) 0.13** (0.02) 0.10** (0.02) 0.10** (0.02) 0.10** (0.02)Niche count 0.01** (0.00) 0.01** (0.00) 0.01** (0.00) 0.01** (0.00) 0.01** (0.00)Diversification 0.20** (0.05) 0.20** (0.05) 0.20** (0.05) 0.20** (0.05) 0.20* (0.05)Multimarket contact �0.09** (0.03) �0.09** (0.03) �0.09** (0.03) �0.09** (0.03) �0.09** (0.03)Market concentration 1.33** (0.35) 1.31** (0.35) �0.31 (0.52) �0.30 (0.52) �0.33 (0.52)Ship tonnage 0.00 (0.00) 0.00 (0.00) �0.01** (0.00) �0.01** (0.00) �0.01** (0.00)GDP growth 0.45* (0.20) 0.45* (0.20) 0.48* (0.20) 0.48* (0.20) 0.48* (0.20)Bond yield 0.02** (0.00) 0.02** (0.00) 0.00 (0.00) 0.00 (0.00) 0.00 (0.00)Growth � aspiration levelc 0.01** (0.00) 0.01** (0.00) 0.01** (0.00) 0.01** (0.00) 0.01** (0.00)Growth � aspiration leveld �0.003† (0.001) �0.003 (0.00) �0.003 (0.00) �0.003 (0.00) �0.003 (0.00)Loss ratio increase 0.02* (0.00) 0.02* (0.01) 0.03** (0.01)Size � aspiration levelc �0.08** (0.02) �0.08** (0.02) �0.08** (0.02)Size � aspiration leveld �
loss ratio increased0.01 (0.01)
Size � aspiration leveld �0.03 (0.03) �0.03 (0.03) �0.05† (0.03)Size � aspiration leveld �
loss ratio increased0.05* (0.02)
Loss ratio increased
(indicator variable)�0.02 (0.02)
F for Hypothesis 2 (1 df) 4.58* 4.03* 1.07F for Hypothesis 2 when
loss ratio increase (1 df)5.67**
F for Hypothesis 1 whenloss ratio increase (1 df)
15.43**
F for Hypothesis 4a and4b (2 df)
4.39*
Log-likelihood �2,150.6 �2,147.2 �2,139.0 �2,135.9 �2,129.8Likelihood-ratio test vs.
model 16.77** 23.08** 29.28** 41.47**
Degrees of freedom 1 2 3 6Likelihood-ratio test vs.
model 412.18**
Degrees of freedom 3
a A total of 161 firms and 4,842 firm-year observations comprise the data. Fixed effects are reported for firms. Standard errors are inparentheses. The significance tests for single coefficients are two-sided t-tests.
b The significance tests in this row are against the null hypothesis that the coefficient of log premiums is unity (1), as predicted byGibrat’s law.
c If less than 0.d If more than 0.
† p � .10* p � .05
** p � .01
486 JuneAcademy of Management Journal

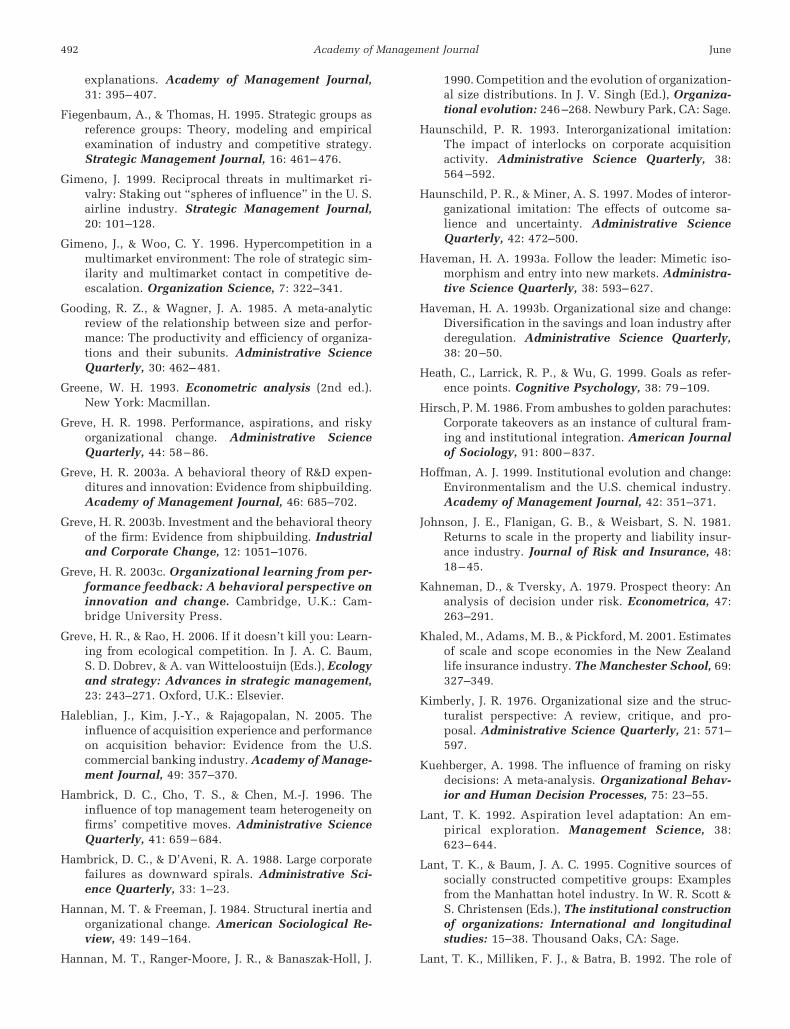
contrary to Hypothesis 4b, predicting size goal ac-tivation when performance is low. The interactionvariables are numerically smaller than the maineffects, and the F-tests for Hypotheses 1 (15.43, p �.01) and 2 (5.67, p � .01) when the loss ratio isincreasing are still significant, which shows thatthe deactivation of the size goal is not complete.The size goal affects growth even when a firm ex-periences high losses but does so less strongly thanwhen the firm experiences low losses. The sequen-tial attention seen here is thus not a strict sequencein which losses are addressed prior to size goals,but instead it takes the form of less attention to thesize goals in the presence of losses. However, theweaker reaction to size above aspiration level pos-ited by Hypothesis 2 is no longer significant whenthe loss ratio is decreasing (1.07, n.s.). Figure 1displays the predicted relation of size to growthimplied by the estimated coefficients in model 5.
Some findings on the control variables are note-worthy. The coefficient estimate of the log of pre-miums is not significantly different from 1, sup-porting the size-proportional growth predicted byGibrat rather than a size-dependent growth rate.This coefficient could be affected by regression to-ward the mean size, which would result in an es-timate below 1, but instead it is very close to 1. Age
and niche count have positive and significant ef-fects on the growth rate. The model does not con-tain an indicator for mutual firm because this in-dicator is constant within firms and thus notidentified when fixed effects are entered. In amodel with random effects, the coefficient estimatefor mutual firm is negative and significant, in linewith managerialist theory. The less-constrainedjoint-stock firms grew more rapidly. Diversificationhad a positive effect on the growth rate instead ofthe negative effect predicted on the basis of thetheory of strategic focus. The reason may be that thediversified firms were better represented in high-growth niches, and specialist firms were numerousin older and stagnant niches such as fishery insur-ance. Firms with high levels of multimarket contactgrew more slowly, as predicted on the basis of thetheory of mutual forbearance.
Growth relative to aspiration level has an unex-pectedly positive coefficient estimate below aspira-tion level and is not significant above aspirationlevel. Examination of the data revealed that thiswas because low growth relative to aspiration leveloften occurred following a year in which a firm hadunusually high growth. In fact, this coefficient canbe made negative and insignificant just by drop-ping 21 observations in which firms had expanded
FIGURE 1Estimated Size Effect on Growth
2008 487Greve

at least fivefold the year before, and thus had veryhigh aspiration levels (dropping these observationshad no effect on the other findings). This findingcould imply that managers do not update theirfirms’ aspiration levels in response to years withunusually high growth or that organizations thathave just completed a set of strategic actions forquick growth seek stability in order to consolidatethe gains. Because there is a good explanation forthis finding that does not involve aspiration levels,I conclude that the analysis shows little support forgrowth rate as a goal variable. Size goals are easierto justify than growth rate goals, and indeed theevidence for size goals is better than that for growthrate goals.
One may ask whether the growth patterns dem-onstrated here were beneficial for the firms or not.This question can be answered by examiningwhether losses and administrative costs increasedproportionally to firm scale or more or less thanproportionally. An aspiration level for size basedon a weighted average gives good decisions if thereare increasing returns to scale for small firms anddecreasing returns to scale for large firms. Thus, Iestimated time-varying three-segment Cobb-Doug-las production functions (Cobb & Douglas, 1928) oflosses, administrative costs, and the sum of thesecosts as a function of size and selected other covari-ates. The analysis showed that small firms hadlarger losses after 1950, and large firms had largerlosses throughout. Analysis of administration costsshowed that most firms were below minimum effi-cient size. Analysis of total costs showed increasingreturns to scale for small and medium-sized firmsand decreasing returns to scale for large firms be-fore 1950, and increasing returns to scale for smallfirms and proportional costs for medium and largefirms after 1950. The analyses thus suggest that firmsin the (upper) range of medium size were mostefficient. However, the average firm size did notreach the estimated optimal firm size until 1970, somany firms had aspiration levels below the opti-mum before that period. Thus, although size aspi-ration levels correctly signaled a need for the small-est firms to grow, they also signaled to medium-sized firms that they were above their optimal sizewhen in fact they were below it.
DISCUSSION
The observation that organizations seek to meetaspiration levels on multiple goal variables haslong been part of organizational theory (Cyert &March, 1963). However, in spite of this theory andthe suggestion that goals for profitability, sales, andproduction exist, researchers interested in organi-
zation-level goals have so far emphasized profit-ability. The finding that aspiration levels for sizeinfluence organizational growth is important be-cause it empirically supports the validity of thetheoretical call for research on a broader range oforganizational goals. It is a finding of broad interestbecause social comparison is a novel explanationfor organizational size, which has been a favoriteindependent variable in organizational researchwithout there having been a corresponding interestin its causes (Kimberly, 1976).
Implications for Further Research
Examination of multiple goals opens up new av-enues for research. Sequential attention to goals, akey element of the theory of multiple goals (Cyert &March, 1963), leads to the prediction that organiza-tional responses to goals differ depending onwhether other goals are met or not. Thus, it isimportant that this study showed a moderating ef-fect of performance: for organizations with low per-formance, the relation between size and growthwas weaker. This study appears to be the first em-pirical demonstration of sequential attention togoals in organizations using quantitative methods. Ideveloped the method of interacting each goal vari-able with an indicator variable for whether theother goal variable was fulfilled specifically to testthe sequential attention hypothesis. This method iseasily replicable, and it should be useful for futureresearch on sequential attention to goals.
Organizational size is just one of many possiblegoal variables to investigate, but it has special sig-nificance because the actions taken to reach a cer-tain size are highly consequential. Indeed, actionsthat lead to organizational growth such as mergers,acquisitions, and market entry have already beenstudied from other theoretical perspectives (e.g.,Boeker, 1997; Haunschild, 1993; Hirsch, 1986; Pfef-fer, 1972). It is time to revisit research on theseoutcomes with size goals as a predictor variable. Onthe basis of the findings reported here, one wouldexpect all these strategic actions to occur morefrequently in firms below their aspiration level forsize. The findings are also relevant to work ongrowth of production systems, such as acquisitionof assets and hiring. Revenue growth and assetgrowth are interdependent for organizations seek-ing to reach optimal size, as revenue growth justi-fies asset growth, which again allows efficiencyincreases that justify further revenue growth.
The theoretical implications of these findings areimportant. The aspiration-level explanation for or-ganizational growth is parsimonious to the point ofseeming simplistic: managers seek growth when
488 JuneAcademy of Management Journal

they believe that their organization is too small. It isvaluable because it makes use of well-known factsabout individual decision making and organiza-tional behaviors to make novel predictions. Or-ganizational pursuit of goals and socially con-structed aspiration levels are microlevel theoriesof individual decision making that have solid em-pirical support (Heath et al., 1999; Lant, 1992;Locke, Frederick, Buckner, & Bobko, 1984). Whenthey are combined with the idea that organizationalsize has implications for performance that are po-tentially large but difficult to judge, they producethe proposition that managers use available infor-mation to form heuristic judgments about the opti-mal size of organizations. This proposition yieldsclear and specific predictions when coupled withtheory on how managers act on such judgments.Here, the theory lends insights and provides evi-dence on how managers form and act on aspirationlevels for organizational profitability (Audia et al.,2000; Bromiley, 1991; Greve, 1998).
The findings come with some cautions aboutgeneralizability. First, arguments on when manag-ers seek growth do not allow prediction of actualgrowth rates if technical or governance constraintscounteract growth attempts. The insurance indus-try is more easily scalable than many manufactur-ing industries, which may make it a good contextfor finding support for these predictions. On theother hand, mutual firms were common in thesedata and were more constrained by governancestructure than joint-stock firms. Hence it is unclearwhether other industries will show stronger orweaker growth reaction to goals for organizationalsize. It is important to test whether these findingshold for other industries as well, and it is especiallyso for manufacturing industries, in which strongsize effects on efficiency have often been seen.
Second, the ability to adjust organizational sizedepends on the relative strength of adaptation abil-ity and selection strength (Levinthal, 1991). It isnotable that many insurers could survive despitebeing far below minimum efficient size. Clearly, ifselection of organizations with inefficient size hadbeen strong in this population, the small organiza-tions would have been eliminated too quickly toshow how their reactions to size goals varied. How-ever, slow removal of weak organizations is fairlytypical in organizational populations (Carroll &Harrison, 1994), so contexts in which organizationsof inefficient size are eliminated rapidly may berare. In these data, a supplementary analysis of firmfailures showed that small firms were more likelyto fail. However, the total number of failures wastoo small to affect the size distribution much, eventhough most of the failed firms were small.
Limitations
Three important limitations are associated withthis study. First, some researchers have examinedthe effects of slack search on outcomes such asinnovations or risk taking (Greve, 2003a; Nohria &Gulati, 1996; Singh, 1986). Slack search seems lessrelevant to a study on organizational growth andthus was not included in this study. Still, it seemsvaluable to control for slack to ensure that unmea-sured effects of slack do not affect findings. Second,according to the theory developed here, growth isan intentional result of specific actions such asprice reductions, sales campaigns, and market en-try. This study examined the final outcome ofgrowth only, however, and did not show whichactions managers took to accomplish it. A supple-mentary analysis of market entries showed thatthey were affected by size relative to aspirationlevel in the same way as growth was, but marketentries were rare events that most likely were notthe main tool for growing. Research on both actionsand outcomes would be a valuable addition to theevidence presented here. Because organizationsmay take multiple actions in pursuit of size goals, apromising approach would be to apply broad mea-sures of competitive aggressiveness (Ferrier, 2001;Ferrier, Fhionnlaoich, Smith, & Grimm, 2002).
Finally, the theory developed here does not con-sider whether behavior changes if the failure toreach aspiration levels is of large magnitude orpersists for a long time. Others have suggested thatbehavior changes under such circumstances, as se-vere or long-lasting low performance may be seenas a threat or a sign of decline (Cameron, Kim, &Whetten, 1987; Staw, Sandelands, & Dutton, 1981).Such interpretations might reverse the predictionof higher risk taking at low levels of goal fulfillment(Audia & Greve, 2006; March & Shapira, 1992).Conversely, it may be of interest to investigatewhether long periods in states above aspiration lev-els affect behaviors. With the present theory, I as-sume temporal myopia (Levinthal & March, 1993),so it does not matter for firm behavior whether aspecific value of size relative to aspiration levelwas reached via a path of multiple years in a con-dition below aspiration level, multiple years aboveit, or years of oscillation. Temporal myopia is aparsimonious assumption, and thus a good startingpoint, but one could add theory that posits effectsof experience with goal fulfillment on the current-period responses.
These findings have implications for how weview the causes and effects of organizational size.My theory of organizational size goals is an impor-tant contrast to other theories of organizational size
2008 489Greve

because it contains only very basic assumptionsabout the motivations and capabilities of managers.The manager in this theory is less heroic than theprofit-maximizing manager with full knowledge ofoptimal size and less menacing than the power-hungry manager seeking to build the largest possi-ble organization. The manager pursuing size goalsseems more human than the other two and moreprone to the type of nonoptimal behavior known asthe honest mistake.
My theory of organizational size goals raises thequestion of what conditions would make managersprone to having aspiration levels that differed fromthe optimal size. Clearly, good information abouthow size relates to performance would free manag-ers from judging size through social comparison.Cognitive maps of an industry would help by iden-tifying which other firms have the most similarstrategies and thus are the most relevant for makingjudgments about organizational size (Baum & Lant,2003; Porac & Thomas, 1990). An unfavorable con-dition would be biased information from press cov-erage of unusual firms such as the largest or mostsuccessful (Strang & Macy, 2001). Another unfavor-able condition would arise when an organizationalpopulation has high diversity in strategies, as whenspecialists and generalists are mixed. Usually spe-cialists are small because they occupy limited andoften peripheral niches in a market. A managerwho ignores these differences while forming anaspiration level in a population of small specialistsand large generalists will likely aspire to a size toosmall for a generalist and too large for a specialist.It may be because of this relationship that studiesoften show that organizations of intermediate sizeare vulnerable to failure (Boone et al., 2004; Han-nan, Ranger-Moore, & Banaszak-Holl, 1990).
Conclusion
Organizational growth driven by sequential at-tention to goals of performance and size is a spe-cific proposition drawn from the behavioral theoryof the firm (Cyert & March, 1963). It is an old yetunderinvestigated idea, and it yielded promisingfindings in a longitudinal study of general insur-ance firms. This work opens several opportunitiesfor additional research. First, it would be interest-ing to investigate which goals other than profitabil-ity and size affect organizational behaviors. Arethere other goals that are general enough to besubject to social comparison among many organi-zations, or do organizations instead have uniquegoals that are results of their specific dominantcoalitions? Second, this work raises the question ofhow general the pattern of sequential attention is.
Will other goal variables also show different effectsdepending on firm performance? Is it correct toplace firm performance first in the attention se-quence, or are attention sequences more variableacross firms? Third, these findings seem to imply aneed to revisit research on behaviors that affectfirm size. Are mergers done primarily because offirm experience and availability of good targets, ordo firms’ aspiration levels for size influence theirpursuit? Despite the progress made here and inother recent research on multiple organizationalgoals (Audia & Brion, 2007; Baum et al., 2005;McNamara et al., 2002), organizational responses togoals still define a research area where importantquestions remain unexplored.
REFERENCES
Aiken, L. S., & West, S. G. 1991. Multiple regression:Testing and interpreting interactions. NewburyPark, CA: Sage.
Armstrong, J. S., & Collopy, F. 1996. Competitor orienta-tion: Effects of objectives and information on mana-gerial decisions and profitability. Journal of Mar-keting Research, 33: 188.
Audia, P. G., & Brion, S. 2007. Reluctant to change:Self-enhancing responses to diverging performancemeasures. Organizational Behavior and HumanDecision Processes, 102: 255–269.
Audia, P. G., & Greve, H. R. 2006. Less likely to fail? Lowperformance, firm size, and factory expansion in theshipbuilding industry. Management Science, 52:83–94.
Audia, P. G., Locke, E. A., & Smith, K. G. 2000. Theparadox of success: An archival and a laboratorystudy of strategic persistence following a radical en-vironmental change. Academy of ManagementJournal, 43: 837–853.
Audia, P. G., & Sorenson, O. 2001. A multilevel analysisof organizational success and inertia. Unpublishedmanuscript, London School of Business.
Baker, D. D., & Cullen, J. B. 1993. Administrative reor-ganization and configurational context: The contin-gent effects of age, size, and change in size. Acad-emy of Management Journal, 36: 1251.
Barnett, W. P., & Carroll, G. R. 1987. Competition andmutualism among early telephone companies. Ad-ministrative Science Quarterly, 32: 400–421.
Barron, D. N., West, E., & Hannan, M. T. 1995. A time togrow and a time to die: Growth and mortality ofcredit unions in New York City, 1914–1990. Amer-ican Journal of Sociology, 100: 381–421.
Baum, J. A. C., & Haveman, H. A. 1997. Love thy neigh-bor? Differentiation and agglomeration in the Man-hattan hotel industry, 1898–1990. AdministrativeScience Quarterly, 42: 304–338.
490 JuneAcademy of Management Journal

Baum, J. A. C., & Korn, H. J. 1996. Competitive dynamicsof interfirm rivalry. Academy of Management Jour-nal, 39: 255–291.
Baum, J. A. C., & Lant, T. K. 2003. Hits and misses:Managers’ (mis)categorization of competitors in theManhattan hotel industry. In J. A. C. Baum & O.Sorenson (Eds.), Geography and strategy: Ad-vances in strategic management, vol. 20: 119–156.Oxford, U.K.: JAI Press/Elsevier.
Baum, J. A. C., Rowley, T. J., Shipilov, A. V., & Chuang,Y. T. 2005. Dancing with strangers: Aspiration per-formance and the search for underwriting syndicatepartners. Administrative Science Quarterly, 50:536–575.
Berle, A. A., & Means, G. C. 1965. The modern corpora-tion and private property. New York: MacMillan.
Boeker, W. 1997. Executive migration and strategicchange: The effect of top manager movement onproduct-market entry. Administrative ScienceQuarterly, 42: 213–236.
Bolton, M. K. 1993. Organizational innovation and sub-standard performance: When is necessity the motherof innovation. Organization Science, 4: 57–75.
Boone, C., Carroll, G. R., & van Witteloostuijn, A. 2004.Size, differentiation and the performance of Dutchdaily newspapers. Industrial and CorporateChange, 13: 117–148.
Bridges, W. P., & Villemez, W. J. 1991. Employmentrelations and the labor market: Integrating institu-tional and market perspectives. American Sociolog-ical Review, 56: 748–764.
Bromiley, P. 1991. Testing a causal model of corporaterisk taking and performance. Academy of Manage-ment Journal, 34: 37–59.
Cameron, K. S., Kim, M. U., & Whetten, D. A. 1987.Organizational effects of decline and turbulence. Ad-ministrative Science Quarterly, 32: 222–240.
Carroll, G. R., & Harrison, J. R. 1994. On the historicalefficiency of competition between organizationalpopulations. American Journal of Sociology, 100:720–49.
Carroll, G. R., & Swaminathan, A. 2000. Why the micro-brewery movement? Organizational dynamics of re-source partitioning in the U.S. brewing industry.American Journal of Sociology, 106: 715–762.
Chen, M.-J. 1996. Competitive analysis and interfirm ri-valry: Toward a theoretical integration. Academy ofManagement Review, 21: 100–134.
Chen, M.-J., & Hambrick, D. C. 1995. Speed, stealth, andselective attack: How small firms differ from largefirms in competitive behavior. Academy of Man-agement Journal, 38: 453–482.
Chen, M.-J., & MacMillan, I. C. 1992. Nonresponse anddelayed response to competitive moves. Academy ofManagement Journal, 35: 539–570.
Clark, B. H., & Montgomery, D. B. 1999. Managerial iden-tification of competitors. Journal of Marketing,63(3): 67–83.
Cobb, C. W., & Douglas, P. H. 1928. A theory of produc-tion. American Economic Review, 18 (supplement):139–165.
Cyert, R. M., & March, J. G. 1963. A behavioral theory ofthe firm. Englewood Cliffs, NJ: Prentice-Hall.
Dalton, D. R., & Kesner, I. F. 1985. Organizational growth:Big is beautiful. Journal of Business Strategy, 6(1):38–48.
Davis, G. F., Diekmann, K. A., & Tinsley, C. H. 1994. Thedecline and fall of the conglomerate firm in the1980s: The deinstitutionalization of an organization-al form. American Sociological Review, 59: 547–570.
Deephouse, D. L. 1996. Does isomorphism legitimate?Academy of Management Journal, 39: 1024–1039.
Delacroix, J., & Swaminathan, A. 1991. Cosmetic, specu-lative and adaptive organizational change in the Cal-ifornia wine industry. Administrative ScienceQuarterly, 36: 631–661.
DiMaggio, P. J., & Powell, W. W. 1983. The iron cagerevisited: Institutional isomorphism and collectiverationality in organizational fields. American Socio-logical Review, 48: 147–160.
Donaldson, T., & Preston, L. E. 1995. The stakeholdertheory of the corporation: Concepts, evidence, andimplications. Academy of Management Review,20: 65–91.
Dutton, J. E., & Dukerich, J. M. 1991. Keeping an eye inthe mirror: Image and identity in organizational ad-aptation. Academy of Management Journal, 34:517–554.
Edmunds, S. W. 1981. Organizational size and efficiencyin the US. Antitrust Bulletin, 26: 507–519.
Ehlrich, I., & Becker, G. 1972. Market insurance, self-insurance, and self-protection. Journal of PoliticalEconomy, 80: 623–648.
Fama, E. F. 1980. Agency problems and the theory of thefirm. Journal of Political Economy, 88: 288–307.
Ferrier, W. J. 2001. Navigating the competitive land-scape: The drivers and consequences of competitiveaggressiveness. Academy of Management Journal,44: 858–877.
Ferrier, W. J., Fhionnlaoich, C. M., Smith, K. G., &Grimm, C. M. 2002. The impact of performance dis-tress on aggressive competitive behavior: A reconcil-iation of conflicting views. Managerial and Deci-sion Economics, 23: 301–316.
Festinger, L. 1954. A theory of social comparison pro-cesses. Human Relations, 7: 117–140.
Fiegenbaum, A., & Thomas, H. 1988. Attitudes towardsrisk and the risk return paradox: Prospect theory
2008 491Greve
explanations. Academy of Management Journal,31: 395–407.
Fiegenbaum, A., & Thomas, H. 1995. Strategic groups asreference groups: Theory, modeling and empiricalexamination of industry and competitive strategy.Strategic Management Journal, 16: 461–476.
Gimeno, J. 1999. Reciprocal threats in multimarket ri-valry: Staking out “spheres of influence” in the U. S.airline industry. Strategic Management Journal,20: 101–128.
Gimeno, J., & Woo, C. Y. 1996. Hypercompetition in amultimarket environment: The role of strategic sim-ilarity and multimarket contact in competitive de-escalation. Organization Science, 7: 322–341.
Gooding, R. Z., & Wagner, J. A. 1985. A meta-analyticreview of the relationship between size and perfor-mance: The productivity and efficiency of organiza-tions and their subunits. Administrative ScienceQuarterly, 30: 462–481.
Greene, W. H. 1993. Econometric analysis (2nd ed.).New York: Macmillan.
Greve, H. R. 1998. Performance, aspirations, and riskyorganizational change. Administrative ScienceQuarterly, 44: 58–86.
Greve, H. R. 2003a. A behavioral theory of R&D expen-ditures and innovation: Evidence from shipbuilding.Academy of Management Journal, 46: 685–702.
Greve, H. R. 2003b. Investment and the behavioral theoryof the firm: Evidence from shipbuilding. Industrialand Corporate Change, 12: 1051–1076.
Greve, H. R. 2003c. Organizational learning from per-formance feedback: A behavioral perspective oninnovation and change. Cambridge, U.K.: Cam-bridge University Press.
Greve, H. R., & Rao, H. 2006. If it doesn’t kill you: Learn-ing from ecological competition. In J. A. C. Baum,S. D. Dobrev, & A. van Witteloostuijn (Eds.), Ecologyand strategy: Advances in strategic management,23: 243–271. Oxford, U.K.: Elsevier.
Haleblian, J., Kim, J.-Y., & Rajagopalan, N. 2005. Theinfluence of acquisition experience and performanceon acquisition behavior: Evidence from the U.S.commercial banking industry. Academy of Manage-ment Journal, 49: 357–370.
Hambrick, D. C., Cho, T. S., & Chen, M.-J. 1996. Theinfluence of top management team heterogeneity onfirms’ competitive moves. Administrative ScienceQuarterly, 41: 659–684.
Hambrick, D. C., & D’Aveni, R. A. 1988. Large corporatefailures as downward spirals. Administrative Sci-ence Quarterly, 33: 1–23.
Hannan, M. T. & Freeman, J. 1984. Structural inertia andorganizational change. American Sociological Re-view, 49: 149–164.
Hannan, M. T., Ranger-Moore, J. R., & Banaszak-Holl, J.
1990. Competition and the evolution of organization-al size distributions. In J. V. Singh (Ed.), Organiza-tional evolution: 246–268. Newbury Park, CA: Sage.
Haunschild, P. R. 1993. Interorganizational imitation:The impact of interlocks on corporate acquisitionactivity. Administrative Science Quarterly, 38:564–592.
Haunschild, P. R., & Miner, A. S. 1997. Modes of interor-ganizational imitation: The effects of outcome sa-lience and uncertainty. Administrative ScienceQuarterly, 42: 472–500.
Haveman, H. A. 1993a. Follow the leader: Mimetic iso-morphism and entry into new markets. Administra-tive Science Quarterly, 38: 593–627.
Haveman, H. A. 1993b. Organizational size and change:Diversification in the savings and loan industry afterderegulation. Administrative Science Quarterly,38: 20–50.
Heath, C., Larrick, R. P., & Wu, G. 1999. Goals as refer-ence points. Cognitive Psychology, 38: 79–109.
Hirsch, P. M. 1986. From ambushes to golden parachutes:Corporate takeovers as an instance of cultural fram-ing and institutional integration. American Journalof Sociology, 91: 800–837.
Hoffman, A. J. 1999. Institutional evolution and change:Environmentalism and the U.S. chemical industry.Academy of Management Journal, 42: 351–371.
Johnson, J. E., Flanigan, G. B., & Weisbart, S. N. 1981.Returns to scale in the property and liability insur-ance industry. Journal of Risk and Insurance, 48:18–45.
Kahneman, D., & Tversky, A. 1979. Prospect theory: Ananalysis of decision under risk. Econometrica, 47:263–291.
Khaled, M., Adams, M. B., & Pickford, M. 2001. Estimatesof scale and scope economies in the New Zealandlife insurance industry. The Manchester School, 69:327–349.
Kimberly, J. R. 1976. Organizational size and the struc-turalist perspective: A review, critique, and pro-posal. Administrative Science Quarterly, 21: 571–597.
Kuehberger, A. 1998. The influence of framing on riskydecisions: A meta-analysis. Organizational Behav-ior and Human Decision Processes, 75: 23–55.
Lant, T. K. 1992. Aspiration level adaptation: An em-pirical exploration. Management Science, 38:623– 644.
Lant, T. K., & Baum, J. A. C. 1995. Cognitive sources ofsocially constructed competitive groups: Examplesfrom the Manhattan hotel industry. In W. R. Scott &S. Christensen (Eds.), The institutional constructionof organizations: International and longitudinalstudies: 15–38. Thousand Oaks, CA: Sage.
Lant, T. K., Milliken, F. J., & Batra, B. 1992. The role of
492 JuneAcademy of Management Journal

managerial learning and interpretation in strategicpersistence and reorientation: An empirical explora-tion. Strategic Management Journal, 13: 585–608.
Levinthal, D. A. 1991. Organizational adaptation and en-vironmental selection: Interrelated processes ofchange. Organization Science, 2: 140–145.
Levinthal, D. A., & March, J. G. 1993. The myopia oflearning. Strategic Management Journal, 14: 95–112.
Locke, E. A., Frederick, E., Buckner, E., & Bobko, P. 1984.Effect of previously assigned goals on self-set goalsand performance. Journal of Applied Psychology,69: 694–699.
Locke, E. A., & Latham, G. P. 1990. A theory of goalsetting and task performance. Englewood Cliffs, NJ:Prentice-Hall.
March, J. G., & Shapira, Z. 1992. Variable risk preferencesand the focus of attention. Psychological Review,99: 172–183.
March, J. G., & Simon, H. 1958. Organizations. NewYork: Wiley.
Matsusaka, J. G. 1993. Takeover motives during the con-glomerate merger wave. RAND Journal of Econom-ics, 24: 357–379.
McNamara, G., & Bromiley, P. 1997. Decision making inan organizational setting: Cognitive and organization-al influences on risk assessment in commercial lend-ing. Academy of Management Journal, 40: 1063–1088.
McNamara, G., Deephouse, D. L., & Luce, R. A. 2003.Competitive positioning within and across a strate-gic group structure: The performance of core, sec-ondary and solitary firms. Strategic ManagementJournal, 24: 161–181.
McNamara, G., Moon, H., & Bromiley, P. 2002. Bankingon commitment: Intended and unintended conse-quences of an organization’s attempt to attenuateirrational commitment. Academy of ManagementJournal, 45: 443–452.
Mezias, S. J., Chen, Y. R., & Murphy, P. R. 2002. Aspira-tion-level adaptation in an American financial ser-vices organization: A field study. ManagementScience, 48: 1285–1300.
Miller, C. T. 1982. The role of performance-related sim-ilarity in social comparison of abilities: A test of therelated attributes hypothesis. Journal of Experimen-tal Social Psychology, 18: 513–523.
Miller, K. D., & Chen, W.-R. 2004. Variable organizationalrisk preferences: Tests of the March-Shapira model.Academy of Management Journal, 47: 105–115.
Nickel, M. N., & Rodriguez, M. C. 2002. A review ofresearch on the negative accounting relationship be-tween risk and return: Bowman’s paradox. Omega,30: 1–18.
Nohria, N., & Gulati, R. 1996. Is slack good or bad for
innovation? Academy of Management Journal, 39:1245–1264.
Palmer, D., Barber, B. M., Zhou, X., & Soysal, Y. 1995.The friendly and predatory acquisition of large U.S.corporations in the 1960s: The other contested ter-rain. American Sociological Review, 60: 469–499.
Penrose, E. T. 1959. The theory of the growth of thefirm. New York: Wiley.
Pfeffer, J. 1972. Merger as a response to organizationalinterdependence. Administrative Science Quar-terly, 17: 382–394.
Phifer, R. 1996. Reinsurance fundamentals. New York:Wiley.
Porac, J. F., & Thomas, H. 1990. Taxonomic mental mod-els in competitor definition. Academy of Manage-ment Review, 15: 224–240.
Porac, J. F., Thomas, H., & Baden-Fuller, C. 1989. Com-petitive groups as cognitive communities: The caseof Scottish knitwear manufacturers. Journal of Man-agement Studies, 26: 397–416.
Porac, J. F., Thomas, H., Wilson, F., Paton, D., & Kanfer,A. 1995. Rivalry and the industry model of Scottishknitwear producers. Administrative Science Quar-terly, 40: 203–227.
Reger, R. K., & Huff, A. S. 1993. Strategic groups: Acognitive perspective. Strategic Management Jour-nal, 14: 103–124.
Rotschild, M., & Stiglitz, J. 1976. Equilibrium in compet-itive insurance markets: An essay on the economicsof imperfect information. Quarterly Journal of Eco-nomics, 90: 629–650.
Scherer, F. M., Beckenstein, A., Kaufer, E., Murphy,D. R., & Bougeon-Massen, F. 1975. The economics ofmulti-plant operation: An international compara-tive study. Cambridge, MA: Harvard UniversityPress.
Schneider, S. L. 1992. Framing and conflict: Aspirationlevel contingency, the status quo, and current theo-ries of risky choice. Journal of Experimental Psy-chology: Learning, Memory, and Cognition, 18:1040–1057.
Singh, J. V. 1986. Performance, slack, and risk taking inorganizational decision making. Academy of Man-agement Journal, 29: 562–585.
Smith, K. G., Ferrier, W. J., & Grimm, C. M. 2001. King ofthe hill: Dethroning the industry leader. Academy ofManagement Executive, 15(1): 59–70.
Smith, K. G., Ferrier, W. J., & Ndofor, H. 2001. Competi-tive dynamics research: Critique and future direc-tions. In M. A. Hitt, R. E. Freeman, & J. S. Harrison(Eds.), The Blackwell handbook of strategic man-agement: 315–361. Oxford, U.K.: Blackwell.
Staw, B. M., Sandelands, L. E., & Dutton, J. E. 1981.Threat-rigidity effects in organizational behavior: A
2008 493Greve

multi-level analysis. Administrative Science Quar-terly, 26: 501–524.
Strang, D., & Macy, M. W. 2001. In search of excellence:Fads, success stories, and adaptive emulation.American Journal of Sociology, 107: 147–182.
Strang, D., & Soule, S. A. 1998. Diffusion in organizationsand social movements: From hybrid corn to poisonpills. In J. Hagan & K. Cook (Eds.), Annual review ofsociology, vol. 24: 265–290. Palo Alto, CA: AnnualReviews.
Sutton, J. R., & Dobbin, F. R. 1996. The two faces ofgovernance: Responses to legal uncertainty in U.S.firms, 1955 to 1985. American Sociological Review,61: 794–811.
Venezian, E. C. 1984. Efficiency and equity in insurance.Journal of Risk and Insurance, 52: 190–204.
Viswanathan, K. S., & Cummins, J. D. 2003. Ownershipstructure changes in the insurance industry: Ananalysis of demutualization. Journal of Risk andInsurance, 70: 401–437.
Westphal, J. D., Seidel, M.-D., & Stewart, K. J. 2001.
Second-order imitation: Uncovering latent effects ofboard network ties. Administrative Science Quar-terly, 46: 717–747.
Wood, J. V. 1989. Theory and research concerning socialcomparisons of personal attributes. PsychologicalBulletin, 106: 213–248.
Zuckerman, E. W. 2000. Focusing the corporate product:Securities analysts and de-diversification. Adminis-trative Science Quarterly, 45: 591–619.
Henrich R. Greve ([email protected]) is a pro-fessor of entrepreneurship and organizational behaviorand INSEAD Chair in Organization and ManagementTheory at INSEAD. He received his Ph.D. in business atthe Graduate School of Business, Stanford University.His research examines learning and strategy in networks,performance feedback effects on organizational change,and identities of newly founded organizations.
494 JuneAcademy of Management Journal
