a 60-acre retail development
TRANSCRIPT

A 60-Acre Retail Development
Highway 71 @ FM 304
Bastrop, Texas

Presented By:
Derek Quinn (512) 628-5354 [email protected]
Justin Poses (512) 628-5358
Steve Durhman (512) 628-5351 [email protected]
100 E. Anderson Lane Suite 200
Austin, TX 78752 Main Tel: (512) 833-6444

Table of Contents
1 Executive Summary Bastrop Summary
2 Maps and Aerials
Central Texas Map Aerial Photos Bastrop Country Residential Map
3 Demographic Information
Retail Market Study Zip Code Demographics Scan/US Demographic Reports
4 Transportation Information
Traffic Counts & Highway 71 On/Off Ramps SH-130 Roadway Map
5 Site Plans

Executive Summary
PROJECT DESCRIPTION Burleson Crossing is a 550,000 square foot retail development located on Highway 71 at State Highway 304 in Bastrop, Texas. The Site is located on the north side of Highway 71, where the majority of Bastrop’s population resides.
The Shopping Center features:
• Lowe’s Home Improvement
• Academy Sports & Outdoors
• Approx. 205,000 SF of Jr. Anchor Space including Hobby Lobby, Best Buy, Petco, Specs Liquors, Staples, TJ Maxx, Ross Dress For Less, Ulta, Five Below, Maurices, Rack Room Shoes and rue21
• 40,000 SF of smaller retail space including AT&T, Subway, Great Clips, Mattress Firm, Castle Dental, Wingstop, Subway, FastMed, Double Dave's Pizza & Bastrop Family Eye Care
• 2 pad sites available
LAND AREA + 60 acres(Additional Land Available)
POPULATION Bastrop (2016): 8,672 Bastrop County (2016): 82,733 Bastrop Trade Area (2016): 187,000+
TRAFFIC COUNTS (2015) Highway 71 52,798 vpd

AAA 111 000 ,,, 000 000 000 AAA CCC RRR EEE
MMM AAA SSS TTT EEE RRR PPP LLL AAA NNN NNN EEE DDD
CCC OOO MMM MMM UUU NNN III TTT YYY WWW III TTT HHH
777 ,,, 000 000 000 +++ HHH OOO MMM EEE SSS cr-invests.com
PRIMARY ENTRANCE
PRIMARY ENTRANCE
HHH YYY AAA TTT TTT LLL OOO SSS TTT PPP III NNN EEE SSS
RRR EEE SSS OOO RRR TTT &&& SSS PPP AAA
TTT HHH EEE CCC OOO LLL OOO NNN YYY
HHH UUU NNN TTT EEE RRR ''' SSS CCC RRR OOO SSS SSS III NNN GGG
CEDAR CREEK
HIGH SCHOOL
PPPRRROOOPPPOOOSSSEEEDDD CCCEEENNNTTT RRRAAALLL
TTT EEEXXXAAASSS RRREEEGGGIII OOONNNAAALLL AAAIII RRRPPPOOORRRTTT
AAA NNN DDD EEE CCC OOO --- MMM EEE RRR GGG EEE GGG RRR EEE EEE NNN
BBB UUU SSS III NNN EEE SSS SSS PPP AAA RRR KKK
AAUUSSTTIINN--BBEERRGGSSTTRROOMM
IINNTTEERRNNAATTIIOONNAALL
AAIIRRPPOORRTT
LLLAAAKKKEEE
BBBAAASSSTTT RRROOOPPP
FFFOOORRRMMMUUU LLLAAA OOONNNEEE
RRRAAACCCEEE TTT RRRAAACCCKKK
BBB AAASSS TTTRRR OOOPPP HHH IIIGGGHHH SSS CCC HHH OOOOOO LLL

BASTROP TRADE AREA
► The population in the trade area is
180,000+ (2015). The trade area
shown accounts for 91% of the
shoppers in Bastrop. Shoppers are
visiting an average of six times per
month. (1)
According to The United States
Postal Service, in February 2013
there were 67,419 active residential
postal drops in the trade area, which
equates to a trade area population
of 194,167 (factoring 2.88 persons
per household (1)).
► Of the total households, 21% have
income levels between $50,000 and
$74,999, which is the largest
segment. (1) The average household
income is $64,246. (1)
► The Bastrop Independent School
District has a total population of
approximately 48,000.
► The Bastrop trade area has a current
ratio of 1.13 square feet of retail
space per capita. Nationally, the
ratio is just over 20 square feet per
capita.
(1)Source: ESRI Demographics
(512) 833 -6444

COLORADO RIVER
COLORADO RIVER
DOWNTOWNDOWNTOWN
BASTROPBASTROP
FUTUREFUTURE
XS RANCHXS RANCH
++ 9,600 ACRES9,600 ACRES
7,000 HOME SITES7,000 HOME SITES
NEW BRIDGENEW BRIDGE
OVEROVER
COLORADO RIVERCOLORADO RIVER
COLORADO RIVERCOLORADO RIVER

7,020 SF
2,352 SF
1,375 SF

COVERT AUTO DEALERSHIP
DOWNTOWN BASTROP

PLAZA
BLDG. J BLDG. R
BLDG. K
PRIME RESTAURANT SPACE WITH
PATIO AVAILABLE
1,375 SF AVAILABLE
3.57 ACRE PAD SITE AVAILABLE
(CAN BE DIVIDED)
12,000 - 22,000 SF AVAILABLE
2,352 SF AVAILABLE
1,200 - 5,000 SF AVAILABLE
WIN
GS
TOP


Prepared forBastrop Economic Development Corporation/City of BastropNovember 2017
RETAIL TRADE AREAGAP/OPPORTUNITY ANALYSISBastrop, Texas

2
RETAIL TRADE AREABastrop, Texas
Bastrop Economic Development Corporation/City of Bastrop | 301 Highway 71 West, Suite 214 | Bastrop, Texas 78602 | 512.303.9700 | [email protected] | www.bastropedc.org
SHAWN A. KIRKPATRICK, EXECUTIVE DIRECTORCONTACT

3
SECTOR DESCRIPTION POTENTIAL SALES ACTUAL SALES *LEAKAGE/SURPLUS †LEAKAGE INDEX
Total Retail Sales Incl Eating and Drinking Places $2,935,965,059 $415,352,623 $2,520,612,436 0.141
441 Motor Vehicle and Parts Dealers $654,622,254 $134,716,112 $519,906,142 0.206
4411 Automotive Dealers $563,430,344 $116,708,158 $446,722,186 0.207
4412 Other Motor Vehicle Dealers $36,608,731 $2,804,162 $33,804,569 0.077
4413 Automotive Parts/Accsrs, Tire Stores $54,583,178 $15,203,792 $39,379,386 0.279
442 Furniture and Home Furnishings Stores $66,791,259 $11,672,060 $55,119,199 0.175
4421 Furniture Stores $38,388,647 $8,764,398 $29,624,249 0.228
4422 Home Furnishing Stores $28,402,612 $2,907,662 $25,494,950 0.102
443 Electronics and Appliance Stores $105,833,475 $17,007,896 $88,825,579 0.161
44311 Appliances, TVs, Electronics Stores $52,916,737 $8,503,948 $44,412,789 0.161
443111 Household Appliances Stores $6,818,230 $612,465 $6,205,765 0.090
443112 Electronics Stores $46,098,508 $7,891,483 $38,207,025 0.171
444 Building Material, Garden Equip Stores $289,975,880 $64,207,401 $225,768,479 0.221
4441 Building Material and Supply Dealers $266,191,116 $62,043,696 $204,147,420 0.233
44411 Home Centers $103,242,400 $32,570,195 $70,672,205 0.315
44412 Paint and Wallpaper Stores $7,399,835 $2,231,064 $5,168,771 0.302
44413 Hardware Stores $24,484,616 $0 $24,484,616 0.000
44419 Other Building Materials Dealers $131,064,264 $27,242,437 $103,821,827 0.208
444191 Building Materials, Lumberyards $48,900,369 $10,164,216 $38,736,153 0.208
4442 Lawn, Garden Equipment, Supplies Stores $23,784,764 $2,163,705 $21,621,059 0.091
44421 Outdoor Power Equipment Stores $3,514,948 $0 $3,514,948 0.000
44422 Nursery and Garden Centers $20,269,816 $2,163,705 $18,106,111 0.107
RETAIL TRADE AREA • GAP/OPPORTUNITY ANALYSISBastrop, Texas
*Positive numbers denote leakage, negative numbers denote a surplus.†A Leakage Index of greater than 1.0 means that the community retail sales include shoppers from outside the trade area (surplus). If the index is less than 1.0, the members of the community are shopping outside of the community for their retail needs.

4
SECTOR DESCRIPTION POTENTIAL SALES ACTUAL SALES *LEAKAGE/SURPLUS †LEAKAGE INDEX
445 Food and Beverage Stores $370,715,381 $21,260,914 $349,454,467 0.057
4451 Grocery Stores $337,264,611 $20,264,711 $316,999,900 0.060
44511 Supermarkets, Grocery (Ex Conv) Stores $309,826,028 $17,107,262 $292,718,766 0.055
44512 Convenience Stores $27,438,583 $3,157,449 $24,281,134 0.115
4452 Specialty Food Stores $14,529,072 $470,067 $14,059,005 0.032
4453 Beer, Wine and Liquor Stores $18,921,697 $526,136 $18,395,561 0.028
446 Health and Personal Care Stores $181,052,406 $33,097,396 $147,955,010 0.183
44611 Pharmacies and Drug Stores $144,399,034 $22,384,286 $122,014,748 0.155
44612 Cosmetics, Beauty Supplies, Perfume Stores $17,879,713 $7,678,708 $10,201,005 0.429
44613 Optical Goods Stores $5,836,387 $850,326 $4,986,061 0.146
44619 Other Health and Personal Care Stores $12,937,273 $2,184,076 $10,753,197 0.169
447 Gasoline Stations $226,066,499 $82,676,448 $143,390,051 0.366
44711 Gasoline Stations With Conv Stores $123,147,927 $0 $123,147,927 0.000
44719 Other Gasoline Stations $102,918,573 $82,676,448 $20,242,125 0.803
448 Clothing and Clothing Accessories Stores $127,135,534 $4,106,146 $123,029,388 0.032
4481 Clothing Stores $93,227,093 $2,422,805 $90,804,288 0.026
44811 Men’s Clothing Stores $3,645,507 $0 $3,645,507 0.000
44812 Women’s Clothing Stores $20,091,592 $0 $20,091,592 0.000
44813 Childrens, Infants Clothing Stores $4,411,531 $0 $4,411,531 0.000
44814 Family Clothing Stores $52,698,201 $1,341,739 $51,356,462 0.025
44815 Clothing Accessories Stores $4,798,931 $335,037 $4,463,894 0.070
44819 Other Clothing Stores $7,581,332 $746,029 $6,835,303 0.098
4482 Shoe Stores $18,882,937 $937,572 $17,945,365 0.050
4483 Jewelry, Luggage, Leather Goods Stores $15,025,503 $745,769 $14,279,734 0.050
44831 Jewelry Stores $13,628,005 $745,769 $12,882,236 0.055
44832 Luggage and Leather Goods Stores $1,397,498 $0 $1,397,498 0.000
RETAIL TRADE AREA • GAP/OPPORTUNITY ANALYSISBastrop, Texas
*Positive numbers denote leakage, negative numbers denote a surplus.†A Leakage Index of greater than 1.0 means that the community retail sales include shoppers from outside the trade area (surplus). If the index is less than 1.0, the members of the community are shopping outside of the community for their retail needs.
5
RETAIL TRADE AREA • GAP/OPPORTUNITY ANALYSISBastrop, Texas
SECTOR DESCRIPTION POTENTIAL SALES ACTUAL SALES *LEAKAGE/SURPLUS †LEAKAGE INDEX
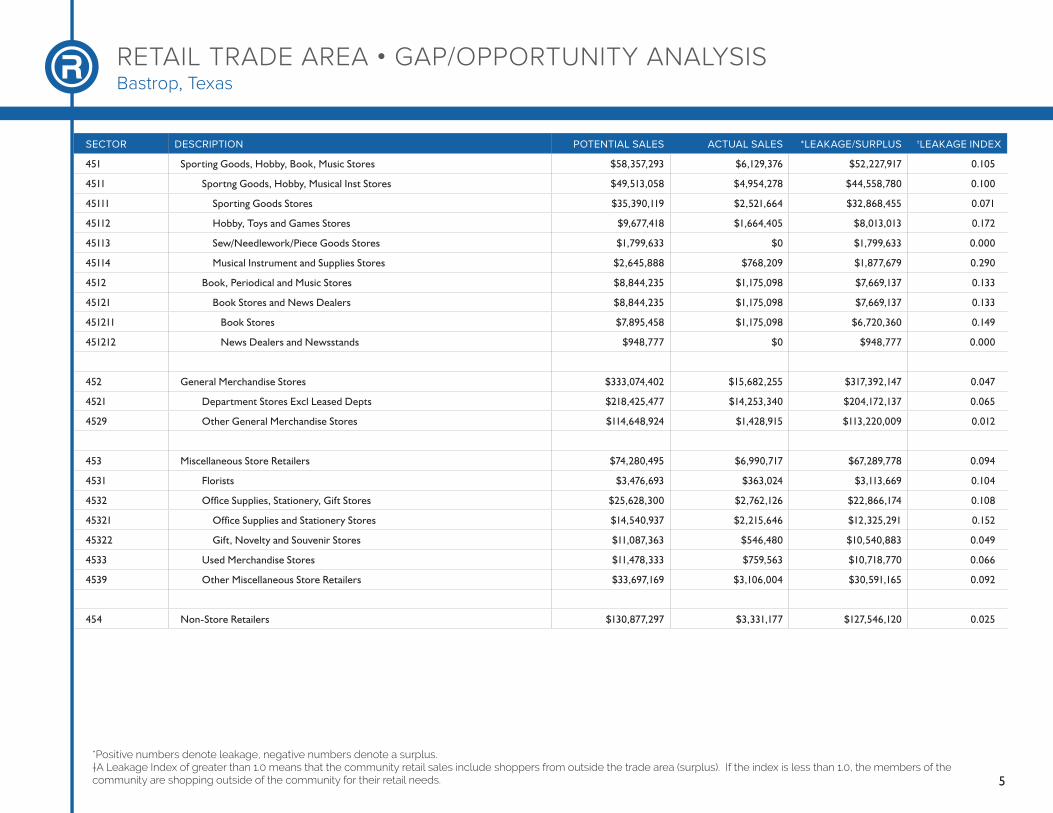
451 Sporting Goods, Hobby, Book, Music Stores $58,357,293 $6,129,376 $52,227,917 0.105
4511 Sportng Goods, Hobby, Musical Inst Stores $49,513,058 $4,954,278 $44,558,780 0.100
45111 Sporting Goods Stores $35,390,119 $2,521,664 $32,868,455 0.071
45112 Hobby, Toys and Games Stores $9,677,418 $1,664,405 $8,013,013 0.172
45113 Sew/Needlework/Piece Goods Stores $1,799,633 $0 $1,799,633 0.000
45114 Musical Instrument and Supplies Stores $2,645,888 $768,209 $1,877,679 0.290
4512 Book, Periodical and Music Stores $8,844,235 $1,175,098 $7,669,137 0.133
45121 Book Stores and News Dealers $8,844,235 $1,175,098 $7,669,137 0.133
451211 Book Stores $7,895,458 $1,175,098 $6,720,360 0.149
451212 News Dealers and Newsstands $948,777 $0 $948,777 0.000
452 General Merchandise Stores $333,074,402 $15,682,255 $317,392,147 0.047
4521 Department Stores Excl Leased Depts $218,425,477 $14,253,340 $204,172,137 0.065
4529 Other General Merchandise Stores $114,648,924 $1,428,915 $113,220,009 0.012
453 Miscellaneous Store Retailers $74,280,495 $6,990,717 $67,289,778 0.094
4531 Florists $3,476,693 $363,024 $3,113,669 0.104
4532 Office Supplies, Stationery, Gift Stores $25,628,300 $2,762,126 $22,866,174 0.108
45321 Office Supplies and Stationery Stores $14,540,937 $2,215,646 $12,325,291 0.152
45322 Gift, Novelty and Souvenir Stores $11,087,363 $546,480 $10,540,883 0.049
4533 Used Merchandise Stores $11,478,333 $759,563 $10,718,770 0.066
4539 Other Miscellaneous Store Retailers $33,697,169 $3,106,004 $30,591,165 0.092
454 Non-Store Retailers $130,877,297 $3,331,177 $127,546,120 0.025
*Positive numbers denote leakage, negative numbers denote a surplus.†A Leakage Index of greater than 1.0 means that the community retail sales include shoppers from outside the trade area (surplus). If the index is less than 1.0, the members of the community are shopping outside of the community for their retail needs.

6
RETAIL TRADE AREA • GAP/OPPORTUNITY ANALYSISBastrop, Texas
SECTOR DESCRIPTION POTENTIAL SALES ACTUAL SALES *LEAKAGE/SURPLUS †LEAKAGE INDEX
722 Foodservice and Drinking Places $317,182,883 $14,474,725 $302,708,158 0.046
7223 Special Foodservices $19,083,136 $0 $19,083,136 0.000
7224 Drinking Places -Alcoholic Beverages $10,532,157 $0 $10,532,157 0.000
722511 Full Service Restaurants $140,952,481 $14,351,014 $126,601,467 0.102
722513 Limited Service Eating Places $130,322,202 $0 $130,322,202 0.000
722514 Cafeterias, Grill Buffets, and Buffets $5,343,473 $0 $5,343,473 0.000
722515 Snack and Non-alcoholic Beverage Bars $10,949,435 $123,711 $10,825,724 0.011
*Positive numbers denote leakage, negative numbers denote a surplus.†A Leakage Index of greater than 1.0 means that the community retail sales include shoppers from outside the trade area (surplus). If the index is less than 1.0, the members of the community are shopping outside of the community for their retail needs.
7
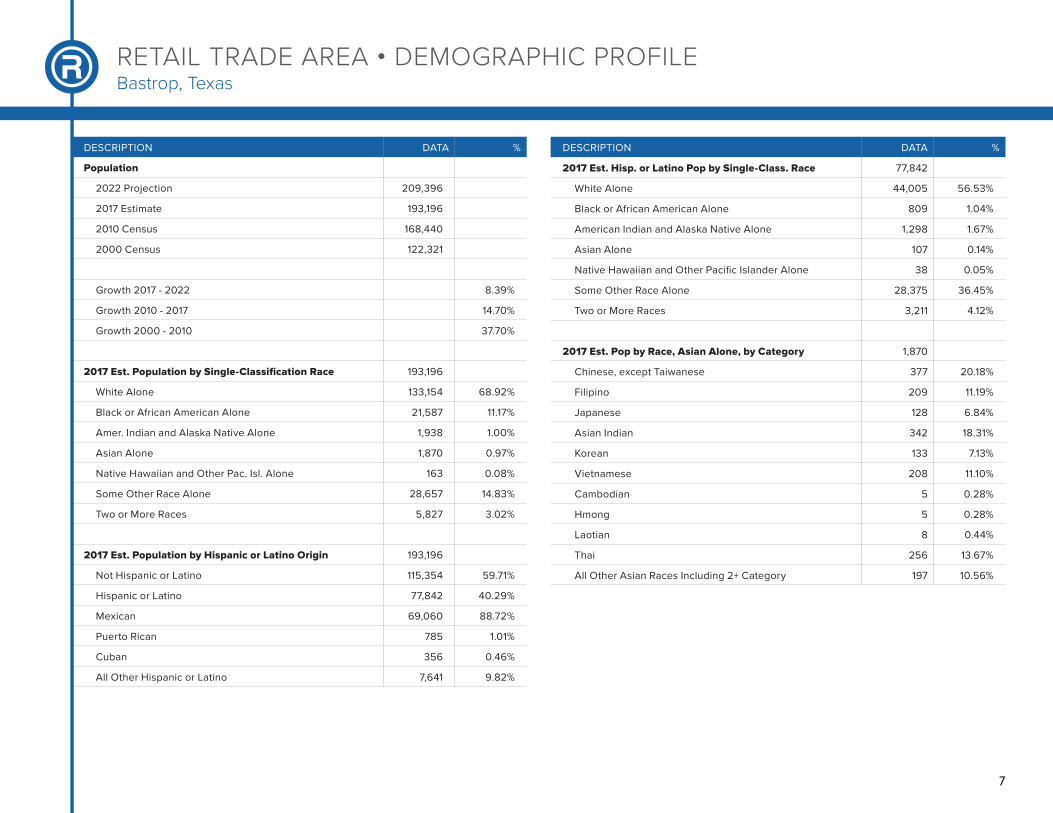
DESCRIPTION DATA %
Population
2022 Projection 209,396
2017 Estimate 193,196
2010 Census 168,440
2000 Census 122,321
Growth 2017 - 2022 8.39%
Growth 2010 - 2017 14.70%
Growth 2000 - 2010 37.70%
2017 Est. Population by Single-Classification Race 193,196
White Alone 133,154 68.92%
Black or African American Alone 21,587 11.17%
Amer. Indian and Alaska Native Alone 1,938 1.00%
Asian Alone 1,870 0.97%
Native Hawaiian and Other Pac. Isl. Alone 163 0.08%
Some Other Race Alone 28,657 14.83%
Two or More Races 5,827 3.02%
2017 Est. Population by Hispanic or Latino Origin 193,196
Not Hispanic or Latino 115,354 59.71%
Hispanic or Latino 77,842 40.29%
Mexican 69,060 88.72%
Puerto Rican 785 1.01%
Cuban 356 0.46%
All Other Hispanic or Latino 7,641 9.82%
DESCRIPTION DATA %
2017 Est. Hisp. or Latino Pop by Single-Class. Race 77,842
White Alone 44,005 56.53%
Black or African American Alone 809 1.04%
American Indian and Alaska Native Alone 1,298 1.67%
Asian Alone 107 0.14%
Native Hawaiian and Other Pacific Islander Alone 38 0.05%
Some Other Race Alone 28,375 36.45%
Two or More Races 3,211 4.12%
2017 Est. Pop by Race, Asian Alone, by Category 1,870
Chinese, except Taiwanese 377 20.18%
Filipino 209 11.19%
Japanese 128 6.84%
Asian Indian 342 18.31%
Korean 133 7.13%
Vietnamese 208 11.10%
Cambodian 5 0.28%
Hmong 5 0.28%
Laotian 8 0.44%
Thai 256 13.67%
All Other Asian Races Including 2+ Category 197 10.56%
RETAIL TRADE AREA • DEMOGRAPHIC PROFILEBastrop, Texas

8
DESCRIPTION DATA %
2017 Est. Population by Ancestry 193,196
Arab 78 0.04%
Czech 4,498 2.33%
Danish 141 0.07%
Dutch 620 0.32%
English 7,650 3.96%
French (except Basque) 2,055 1.06%
French Canadian 141 0.07%
German 22,736 11.77%
Greek 43 0.02%
Hungarian 129 0.07%
Irish 7,614 3.94%
Italian 1,745 0.90%
Lithuanian 72 0.04%
United States or American 7,630 3.95%
Norwegian 697 0.36%
Polish 1,355 0.70%
Portuguese 53 0.03%
Russian 309 0.16%
Scottish 1,813 0.94%
Scotch-Irish 2,060 1.07%
Slovak 18 0.01%
Subsaharan African 2,861 1.48%
Swedish 936 0.48%
Swiss 494 0.26%
Ukrainian 68 0.04%
Welsh 355 0.18%
West Indian (except Hisp. groups) 321 0.17%
Other ancestries 91,454 47.34%
Ancestry Unclassified 35,249 18.24%
DESCRIPTION DATA %
2017 Est. Pop Age 5+ by Language Spoken At Home 180,033
Speak Only English at Home 126,851 70.46%
Speak Asian/Pac. Isl. Lang. at Home 1,239 0.69%
Speak IndoEuropean Language at Home 3,026 1.68%
Speak Spanish at Home 48,816 27.12%
Speak Other Language at Home 101 0.06%
2017 Est. Population by Age 193,196
Age 0 - 4 13,164 6.81%
Age 5 - 9 13,553 7.02%
Age 10 - 14 14,141 7.32%
Age 15 - 17 8,484 4.39%
Age 18 - 20 7,508 3.89%
Age 21 - 24 9,420 4.88%
Age 25 - 34 24,696 12.78%
Age 35 - 44 24,927 12.90%
Age 45 - 54 25,056 12.97%
Age 55 - 64 24,923 12.90%
Age 65 - 74 16,843 8.72%
Age 75 - 84 7,561 3.91%
Age 85 and over 2,922 1.51%
Age 16 and over 149,559 77.41%
Age 18 and over 143,855 74.46%
Age 21 and over 136,347 70.57%
Age 65 and over 27,326 14.14%
2017 Est. Median Age 37.3
2017 Est. Average Age 38.0
RETAIL TRADE AREA • DEMOGRAPHIC PROFILEBastrop, Texas

9
DESCRIPTION DATA %
2017 Est. Population by Sex 193,196
Male 97,686 50.56%
Female 95,510 49.44%
2017 Est. Male Population by Age 97,686
Age 0 - 4 6,669 6.83%
Age 5 - 9 6,798 6.96%
Age 10 - 14 7,157 7.33%
Age 15 - 17 4,421 4.53%
Age 18 - 20 3,982 4.08%
Age 21 - 24 4,980 5.10%
Age 25 - 34 12,761 13.06%
Age 35 - 44 12,815 13.12%
Age 45 - 54 12,726 13.03%
Age 55 - 64 12,567 12.87%
Age 65 - 74 8,304 8.50%
Age 75 - 84 3,448 3.53%
Age 85 and over 1,059 1.08%
2017 Est. Median Age, Male 36.6
2017 Est. Average Age, Male 37.4
RETAIL TRADE AREA • DEMOGRAPHIC PROFILEBastrop, Texas
DESCRIPTION DATA %
2017 Est. Female Population by Age 95,510
Age 0 - 4 6,495 6.80%
Age 5 - 9 6,756 7.07%
Age 10 - 14 6,983 7.31%
Age 15 - 17 4,063 4.25%
Age 18 - 20 3,526 3.69%
Age 21 - 24 4,440 4.65%
Age 25 - 34 11,935 12.50%
Age 35 - 44 12,112 12.68%
Age 45 - 54 12,330 12.91%
Age 55 - 64 12,356 12.94%
Age 65 - 74 8,539 8.94%
Age 75 - 84 4,113 4.31%
Age 85 and over 1,863 1.95%
2017 Est. Median Age, Female 37.9
2017 Est. Average Age, Female 38.5
2017 Est. Pop Age 15+ by Marital Status 152,339
Total, Never Married 44,096 28.95%
Males, Never Married 25,053 16.45%
Females, Never Married 19,044 12.50%
Married, Spouse present 72,950 47.89%
Married, Spouse absent 9,363 6.15%
Widowed 8,619 5.66%
Males Widowed 2,103 1.38%
Females Widowed 6,516 4.28%
Divorced 17,311 11.36%
Males Divorced 8,267 5.43%
Females Divorced 9,044 5.94%

10
DESCRIPTION DATA %
2017 Est. Pop Age 25+ by Edu. Attainment 126,927
Less than 9th grade 13,404 10.56%
Some High School, no diploma 14,271 11.24%
High School Graduate (or GED) 39,991 31.51%
Some College, no degree 30,143 23.75%
Associate Degree 8,142 6.42%
Bachelor’s Degree 15,291 12.05%
Master’s Degree 4,084 3.22%
Professional School Degree 839 0.66%
Doctorate Degree 763 0.60%
2017 Est. Pop Age 25+ by Edu. Attain., Hisp./Lat. 41,601
No High School Diploma 19,713 47.39%
High School Graduate 11,585 27.85%
Some College or Associate’s Degree 7,293 17.53%
Bachelor’s Degree or Higher 3,011 7.24%
Households
2022 Projection 70,612
2017 Estimate 65,331
2010 Census 57,519
2000 Census 43,280
Growth 2017 - 2022 8.08%
Growth 2010 - 2017 13.58%
Growth 2000 - 2010 32.90%
RETAIL TRADE AREA • DEMOGRAPHIC PROFILEBastrop, Texas
DESCRIPTION DATA %
2017 Est. Households by Household Type 65,331
Family Households 48,202 73.78%
Nonfamily Households 17,129 26.22%
2017 Est. Group Quarters Population 5,438
2017 HHs by Ethnicity, Hispanic/Latino 18,782
2017 Est. Households by HH Income 65,331
Income < $15,000 6,636 10.16%
Income $15,000 - $24,999 6,344 9.71%
Income $25,000 - $34,999 6,121 9.37%
Income $35,000 - $49,999 9,827 15.04%
Income $50,000 - $74,999 13,423 20.55%
Income $75,000 - $99,999 8,426 12.90%
Income $100,000 - $124,999 5,590 8.56%
Income $125,000 - $149,999 3,583 5.48%
Income $150,000 - $199,999 3,028 4.64%
Income $200,000 - $249,999 1,150 1.76%
Income $250,000 - $499,999 912 1.40%
Income $500,000+ 290 0.44%
2017 Est. Average Household Income $72,570
2017 Est. Median Household Income $56,961

11
DESCRIPTION DATA %
2017 Median HH Inc. by Single-Class. Race or Eth.
White Alone $59,998
Black or African American Alone $53,664
American Indian and Alaska Native Alone $42,924
Asian Alone $72,102
Native Hawaiian and Other Pacific Islander Alone $48,469
Some Other Race Alone $41,567
Two or More Races $48,748
Hispanic or Latino $45,895
Not Hispanic or Latino $62,062
2017 Est. Family HH Type by Presence of Own Child. 48,202
Married-Couple Family, own children 16,175 33.56%
Married-Couple Family, no own children 20,345 42.21%
Male Householder, own children 1,831 3.80%
Male Householder, no own children 1,894 3.93%
Female Householder, own children 4,453 9.24%
Female Householder, no own children 3,504 7.27%
2017 Est. Households by Household Size 65,331
1-person 14,266 21.84%
2-person 20,962 32.09%
3-person 10,281 15.74%
4-person 9,025 13.81%
5-person 5,467 8.37%
6-person 2,836 4.34%
7-or-more-person 2,494 3.82%
2017 Est. Average Household Size 2.87
DESCRIPTION DATA %
2017 Est. Households by Presence of People Under 18 65,331
Households with 1 or More People under Age 18: 25,733 39.39%
Married-Couple Family 17,786 69.12%
Other Family, Male Householder 2,269 8.82%
Other Family, Female Householder 5,474 21.27%
Nonfamily, Male Householder 167 0.65%
Nonfamily, Female Householder 36 0.14%
Households with No People under Age 18: 39,598 60.61%
Married-Couple Family 18,743 47.33%
Other Family, Male Householder 1,444 3.65%
Other Family, Female Householder 2,483 6.27%
Nonfamily, Male Householder 8,579 21.66%
Nonfamily, Female Householder 8,349 21.08%
2017 Est. Households by Number of Vehicles 65,331
No Vehicles 2,320 3.55%
1 Vehicle 18,397 28.16%
2 Vehicles 26,626 40.76%
3 Vehicles 12,312 18.85%
4 Vehicles 3,998 6.12%
5 or more Vehicles 1,677 2.57%
2017 Est. Average Number of Vehicles 2.1
RETAIL TRADE AREA • DEMOGRAPHIC PROFILEBastrop, Texas
12
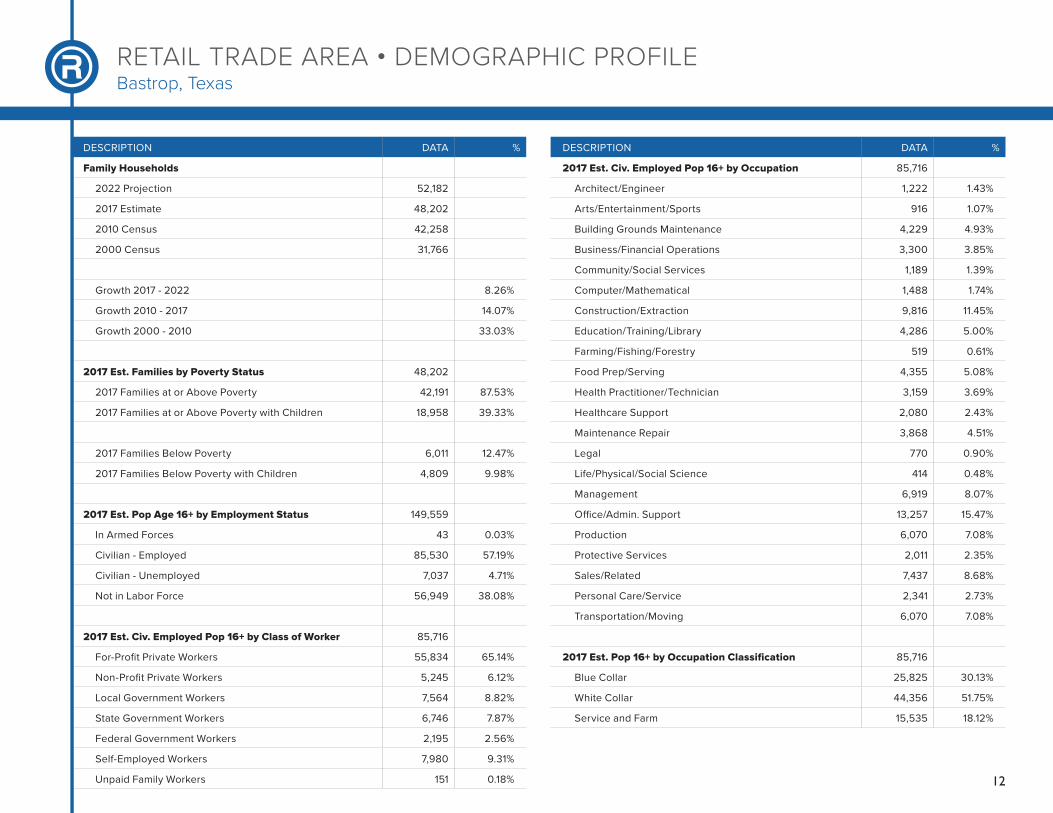
DESCRIPTION DATA %
Family Households
2022 Projection 52,182
2017 Estimate 48,202
2010 Census 42,258
2000 Census 31,766
Growth 2017 - 2022 8.26%
Growth 2010 - 2017 14.07%
Growth 2000 - 2010 33.03%
2017 Est. Families by Poverty Status 48,202
2017 Families at or Above Poverty 42,191 87.53%
2017 Families at or Above Poverty with Children 18,958 39.33%
2017 Families Below Poverty 6,011 12.47%
2017 Families Below Poverty with Children 4,809 9.98%
2017 Est. Pop Age 16+ by Employment Status 149,559
In Armed Forces 43 0.03%
Civilian - Employed 85,530 57.19%
Civilian - Unemployed 7,037 4.71%
Not in Labor Force 56,949 38.08%
2017 Est. Civ. Employed Pop 16+ by Class of Worker 85,716
For-Profit Private Workers 55,834 65.14%
Non-Profit Private Workers 5,245 6.12%
Local Government Workers 7,564 8.82%
State Government Workers 6,746 7.87%
Federal Government Workers 2,195 2.56%
Self-Employed Workers 7,980 9.31%
Unpaid Family Workers 151 0.18%
RETAIL TRADE AREA • DEMOGRAPHIC PROFILEBastrop, Texas
DESCRIPTION DATA %
2017 Est. Civ. Employed Pop 16+ by Occupation 85,716
Architect/Engineer 1,222 1.43%
Arts/Entertainment/Sports 916 1.07%
Building Grounds Maintenance 4,229 4.93%
Business/Financial Operations 3,300 3.85%
Community/Social Services 1,189 1.39%
Computer/Mathematical 1,488 1.74%
Construction/Extraction 9,816 11.45%
Education/Training/Library 4,286 5.00%
Farming/Fishing/Forestry 519 0.61%
Food Prep/Serving 4,355 5.08%
Health Practitioner/Technician 3,159 3.69%
Healthcare Support 2,080 2.43%
Maintenance Repair 3,868 4.51%
Legal 770 0.90%
Life/Physical/Social Science 414 0.48%
Management 6,919 8.07%
Office/Admin. Support 13,257 15.47%
Production 6,070 7.08%
Protective Services 2,011 2.35%
Sales/Related 7,437 8.68%
Personal Care/Service 2,341 2.73%
Transportation/Moving 6,070 7.08%
2017 Est. Pop 16+ by Occupation Classification 85,716
Blue Collar 25,825 30.13%
White Collar 44,356 51.75%
Service and Farm 15,535 18.12%

13
DESCRIPTION DATA %
2017 Est. Workers Age 16+ by Transp. to Work 84,520
Drove Alone 66,169 78.29%
Car Pooled 12,214 14.45%
Public Transportation 643 0.76%
Walked 1,270 1.50%
Bicycle 111 0.13%
Other Means 1,136 1.34%
Worked at Home 2,976 3.52%
2017 Est. Workers Age 16+ by Travel Time to Work
Less than 15 Minutes 18,074
15 - 29 Minutes 22,052
30 - 44 Minutes 19,657
45 - 59 Minutes 10,660
60 or more Minutes 11,048
2017 Est. Avg Travel Time to Work in Minutes 34.00
2017 Est. Occupied Housing Units by Tenure 65,331
Owner Occupied 51,308 78.54%
Renter Occupied 14,023 21.46%
2017 Owner Occ. HUs: Avg. Length of Residence 13.7
2017 Renter Occ. HUs: Avg. Length of Residence 6.8
RETAIL TRADE AREA • DEMOGRAPHIC PROFILEBastrop, Texas
DESCRIPTION DATA %
2017 Est. Owner-Occupied Housing Units by Value 51,308
Value Less than $20,000 2,641 5.15%
Value $20,000 - $39,999 2,830 5.52%
Value $40,000 - $59,999 2,769 5.40%
Value $60,000 - $79,999 4,022 7.84%
Value $80,000 - $99,999 4,293 8.37%
Value $100,000 - $149,999 11,898 23.19%
Value $150,000 - $199,999 8,609 16.78%
Value $200,000 - $299,999 6,516 12.70%
Value $300,000 - $399,999 3,325 6.48%
Value $400,000 - $499,999 1,760 3.43%
Value $500,000 - $749,999 1,177 2.29%
Value $750,000 - $999,999 695 1.35%
Value $1,000,000 or more 773 1.51%
2017 Est. Median All Owner-Occupied Housing Value $138,237
2017 Est. Housing Units by Units in Structure 75,494
1 Unit Attached 831 1.10%
1 Unit Detached 52,982 70.18%
2 Units 1,083 1.43%
3 or 4 Units 830 1.10%
5 to 19 Units 860 1.14%
20 to 49 Units 324 0.43%
50 or More Units 156 0.21%
Mobile Home or Trailer 17,803 23.58%
Boat, RV, Van, etc. 625 0.83%

14
RETAIL TRADE AREA • DEMOGRAPHIC PROFILEBastrop, Texas
DESCRIPTION DATA %
2017 Est. Housing Units by Year Structure Built 75,494
Housing Units Built 2010 or later 10,034 13.29%
Housing Units Built 2000 to 2009 19,060 25.25%
Housing Units Built 1990 to 1999 13,616 18.04%
Housing Units Built 1980 to 1989 11,311 14.98%
Housing Units Built 1970 to 1979 7,554 10.01%
Housing Units Built 1960 to 1969 3,780 5.01%
Housing Units Built 1950 to 1959 3,543 4.69%
Housing Units Built 1940 to 1949 2,188 2.90%
Housing Unit Built 1939 or Earlier 4,408 5.84%
2017 Est. Median Year Structure Built 1994

ZIP CODE SUMMARY MAP BASTROP TRADE AREA
BBAASSTTRROOPP
SSMMIITTHHVVIILLLLEE
EELLGGIINN
LLAA GGRRAANNGGEE
GGIIDDDDIINNGGSS
LLEEXXIINNGGTTOONN
Active Residential Population (2) Active Residential Population (2)
Zip Code Postal Drops (1) Zip Code Postal Drops (1)
78602 11,445 32,962 78725 2,896 8,340 78612 5,022 14,463 78941 1,366 3,934 78615 589 1,696 78942 3,702 10,662 78616 2,894 8,335 78945 5,035 14,501 78617 6,992 20,137 78947 2,084 6,002 78621 8,599 24,765 78949 254 732 78644 7,291 20,998 78953 570 1,642 78650 690 1,987 78957 4,438 12,781 78653 7,500 21,600 78959 825 2,376 78659 1,369 3,943 78963 365 1,051 78662 1,131 3,257 78948 454 1,308
TOTAL ACTIVE RESIDENTIAL POSTAL DROPS 75,511 TOTAL POPULATION (2) 217,472
(1) Source: U.S. Post Office AIS Viewer April 2017
(2) Source: ESRI Demograhics. Average Household size is 2.88 people.
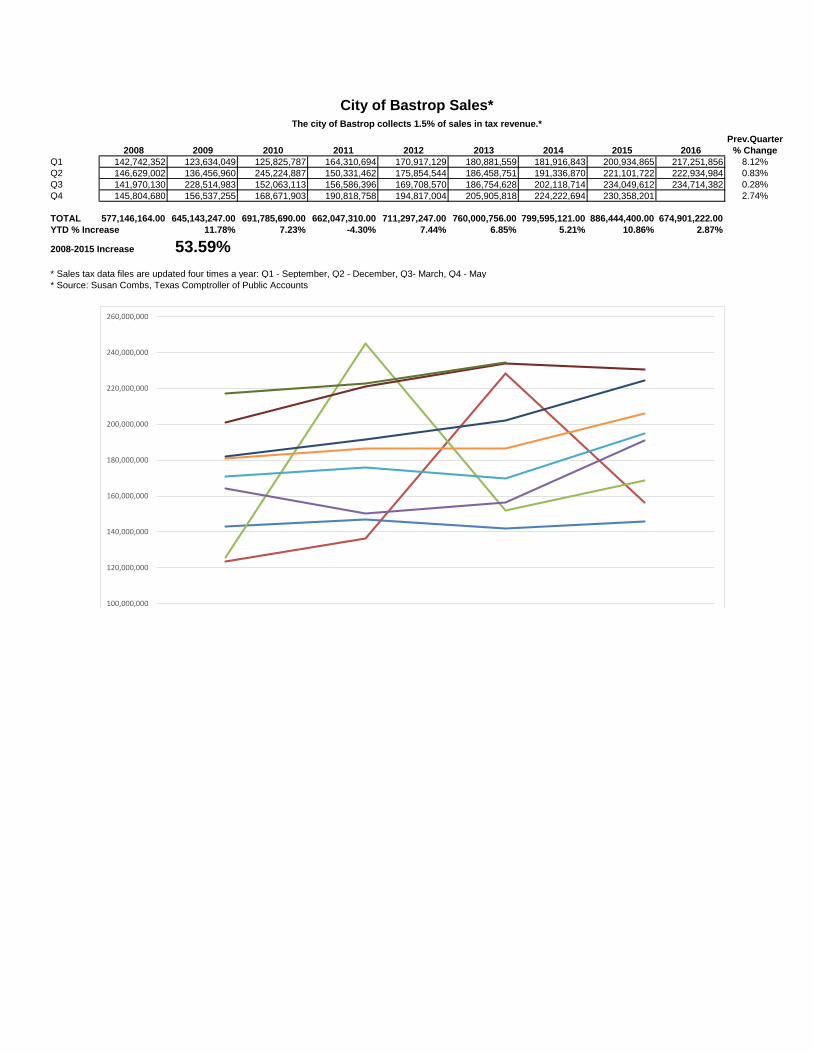
Prev.Quarter2008 2009 2010 2011 2012 2013 2014 2015 2016 % Change
Q1 142,742,352 123,634,049 125,825,787 164,310,694 170,917,129 180,881,559 181,916,843 200,934,865 217,251,856 8.12%
Q2 146,629,002 136,456,960 245,224,887 150,331,462 175,854,544 186,458,751 191,336,870 221,101,722 222,934,984 0.83%
Q3 141,970,130 228,514,983 152,063,113 156,586,396 169,708,570 186,754,628 202,118,714 234,049,612 234,714,382 0.28%
Q4 145,804,680 156,537,255 168,671,903 190,818,758 194,817,004 205,905,818 224,222,694 230,358,201 2.74%
TOTAL 577,146,164.00 645,143,247.00 691,785,690.00 662,047,310.00 711,297,247.00 760,000,756.00 799,595,121.00 886,444,400.00 674,901,222.00YTD % Increase 11.78% 7.23% -4.30% 7.44% 6.85% 5.21% 10.86% 2.87%
2008-2015 Increase 53.59%* Sales tax data files are updated four times a year: Q1 - September, Q2 - December, Q3- March, Q4 - May
* Source: Susan Combs, Texas Comptroller of Public Accounts
City of Bastrop Sales*The city of Bastrop collects 1.5% of sales in tax revenue.*
100,000,000
120,000,000
140,000,000
160,000,000
180,000,000
200,000,000
220,000,000
240,000,000
260,000,000
Q1 Q2 Q3 Q4
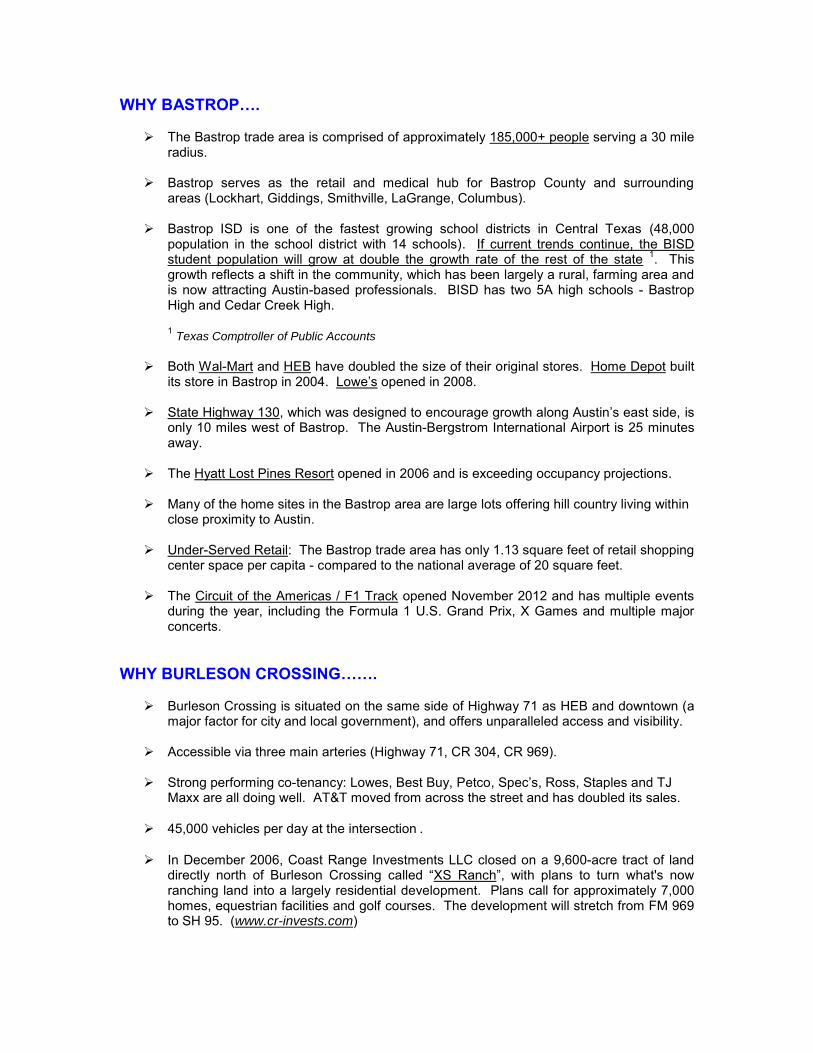
WHY BASTROP….
The Bastrop trade area is comprised of approximately 185,000+ people serving a 30 mileradius.
Bastrop serves as the retail and medical hub for Bastrop County and surroundingareas (Lockhart, Giddings, Smithville, LaGrange, Columbus).
Bastrop ISD is one of the fastest growing school districts in Central Texas (48,000population in the school district with 14 schools). If current trends continue, the BISDstudent population will grow at double the growth rate of the rest of the state 1. Thisgrowth reflects a shift in the community, which has been largely a rural, farming area andis now attracting Austin-based professionals. BISD has two 5A high schools - BastropHigh and Cedar Creek High.
1Texas Comptroller of Public Accounts
Both Wal-Mart and HEB have doubled the size of their original stores. Home Depot builtits store in Bastrop in 2004. Lowe’s opened in 2008.
State Highway 130, which was designed to encourage growth along Austin’s east side, isonly 10 miles west of Bastrop. The Austin-Bergstrom International Airport is 25 minutesaway.
The Hyatt Lost Pines Resort opened in 2006 and is exceeding occupancy projections.
Many of the home sites in the Bastrop area are large lots offering hill country living withinclose proximity to Austin.
Under-Served Retail: The Bastrop trade area has only 1.13 square feet of retail shoppingcenter space per capita - compared to the national average of 20 square feet.
The Circuit of the Americas / F1 Track opened November 2012 and has multiple eventsduring the year, including the Formula 1 U.S. Grand Prix, X Games and multiple majorconcerts.
WHY BURLESON CROSSING…….
Burleson Crossing is situated on the same side of Highway 71 as HEB and downtown (amajor factor for city and local government), and offers unparalleled access and visibility.
Accessible via three main arteries (Highway 71, CR 304, CR 969).
Strong performing co-tenancy: Lowes, Best Buy, Petco, Spec’s, Ross, Staples and TJMaxx are all doing well. AT&T moved from across the street and has doubled its sales.
45,000 vehicles per day at the intersection .
In December 2006, Coast Range Investments LLC closed on a 9,600-acre tract of landdirectly north of Burleson Crossing called “XS Ranch”, with plans to turn what's nowranching land into a largely residential development. Plans call for approximately 7,000homes, equestrian facilities and golf courses. The development will stretch from FM 969to SH 95. (www.cr-invests.com)

BASTROP OVERVIEW
The City of Bastrop
The City of Bastrop is located in the bend of the Colorado River 33 miles east of downtown Austin. Bastrop was established as a part of Stephen F. Austin’s “Little Colony” in 1832. It is the second oldest incorporated city in Texas. Its historic downtown attracts many visitors and gives a certain ambiance that makes the residents proud to be part of a great community.
Growth1
Bastrop County is ranked in the top 10 fastest growing Texas counties with a rate of 16.2% and is ranked 30th in the United States. The trade area population is 150,008 and is expected to grow 16.18% by 2009. The City of Bastrop has grown 36.62% from 1990-2000. From 1995 to 2004, retail sales increased an average of 7% annually. Sales in service establishments increased from $66 million in 1995 to $102 million in 2004, an average annual increase of 5%.
1U.S. Census Bureau
Water Resources
The single most limiting factor to development of housing and other real estate growth in many areas of Central Texas has historically been the lack of water and wastewater services. The exclusive reliance on well water and septic systems results in home construction on large lots and low building density. This has reduced the ability of homebuilders to put together high density neighborhoods, but the addition of three new water service providers will provide opportunities for more traditional home sites.
The Lower Colorado River Authority completed a wastewater system in the McKinney Roughs area. This plant serves the new Hyatt Regency Lost Pines Resort and Spa and will also provide services to future developments in the vicinity.
The regional wastewater system in the Camp Swift area north of the City of Bastrop is currently being expanded by the LCRA. The expanded system will serve many of the homes in this area that currently have septic systems and unimproved lots.
The City of Bastrop has sufficient water supply to meet the needs of a growing population. The City recently reopened its older wastewater plant and has purchased land to construct a new plant.

Trade Area
A recent survey was conducted by the Bastrop Economic Development Council to determine the Bastrop trade area by asking customers in the HEB, Home Depot, and Wal-Mart parking lots the location of their residences. The study found that customers drive approximately 20+ miles from the north and west to shop in Bastrop because the next closest metropolitan city is Austin. They will travel further from the east and south from cites such as Elgin, McDade, Cedar Creek, Utley, and Butler since Bastrop is the closest large city.
According to a Retail Market Analysis report by Houston-based Fearon, Hepner, and Rhodes (FH&R) retail in Bastrop is “very healthy”, with retail sales climbing to $1.3 billion in 2004 from $753 million in 1995. FH&R stated that Bastrop is “severely underserved in many retail and service categories”. Nationally, retail shopping center space per capita is about 20 square feet per person, but in Bastrop there is only 1.13 square feet per person. The report concludes that the Bastrop area could support an additional 2.75 million square feet of retail space over just the next 5 years.
Both HEB and Wal-Mart opened Bastrop stores in 1987, and since have rebuilt to meet the needs of a growing customer base (Super Wal-Mart rebuilt 1995, and HEB rebuilt in 2003). It is reported that HEB’s current store (93,000 square feet) is already at full capacity. A new subdivision, West Bastrop Village has recognized this demand and has acquired land for production of new homes. The city has planned to build two new utility districts as a foundation for new homes being built.
Education
Bastrop Independent School District has six elementary schools, two intermediate schools, two middle schools, and two high schools. There are 5,614 students enrolled in grades K-12 and the school district has grown 27% over the past five years. Eight of the district schools recently achieved the Gold Performance Acknowledgement (GPA) by the Texas Education Agency which recognizes schools for high performance and improvement in areas crucial to the academic success.
Health Care Facilities
Seton Hospital purchased the Lakeside Hospital (28,500 sf).

Hyatt Regency Lost Pines Resort and Spa
The new Hyatt Regency Lost Pines Resort and Spa, a 492-room resort, opened June 1, 2006 after a two-year construction period. The resort is located approximately 7 miles west of the City of Bastrop near the Colorado River and McKinney Roughs Nature Park. This is the largest resort in Central Texas. With room prices beginning at $200 per night, the resort is expected to draw more business travelers than families. The resort predicts that 70% of its clientele will be business travelers.
Economically, the 405-acre resort will benefit Bastrop in several primary ways. First, it has become the largest private employer in the area. Secondly, many existing Bastrop businesses will benefit through increased sales. The City of Bastrop will likely receive $2 million per year in hotel taxes and $800,000 in property taxes from the resort. New jobs are also expected to be created as new businesses come to the area to serve the resort and its clientele.
It is estimated that the resort will employ more than 550 workers. The majority of these jobs are expected to be filled through local residents although it is expected that some workers will move to the area for employment. Most workers filling managerial positions will transfer from other Hyatt hotels. Another 200 indirect jobs are expected to be created. Austin-based Resource Economics, Inc. estimates that the newly created jobs will amount to $17.9 million to $21.2 million per year for Bastrop County.
Demographic and Firmographic Information
The following are highlights of the demographic and firmographic findings for the Bastrop trade area (for detailed reports, please refer to the Bastrop EDC website: www.bastropedc.org)
Demographics
♦ The population of the trade area is 160,008 and is estimated to grow 16.18%by 2012. The number of households is expected to grow at 16.34%.Currently, there are 50,805 households in the area. The population of thetrade area is predominantly White at 73.61% of the total population in thearea.
♦ Approximately 77.9% of the population lives in owner-occupied units.

♦ Of the total households, 21.92% have income levels between $50,000 and$74,999. The second largest category is households with income levelsbetween $35,000 and $49,999, representing 16.55% of the total areahouseholds.
♦ People between 35 and 44 years of age are the largest segment of thepopulation, 15.68%.
♦ 53.94% of the population is married, followed by single males, whichrepresent 13.47% of the total population.
♦ 33.39% of the population are high school graduates, while 21% haveexperienced some college. Another 10.92% have obtained a Bachelor’sdegree.
Firmographics
♦ There are approximately 4,959 total businesses in the trade area, and thedominant group is services at 38.01%. Retail trade businesses are thesecond major category, representing 21.6% of the total businesses in thearea.
♦ The number of employees in the trade area is 47,740, and the majority workin services. Approximately 37.36% of the total employees work in services,while 18.41% of employees work in retail trade businesses.
♦ Total annual retail sales for the trade area are approximately $1.3 billion.Retail sales include $353 million for Auto Dealers and Gas Stations, $203million for Food Stores, $167 million for Home Improvement Stores, and $107million for General Merchandise Stores.
Transportation
Bastrop is located 33 miles and 40 minutes east of downtown Austin on Highway 71. Highway 71/Ben White Blvd. has been a major east/west arterial for southAustin for over 50 years. In the 1990’s the Highway began undergoing majorexpansion to insure easier accessibility and to enhance traffic flow. Highway 71from Austin to Austin Bergstrom International Airport will be completed in 2006.
Additionally, the new toll road SH-130 intersects Hwy 71 just east of the airport and Hwy 973. SH-130 runs nearly parallel to IH-35 about 20 miles from Bastrop enabling easier transportation routes for the cities north and south of Bastrop.

7860226.6%
7894521.6%
7862131.3%
7861244.9%
7865916.7%
7895327.9%
7866228.6%
7865014.3%
7861734.7%
7861610.8%
7894149.1%
786530%
AUSTIN
LOCKHART
BASTROP
ELGIN
GIDDINGS
MANOR
MUSTANG RIDGE
SMITHVILLE
WEBBERVILLE
PFLUGERVILLE LEXINGTON
NIEDERWALD
LA GRANGE
CREEDMOOR
Lake Bastrop
Walter E. Long Lake
Colorado River
35
304
95
21
71
275
111
169
95
95
71
290
77
183
77
BASTROP COUNTY
LEE COUNTYTRAVIS COUNTY
FAYETTE COUNTY
CALDWELL COUNTY
Bastrop CountyZip Codes
Overview Map
Metadata: BastropPop.mxd produced on January 14, 2009. Population Sources: 2000 U.S. Census, 2008 Estimates ESRI Business Analyst Online. Note: The percentage is calculated based on the population of that Zip Code which lies within Bastrop County. For additional info contact CAPCOG at (512) 916-6000. Disclaimer: The Capital Area Council of Governments (CAPCOG) provides this map and/or data 'as is' and assumes no liability for its accuracy or completeness. This is intended as a general representation only and is in no way intended to be used as survey grade information.
0 1 2 3 4 5
Miles
Interstate
State Highway
US Highway
Rivers
Lakes
City Limits
Map Legend
Population Growth2000-2008
Percent Change0 - 15%
15.1 - 25%
25.1 - 35%
35.1 - 49.1%
Source: ESRI Business Analyst Online

RREEDD TTOOWWNN 3344 LLOOTTSS
2211 HHOOMMEESS
LLIITTTTLLEE MMccAACCRREESS 5533 LLOOTTSS
3333 HHOOMMEESS
TTHHEE AARRBBOORRSS AATT DDOOGGWWOOOODD CCRREEEEKK
112211 LLOOTTSS 8811 HHOOMMEESS
CCEEDDAARR HHIILLLLSS 111133 LLOOTTSS
7711 HHOOMMEESS
HHIIDDDDEENN OOAAKKSS 111122 LLOOTTSS 6655 HHOOMMEESS
RROOLLLLIINNGG OOAAKK FFAARRMMSS 1177 LLOOTTSS
1144 HHOOMMEESS LLAAZZYY RRIIVVEERR AACCRREESS 4499 LLOOTTSS
3333 HHOOMMEESS
TTHHEE OOAAKKSS 3399 LLOOTTSS
2266 HHOOMMEESS
RRIIVVEERR CCRROOSSSSIINNGG 116644 LLOOTTSS
110055 HHOOMMEESS MMEESSAA VVEERRDDEE
3377 LLOOTTSS
EELLMM RRIIDDGGEE 666600 LLOOTTSS
LLeessss tthhaann 110000 LLoottss
110000 LLoottss oorr MMoorree
LLaarrggee FFuuttuurree DDeevveellooppmmeennttss
BBAASSTTRROOPP CCOOUUNNTTYY WWEESSTT 7755 LLOOTTSS
4455 HHOOMMEESS
RROOLLLLIINNGG OOAAKKSS 111177 LLOOTTSS
7700 HHOOMMEESS
CCAAMMPP SSWWIIFFTT RRAANNCCHH 116688 LLOOTTSS
110077 HHOOMMEESS
LLAAKKEE BBAASSTTRROOPP EESSTTAATTEESS 115500 LLOOTTSS
110022 HHOOMMEESS
LLIINNCCOOLLNN LLAAKKEE EESSTTAATTEESS
448855 LLOOTTSS 226600 HHOOMMEESS
BBAASSTTRROOPP CCOOUUNNTTYY RREESSIIDDEENNTTIIAALL MMAAPP
ELGIN Pop. 8,007
BASTROP Pop. 7,535
RED ROCK
CCIIEELLOO VVIISSTTAA RRAANNCCHH 113300 LLOOTTSS 8800 HHOOMMEESS
HHOORRSSEESSHHOOEE LLAAKKEE 110033 LLOOTTSS 7700 HHoommeess
IINNDDIIAANN LLAAKKEE 229966 LLOOTTSS
115500 HHoommeess HHIIDDDDEENN SSHHOORREESS
110000 LLOOTTSS 7722 HHoommeess
LLAA RREETTAA 114422 LLOOTTSS
110000 HHoommeess
PPIINNEE VVAALLLLEEYY 115555 LLOOTTSS
112200 HHoommeess
UUNNIIVVEERRSSIITTYY PPAARRKK 3300 LLOOTTSS
2211 HHoommeess
DDOOTTYY RRIIVVEERR EESSTTAATTEESS 5599 LLOOTTSS
4400 HHoommeess
IIDDLLEE AACCRREESS 2255 LLOOTTSS
2200 HHoommeess
CCLLEEAARRVVIIEEWW EESSTTAATTEESS 2277 LLOOTTSS
1155 HHoommeess
PPIINNEE HHIILLLLSS 5566 LLOOTTSS
3300 HHoommeess
FFOORREESSTT OOFF CCOOLLOORRAADDOO CCRROOSSSSIINNGG 5544 LLOOTTSS
3333 HHOOMMEESS
CCOOLLOORRAADDOO RRIIVVEERR RRAANNCCHHEETTTTEE 6677 LLOOTTSS
4477 HHOOMMEESS
BBLLUUEEBBOONNNNEETT AACCRREESS 220066 LLOOTTSS
WWAALLNNUUTT CCRREEEEKK PPLLAACCEE 8822 LLOOTTSS
5522 HHoommeess
AARRTTEESSIIAANN OOAAKKSS 225511 LLOOTTSS
115555 HHoommeess
MMEESSQQUUIITTEE AACCRREESS 5555 LLOOTTSS
3300 HHoommeess
VVAALLLLEEYY CCRREEEEKK 2255 LLOOTTSS
2200 HHOOMMEESS
OOAAKK FFOORREESSTT 6600 LLOOTTSS
SSpprriinngg 22001111
TTHHOOUUSSAANNDD OOAAKKSS 112288 LLOOTTSS
7766 HHOOMMEESS
HHEERRIITTAAGGEE OOAAKKSS 112288 LLOOTTSS
TTHHEE RRAANNCCHH 5588 LLOOTTSS
3300 HHOOMMEESS
HHOOMMEESSTTEEAADD 8822 LLOOTTSS
6611 HHOOMMEESS
McDADE
HHIIGGHH VVIIEEWW RRAANNCCHHEESS 223377 LLOOTTSS
113300 HHoommeess
AARRBBOORR HHIILLLLSS 110088 LLOOTTSS
7722 HHOOMMEESS
TTHHEE FFOORREESSTT 3355 LLOOTTSS
2255 HHOOMMEESS
LLEEGGEENNDD OOAAKKSS 118844 LLOOTTSS
113322 HHOOMMEESS
MMEEAADDOOWW LLAAKKEE HHEEIIGGHHTTSS 114488 LLOOTTSS 8877 HHoommeess
SSTTOONNYY PPOOIINNTT 115533 LLOOTTSS 9955 HHOOMMEESS
PAIGE
LLAAKKEE TTHHUUNNDDEERRBBIIRRDD 11,,009944 LLOOTTSS 770000 HHoommeess
SMITHVILLE Pop. 4,339
CCOOAASSTT RRAANNGGEE DDEEVVEELLOOPPMMEENNTT
((FFUUTTUURREE)) ++ 1100,,000000 AAccrreess
WWEESSTT BBAASSTTRROOPP VVIILLLLAAGGEE ((PPrrooppoosseedd))
11,,220000 LLoottss
MMIITTCCHHEELLLL TTRRAACCTT 55,,000000 LLoottss
CCOOLLOORRAADDOO RRIIVVEERR EESSTTAATTEESS 3322 LLoottss
2200 HHoommeess
CCEEDDAARR CCRREEEEKK FFAARRMMSS 4411 LLoottss
2233 HHoommeess
TTHHEE CCOOLLOONNYY 44,,550000 LLoottss
22,,440000 HHoommeess
JJAACCOOBB’’SS LLAANNDDIINNGG 4466 LLoottss
2255 HHoommeess
TTHHEE WWOOOODDLLAANNDDSS 7733 LLoottss
4400 HHoommeess
RRIIVVEERR OOAAKKSS 110000 LLoottss
5555 HHoommeess
MMAARRTTIINN’’SS MMEEAADDOOWW 110033 LLoottss
6622 HHoommeess
RRIIVVEERR MMEEAADDOOWWSS 112200 LLoottss
6655 HHoommeess TTAAHHIITTIIAANN VVIILLLLAAGGEE
66,,115500 LLoottss 11,,330000 HHoommeess
CCOOLLOOVVIISSTTAA EESSTTAATTEESS 447700 LLoottss
118866 HHoommeess
HHUUNNTTEERR’’SS CCRROOSSSSIINNGG 447700 LLoottss
226600 HHoommeess
RRIIVVEERRSSIIDDEE GGRROOVVEE 440099 LLoottss
330000 HHoommeess
SSAANNDDEERRSS EESSTTAATTEESS 9999 LLoottss
6622 HHoommeess
PPIINNEEYY RRIIDDGGEE 112200 LLoottss
7722 HHoommeess
LLAAKKEE BBAASSTTRROOPP PPIINNEESS 117700 LLoottss
110000 HHoommeess BBAASSTTRROOPP HHIILLLLSS
5544 LLoottss 3311 HHoommeess
LLAAKKEE BBAASSTTRROOPP AACCRREESS 334444 LLoottss
119900 HHoommeess
LLAAKKEE VVIIEEWW EESSTTAATTEESS 2255 LLoottss
2255 HHoommeess
KKCC EESSTTAATTEESS 222200 LLoottss
118800 HHoommeess
CCIIRRCCLLEE DD CCOOUUNNTTRRYY AACCRREESS 8888 LLoottss
5522 HHoommeess

AGENCY DISCLOSURE RULES
Before working with a real estate broker, you should know that the duties of a broker depend on whom the broker represents. If you are a prospective seller or landlord (owner) or a prospective buyer or tenant (buyer), you should know that the broker who lists the property for sale or lease is the owner’s agent. A broker who acts as a subagent represents the owner in cooperation with the
listing broker. A broker who acts as a buyer’s agent represents the buyer, A broker may act as an intermediary between the parties if the parties consent in writing. A broker can assist you in locating a property, preparing a contract or lease, or obtaining financing without representing you. A broker is obligated by law to treat you fairly.
IF THE BROKER REPRESENTS THE OWNER: The broker becomes the owner’s agent by entering into an agreement with the owner, usually through a written listing agreement, or by agreeing to act as a subagent by accepting an offer of subagency from the listing broker. A subagent may work in a different real estate office. A listing broker or subagent can assist the buyer but does not represent the buyer and must place the interests of the owner first. The buyer should not tell the owner’s agent anything the buyer would not want the owner to know because an owner’s agent must disclose to the owner any material information known to the agent.
IF THE BROKER REPRESENTS THE BUYER: The broker becomes the buyer’s agent by entering into an agreement to represent the buyer, usually through a written buyer representation agreement. A buyer’s agent can assist the owner but does not represent the owner and must place the interests of the buyer first. The owner should not tell a buyer’s agent anything the owner would not want the buyer to know because the buyer’s agent must disclose any material information known to the agent.
IF THE BROKER ACTS AS AN INTERMEDIARY: A broker may act as an intermediary between the parties if the broker complies with The Texas Real Estate License Act. The broker must obtain the written consent of each party to the transaction to act as an intermediary. The written consent must state who will pay the broker and, in conspicuous bold or underlined print, set forth the broker’s obligations as an intermediary. The broker is required to treat each party honestly and fairly and to comply with The Texas Real Estate License Act. A broker who acts as an intermediary in a transaction: (1) shall treat all parties honestly; (2) may not disclose that the owner will accept a price less than the asking price unless authorized in writing to do so by the owner; (3) may not disclose that the buyer will pay a price greater than the price submitted in a written offer unless authorized in writing to do so by the buyer; (4) may not disclose any confidential information or any information that a party specifically instructs the broker in writing not to disclose unless authorized in writing to disclose the information or required to do so by The Texas Real Estate License Act or a court order or if the information materially relates to the condition of the property. With the parties’ consent, a broker acting as an intermediary between the parties may appoint a person who is licensed under The Texas Real Estate License Act and associated with the broker to communicate with and carry out instructions of one party and another person who is licensed under that Act and associated with the broker to communicate with and carry out instructions of the other party.
If you choose to have a broker represent you, you should enter into a written agreement with the broker that clearly establishes the broker’s obligations and your obligations. The agreement should state how and by whom the broker will be paid. You have the right to choose the type of representation, if any, you wish to receive. Your payment of a fee to a broker does not necessarily establish that the broker represents you. If you have any questions regarding the duties and responsibilities of the broker, you should resolve those questions before proceeding.