a 5-decade analysis of 13,715 carcinoid tumors · states-based databases comprising patients from...
TRANSCRIPT
A 5-Decade Analysis of 13,715 Carcinoid Tumors
Irvin M. Modlin, M.D., Ph.D.1,2
Kevin D. Lye, M.D.1,2
Mark Kidd, Ph.D.1,2
1 Department of Surgery, Yale University School ofMedicine, New Haven, Connecticut.
2 Gastric Pathobiology Research Group, Yale Uni-versity School of Medicine, New Haven, Connect-icut.
Address for reprints: Irvin M. Modlin, M.D., Ph.D.,Yale University School of Medicine, P.O. Box208062, New Haven, CT 06520-8062; Fax: (203)937-4783; E-mail: [email protected]
Received July 30, 2002; revision received August12, 2002; accepted September 20, 2002.
BACKGROUND. Carcinoid tumors represent an unusual and complex disease spec-
trum with protean clinical manifestations. This compilation of several large United
States-based databases comprising patients from 1950 to 1999 examines 13,715
carcinoid tumors and provides epidemiologic information regarding the natural
history and evolution of the detection and diagnosis of this entity.
METHODS. The authors evaluated 10,878 carcinoid tumors that were identified by
the Surveillance, Epidemiology, and End Results (SEER) Program of the National
Cancer Institute (NCI) from 1973 to 1999 in addition to 2837 carcinoid tumors that
were registered previously by two earlier NCI programs. To the authors’ knowl-
edge, this represents the largest current epidemiology series addressing carcinoid
tumors to date.
RESULTS. Specific trends in incidence for carcinoid tumors of certain sites were
identified. Among the most recently collected subset of data, sites that demon-
strated the greatest incidence of carcinoids were the gastrointestinal tract (67.5%)
and the bronchopulmonary system (25.3%). Within the gastrointestinal tract, most
carcinoid tumors occurred in the small intestine (41.8%), rectum (27.4%), and
stomach (8.7%). For all sites, age-adjusted incidence rates were highest in black
males (4.48 per 100,000 population per year). Associated noncarcinoid tumors
were frequent in conjunction with small intestinal (29.0%), gastric (20.5%), colonic
(20.0%), and appendiceal (18.2%) carcinoids. The highest percentages of nonlocal-
ized lesions were noted for cecal (81.5– 83.2%) and pancreatic (71.9 – 81.3%) carci-
noids, whereas the highest percentage of localized disease was found among rectal
(81.7%), gastric (67.5%), and bronchopulmonary (65.4%) carcinoids. The best
5-year survival rates were recorded for patients with rectal (88.3%), bronchopul-
monary (73.5%), and appendiceal (71.0%) carcinoids; these tumors exhibited in-
vasive growth or metastatic spread in 3.9%, 27.5%, and 38.8% of patients, respec-
tively.
CONCLUSIONS. Carcinoids appear to have increased in overall incidence over the
past 30 years; for some sites, this trend has been evident for nearly half a century.
Recent marked increases in gastric and rectal carcinoids and a concomitant de-
crease in appendiceal carcinoid incidence may be due in part to varying rules of
registration among the compiled databases examined in this report or to improve-
ments in diagnostic technology; increased awareness of and about carcinoid tu-
mors also may play a significant role. In 12.9% of all patients with carcinoid, distant
metastases already were evident at the time of diagnosis; the overall 5-year survival
rate for all carcinoid tumors, regardless of site, was 67.2%. These findings bring into
question the widely promulgated relative benignity of carcinoid disease. Certain
carcinoid tumors, such as those of the rectum, appear to be over-represented
among the black and Asian populations within the United States, suggesting the
role of genetics in the development of this intriguing disease. Cancer 2003;97:
934 –59. © 2003 American Cancer Society.
DOI 10.1002/cncr.11105
KEYWORDS: carcinoid, epidemiology, incidence, survival, metastases, stomach,small bowel, colon, appendix.
934
© 2003 American Cancer Society
Carcinoid tumors are slow-growing malignancieswith distinct biologic and clinical characteristics.
Although these tumors have long been a source ofclinical and pathologic interest, their fundamental bi-ology still eludes precise delineation. Langhans1 firstdescribed a gut carcinoid tumor in 1867, and it was in1888 that Lubarsch2 became the first to record such alesion in detail. Two years later, Ransom3 provided thefirst comprehensive descriptions of the classic symp-toms of carcinoid syndrome. Oberndorfer4 first usedthe word karzinoide in 1907 to distinguish these neo-plasms, which he believed were benign, from malig-nant adenocarcinomata. The recognition of carcinoidsas endocrine-related tumors was outlined by Gossetand Masson in 1914.5
Because these tumors derive from neuroendo-crine cell compartments, their frequency of occur-rence correlates with the site-density of neuroendo-crine cells. Thus, nearly 60% of carcinoid tumors arisealong the largest endocrine organ of man, the intes-tine. Greater than 25% of carcinoid tumors arisewithin the bronchopulmonary system, reflecting thehigh density of Kultschitzky cells in the respiratoryepithelium. Other carcinoid tumors occur less fre-quently and in more obscure sites; the biologic andclinical characteristics of these lesions are not as ap-parent.
It has become apparent that these supposedlybenign tumors may not always behave in such a fash-ion. Because carcinoid tumors differ substantiallyfrom conventional gastrointestinal adenocarcinomasin their pathophysiology and outcome, it is imperativethat clinicians consider the biology of these lesions indefining appropriate therapy.
It has become apparent that the term carcinoidrepresents a wide spectrum of neoplasms originatingfrom a variety of neuroendocrine cell types. This ar-chaic descriptor, however, fails to convey adequatelythe pathologic variety of such neoplasms with theirvast array of secretory products. Although notableclinical manifestations of carcinoid tumors often areeither vague or absent, in approximately 10% of pa-tients, these tumors secrete bioactive mediators thatmay engender various characteristics of the carcinoidsyndrome.6 Although precise identification of the spe-cific cell type of each neuroendocrine tumor of thegastrointestinal tract is far from complete, the wide-spread use of endoscopy, ultrasonography, and otheradvanced imaging modalities has enhanced signifi-cantly the identification of previously undetectablelesions and has allowed a more accurate delineation ofmetastases.
Unfortunately, investigation of the complex na-ture of endocrine cell function initially was hampered
by a lack of experimental techniques applicable to thecell biology of these lesions. Considerable informationhas been accrued recently, however, regarding theircells of origin, markers of proliferative activity, bioac-tive products, and production of diverse growth fac-tors.7–9
The epidemiology of these relatively rare lesions,which comprise only 0.49% of all malignancies, is ofconsiderable interest. Although the majority of largerreports regarding carcinoid tumors have dealt with anaverage of 100 –300 patients, a fundamental contribu-tion was presented in 1975 by Godwin in his substan-tial and detailed evaluation of carcinoid tumor inci-dence, distribution, and survival.10 A total of 2837patients identified by the End Results Group (ERG)and the Third National Cancer Survey (TNCS) pro-grams of the National Cancer Institute (NCI) between1950 and 1971 were examined. Sites of carcinoid tu-mors included the lung, ovary, biliary system, and thelength of the gastrointestinal tract. Among these pa-tients, the appendix represented the site of most re-ported carcinoids (ERG, 43.9%; TNCS, 35.5%), fol-lowed by the rectum (ERG, 15.4%; TNCS, 12.3%), andthe ileum (ERG, 10.8%; TNCS, 13.8%). Godwin notedthat age-adjusted incidence rates generally werehigher in the black population.
Until 1997, Godwin’s analysis remained the goldstandard for discussion of carcinoid epidemiology. Atthat time, however, carcinoid data from the NCI Sur-veillance Research Program was compiled with God-win’s data and examined by Modlin and Sandor,11
culminating in the epidemiologic analysis of 8305 pa-tients with carcinoid tumors. That review noted anincreased incidence of carcinoid tumors over the pre-ceding 20 years and a concomitant decreasing inci-dence of appendiceal carcinoids.
The objective of this study was to update informa-tion regarding carcinoid tumor epidemiology and tocreate an expanded database derived from reportedpatients with carcinoid tumors accumulated by theNCI since 1973. This analysis provides informationabout changes in incidence and behavior of theselesions; such changes may be secondary to novelmethods of diagnosis and treatment for patients withthese tumors. Thus, the authors evaluated all availablepatients within the SEER database from 1973 to 1999which had registered an additional 10,878 patientswith carcinoid tumors of various types since the clo-sure of the ERG and TNCS programs. Wherever pos-sible, data were assimilated in a fashion comparable tothat reported by Godwin to facilitate comparison ofinformation and to allow the opportunity to evaluatechanges that may have occurred throughout the peri-ods 1950 –1971 and 1973–1999.
Analysis of 13,715 Carcinoid Tumors/Modlin et al. 935
MATERIALS AND METHODSThe data in this study were extracted from the SEERdatabase, as compiled by the Surveillance ResearchProgram of the NCI from January 1, 1973 to December31, 1999.12 The SEER Program succeeded two earlierNCI programs—the ERG and the TNCS—and coversseveral geographic areas of the United States and itsterritories.
The Surveillance Research Program accrues pa-tients from registries in the states of Connecticut,Iowa, New Mexico, Utah, and Hawaii as well as themetropolitan areas of Detroit and San Francisco–Oak-land. In 1974 –1975, the metropolitan area of Atlantaand the 13-county Seattle–Puget Sound areas wereadded. In 1978, 10 predominantly black rural countiesin Georgia were included; in 1980, patients from theAmerican Indian populations residing in Arizona wereadjoined. Three additional geographic areas partici-pated in the SEER Program prior to 1990: New Or-leans, LA (1974 –1977); New Jersey (1979 –1989); andPuerto Rico (1973–1989). In 1992, the SEER databasewas expanded to increase coverage of minority popu-lations, including Hispanics, with the addition of LosAngeles County and four counties in the San Jose–Monterey area south of San Francisco.
Selection criteria for these geographic areas in-cluded an ability to operate and maintain a high-quality, population-based cancer reporting system aswell as coverage of epidemiologically significant pop-ulation subgroups. The population covered by SEER iscomparable to the general United States populationwith regard to poverty and education, although theSEER population tends to be somewhat more urbanand has a greater proportion of foreign-born personscompared with the general United States population(Table 1). The SEER database, thus, has a catchment ofapproximately 14% of the United States population;the data set includes records on approximately 2.7million tumors.
The stated goals of the SEER Program are 1) as-sembling and reporting, on a periodic basis, estimatesof cancer incidence and mortality in the United States;
2) monitoring annual cancer incidence trends to iden-tify unusual changes in specific forms of cancer oc-curring in population subgroups defined by geo-graphic and demographic characteristics; 3) providingcontinuing information on changes over time in theextent of disease at diagnosis, during therapy, andassociated changes in patient survival; and 4) promot-ing studies designed to identify factors amenable tocancer control interventions.12 The International Clas-sification of Diseases for Oncology (ICD-O) histologycodes describing subsets of carcinoid tumor typeswere included in queries of the SEER database (Table2).13 Because the ICD-O definitions have evolved withtime, the definition of carcinoid tumors has variedslightly in each subsequent version of this codingschema. This may have influenced the data presentedin the current study during comparisons with the ERGand TNCS databases.14 Because the SEER Programonly registered malignant tumors prior to 1986, carci-noid tumors were reported only to the SEER registryduring this period if they were designated malignant.However, in classic histologic terminology, carcinoidtumors (except those of the appendix) generally havebeen considered malignant, and, as such, all are re-portable to SEER unless they specifically are desig-nated benign.4,15,16 In this report, the authors com-pared the data, as supplied by the SEER Program, withthe ERG (1950 –1969) and the TNCS (1969 –1971) datareported by Godwin in 1975.10 The ERG was a hospi-tal-based program that was set up to report survival,whereas the TNCS was a population-based incidence-reporting system that was used over a 3-year period.Because distribution by gender, race, and age for theERG data were remarkably similar to that of the TNCSfile, Godwin employed the TNCS database to evaluateage-adjusted incidence rates and to compare carci-noid tumors with other noncarcinoid tumors.10 Con-versely, the ERG data were used as a baseline to ana-lyze carcinoid tumors by stage and to estimate the
TABLE 1Characteristics of the Surveillance, Epidemiology, and End Results(SEER) Database and the 1990 United States Population
Characteristic SEER (1973–1999) (%) 1990 US population (%)
Below poverty level 12 13High school graduate or higher
(persons age � 25 ys) 78 75Urban areas 89 75Farm areas 1 2Foreign-born 15 8
TABLE 2Carcinoid-Related International Classification of Diseases forOncology Second Edition Codes Employed for Database Queries
Code descriptor SEER (1973–1999)
Carcinoid tumor, NOS 8240Argentaffin carcinoid, NOS 8241Enterochromaffin-like cell carcinoid, NOS 8242Goblet cell carcinoid 8243Composite carcinoid 8244Atypical carcinoid tumor 8249Strumal carcinoid 9091
NOS: not otherwise specified.
936 CANCER February 15, 2003 / Volume 97 / Number 4
5-year relative survivals. For this article, specific que-ries of the SEER database were generated to facilitatecomparison of the SEER data with anatomic sites ofpathology as reported by Godwin.
In the current study, the entire SEER database wasanalyzed to generate information regarding the typeand distribution of carcinoid tumors. Subanalysis wasundertaken, when appropriate, for patients accruedfrom 1992 through 1999 to investigate trends in inci-dence (including data from the ERG and TNCS re-ports) during the periods 1950 –1969, 1969 –1971,1973–1991, and 1992–1999. Anatomic sites with pa-tient tallies of less than five were included in all cal-culations but, to facilitate space management, havenot been presented in the accompanying tables. Age-adjusted analyses were completed using the 1970 and2000 United States standard populations for examina-tion of cases accrued from 1973–1991 and from 1992–1999, respectively. Population-based correction ratiosfor gender and race were obtained from United Statesdecennial census data for 1980, 1990, and 2000 andwere applied to the 1973–1991, 1973–1999, and 1992–1999 SEER data sets, respectively (Table 3).17 Unfortu-nately, as in all multisource and time-extended anal-yses, this study retains certain limitations, including 1)distinct operational rules between the ERG, TNCS, andSEER data (e.g., in the ERG data, all carcinoids werereported, whereas in the TNCS and SEER data, onlytumors that were considered malignant were reportedprior to 1986), and 2) because only summarized infor-mation on the ERG and TNCS data, as reported byGodwin, is available, it was not feasible to undertakethe ideal statistical analyses necessary to preciselyevaluate the populations and incidences as noted dur-ing these earlier periods.
For this analysis, tumor staging was categorized aslocalized if the lesion was described as in situ or wasconfined to the organ of origin; regional if local inva-sion or lymph node metastasis was present; distant ifmetastatic dissemination to other organs was evident;and unstaged if information was insufficient to assign
a stage. Statistical evaluation of survival data was un-dertaken by analysis of variance; data are expressed asthe mean � standard error of the mean, where appro-priate.
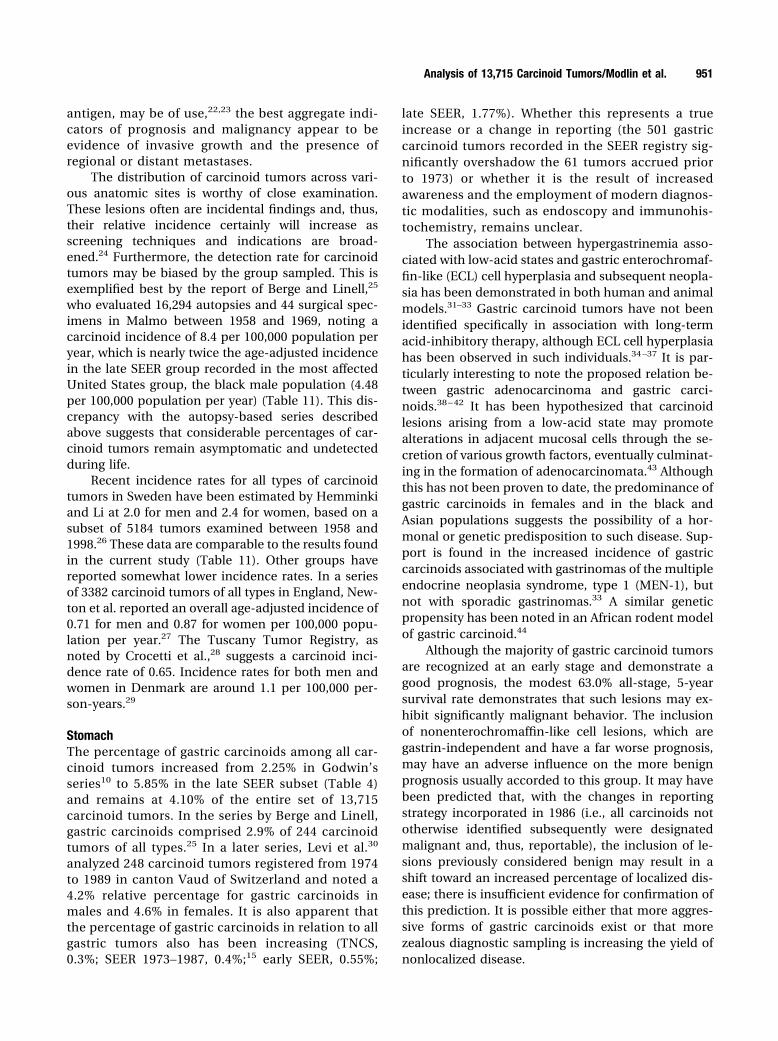
RESULTSSiteThe distribution of 13,715 carcinoid tumors by site ineach of the ERG, TNCS, and SEER Program series aswell as the combined set of the three series is shown inTable 4. The following trends are apparent over the50-year period: Gastric carcinoid tumors, as a percent-age of total carcinoid tumors, increased from 2.25% inthe ERG series to 5.85% in the most recent SEERsubset (1992–1999), whereas small intestinal carcinoidtumors increased from 18.9% to 28.2%. The percent-age of cecal carcinoid tumors rose from 2.7% to 4.6%in the 1973–1991 SEER subset but subsequently fell to3.5% in the 1992–1999, SEER subset. The percentage ofrectosigmoid lesions, however, increased between theearliest and most recent data groupings, from 0.80% to1.94%. Appendiceal carcinoid tumors decreased from43.9% to 2.4%, although the pan-SEER (1973–1999)database incidence remained 4.77%. The combinedgroup of all gastrointestinal carcinoid tumors has de-creased in relative frequency over time (ERG andTNCS, 76.8%; pan-SEER, 64.3%) despite the increasingnumber of reported gastrointestinal carcinoid tumors(ERG and TNCS, 2301 tumors; pan-SEER, 6996 tu-mors). This alteration reflects the increase in the per-centage of tracheobronchopulmonary carcinoid tu-mors (ERG, 10.2%; pan-SEER, 27.9%) identified overthe past half-century.
Overall, in the combined series of 13,715 carcinoidtumors, 66.9% of all carcinoid tumors occurred in thegastrointestinal tract, whereas the tracheobronchop-ulmonary complex (24.5%) comprises the most fre-quent extradigestive site for carcinoid formation. Forthe most recent SEER subset, most carcinoid tumorswithin the gastrointestinal tract occurred in the smallbowel (41.8% of gastrointestinal carcinoids), with the
TABLE 3Population Ratios from Decennial Census Data
Census yr Applicable SEER subset
Ratio
Female:male White:black Non-Asian:Asiana Non-Hispanic:Hispanic
1980 Early SEER (1973–1991) 1.06 7.11 66.3 14.01990 Pan-SEER (1973–1999) 1.05 6.84 32.3 10.12000 Late SEER (1992–1999) 1.04 6.10 24.6 6.7
a The 1980 and 1990 United States Census grouping for “Asian” included respondents for Japanese, Chinese, Filipino, Korean, Asian Indian, and Vietnamese. However, for the United States Census 2000, respondents
were asked to report any one or more races they considered themselves; the Year 2000 ratio data corresponds to those indicating “Asian alone.”
Analysis of 13,715 Carcinoid Tumors/Modlin et al. 937
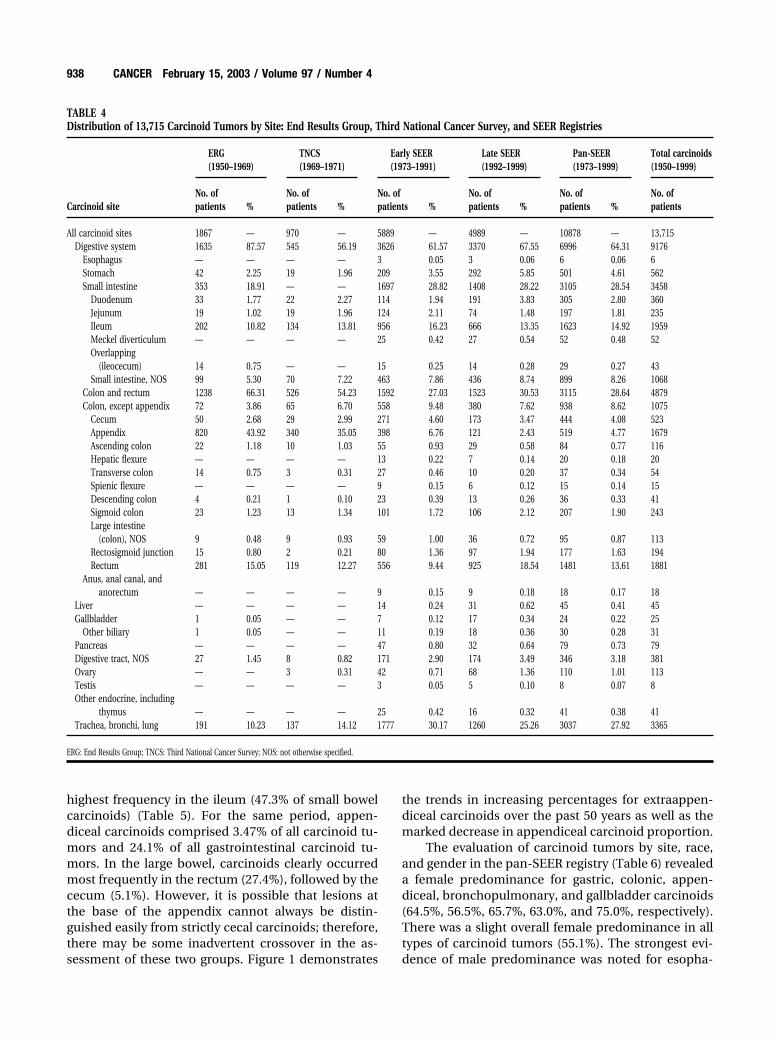
highest frequency in the ileum (47.3% of small bowelcarcinoids) (Table 5). For the same period, appen-diceal carcinoids comprised 3.47% of all carcinoid tu-mors and 24.1% of all gastrointestinal carcinoid tu-mors. In the large bowel, carcinoids clearly occurredmost frequently in the rectum (27.4%), followed by thececum (5.1%). However, it is possible that lesions atthe base of the appendix cannot always be distin-guished easily from strictly cecal carcinoids; therefore,there may be some inadvertent crossover in the as-sessment of these two groups. Figure 1 demonstrates
the trends in increasing percentages for extraappen-diceal carcinoids over the past 50 years as well as themarked decrease in appendiceal carcinoid proportion.
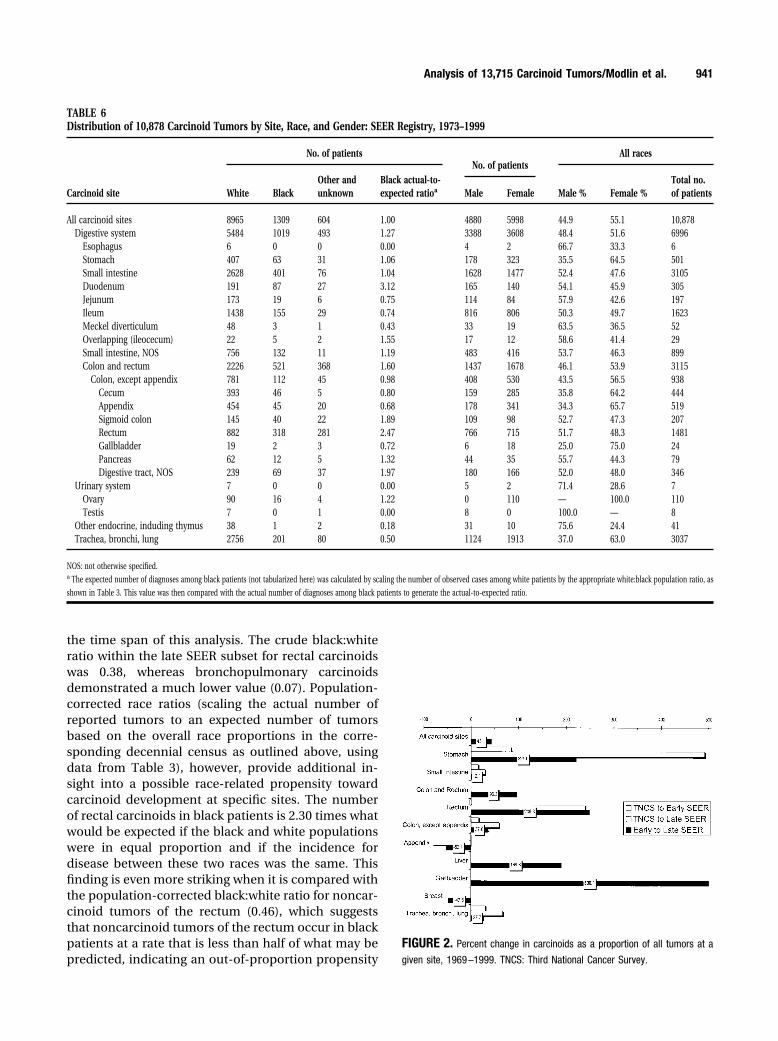
The evaluation of carcinoid tumors by site, race,and gender in the pan-SEER registry (Table 6) revealeda female predominance for gastric, colonic, appen-diceal, bronchopulmonary, and gallbladder carcinoids(64.5%, 56.5%, 65.7%, 63.0%, and 75.0%, respectively).There was a slight overall female predominance in alltypes of carcinoid tumors (55.1%). The strongest evi-dence of male predominance was noted for esopha-
TABLE 4Distribution of 13,715 Carcinoid Tumors by Site: End Results Group, Third National Cancer Survey, and SEER Registries
Carcinoid site
ERG(1950–1969)
TNCS(1969–1971)
Early SEER(1973–1991)
Late SEER(1992–1999)
Pan-SEER(1973–1999)
Total carcinoids(1950–1999)
No. ofpatients %
No. ofpatients %
No. ofpatients %
No. ofpatients %
No. ofpatients %
No. ofpatients
All carcinoid sites 1867 — 970 — 5889 — 4989 — 10878 — 13,715Digestive system 1635 87.57 545 56.19 3626 61.57 3370 67.55 6996 64.31 9176
Esophagus — — — — 3 0.05 3 0.06 6 0.06 6Stomach 42 2.25 19 1.96 209 3.55 292 5.85 501 4.61 562Small intestine 353 18.91 — — 1697 28.82 1408 28.22 3105 28.54 3458
Duodenum 33 1.77 22 2.27 114 1.94 191 3.83 305 2.80 360Jejunum 19 1.02 19 1.96 124 2.11 74 1.48 197 1.81 235Ileum 202 10.82 134 13.81 956 16.23 666 13.35 1623 14.92 1959Meckel diverticulum — — — — 25 0.42 27 0.54 52 0.48 52Overlapping
(ileocecum) 14 0.75 — — 15 0.25 14 0.28 29 0.27 43Small intestine, NOS 99 5.30 70 7.22 463 7.86 436 8.74 899 8.26 1068
Colon and rectum 1238 66.31 526 54.23 1592 27.03 1523 30.53 3115 28.64 4879Colon, except appendix 72 3.86 65 6.70 558 9.48 380 7.62 938 8.62 1075
Cecum 50 2.68 29 2.99 271 4.60 173 3.47 444 4.08 523Appendix 820 43.92 340 35.05 398 6.76 121 2.43 519 4.77 1679Ascending colon 22 1.18 10 1.03 55 0.93 29 0.58 84 0.77 116Hepatic flexure — — — — 13 0.22 7 0.14 20 0.18 20Transverse colon 14 0.75 3 0.31 27 0.46 10 0.20 37 0.34 54Spienic flexure — — — — 9 0.15 6 0.12 15 0.14 15Descending colon 4 0.21 1 0.10 23 0.39 13 0.26 36 0.33 41Sigmoid colon 23 1.23 13 1.34 101 1.72 106 2.12 207 1.90 243Large intestine
(colon), NOS 9 0.48 9 0.93 59 1.00 36 0.72 95 0.87 113Rectosigmoid junction 15 0.80 2 0.21 80 1.36 97 1.94 177 1.63 194Rectum 281 15.05 119 12.27 556 9.44 925 18.54 1481 13.61 1881
Anus, anal canal, andanorectum — — — — 9 0.15 9 0.18 18 0.17 18
Liver — — — — 14 0.24 31 0.62 45 0.41 45Gallbladder 1 0.05 — — 7 0.12 17 0.34 24 0.22 25
Other biliary 1 0.05 — — 11 0.19 18 0.36 30 0.28 31Pancreas — — — — 47 0.80 32 0.64 79 0.73 79Digestive tract, NOS 27 1.45 8 0.82 171 2.90 174 3.49 346 3.18 381Ovary — — 3 0.31 42 0.71 68 1.36 110 1.01 113Testis — — — — 3 0.05 5 0.10 8 0.07 8Other endocrine, including
thymus — — — — 25 0.42 16 0.32 41 0.38 41Trachea, bronchi, lung 191 10.23 137 14.12 1777 30.17 1260 25.26 3037 27.92 3365
ERG: End Results Group; TNCS: Third National Cancer Survey; NOS: not otherwise specified.
938 CANCER February 15, 2003 / Volume 97 / Number 4

geal carcinoids (66%) and thymic carcinoids (76%).Because each of these latter two groups represented asmall number of patients (6 patients and 41 patients,respectively), the strength of this observation is ques-tionable.
Examining the patient tallies by race, the crudenumber of carcinoid tumors arising in white patientsexceeds that for black patients at all sites. However,when the number of tumors in black patients is scaledby the ratio of white to black citizens, as identified inthe 1990 United States Census (Table 3), an estimateof the relative race-based incidence can be made. Forexample, 1990 census data suggest that there are 6.84white citizens for each black citizen in the UnitedStates. For the 882 rectal carcinoids identified in whitepatients within the pan-SEER database, it is possibleto expect that 882 � 6.84 � 129 rectal carcinoids
among black patients, if race played no factor in car-cinoid development. However, 318 such tumors wereregistered. This reveals an actual-to-expected ratio of318 � 129 � 2.47 for rectal carcinoids among blackpatients, suggesting that carcinoid tumors at this sitewere over-represented among black patients. Simi-larly, duodenal carcinoids demonstrate an incidencepropensity in black patients 3.12 times what would beexpected; earlier reports have not demonstrated anequivalently increased occurrence of peptic ulcers inthe black population.18 Bronchopulmonary carci-noids, however, are present in only half of the ex-pected number of black patients. The noncarcinoidlung carcinoma rate for the black population exceedsthat of the white population (79.8 vs. 60.6 per 100,000population, respectively), and the actual number ofsuch noncarcinoid lung carcinomas (34,921 patients)
TABLE 5Distribution of 9421 Gastrointestinal Carcinoid Tumors by Site: End Results Group, Third National Cancer Survey, and SEER Registries
Carcinoid site
ERG(1950–1969)
TNCS(1969–1971)
Early SEER(1973–1991)
Late SEER(1992–1999)
Pan-SEER(1973–1999)
Total carcinoids(1950–1999)
No. ofpatients %
No. ofpatients %
No. ofpatients %
No. ofpatients %
No. ofpatients %
No. ofpatients
Digestive system 1635 — 790 — 3626 — 3370 — 6996 — 9421Esophagus — — — — 3 0.08 3 0.09 6 0.09 6Stomach 42 2.57 19 2.41 209 5.76 292 8.66 501 7.16 562Small intestine 353 21.59 245 31.01 1697 46.80 1408 41.78 3105 44.38 3703
Duodenum 33 2.02 22 2.78 114 3.14 191 5.67 305 4.36 360Jejunum 19 1.16 19 2.41 124 3.42 74 2.20 197 2.82 235Ileum 202 12.35 134 16.96 956 26.37 666 19.76 1623 23.20 1959Meckel diverticulum — — — — 25 0.69 27 0.80 52 0.74 52Overlapping (lleocecum) 14 0.86 — — 15 0.41 14 0.42 29 0.41 43Small intestine, NOS 99 6.06 70 8.86 463 12.77 436 12.94 899 12.85 1068
Colon and rectum 1238 75.72 526 66.58 1592 43.91 1523 45.19 3115 44.53 4879Colon, except appendix 72 4.40 65 8.23 558 15.39 380 11.28 938 13.41 1075Colon, except rectum 942 57.61 405 51.27 956 26.37 501 14.87 1457 20.83 2804
Cecum 50 3.06 29 3.67 271 7.47 173 5.13 444 6.35 523Appendix 820 50.15 340 43.04 398 10.98 121 3.59 519 7.42 1679Ascending colon 22 1.35 10 1.27 55 1.52 29 0.86 84 1.20 116Hepatic flexure — — — — 13 0.36 7 0.21 20 0.29 20Transverse colon 14 0.86 3 0.38 27 0.74 10 0.30 37 0.53 54Splenic flexure — — — — 9 0.25 6 0.18 15 0.21 15Descending colon 4 0.24 1 0.13 23 0.63 13 0.39 36 0.51 41Sigmoid colon 23 1.41 13 1.65 101 2.79 106 3.15 207 2.96 243Large intestine (colon), NOS 9 0.55 9 1.14 59 1.63 36 1.07 95 1.36 113
Rectum and rectosigmoid junction 296 18.10 121 15.32 636 17.54 1022 30.33 1658 23.70 2075Rectosigmoid junction 15 0.92 2 0.25 80 2.21 97 2.88 177 2.53 194Rectum 281 17.19 119 15.06 556 15.33 925 27.45 1481 21.17 1881
Liver — — — — 14 0.39 31 0.92 45 0.64 45Intrahepatic bile ducts — — — — 0 0.00 1 0.03 1 0.01 1
Gallbladder 1 0.06 — — 7 0.19 17 0.50 24 0.34 25Other billary 1 0.06 — — 11 0.30 18 0.53 30 0.43 31
Pancreas — — — — 47 1.30 32 0.95 79 1.13 79Digestive tract, NOS 27 1.65 8 1.01 171 4.72 174 5.16 346 4.95 381
ERG: End Results Group; TNCS: Third National Cancer Survey; NOS: not otherwise specified.
Analysis of 13,715 Carcinoid Tumors/Modlin et al. 939
closely matches the expected number of patientsbased on decennial population census ratios (34,490patients). This supports the finding that although non-carcinoid lung carcinoma occurs in the white popula-tion at a frequency greater than or equal to the fre-quency that is expected in the black population,carcinoids of the lung are less prevalent among theblack population than may be expected.
It is interesting to note that the overall popula-tion-corrected number of carcinoid tumors in blackpatients (1311) is essentially equal to the actual num-ber of accrued patients (1309) (Table 6). This furthersupports the finding that particular sites for carcinoidtumors, rather than carcinoid tumors as a whole, mayharbor differential incidence proclivities within thispopulation.
Comparison of Carcinoids with Other Site-SpecificMalignanciesThe carcinoid and noncarcinoid tumors in the SEERfile were compared by site with regard to incidence,average age at diagnosis, male:female ratios, and var-ious race and origin ratios. By using the data from theTNCS series, trends in such ratios over the past 30years were examined. In the late SEER (1992–1999)subgroup, small intestinal carcinoids maintained arelatively high percentage (43.5%) of all tumors re-ported at this site. There was a marked increase in thepercentage of gastric carcinoids (TNCS, 0.3%; lateSEER, 1.77%), whereas the predominance of appen-diceal carcinoids decreased notably (TNCS, 77.3%; lateSEER, 15.2%). Examining the relative changes in car-cinoid presentation by site from the TNCS data set tothe late SEER subgroup revealed a 491% increase in
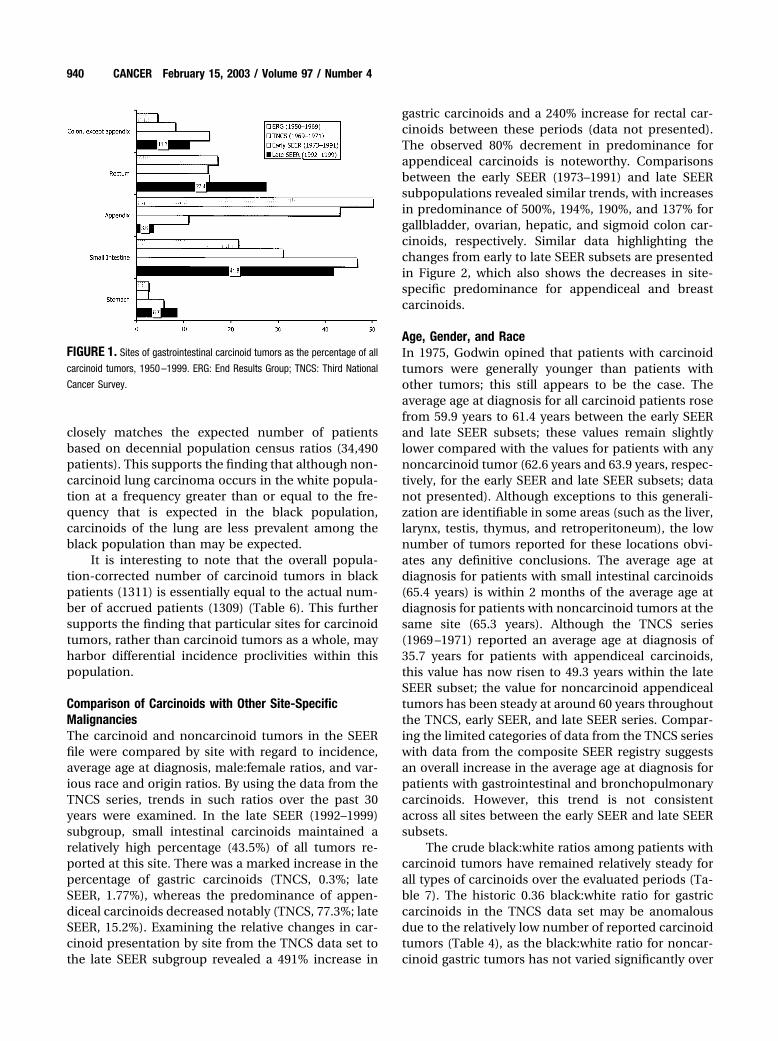
gastric carcinoids and a 240% increase for rectal car-cinoids between these periods (data not presented).The observed 80% decrement in predominance forappendiceal carcinoids is noteworthy. Comparisonsbetween the early SEER (1973–1991) and late SEERsubpopulations revealed similar trends, with increasesin predominance of 500%, 194%, 190%, and 137% forgallbladder, ovarian, hepatic, and sigmoid colon car-cinoids, respectively. Similar data highlighting thechanges from early to late SEER subsets are presentedin Figure 2, which also shows the decreases in site-specific predominance for appendiceal and breastcarcinoids.
Age, Gender, and RaceIn 1975, Godwin opined that patients with carcinoidtumors were generally younger than patients withother tumors; this still appears to be the case. Theaverage age at diagnosis for all carcinoid patients rosefrom 59.9 years to 61.4 years between the early SEERand late SEER subsets; these values remain slightlylower compared with the values for patients with anynoncarcinoid tumor (62.6 years and 63.9 years, respec-tively, for the early SEER and late SEER subsets; datanot presented). Although exceptions to this generali-zation are identifiable in some areas (such as the liver,larynx, testis, thymus, and retroperitoneum), the lownumber of tumors reported for these locations obvi-ates any definitive conclusions. The average age atdiagnosis for patients with small intestinal carcinoids(65.4 years) is within 2 months of the average age atdiagnosis for patients with noncarcinoid tumors at thesame site (65.3 years). Although the TNCS series(1969 –1971) reported an average age at diagnosis of35.7 years for patients with appendiceal carcinoids,this value has now risen to 49.3 years within the lateSEER subset; the value for noncarcinoid appendicealtumors has been steady at around 60 years throughoutthe TNCS, early SEER, and late SEER series. Compar-ing the limited categories of data from the TNCS serieswith data from the composite SEER registry suggestsan overall increase in the average age at diagnosis forpatients with gastrointestinal and bronchopulmonarycarcinoids. However, this trend is not consistentacross all sites between the early SEER and late SEERsubsets.
The crude black:white ratios among patients withcarcinoid tumors have remained relatively steady forall types of carcinoids over the evaluated periods (Ta-ble 7). The historic 0.36 black:white ratio for gastriccarcinoids in the TNCS data set may be anomalousdue to the relatively low number of reported carcinoidtumors (Table 4), as the black:white ratio for noncar-cinoid gastric tumors has not varied significantly over
FIGURE 1. Sites of gastrointestinal carcinoid tumors as the percentage of all
carcinoid tumors, 1950–1999. ERG: End Results Group; TNCS: Third National
Cancer Survey.
940 CANCER February 15, 2003 / Volume 97 / Number 4
the time span of this analysis. The crude black:whiteratio within the late SEER subset for rectal carcinoidswas 0.38, whereas bronchopulmonary carcinoidsdemonstrated a much lower value (0.07). Population-corrected race ratios (scaling the actual number ofreported tumors to an expected number of tumorsbased on the overall race proportions in the corre-sponding decennial census as outlined above, usingdata from Table 3), however, provide additional in-sight into a possible race-related propensity towardcarcinoid development at specific sites. The numberof rectal carcinoids in black patients is 2.30 times whatwould be expected if the black and white populationswere in equal proportion and if the incidence fordisease between these two races was the same. Thisfinding is even more striking when it is compared withthe population-corrected black:white ratio for noncar-cinoid tumors of the rectum (0.46), which suggeststhat noncarcinoid tumors of the rectum occur in blackpatients at a rate that is less than half of what may bepredicted, indicating an out-of-proportion propensity
FIGURE 2. Percent change in carcinoids as a proportion of all tumors at a
given site, 1969–1999. TNCS: Third National Cancer Survey.
TABLE 6Distribution of 10,878 Carcinoid Tumors by Site, Race, and Gender: SEER Registry, 1973–1999
Carcinoid site
No. of patientsNo. of patients
All races
White BlackOther andunknown
Black actual-to-expected ratioa Male Female Male % Female %
Total no.of patients
All carcinoid sites 8965 1309 604 1.00 4880 5998 44.9 55.1 10,878Digestive system 5484 1019 493 1.27 3388 3608 48.4 51.6 6996
Esophagus 6 0 0 0.00 4 2 66.7 33.3 6Stomach 407 63 31 1.06 178 323 35.5 64.5 501Small intestine 2628 401 76 1.04 1628 1477 52.4 47.6 3105Duodenum 191 87 27 3.12 165 140 54.1 45.9 305Jejunum 173 19 6 0.75 114 84 57.9 42.6 197Ileum 1438 155 29 0.74 816 806 50.3 49.7 1623Meckel diverticulum 48 3 1 0.43 33 19 63.5 36.5 52Overlapping (ileocecum) 22 5 2 1.55 17 12 58.6 41.4 29Small intestine, NOS 756 132 11 1.19 483 416 53.7 46.3 899Colon and rectum 2226 521 368 1.60 1437 1678 46.1 53.9 3115
Colon, except appendix 781 112 45 0.98 408 530 43.5 56.5 938Cecum 393 46 5 0.80 159 285 35.8 64.2 444Appendix 454 45 20 0.68 178 341 34.3 65.7 519Sigmoid colon 145 40 22 1.89 109 98 52.7 47.3 207Rectum 882 318 281 2.47 766 715 51.7 48.3 1481Gallbladder 19 2 3 0.72 6 18 25.0 75.0 24Pancreas 62 12 5 1.32 44 35 55.7 44.3 79Digestive tract, NOS 239 69 37 1.97 180 166 52.0 48.0 346
Urinary system 7 0 0 0.00 5 2 71.4 28.6 7Ovary 90 16 4 1.22 0 110 — 100.0 110Testis 7 0 1 0.00 8 0 100.0 — 8
Other endocrine, induding thymus 38 1 2 0.18 31 10 75.6 24.4 41Trachea, bronchi, lung 2756 201 80 0.50 1124 1913 37.0 63.0 3037
NOS: not otherwise specified.a The expected number of diagnoses among black patients (not tabularized here) was calculated by scaling the number of observed cases among white patients by the appropriate white:black population ratio, as
shown in Table 3. This value was then compared with the actual number of diagnoses among black patients to generate the actual-to-expected ratio.
Analysis of 13,715 Carcinoid Tumors/Modlin et al. 941
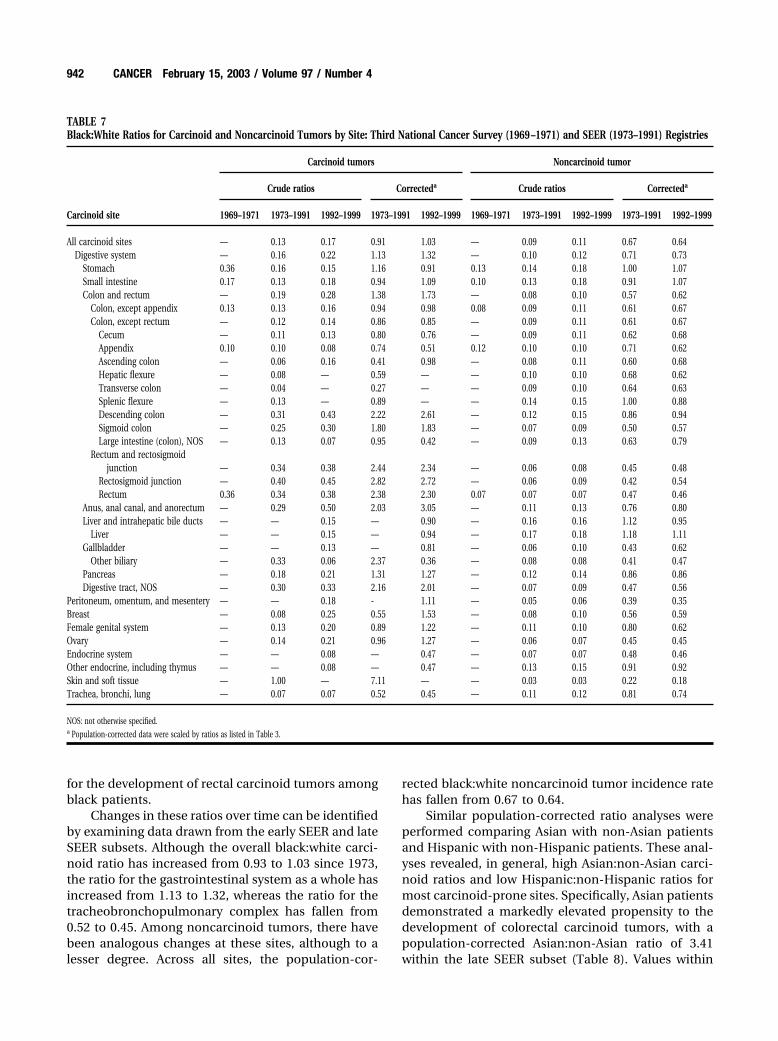
for the development of rectal carcinoid tumors amongblack patients.
Changes in these ratios over time can be identifiedby examining data drawn from the early SEER and lateSEER subsets. Although the overall black:white carci-noid ratio has increased from 0.93 to 1.03 since 1973,the ratio for the gastrointestinal system as a whole hasincreased from 1.13 to 1.32, whereas the ratio for thetracheobronchopulmonary complex has fallen from0.52 to 0.45. Among noncarcinoid tumors, there havebeen analogous changes at these sites, although to alesser degree. Across all sites, the population-cor-
rected black:white noncarcinoid tumor incidence ratehas fallen from 0.67 to 0.64.
Similar population-corrected ratio analyses wereperformed comparing Asian with non-Asian patientsand Hispanic with non-Hispanic patients. These anal-yses revealed, in general, high Asian:non-Asian carci-noid ratios and low Hispanic:non-Hispanic ratios formost carcinoid-prone sites. Specifically, Asian patientsdemonstrated a markedly elevated propensity to thedevelopment of colorectal carcinoid tumors, with apopulation-corrected Asian:non-Asian ratio of 3.41within the late SEER subset (Table 8). Values within
TABLE 7Black:White Ratios for Carcinoid and Noncarcinoid Tumors by Site: Third National Cancer Survey (1969 –1971) and SEER (1973–1991) Registries
Carcinoid site
Carcinoid tumors Noncarcinoid tumor
Crude ratios Correcteda Crude ratios Correcteda
1969–1971 1973–1991 1992–1999 1973–1991 1992–1999 1969–1971 1973–1991 1992–1999 1973–1991 1992–1999
All carcinoid sites — 0.13 0.17 0.91 1.03 — 0.09 0.11 0.67 0.64Digestive system — 0.16 0.22 1.13 1.32 — 0.10 0.12 0.71 0.73
Stomach 0.36 0.16 0.15 1.16 0.91 0.13 0.14 0.18 1.00 1.07Small intestine 0.17 0.13 0.18 0.94 1.09 0.10 0.13 0.18 0.91 1.07Colon and rectum — 0.19 0.28 1.38 1.73 — 0.08 0.10 0.57 0.62
Colon, except appendix 0.13 0.13 0.16 0.94 0.98 0.08 0.09 0.11 0.61 0.67Colon, except rectum — 0.12 0.14 0.86 0.85 — 0.09 0.11 0.61 0.67
Cecum — 0.11 0.13 0.80 0.76 — 0.09 0.11 0.62 0.68Appendix 0.10 0.10 0.08 0.74 0.51 0.12 0.10 0.10 0.71 0.62Ascending colon — 0.06 0.16 0.41 0.98 — 0.08 0.11 0.60 0.68Hepatic flexure — 0.08 — 0.59 — — 0.10 0.10 0.68 0.62Transverse colon — 0.04 — 0.27 — — 0.09 0.10 0.64 0.63Splenic flexure — 0.13 — 0.89 — — 0.14 0.15 1.00 0.88Descending colon — 0.31 0.43 2.22 2.61 — 0.12 0.15 0.86 0.94Sigmoid colon — 0.25 0.30 1.80 1.83 — 0.07 0.09 0.50 0.57Large intestine (colon), NOS — 0.13 0.07 0.95 0.42 — 0.09 0.13 0.63 0.79
Rectum and rectosigmoidjunction — 0.34 0.38 2.44 2.34 — 0.06 0.08 0.45 0.48
Rectosigmoid junction — 0.40 0.45 2.82 2.72 — 0.06 0.09 0.42 0.54Rectum 0.36 0.34 0.38 2.38 2.30 0.07 0.07 0.07 0.47 0.46
Anus, anal canal, and anorectum — 0.29 0.50 2.03 3.05 — 0.11 0.13 0.76 0.80Liver and intrahepatic bile ducts — — 0.15 — 0.90 — 0.16 0.16 1.12 0.95
Liver — — 0.15 — 0.94 — 0.17 0.18 1.18 1.11Gallbladder — — 0.13 — 0.81 — 0.06 0.10 0.43 0.62
Other biliary — 0.33 0.06 2.37 0.36 — 0.08 0.08 0.41 0.47Pancreas — 0.18 0.21 1.31 1.27 — 0.12 0.14 0.86 0.86Digestive tract, NOS — 0.30 0.33 2.16 2.01 — 0.07 0.09 0.47 0.56
Peritoneum, omentum, and mesentery — — 0.18 - 1.11 — 0.05 0.06 0.39 0.35Breast — 0.08 0.25 0.55 1.53 — 0.08 0.10 0.56 0.59Female genital system — 0.13 0.20 0.89 1.22 — 0.11 0.10 0.80 0.62Ovary — 0.14 0.21 0.96 1.27 — 0.06 0.07 0.45 0.45Endocrine system — — 0.08 — 0.47 — 0.07 0.07 0.48 0.46Other endocrine, including thymus — — 0.08 — 0.47 — 0.13 0.15 0.91 0.92Skin and soft tissue — 1.00 — 7.11 — — 0.03 0.03 0.22 0.18Trachea, bronchi, lung — 0.07 0.07 0.52 0.45 — 0.11 0.12 0.81 0.74
NOS: not otherwise specified.a Population-corrected data were scaled by ratios as listed in Table 3.
942 CANCER February 15, 2003 / Volume 97 / Number 4
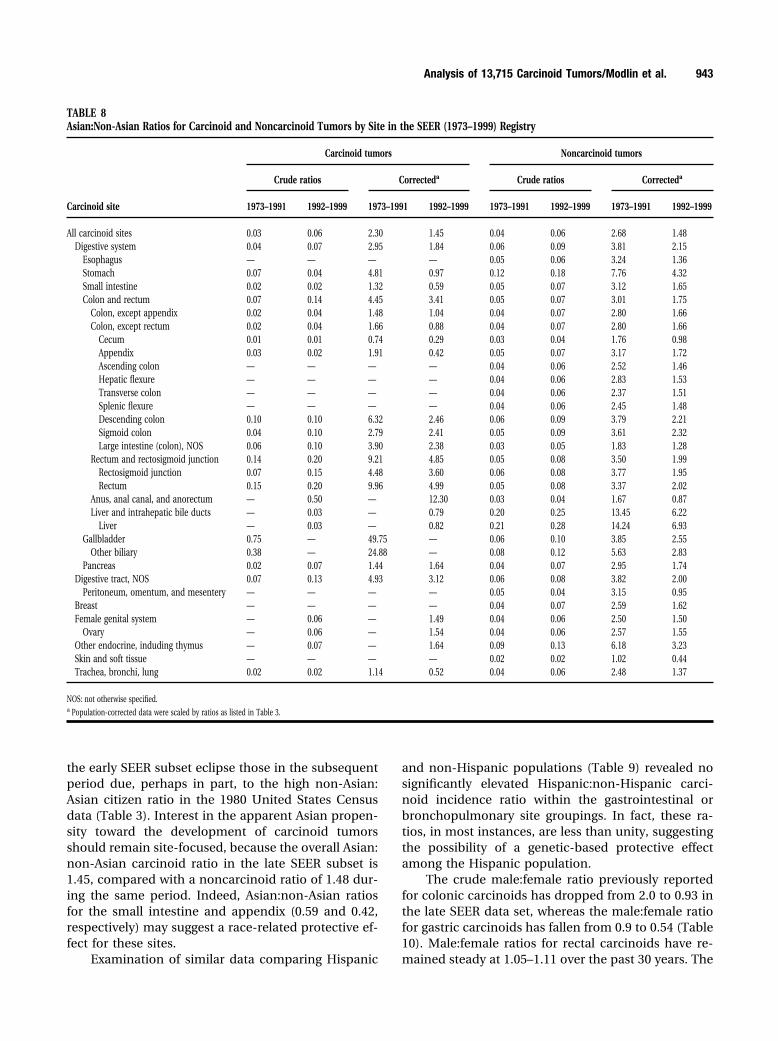
the early SEER subset eclipse those in the subsequentperiod due, perhaps in part, to the high non-Asian:Asian citizen ratio in the 1980 United States Censusdata (Table 3). Interest in the apparent Asian propen-sity toward the development of carcinoid tumorsshould remain site-focused, because the overall Asian:non-Asian carcinoid ratio in the late SEER subset is1.45, compared with a noncarcinoid ratio of 1.48 dur-ing the same period. Indeed, Asian:non-Asian ratiosfor the small intestine and appendix (0.59 and 0.42,respectively) may suggest a race-related protective ef-fect for these sites.
Examination of similar data comparing Hispanic
and non-Hispanic populations (Table 9) revealed nosignificantly elevated Hispanic:non-Hispanic carci-noid incidence ratio within the gastrointestinal orbronchopulmonary site groupings. In fact, these ra-tios, in most instances, are less than unity, suggestingthe possibility of a genetic-based protective effectamong the Hispanic population.
The crude male:female ratio previously reportedfor colonic carcinoids has dropped from 2.0 to 0.93 inthe late SEER data set, whereas the male:female ratiofor gastric carcinoids has fallen from 0.9 to 0.54 (Table10). Male:female ratios for rectal carcinoids have re-mained steady at 1.05–1.11 over the past 30 years. The
TABLE 8Asian:Non-Asian Ratios for Carcinoid and Noncarcinoid Tumors by Site in the SEER (1973–1999) Registry
Carcinoid site
Carcinoid tumors Noncarcinoid tumors
Crude ratios Correcteda Crude ratios Correcteda
1973–1991 1992–1999 1973–1991 1992–1999 1973–1991 1992–1999 1973–1991 1992–1999
All carcinoid sites 0.03 0.06 2.30 1.45 0.04 0.06 2.68 1.48Digestive system 0.04 0.07 2.95 1.84 0.06 0.09 3.81 2.15
Esophagus — — — — 0.05 0.06 3.24 1.36Stomach 0.07 0.04 4.81 0.97 0.12 0.18 7.76 4.32Small intestine 0.02 0.02 1.32 0.59 0.05 0.07 3.12 1.65Colon and rectum 0.07 0.14 4.45 3.41 0.05 0.07 3.01 1.75
Colon, except appendix 0.02 0.04 1.48 1.04 0.04 0.07 2.80 1.66Colon, except rectum 0.02 0.04 1.66 0.88 0.04 0.07 2.80 1.66
Cecum 0.01 0.01 0.74 0.29 0.03 0.04 1.76 0.98Appendix 0.03 0.02 1.91 0.42 0.05 0.07 3.17 1.72Ascending colon — — — — 0.04 0.06 2.52 1.46Hepatic flexure — — — — 0.04 0.06 2.83 1.53Transverse colon — — — — 0.04 0.06 2.37 1.51Splenic flexure — — — — 0.04 0.06 2.45 1.48Descending colon 0.10 0.10 6.32 2.46 0.06 0.09 3.79 2.21Sigmoid colon 0.04 0.10 2.79 2.41 0.05 0.09 3.61 2.32Large intestine (colon), NOS 0.06 0.10 3.90 2.38 0.03 0.05 1.83 1.28
Rectum and rectosigmoid junction 0.14 0.20 9.21 4.85 0.05 0.08 3.50 1.99Rectosigmoid junction 0.07 0.15 4.48 3.60 0.06 0.08 3.77 1.95Rectum 0.15 0.20 9.96 4.99 0.05 0.08 3.37 2.02
Anus, anal canal, and anorectum — 0.50 — 12.30 0.03 0.04 1.67 0.87Liver and intrahepatic bile ducts — 0.03 — 0.79 0.20 0.25 13.45 6.22
Liver — 0.03 — 0.82 0.21 0.28 14.24 6.93Gallbladder 0.75 — 49.75 — 0.06 0.10 3.85 2.55
Other biliary 0.38 — 24.88 — 0.08 0.12 5.63 2.83Pancreas 0.02 0.07 1.44 1.64 0.04 0.07 2.95 1.74
Digestive tract, NOS 0.07 0.13 4.93 3.12 0.06 0.08 3.82 2.00Peritoneum, omentum, and mesentery — — — — 0.05 0.04 3.15 0.95
Breast — — — — 0.04 0.07 2.59 1.62Female genital system — 0.06 — 1.49 0.04 0.06 2.50 1.50
Ovary — 0.06 — 1.54 0.04 0.06 2.57 1.55Other endocrine, induding thymus — 0.07 — 1.64 0.09 0.13 6.18 3.23Skin and soft tissue — — — — 0.02 0.02 1.02 0.44Trachea, bronchi, lung 0.02 0.02 1.14 0.52 0.04 0.06 2.48 1.37
NOS: not otherwise specified.a Population-corrected data were scaled by ratios as listed in Table 3.
Analysis of 13,715 Carcinoid Tumors/Modlin et al. 943

female predominance of appendiceal carcinoids hasdecreased from 77% of the TNCS patients to 57% ofthe late SEER subgroup. The marked male predomi-nance of noncarcinoid tumors of the trachea, bronchi,and lungs, however, decreased substantially duringthe same periods, with the male:female ratio droppingfrom 4.10 to 1.36.
As with the race-delineated statistics, correctionof the raw patient numbers for actual populationratios can demonstrate either a deleterious effect ora protective gender effect. In carcinoids of the analcomplex (anus, anal canal, and anorectum), the
male:female incidence ratio is 2.08 times whatwould be expected if both the population ratio andthe incidence rates for anal carcinoids were equiv-alent for males and females. Similar trends arenoted for carcinoids of the descending colon andurinary system. However, male gender appears toimpart a protective effect for carcinoids of the gall-bladder, with a corrected male:female ratio of 0.32in the late SEER subset; a similar but less pro-nounced gender disparity was noted for noncarci-noid tumors of the same site. This may suggest arelative gender-based propensity for carcinoid tumor
TABLE 9Hispanic:Non-Hispanic Ratios for Carcinoid and Noncarcinoid Tumors by Site: Third National Cancer Survey (1969 –1971)and SEER (1973–1991) Registries
Carcinoid site
Carcinoid tumors Noncarcinoid tumors
Crude ratios Correcteda Crude ratios Correcteda
1973–1991 1992–1999 1973–1991 1992–1999 1973–1991 1992–1999 1973–1991 1992–1999
All carcinoid sites 0.03 0.04 0.38 0.28 0.03 0.04 0.42 0.26Digestive system 0.03 0.05 0.37 0.31 0.03 0.04 0.41 0.29
Esophagus — — — — 0.02 0.03 0.33 0.23Stomach 0.04 0.10 0.59 0.64 0.05 0.07 0.76 0.47Small intestine 0.03 0.03 0.39 0.23 0.03 0.03 0.41 0.21Colon, except appendix 0.02 0.02 0.27 0.17 0.02 0.03 0.29 0.22Colon and rectum 0.02 0.05 0.34 0.32 0.02 0.04 0.31 0.24
Colon, except rectum 0.02 0.03 0.23 0.17 0.02 0.03 0.29 0.22Cecum 0.01 0.02 0.22 0.12 0.02 0.03 0.27 0.22Appendix 0.01 0.03 0.19 0.17 0.03 0.04 0.49 0.24Ascending colon 0.02 — 0.27 — 0.02 0.03 0.27 0.19Hepatic flexure — 0.17 — 1.12 0.02 0.03 0.25 0.19Transverse colon — 0.11 — 0.75 0.01 0.03 0.22 0.18Splenic flexure — — — — 0.02 0.03 0.30 0.21Descending colon — — — — 0.02 0.03 0.26 0.18Sigmoid colon 0.03 0.04 0.45 0.28 0.02 0.04 0.34 0.26Large intestine (colon), NOS 0.04 — 0.56 — 0.02 0.04 0.29 0.26
Rectum and rectosigmoid junction 0.04 0.06 0.52 0.41 0.02 0.04 0.36 0.29Rectosigmoid junction 0.01 0.04 0.19 0.30 0.02 0.04 0.33 0.26Rectum 0.04 0.06 0.57 0.42 0.03 0.04 0.38 0.30
Anus, anal canal, and anorectum — — — — 0.03 0.05 0.39 0.33Liver and intrahepatic bile duct — 0.19 — 1.24 0.05 0.08 0.73 0.54
Liver — 0.15 — 0.99 0.05 0.09 0.75 0.57Gallbladder — 0.06 — 0.42 0.09 0.09 1.25 0.62Other Biliary 0.10 — 1.45 — 0.04 0.05 0.58 0.34Pancreas — — — — 0.03 0.04 0.47 0.27
Digestive tract, NOS 0.03 0.04 0.37 0.24 0.03 0.05 0.39 0.32Peritoneum, omentum, and mesentery — — — — 0.03 0.05 0.50 0.31Breast — — — — 0.03 0.04 0.37 0.24Female genital system 0.05 — 0.67 — 0.05 0.06 0.66 0.39
Ovary 0.05 — 0.73 — 0.03 0.05 0.44 0.30Testis 0.50 — 7.25 — 0.04 0.07 0.61 0.45Other endocrine, including thymus — — — — 0.03 0.07 0.47 0.44
Skin and soft tissue — — — — 0.03 0.03 0.37 0.18Trachea, bronchi, lung 0.03 0.03 0.44 0.23 0.02 0.03 0.27 0.17
NOS: not otherwise specified.a Population-corrected data were scaled by ratios, as listed in Table 3.
944 CANCER February 15, 2003 / Volume 97 / Number 4
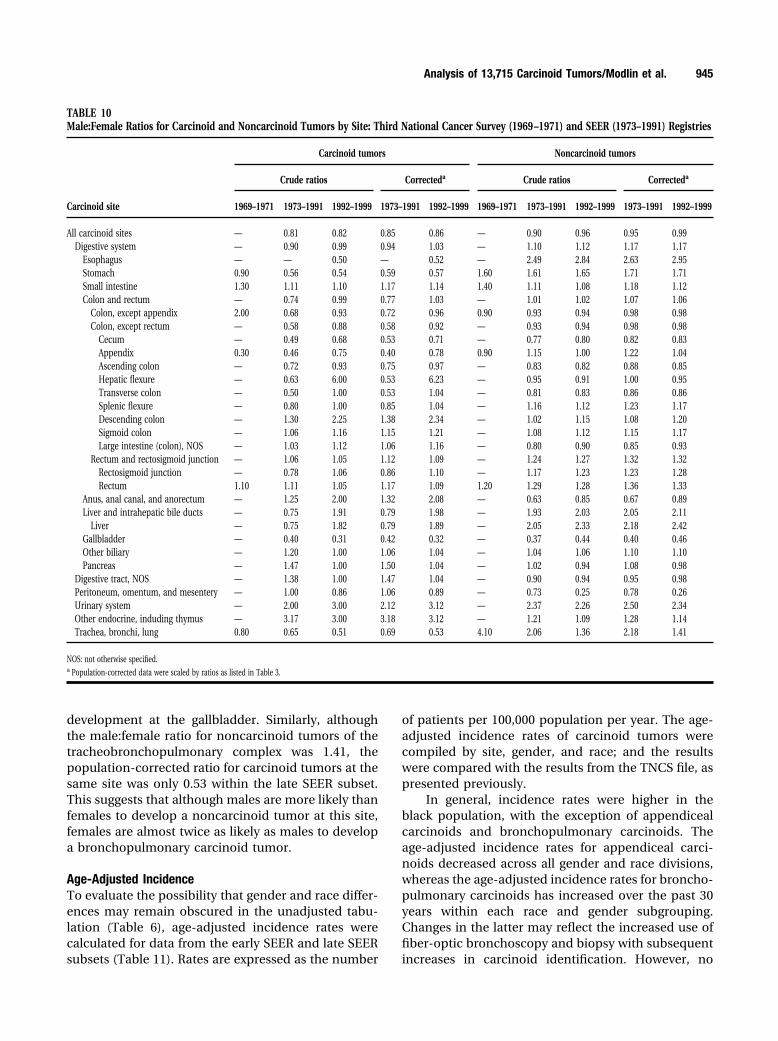
development at the gallbladder. Similarly, althoughthe male:female ratio for noncarcinoid tumors of thetracheobronchopulmonary complex was 1.41, thepopulation-corrected ratio for carcinoid tumors at thesame site was only 0.53 within the late SEER subset.This suggests that although males are more likely thanfemales to develop a noncarcinoid tumor at this site,females are almost twice as likely as males to developa bronchopulmonary carcinoid tumor.
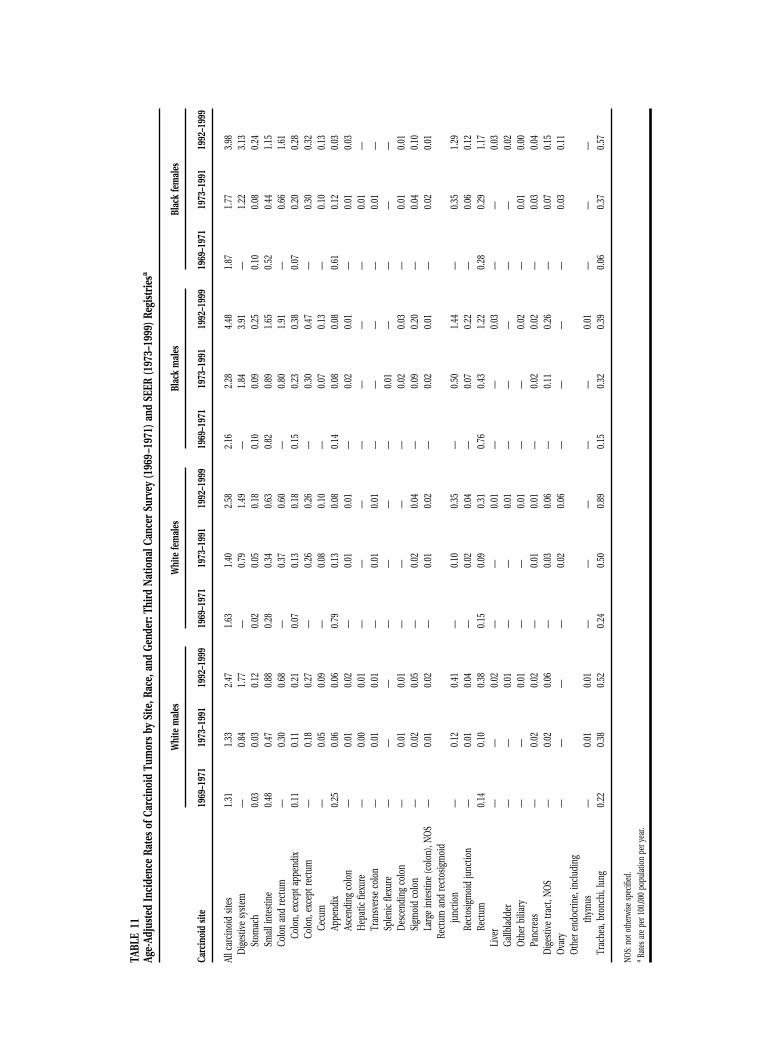
Age-Adjusted IncidenceTo evaluate the possibility that gender and race differ-ences may remain obscured in the unadjusted tabu-lation (Table 6), age-adjusted incidence rates werecalculated for data from the early SEER and late SEERsubsets (Table 11). Rates are expressed as the number
of patients per 100,000 population per year. The age-adjusted incidence rates of carcinoid tumors werecompiled by site, gender, and race; and the resultswere compared with the results from the TNCS file, aspresented previously.
In general, incidence rates were higher in theblack population, with the exception of appendicealcarcinoids and bronchopulmonary carcinoids. Theage-adjusted incidence rates for appendiceal carci-noids decreased across all gender and race divisions,whereas the age-adjusted incidence rates for broncho-pulmonary carcinoids has increased over the past 30years within each race and gender subgrouping.Changes in the latter may reflect the increased use offiber-optic bronchoscopy and biopsy with subsequentincreases in carcinoid identification. However, no
TABLE 10Male:Female Ratios for Carcinoid and Noncarcinoid Tumors by Site: Third National Cancer Survey (1969 –1971) and SEER (1973–1991) Registries
Carcinoid site
Carcinoid tumors Noncarcinoid tumors
Crude ratios Correcteda Crude ratios Correcteda
1969–1971 1973–1991 1992–1999 1973–1991 1992–1999 1969–1971 1973–1991 1992–1999 1973–1991 1992–1999
All carcinoid sites — 0.81 0.82 0.85 0.86 — 0.90 0.96 0.95 0.99Digestive system — 0.90 0.99 0.94 1.03 — 1.10 1.12 1.17 1.17
Esophagus — — 0.50 — 0.52 — 2.49 2.84 2.63 2.95Stomach 0.90 0.56 0.54 0.59 0.57 1.60 1.61 1.65 1.71 1.71Small intestine 1.30 1.11 1.10 1.17 1.14 1.40 1.11 1.08 1.18 1.12Colon and rectum — 0.74 0.99 0.77 1.03 — 1.01 1.02 1.07 1.06
Colon, except appendix 2.00 0.68 0.93 0.72 0.96 0.90 0.93 0.94 0.98 0.98Colon, except rectum — 0.58 0.88 0.58 0.92 — 0.93 0.94 0.98 0.98
Cecum — 0.49 0.68 0.53 0.71 — 0.77 0.80 0.82 0.83Appendix 0.30 0.46 0.75 0.40 0.78 0.90 1.15 1.00 1.22 1.04Ascending colon — 0.72 0.93 0.75 0.97 — 0.83 0.82 0.88 0.85Hepatic flexure — 0.63 6.00 0.53 6.23 — 0.95 0.91 1.00 0.95Transverse colon — 0.50 1.00 0.53 1.04 — 0.81 0.83 0.86 0.86Splenic flexure — 0.80 1.00 0.85 1.04 — 1.16 1.12 1.23 1.17Descending colon — 1.30 2.25 1.38 2.34 — 1.02 1.15 1.08 1.20Sigmoid colon — 1.06 1.16 1.15 1.21 — 1.08 1.12 1.15 1.17Large intestine (colon), NOS — 1.03 1.12 1.06 1.16 — 0.80 0.90 0.85 0.93
Rectum and rectosigmoid junction — 1.06 1.05 1.12 1.09 — 1.24 1.27 1.32 1.32Rectosigmoid junction — 0.78 1.06 0.86 1.10 — 1.17 1.23 1.23 1.28Rectum 1.10 1.11 1.05 1.17 1.09 1.20 1.29 1.28 1.36 1.33
Anus, anal canal, and anorectum — 1.25 2.00 1.32 2.08 — 0.63 0.85 0.67 0.89Liver and intrahepatic bile ducts — 0.75 1.91 0.79 1.98 — 1.93 2.03 2.05 2.11
Liver — 0.75 1.82 0.79 1.89 — 2.05 2.33 2.18 2.42Gallbladder — 0.40 0.31 0.42 0.32 — 0.37 0.44 0.40 0.46Other biliary — 1.20 1.00 1.06 1.04 — 1.04 1.06 1.10 1.10Pancreas — 1.47 1.00 1.50 1.04 — 1.02 0.94 1.08 0.98
Digestive tract, NOS — 1.38 1.00 1.47 1.04 — 0.90 0.94 0.95 0.98Peritoneum, omentum, and mesentery — 1.00 0.86 1.06 0.89 — 0.73 0.25 0.78 0.26Urinary system — 2.00 3.00 2.12 3.12 — 2.37 2.26 2.50 2.34Other endocrine, induding thymus — 3.17 3.00 3.18 3.12 — 1.21 1.09 1.28 1.14Trachea, bronchi, lung 0.80 0.65 0.51 0.69 0.53 4.10 2.06 1.36 2.18 1.41
NOS: not otherwise specified.a Population-corrected data were scaled by ratios as listed in Table 3.
Analysis of 13,715 Carcinoid Tumors/Modlin et al. 945
TABL
E11
Age-
Adju
sted
Inci
denc
eRa
tes
ofCa
rcin
oid
Tum
ors
bySi
te,R
ace,
and
Gend
er:T
hird
Natio
nalC
ance
rSu
rvey
(196
9–19
71)a
ndSE
ER(1
973–
1999
)Reg
istr
iesa
Carc
inoi
dsit
e
Whi
tem
ales
Whi
tefe
mal
esBl
ack
mal
esBl
ack
fem
ales
1969
–197
119
73–1
991
1992
–199
919
69–1
971
1973
–199
119
92–1
999
1969
–197
119
73–1
991
1992
–199
919
69–1
971
1973
–199
119
92–1
999
Allc
arci
noid
sites
1.31
1.33
2.47
1.63
1.40
2.58
2.16
2.28
4.48
1.87
1.77
3.98
Dig
estiv
esy
stem
—0.
841.
77—
0.79
1.49
—1.
843.
91—
1.22
3.13
Stom
ach
0.03
0.03
0.12
0.02
0.05
0.18
0.10
0.09
0.25
0.10
0.08
0.24
Smal
lint
estin
e0.
480.
470.
880.
280.
340.
630.
820.
891.
650.
520.
441.
15Co
lon
and
rect
um—
0.30
0.68
—0.
370.
60—
0.80
1.91
—0.
661.
61Co
lon,
exce
ptap
pend
ix0.
110.
110.
210.
070.
130.
180.
150.
230.
380.
070.
200.
28Co
lon,
exce
ptre
ctum
—0.
180.
27—
0.26
0.26
—0.
300.
47—
0.30
0.32
Cecu
m—
0.05
0.09
—0.
080.
10—
0.07
0.13
—0.
100.
13Ap
pend
ix0.
250.
060.
060.
790.
130.
080.
140.
080.
080.
610.
120.
03As
cend
ing
colo
n—
0.01
0.02
—0.
010.
01—
0.02
0.01
—0.
010.
03H
epat
icfie
xure
—0.
000.
01—
——
——
——
0.01
—Tr
ansv
erse
colo
n—
0.01
0.01
—0.
010.
01—
——
—0.
01—
Sple
nic
flexu
re—
——
——
——
0.01
——
——
Des
cend
ing
colo
n—
0.01
0.01
——
——
0.02
0.03
—0.
010.
01Si
gmoi
dco
lon
—0.
020.
05—
0.02
0.04
—0.
090.
20—
0.04
0.10
Larg
ein
test
ine
(col
on),
NO
S—
0.01
0.02
—0.
010.
02—
0.02
0.01
—0.
020.
01Re
ctum
and
rect
osig
moi
dju
nctio
n—
0.12
0.41
—0.
100.
35—
0.50
1.44
—0.
351.
29Re
ctos
igm
oid
junc
tion
—0.
010.
04—
0.02
0.04
—0.
070.
22—
0.06
0.12
Rect
um0.
140.
100.
380.
150.
090.
310.
760.
431.
220.
280.
291.
17Li
ver
——
0.02
——
0.01
——
0.03
——
0.03
Gallb
ladd
er—
—0.
01—
—0.
01—
——
——
0.02
Oth
erbi
liary
——
0.01
——
0.01
——
0.02
—0.
010.
00Pa
ncre
as—
0.02
0.02
—0.
010.
01—
0.02
0.02
—0.
030.
04D
iges
tive
tract
,NO
S—
0.02
0.06
—0.
030.
06—
0.11
0.26
—0.
070.
15O
vary
——
——
0.02
0.06
——
——
0.03
0.11
Oth
eren
docr
ine,
incl
udin
gth
ymus
—0.
010.
01—
——
——
0.01
——
—Tr
ache
a,br
onch
i,lu
ng0.
220.
380.
520.
240.
500.
890.
150.
320.
390.
060.
370.
57
NOS:
noto
ther
wise
spec
ified
.a
Rate
sare
per1
00,00
0po
pula
tion
pery
ear.
clear explanation of the changes noted for appen-diceal carcinoid data is available. The rates for gastriccarcinoids increased in all groups between the TNCSdata set and the late SEER data set, as have the ratesfor colonic carcinoids; increases in incidence for thelatter have been between 150% and 300% among blackmales and females, respectively. Among the whitepopulation (both male and female), the highest rateswere noted for small intestinal carcinoids (male, 0.88;female, 0.63) and bronchopulmonary carcinoids(male, 0.52; female, 0.89). In addition, in the blackpopulation (both male and female), a high incidenceof rectal carcinoids was observed, with rates rising to1.22 and 1.17 per 100,000 population per year, respec-tively, in the late SEER subset.
Associated NeoplasmsThe SEER database facilitates the identification of pa-tients with carcinoid tumors who are diagnosed withadditional carcinoid or noncarcinoid tumors. Acrossall anatomic sites, 22.4% of carcinoid tumors in thelate SEER subset were associated with other (noncar-cinoid) neoplasms (data not presented). Within thisperiod (1992–1999), it was noted that a high percent-age of associated tumors occurred with small intesti-nal carcinoids (29.0%), whereas lower rates werefound with rectal, gallbladder, appendiceal, and pan-creatic carcinoids (13.1%, 17.6%, 18.2%, and 18.8%,respectively). However, because these groups repre-sent a relatively small number of patients, the accu-racy of the latter observation is questionable.
Although patients with gastric carcinoid tumorshad an increased incidence of additional noncarcinoidtumors in the pan-SEER data set compared with theERG and TNCS groups (20.5–27.8% vs. 14% and 5%,respectively), this rate decreased by 26% between theearly SEER and late SEER subsets. This may representrecent improvements in endoscopic screening, bi-opsy, and identification of carcinoid tumors over thepast decade. It is possible that removal of carcinoidtumors lessens the incidence of associated tumors,because carcinoids, left undisturbed, may continue toproduce proliferative peptides, enhancing the devel-opment or growth of other neoplasia. There is somespeculation regarding the pericarcinoid micromilieu,which may promote the development of gastric ade-nocarcinomata.19 Similar improvements in colonos-copy surveillance, with early carcinoid nodule identi-fication, may explain the overall decrease of 16% intumors associated with colorectal carcinoids.
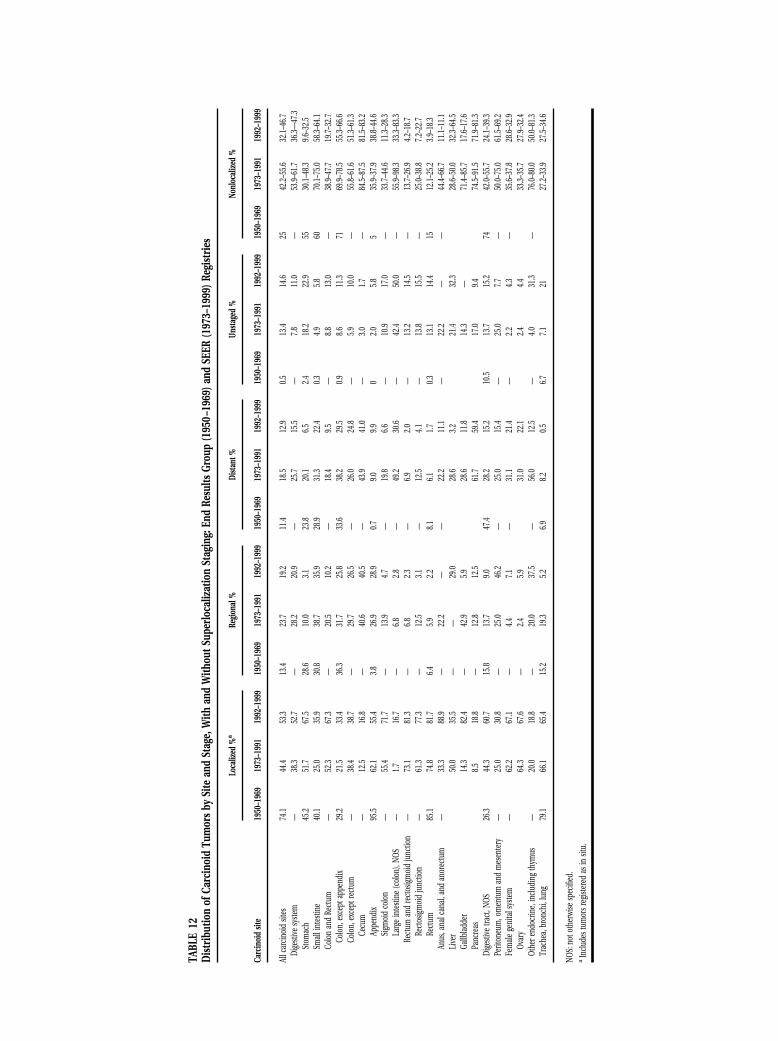
Metastatic DisseminationThe distribution of the SEER data by site and stage wasexamined to evaluate the propensity of individual sites
of carcinoid tumors to develop regional or distantmetastases; comparison to earlier data was made withthe ERG series. Disparate percentages of lesions (0.5%and 14.6%) of the ERG series and the late SEER series,respectively, had not been staged. For the late SEERperiod, this may be attributed to documentation man-dated by many hospitals at the time of patient dis-charge that requests the recording of tumor staging;this information may not always be availablepromptly; as such, tumors in these patients automat-ically may be designated as unstaged, even though thisinformation subsequently becomes available. To de-termine the range of frequencies at presentation fornonlocalized carcinoid tumors, unstaged lesions wereincluded serially within both localized and nonlocal-ized groupings; these results are presented in Table 12.The most significant variances are observed withincarcinoids of the liver, stomach, and rectum (unstagedlesions in 32.3%, 22.9%, and 14.4% of patients, respec-tively). The percentage of nonlocalized gastric lesionsdecreased over the past 49 years from 55% (ERG) to30.1% (early SEER). A further decrease to 9.6% in thelate SEER subset is evident despite the overall increasein incidence of gastric carcinoids (Table 4). This mayreflect an earlier stage diagnosis facilitated by in-creased utilization of upper gastrointestinal endos-copy and biopsy.
Overall, sites with the greatest percentages of non-locality at the time of presentation in the late SEERdata set included the cecum, pancreas, and small in-testine (81.5%, 71.9%, and 58.3%, respectively). Non-localized appendiceal carcinoids, which comprisedonly 5% of all appendiceal carcinoids within the ERGdata set, as noted previously, were increased to at least38.8%. This may represent improved awareness of thebiology of the lesion or greater sampling of periappen-diceal lymph nodes and surrounding tissues at appen-dectomy. Cumulative analysis of all types of carcinoidtumors in the SEER group indicated that in 12.9% ofpatients, metastases already were evident at the timeof diagnosis. This suggests that widely held beliefsregarding the benignity of carcinoid tumors should berevised and made clear to both the public and practi-tioners.
Five-Year Survival RatesThe 5-year survival rates of carcinoid tumors weretabulated by site and extent. In nearly all carcinoidtumors, irrespective of site, the stage of the diseaseclosely paralleled overall survival (Table 13). The5-year survival rate for all types of carcinoid tumoracross all stages within the late SEER subset was67.2%, a modest increase compared with the earlySEER subset (59.5%). The presence of regional and
Analysis of 13,715 Carcinoid Tumors/Modlin et al. 947
TABL
E12
Dis
trib
utio
nof
Carc
inoi
dTu
mor
sby
Site
and
Stag
e,W
ithan
dW
ithou
tSup
erlo
caliz
atio
nSt
agin
g:En
dRe
sults
Grou
p(1
950–
1969
)and
SEER
(197
3–19
99)R
egis
trie
s
Carc
inoi
dsit
e
Loca
lized
%a
Regi
onal
%Di
stant
%Un
stag
ed%
Nonl
ocal
ized
%
1950
–196
919
73–1
991
1992
–199
919
50–1
969
1973
–199
119
92–1
999
1950
–196
919
73–1
991
1992
–199
919
50–1
969
1973
–199
119
92–1
999
1950
–196
919
73–1
991
1992
–199
9
Allc
arcin
oid
sites
74.1
44.4
53.3
13.4
23.7
19.2
11.4
18.5
12.9
0.513
.414
.625
42.2–
55.6
32.1–
46.7
Dige
stive
syste
m—
38.3
52.7
—28
.220
.9—
25.7
15.5
—7.8
11.0
—53
.9–61
.736
.3—47
.3St
omac
h45
.251
.767
.528
.610
.03.1
23.8
20.1
6.52.4
18.2
22.9
5530
.1–48
.39.6
–32.5
Smal
lint
estin
e40
.125
.035
.930
.838
.735
.928
.931
.322
.40.3
4.95.8
6070
.1–75
.058
.3–64
.1Co
lon
and
Rect
um—
52.3
67.3
—20
.510
.2—
18.4
9.5—
8.813
.0—
38.9–
47.7
19.7–
32.7
Colo
n,ex
cept
appe
ndix
29.2
21.5
33.4
36.3
31.7
25.8
33.6
38.2
29.5
0.98.6
11.3
7169
.9–78
.555
.3–66
.6Co
lon,
exce
ptre
ctum
—38
.438
.7—
29.7
26.5
—26
.024
.8—
5.910
.0—
55.8–
61.6
51.3–
61.3
Cecu
m—
12.5
16.8
—40
.640
.5—
43.9
41.0
—3.0
1.7—
84.5–
87.5
81.5–
83.2
Appe
ndix
95.5
62.1
55.4
3.826
.928
.90.7
9.09.9
02.0
5.85
35.9–
37.9
38.8–
44.6
Sigm
oid
colo
n—
55.4
71.7
—13
.94.7
—19
.86.6
—10
.917
.0—
33.7–
44.6
11.3–
28.3
Larg
ein
testi
ne(c
olon
),NO
S—
1.716
.7—
6.82.8
—49
.230
.6—
42.4
50.0
—55
.9–98
.333
.3–83
.3Re
ctum
and
rect
osig
moi
dju
nctio
n—
73.1
81.3
—6.8
2.3—
6.92.0
—13
.214
.5—
13.7–
26.9
4.2–1
8.7Re
ctos
igm
oid
junc
tion
—61
.377
.3—
12.5
3.1—
12.5
4.1—
13.8
15.5
—25
.0–38
.87.2
–22.7
Rect
um85
.174
.881
.76.4
5.92.2
8.16.1
1.70.3
13.1
14.4
1512
.1–25
.23.9
–18.3
Anus
,ana
lcan
al,a
ndan
orec
tum
—33
.388
.9—
22.2
——
22.2
11.1
—22
.2—
—44
.4–66
.711
.1–11
.1Li
ver
50.0
35.5
——
29.0
28.6
3.221
.432
.328
.6–50
.032
.3–64
.5Ga
llbla
dder
14.3
82.4
—42
.95.9
28.6
11.8
14.3
—71
.4–85
.717
.6–17
.6Pa
ncre
as8.5
18.8
—12
.812
.561
.759
.417
.09.4
74.5–
91.5
71.9–
81.3
Dige
stive
tract
,NOS
26.3
44.3
60.7
15.8
13.7
9.047
.428
.215
.210
.513
.715
.274
42.0–
55.7
24.1–
39.3
Perit
oneu
m,o
men
tum
and
mes
ente
ry—
25.0
30.8
—25
.046
.2—
25.0
15.4
—25
.07.7
—50
.0–75
.061
.5–69
.2Fe
mal
ege
nita
lsys
tem
—62
.267
.1—
4.47.1
—31
.121
.4—
2.24.3
—35
.6–37
.828
.6–32
.9Ov
ary
64.3
67.6
—2.4
5.931
.022
.12.4
4.433
.3–35
.727
.9–32
.4Ot
here
ndoc
rine,
inclu
ding
thym
us—
20.0
18.8
—20
.037
.5—
56.0
12.5
—4.0
31.3
—76
.0–80
.050
.0–81
.3Tr
ache
a,br
onch
i,lu
ng79
.166
.165
.415
.219
.35.2
6.98.2
0.56.7
7.121
27.2–
33.9
27.5–
34.6
NOS:
noto
ther
wise
spec
ified
.a
Inclu
dest
umor
sreg
ister
edas
insit
u.
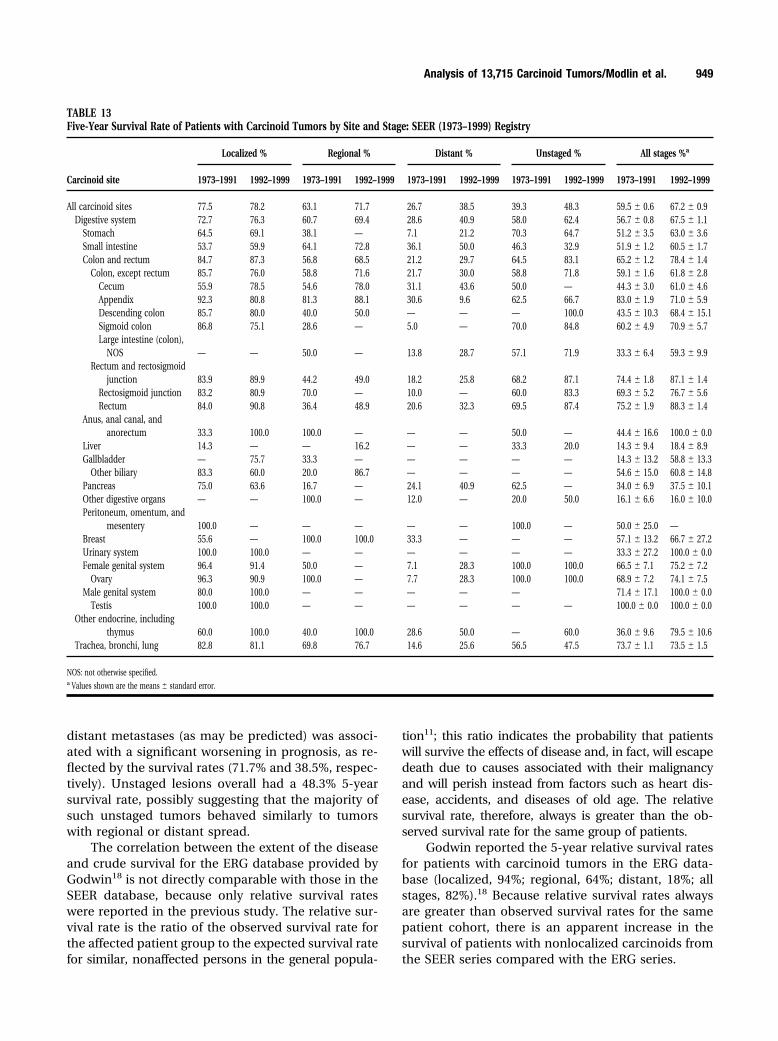
distant metastases (as may be predicted) was associ-ated with a significant worsening in prognosis, as re-flected by the survival rates (71.7% and 38.5%, respec-tively). Unstaged lesions overall had a 48.3% 5-yearsurvival rate, possibly suggesting that the majority ofsuch unstaged tumors behaved similarly to tumorswith regional or distant spread.
The correlation between the extent of the diseaseand crude survival for the ERG database provided byGodwin18 is not directly comparable with those in theSEER database, because only relative survival rateswere reported in the previous study. The relative sur-vival rate is the ratio of the observed survival rate forthe affected patient group to the expected survival ratefor similar, nonaffected persons in the general popula-
tion11; this ratio indicates the probability that patientswill survive the effects of disease and, in fact, will escapedeath due to causes associated with their malignancyand will perish instead from factors such as heart dis-ease, accidents, and diseases of old age. The relativesurvival rate, therefore, always is greater than the ob-served survival rate for the same group of patients.
Godwin reported the 5-year relative survival ratesfor patients with carcinoid tumors in the ERG data-base (localized, 94%; regional, 64%; distant, 18%; allstages, 82%).18 Because relative survival rates alwaysare greater than observed survival rates for the samepatient cohort, there is an apparent increase in thesurvival of patients with nonlocalized carcinoids fromthe SEER series compared with the ERG series.
TABLE 13Five-Year Survival Rate of Patients with Carcinoid Tumors by Site and Stage: SEER (1973–1999) Registry
Carcinoid site
Localized % Regional % Distant % Unstaged % All stages %a
1973–1991 1992–1999 1973–1991 1992–1999 1973–1991 1992–1999 1973–1991 1992–1999 1973–1991 1992–1999
All carcinoid sites 77.5 78.2 63.1 71.7 26.7 38.5 39.3 48.3 59.5 � 0.6 67.2 � 0.9Digestive system 72.7 76.3 60.7 69.4 28.6 40.9 58.0 62.4 56.7 � 0.8 67.5 � 1.1
Stomach 64.5 69.1 38.1 — 7.1 21.2 70.3 64.7 51.2 � 3.5 63.0 � 3.6Small intestine 53.7 59.9 64.1 72.8 36.1 50.0 46.3 32.9 51.9 � 1.2 60.5 � 1.7Colon and rectum 84.7 87.3 56.8 68.5 21.2 29.7 64.5 83.1 65.2 � 1.2 78.4 � 1.4
Colon, except rectum 85.7 76.0 58.8 71.6 21.7 30.0 58.8 71.8 59.1 � 1.6 61.8 � 2.8Cecum 55.9 78.5 54.6 78.0 31.1 43.6 50.0 — 44.3 � 3.0 61.0 � 4.6Appendix 92.3 80.8 81.3 88.1 30.6 9.6 62.5 66.7 83.0 � 1.9 71.0 � 5.9Descending colon 85.7 80.0 40.0 50.0 — — — 100.0 43.5 � 10.3 68.4 � 15.1Sigmoid colon 86.8 75.1 28.6 — 5.0 — 70.0 84.8 60.2 � 4.9 70.9 � 5.7Large intestine (colon),
NOS — — 50.0 — 13.8 28.7 57.1 71.9 33.3 � 6.4 59.3 � 9.9Rectum and rectosigmoid
junction 83.9 89.9 44.2 49.0 18.2 25.8 68.2 87.1 74.4 � 1.8 87.1 � 1.4Rectosigmoid junction 83.2 80.9 70.0 — 10.0 — 60.0 83.3 69.3 � 5.2 76.7 � 5.6Rectum 84.0 90.8 36.4 48.9 20.6 32.3 69.5 87.4 75.2 � 1.9 88.3 � 1.4
Anus, anal canal, andanorectum 33.3 100.0 100.0 — — — 50.0 — 44.4 � 16.6 100.0 � 0.0
Liver 14.3 — — 16.2 — — 33.3 20.0 14.3 � 9.4 18.4 � 8.9Gallbladder — 75.7 33.3 — — — — — 14.3 � 13.2 58.8 � 13.3
Other biliary 83.3 60.0 20.0 86.7 — — — — 54.6 � 15.0 60.8 � 14.8Pancreas 75.0 63.6 16.7 — 24.1 40.9 62.5 — 34.0 � 6.9 37.5 � 10.1Other digestive organs — — 100.0 — 12.0 — 20.0 50.0 16.1 � 6.6 16.0 � 10.0Peritoneum, omentum, and
mesentery 100.0 — — — — — 100.0 — 50.0 � 25.0 —Breast 55.6 — 100.0 100.0 33.3 — — — 57.1 � 13.2 66.7 � 27.2Urinary system 100.0 100.0 — — — — — — 33.3 � 27.2 100.0 � 0.0Female genital system 96.4 91.4 50.0 — 7.1 28.3 100.0 100.0 66.5 � 7.1 75.2 � 7.2
Ovary 96.3 90.9 100.0 — 7.7 28.3 100.0 100.0 68.9 � 7.2 74.1 � 7.5Male genital system 80.0 100.0 — — — — — 71.4 � 17.1 100.0 � 0.0
Testis 100.0 100.0 — — — — — — 100.0 � 0.0 100.0 � 0.0Other endocrine, including
thymus 60.0 100.0 40.0 100.0 28.6 50.0 — 60.0 36.0 � 9.6 79.5 � 10.6Trachea, bronchi, lung 82.8 81.1 69.8 76.7 14.6 25.6 56.5 47.5 73.7 � 1.1 73.5 � 1.5
NOS: not otherwise specified.a Values shown are the means � standard error.
Analysis of 13,715 Carcinoid Tumors/Modlin et al. 949
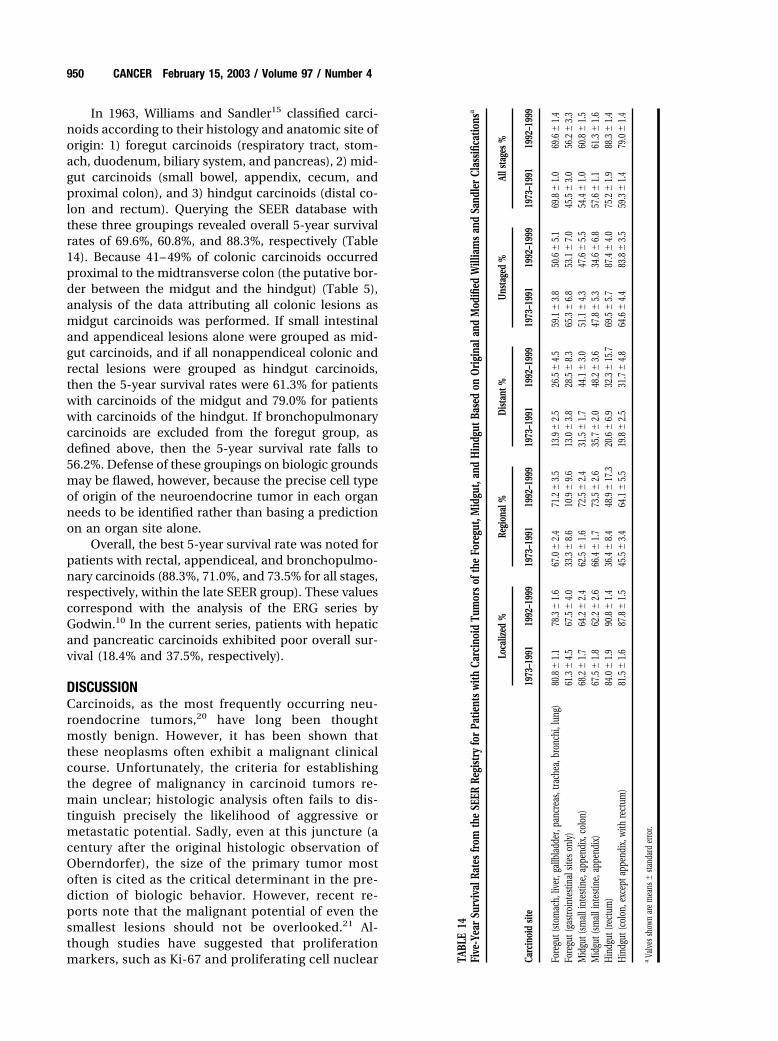
In 1963, Williams and Sandler15 classified carci-noids according to their histology and anatomic site oforigin: 1) foregut carcinoids (respiratory tract, stom-ach, duodenum, biliary system, and pancreas), 2) mid-gut carcinoids (small bowel, appendix, cecum, andproximal colon), and 3) hindgut carcinoids (distal co-lon and rectum). Querying the SEER database withthese three groupings revealed overall 5-year survivalrates of 69.6%, 60.8%, and 88.3%, respectively (Table14). Because 41– 49% of colonic carcinoids occurredproximal to the midtransverse colon (the putative bor-der between the midgut and the hindgut) (Table 5),analysis of the data attributing all colonic lesions asmidgut carcinoids was performed. If small intestinaland appendiceal lesions alone were grouped as mid-gut carcinoids, and if all nonappendiceal colonic andrectal lesions were grouped as hindgut carcinoids,then the 5-year survival rates were 61.3% for patientswith carcinoids of the midgut and 79.0% for patientswith carcinoids of the hindgut. If bronchopulmonarycarcinoids are excluded from the foregut group, asdefined above, then the 5-year survival rate falls to56.2%. Defense of these groupings on biologic groundsmay be flawed, however, because the precise cell typeof origin of the neuroendocrine tumor in each organneeds to be identified rather than basing a predictionon an organ site alone.
Overall, the best 5-year survival rate was noted forpatients with rectal, appendiceal, and bronchopulmo-nary carcinoids (88.3%, 71.0%, and 73.5% for all stages,respectively, within the late SEER group). These valuescorrespond with the analysis of the ERG series byGodwin.10 In the current series, patients with hepaticand pancreatic carcinoids exhibited poor overall sur-vival (18.4% and 37.5%, respectively).
DISCUSSIONCarcinoids, as the most frequently occurring neu-roendocrine tumors,20 have long been thoughtmostly benign. However, it has been shown thatthese neoplasms often exhibit a malignant clinicalcourse. Unfortunately, the criteria for establishingthe degree of malignancy in carcinoid tumors re-main unclear; histologic analysis often fails to dis-tinguish precisely the likelihood of aggressive ormetastatic potential. Sadly, even at this juncture (acentury after the original histologic observation ofOberndorfer), the size of the primary tumor mostoften is cited as the critical determinant in the pre-diction of biologic behavior. However, recent re-ports note that the malignant potential of even thesmallest lesions should not be overlooked.21 Al-though studies have suggested that proliferationmarkers, such as Ki-67 and proliferating cell nuclear TA
BLE
14Fi
ve-Y
ear
Surv
ival
Rate
sfr
omth
eSE
ERRe
gist
ryfo
rPa
tient
sw
ithCa
rcin
oid
Tum
ors
ofth
eFo
regu
t,M
idgu
t,an
dH
indg
utBa
sed
onO
rigi
nala
ndM
odifi
edW
illia
ms
and
Sand
ler
Clas
sific
atio
nsa
Carc
inoi
dsit
e
Loca
lized
%Re
gion
al%
Dist
ant%
Uns
tage
d%
Alls
tage
s%
1973
–199
119
92–1
999
1973
–199
119
92–1
999
1973
–199
119
92–1
999
1973
–199
119
92–1
999
1973
–199
119
92–1
999
Fore
gut(
stom
ach,
liver
,gal
lbla
dder
,pan
crea
s,tra
chea
,bro
nchi
,lun
g)80
.8�
1.1
78.3
�1.
667
.0�
2.4
71.2
�3.
513
.9�
2.5
26.5
�4.
559
.1�
3.8
50.6
�5.
169
.8�
1.0
69.6
�1.
4Fo
regu
t(ga
stro
inte
stin
alsit
eson
ly)
61.3
�4.
567
.5�
4.0
33.3
�8.
610
.9�
9.6
13.0
�3.
828
.5�
8.3
65.3
�6.
853
.1�
7.0
45.5
�3.
056
.2�
3.3
Mid
gut(
smal
lint
estin
e,ap
pend
ix,c
olon
)68
.2�
1.7
64.2
�2.
462
.5�
1.6
72.5
�2.
431
.5�
1.7
44.1
�3.
051
.1�
4.3
47.6
�5.
554
.4�
1.0
60.8
�1.
5M
idgu
t(sm
alli
ntes
tine,
appe
ndix
)67
.5�
1.8
62.2
�2.
666
.4�
1.7
73.5
�2.
635
.7�
2.0
48.2
�3.
647
.8�
5.3
34.6
�6.
857
.6�
1.1
61.3
�1.
6H
indg
ut(re
ctum
)84
.0�
1.9
90.8
�1.
436
.4�
8.4
48.9
�17
.320
.6�
6.9
32.3
�15
.769
.5�
5.7
87.4
�4.
075
.2�
1.9
88.3
�1.
4H
indg
ut(c
olon
,exc
epta
ppen
dix,
with
rect
um)
81.5
�1.
687
.8�
1.5
45.5
�3.
464
.1�
5.5
19.8
�2.
531
.7�
4.8
64.6
�4.
483
.8�
3.5
59.3
�1.
479
.0�
1.4
aVa
lvess
hown
are
mea
ns�
stand
ard
erro
r.
950 CANCER February 15, 2003 / Volume 97 / Number 4
antigen, may be of use,22,23 the best aggregate indi-cators of prognosis and malignancy appear to beevidence of invasive growth and the presence ofregional or distant metastases.
The distribution of carcinoid tumors across vari-ous anatomic sites is worthy of close examination.These lesions often are incidental findings and, thus,their relative incidence certainly will increase asscreening techniques and indications are broad-ened.24 Furthermore, the detection rate for carcinoidtumors may be biased by the group sampled. This isexemplified best by the report of Berge and Linell,25
who evaluated 16,294 autopsies and 44 surgical spec-imens in Malmo between 1958 and 1969, noting acarcinoid incidence of 8.4 per 100,000 population peryear, which is nearly twice the age-adjusted incidencein the late SEER group recorded in the most affectedUnited States group, the black male population (4.48per 100,000 population per year) (Table 11). This dis-crepancy with the autopsy-based series describedabove suggests that considerable percentages of car-cinoid tumors remain asymptomatic and undetectedduring life.
Recent incidence rates for all types of carcinoidtumors in Sweden have been estimated by Hemminkiand Li at 2.0 for men and 2.4 for women, based on asubset of 5184 tumors examined between 1958 and1998.26 These data are comparable to the results foundin the current study (Table 11). Other groups havereported somewhat lower incidence rates. In a seriesof 3382 carcinoid tumors of all types in England, New-ton et al. reported an overall age-adjusted incidence of0.71 for men and 0.87 for women per 100,000 popu-lation per year.27 The Tuscany Tumor Registry, asnoted by Crocetti et al.,28 suggests a carcinoid inci-dence rate of 0.65. Incidence rates for both men andwomen in Denmark are around 1.1 per 100,000 per-son-years.29
StomachThe percentage of gastric carcinoids among all car-cinoid tumors increased from 2.25% in Godwin’sseries10 to 5.85% in the late SEER subset (Table 4)and remains at 4.10% of the entire set of 13,715carcinoid tumors. In the series by Berge and Linell,gastric carcinoids comprised 2.9% of 244 carcinoidtumors of all types.25 In a later series, Levi et al.30
analyzed 248 carcinoid tumors registered from 1974to 1989 in canton Vaud of Switzerland and noted a4.2% relative percentage for gastric carcinoids inmales and 4.6% in females. It is also apparent thatthe percentage of gastric carcinoids in relation to allgastric tumors also has been increasing (TNCS,0.3%; SEER 1973–1987, 0.4%;15 early SEER, 0.55%;
late SEER, 1.77%). Whether this represents a trueincrease or a change in reporting (the 501 gastriccarcinoid tumors recorded in the SEER registry sig-nificantly overshadow the 61 tumors accrued priorto 1973) or whether it is the result of increasedawareness and the employment of modern diagnos-tic modalities, such as endoscopy and immunohis-tochemistry, remains unclear.
The association between hypergastrinemia asso-ciated with low-acid states and gastric enterochromaf-fin-like (ECL) cell hyperplasia and subsequent neopla-sia has been demonstrated in both human and animalmodels.31–33 Gastric carcinoid tumors have not beenidentified specifically in association with long-termacid-inhibitory therapy, although ECL cell hyperplasiahas been observed in such individuals.34 –37 It is par-ticularly interesting to note the proposed relation be-tween gastric adenocarcinoma and gastric carci-noids.38 – 42 It has been hypothesized that carcinoidlesions arising from a low-acid state may promotealterations in adjacent mucosal cells through the se-cretion of various growth factors, eventually culminat-ing in the formation of adenocarcinomata.43 Althoughthis has not been proven to date, the predominance ofgastric carcinoids in females and in the black andAsian populations suggests the possibility of a hor-monal or genetic predisposition to such disease. Sup-port is found in the increased incidence of gastriccarcinoids associated with gastrinomas of the multipleendocrine neoplasia syndrome, type 1 (MEN-1), butnot with sporadic gastrinomas.33 A similar geneticpropensity has been noted in an African rodent modelof gastric carcinoid.44
Although the majority of gastric carcinoid tumorsare recognized at an early stage and demonstrate agood prognosis, the modest 63.0% all-stage, 5-yearsurvival rate demonstrates that such lesions may ex-hibit significantly malignant behavior. The inclusionof nonenterochromaffin-like cell lesions, which aregastrin-independent and have a far worse prognosis,may have an adverse influence on the more benignprognosis usually accorded to this group. It may havebeen predicted that, with the changes in reportingstrategy incorporated in 1986 (i.e., all carcinoids nototherwise identified subsequently were designatedmalignant and, thus, reportable), the inclusion of le-sions previously considered benign may result in ashift toward an increased percentage of localized dis-ease; there is insufficient evidence for confirmation ofthis prediction. It is possible either that more aggres-sive forms of gastric carcinoids exist or that morezealous diagnostic sampling is increasing the yield ofnonlocalized disease.
Analysis of 13,715 Carcinoid Tumors/Modlin et al. 951
Small IntestineSmall bowel carcinoids currently are the most fre-quently occurring type of carcinoid tumors (25.2% ofall carcinoids among all 13,715 tumors and 28.5% ofthe pan-SEER data set). The predominance of this sitehas been noted by others.27,45,46 Gabos et al.47 ana-lyzed 1244 small intestinal carcinomas registered be-tween 1975 and 1989 in western Canada and notedthat carcinoids comprised 26.8% of such lesions andrepresented the second most frequent neoplasm en-countered in the small intestine after adenocarci-noma. DiSario and associates48 evaluated 328 smallbowel tumors that were identified in the Utah CancerRegistry from 1966 through 1990 (most of which areincluded in the SEER registry) and noted that carci-noids comprised 41% of all lesions at this site, whereasadenocarcinoma was diagnosed in 24% of such pa-tients. Within the late SEER data set, carcinoids com-prised 43.5% of all small intestinal tumors. It appearsthat the biology of the small intestine is not as a singleorgan but, instead, exhibits a graduated propensity fordeveloping neuroendocrine neoplasia along its longi-tudinal axis. Indeed, the majority of previously iden-tified duodenal carcinoids are classified now as gas-trinomas. It is likely that the specific endocrine celltypes in each region of the small intestine give rise todistinct species of carcinoid tumors; in many in-stances, the specific biology of these lesions remainsunclear.49 Although carcinoids in the late SEER groupcomprised just over 40% of all small intestinal primarytumors, in the autopsy series by Berge and Linell, thisnumber was 95%, with 88% of such lesions identifiedas incidental findings.25 This clearly demonstrates thatthe evaluation of autopsy series may significantly altermany aspects of epidemiology data and further em-phasizes the growing body of evidence that many car-cinoid lesions remain asymptomatic and undetectedin vivo. Within the late SEER population, the age-adjusted incidence rate (expressed as cases per100,000 population per year) for small intestinal car-cinoids (Table 11) is high in the black male population(1.65) compared with black females (1.15), whitemales (0.88), and white females (0.63). DiSario et al.48
reported a 0.8 per 100,000 population per year, age-adjusted incidence in males and a 0.5 per 100,000population per year incidence in females for theselesions. In the current SEER registry, the crude male:female ratios for small intestinal carcinoids and non-carcinoid tumors (Table 10) were nearly equivalent(1.10 and 1.08, respectively), although DiSario et al.noted a higher male:female ratio for carcinoids (1.6)and an even higher male:female ratio for noncarci-noids (2.0) at this site. The changes in registry report-
ing techniques in 1986 appear to have had little or noeffect on overall frequency, site, and stage distributionof small intestine lesions compared with a later SEERsubset analysis.15 This may reflect the observation thatsmall bowel carcinoids more often are malignant;thus, almost all such tumors already were being re-ported to SEER registries prior to the 1986 change inprotocol.
Other noncarcinoid neoplasms are associatedovertly with small bowel carcinoids in 29% of patients.This is the largest percentage association among allextrahepatic gastrointestinal carcinoid sites and sup-ports the hypothesis that the cells of origin of suchlesions may exhibit the highest propensity for the pro-duction of growth factors.8
At the time of diagnosis, 58 – 64% of patients withsmall intestine carcinoids had nonlocalized disease,compared with an overall percentage of 32– 46% off allpatients with gastrointestinal carcinoids (Table 12).Saha et al. reported a series of 112 gastrointestinalcarcinoids that were identified in a New Orleans hos-pital during a 44-year period in which 10% of 40 pa-tients with small intestinal carcinoids died of livermetastases.50 In an analysis of 192 patients with gas-trointestinal carcinoids who were treated at the Uni-versity of Iowa between 1938 and 1982, Olney andcolleagues51 noted that 32.9% of 79 small intestinallesions exhibited metastatic disease and that this fre-quency was the highest (40%) for the ileal carcinoidsubset. In the autopsy series by Berge and Linell, it wasnoted that 28.3% of 152 small intestinal carcinoid tu-mors had metastasized.25
In the late SEER database, the 5-year survival ratefor patients with small intestinal carcinoid tumors was60.5%, compared with the overall percentage of 67.2%for patients with all gastrointestinal carcinoids (Table13). This is somewhat better compared with the 30 –33% 5-year survival rate reported in the New Orleansand Iowa series.50,51
Meckel DiverticulumTo our knowledge to date, only 109 diagnoses of car-cinoids arising within a Meckel diverticulum havebeen reported in the literature, and, in the SEERgroup, 52 such lesions have been encountered.52–55
Moyana reported a series of 44 surgical specimens ofMeckel diverticula in which 9% (n � 4 specimens)harbored a carcinoid tumor.56 The mean age of thesepatients was 57 years, and they had a survival rate of100% after a mean follow-up of 10.2 years. Moyananoted that the immunohistochemical profile of Meck-elian carcinoids is similar to that of small intestinalcarcinoids. Nies et al.52 analyzed two of their ownpatients with carcinoid tumors within Meckel diver-
952 CANCER February 15, 2003 / Volume 97 / Number 4
ticula along with an additional 104 patients reportedin the literature; these authors reported that 64.4% ofsuch carcinoids were asymptomatic and that 25.5%were incidental findings at autopsy. In that series, theaverage age at diagnosis was 56.8 years. Those authorsalso stated that metastases were present in 24% ofpatients at the time of presentation. It is noteworthythat Nies et al. found a 2.6 male:female ratio. Thepropensity of such lesions to occur in blind diverticulaof the gut suggests that alterations in luminal contentmay be of significance. This is supported by the ob-servation that the incidence of gastric carcinoids isincreased when gastric pH is elevated either in exper-imental models or in patients with atrophic gastritis orpernicious anemia.43
AppendixAlthough appendiceal carcinoids have long been rec-ognized as the most frequently occurring carcinoidtumors, their relative frequency, reflected by the threeregistries examined herein, has decreased over time(ERG, 43.9%; TNCS, 35.5%; late SEER, 2.43%) (Table 4).However, this information should be evaluated andinterpreted cautiously, because the ERG file containsboth benign and malignant appendiceal carcinoids,whereas the TNCS and the initial 14-year period ofSEER case accrual do not. An alternative explanationfor this apparent decrement is the somewhat relaxedsurgical commitment to appendectomy over the past2 decades. Addiss et al.57 reported an analysis of thefiles of the United States National Hospital DischargeSurvey between 1970 and 1984, noting that the overallincidence of primary appendectomy decreased by22.1%, whereas diagnostic accuracy (appendicitis rate� primary appendectomy rate) increased from 74% to83% in females and from 86% to 92% in males.
The relative frequency of appendiceal carci-noids, compared with all appendiceal malignancies,has decreased within the SEER registry over time.During 1973–1987, 376 patients with appendicealcarcinoids were reported, comprising 40% of all ap-pendiceal malignancies.15 In contrast, the pan-SEERfile (1973–1999) contains 519 patients with appen-diceal carcinoids, comprising only 25.3% of all ap-pendiceal malignancies (Tables 4,7). The markedfemale predominance for small bowel carcinoidsevident in these three series also was noted byRoggo and associates,58 who retrospectively ana-lyzed 41 patients with appendiceal carcinoids accu-mulated at Massachusetts General Hospital in Bos-ton between 1969 and 1990. Those authors reportedthat 80.5% of such tumors occurred in females. Mo-ertel et al.59 evaluated 150 patients with such lesionswho were encountered at the Mayo Clinic over a
period of 51 years and noted a male:female ratio of0.4. In the late SEER subset, the overall age-adjustedincidence rate for white women was somewhathigher compared with white men (Table 11), and theoverall crude male:female ratio was 0.82 (Table 10).This may reflect an increased number of pelvic pro-cedures (such as laparoscopy) performed in women;thus, more incidental lesions, including carcinoidsof the appendix, may be identified.
Appendiceal carcinoids tend to present at an earlyage (late SEER, 49.3 years, compared with 59.8 yearsfor noncarcinoid tumors of the appendix). In the se-ries reported by Roggo et al., the average age at diag-nosis was 32 years.58 It is interesting to note that in theMayo Clinic series, patients who had tumors and me-tastases were younger (29 years) compared with pa-tients who had smaller and clinically benign lesions(42 years).59 In a separate series of 23 patients withappendiceal carcinoids occurring during childhoodand adolescence, Moertel and colleagues60 noted thatalthough, in adults, these lesions most commonly arediagnosed as a result of incidental appendectomy,78.3% of these younger patients presented with signsand symptoms of an acute abdomen. Moertel et al.also reported that the distribution of carcinoids withinthe appendix is not uniform, with the majority (67%)occurring at the tip of the structure rather than thebase.
Although the female predominance and age dis-tribution may reflect the primary indication for sur-gery, other possibilities may exist. In 1928, Masson61
proposed that, unlike what occurs within other zonesof the gastrointestinal tract, carcinoid tumors of theappendix originated from the subepithelial neuroen-docrine cells. Shaw62 evaluated the epithelial neuroen-docrine cells (ENC) and subepithelial neuroendocrinecells (SNC) in 50 normal appendices and reportedthat, although the ENC were distributed equally withinthe appendix, the SNC were more numerous at the tipthan at the base. Furthermore, although the density ofENC remained steady throughout life, SNC densitywas low in infants, but in a significant proportion ofindividuals, increased with age to a peak around thethird decade, and thereafter slowly declined, returningto low levels in the elderly.
In the Mayo Clinic series, 4.7% of appendicealcarcinoid tumors metastasized, but no tumor measur-ing � 2 cm in greatest dimension exhibited metastaticspread.59 Although, in the ERG group, the percentageof nonlocalized lesions was similar (5%) (Table 12),this value in the late SEER subset was significantlygreater (39 – 45%). In the autopsy series by Berge andLinell, none of the patients with appendiceal carci-noids diagnosed at autopsy exhibited metastases.25
Analysis of 13,715 Carcinoid Tumors/Modlin et al. 953
This observation also may reflect the fact that al-though the ERG registry recorded all appendiceal car-cinoids until 1986, these lesions were reportable onlyto the SEER program if they were considered malig-nant. Despite the moderate percentage of associatednoncarcinoid neoplasms (18.2%) associated with ap-pendiceal carcinoids, the 5-year survival rate for pa-tients with such lesions (71.0%) was among the bestout of all types of carcinoids (Table 13). Numerousother reports confirm the favorable prognosis for pa-tients with appendiceal carcinoids.50,51,58 – 60 The rea-son for this relatively benign behavior may reflecteither the specific cell type or the anatomic site of thelesion and its early or serendipitous detection. How-ever, it is certain that the incidental, early discoveryand simple management (i.e., appendectomy) of mostappendiceal lesions contributes significantly to theexcellent survival rate.
ColonCarcinoid tumors of the nonappendiceal colon com-prised 7.84% of the 13,715 tumors examined for thisreview. The most frequent site of colonic carcinoidwas the cecum (34.5% of colonic carcinoids and 3.47%of all carcinoids within the late SEER subset) (Table 4).Ballantyne et al.63 reported 54 patients with carcinoidsof the colon who were identified by the ConnecticutTumor Registry between 1976 and 1986, 48% of whichwere located in the cecum. In their series, a slightfemale predominance (57%) and a marked white pre-dominance (89%) were noted. It is possible that somececal lesions actually arise from the base of the ap-pendix and extend into the cecum; this process mayhelp explain the reported preponderance of right-sided colonic carcinoids. Another possibility is theexistence of a common cause for the apparent in-creased frequency of both carcinoids and adenocarci-noma in the right colon.15 Similarly, in the late SEERregistry, the population-corrected male:female ratiofor colorectal carcinoids was 1.03 (Table 10), and thepopulation-corrected black:white ratio was 1.73 (Table7). However, noncarcinoid colorectal tumors exhib-ited predominance for whites (black:white ratio, 0.62)but demonstrated no notable gender bias (popula-tion-scaled male:female ratio, 1.06), possibly reflectingvarying etiologic factors of specific tumor subtypes ofthe colon and rectum.
Extraappendiceal colonic carcinoids were nonlo-calized in 55– 67% of patients, a modest decline fromthe 71.0% nonlocalized classification in the ERG data-base (Table 12). Saha and associates reported a seriesof 13 patients with colonic carcinoid tumors in which85% had metastatic disease at the time of diagnosis.50
These patients exhibited the worst prognosis among
all patients with carcinoid tumors of the gut (5-yearsurvival, 41.6%). In the ERG group, the patients withcarcinoids of the sigmoid colon exhibited the mostunfavorable 5-year relative survival rates (33%).10
Within the Connecticut Tumor Registry data, an over-all 37% 5-year survival rate was noted; in the NewOrleans series, the survival rate was 23%; for the Iowaregistry, it was 20%.50,51,63 The explanation for themore malignant biologic profile of colonic carcinoidtumors is not clear. In contrast, within the SEER reg-istry, the overall 5-year relative survival rate for pa-tients with adenocarcinoma of the colon was 60.4%.12
Thomas and Sobin15 have proposed that some coloniccarcinoids previously were misdiagnosed and actuallywere poorly differentiated adenocarcinomas or undif-ferentiated carcinomas.
RectumRectal carcinoids, overall, are the third most frequentgroup of the gastrointestinal carcinoid tumors (13.7%of 13,715 carcinoid tumors). It appears that the overallrace, age, gender, and stage distribution for rectalcarcinoids remained unaffected by the modified SEERcase-reporting policy introduced in 1986. Jetmore etal.,64 in their series of 170 patients with gastrointesti-nal carcinoids who were treated at the Ochsner Clinicbetween 1958 and 1990, reported that rectal carci-noids comprised 55% of all tumors. In other reports,the relative frequency of rectal carcinoids in relationto all carcinoid tumors varied between 5% and 27%,although many of those series were modest and highlyselective and, thus, may not be completely represen-tative.46,50,51 Matsui and colleagues65 reported 15small rectal carcinoids (2–13 mm in greatest dimen-sion) among 21,522 healthy individuals who under-went proctosigmoidoscopy in Toyama, Japan. Al-though other series noted male:female ratios of 1.7and 2.8,64,65 in the pan-SEER (1973–1999) data set,rectal carcinoids failed to exhibit any significant spe-cific gender predominance (crude and corrected ratiosof 1.07 and 1.13, respectively) (Table 10). The averageage at diagnosis was 52 years and 48 years, respec-tively, in the studies by Jetmore et al.64 and Matsui etal.;65 in the late SEER group, the average age at diag-nosis was 56.2 years. This is in contrast to an averageage at diagnosis of 68.0 years for patients with non-carcinoid rectal tumors. Among the SEER data set, theage-adjusted incidence rates were approximatelythreefold greater in the gender-matched black popu-lation relative to white patients (Table 11). Rectal car-cinoid tumors appear to exhibit a low propensity tometastasize and, thus, are associated with a favorableprognosis, as reflected by the small percentage of non-localized tumors (4 –18%) (Table 12) and a high 5-year
954 CANCER February 15, 2003 / Volume 97 / Number 4
survival rate (88.3%) (Table 13). A recent report sug-gests that there may be a number of different types ofrectal carcinoids and that a generalization of this kindmay not be valid for all patients.66
Nevertheless, these excellent outcome data alsomay reflect the expeditious diagnosis of such tumors,usually based on endoscopic rectal evaluation afterthe early presenting symptoms of hematochezia orpain. Mani et al.9 evaluated more than 200 reports ofrectal carcinoids and noted that tumor size and mus-cularis invasion were the two most important predic-tive criteria in the assessment of the malignant natureof these neoplasms. In analyzing data from the litera-ture, those authors reported that at least 60% of car-cinoids of the rectum diagnosed at biopsy measured� 1.0 cm in greatest dimension and that these lesionshad metastasized in fewer than 2% of patients. Inaddition, metastatic spread in carcinoids measuringbetween 1.0 cm and 1.9 cm and in lesions measuring� 2 cm was evident in 10 –15% and 60 – 80% of pa-tients, respectively. Mani et al. concluded that rectalcarcinoids measuring � 2 cm in greatest dimension ordemonstrating evidence of muscularis invasionshould be treated as though they were adenocarcino-mas. Thus, the appropriate carcinoma-specific proce-dure should be performed, and the overall manage-ment of patients with hepatic or lymph nodemetastases should be no different than the treatmentproposed for patients with other tumors of the rec-tum.9
PancreasAlthough no data regarding pancreatic carcinoids areavailable from the ERG and TNCS databases, the SEERregistry has accrued 79 such patients since 1973. Theparameters used to distinguish pancreatic carcinoidsfrom islet cell neoplasia are not entirely clear; it is notreadily apparent which criteria were applied to iden-tify these lesions as carcinoids or whether attemptswere made specifically to identify the peptide prod-ucts of such lesions. Because many antibodies suitablefor immunohistochemistry techniques have becomeavailable only recently, it is unlikely that such proce-dures were used in these cases. Nevertheless, carci-noids of the pancreas, although they are extremelyrare (0.73% of all types of carcinoids within the pan-SEER data set) (Table 4), appear to constitute a par-ticularly malignant form of carcinoid tumor. Thus, atthe time of diagnosis, 72– 81% of patients had nonlo-calized disease, and the overall 5-year survival ratewas only 37.5% (Tables 12,13). This is consistent withthe usual pattern of late diagnosis and poor prognosisfor almost all patients with pancreatic neoplasia, al-though it is ameliorated somewhat by the relatively
indolent nature of carcinoid tumor biology comparedwith pancreatic adenocarcinoma. Thus, patients withpancreatic carcinoids may have the best outcomeamong all patients with pancreatic malignancies(SEER, 1973–1987: median survival � 12 months, with84% of patients alive 1 year after diagnosis);67 thiscompares favorably with the results from a retrospec-tive meta-analysis of 119,000 patients with adenocar-cinoma of the pancreas, in which Gudjonsson68 notedan overall 5-year survival rate of merely 0.5%.
Respiratory TractBronchial carcinoid tumors previously were termedbronchial adenomas because of their presumed be-nign nature. Such lesions, which previously were con-sidered benign, were included within the SEER regis-try beginning in 1986. However, this aggregation ofdata appears not to have affected the overall age,gender, race, and stage distribution compared withprevious data.69 Davila et al.70 reported that approxi-mately 75% of bronchial carcinoids arise in the lobarbronchi, 10% occur in the mainstem bronchi, and 15%originate in the periphery of the lung. A somewhatdifferent distribution pattern was noted by Blondaland associates,71 who analyzed 46 patients with bron-chopulmonary carcinoid tumors who were encoun-tered between 1957 and 1976 in Uppsala, Sweden. Intheir series, 52% of the lesions were located in a mainor lobar bronchus, with the rest found in the peripheryof the lung. This suggests either a possible differentialsite-proclivity for carcinoids compared with adenocar-cinomata of the lung or perhaps an unequal distribu-tion of precursor cell types for each lesion. The abso-lute and relative frequency of bronchopulmonarycarcinoids relative to all sites of carcinoid tumor hasincreased over time through all three series reportedhere (ERG, 10.2%; TNCS, 14.1%; pan-SEER, 27.9%)(Table 4). In the autopsy series by Berge and Linell andin the Swiss series of Levi et al., bronchopulmonarycarcinoid tumors comprised 9% and 17.3% of all car-cinoids, respectively.25,30 In the ERG and late SEERdatabases, the crude male:female ratios recorded forthese lesions were 0.8 and 0.51, respectively (Table10); this female predominance was confirmed by otherseries (Levi et al. [Swiss canton series], 0.53; Uppsalaseries, 0.7).30,71 Conversely, noncarcinoid tumors ofthe bronchopulmonary system exhibited a markedmale predominance, although the extremely highmale:female ratio noted in the ERG group (4.1) hasdeclined in the past 20 years (late SEER, 1.36). Becausesmoking has long been implicated as a major etiologicfactor in the genesis of lung carcinomas of certainhistologic types, this decline may reflect alterations inthe distribution of smokers and nonsmokers among
Analysis of 13,715 Carcinoid Tumors/Modlin et al. 955
males and females. Moreover, this also suggests thatcarcinoid tumors and noncarcinoid tumors of thebronchopulmonary system have different etiologicfactors.
The age-adjusted incidence rates for all races andboth genders with bronchopulmonary carcinoids alsohave increased over the past 30 years (Table 11). Thismay reflect the changes in the designation of all suchlesions as malignant and, thus, reportable to cancerregistries. The average age at diagnosis of patients whohave bronchopulmonary carcinoids is nearly a decadeyounger compared with patients who have noncarci-noid lung tumors (59.8 years vs. 68.5 years). Blondal etal.71 noted that 76.1% of patients with bronchopulmo-nary lesions in their series presented with obvioussymptomatology. The routine diagnostic use of fiber-optic bronchoscopy associated with the introductionof specific immunocytochemical techniques has fur-ther facilitated the early recognition and diagnosis ofthese lesions. In general, patients with bronchopul-monary carcinoids have a favorable prognosis. Over-all, 27.5–34.6% of tumors were nonlocalized at diag-nosis (Table 12) and the all-stage, 5-year survival ratewas 73.5% (Table 13). This reflects a somewhat worseprognosis than was noted either in the Uppsala study(91% 5-year survival rate) or in a review of a number ofother reported series (90%).70,71 Soga and Yakuwa72
recently described a series of 1875 tracheal and bron-chopulmonary carcinoids within a Japanese carcinoidregistry; significantly different 5-year postoperativesurvival rates were found between patients with typi-cal and atypical carcinoid types (93.3% and 68.8%,respectively). Patients who had lung carcinoid tumorsshowed superior survival compared with patients whohad other types of lung carcinoma.73 Within the lateSEER subset, other noncarcinoid tumors were associ-ated with bronchopulmonary carcinoids in 23.4% ofsuch patients.
Unusual and Rare SitesIt is important to recognize that carcinoid tumors maydevelop in virtually any organ of the abdomen orthorax. However, the small number of patients withesophageal tumors (n � 6 patients), hepatic tumors (n� 45), and gallbladder tumors (n � 25), and the lack ofinformation regarding the diagnostic criteria used toidentify them, make any specific conclusions difficult.Although sporadic reports have been published re-garding renal and testicular carcinoids,74 –76 only threerenal carcinoids and eight testicular carcinoids havebeen reported through the SEER registries(1973–1999). The prognosis of patients with carcinoidtumors in rare gastrointestinal sites remains poor(overall 5-year survival: liver, 18.4%; pancreas, 37.5%).
Synchronous or Metachronous NeoplasiaThe coexistence of malignant tumors of different his-tologic types with carcinoids has been a source ofsignificant debate throughout the past several de-cades. In the series by Berge and Linell, 40.7% of 199patients with carcinoid tumors exhibited � 1 coexist-ing second malignancies, one-third of which (35.8%)occurred in the gastrointestinal tract.25 However, theauthors also noted that malignant tumors were evi-dent at approximately the same frequency (44.5%) intheir autopsy series. However, because more recentclinical studies based on surgical specimens consis-tently have emphasized the apparently high frequencyof second malignancies in patients with carcinoid tu-mors, the observations of Berge and Linell are cominginto question. Their findings, however, may reflect thebiology of the asymptomatic lesions identified at au-topsy. Saha and colleagues50 reported in their series of112 patients with gastrointestinal carcinoids that asecond malignancy was evident in 25% of patients. Ofsuch lesions, 53% were adenocarcinoma of the gastro-intestinal tract (colon, 25%; rectum, 14%; small bowel,7%; stomach, 7%); the remainder occurred mostly inthe lung (7%), prostate (7%), cervix uteri (7%), andother diverse sites. In a series of 55 patients withgastrointestinal carcinoid tumors presented by Mar-shall and Bodnarchuk,46 secondary malignancies werenoted in 18% of patients, 25% of which were colorectalcarcinomas. Olney et al.51 noted similar results in theirassessment of 192 carcinoid tumors.
In the late SEER subset, carcinoid tumors in totowere associated with other noncarcinoid tumors in22.4% of patients. An explanation for the high fre-quency of other neoplasia associated with carcinoidtumors remains unclear. It presumably reflects thefact that some of the bioactive agents secreted bythese lesions are known mitogens for a variety of celltypes. Therefore, it is probable that, over time, theprolonged action of such growth factors may promotephenotypic changes in susceptible cells and induceneoplastic transformation.8,41 This may represent thesecond hit in cells of patients with a genetic predispo-sition to the development of carcinoid tumors. Anal-ysis of the current data and other reports suggests thatif a carcinoid tumor is identified, particularly in thesmall intestine, appendix, or colon, then it is appro-priate and prudent to undertake surveillance on aregular basis of the colon, rectum, small intestine,lung, and (in female patients) the cervix and ovaries.
Multiple CarcinoidsIn the SEER registry of 10,878 patients with at least 1carcinoid tumor, 125 patients (1.15%) with � 1 carci-
956 CANCER February 15, 2003 / Volume 97 / Number 4

noid tumor were identified, with a mean of 2.5 distincttumor-laden sites. Early SEER and late SEER subgroupanalyses reveal multiple carcinoid rates of 0.80% and1.56%, respectively; the average number of involvedsites remained stable (2.47–2.43) between those twoperiods. The existence of such tumors, in part, mayhold the key to the unique pathobiology of carcinoidtumors, because multicentricity suggests either expo-sure to a common luminal pathogen or a regionalclonal abnormality. Berge and Linell reported in theMalmo autopsy series25 that multiple carcinoids wereevident in 50 of 152 patients (33%) with small intesti-nal carcinoids; in 2 patients, carcinoids were found at2 different sites (appendix–ileum and ileum– colon).Watson et al.76 noted that in 318 patients with carci-noid tumors, 7 multiple small intestinal carcinoids (5in the ileum and 2 in the jejunum) were identified atsurgery (12.3% of all small intestinal lesions). In thatseries, the number of tumors at 1 site ranged from 3 to10 tumors. In a series by Saha and colleagues,50 10% ofthe patients had tumors at multiple sites, and 82%were located in the small bowel. The propensity ofsmall bowel carcinoids to develop as multiple lesionsis not understood well. One possible explanation isthat the malignant transformation of the specific stemcells from which these tumors originate may be drivenby an exogenous growth factor that is capable of in-fluencing similar cells in disparate locations. The va-lidity of this hypothesis is exemplified best by themultiple fundic gastric carcinoids that occur in re-sponse to hypergastrinemia associated with chronicatrophic gastritis or gastrinomas associated with theMEN-1 syndrome.73
MetastasesIn the Malmo autopsy series compiled by Berge andLinell,25 metastases were identified in 29.4% of pa-tients; the majority of metastases (61.2%) originatedfrom the small intestine. Overall, in addition to thelymph nodes (89.8%), the most frequent sites of met-astatic carcinoids were the liver (44.1%), lung (13.6%),peritoneum (13.6%), and pancreas (6.8%). The liveralso has been noted by other authors as the mostfrequent site for carcinoid metastases.50,76 Olney etal.51 reported in their series that ileal lesions (40%),cecal lesions (66.7%), and colonic lesions (44.4%) me-tastasized most frequently. Marshall and Bodnar-chuk46 noted in their series that metastatic diseasewas evident in 68% of 19 ileal carcinoids and in 100%of 5 cecal carcinoids. Similarly, in the late SEER sub-group, the highest percentage of nonlocalized lesionswas noted for esophageal, small intestinal, cecal, andpancreatic carcinoids (66.7%, 58.3– 64.1%, 81.5– 83.2%,and 71.9 – 81.3%, respectively), compared with the
overall percentage of nonlocalized lesions for all car-cinoids (32.1– 46.7%) (Table 12). To explain the highmetastatic potential of small intestinal and coloniccarcinoids, further information regarding the pathobi-ology of these tumors is needed.
CONCLUSIONSThis review of 13,715 patients with carcinoid tumorsspans nearly 50 years and represents the largestknown and longest such aggregation. In addition, thedata pool is such that, overall, it may be regarded as afair sample of the United States population as a whole.Critical examination of the data and time distributionof these patients reveals several important findingsand trends that will aid the further examination of thisdisease and provide additional epidemiologic insight.The incidence of carcinoid has increased over the past5 decades; this may be secondary to true in vivochanges or to improvements in disease detection. Thepercentage of carcinoid tumors among all tumors oc-curring at specific sites has increased for the stomachand rectum but has decreased for the appendix. Cer-tain carcinoid tumors, such as those of the rectum, areexceedingly prevalent among black and Asian popu-lations within the United States, whereas persons ofHispanic descent are diagnosed with carcinoid tumorat a lower rate than might be expected, suggesting thatgenetic factors may play a role in the differential de-velopment of this disease.
Although, over the past 30 years, the study ofneuroendocrine tumors has been advanced signifi-cantly by the elucidation of aspects of carcinoidbiology and the development of novel diagnosticmethodology, there appears to be little change interms of outcome. Despite the use of specific anti-bodies in immunohistochemistry to identify neu-roendocrine tumors and more precise identificationof lesions that previously were not clearly evident asneuroendocrine in origin, there remains confusionregarding the classification of carcinoid tumors. Ofpositive clinical relevance has been the widespreadutilization of endoscopy, ultrasonography, comput-erized axial tomography, and somatostatin scintig-raphy, all of which have enhanced significantly theidentification of previously undetectable lesionsand, hence, have allowed more accurate delineationof metastases. Thus, some of the changes appreci-ated in the epidemiology of carcinoid tumors mayreflect improvements in technology.
The somewhat underwhelming change in survivalapparent in the analysis of the data of the last 50 yearsindicates that the failure to identify the precise biologyof these lesions still confounds the development ofadequate therapeutic strategies. In general, it appears
Analysis of 13,715 Carcinoid Tumors/Modlin et al. 957
that current optimal therapeutic strategy for carcinoidtumors should be based on the appreciation of theobviously malignant yet somewhat restrained biologicbehavior of these lesions. Thus, overly radical man-agement does not appear justified, although a diligentsearch for associated noncarcinoid tumors appearsprudent and relevant. The assessment of the currentdatabase confirms that the future of the elucidation ofthis disease process requires correlation with precisecellular and biologic determinants of malignancy aswell as a delineation of the specific cell of origin andits precise genomic configuration. The availability ofsuch data will facilitate predictions of the rate of tu-mor growth and the likelihood of metastatic dissemi-nation, thus allowing optimization of therapeutic in-tervention. Further rigorous evaluation of theepidemiology of carcinoid disease may provide basicinsights into the etiopathology of these fascinating butpoorly understood lesions. Indeed, as this study dem-onstrates, the broad hinterland of the disease is ap-parent; however, the precise topography, both bio-logic and genomic, remains for the most partuncharted.
REFERENCES1. Langhans T. Ueber einen drusenpolyp im ileum. Virchow
Arch Pathol Anat Physiol Klin Med. 1867;38:559 –560.2. Lubarsch O. Ueber den primaren Krebs des Ileum, nebst
Bemerkungen uber das gleichzeitige Vorkommen von Krebsund Tuberkolose. Virchow Arch Pathol Anat Physiol KlinMed. 1888;111:280 –317.
3. Ransom WB. A case of primary carcinoma of the ileum.Lancet. 1890;2:1020 –1023.
4. Oberndorfer S. Karzenoide tumoren des dunndarms. FrankfZschr Path. 1907;1:426 – 430.
5. Gosset A, Masson P. Tumeurs endocrines de 1’appendice.Presse Med. 1914;25:237–239.
6. Tomassetti P. Clinical aspects of carcinoid tumours. DigestLiver Dis. 1999;31(Suppl 2):S143–S146.
7. Moyana TN. Gastrointestinal endocrine cells and carci-noids: histogenetic and pathogenetic considerations. PatholAnnu. 1995;30:227–246.
8. Oberg K. Expression of growth factors and their receptors inneuroendocrine gut and pancreatic tumors, and prognosticfactors for survival. Ann NY Acad Sci. 1994;733:46 –55.
9. Mani S, Modlin IM, Ballantyne GH, Ahlman H, West AB.Carcinoids of the rectum. J Am Coll Surg. 1994;179:231–248.
10. Godwin JD. Carcinoid tumors: an analysis of 2837 cases.Cancer. 1975;36:560 –569.
11. Modlin IM, Sandor A. An analysis of 8305 carcinoid tumors.Cancer. 1997;79:813– 829.
12. Surveillance, Epidemiology, and End Results (SEER) Pro-gram. Public-use data (1973–1999), National Cancer Insti-tute, DCCPS, Surveillance Research Program, Cancer Statis-tics Branch (released April 2002, based on the November2001 submission). Bethesda: National Cancer Institute,2002.
13. World Health Organization. International classification ofdiseases for oncology: morphology of neoplasms, 2nd ed.Geneva: World Health Organization, 1990.
14. Percy C, Young JL, Muir C, et al. Introduction to histology ofcancer: incidence and prognosis: SEER population-baseddata, 1973–1987. Cancer. 1995;75:140 –146.
15. Thomas RM, Sobin LH. Gastrointestinal cancer. Cancer.1995;75:154 –170.
16. Williams ED, Sandler M. The classification of carcinoid tu-mors. Lancet. 1963;1:238 –239.
17. United States Department of Commerce, Bureau of the Cen-sus. 2000. Census of population and housing: summarypopulation housing characteristics, PHC-1-1. Washington,DC: US Government Printing Office, 2002.
18. Sonnenberg A. Factors which influence the incidence andcourse of peptic ulcer. Scand J Gastroenterol Suppl. 1988;155:119 –140.
19. Waldum HL, Haugen OA, Brenna E. Do neuroendocrinecells, particularly the D-cell, play a role in the developmentof gastric stump cancer? Cancer Detect Prevent. 1994;18:431–436.
20. Buchanan KD, Johnston CF, O’Hare MMT, et al. Neuroen-docrine tumors: a European view. Am J Med. 1986;81(Suppl6B):14 –22.
21. Heah SM, Eu KW, Ooi BS, Ho YH, Seow-Choen F. Tumorsize is irrelevant in predicting malignant potential of carci-noid tumors of the rectum. Techn Coloproctol. 2001;5:73–77.
22. Sokmensuer C, Gedikoglu G, Uzunalimoglu B. Importanceof proliferation markers in gastrointestinal carcinoid tu-mors: a clinicopathologic study. Hepatogastroenterology.2001;48:720 –723.
23. Oberg K. Biochemical diagnosis of neuroendocrine GEP tu-mor. Yale J Biol Med. 1997;70:501–508.
24. Moertel CG, Dockerty MB, Judd ES. Carcinoid tumors of thevermiform appendix. Cancer. 1968;21:270 –278.
25. Berge T, Linell F. Carcinoid tumors. frequency in a definedpopulation during a 12-year-period. Acta Pathol MicrobiolScand. 1976;84:322–330.
26. Hemminki K, Li X. Incidence trends and risk factors ofcarcinoid tumors: a nationwide epidemiologic study fromSweden. Cancer. 2001;92:2204 –2210.
27. Newton JN, Swerdlow AJ, dos Santos Silva IM, et al. Theepidemiology of carcinoid tumours in England and Scot-land. Br J Cancer. 1994;70:939 –942.
28. Crocetti E, Buiatti E, Amorosi A. Epidemiology of carcinoidtumours in central Italy. Eur J Epidemiol. 1997;13:357–359.
29. Westergaard T, Frisch M, Melbye M. Carcinoid tumors inDenmark 1978 –1989 and the risk of subsequent cancers. Apopulation-based study. Cancer. 1995;76:106 –109.
30. Levi F, Randimbison L, Franceschi S, LaVecchia C. Descrip-tive epidemiology of malignant carcinoids in the Swiss Can-ton of Vaud. Int J Cancer. 1993;53:1036 –1037.
31. Modlin IM, Zucker K, Zdon M, Sussman J, Adrian T. Char-acteristics of the spontaneous gastric endocrine tumor ofmastomys. J Surg Res. 1988;44:205–215.
32. Bilchik AJ, Nilsson O, Modlin IM, Adrian TE. H2-receptorblockade induces peptide YY (PYY) and enteroglucagon (EG)secreting gastric carcinoids in mastomys. Surgery. 1989;106:1119 –1127.
33. Modlin IM, Nangia AK. The pathobiology of the humanenterochromaffin-like cell. Yale J Biol Med. 1992;65:775–792.
34. Sanduleanu S, Jonkers D, de Bruine A, Hameeteman W,Stockbrugger RW. Changes in gastric mucosa and luminalenvironment during acid-suppressive therapy: a review indepth. Digest Liver Dis. 2001;33:707–719.
958 CANCER February 15, 2003 / Volume 97 / Number 4
35. Robinson M. Review article: current perspectives on hyper-gastrinaemia and enterochromaffin-like-cell hyperplasia.Alimentary Pharmacol Therapeut. 1999;13(Suppl 5):5–10.
36. Creutzfeldt W, Lamberts R. Is hypergastrinemia dangerousto man? Scand J Gastroenterol. 1991;26(Suppl 180):179 –191.
37. McCloy RF, Arnold R, Bardhan KD, et al. Pathophysiologicaleffects of long-term acid suppression in man. Digest Dis Sci.1995;40:96S–120S.
38. Smith AM, Watson SA, Caplin M, et al. Gastric carcinoidexpresses the gastrin autocrine pathway. Br J Surg. 1998;85:1285–1289.
39. Modlin IM, Lawton GP, Miu K, et al. Pathophysiology of thefundic enterochromaffin-like (ECL) cell and gastric carci-noid tumours. Ann R Coll Surg Engl. 1996;78:133–138.
40. Kitago M, Inada T, Igarashi S, Mizutani S, Ogata Y, Kubota T.Multiple gastric carcinoid tumors with type A gastritis con-comitant with gastric cancer: a case report. Oncol Rep. 2001;8:343–346.
41. Modlin IM, Goldenring JR, Lawton GP, Hunt R. Aspects ofthe theoretical basis and clinical relevance of low acid states.Am J Gastroenterol. 1994;89:308 –318.
42. Waldum HL, Haugen OA, Isaksen C, Mecsei C, Sandvik AK.Enterochromaffin-like tumour cells in the diffuse but notthe intestinal type of gastric carcinomas. Scand J Gastroen-terol. 1991;26(Suppl 180):165–169.
43. Modlin IM, Tang LH. The gastric enterochromaffin-like cell:an enigmatic cellular link (ECL). Gastroenterology. 1996;111:783– 810.
44. Modlin IM, Lawton GP, Tang LH, Geibel J, Abraham R,Darr U. The Mastomys gastric carcinoid: aspects of en-terochromaffin-like cell function. Digestion. 1994;55(Suppl 3):31–37.
45. Woods HF, Bax NDS, Ainsworth I. Abdominal carcinoidtumors in Sheffield. Digestion. 1990;45(Suppl 1):17–22.
46. Marshall JB, Bodnarchuk G. Carcinoid tumors of the gut.J Clin Gastroenterol. 1993;16:123–129.
47. Gabos S, Berkel J, Band P, Robson D, Whittaker H. Smallbowel cancer in Western Canada. Int J Epidemiol. 1993;22:198 –206.
48. DiSario JA, Burt RW, Vargas H, McWhorter WP. Small bowelcancer: epidemiological and clinical characteristics from apopulation-based registry. Am J Gastroenterol. 1994;89:699 –701.
49. Basson MD, Ahlman H, Wangberg B, Modlin IM. Biologyand management of the midgut carcinoid. Am J Surg. 1993;165:288 –297.
50. Saha S, Hoda S, Godfrey R, Sutherland C, Raybon K. Carci-noid tumors of the gastrointestinal tract: a 44-year experi-ence. South Med J. 1989;82:1501–1505.
51. Olney JR, Urdaneta LF, Al-Jurf AS, Jochimsen PR, Shirazi SS.Carcinoid tumors of the gastrointestinal tract. Am Surg.1985;51:37– 41.
52. Nies C, Zielke A, Hasse C, Ruschoff J, Rothmund M. Carci-noid tumors of Meckel’s diverticula. Dis Colon Rectum.1992;35:589 –596.
53. Spieth ME, Seder JS, Yuja RE, Kimura RL, Schroeder EV,Silvestri JH. False-positive Meckel’s imaging and true posi-tive imaging of a gastrointestinal bleed and surgical lesion.Clin Nucl Med. 1994;19:298 –301.
54. Hadjiminas D, Hershman MJ, Rosin RD. Asymptomaticmetastatic small bowel carcinoid. J R Soc Med. 1993;86:479 –480.
55. Pyke CM, Lancaster BA, van Heerden JA, Kvols LK. Carcinoidsyndrome secondary to a primary tumor in a Meckel’s di-verticulum. Aust NZ J Surg. 1993;63:732–734.
56. Moyana TN. Carcinoid tumors arising from Meckel’s diver-ticulum. Am J Clin Pathol. 1989;91:52–56.
57. Addiss DG, Shaffer N, Fowler BS, Tauxe RV. The epidemiol-ogy of appendicitis and appendectomy in the United States.Am J Epidemiol. 1990;132:910 –925.
58. Roggo A, Wood WC, Ottinger LW. Carcinoid tumors of theappendix. Ann Surg. 1993;217:385–390.
59. Moertel CG, Weiland LH, Nagorney DM, Dockerty MB. Car-cinoid tumor of the appendix: treatment and prognosis.N Engl J Med. 1987;317:1699 –1701.
60. Moertel CL, Weiland LH, Telander RL. Carcinoid tumor ofthe appendix in the first two decades of life. J Pediatr Surg.1990;25:1073–1075.
61. Masson P. Carcinoids (argentaffin cell tumors) and nervehyperplasia of the appendicular mucosa. Am J Pathol. 1928;4:181–211.
62. Shaw PA. The topographical and age distributions of neu-roendocrine cells in the normal human appendix. J Pathol.1991;164:235–239.
63. Ballantyne GH, Savoca PE, Flannery JT, Ahlman MH, ModlinIM. Incidence and mortality of carcinoids of the colon.Cancer. 1992;69:2400 –2405.
64. Jetmore AB, Ray JE, Gathright JB Jr., McMullen KM, HicksTC, Timmcke AE. Rectal carcinoids. the most frequent car-cinoid tumor. Dis Colon Rectum. 1992;35:717–725.
65. Matsui K, Iwase T, Kitagawa M. Small, polypoid-appearingcarcinoid tumors of the rectum: clinicopathologic study of16 cases and effectiveness of endoscopic treatment. Am JGastroenterol. 1993;88:1949 –1953.
66. Takahashi Y, Onda M, Tanaka N, Seya T. Establishment andcharacterization of two new rectal neuroendocrine cell car-cinoma cell lines. Digestion. 2000;62:262–270.
67. Carriaga MT, Henson DE. Liver, gallbladder, extrahepaticbile ducts, and pancreas. Cancer. 1995;75:171–190.
68. Gudjonsson B. Carcinoma of the pancreas: critical analysisof costs, results of resections, and the need for standardizedreporting. J Am Coll Surg. 1995;181:483–503.
69. Travis WD, Travis LB, Devesa SS. Lung cancer. Cancer. 1995;75:191–202.
70. Davila DG, Dunn WF, Tazelaar HD, Pairolero PC. Bronchialcarcinoid tumors. Mayo Clin Proc. 1993;68:795– 803.
71. Blondal T, Grimelius L, Nou E, Wilander E, Aberg T. Argy-rophil carcinoid tumors of the lung. Chest. 1980;78:840 – 844.
72. Soga J, Yakuwa Y. Bronchopulmonary carcinoids: an analy-sis of 1875 reported cases with special reference to a com-parison between typical carcinoids and atypical varieties.Ann Thorac Cardiovasc Surg. 1999;5:211–219.
73. Gilligan CJ, Lawton GP, Tang LH, West AB, Modlin IM.Gastric carcinoid tumors: the biology and therapy of anenigmatic and controversial lesion. Am J Gastroenterol.1995;90:338 –352.
74. Schlussel RN, Kirschenbaum AM, Levine A, Unger P. Pri-mary renal carcinoid tumor. Urology. 1993;41:295–297.
75. Llaverias S, Valls C, Picas E. Carcinoid tumor of the thymus.Am J Roentgenol. 1994;163:478.
76. Watson RG, Johnston CF, O’Hare MMT, et al. The frequencyof gastrointestinal endocrine tumours in a well defined pop-ulation: Northern Ireland, 1970 –1985. Q J Med. 1989;267:647– 657.
Analysis of 13,715 Carcinoid Tumors/Modlin et al. 959