a 4-6 what is regression and median fit eq why is math used to model real-world situations? i will...
TRANSCRIPT

A 4-6 What is Regression and Median FitEQ
Why is math used to model real-world situations?
I will be able to…Write equations of best-fit lines using linear regression
Activities:Warm-upReview warm-upComplete quiz activity Review HWPower point lesson: Regression and Median FitMid-chapter 4 testDistribute tonight’s HW
Vocabulary:
• best-fit line• linear regression
• correlation coefficient

4-6 Regression and Median Fit

A Quick ReviewThe table shows the average weight for given heights. Does the data have a positive or negative correlation?
Refer to the scatter plot of Jessica’s visits to the park. Use the points (20, 9) and (100, 4) to write the slope-intercept form of an equation for a line of fit.
The table shows the average weight for given heights. Approximately how much would you expect a person who is 5’6” tall to weigh?
A. 140 lbsB. 152 lbsC. 160 lbsD. 170 lbs

A Quick ReviewRefer to the scatter plot of Jessica’s visits to the park. Predict the number of times Jessica will go to the park when the temperature is 50 degrees.
What is an equation of the line of fit that passes through the points at (2, –1) and (–1, –7)?

Real World ProblemEARNINGS The table shows Ariana’s hourly earnings for the years 2001–2007. Use a graphing calculator or phone to write an equation for the best-fit line for the data. Name the correlation coefficient. Round to the nearest ten-thousandth. (No graphing calculator – graph by hand)
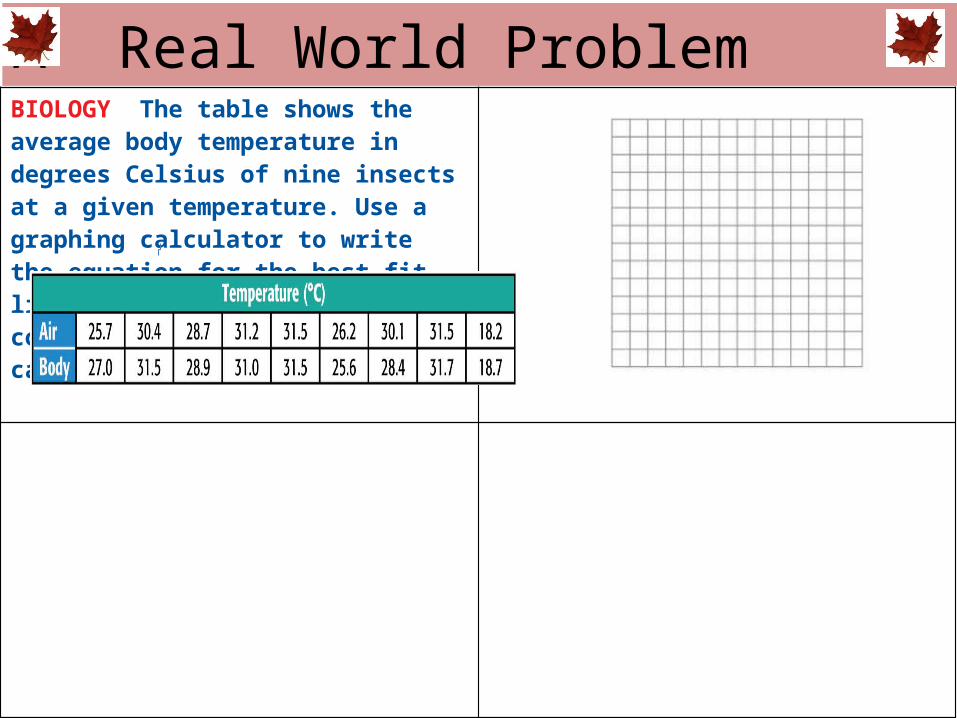
A Real World ProblemBIOLOGY The table shows the average body temperature in degrees Celsius of nine insects at a given temperature. Use a graphing calculator to write the equation for the best-fit line for that data. Name the correlation coefficient. (No calculator- graph by hand)

A Quick ReviewBOWLING The table shows the points earned by the top ten bowlers in a tournament. How many points did the 15th-ranked bowler earn?
Best way is using graphing calculator – alternative graph by hand…

A Quick Review

A Quick Review

A Quick Review

A Quick Review

A Quick Review