a 3d reconstruction algorithm for the location of ... · pdf filea 3d reconstruction algorithm...
TRANSCRIPT

A 3D reconstruction algorithm for the location offoundations in demolished buildings
Mr. Anand Sengodan and Dr. W. Paul CockshottComputer Vision and Graphics Group
School of Computing ScienceUniversity of Glasgow
Glasgow, G12 8QQEmail: {sengodan, wpc}@dcs.gla.ac.uk
Ms. Carmen Cuenca-GarciaFaculty of Arts
Department of ArchaeologyUniversity of Glasgow
Glasgow, G12 8QQEmail: [email protected]
Abstract—The location of foundations in a demolished buildingcan be accomplished by undertaking a Ground PenetratingRadar (GPR) survey and then to use the GPR data to generate3D isosurfaces of what was beneath the soil surface using imagereconstruction. The SIMCA (’SIMulated Correlation Algorithm’)algorithm is a technique based on a comparison between thetrace that would be returned by an ideal point reflector inthe soil conditions at the site and the actual trace. During aninitialization phase, SIMCA carries out radar simulation usingthe design parameters of the radar and the soil properties. Thetrace which would be returned by a target under these conditionsis then used to form a kernel. Then SIMCA takes the raw data asthe radar is scanned over the ground and removes clutter usinga clutter removal technique. The system correlates the kernelwith the data by carrying out volume correlation and produces3D images of the surface of subterranean objects detected. The3D isosurfaces are generated using MATLAB software. Thevalidation of the algorithm has been accomplished by comparingthe 3D isosurfaces produced by the SIMCA algorithm, Scheersalgorithm and REFLEXW commercial software. Then the depthand the position in the x and y directions as obtained usingMATLAB software for each of the cases are compared withthe corresponding values approximately obtained from originalArchitect’s drawings of the buildings.
Index Terms—GPR; simulation; kernel; correlation; convolu-tion.
I. INTRODUCTION
It is the aim of this paper to present the 3D reconstructedisosurface produced by the SIMCA algorithm and comparethem to 3D isosurface obtained using the REFLEXW software.Also the same data is going to be processed using the Scheers’algorithm [2]. Then the objectives of this study was to acquiredata from a car park which was built on the former site of arow of 19th century terraced houses, to process the data usingthe above mentioned techniques and then finally validate theresults. The existing car park shows bumps, cracks and thereis the irregular subsidence of the tarmac surface due to theeffects of the structural remains of the demolished houses thatoccupied the site prior to the car park construction.
Photographs of the original terraced buildings alongwith the degrading car park are shown in Figures 1and 2 respectively. The resulting 2D radargrams producedby the SIMCA algorithm are given in [1] and fromhttps://sites.google.com/site/simcaforfoundations/.
Fig. 1. Photograph showing location of demolished buildings (Courtesy ofT. R. Annan and Sons).
Fig. 2. Photograph showing the crack in the car park.
The background to the site and the data acquisition proce-dure are detailed in [1].
GPR traces contain a lot of artifacts such as the noiseproduced by near surface clutter (e.g. demolition debris) andalso clutter such as cross talk, initial ground reflections andantenna ringing and prevent the accurate estimation of theposition of targets. Therefore a clutter removal technique usedby the SIMCA algorithm is detailed in [1].
Figure 3 shows the raw and the processed radargrams. Fromthese figures it is difficult for a untrained operator to locate thefoundations. Therefore it can be concluded that it would be
easier for an operator to understand and locate the foundationsfrom 3D isosurfaces.
II. SIMCA ALGORITHM
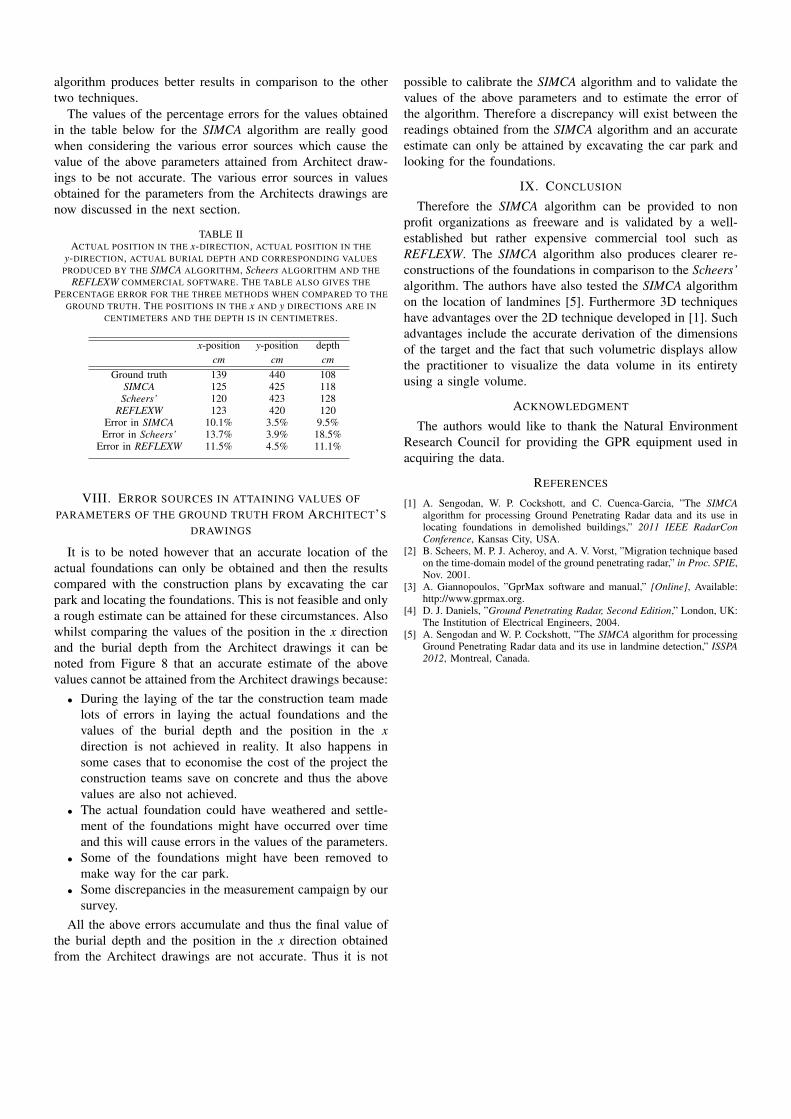
The flowchart of the SIMCA algorithm is shown in Figure 4.Using a point based target and the properties of the soil
at the site, the SIMCA algorithm carries out GPR simulationand from this simulated result the 2D correlation kernel isderived. By rotating the 2D kernel along the polar co-ordinatesproduces the 3D kernel. SIMCA then takes the raw data as theradar is scanned over the ground and removes the clutter suchas cross talk, initial ground reflection and antenna ringing. Thisclutter is removed by computing the mean vector of a numberof scans and then to subtract this from each of the scans. Thisproduces the clutter removed 2D radargram. The 3D data canbe then formed by the stacking of the clutter removed 2Dradargram.
The SIMCA technique then carries out volume correlationbetween the ideal point reflector trace generated by carryingout GPR simulation using GprMAX2D v1.5 developed by[3] and the clutter removed GPR trace obtained in the field.Then raising the image to an odd power >2 enhances thetarget/background separation. We use Pearson’s correlationcoefficient between two variables which carries out divisionbetween the covariance of the two variables and the productof their standard deviations.
Fig. 4. The flowchart of the SIMCA algorithm.
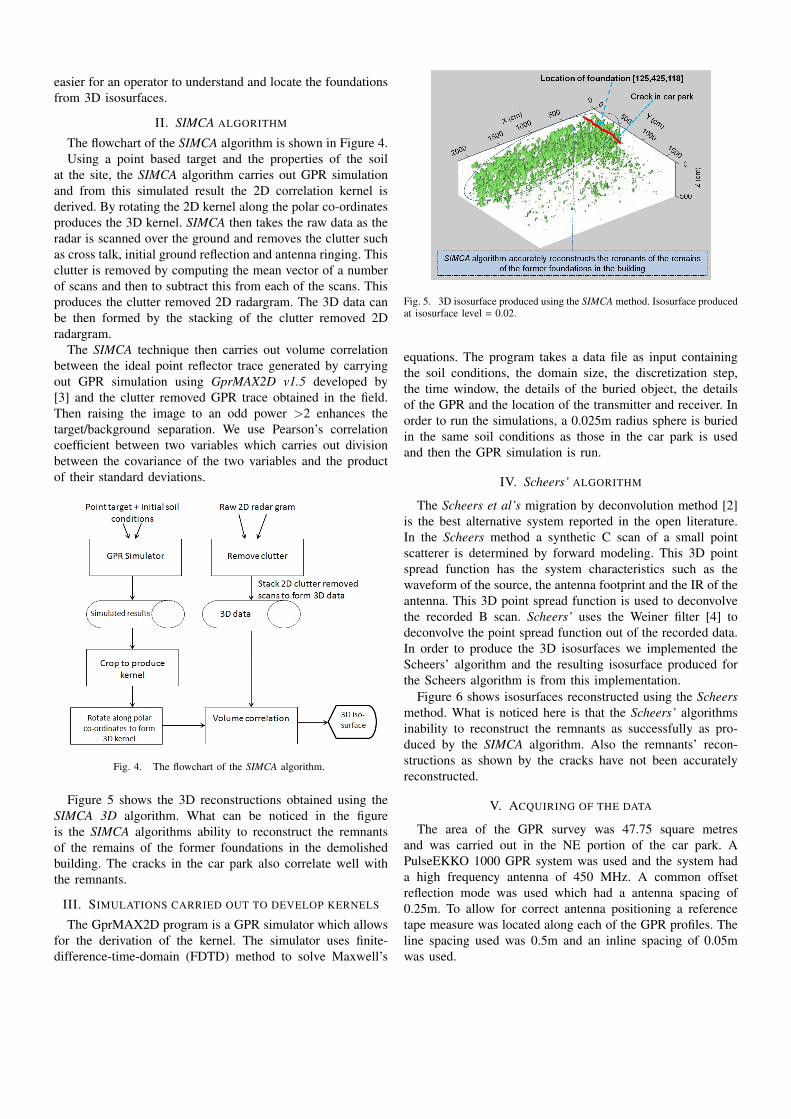
Figure 5 shows the 3D reconstructions obtained using theSIMCA 3D algorithm. What can be noticed in the figureis the SIMCA algorithms ability to reconstruct the remnantsof the remains of the former foundations in the demolishedbuilding. The cracks in the car park also correlate well withthe remnants.
III. SIMULATIONS CARRIED OUT TO DEVELOP KERNELS
The GprMAX2D program is a GPR simulator which allowsfor the derivation of the kernel. The simulator uses finite-difference-time-domain (FDTD) method to solve Maxwell’s
Fig. 5. 3D isosurface produced using the SIMCA method. Isosurface producedat isosurface level = 0.02.
equations. The program takes a data file as input containingthe soil conditions, the domain size, the discretization step,the time window, the details of the buried object, the detailsof the GPR and the location of the transmitter and receiver. Inorder to run the simulations, a 0.025m radius sphere is buriedin the same soil conditions as those in the car park is usedand then the GPR simulation is run.
IV. Scheers’ ALGORITHM
The Scheers et al’s migration by deconvolution method [2]is the best alternative system reported in the open literature.In the Scheers method a synthetic C scan of a small pointscatterer is determined by forward modeling. This 3D pointspread function has the system characteristics such as thewaveform of the source, the antenna footprint and the IR of theantenna. This 3D point spread function is used to deconvolvethe recorded B scan. Scheers’ uses the Weiner filter [4] todeconvolve the point spread function out of the recorded data.In order to produce the 3D isosurfaces we implemented theScheers’ algorithm and the resulting isosurface produced forthe Scheers algorithm is from this implementation.
Figure 6 shows isosurfaces reconstructed using the Scheersmethod. What is noticed here is that the Scheers’ algorithmsinability to reconstruct the remnants as successfully as pro-duced by the SIMCA algorithm. Also the remnants’ recon-structions as shown by the cracks have not been accuratelyreconstructed.
V. ACQUIRING OF THE DATA
The area of the GPR survey was 47.75 square metresand was carried out in the NE portion of the car park. APulseEKKO 1000 GPR system was used and the system hada high frequency antenna of 450 MHz. A common offsetreflection mode was used which had a antenna spacing of0.25m. To allow for correct antenna positioning a referencetape measure was located along each of the GPR profiles. Theline spacing used was 0.5m and an inline spacing of 0.05mwas used.

Fig. 3. The 2D radargrams. The figure on the top is the unprocessed raw radargram and the one on the bottom is the clutter removed radargram.
Fig. 6. 3D isosurface produced using the Scheers method. Isosurfaceproduced at isosurface level = 0.09.
VI. PROCESSING USING REFLEXW COMMERCIALPACKAGE
The processing step used to process data using the RE-FLEXW commercial software is detailed in [1]. A 3D blockwas constructed from the parallel profiles and then the 3Dreconstructed isosurface was generated from this as shownin Figure 7. Table I illustrates the processing steps used toprocess the data using the REFLEXW software. Attenuationin the ground is compensated by a varying gain in the receiverpart of the system.
VII. COMPARISON OF RESULTS
Table II gives the values for the x-position, y-position andthe burial depth for the ground truth and those from thethree methods. The actual values for the above parameters
TABLE ITHE PROCESSING STEPS USED IN THE REFLEXW SOFTWARE
Processing steps
1 Static correction2 Subtract-mean (dewow)3 Gain (energy decay)4 Background removal
4.1 Time cut
Fig. 7. Isosurface generated using REFLEXW commercial software atthreshold of 0.02.
are obtained from Architects drawings. The percentage errorsindicate that the SIMCA algorithm is slightly better than theREFLEXW software and that the Scheers algorithm again isnot accurate. This shows that the SIMCA algorithm is accuratein reconstructing targets. The absolute errors for the x-positionand the burial depth for the SIMCA 3D, Scheers algorithmand the REFLEXW software are better than the correspondingresults obtained using 2D methods, but overall the SIMCA 3D
algorithm produces better results in comparison to the othertwo techniques.
The values of the percentage errors for the values obtainedin the table below for the SIMCA algorithm are really goodwhen considering the various error sources which cause thevalue of the above parameters attained from Architect draw-ings to be not accurate. The various error sources in valuesobtained for the parameters from the Architects drawings arenow discussed in the next section.
TABLE IIACTUAL POSITION IN THE x-DIRECTION, ACTUAL POSITION IN THE
y-DIRECTION, ACTUAL BURIAL DEPTH AND CORRESPONDING VALUESPRODUCED BY THE SIMCA ALGORITHM, Scheers ALGORITHM AND THE
REFLEXW COMMERCIAL SOFTWARE. THE TABLE ALSO GIVES THEPERCENTAGE ERROR FOR THE THREE METHODS WHEN COMPARED TO THE
GROUND TRUTH. THE POSITIONS IN THE x AND y DIRECTIONS ARE INCENTIMETERS AND THE DEPTH IS IN CENTIMETRES.
x-position y-position depthcm cm cm
Ground truth 139 440 108SIMCA 125 425 118Scheers’ 120 423 128
REFLEXW 123 420 120Error in SIMCA 10.1% 3.5% 9.5%Error in Scheers’ 13.7% 3.9% 18.5%
Error in REFLEXW 11.5% 4.5% 11.1%
VIII. ERROR SOURCES IN ATTAINING VALUES OFPARAMETERS OF THE GROUND TRUTH FROM ARCHITECT’S
DRAWINGS
It is to be noted however that an accurate location of theactual foundations can only be obtained and then the resultscompared with the construction plans by excavating the carpark and locating the foundations. This is not feasible and onlya rough estimate can be attained for these circumstances. Alsowhilst comparing the values of the position in the x directionand the burial depth from the Architect drawings it can benoted from Figure 8 that an accurate estimate of the abovevalues cannot be attained from the Architect drawings because:
• During the laying of the tar the construction team madelots of errors in laying the actual foundations and thevalues of the burial depth and the position in the xdirection is not achieved in reality. It also happens insome cases that to economise the cost of the project theconstruction teams save on concrete and thus the abovevalues are also not achieved.
• The actual foundation could have weathered and settle-ment of the foundations might have occurred over timeand this will cause errors in the values of the parameters.
• Some of the foundations might have been removed tomake way for the car park.
• Some discrepancies in the measurement campaign by oursurvey.
All the above errors accumulate and thus the final value ofthe burial depth and the position in the x direction obtainedfrom the Architect drawings are not accurate. Thus it is not
possible to calibrate the SIMCA algorithm and to validate thevalues of the above parameters and to estimate the error ofthe algorithm. Therefore a discrepancy will exist between thereadings obtained from the SIMCA algorithm and an accurateestimate can only be attained by excavating the car park andlooking for the foundations.
IX. CONCLUSION
Therefore the SIMCA algorithm can be provided to nonprofit organizations as freeware and is validated by a well-established but rather expensive commercial tool such asREFLEXW. The SIMCA algorithm also produces clearer re-constructions of the foundations in comparison to the Scheers’algorithm. The authors have also tested the SIMCA algorithmon the location of landmines [5]. Furthermore 3D techniqueshave advantages over the 2D technique developed in [1]. Suchadvantages include the accurate derivation of the dimensionsof the target and the fact that such volumetric displays allowthe practitioner to visualize the data volume in its entiretyusing a single volume.
ACKNOWLEDGMENT
The authors would like to thank the Natural EnvironmentResearch Council for providing the GPR equipment used inacquiring the data.
REFERENCES
[1] A. Sengodan, W. P. Cockshott, and C. Cuenca-Garcia, ”The SIMCAalgorithm for processing Ground Penetrating Radar data and its use inlocating foundations in demolished buildings,” 2011 IEEE RadarConConference, Kansas City, USA.
[2] B. Scheers, M. P. J. Acheroy, and A. V. Vorst, ”Migration technique basedon the time-domain model of the ground penetrating radar,” in Proc. SPIE,Nov. 2001.
[3] A. Giannopoulos, ”GprMax software and manual,” [Online], Available:http://www.gprmax.org.
[4] D. J. Daniels, ”Ground Penetrating Radar, Second Edition,” London, UK:The Institution of Electrical Engineers, 2004.
[5] A. Sengodan and W. P. Cockshott, ”The SIMCA algorithm for processingGround Penetrating Radar data and its use in landmine detection,” ISSPA2012, Montreal, Canada.
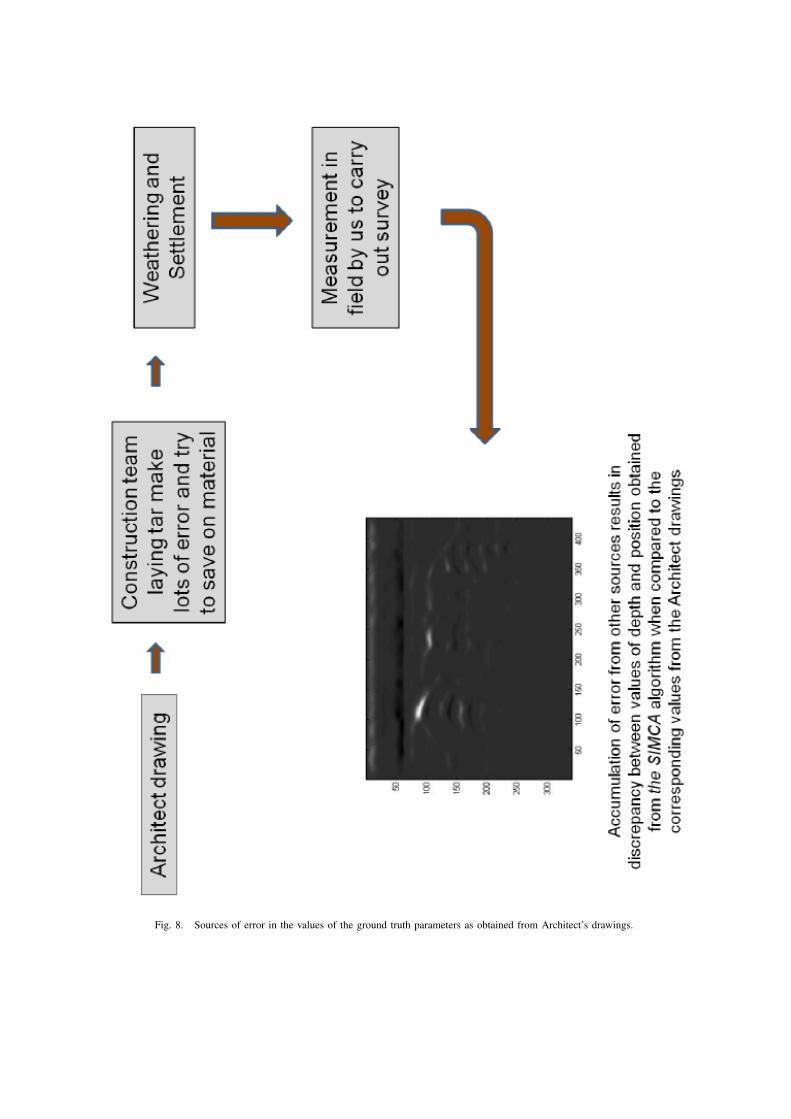
Fig. 8. Sources of error in the values of the ground truth parameters as obtained from Architect’s drawings.