a 2d aerodynami study on morphing in the na a …
TRANSCRIPT

READ-2018-15
1
A 2D AERODYNAMIC STUDY ON MORPHING IN THE NACA 2412 AEROFOIL
Pratik Meghani
School of Computing, Engineering and Mathematics University of Brighton
Cockcroft Building, Lewes Road, Brighton, BN2 4GJ www.brighton.ac.uk
United Kingdom
Keywords: Aerofoil, Morphing, XFOIL, CFD (ANSYS FLUENT), Wind Tunnel Testing
Abstract: This paper investigates the potential of modifications in the NACA 2412 aerofoil’s geometry which could be implemented as a morphing wing in the Cessna 172SP. A 2D study on three morphing configurations: landing, take-off and stall maneuvering was conducted. The new geometries were designed using XFLR5. The initial aerodynamics characteristics were computed using XFOIL and compared to that of NACA 2412 in the Cessna 172SP. A selected configuration (landing) was tested at the University of Brighton wind tunnel facility, in comparison to XFOIL predictions. Moreover, the ESDU 07010 report was used to extrapolate the Reynold’s number to full scale, which was necessary to obtain an approximation of the aerodynamic characteristics at actual flight. The paper presents results of ANSYS FLUENT simulations for all three configurations. Results reveal that XFOIL is suitable for morphing airfoil configuration analysis but only at low Reynolds number (Re≈500,000). Adaptive aerofoil geometry improves the lift to drag (L/D) ratio by decreasing the drag coefficient; it also expands the flight envelope by delaying stall.
1 INTRODUCTION
All modern fixed-wing aircrafts have an optimal window of aerodynamic performance. This implies
that high lift devices such as flaps and slats have been used to alter the aerodynamic characteristics to
suit the mission profile of any given aircraft, such as extending the flaps during landing. To increase
the aerodynamic performance and efficiency at different flight conditions, morphing aerofoil
configurations were considered. Morphing involves changing the aerofoil’s geometry during flight to
optimise the aerodynamic characteristics to achieve better performance. It increases the overall
efficiency of a wing by reducing the drag, complexity of dynamic structures in high lift devices and
overall scour. The performance of the morphing aerofoil was analysed using XFOIL and compared to
wind tunnel experiments and Computational Fluid Dynamics (CFD) software. This study focuses only
on the aerodynamic aspect of morphing wing and aspects such as material, manufacture and control
are not included.
READ-2018-15
2
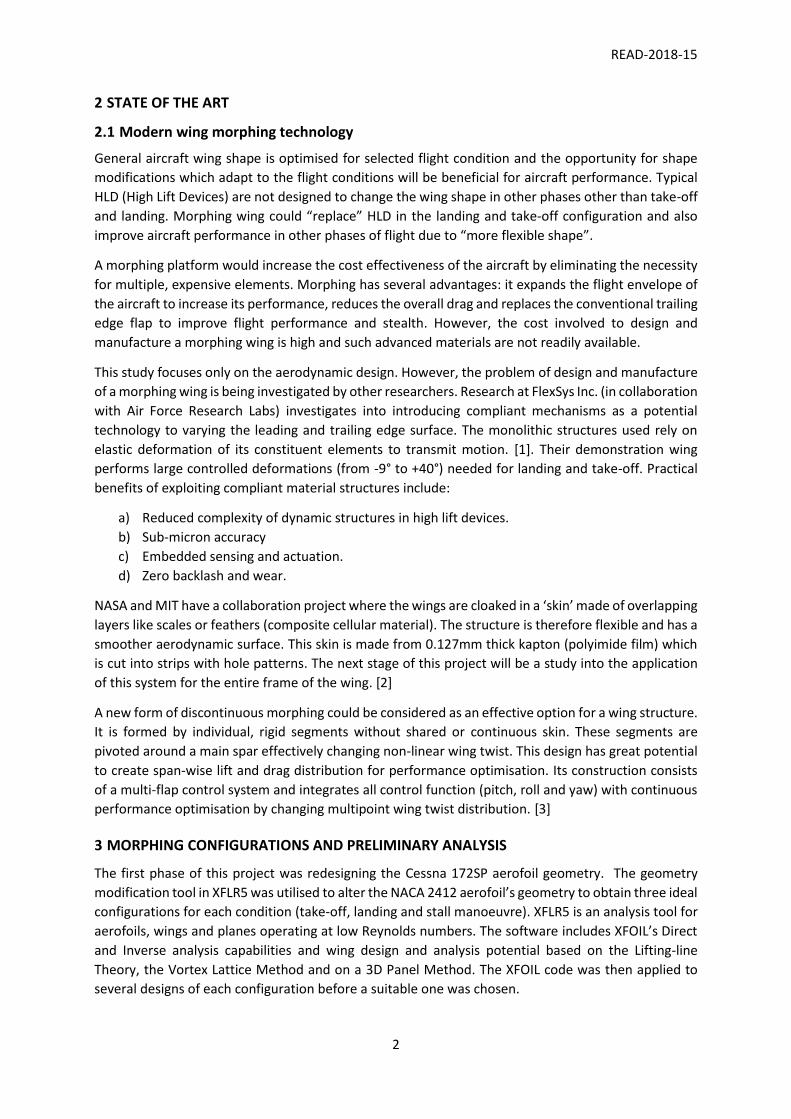
2 STATE OF THE ART
2.1 Modern wing morphing technology
General aircraft wing shape is optimised for selected flight condition and the opportunity for shape
modifications which adapt to the flight conditions will be beneficial for aircraft performance. Typical
HLD (High Lift Devices) are not designed to change the wing shape in other phases other than take-off
and landing. Morphing wing could “replace” HLD in the landing and take-off configuration and also
improve aircraft performance in other phases of flight due to “more flexible shape”.
A morphing platform would increase the cost effectiveness of the aircraft by eliminating the necessity
for multiple, expensive elements. Morphing has several advantages: it expands the flight envelope of
the aircraft to increase its performance, reduces the overall drag and replaces the conventional trailing
edge flap to improve flight performance and stealth. However, the cost involved to design and
manufacture a morphing wing is high and such advanced materials are not readily available.
This study focuses only on the aerodynamic design. However, the problem of design and manufacture
of a morphing wing is being investigated by other researchers. Research at FlexSys Inc. (in collaboration
with Air Force Research Labs) investigates into introducing compliant mechanisms as a potential
technology to varying the leading and trailing edge surface. The monolithic structures used rely on
elastic deformation of its constituent elements to transmit motion. [1]. Their demonstration wing
performs large controlled deformations (from -9° to +40°) needed for landing and take-off. Practical
benefits of exploiting compliant material structures include:
a) Reduced complexity of dynamic structures in high lift devices.
b) Sub-micron accuracy
c) Embedded sensing and actuation.
d) Zero backlash and wear.
NASA and MIT have a collaboration project where the wings are cloaked in a ‘skin’ made of overlapping
layers like scales or feathers (composite cellular material). The structure is therefore flexible and has a
smoother aerodynamic surface. This skin is made from 0.127mm thick kapton (polyimide film) which
is cut into strips with hole patterns. The next stage of this project will be a study into the application
of this system for the entire frame of the wing. [2]
A new form of discontinuous morphing could be considered as an effective option for a wing structure.
It is formed by individual, rigid segments without shared or continuous skin. These segments are
pivoted around a main spar effectively changing non-linear wing twist. This design has great potential
to create span-wise lift and drag distribution for performance optimisation. Its construction consists
of a multi-flap control system and integrates all control function (pitch, roll and yaw) with continuous
performance optimisation by changing multipoint wing twist distribution. [3]
3 MORPHING CONFIGURATIONS AND PRELIMINARY ANALYSIS
The first phase of this project was redesigning the Cessna 172SP aerofoil geometry. The geometry
modification tool in XFLR5 was utilised to alter the NACA 2412 aerofoil’s geometry to obtain three ideal
configurations for each condition (take-off, landing and stall manoeuvre). XFLR5 is an analysis tool for
aerofoils, wings and planes operating at low Reynolds numbers. The software includes XFOIL’s Direct
and Inverse analysis capabilities and wing design and analysis potential based on the Lifting-line
Theory, the Vortex Lattice Method and on a 3D Panel Method. The XFOIL code was then applied to
several designs of each configuration before a suitable one was chosen.
READ-2018-15
3
3.1 The XFOIL code
XFOIL uses a fast and robust analysis method for on-design and off-design performance evaluation. Its
mathematical algorithm handles very strong and nonlinear coupling between the viscous, transition
and inviscid formulations at separation bubbles. XFOIL’s viscous formulation is similar to that of the
transonic ISES code. In this method, the Euler equations are discretised on a conservative streamline
grid and are coupled to a 2-equation integral boundary layer formulation, using the displacement
thickness concept. A transition prediction formulation of eN_crit is incorporated into the viscous
formulation. The discrete equation set (viscous and transition formulations) is solved as a fully coupled
nonlinear system by a global Newton method. The Newton method is rapid and reliable for dealing
with strong viscous-inviscid interactions which occur at low Reynolds number (Re) flows (about half a
million). An N_crit value of 9 (default) and a turbulence factor of 0.0759 was applied to all simulations
in XFOIL and was calculated using equation (1). [4]
𝑁𝑐𝑟𝑖𝑡 = −8.43 − 2.4 ln (𝑇𝑢%/100%) (1)
There are not many published papers that focus purely on an aerodynamic approach on morphing at
high Re using either XFOIL or any valid CFD software; however, a journal paper named – XFOIL vs CFD
performance prediction for high lift low Reynold’s number airfoils – was found valuable. [5]
In this literature, Blade Element Momentum theory (BEM) was used to calculate the performance of
propellers using Reynolds Averaged Navier Stokes (RANS) equations (k-ω SST and k-kl-l) and inviscid
flow coupled with boundary layer formulation. The results showed that all predictions were in good
agreement with the experiments and concluded that XFOIL was an excellent aerofoil design and
analysis tool at low Re (2.0 x 10⁵).
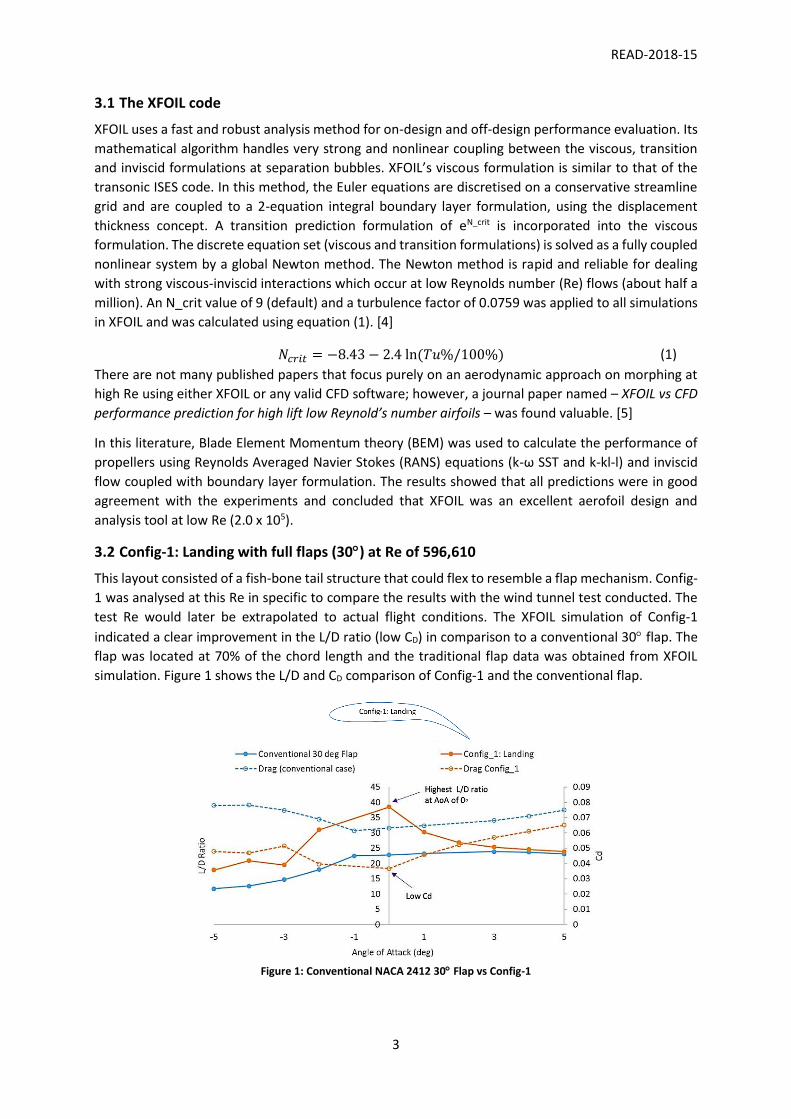
3.2 Config-1: Landing with full flaps (30) at Re of 596,610
This layout consisted of a fish-bone tail structure that could flex to resemble a flap mechanism. Config-
1 was analysed at this Re in specific to compare the results with the wind tunnel test conducted. The
test Re would later be extrapolated to actual flight conditions. The XFOIL simulation of Config-1
indicated a clear improvement in the L/D ratio (low CD) in comparison to a conventional 30 flap. The
flap was located at 70% of the chord length and the traditional flap data was obtained from XFOIL
simulation. Figure 1 shows the L/D and CD comparison of Config-1 and the conventional flap.
Figure 1: Conventional NACA 2412 30 Flap vs Config-1

READ-2018-15
4
3.3 Config-2 and Config-3: Take-off and Stall Manoeuvre respectively at Re of 3,492,402
Config-2 exhibited a drooping leading-edge feature which was designed to exhibit better aerodynamic
characteristic during take-off/climb, hence the range of Angle of Attack (AoA) from 7 to 15. The XFOIL
simulations performed reflected this, hence high L/D ratio due to low coefficient of drag between this
ranges.
Config_3 incorporated a droop and active fish-bone like feature on the leading edge and trailing edge
respectively. The purpose of designing this aerofoil was to exploit the aerodynamic limit via morphing.
This could be beneficial in training aircrafts by giving new pilots more time to react before stall. XFOIL
simulations predicted an increase in stall angle from 18 to 23. Figure 2 show the L/D comparison of
Config-2 & 3 and the NACA 2412 computed using XFOIL.
Figure 2: (a) XFOIL Comparison of Config-2 vs NACA 2412 (b) XFOIL Comparison of Config-3 vs NACA 2412
4 WIND TUNNEL TEST
This section of the research paper presents the wind tunnel test results for the model scale of Config-
1. As mentioned in section 3.1, the Re would be extrapolated from the wind tunnel test to full scale
flight using the transition-location ‘sweep’ presented in the ESDU 07010 technical paper [6]. The main
purpose of the experiment was to conduct a 2D pressure distribution study of the airflow over the
surface of the model; in comparison to XFOIL results.
4.1 Wind tunnel - 2D Pressure Profile study
The research was conducted at the open section closed circuit subsonic wind tunnel at the University
of Brighton. A paraffin-filled manometer was utilised to measure pressure. Pressure tapings on the
surface of the model determined the pressure coefficient distribution. The test was carried out for AoA
from -5 to 5 and free stream speed equal to V=22m/s, which correspond to Re=596,610.
(a) (b)
READ-2018-15
5
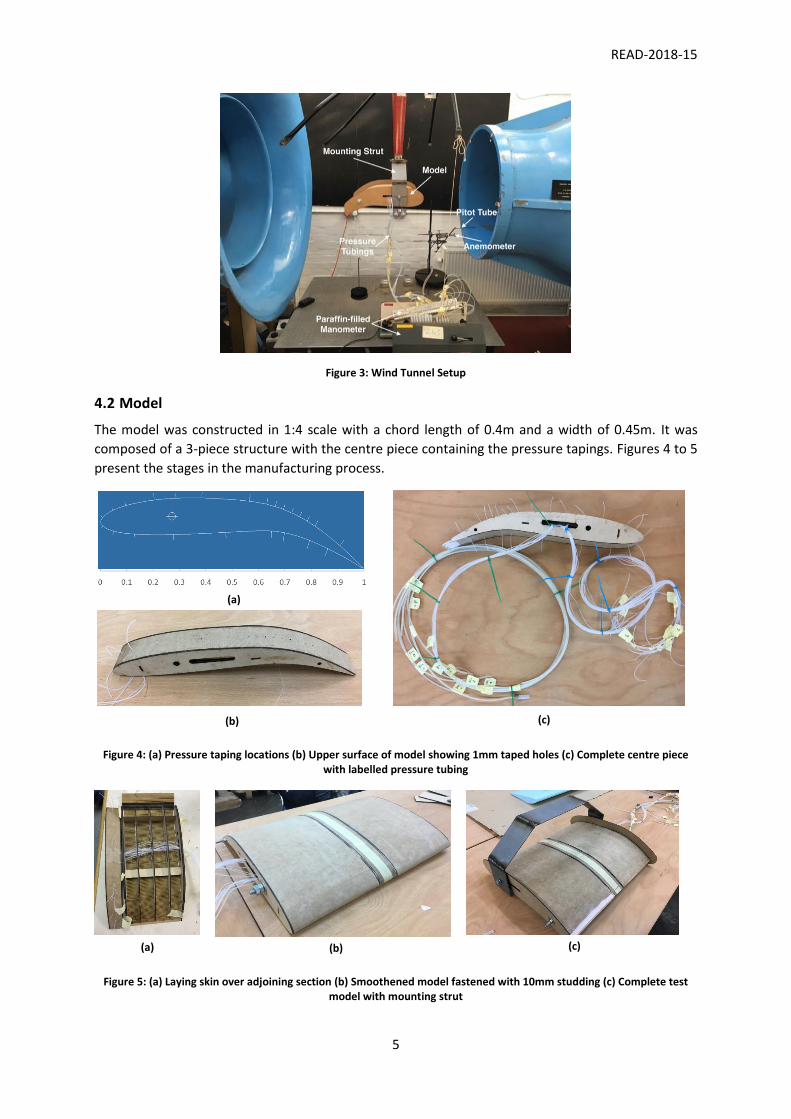
Figure 3: Wind Tunnel Setup
4.2 Model
The model was constructed in 1:4 scale with a chord length of 0.4m and a width of 0.45m. It was
composed of a 3-piece structure with the centre piece containing the pressure tapings. Figures 4 to 5
present the stages in the manufacturing process.
Figure 4: (a) Pressure taping locations (b) Upper surface of model showing 1mm taped holes (c) Complete centre piece with labelled pressure tubing
Figure 5: (a) Laying skin over adjoining section (b) Smoothened model fastened with 10mm studding (c) Complete test model with mounting strut
(a)
(b) (c)
(a) (b) (c)

READ-2018-15
6
4.3 Results
The coefficient of lift (CL) was calculated based on the pressure coefficient. Equations (2) and (3) were
used to calculate the CL for this case. The results presented show a comparison of the 2D pressure
distribution between the wind tunnel test and the initial XFOIL predictions for 3 tests ranging from an
AoA from -5 to 5.
𝐶𝑃 =∆𝑃
12 . 𝑣2. 𝜌
(2)
𝐶𝐿 = ∫ 𝐶𝑃
𝑦
0
× 𝐶𝑜𝑠(𝛼) (3)
Comparison of XFOIL and experimental results for Test A, B and C are presented in Table 1. Figure 6
presents the comparison of the 2D pressure profiles between XFOIL and the experiment for the scale
model of Config-1.
Test A (-5) Test B (0) Test C (5)
CD CL CD CL CD CL
XFOIL Prediction 0.024 0.251 0.038 0.620 0.047 0.987 Wind Tunnel Test 0.033 0.275 0.025 0.700 0.082 1.071
Table 1: Comparison of aerodynamic data between XFOIL and Wind Tunnel Test
Figure 6: (a) Cp vs x/c Test A (b) Cp vs x/c Test B (c) Cp vs x/c Test C
(a) (b)
(c)

READ-2018-15
7
4.4 Reynold’s number extrapolation for Test B
Assuming the stagnation conditions in the wind tunnel were fixed (‘atmospheric tunnel’), the
transition-location ‘sweep’ extrapolation method was used to extrapolate the Reynolds number to
real flight conditions. This involved manipulating the boundary layer state at the test Reynolds number
to reproduce flow features that occur at higher Reynolds number. Control over the boundary layer
state was achieved by moving the transition roughness strip from the position corresponding to full-
scale transition (near leading edge) to a point further aft (aft-fixing). Moving the transition location aft
thins the turbulent boundary layer, thus simulating flow at high Reynolds number. This enables a
chosen flow feature, e.g. the boundary layer momentum thickness at the wing trailing edge, to be
matched. To apply this extrapolation method to an aerofoil, the flat plate criterion was used in
Reynolds number mapping and based on the assumption of an incompressible boundary layer. [6] The
momentum thickness at the trailing edge of the flat plate was matched using empirical relationships
for local surface friction coefficient and boundary layer theory. Equation (4) and (5) show the mapping
function.
𝑥𝑜
𝑐=
𝑥𝑡𝑟
𝑐− 41.58𝑅𝑒𝑡𝑒𝑠𝑡
−3/8(
𝑥𝑡𝑟
𝑐)
5/8
(4)
𝑅𝑒𝑒𝑓𝑓
𝑅𝑒𝑡𝑒𝑠𝑡= (1 −
𝑥𝑜
𝑐)
−4
= (1 −𝑥𝑡𝑟
𝑐− 41.58𝑅𝑒𝑡𝑒𝑠𝑡
−3/8(
𝑥𝑡𝑟
𝑐)
5/8
)
−4
(5)
The extrapolation procedure gave an effective Re (𝑅𝑒𝑒𝑓𝑓) of 3,874,144, this value neighboured the
expected Re of 3,942,505. The transition distance (𝑥𝑡𝑟) was based on XFOIL’s prediction and was
obtained as 0.2297m. Assuming that the test was conducted above the critical Reynold’s number,
similar aerodynamic characteristics were expected to be seen in actual flight as observed in the scale
model testing.
5 NUMERICAL CALCULATION
Numerical aerodynamic calculations were applied to the other morphing configurations (Config-2 &
Config-3) at full scale (c=1.6m) in comparison to XFOIL and NACA 2412 in Cessna 172SP. FLUENT
software (solves Navier-Stokes equations) was used for the research. Due to the size of the University
of Brighton wind tunnel, there was no possibility to experimentally test those configurations, hence
use of a scaled model.
5.1 Fluent Simulation
The flow domain area used was 20 times larger (32 m by 32 m). Projection surfaces were created in
preparation for meshing. The mesh element size was limited to ≤ 500,000 to cut down simulation
times. A triangular mesh was applied to all configurations with the element size (in the projection
surface) increasing proximity to the given morphing configuration. 5 Inflation layers with a first layer
thickness corresponding to the calculated y+ parameter was applied to the configurations.
All configurations were simulated in FLUENT, only Config-1 was a scaled model to ensure easy
comparison with wind tunnel results. Table 2 describes the setup procedure used to perform the CFD
simulations.
READ-2018-15
8
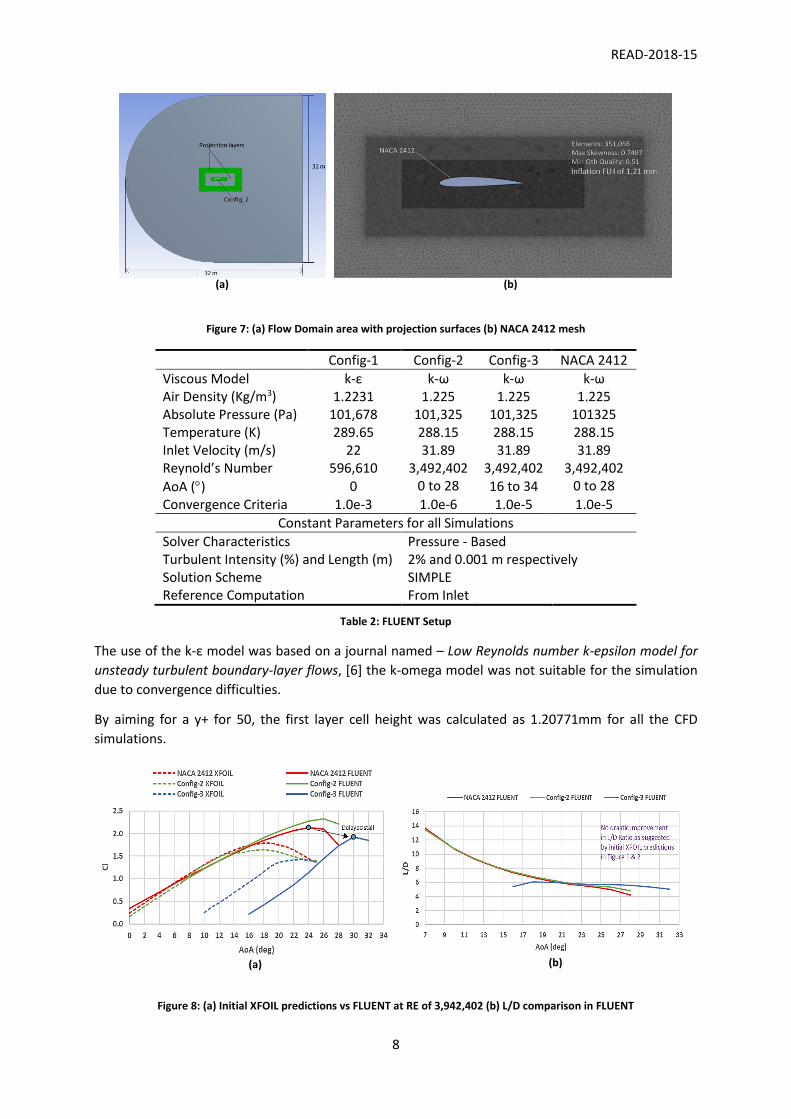
Figure 7: (a) Flow Domain area with projection surfaces (b) NACA 2412 mesh
Config-1 Config-2 Config-3 NACA 2412
Viscous Model k-ε k-ω k-ω k-ω Air Density (Kg/m3) 1.2231 1.225 1.225 1.225 Absolute Pressure (Pa) 101,678 101,325 101,325 101325 Temperature (K) 289.65 288.15 288.15 288.15 Inlet Velocity (m/s) 22 31.89 31.89 31.89 Reynold’s Number 596,610 3,492,402 3,492,402 3,492,402
AoA () 0 0 to 28 16 to 34 0 to 28
Convergence Criteria 1.0e-3 1.0e-6 1.0e-5 1.0e-5
Constant Parameters for all Simulations
Solver Characteristics Pressure - Based Turbulent Intensity (%) and Length (m) 2% and 0.001 m respectively Solution Scheme SIMPLE Reference Computation From Inlet
Table 2: FLUENT Setup
The use of the k-ε model was based on a journal named – Low Reynolds number k-epsilon model for
unsteady turbulent boundary-layer flows, [6] the k-omega model was not suitable for the simulation
due to convergence difficulties.
By aiming for a y+ for 50, the first layer cell height was calculated as 1.20771mm for all the CFD
simulations.
Figure 8: (a) Initial XFOIL predictions vs FLUENT at RE of 3,942,402 (b) L/D comparison in FLUENT
(a) (b)
(a) (b)
READ-2018-15
9
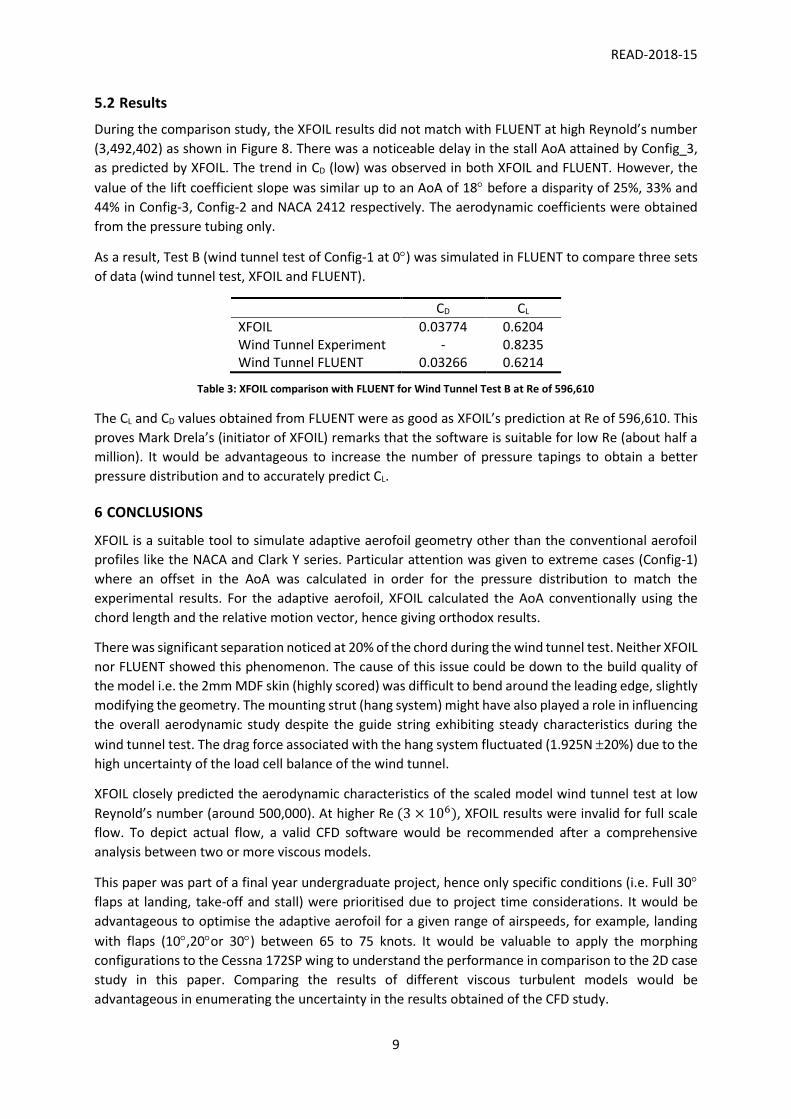
5.2 Results
During the comparison study, the XFOIL results did not match with FLUENT at high Reynold’s number
(3,492,402) as shown in Figure 8. There was a noticeable delay in the stall AoA attained by Config_3,
as predicted by XFOIL. The trend in CD (low) was observed in both XFOIL and FLUENT. However, the
value of the lift coefficient slope was similar up to an AoA of 18 before a disparity of 25%, 33% and
44% in Config-3, Config-2 and NACA 2412 respectively. The aerodynamic coefficients were obtained
from the pressure tubing only.
As a result, Test B (wind tunnel test of Config-1 at 0) was simulated in FLUENT to compare three sets
of data (wind tunnel test, XFOIL and FLUENT).
CD CL
XFOIL 0.03774 0.6204 Wind Tunnel Experiment - 0.8235 Wind Tunnel FLUENT 0.03266 0.6214
Table 3: XFOIL comparison with FLUENT for Wind Tunnel Test B at Re of 596,610
The CL and CD values obtained from FLUENT were as good as XFOIL’s prediction at Re of 596,610. This
proves Mark Drela’s (initiator of XFOIL) remarks that the software is suitable for low Re (about half a
million). It would be advantageous to increase the number of pressure tapings to obtain a better
pressure distribution and to accurately predict CL.
6 CONCLUSIONS
XFOIL is a suitable tool to simulate adaptive aerofoil geometry other than the conventional aerofoil
profiles like the NACA and Clark Y series. Particular attention was given to extreme cases (Config-1)
where an offset in the AoA was calculated in order for the pressure distribution to match the
experimental results. For the adaptive aerofoil, XFOIL calculated the AoA conventionally using the
chord length and the relative motion vector, hence giving orthodox results.
There was significant separation noticed at 20% of the chord during the wind tunnel test. Neither XFOIL
nor FLUENT showed this phenomenon. The cause of this issue could be down to the build quality of
the model i.e. the 2mm MDF skin (highly scored) was difficult to bend around the leading edge, slightly
modifying the geometry. The mounting strut (hang system) might have also played a role in influencing
the overall aerodynamic study despite the guide string exhibiting steady characteristics during the
wind tunnel test. The drag force associated with the hang system fluctuated (1.925N 20%) due to the
high uncertainty of the load cell balance of the wind tunnel.
XFOIL closely predicted the aerodynamic characteristics of the scaled model wind tunnel test at low
Reynold’s number (around 500,000). At higher Re (3 × 10⁶), XFOIL results were invalid for full scale
flow. To depict actual flow, a valid CFD software would be recommended after a comprehensive
analysis between two or more viscous models.
This paper was part of a final year undergraduate project, hence only specific conditions (i.e. Full 30
flaps at landing, take-off and stall) were prioritised due to project time considerations. It would be
advantageous to optimise the adaptive aerofoil for a given range of airspeeds, for example, landing
with flaps (10,20or 30) between 65 to 75 knots. It would be valuable to apply the morphing
configurations to the Cessna 172SP wing to understand the performance in comparison to the 2D case
study in this paper. Comparing the results of different viscous turbulent models would be
advantageous in enumerating the uncertainty in the results obtained of the CFD study.

READ-2018-15
10
Morphing technology could be integrated with control theory [8] to optimise the flight performance
for any given condition. Delaying the stall could be a useful safety feature as the Cessna 172SP is widely
used as a training aircraft for new generation of pilots.
ACKNOWLEDGEMENTS
I would like to thank the University of Brighton for funding our trip to the Czech Republic and giving us
an opportunity to present our research paper at an undergraduate level and represent the university
at this international conference. I also acknowledge the support my supervisor and the lab technicians
gave in terms of technical advice and manufacturing expertise during the scale model construction.
REFERENCES
[1] Kota, S. (n.d.). Mission Adaptive Compliant Wing - Design, Fabrication and Flight Test. [online] (1), p.4. Available at: https://pdfs.semanticscholar.org/c894/116f99834e6aaeb181e40e8ef747132356ea.pdf [Accessed 15 Dec. 2017].
[2] NASA. (2018). Go, Go, Green Wing! Mighty Morphing Materials in Aircraft Design. [online] Available at: https://www.nasa.gov/ames/feature/go-go-green-wing-mighty-morphing-materials-in-aircraft-design [Accessed 26 Apr. 2018].
[3] Tarnowski, A. (2017). Morphing wing with skin discontinuity – kinematic concept. Aircraft Engineering and Aerospace Technology, 89(4), pp.535-546.
[4] Web.mit.edu. (2018). An Analysis and Design System for Low Reynolds Number Airfoils. [online] Available at: http://web.mit.edu/drela/Public/papers/xfoil_sv.pdf [Accessed 3 Apr. 2018].
[5] Morgado, J., Vizinho, R., Silvestre, M. and Páscoa, J. (2016). XFOIL vs CFD performance predictions for high lift low Reynolds number airfoils. Aerospace Science and Technology, 52, pp.207-214.
[6] Philpott, D. (2007). Extrapolating wind-tunnel data to full-scale Reynolds number. ESDU, (07010), pp.13-14, 57-59.
[7] Fan, S., Lakshminarayana, B. and Barnett, M. (2018). Low-Reynolds-number k-epsilon model for unsteady turbulent boundary-layer flows. [online] Ntrs.nasa.gov. Available at: https://ntrs.nasa.gov/search.jsp?R=19930069211 [Accessed 11 Oct. 2018].
[8] Bourdin, P., Gatto, A. and Friswell, M. (2008). Aircraft Control via Variable Cant-Angle Winglets. Journal of Aircraft, 45(2), pp.414-423.
COPYRIGHT STATEMENT
The authors confirm that they, and/or their company or organization, hold copyright on all of the
original material included in this paper. The authors also confirm that they have obtained permission,
from the copyright holder of any third party material included in this paper, to publish it as part of their
paper. The authors confirm that they give permission, or have obtained permission from the copyright
holder of this paper, for the publication and distribution of this paper as part of the READ 2018
proceedings published under the Creative Commons Attribution licence
(https://creativecommons.org/licenses/by/4.0/) in the Digital Library of the Brno University of
Technology (https://dspace.vutbr.cz/).