a 21 st century observation system for forcings of extreme precipitation and flood events in...
TRANSCRIPT

A 21st Century Observation System for Forcingsof Extreme Precipitation and Flood Events in California:
HMT-West’s Legacy Project
Photo by Stephan Dietrich
Allen White1, Mike Anderson2, Mike Dettinger3, Art Hinojosa2, Marty Ralph1, and Dan Cayan4
1NOAA Earth System Research Laboratory, Boulder, CO2California Department of Water Resources, Sacramento, CA3U.S. Geological Survey, Scripps Institution of Oceanography, La Jolla, CA4Scripps Institution of Oceanography, La Jolla, CA
University of Arizona and NOAA Coordination Meeting on Hydrometeorology, 9 April 2012, Boulder, Colorado

IV: Off-
shorerecon.
Tier III:Newer technology
Ex: Gap-filling radars,Buoy-mounted WPs
Tier I: Address well-defined needs with proven technology
Ex: Soil moisture sensors at CIMIS sites, GPS receivers of opportunity, snow-level radars
Tier II: Expand on well-defined needs with proven technology
Ex: Wind profilers, Coastal Atmospheric river observatory
A tiered approach for new obs to help address CA’s water resource issues
DWR
NOAA
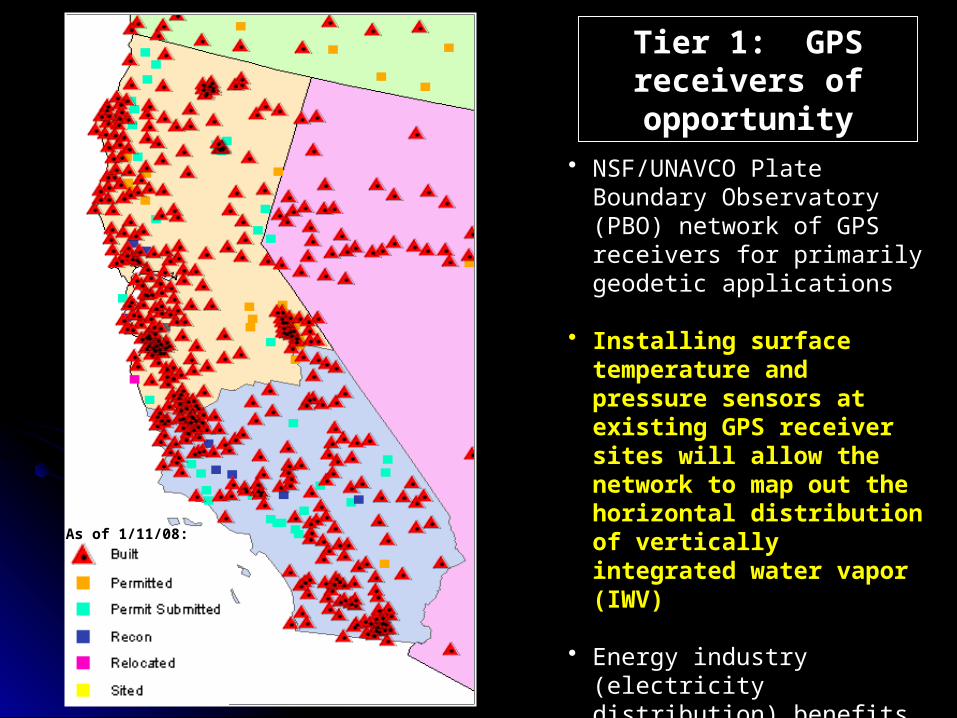
• NSF/UNAVCO Plate Boundary Observatory (PBO) network of GPS receivers for primarily geodetic applications
• Installing surface temperature and pressure sensors at existing GPS receiver sites will allow the network to map out the horizontal distribution of vertically integrated water vapor (IWV)
• Energy industry (electricity distribution) benefits because GPS receivers are used by Space Weather Center to monitor geomagnetic storms
Tier 1: GPS receivers of opportunity
As of 1/11/08:

As of Dec 2011:84% complete

Upper Amer. Riv. basin with the glacial outwash/alluvium soil type has a much more rapid dry down and reduced storage capacity as compared to the lower basin with the clay/loam soil type. This suggests the need to monitor both altitude ranges in order to characterize soil moisture throughout the full basin.

As of Dec 2011:25% complete

HMT Snow Level Research Results
NWS RFSSnow-17SAC-SMA
White et al.JTech, 2002
0
5
10
15
20
25
30
35
40
45
50
55
60
# o
f Re
spon
ses
aviation flowpatterns
fronts m arineinversion
low-levelje ts
ra infa llin tensity
orographicprecip.
snowlevel
terra inim pacts
tem per-ature
troughs
Winters 2002-2003:West Coast WFO, RFC usage of wind profiler data products
24-h QPF = 4 in.
White et al. 2002J Tech
Percentage of basin area below melting level
-3.5 -3.0 -2.5 -2.0 -1.5 -1.0 -0.5 0.0 0.5 1.0 1.5 2.0 2.5 3.0 3.5
Forecast Freezing Level - Radar-Derived Freezing Level (Thousands of Feet)
0
20
40
60
80
100
Number of Occurrences
A lta
C azadero
Forecast Lower than Observations
Forecast Higherthan Observations
4000
6000
8000
10000
12000
Observed Freezing Level (Feet MSL)
00 - 24 H our (D ay 1)
30 - 48 H our (D ay 2)
54 - 66 H our (D ay 3)
-3000 -2000 -1000 0 1000 2000 3000
Forecast Freezing Level - Radar-Derived Freezing Level (Feet)
4000
6000
8000
10000
12000
00 - 24 H our (D ay 1)
30 - 48 H our (D ay 2)
54 - 66 H our (D ay 3)
Alta
Cazadero
White et al. 2010JHM

Snow level
Tier 1: Snow level radars
Provides proxy snow-level height during precipitation events
Utilizes proven FMCW technology to substantially lower cost
Uses the patented ESRL automated snow-level detection algorithm proven in nationwide field experiments
Less than 8’ diameter footprint Low-power requiring minimal
infrastructurePhoto by P. Johnston
Colfax, CAElev. 636 m
SLR developers P. Johnston, D. Costa, and D. Carter win 2011 CIRES Engineering and Science Award

As of Jan 2012:60% complete

From top to bottom (North to South):
Happy Camp (HCP)41.79 N, 123.39 W, 366 m
Shasta Dam (STD)40.72 N, 122.43 W, 183 m
Oroville (OVL)
39.53 N, 121.42 W, 114 m
Colfax (CFF) 39.08 N, 120.94 W, 644 m
New Exchequer (NER) 37.60 N, 120.28 W, 274 m
Pine Flat Dam (PFD)36.83 N, 119.31 W, 184 m

Rain >10 mm/h:>12.5 m/s; >2 cm
Atmospheric river quadrant:Strongest IWV fluxes yieldheaviest rains
Hourly 850-1150 m upslope flow from BBY (m s-1)
Hou
rly G
PS
IW
V f
rom
BB
Y (
cm)

Atmospheric River (AR) Observatory: Russian River PrototypeObjectives: Monitor key AR and precipitation characteristics.
Observing systems:1. Wind profiler/RASS2. S-band radar3. Disdrometer4. Surface met5. GPS-IWV6. Rain gauges
-123.8 -123.6 -123.4 -123.2 -123.0 -122.8
38.4
38.6
38.8
39.0
PacificOcean
M E N D O C I N O
S O N O M A
L A K E
0 10 20 km
Cazadero (475 m)
50
100
150
200
300
400
500
600
800
1000
1200
1400
1600
Elev. (m)
Bodega Bay (12 m)
W ind profiler/RASSS-band precip profilerGPS IW VSfc. met. + rain gaugeRaindrop disdrometer
1. 2., 3.
5.
4.
6.
Tier 2: Atmospheric River Observatory
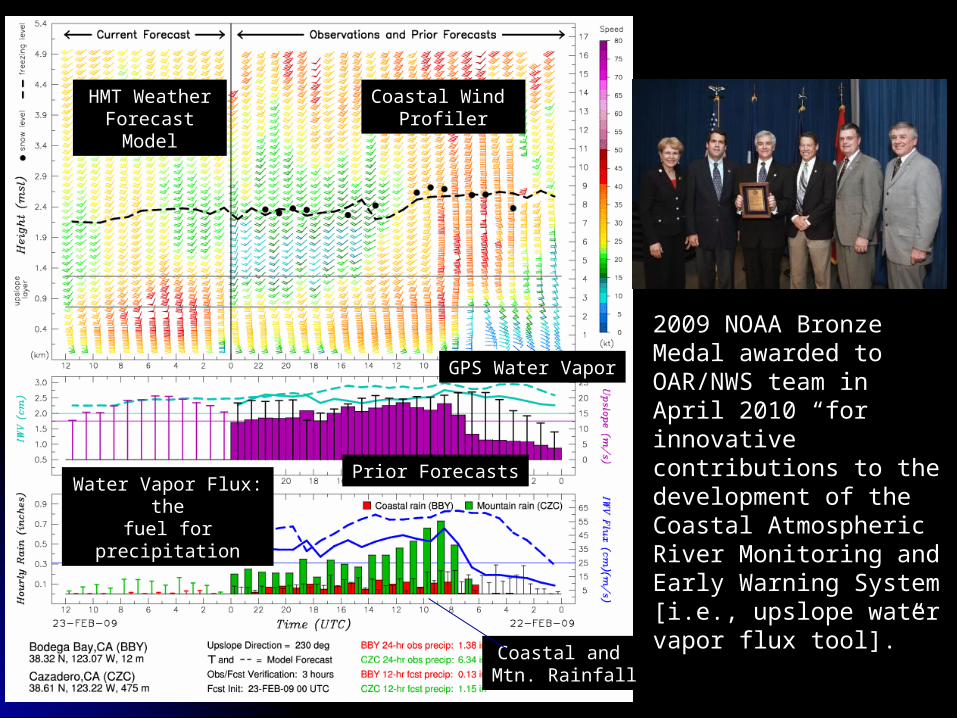
HMT Weather Forecast Model
Coastal Wind Profiler
Prior Forecasts
GPS Water Vapor
Coastal and Mtn. Rainfall
Water Vapor Flux: thefuel for precipitation
2009 NOAA Bronze Medal awarded to OAR/NWS team in April 2010 “for innovative contributions to the development of the Coastal Atmospheric River Monitoring and Early Warning System [i.e., upslope water vapor flux tool].”

14
Eureka
Bodega Bay
Pt. Sur
GoletaAs of Now:
Construction in Progress

Time of max. IWV flux at BBY: 1500 UTC 4-Jan-084 Jan 2008, 1500 UTC
Time (UTC)
CZD rain: 264mmBBY rain: 36mm
4 Jan 2008, 2100 UTC Time of max. IWV flux at PPB: 2100 UTC 4-Jan-08
Time (UTC)
TPK rain: 320mmPPB rain: 75mm
5 Jan 2008, 0300 UTC
Time of max. IWV flux at GLA: 0300 UTC 5-Jan-08
Time (UTC)
SMC rain: 230mmGLA rain: 51mm
AR Propagation: ~12 m s-1.½-day lead time for SoCal
Max. IWV flux in AR highly correlated withmax. mountain rainfall at each site
Ratio: 7.3:1
Ratio: 4.3:1
Ratio: 4.5:1

16
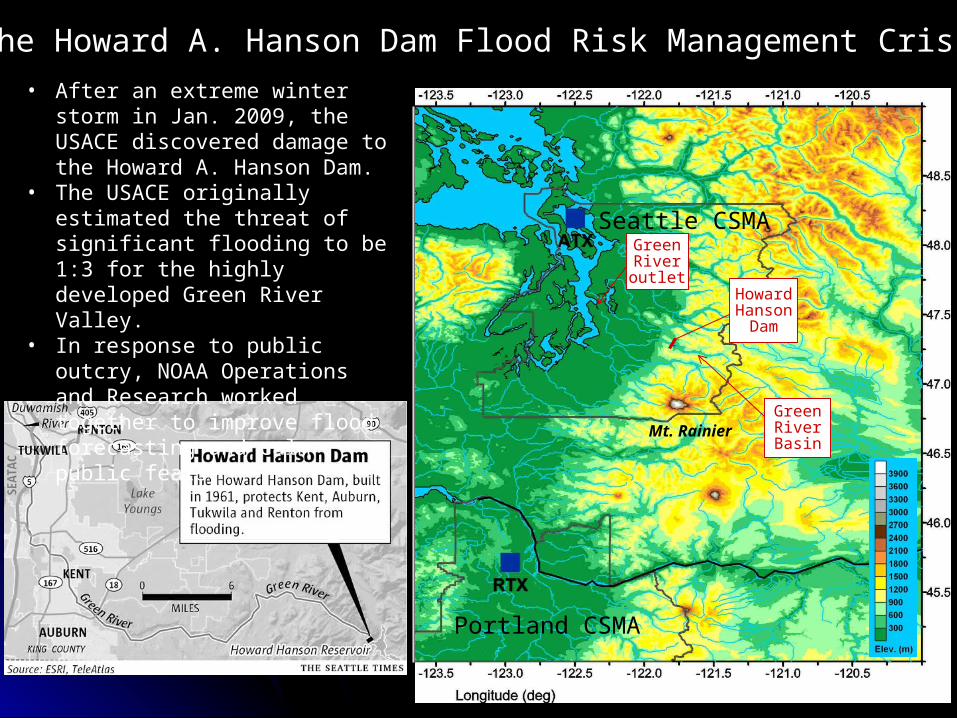
HowardHanson
Dam
GreenRiverBasin
GreenRiveroutlet
Seattle CSMA
Portland CSMA
Mt. Rainier
• After an extreme winter storm in Jan. 2009, the USACE discovered damage to the Howard A. Hanson Dam.
• The USACE originally estimated the threat of significant flooding to be 1:3 for the highly developed Green River Valley.
• In response to public outcry, NOAA Operations and Research worked together to improve flood forecasting and calm public fears.
The Howard A. Hanson Dam Flood Risk Management Crisis

News Article from “The Seattle Times” 27 August 2009Flood threat may cost King County millions
King County Executive Kurt Triplett will ask the County Council for $10 million to $35 million to protect and possibly evacuate jail inmates, courts, animal shelter and county offices in the face of floods in the Green River Valley that could be caused by water releases from the damaged Howard Hanson Dam.
By Keith ErvinSeattle Times staff reporter
JOHN LOK / THE SEATTLE TIMESThe King County Regional Justice Center in Kent. RelatedGreen River floodingFor more information about the risk of flooding in the Green River Valley, go to www.kingcounty.gov/floodplans King County may have to spend millions of dollars to keep its South King County jail, courts, animal shelter, elections and permitting offices open in the face of potentially catastrophic
flooding of the Green River this winter, the County Council learned Wednesday.The stakes are even higher for the thousands of businesses and residents who face $2 billion to $3 billion in property damage if the river floods because of problems at the Howard
Hanson Dam, Assistant County Executive Pam Bissonnette said in a briefing before the Metropolitan King County Council.The damage estimate for the state's largest warehouse district comes from a draft report prepared by the Federal Emergency Management Agency (FEMA), Bissonnette said.She said the Army Corps of Engineers, which owns and operates the Howard Hanson Dam, has also said it may take three to five years to fix the problem of water seeping through a
hillside dam abutment. That solution — most likely a concrete cutoff wall — would cost hundreds of millions of dollars, she said.County Executive Kurt Triplett will present a plan to the council in two weeks for protecting county property, along with a funding request — now estimated at $10 million to $35 million
— to protect county operations from possible flooding of parts of Kent, Renton, Auburn and Tukwila, Bissonnette said.County facilities at risk, include:• King County Elections headquarters, opened at the end of 2007 in a $20 million building on Southwest Grady Way in Renton, could be flooded by up to 10 feet of water, Bissonnette
said. It might be necessary to relocate the headquarters before flood season to avoid possibly disrupting the November election, she said.• The Maleng Regional Justice Center in Kent, opened in 1997, which holds 800 prisoners in its jail and has courtrooms for 19 Superior Court judges and commissioners, could by
flooded by up to 4 feet of water;• The Department of Development and Environmental Services, which issues building and land-use permits, could receive up to 7 feet of water at its building on Oakesdale Avenue in
Renton;• The county's main animal shelter in Kent, up to 3 feet of water; and• Aukeen District Court in Kent, up to a foot of water.County officials are studying options for maintaining services at the at-risk buildings. Options include placing protective barriers around buildings and evacuating employees, jail
inmates and shelter animals. Some offices, including the 1-½-year-old election headquarters in Renton, could be permanently moved to new locations.Some of those costs could be reimbursed by the federal government. Acting Budget Director Beth Goldberg said it wasn't yet clear how flood preparations would affect the already
troubled 2010 and 2011 budgets."We're really in an unprecedented, uncharted situation," she said. "We're getting new information all the time."The council's Committee of the Whole sent to the full council without recommendation Triplett's request for authority to declare an emergency in advance of a flood so the county could
avoid the red tape of standard procurement procedures.The corps is now installing an underground "grout curtain" intended to slow water seepage. Until that seepage is controlled, the corps is restricting the amount of water that will be held
behind the dam. That means more water may be released into the river during storms, resulting in "bigger and more frequent" flooding, Bissonnette said.The valley hasn't had a major flood — once common in the valley — since the dam began operating in 1962.Several County Council members urged Triplett's office Wednesday to organize a door-to-door campaign to reach all 20,000 valley residents of the flood danger. Council members were
also unhappy about how long it will take the federal government to fix the problem at the dam."If we eventually have a flood that does 2 or 3 billion dollars damage and displaces the entire valley, I think we need to respectfully challenge the federal government to explain why they
will take so long to come up with a permanent fix," Councilmember Julia Patterson of SeaTac said.Bissonnette said the corps is working "very hard" to solve the problem. Because of the complexity of the seepage problem, she said, "it takes a while to do the studies to make sure you
don't make a mistake."Keith Ervin: 206-464-2105 or [email protected] © The Seattle Times Company
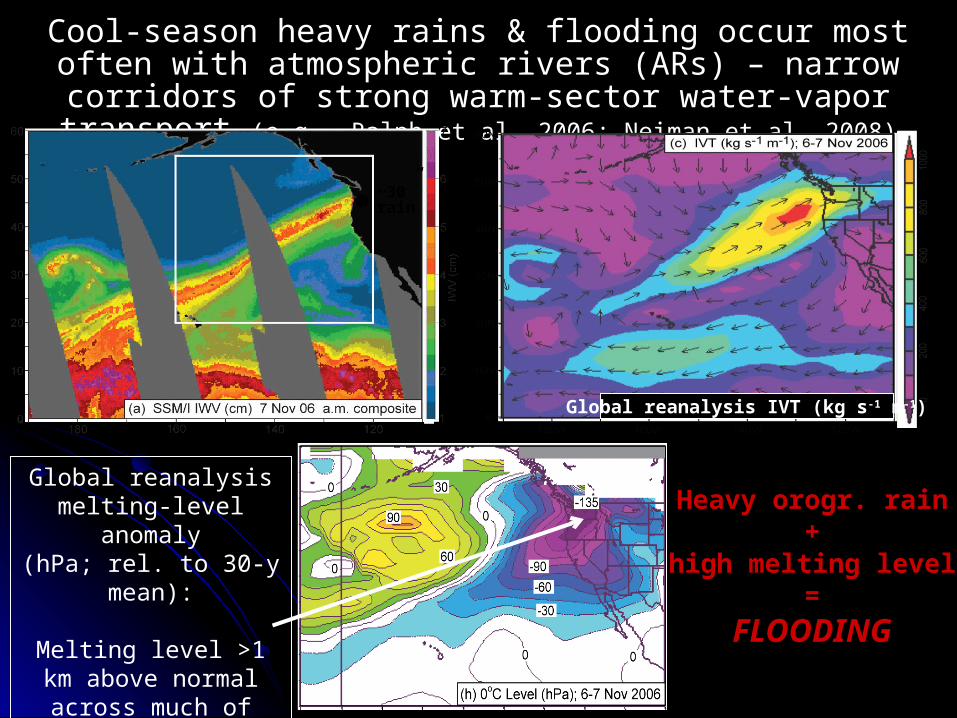
Cool-season heavy rains & flooding occur most often with atmospheric rivers (ARs) – narrow corridors of strong warm-
sector water-vapor transport (e.g., Ralph et al. 2006; Neiman et al. 2008)
~30”rain
Global reanalysis IVT (kg s-1 m-1)
Heavy orogr. rain+
high melting level=
FLOODING
Global reanalysis melting-level anomaly
(hPa; rel. to 30-y mean):
Melting level >1 km above normal across
much of PacNW during AR landfall.

How NOAA Responded to the HHD Crisis
1) Participation in focus groups on warning and notification; elected officials policy planning; and public outreach, education, and awareness (NWS/Seattle WFO).
2) Participation in public outreach effort including numerous presentations at trade shows, meetings with local decision makers, as well as local and regional workshops (NWS/Seattle WFO).
3) Enhancements to the existing weather and precipitation reporting network critical to Green River forecasts (e.g., 14 new rain gauges made available via real-time comms and/or new sites; NWS/OHD, NWS Western Region).
4) Snow level measurements critical to hydrologic forecasting at four sites upstream of and in the Green River Basin (OAR/PSD).
5) Two AR observatories to monitor the forcings associated with precipitation caused by landfalling ARs, including an observation/model based AR water vapor flux tool (OAR/PSD).
6) Extended seven-day quantitative precipitation forecasts (QPFs) for the Pacific Northwest (NWS/HPC).
7) Probabilistic QPFs for 6-h and 24-h accumulation thresholds (NWS/HPC).

How NOAA Responded to the HHD Crisis (cont’d)
8) High-resolution, rapid-refresh, ensemble numerical weather prediction forecasts (OAR/GSD )
9) NWS forecaster and stakeholder training (NWS-Seattle WFO, -Monterey WFO, OAR/PSD ).
10) Twice-daily Macro Level Alert Forecasts targeting the three- to five-day period and with respect to predetermined thresholds of precipitation that correlate with critical inflows into the dam (NWS-Seattle WFO, NWRFC).
11) A new discussion section to the Area Forecast Discussion (AFD) dedicated to hydrology and potential flood situations (updated four times per day; NWS-Seattle WFO, NWRFC).
12) A web portal to provide easy access to key information and new products (NWS/Seattle WFO).
13) Feedback on NWS operational forecasts and services and use of AR Observatories in daily forecast operations (NWS/Seattle WFO, OAR/PSD).
14) A BAMS article summarizing NOAA’s rapid response to this important flood risk management crisis published in Feb. 2012 (All; led by OAR/PSD).

Feedback on NOAA’s Response
Jim Mullen, the Washington State Director of Emergency Management, praised the NWS and OAR for “providing maximum service that they could to local and state government response personnel and decision makers.”
Dr. Dennis Hunsinger, Acting Regional Administrator of FEMA, summed up the overall effort: “This work represents the very best of what can happen when we all work together collaboratively with our partners.”
Dr. Jane Lubchenco, Under Secretary of the U.S. Dept. of Commerce for Oceans and Atmosphere and Administrator of NOAA, has chosen to award the NOAA team that responded to the Howard A. Hanson Dam crisis with the 2011 NOAA Bronze Medal.
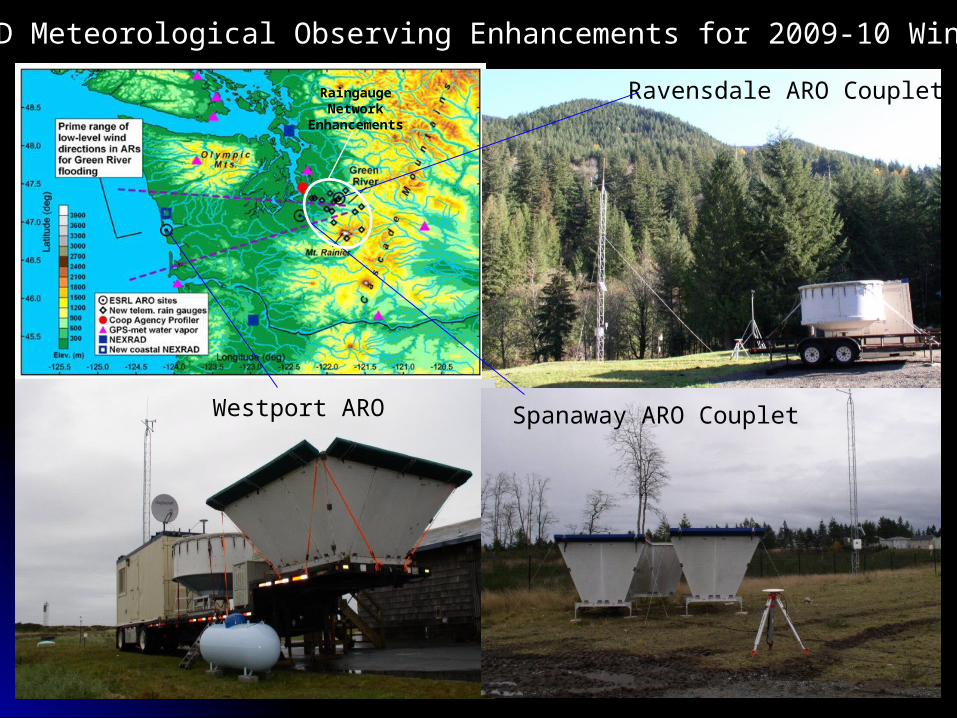
Westport ARO Spanaway ARO Couplet
Ravensdale ARO Couplet
HHD Meteorological Observing Enhancements for 2009-10 Winter
RaingaugeNetwork
Enhancements

Analysis showing how the AR Observatory data and products were used by Seattle WFO forecasters both in terms of the meteorological application (left) as well as timing and number of products accessed with respect to major precipitation events (right).
Usage of AR Observatories in Forecast Operations

340 PM PST FRI JAN 8 2010: THE AIR MASS IN GENERAL REMAINS WARM WITH ATMOSPHERIC RIVER OBSERVATORY DATA SHOWING THE SNOW LEVEL STILL UP AROUND 7500 FEET THIS AFTERNOON.
400 PM PST FRI JAN 1 2010: ATMOSPHERIC RIVER PROFILER OBS FROM WESTPORT AND SPANAWAY ARE SHOWING LOW LEVEL FLOW SW AROUND 40 KT WHICH FITS WELL WITH THE MODELS.
300 AM PST WED DEC 23 2009: THE LAYER IS NOT VERY THICK WITH THE TOPS ON THE ARO PROFILER AT WESTPORT AROUND 2000 FEET ABOVE THE BASES WITH THE CLOUD DECK THINNING THE CLOSER ONE GETS TO THE CASCADES.
340 AM PDT MON MAR 29 2010: AND THE ATMOSPHERIC RIVER OBS AT WESTPORT SUPPORT THE POTENTIAL FLOOD PROBLEM FOR THE SKOKOMISH RIVER. PROFILER IS SHOWING S WINDS NEAR 65 KT IN THE SWEET SPOT BETWEEN 2500 AND 4000 FEET.
912 AM PST SUN JAN 3 2010: HANDY ATMOSPHERIC RIVER OBSERVATORY UPWARD PROFILING RADAR AT RAVENSDALE SHOWS A NICE VIRGA SIGNATURE COMING DOWN TO ABOUT 11000 FEET WHICH FITS THE SEA-TAC OB.
Sample Excerpts from NWS Forecast Office Official AFDs
# of times an ARO data product was viewed on one of ESRL/PSD’s real-time
data Web pages1
# of citations in Area Forecast Discussions that quoted an ARO data
product
3,541 59
1During Nov. 24 – Dec. 23, 2009 and Jan. 1 – Apr. 8, 2010.

Internal Feedback from Seattle WFO and ESRL/PSD Staff

Contributions from 7 different NWS Offices, ESRL/PSD, ESLR/GSD, CIRA, and the US Army Corps of Engineers
Lawrence J. Schick, Meteorologist, USACE, Seattle District
Re: Jan 2010 AR event in Western WA: “We were right on the edge of taking over Wynoochee Dam today for flood control, but we had high confidence we didn’t need to with the AR Observatory info that the rain would taper off quickly – and it did.”
Re: Jan 2012 storms in Western WA: “Yesterday, I used the new coastal radar and ARO in tandem to refine the forecast and give our dam regulator engineers critical forecast information… Of course, I was monitoring local WFO Seattle NWS forecasts and NWRFC as well and they were right on, but the ARO does allow a strong confirmation for making these rapidly changing but important dam operational decisions.”
“One NOAA” Working Together with Partners to Benefit Society

T h a n k Y o u !