$9,750,000 west chester area school district statements...will be passed upon for the school...
TRANSCRIPT
RATING: Moody’s: “Aaa (Stable Outlook)” (Underlying)(See “RATING” herein)
NEW ISSUE—BOOK-ENTRY ONLY
$9,750,000West Chester Area School District(Chester and Delaware Counties, Pennsylvania)
General Obligation Bonds, Series A of 2017
Principal Due: May 15, as shown on inside coverFirst Interest Payment: May 15, 2018
Bonds Dated: Date of DeliveryInterest Due: May 15 and November 15
The bonds described herein will be issued in the aggregate principal amount of $9,750,000 and will be designated as the General Obligation Bonds, Series A of 2017 (the “Bonds”). The Bonds will be issued in denominations of $5,000 and integral multiples thereof, and will be registered in the name of Cede & Co., as the owner and nominee of The Depository Trust Company (“DTC”), New York, New York, under its book-entry only system maintained through its brokers and dealers who are, or act through, DTC Participants. The purchasers of the Bonds will not receive physical delivery of the Bonds. A purchaser of the Bonds must maintain an account with a broker or a dealer who is, or acts through, a DTC Participant to receive payment of principal of and interest on the Bonds. See “BOOK-ENTRY ONLY SYSTEM” herein. If, under the circumstances described herein, Bonds are ever issued in certificated form, such Bonds will be subject to registration or transfer, exchange and payment as described herein. The principal of any certificated Bonds will be paid to the registered owners or assigns, when due, upon presentation and surrender of such Bonds to Manufacturers and Traders Trust Company (the “Paying Agent”), acting as paying agent, registrar and sinking fund depository, at its designated corporate trust office. Interest on the Bonds is payable initially on May 15, 2018 and thereafter semiannually on May 15 and November 15 of each year, until the principal sum thereof is paid. DTC Participants and Indirect Participants will be responsible for remitting interest and principal payments to Beneficial Owners of the Bonds.
The Bonds are general obligations of the West Chester Area School District, a public school district located in portions of Chester and Delaware Counties, Pennsylvania (the “School District”), payable from its tax and other general revenues. The School District has covenanted that it will provide in its budget in each year, and will appropriate from its general revenues in each such year, the amount of the debt service due on the Bonds for such year and will duly and punctually pay or cause to be paid from the sinking fund established under the Resolution (herein defined) or any other of its revenues or funds the principal of every Bond and the interest thereon on the dates, at the place and in the manner stated in the Bonds, and for such budgeting, appropriation and payment the School District has irrevocably pledged its full faith, credit and taxing power, which taxing power presently includes the power to levy an annual ad valorem tax on all taxable real property within the School District, within the limits provided by law. (See “THE BONDS” – “Security” and “TAXING POWERS OF THE SCHOOL DISTRICT” infra).
The Bonds are subject to optional redemption prior to maturity as described herein.
Proceeds of the Bonds will be used to pay the costs of planning, designing, acquiring, constructing, furnishing and equipping additions and improvements to the School District’s existing elementary schools and, to the extent of remaining funds, other buildings and facilities of the School District, and pay the costs of issuing the Bonds.
The Bonds are an authorized investment for fiduciaries in the Commonwealth of Pennsylvania pursuant to the Pennsylvania Probate, Estate and Fiduciaries Code, Act of June 30, 1972, No. 164, P.L. 508, as amended and supplemented.
MATURITIES, AMOUNTS, RATES, YIELDS/PRICES AND CUSIPS [As Shown on Inside Front Cover]
The Bonds are offered when, as and if issued, subject to withdrawal or modification of the offer without notice, and subject to the approving legal opinion of Rhoads & Sinon LLP, Harrisburg, Pennsylvania, Bond Counsel to the School District, to be furnished upon delivery of the Bonds. Certain other legal matters will be passed upon for the School District by Unruh, Turner, Burke & Frees, P.C., West Chester, Pennsylvania, School District Solicitor. PFM Financial Advisors LLC, Harrisburg, Pennsylvania, will serve as the School District’s Financial Advisor in connection with the issuance of the Bonds. It is expected that the Bonds will be available for delivery through DTC, on or about December 5, 2017.
In the opinion of Bond Counsel, under existing statutes, regulations, and judicial decisions, interest on the Bonds is excluded from gross income for purposes of federal income taxation and is not an item of tax preference for purposes of the federal alternative minimum tax imposed on individuals and corporations, although in the case of corporations (as defined for federal income tax purposes) such interest is taken into account in determining adjusted current earnings for purposes of such alternative minimum tax. This opinion of Bond Counsel is subject to continuing compliance by the School District with its covenants in the Resolution and other documents to comply with requirements of the Internal Revenue Code of 1986, as amended, and applicable regulations thereunder (herein defined).
Bond Counsel is also of the opinion that under the laws of the Commonwealth of Pennsylvania (the “Commonwealth”) as presently enacted and construed, the Bonds are exempt from personal property taxes in the Commonwealth and the interest on the Bonds is exempt from the Commonwealth’s Personal Income Tax and the Commonwealth’s Corporate Net Income Tax.
The Bonds are “qualified tax-exempt obligations”, for purposes and effect contemplated by Section 265 of the Internal Revenue Code of 1986, as amended (relating to expenses and interest relating to tax-exempt income of certain financial institutions).
For further information concerning federal and state tax matters relating to the Bonds, see “Tax Exemption and Other Tax Matters” herein.
Dated: November 1, 2017
PNC CAPITAL MARKETS LLC

i
$9,750,000
West Chester Area School District (Chester and Delaware Counties, Pennsylvania)
General Obligation Bonds, Series A of 2017
Bonds Dated: Date of Delivery Principal Due: May 15 (as shown below) Interest Due: May 15 and November 15 First Interest Payment: May 15, 2018 Denomination: Integral multiples of $5,000 Form: DTC Book-Entry Only
BOND MATURITY SCHEDULE:
Maturity Date
(May 15) Principal Interest Initial Offering Initial Offering
Year Amounts Rates Yields Prices CUSIP(1)
2029 $2,340,000 2.250% 2.350% 99.000% 9520302W3
2030 2,395,000 2.500% 2.450%* 100.252% 9520302X1
$25,000 1.750% Term Bond Due May 15, 2023 to Yield 1.750% at a Price of 100.000%. CUSIP 9520302Q6 $25,000 2.250% Term Bond Due May 15, 2028 to Yield 2.250% at a Price of 100.000%. CUSIP 9520302V5
$4,965,000 2.500% Term Bond Due May 15, 2032 to Yield 2.500% at a Price of 100.000%. CUSIP 9520302Z6
* Yield shown is to first Optional Redemption date of May 15, 2023.
(1)The above CUSIP (Committee on Uniform Securities Identification Procedures) numbers have been assigned by an organization not affiliated with the School District or the Underwriter, and such parties are not responsible for the selection or use of the CUSIP numbers. The CUSIP numbers are included solely for the convenience of bondholders and no representation is made as to the correctness of such CUSIP numbers. CUSIP numbers assigned to securities may be changed during the term of such securities based on a number of factors including, but not limited to, the refunding or defeasance of such issue or the use of secondary market financial products. Neither the School District nor the Underwriter has agreed to, and there is no duty or obligation to, update this Official Statement to reflect any change or correction in the CUSIP numbers set forth above.
ii
WEST CHESTER AREA SCHOOL DISTRICT (Chester and Delaware Counties, Pennsylvania)
BOARD OF SCHOOL DIRECTORS
Chris McCune President
Sue Tiernan Vice President
Gary Bevilacqua Member
Joyce Chester Member
Karen Herrmann Member
Robin Kaliner Member
Kate Shaw Member
Dr. Ricky Swalm Member
M. Christopher Tabakin Member
Linda Cherashore Secretary*
Carol DeLuca Assistant Secretary*
John T. Scully Treasurer*
*Non-Voting Member
SUPERINTENDENT DR. JAMES R. SCANLON
DIRECTOR OF BUSINESS AFFAIRS JOHN T. SCULLY
SCHOOL DISTRICT SOLICITOR UNRUH, TURNER, BURKE & FREES, P.C.
West Chester, Pennsylvania
BOND COUNSEL RHOADS & SINON LLP Harrisburg, Pennsylvania
FINANCIAL ADVISOR PFM FINANCIAL ADVISORS LLC
Harrisburg, Pennsylvania
UNDERWRITER PNC CAPITAL MARKETS LLC
Philadelphia, Pennsylvania
PAYING AGENT MANUFACTURERS AND TRADERS TRUST COMPANY
Buffalo, New York and Harrisburg, Pennsylvania
SCHOOL DISTRICT ADDRESS 782 Springdale Drive Exton, Pennsylvania
No dealer, broker, salesman or other person has been authorized by the School District to give information or to make any representations, other than those contained in this Official Statement, and if given or made, such other information or representations must not be relied upon. This Official Statement does not constitute an offer to sell or the solicitation of an offer to buy, nor shall there be any sale of the Bonds in any jurisdiction in which it is unlawful to make such offer, solicitation or sale. The information set forth herein has been obtained from the School District and from other sources which are believed to be reliable but the School District does not guarantee the accuracy or completeness of information from sources other than the School District. The information and expressions of opinion herein are subject to change without notice and neither the delivery of this Official Statement nor any sale made hereunder shall, under any circumstances, create any implication that there has been no change in any of the information set forth herein since the date hereof.
TABLE OF CONTENTS
Page Page
INTRODUCTION .............................................................. 1 PURPOSE OF THE ISSUE ................................................ 1
Sources and Uses of Bond Proceeds ........................... 1 THE BONDS ....................................................................... 2
Description .................................................................. 2 Payment of Principal and Interest ............................... 2 Transfer, Exchange and Registration of Bonds ........... 3 Security ....................................................................... 3 Commonwealth Enforcement of Debt Service Payments ..................................................................... 3 Pennsylvania Budget Adoption ................................... 4 Act 85 of 2016 ............................................................ 4 Sinking Fund ............................................................... 5
BOOK-ENTRY ONLY SYSTEM ..................................... 5 REDEMPTION OF BONDS .............................................. 7
Optional Redemption .................................................. 7 Mandatory Redemption ............................................... 7 Notice of Redemption ................................................. 7 Manner of Redemption ............................................... 8
THE SCHOOL DISTRICT ................................................ 8 Introduction ................................................................. 8 Administration ............................................................ 8 School District Facilities ............................................. 9 Enrollment Trends ...................................................... 9
SCHOOL DISTRICT FINANCES .................................... 10 Introduction ................................................................. 10 Financial Reporting ..................................................... 10 Budgeting Process as modified by Act 1 of 2006 (Taxpayer Relief Act) ................................................. 10 Summary and Discussion of Financial Results ........... 12 General Fund Revenue ................................................ 13 General Fund Expenditures ......................................... 14
TAXING POWERS OF THE SCHOOL DISTRICT ....... 15 In General ................................................................... 15 The Taxpayer Relief Act (Act 1)................................. 15 Status of the Bonds Under Act 1 ................................. 16 Legislation Limiting Unreserved Fund Balances ........ 16 Tax Levy Trends ......................................................... 17 Real Property Tax ....................................................... 18 Other Taxes ................................................................. 19
DEBT AND DEBT LIMITS ............................................... 20 Commonwealth Aid to School Districts ...................... 20 Current Lack of State Appropriations for Debt Service Subsidies ........................................................ 20 Debt Statement ............................................................ 21 Debt Limit and Remaining Borrowing Capacity ......... 23 Debt Service Requirements ......................................... 24 Future Financing ......................................................... 24
LABOR RELATIONS ........................................................25 School District Employees ..........................................25 Pension Program ..........................................................25 Other Post-Employment Benefits (“OPEB”) ...............26 OPEB Funding Policy .................................................26 OPEB Funding Progress ..............................................26 OPEB Actuarial Methods and Assumptions ................26 Annual OPEB Cost and Net OPEB Obligations ..........27
LITIGATION ......................................................................27 DEFAULTS AND REMEDIES ..........................................27 TAX EXEMPTION AND OTHER TAX MATTERS .......27
Bond Counsel Opinion ................................................27 Federal Income Tax Matters ........................................27 Changes in Federal Tax Laws ......................................28 Pennsylvania Tax Matters ............................................28 Federal Income Tax Interest Expense Deductions for Financial Institutions ..............................................29
CONTINUING DISCLOSURE UNDERTAKING ...........29 Future Continuing Disclosure Compliance ..................30
RATING ..............................................................................31 UNDERWRITING ..............................................................31 LEGAL OPINIONS ............................................................31 FINANCIAL ADVISOR .....................................................31 MISCELLANEOUS ............................................................31 APPENDIX A DEMOGRAPHIC AND ECONOMIC INFORMATION RELATING TO THE WEST CHESTER AREA SCHOOL
DISTRICT Introduction .................................................................A-1 Employment ................................................................A-2 Income .........................................................................A-4 Commercial Activity ...................................................A-4 Housing .......................................................................A-4 Educational Institutions ...............................................A-4 Medical Facilities ........................................................A-5 Transportation ..............................................................A-5 Recreation ....................................................................A-5 Utilities ........................................................................A-5 Municipal Services ......................................................A-5
APPENDIX B Form of Opinion of Bond Counsel ..............................B-1
APPENDIX C Form of Continuing Disclosure Certificate ..................C-1
APPENDIX D Financial Statements - West Chester Area School District - June 30, 2016 ................................................D-1

1
OFFICIAL STATEMENT
$9,750,000 West Chester Area School District (Chester and Delaware Counties, Pennsylvania)
General Obligation Bonds, Series A of 2017
INTRODUCTION
This Official Statement, including the cover page and inside cover page hereof, and Appendices hereto, is furnished by the West Chester Area School District, a public school district that consists of portions of Chester and Delaware Counties, Pennsylvania (the “School District”), in connection with the offering of $9,750,000 aggregate principal amount, of its General Obligation Bonds, Series A of 2017 (the “Bonds”). The Bonds are being issued pursuant to, and are secured by, a Resolution of the Board of School Directors of the School District adopted on October 23, 2017 (the “Resolution”), and in accordance with the Local Government Unit Debt Act, 53 Pa. C.S. Chs. 80-82 (the “Debt Act”), of the Commonwealth of Pennsylvania (the “Commonwealth” or “State”).
PURPOSE OF THE ISSUE Proceeds of the Bonds will be used to pay the costs of planning, designing, acquiring, constructing, furnishing and equipping additions and improvements to the School District’s existing elementary schools and, to the extent of remaining funds, other buildings and facilities of the School District, and pay the costs of issuing the Bonds. Sources and Uses of Bond Proceeds
The following is a summary of the sources and uses of the proceeds from the issuance of the Bonds.
Sources of Funds: Total
Bond Proceeds $9,750,000.00
Less: Net Original Issue Discount (17,364.60)
Total $9,732,635.40
Uses of Funds:
Construction Fund Deposit $9,583,273.40
Costs of Issuance (1) 149,362.00
Total $9,732,635.40
(1) Includes legal, financial advisor, printing, rating, total bond discount, CUSIP, paying agent, and miscellaneous costs.
2
THE BONDS Description
The Bonds will be issued in fully registered form in denominations of $5,000 principal amount and integral multiples thereof, in the aggregate principal amount of $9,750,000. The Bonds will be dated as of the date of the original issuance and delivery thereof (the “Date of Delivery”), and will bear interest at the rates and mature in the amounts and on the dates set forth on the inside front cover of this Official Statement. Interest on each of the Bonds will be payable initially on May 15, 2018, and, thereafter, semiannually on May 15 and November 15 of each year until the maturity date of such Bond or, if such Bond is redeemable and is called for redemption prior to maturity, until the date fixed for redemption thereof, if payment of the redemption price has been duly made or provided for.
When issued, the Bonds will be registered in the name of Cede & Co., as nominee for The Depository Trust Company (“DTC”), New York, New York. Purchasers of the Bonds (the “Beneficial Owners”) will not receive any physical delivery of Bond certificates, and beneficial ownership of the Bonds will be evidenced only by book entries. See “BOOK – ENTRY ONLY SYSTEM” herein. Payment of Principal and Interest
So long as Cede & Co., as nominee of DTC, is the registered owner of the Bonds, payments of principal of, redemption premium, if any, and interest on the Bonds, when due, are to be made to DTC, and all such payments shall be valid and effective to satisfy fully and to discharge the obligations of the School District with respect to, and to the extent of, principal, redemption premium, if any, and interest so paid. If the use of the Book-Entry Only System for the Bonds is discontinued for any reason, bond certificates will be issued and payment of principal, redemption premium, if any, and interest on the Bonds shall be made as described in the following paragraphs:
The principal of any certificated Bonds, when due upon maturity or upon any earlier redemption, will be paid to the registered owners of the Bonds, or registered assigns, upon surrender of such Bonds to Manufacturers and Traders Trust Company (the “Paying Agent”), acting as paying agent and sinking fund depositary for the Bonds, at its designated corporate trust offices (or to any successor paying agent at its designated office(s)).
Interest on any certificated Bonds will be payable to the registered owner of such Bond from the interest payment date next preceding the date of registration and authentication of such Bond, unless: (a) such Bond is registered and authenticated as of an interest payment date, in which event such Bond shall bear interest from said interest payment date, or (b) such Bond is registered and authenticated after a Record Date (hereinafter defined) and before the next succeeding interest payment date, in which event such Bond shall bear interest from such interest payment date, or (c) such Bond is registered and authenticated on or prior to the Record Date preceding May 15, 2018, in which event such Bond shall bear interest from the Date of Delivery, or (d) as shown by the records of the Paying Agent, interest on such Bond shall be in default, in which event such Bond shall bear interest from the date to which interest was last paid on such Bond. Interest on a certificated Bond will be payable by check drawn on the Paying Agent, which shall be mailed to the registered owner whose name and address shall appear, at the close of business on the fifteenth (15th) day (whether or not a day on which the Paying Agent is open for business) next preceding each interest payment date (the “Record Date”), on the registration books maintained by the Paying Agent, irrespective of any transfer or exchange of each Bond subsequent to such Record Date and prior to such interest payment date, unless the School District shall be in default in payment of interest due on such interest payment date. In the event of any such default, such defaulted interest shall be payable to the person in whose name the certificated Bond is registered at the close of business on a special record date for the payment of such defaulted interest established by notice mailed by the Paying Agent to the registered owner of such Bond not less than fifteen (15) days preceding such special record date. Such notice shall be mailed to the person in whose name such Bond is registered at the close of business on the fifth (5th) day preceding the date of mailing.
If the date for payment of the principal of or interest on any Bonds shall be a Saturday, Sunday, legal holiday or a day on which banking institutions in the Commonwealth are authorized or required by law or executive order to close, then the date for payment of such principal or interest shall be the next succeeding day which is not a Saturday, Sunday, legal holiday or a day on which such banking institutions are authorized or required to close, and payment on such date shall have the same force and effect as if made on the nominal date established for such payment.

3
Transfer, Exchange and Registration of Bonds
Subject to the provisions described below under “Book-Entry Only System,” a certificated Bond is transferable or exchangeable by the registered owner, thereof upon surrender of such Bond to the Paying Agent, accompanied by a written instrument or instruments in form, with instructions, and with guaranty of signature satisfactory to the Paying Agent, duly executed by the registered owner of such Bond or his attorney-in-fact or legal representative. The Paying Agent shall enter any transfer of ownership of certificated Bonds in the registration books and shall authenticate and deliver at the earliest practicable time in the name of the transferee or transferees a new fully registered Bond or Bonds of authorized denominations of the same maturity and interest rate for the aggregate principal amount which the registered owner is entitled to receive. The School District and the Paying Agent may deem and treat the registered owner of any Bond as the absolute owner thereof (whether or not such Bond shall be overdue) for the purpose of receiving payment of or on account of principal and interest and for all other purposes, and the School District and the Paying Agent shall not be affected by any notice to the contrary.
The School District and the Paying Agent shall not be required (a) to register the transfer or exchange any Bonds then
considered for redemption during a period beginning at the close of business on the fifteenth (15th) day next preceding any date of selection of Bonds to be redeemed and ending at the close of business on the day on which the applicable notice of redemption is mailed or (b) to register the transfer of or exchange any portion of any Bond selected for redemption until after the redemption date. Bonds may be exchanged for a like aggregate principal amount of Bonds of other authorized denominations of the same maturity and interest rate. Security
The Bonds will be general obligations of the School District, payable on a parity basis with all existing and future general obligation debt of the School District, from its tax and other general revenues. The School District has covenanted that it will provide in its budget for each year, and will appropriate from its general revenues in each such year, the amount of the debt service on the Bonds for such year, and will duly and punctually pay or cause to be paid from its Sinking Fund, as hereinafter defined, or any other of its revenues or funds, the principal of each of the Bonds and the interest thereon at the dates and place and in the manner stated on the Bonds, and for such budgeting, appropriation and payment the School District irrevocably has pledged its full faith, credit and taxing power, which taxing power includes the power to levy an annual ad valorem tax on all taxable property within the School District, within the limits provided by law (see “TAXING POWERS OF THE SCHOOL DISTRICT” herein). The Debt Act presently provides for the enforcement of debt service payments as hereinafter described (see “DEFAULTS AND REMEDIES” herein), and the Public School Code presently provides for the withholding and application of subsidies in the event of failure to pay debt service (See “Commonwealth Enforcement of Debt Service Payments” below). Commonwealth Enforcement of Debt Service Payments Section 633 of the Pennsylvania Public School Code of 1949, as amended by Act 150 of 1975, and as further amended and supplemented (the “Public School Code”), presently provides that in all cases where the board of school directors of any school district fails to pay or to provide for the payment of any indebtedness on the date of maturity or date of mandatory redemption or on any sinking fund deposit date, or any interest due on such indebtedness on any interest payment date or on any sinking fund deposit date, in accordance with the schedule under which the Bonds were issued, the Secretary of Education shall notify such board of school directors of its obligation and shall withhold out of any Commonwealth appropriation due such school district an amount equal to the sum of the principal amount maturing or subject to mandatory redemption and interest owing by such school district, or sinking fund deposit due by such school district, and shall pay over the amount so withheld to the bank or other person acting as sinking fund depositary for such Bond issue. These withholding provisions are not part of any contract with the holders of the Bonds, and may be amended or repealed by future legislation.
The effectiveness of Section 633 of the Public School Code may be limited by the application of other withholding
provisions contained in the Public School Code, such as provisions for withholding and paying over of appropriations for payment of unpaid teachers’ salaries. Enforcement may also be limited by bankruptcy, insolvency, or other laws or equitable principles affecting the enforcement of creditors’ rights generally. See “Pennsylvania Budget Adoption” hereinafter.

4
Pennsylvania Budget Adoption Over the past several years the Commonwealth of Pennsylvania has, from time to time, started its fiscal year without a fully
adopted state budget. In the state’s 2015-16 fiscal year, a final budget was not enacted until March 27, 2016, which was 270 days following the beginning of the fiscal year on March 27, 2016 when the Governor failed to sign or veto the state budget that was adopted by the General Assembly on March 17, 2016.
For the 2016-17 fiscal year, the state budget became law, known as Act 16A of 2016, on July 12, 2016 when the Governor
failed to sign or veto the state budget that was adopted by the General Assembly on July 1, 2016. On July 13, 2016, the General Assembly adopted and Governor signed into law additional tax and revenue package, known as Act 85 of 2016, which was needed to balance the 2016-17 state budget.
For the current 2017-18 fiscal year, the state budget became law, known as Act 1A of 2017, on July 11, 2017 when the
Governor failed to sign or veto the state budget that was adopted by the General Assembly on June 30, 2017. Act 1A of 2017 did not have any accompanying legislation regarding the potential revenue that would be needed to fund the balance of the 2017-18 Budget at the time of its enactment. On October 25, 2017, the General Assembly adopted House Bill 542 which contained the necessary revenue to fund the balance of the previously adopted Act 1A of 2017. On October 30, 2017 the Governor approved and signed House Bill 542 and it became known as Act 43 of 2017.
During a state budget impasse, school districts in Pennsylvania cannot be certain that state subsidies and revenues owed them
from the Commonwealth will become available. This includes many of the major state subsidies, and overall revenues, that a Pennsylvania school district receives including basic education funding, special education funding, PlanCon reimbursements, and certain block grants, among many others. Future budget impasses may affect the timeliness or amount of payments by the Commonwealth under the withholding provisions of Section 633 of the Public School Code, however recent legislation included in Act 85 of 2016 has attempted to address the timeliness of the withholding provisions of Section 633 of the Public School Code during any future budget impasses. See “Act 85 of 2016” hereinafter. Act 85 of 2016 – State Enforcement of Debt Service During Budget Impasses
On July 13, 2016, the Governor of the Commonwealth signed into law Act No. 85 of 2016, (P.L. 664, No. 85) (“Act 85 of
2016”), an amendment to the Act of April 9, 1929 (P.L. 343, No. 176), known as the Fiscal Code (“Fiscal Code”). Act 85 of 2016 adds to the Fiscal Code Article XV1-E.4, entitled “School District Intercepts for the Payment of Debt Service During Budget Impasse”, which provides for intercept of subsidy payments by the Pennsylvania Department of Education (“PDE”) to a school district subject to an “intercept statute” or an “intercept agreement” in the event of a Commonwealth budget impasse in any fiscal year.
Act 85 of 2016 includes in the definition of “intercept statute” Section 633 of the Public School Code. The School District's
general obligation bonds, including the Bonds, are subject to Section 633 of the Public School Code. Act 85 of 2016 provides that the amounts that may be necessary for PDE to comply with the provisions of the applicable
intercept statute or intercept agreement “shall be appropriated” to PDE from the General Fund of the Commonwealth after PDE submits justification to the majority and minority chairs of the appropriations committees of the Pennsylvania Senate and House of Representatives allowing ten (10) calendar days for their review and comment, if, in any fiscal year:
(1) annual appropriations for payment of Commonwealth money to school districts have not been enacted by July 1 and
continue not to be enacted when a payment is due; (2) the conditions under which PDE is required to comply with an intercept statute or intercept agreement have
occurred, thereby requiring PDE to withhold payments which would otherwise be due to school districts; and (3) the Secretary of PDE, in consultation with the Secretary of the Budget, determines that there are no payments or
allocations due to be paid to the applicable school districts from which PDE may withhold money as required by the applicable intercept statute or intercept agreement.
The necessary amounts shall be appropriated on the expiration of the tenth (10th) day following submission of the justification
described above to the majority and minority chairs of the appropriations committees, who may comment on the justification but cannot prevent the effectiveness of the appropriation.
The total of all intercept payments under Article XV11-E.4 for a school district may not exceed 50% of the total nonfederal
general fund subsidy payments made to that school district in the prior fiscal year. Act 85 of 2016 requires that each school district with bonds or notes subject to an intercept statute or intercept agreement must
deliver to PDE, in such format as PDE may direct, a copy of the final Official Statement for the relevant bonds or notes or the loan documents relating to the obligations, within thirty (30) days of receipt of the proceeds of the obligations. The School District intends on submitting this information with respect to the Bonds to PDE within the prescribed timeframe following the issuance of

5
the Bonds. Act 85 of 2016 provides that any obligation for which PDE does not receive the required documents shall not be subject to the applicable intercept statute or intercept agreement.
The provisions of Act 85 of 2016 are not part of any contract with the holders of the Bonds and may be amended or repealed by future legislation.
Sinking Fund
The sinking fund for the payment of debt service on the Bonds, designated “General Obligation Bonds, Series A of 2017 - Sinking Fund” (the “Sinking Fund”), created under the Resolution shall be held by the Paying Agent as sinking fund depository. The School District shall deposit in the Sinking Fund a sufficient sum not later than the date when interest and/or principal is to become due on the Bonds so that on each payment date the Sinking Fund will contain an amount which, together with any other funds available therein, is sufficient to pay in full interest and/or principal then due on the Bonds.
The Sinking Fund shall be held by the Paying Agent, as sinking fund depository, and funds deposited therein will be invested by the Paying Agent in such securities or shall be deposited in such funds or accounts as are authorized by law, upon direction of the School District. Such deposits and securities shall be in the name of the School District, but subject to withdrawal or collection only by the Paying Agent, as sinking fund depository, and such deposits and securities, together with the interest thereon, shall be a part of the Sinking Fund.
The Paying Agent, as sinking fund depository, is authorized without further order from the School District to pay from the Sinking Funds the principal of and interest on the Bonds, as and when due and payable.
BOOK-ENTRY ONLY SYSTEM
The information in this section has been obtained from materials provided by DTC for such purpose. The School District (herein referred to as the “Issuer”) and the Underwriter do not guaranty the accuracy or completeness of such information, and such information is not to be construed as a representation of the School District or the Underwriter.
The Depository Trust Company (“DTC”), New York, NY, will act as securities depository for the Bonds (the “Bonds”). The Bonds will be issued as fully-registered securities registered in the name of Cede & Co. (DTC's partnership nominee) or such other name as may be requested by an authorized representative of DTC. One fully-registered Bond certificate will be issued for each maturity of the Bonds, each in the aggregate principal amount of such maturity, and will be deposited with DTC.
DTC the world's largest securities depository is a limited-purpose trust company organized under the New York Banking Law, a “banking organization” within the meaning of the New York Banking Law, a member of the Federal Reserve System. a “clearing corporation” within the meaning of the New York Uniform Commercial Code, and a “clearing agency” registered pursuant to the provisions of Section 17A of the Securities Exchange Act of 1934. DTC holds and provides asset servicing for over 3.6 million issues of U.S. and non-U.S. equity issues, corporate and municipal debt issues, and money market instruments (from over 100 countries) that DTC's participants (“Direct Participants”) deposit with DTC. DTC also facilitates the post-trade settlement among Direct Participants of sales and other securities transactions in deposited securities, through electronic computerized book-entry transfers and pledges between Direct Participants' accounts. This eliminates the need for physical movement of securities certificates. Direct Participants include both U.S. and non-U.S. securities brokers and dealers, banks, trust companies, clearing corporations, and certain other organizations. DTC is a wholly-owned subsidiary of The Depository Trust & Clearing Corporation (“DTCC”). DTCC is the holding company for DTC, National Securities Clearing Corporation and Fixed Income Clearing Corporation, all of which are registered clearing agencies. DTCC is owned by the users of its regulated subsidiaries. Access to the DTC system is also available to others such as both U.S. and non-U.S. securities brokers and dealers, banks, trust companies, and clearing corporations that clear through or maintain a custodial relationship with a Direct Participant, either directly or indirectly (“Indirect Participants”). DTC has a Standard & Poor's rating of AA+. The DTC Rules applicable to its Participants are on file with the Securities and Exchange Commission. More information about DTC can be found at www.dtcc.com.
Purchases of Bonds under the DTC system must be made by or through Direct Participants, which will receive a credit for the Bonds on DTC's records. The ownership interest of each actual purchaser of each Bond (“Beneficial Owner”) is in turn to be recorded on the Direct and Indirect Participants' records. Beneficial Owners will not receive written confirmation from DTC of their purchase. Beneficial Owners are, however, expected to receive written confirmations providing details of the transaction, as well as periodic statements of their holdings, from the Direct or Indirect Participant through which the Beneficial Owner entered into the transaction. Transfers of ownership interests in the Bonds are to be accomplished by entries made on the books of Direct and Indirect Participants acting on behalf of Beneficial Owners. Beneficial Owners will not receive certificates representing their ownership interests in Bonds, except in the event that use of the book-entry system for the Bonds is discontinued.
To facilitate subsequent transfers, all Bonds deposited by Direct Participants with DTC are registered in the name of DTC's partnership nominee, Cede & Co., or such other name as may be requested by an authorized representative of DTC. The deposit of Bonds with DTC and their registration in the name of Cede & Co. or such other DTC nominee do not affect any change in beneficial ownership. DTC has no knowledge of the actual Beneficial Owners of the Bonds: DTC's records reflect only the identity of the Direct Participants to whose accounts such Bonds are credited, which may or may not be the Beneficial Owners. The Direct and Indirect Participants will remain responsible for keeping account of their holdings on behalf of their customers.

6
Conveyance of notices and other communications by DTC to Direct Participants, by Direct Participants to Indirect Participants,
and by Direct Participants and Indirect Participants to Beneficial Owners will be governed by arrangements among them, subject to any statutory or regulatory requirements as may be in effect from time to time. Beneficial Owners of Bonds may wish to take certain steps to augment the transmission to them of notices of significant events with respect to the Bonds, such as redemptions, tenders, defaults, and proposed amendments to the Bond documents. For example, Beneficial Owners of Bonds may wish to ascertain that the nominee holding the Bonds for their benefit bas agreed to obtain and transmit notices to Beneficial Owners. In the alternative, Beneficial Owners may wish to provide their names and addresses to the registrar and request that copies of notices be provided directly to them.
Redemption notices shall be sent to DTC. If less than all of the Bonds of any particular maturity are being redeemed, DTC's practice is to determine by lot the amount of the interest of each Direct Participant in such maturity to be redeemed.
Neither DTC nor Cede & Co. (nor any other DTC nominee) will consent or vote with respect to Bonds unless authorized by a Direct Participant in accordance with DTC's MMI Procedures. Under its usual procedures, DTC mails an Omnibus Proxy to Issuer as soon as possible after the record date. The Omnibus Proxy assigns Cede & Co.'s consenting or voting rights to those Direct Participants to whose accounts Bonds are credited on the record date (identified in a listing attached to the Omnibus Proxy).
Payments of Principal, interest and redemption premium, if any, on the Bonds, will be made to Cede & Co., or such other
nominee as may be requested by an authorized representative of DTC. DTC's practice is to credit Direct Participants' accounts upon DTC's receipt of funds and corresponding detail information from the Issuer or the Paying Agent, on payable date in accordance with their respective holdings shown on DTC's records. Payments by Participants to Beneficial Owners will be governed by standing instructions and customary practices, as is the case with securities held for the accounts of customers in bearer form or registered in “street name,” and will be the responsibility of such Participant and not of DTC, the Issuer or the Paying Agent, subject to any statutory or regulatory requirements as may be in effect from time to time. Payments of Principal, interest and redemption premium, if any, on the Bonds, to Cede & Co. (or such other nominee as may be requested by an authorized representative of DTC) is the responsibility of the Issuer or the Paying Agent, disbursement of such payments to Direct Participants will be the responsibility of DTC, and disbursement of such payments to the Beneficial Owners will be the responsibility of Direct and Indirect Participants.
DTC may discontinue providing its services as depository with respect to the Bonds at any time by giving reasonable notice to the Issuer or the Paying Agent. Under such circumstances, in the event that a successor depository is not obtained, Bond certificates are required to be printed and delivered.
The issuer may decide to discontinue use of the system of book-entry-only transfers through DTC (or a successor securities depository). In that event, Bond certificates will be printed and delivered to DTC.
The information in this section concerning DTC and DTC's book-entry system has been obtained from sources that Issuer believes to be reliable, but Issuer takes no responsibility for the accuracy thereof.
NEITHER THE ISSUER NOR THE PAYING AGENT WILL HAVE ANY RESPONSIBILITY OR OBLIGATION TO ANY DTC PARTICIPANT, INDIRECT PARTICIPANT OR BENEFICIAL OWNER OR ANY OTHER PERSON WITH RESPECT TO: (1) THE BONDS; (2) THE ACCURACY OF ANY RECORDS MAINTAINED BY DTC OR ANY DTC PARTICIPANT OR INDIRECT PARTICIPANT; (3) THE PAYMENT BY DTC OR ANY DTC PARTICIPANT OR INDIRECT PARTICIPANT OF ANY AMOUNT DUE TO ANY BENEFICIAL OWNER IN RESPECT OF THE PRINCIPAL OR REDEMPTION PRICE OF OR INTEREST ON THE BONDS; (4) THE DELIVERY TO ANY BENEFICIAL OWNER BY DTC OR ANY DTC PARTICIPANT OR INDIRECT PARTICIPANT OF ANY NOTICE WHICH IS REQUIRED OR PERMITTED UNDER THE TERMS OF THE ORDINANCE TO BE GIVEN TO BONDHOLDERS; (5) THE SELECTION OF THE BENEFICIAL OWNERS TO RECEIVE PAYMENT IN THE EVENT OF ANY PARTIAL REDEMPTION OF THE BONDS; OR (6) ANY OTHER ACTION TAKEN BY DTC AS BONDHOLDER.
The Issuer and the Paying Agent cannot give any assurances that DTC or the Participants will distribute payments of the
principal or redemption price of and interest on the Bonds paid to DTC or its nominee, as the registered owner of the Bonds, or any redemption or other notices, to the Beneficial Owners or that they will do so on a timely basis, or that DTC will serve and act in the manner described in this Official Statement.

7
REDEMPTION OF BONDS
Optional Redemption
The Bonds stated to mature on or after May 15, 2024, shall be subject to redemption prior to maturity, at the option of the School District, as a whole or on any date thereafter, or from time to time, in part (and if in part, in any order of maturities designated by the School District and within a maturity by lot) on May 15, 2023, or on any date thereafter, in either case upon payment of a redemption price of 100% of the principal amount to be redeemed, together with accrued interest to the redemption date.
Mandatory Redemption
The Bonds stated to mature on May 15, 2023, May 15, 2028, and May 15, 2032 are subject to redemption prior to maturity as required by the Resolution, in the amounts and on May 15 of the years shown below, from money in the Mandatory Sinking Fund created pursuant to the Resolution, upon payment of the principal amount being redeemed, together with interest accrued to the date fixed for redemption.
Bonds stated to mature May 15, 2023:
2019 $5,0002020 5,0002021 5,0002022 5,0002023 5,000*
Bonds stated to mature May 15, 2028:
2024 $5,0002025 5,0002026 5,0002027 5,0002028 5,000*
Bonds stated to mature May 15, 2032:
2031 $2,450,0002032 2,515,000*
* Stated maturity.
Notice of Redemption
So long as Cede & Co., as nominee of DTC, is the registered owner of the Bonds, the School District and the Paying Agent shall send redemption notices only to Cede & Co. See “BOOK-ENTRY ONLY SYSTEM” herein for further information regarding conveyance of notices to Beneficial Owners.
Notice of any redemption of certificated Bonds shall be given by depositing a copy of a redemption notice in first class mail not less than thirty (30) days prior to the date fixed for redemption, addressed to the registered owners of each of the Bonds to be redeemed, in whole or in part, at the addresses shown on the registration books kept by the Paying Agent as of the day such Bonds are selected for redemption; provided, however, that failure to give such notice by mailing, or any defect therein or in the mailing thereof, shall not affect the validity of any proceeding for redemption of other Bonds called for redemption as to which proper notice has been given.
On the date designated for redemption, notice having been provided as aforesaid, and money for payment of the principal and accrued interest being held by the Paying Agent, interest on the Bonds or portions thereof so called for redemption shall cease to accrue and such Bonds or portions thereof shall cease to be entitled to any benefit or security under the Resolution, and registered owners of such Bonds or portions thereof so called for redemption shall have no rights with respect thereto, except to receive payment of the principal thereof and accrued interest thereon to the date fixed for redemption.
If at the time of mailing of a notice of redemption the School District shall not have deposited with the Paying Agent, as sinking fund depository, money sufficient to redeem all Bonds or portions thereof called for redemption, the notice of redemption may state that it is conditional, i.e., that it is subject to the deposit of sufficient redemption money with the Paying Agent not later than the redemption date, and such notice shall be of no effect unless such money is so deposited. If the Bonds to be called for redemption shall have been refunded, money sufficient to redeem such Bonds shall be deemed to be on deposit with the Paying Agent for the purposes of this paragraph and the notice of redemption need not state that it is conditional, if the redemption money has been deposited irrevocably with another bank or bank and trust company which shall have been given irrevocable instructions to

8
transfer the same to the Paying Agent not later than the redemption date. If sufficient funds are not received, such notice of redemption shall be of no effect. Manner of Redemption
So long as Cede & Co., as nominee of DTC, is the registered owner of the Bonds, payment of the redemption price shall be made to Cede & Co. in accordance with the existing arrangements by and among the School District, the Paying Agent and DTC and, if less than all Bonds of any particular maturity of a series are to be redeemed, the amount of the interest of each DTC Participant, Indirect Participant and Beneficial Owner in such Bonds to be redeemed shall be determined by the governing arrangements among them, subject to any statutory or regulatory requirements as may be in effect from time to time. See “BOOK-ENTRY ONLY SYSTEM” herein for further information regarding redemption of Bonds registered in the name of Cede & Co.
If a Bond is of a denomination larger than $5,000, a portion of such Bond may be redeemed. For the purposes of redemption, a
Bond shall be treated as representing the number of Bonds that is equal to the principal amount thereof divided by $5,000, each $5,000 portion of such Bond being subject to redemption. In the case of partial redemption of a Bond, payment of the redemption price shall be made only upon surrender of such Bond in exchange for Bonds of the same maturity and in authorized denominations of the same series, maturity and interest rate in an aggregate principal amount equal to the unredeemed portion of the principal amount thereof.
If the redemption date for any Bonds shall be a Saturday, Sunday, legal holiday or a day on which banking institutions in the Commonwealth are authorized or required by law or executive order to close, then the date for payment of the principal, premium, if any, and interest upon such redemption shall be the next succeeding day which is not a Saturday, Sunday, legal holiday or a day on which such banking institutions are authorized or required to close, and payment on such date shall have the same force and effect as if made on the nominal date of redemption.
If any maturity of the Bonds which is subject to mandatory sinking fund redemption shall be called for optional redemption in
part, the School District shall be entitled to designate whether the principal amount redeemed is to be credited against the principal amount of the Bonds of any such maturity required to be called for mandatory sinking fund redemption on any particular future date or dates, or shall be credited against the principal amount of such Bonds to be due and payable at stated maturity, in each case in a whole multiple of $5,000 principal amount.
THE SCHOOL DISTRICT Introduction
The School District consists of the Borough of West Chester and surrounding municipalities in central Chester County and one municipality in western Delaware County and covers an area of approximately 75 square miles. The School District’s boundaries are coterminous with those of the Borough of West Chester and the Townships of East Bradford, East Goshen, Thornbury, West Goshen, Westtown and West Whiteland, all located in Chester County, and the Township of Thornbury in Delaware County. The Borough of West Chester, located in the geographic center of the School District and county seat of Chester County, is approximately 25 miles west of metropolitan Philadelphia, 15 miles north of Wilmington, Delaware, and 15 miles south of King of Prussia and Valley Forge. Many well-known unincorporated communities are located within the School District and these include: Exton in West Whiteland Township, Goshenville in East Goshen Township, Chatwood in West Goshen Township, Cheyney and Glen Mills in Thornbury Township, Delaware County, and Darlington Corners in Westtown Township.
West Chester Area School District is characterized by rolling hills and fertile valleys flanking the east branch of the Brandywine Creek and the tributaries of the Chester Creek. The Borough of West Chester is the financial and professional center for the surrounding area. The Townships encompassed within the School District are principally residential in character, with regional shopping centers and industrial parks. Four major public institutions are within the School District: West Chester University; Cheyney University; Chester County Courthouse; and Chester County Hospital. Administration
The School District is governed by a nine member Board of School Directors (the “School Board”) who are elected for four-year terms. The Superintendent is the chief administrative officer of the School District, with overall responsibility for all aspects of operations, including education. The Director of Business Affairs is responsible for budget and financial operations. Both of these officials are appointed by the School Board.

9
School District Facilities
The School District operates ten elementary schools, three middle schools and three high schools an administration building and athletic and support facilities, all as described on the following table. Students at the secondary level also attend the Central Chester County Area Vocational Technical School.
TABLE 1 WEST CHESTER AREA SCHOOL DISTRICT FACILITIES
Original Addition and/or
Construction Renovation 2017-18 Building Date Date Grades Enrollment* High Schools B. Rustin High School 2003-06 - 9-12 1,299 East High School 1973 1976/92/93/04 9-12 1,223 Henderson High School 1951 1956/64/76/94/98/04 9-12 1,218 Middle Schools E. N. Peirce Middle School 1963 1998/01/03 6-8 974 G. A. Stetson Middle School 1959 1961/98/03/07 6-8 940 J. R. Fugett Middle School 1969 2009 6-8 877 Elementary Schools East Bradford Elementary 1958 1966/70/89/14 K-5 438 East Goshen Elementary 1955 1960/64/67/95/01 K-5 403 Exton Elementary 1940 1953/57/91/92/93/00 K-5 492 Fern Hill Elementary 1955 1960/89 K-5 557 Glen Acres Elementary 1966 1997 K-5 577 Hillsdale Elementary 1976 2007 K-5 577 Mary C. Howse Elementary 1962 1965/97 K-5 533 Penn Wood Elementary 1966 1970/89/01/13 K-5 510 Sarah W. Starkweather Elementary 1991 1998 K-5 594 Westtown-Thornbury Elementary 1954 1956/89/13 K-5 464 Other Facilities & Operations Center 1999 - - Spellman Administration** 1924 1952/55/77/99 Admin./Gifted East/Fugett Athletic Fields 2004 - - Henderson-North Campus Athletics 2006 - -
Totals 11,676 *Projected for September 30, 2017 enrollment. ** School District still currently owns existing Spellman Administration Building described above, although the School District does intend to sell the building once a sale agreement has been finalized with a purchaser. In June 2017, the School District purchase a new office building in Exton and relocated its administrative offices. The new building is also called the Spellman Administration Building.
Source: School District Officials. Enrollments do not include vo-tech students or students attending facilities not operated by the School District. Enrollment Trends
The following table presents recent trends in School District enrollment and projections of enrollment for the next 4-5 years, as prepared by the School District's administrative officials.
TABLE 2
WEST CHESTER AREA SCHOOL DISTRICT ENROLLMENT TRENDS
Actual Enrollments Projected Enrollments
School School Year K-5 6-8 9-12 Total Year K-5 6-8 9-12 Total
2013-14 5,037 2,754 3,824 11,615 2018-19 5,154 2,723 3,812 11,689 2014-15 5,026 2,790 3,808 11,624 2019-20 5,095 2,768 3,776 11,639 2015-16 4,943 2,782 3,758 11,483 2020-21 5,087 2,780 3,799 11,666 2016-17 5,027 2,809 3,753 11,589 2021-22 5,127 2,771 3,754 11,652
2017-18* 5,145 2,791 3,740 11,676
*Projected for September 30, 2017 enrollment. Source: School District officials.
10
SCHOOL DISTRICT FINANCES
Introduction
The School District budgets and expends funds according to procedures mandated by the Pennsylvania Department of Education. An annual operating budget is prepared by the Superintendent and Director of Business Affairs and submitted to the School Board for approval prior to the beginning of each fiscal year (“FY”) on July 1. Financial Reporting
The School District keeps the books and prepares the financial reports for the General Fund according to a modified accrual basis of accounting. Major accrual items are payrolls, payroll taxes and pension fund contributions payable, loans receivable from other funds, and revenues receivable from other governmental units. Taxes are credited when received.
As of July 1, 2001, the School District adopted provisions of Governmental Accounting Standards Board Statement No. 34, Basic Financial Statements-and Management’s Discussion and Analysis - For State and Local Governments, Statement No. 37, Basic Financial Statements – and Management Discussion and Analysis - For State and Local Governments: Omnibus, and Interpretation No. 6, Recognition and Measurement of Certain Liabilities and Expenditures in Governmental Fund Balance Statements.
The School District financial statements are audited annually by an independent certified public accountant, as required by Commonwealth law. The firm of Barbacane, Thornton & Company LLP, Wilmington, Delaware, currently serves as the School District’s auditor.
The School District’s auditor has not been engaged to perform, and has not performed, since the date of its report included in an Appendix to this Official Statement, any procedure on the financial statements addressed in that report. Such auditor also has not performed any procedures relating to this Official Statement. Budgeting Process as modified by Act 1 of 2006 (Taxpayer Relief Act)
In General. School districts budget and expend funds according to procedures mandated by the Pennsylvania Department of Education (“PDE”). An annual operating budget is prepared by school district administrative officials on a uniform form furnished by PDE and submitted to the board of school directors for approval prior to the beginning of the fiscal year on July 1.
Procedures for Adoption of the Annual Budget. Under Pennsylvania Act No. 1 of the Special Session of 2006, as amended by Act 25 of 2011 (the “Taxpayer Relief Act” or “Act 1”), all school districts of the first class A, second class, third class and fourth class (except as described below) must adopt a preliminary budget proposal (which must include estimated revenues and expenditures and proposed tax rates) no later than 90 days prior to the date of the election immediately preceding the fiscal year. The preliminary budget proposal must be printed and made available for public inspection at least 20 days prior to its adoption; the board of school directors may hold a public hearing on the budget; and the board must give at least 10 days public notice of its intent to adopt the final budget.
If the adopted preliminary budget includes an increase in the rate of any tax levy, the preliminary budget must be submitted to PDE no later than 85 days prior to the date of the election immediately preceding the fiscal year. PDE is to compare the proposed percentage increase in the rate of any tax with the school district’s Index (see “The Taxpayer Relief Act” herein) and within 10 days, but not later than 75 days prior to the upcoming election, inform the school district whether the proposed percentage increase is less than or equal to the Index. If PDE determines that a proposed tax increase will exceed the Index, the school district must reduce the proposed tax increase, seek voter approval for the tax increase at the upcoming election, or seek approval to utilize one of the referendum exceptions authorized under The Taxpayer Relief Act.
With respect to the utilization of any of the Taxpayer Relief Act referendum exceptions for which PDE approval is required (see “The Taxpayer Relief Act (Act 1)” herein), the school district must publish notice of its intent to seek PDE approval not less than one week before submitting its request for approval to PDE and, if PDE determines to schedule a public hearing on the request, a notice of the date, time and place of such hearing. PDE is required by the Taxpayer Relief Act to rule on the school district’s request and inform the school district of its decision no later than 55 days prior to the upcoming election so that, if PDE denies the school district’s request, the school district may submit a referendum question to the local election officials at least 50 days before the upcoming election, if it so chooses.
If a school district seeks voter approval to increase taxes at a rate higher than the applicable Index, whether or not it first seeks approval to utilize one of the referendum exceptions available under the Taxpayer Relief Act, and the referendum question is not approved by a majority of the voters voting on the question, the board of school directors may not approve an increase in the tax rate greater than the applicable Index.

11
Simplified Procedures in Certain Cases. The above budgetary procedures will not apply to a school district if the board of
school directors adopts a resolution no later than 110 days prior to the election immediately preceding the upcoming fiscal year declaring that it will not increase any tax at a rate that exceeds the Index and that a tax increase at or below the rate of the Index will be sufficient to balance its budget. In that case, the Taxpayer Relief Act requires only that the proposed annual budget be prepared at least 30 days, and made available for public inspection at least 20 days, prior to its adoption, and that at least ten (10) days’ public notice be given of the board’s intent to adopt the annual budget. No referendum exceptions are available to a school district adopting such a resolution.
Status of FY 2017-18 Budget Under Act 1. On May 24, 2017, at its regular monthly meeting the School Board of the School District adopted a FY 2017-18 Final Budget, which calls for a tax millage rate increase of 2.91%, up .5845 mills over the previous approved FY budget, to 20.6841 mills for Chester County residents and a tax millage rate increase of 3.394%, up 0.4973 mills to 15.2086 mills for Delaware County residents. This budget relies heavily on School District spending reductions and the use of approximately $5.6 million of the School District’s accumulated fund balance. Property tax millage rates in the School District will remain the lowest of any school district in Chester County or Delaware County, Pennsylvania.
[THE REMAINDER OF THIS PAGE INTENTIONALLY LEFT BLANK]

12
Summary and Discussion of Financial Results
A summary of the comparative governmental fund balance sheets is presented in Table 3 and Table 4 shows historic changes in the general fund balances of the School District. Table 5 summarizes revenues and expenditures for the past four years, estimated 2016-17 and the 2017-18 budget.
TABLE 3 WEST CHESTER AREA SCHOOL DISTRICT
SUMMARY OF COMPARATIVE GOVERNMENTAL FUND BALANCE SHEET (Fiscal Years Ending June 30)
2013 2014 2015 2016 ASSETS Current: Cash and Cash Equivalents $22,136,164 $17,622,072 $23,439,719 $18,762,949 Investments 47,173,414 57,583,651 44,283,458 53,490,542 Internal Balances 0 0 (492) (585) Investments (restricted) 1,894,735 0 0 0 Property Taxes Receivable, Net 4,760,811 4,253,307 3,651,985 3,615,153 Due from other Governments 2,170,257 2,683,899 3,557,838 4,598,096 Other Receivables 1,429,544 868,411 814,784 1,709,901 Prepaid Expenditures 1,918,300 3,482,456 4,413,770 2,434,975 Other Current Assets 0 12,270 0 0 TOTAL CURRENT ASSETS $81,483,225 $86,506,066 $80,161,062 $84,611,031
Noncurrent Assets Capital Assets: Bond issuance costs $0 $0 $0 $0 Other post-employment benefits 0 0 0 0 Land 33,159,800 33,159,800 33,159,800 28,289,916 Land Improvements 14,737,125 14,737,125 15,387,038 15,770,266 Buildings 363,112,043 364,460,917 396,169,432 398,442,243 Construction in Progress 18,914,012 27,269,498 8,544,126 13,850,498 Furniture and Equipment 33,152,717 33,064,984 35,366,723 35,726,095 TOTAL CAPITAL ASSETS, NET OF DEPRECIATION $463,075,697 $472,692,324 $488,627,119 $492,079,018
Less: Accumulated depreciation ($164,135,053) ($173,719,145) ($185,790,681) ($198,539,706) TOTAL ASSETS $380,423,869 $385,479,245 $382,997,500 $378,150,343
DEFFERED INFLOWS OF RESOURCES Deferred amount on refunding $4,391,514 $5,544,256 $7,591,636 $7,550,581 Deferred Pension Contributions 0 0 18,609,908 22,053,155 Deferred Pension 0 0 4,661,632 9,097,787 TOTAL DEFERRED OUTFLOWS $4,391,514 $5,544,256 $30,863,176 $38,701,523
TOTAL ASSETS AND DEFERRED OUTFLOWS OF RESOURCES $384,815,383 $391,023,501 $413,860,676 $416,851,866
LIABILITIES Current: Accounts Payable and other current liabilities $23,697,396 $25,042,441 $27,410,251 $22,202,118 Bond and Notes Payable Due Within One Year 13,765,676 15,571,743 11,835,240 16,976,211 Accrued Interest 1,654,712 2,062,171 1,933,474 1,500,949 Deferred Revenues 23,781 195,159 105,440 144,102 TOTAL CURRENT LIABILITIES $39,141,565 $42,871,514 $41,284,405 $40,823,380
Long-Term: Bonds and Notes Payable Due After One Year $286,418,634 $284,067,626 $277,603,614 $273,049,843 Accrued Severance and Compensated Absences 6,827,788 4,877,394 4,805,853 4,626,439 Other post-employment benefits 37,180 236,392 293,516 406,171 Net pension liability 0 0 262,381,000 293,071,000 TOTAL LONG-TERM LIABILITIES $293,283,602 $289,181,412 $545,083,983 $571,153,453
TOTAL LIABILITIES $332,425,167 $332,052,926 $586,368,388 $611,976,833
DEFERRED INFLOW OF RESOURCES Deferred pension $0 $0 $18,757,000 $1,803,000
NET POSITION (DEFICIT) Net investment in capital assets $5,876,233 $7,710,407 $20,989,220 $11,063,839 Restricted for Capital Projects 15,646,701 17,672,551 22,203,300 27,440,218 Unrestricted (Deficit) 30,867,282 34,101,596 (234,457,232) (235,432,024) TOTAL FUND EQUITIES $52,390,216 $59,484,554 ($191,264,712) ($196,927,967)
TOTAL LIABILITIES AND FUND EQUITIES/NET ASSETS $384,815,383 $391,537,480 $413,860,676 $416,851,866
Source: School District’s Annual Financial Reports.

13
TABLE 4 WEST CHESTER AREA SCHOOL DISTRICT GENERAL FUND
SUMMARY OF CHANGES IN GENERAL FUND BALANCE* (Fiscal Years Ending June 30)
Actual Estimated Budgeted
2013 2014 2015 2016 2017 2018(1)
Beginning Fund Balance $25,376,004 $32,371,890 $33,351,073 $31,665,559 $28,760,978 $28,849,853
Revenues over (under) Expenditure 6,995,886 979,183 (1,685,514) (2,904,581) 88,875 (5,646,042)
Prior Period Adjustment 0 0 0 0 0 0
Ending Fund Balance $32,371,890 $33,351,073 $31,665,559 $28,760,978 $28,849,853 $23,203,811
*Totals may not add due to rounding. (1)Budget, as adopted May 24, 2017. Source: School District Annual Financial Reports and Budget.
General Fund Revenue
The School District received an estimated $235,401,338 in total revenue in FY 2016-17, and has budgeted total revenue of $238,173,483 in FY 2017-18. Local sources decreased as a share of total revenue in the past five years, from 83.91% in FY 2013-14 to a budgeted 81.85% in FY 2017-18. Revenue from Commonwealth sources increased slightly as a share of the total revenue from 15.99% to a budgeted 17.39% over this period. Federal and other revenue increased slightly as a share of the total revenue from 0.73% to 0.76% over this period.
TABLE 5
WEST CHESTER AREA SCHOOL DISTRICT SUMMARY OF SCHOOL DISTRICT GENERAL FUND
REVENUES* (Fiscal Years Ending June 30)
REVENUE: Actual Estimated Budgeted
Local Sources: 2013 2014 2015 2016 2017 2018
Real Estate Taxes (Current) $141,839,871 $143,225,113 $147,447,717 $151,929,043 $156,989,628 $162,030,545
Interim Real Estate Taxes 1,573,196 679,486 955,973 780,930 695,464 1,188,338
Total Act 511 Taxes 22,165,152 23,185,205 23,505,224 24,325,967 27,451,544 25,371,207
Public Utility Realty Tax 223,786 210,851 214,682 198,340 196,738 200,000
Delinquencies on Taxes Levied 4,069,877 3,365,905 3,246,013 3,000,329 3,479,843 3,008,800
Earnings from Temporary Deposits & Investments 129,835 70,970 165,496 332,215 731,944 396,030
PA Revenue Rec'd.-Other Intermediate Sources 413,737 419,389 136,281 152,905 227,193 0
Fed. Rev. Rec'd.-Other Intermediate/PA Sources 1,264,456 1,154,666 1,215,754 1,199,740 1,333,558 1,193,717
Tuition from Patrons 143,171 29,342 149,291 157,428 161,773 475,640
Rentals 298,044 332,728 347,233 402,308 509,869 360,000
Contributions and Donations 6,500 11,500 5,000 13,381 17,602 20,000
Receipts from Other LEAs 583,741 408,333 213,468 385,557 118,233 191,500
Refund of Prior Years' Expenditures 24,824 14,881 16,391 36,859 34,677 504,985
All Other Local Revenues Not Specified 20,944 106,126 398,020 406,289 339,491 0
Other Sources 74,943 13,861 0 0 0 0
Total Local Sources $172,832,076 $173,228,355 $178,016,542 $183,321,291 $192,287,557 $194,940,762
State Sources:
Total State Sources $29,520,370 $31,717,857 $34,209,926 $35,806,499 $41,156,642 $41,423,546
Federal Sources:
Total Federal Sources $2,776,774 $1,507,117 $1,744,067 $1,665,595 $1,957,139 $1,809,175
Other Sources:
Total Other Sources $973 $0 $0 $0 $0 $0
TOTAL REVENUE $205,130,193 $206,453,328 $213,970,536 $220,793,385 $235,401,338 $238,173,483
*Totals may not add due to rounding. (1)Budget, as adopted May 24, 2017. Source: School District Annual Financial Reports and Budget.
14
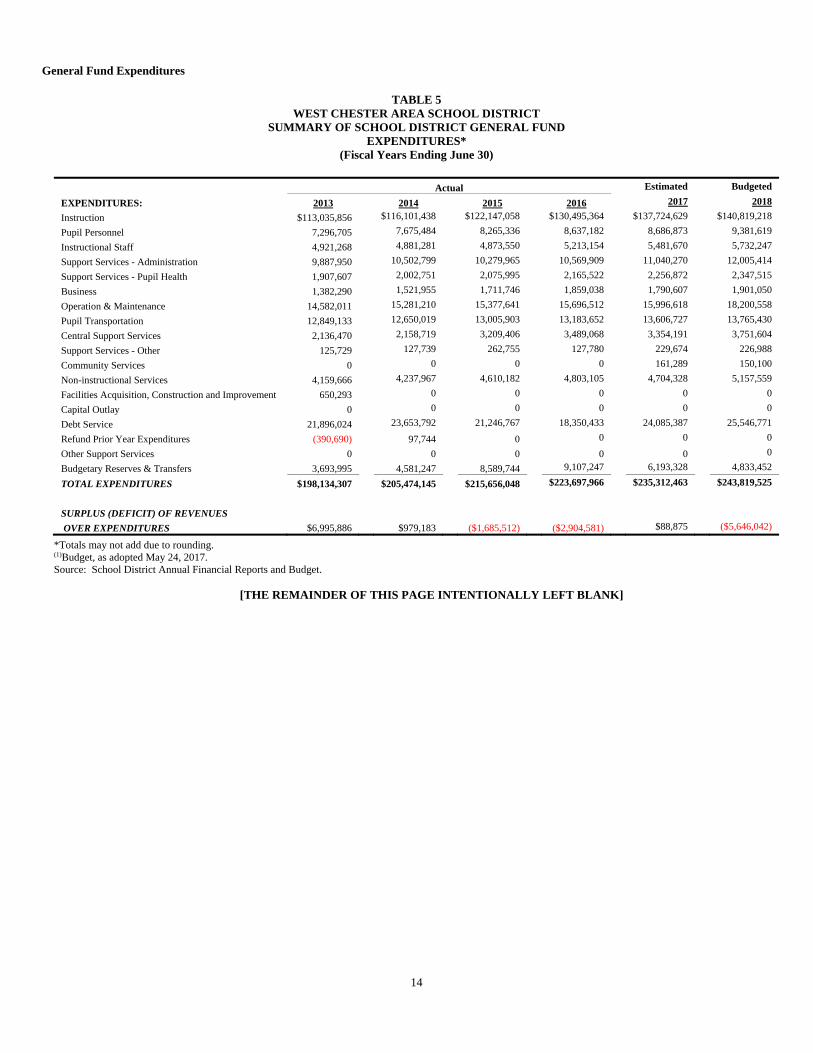
General Fund Expenditures
TABLE 5 WEST CHESTER AREA SCHOOL DISTRICT
SUMMARY OF SCHOOL DISTRICT GENERAL FUND EXPENDITURES*
(Fiscal Years Ending June 30)
Actual Estimated Budgeted
EXPENDITURES: 2013 2014 2015 2016 2017 2018
Instruction $113,035,856 $116,101,438 $122,147,058 $130,495,364 $137,724,629 $140,819,218
Pupil Personnel 7,296,705 7,675,484 8,265,336 8,637,182 8,686,873 9,381,619
Instructional Staff 4,921,268 4,881,281 4,873,550 5,213,154 5,481,670 5,732,247
Support Services - Administration 9,887,950 10,502,799 10,279,965 10,569,909 11,040,270 12,005,414
Support Services - Pupil Health 1,907,607 2,002,751 2,075,995 2,165,522 2,256,872 2,347,515
Business 1,382,290 1,521,955 1,711,746 1,859,038 1,790,607 1,901,050
Operation & Maintenance 14,582,011 15,281,210 15,377,641 15,696,512 15,996,618 18,200,558
Pupil Transportation 12,849,133 12,650,019 13,005,903 13,183,652 13,606,727 13,765,430
Central Support Services 2,136,470 2,158,719 3,209,406 3,489,068 3,354,191 3,751,604
Support Services - Other 125,729 127,739 262,755 127,780 229,674 226,988
Community Services 0 0 0 0 161,289 150,100
Non-instructional Services 4,159,666 4,237,967 4,610,182 4,803,105 4,704,328 5,157,559
Facilities Acquisition, Construction and Improvement 650,293 0 0 0 0 0
Capital Outlay 0 0 0 0 0 0
Debt Service 21,896,024 23,653,792 21,246,767 18,350,433 24,085,387 25,546,771
Refund Prior Year Expenditures (390,690) 97,744 0 0 0 0
Other Support Services 0 0 0 0 0 0
Budgetary Reserves & Transfers 3,693,995 4,581,247 8,589,744 9,107,247 6,193,328 4,833,452
TOTAL EXPENDITURES $198,134,307 $205,474,145 $215,656,048 $223,697,966 $235,312,463 $243,819,525
SURPLUS (DEFICIT) OF REVENUES
OVER EXPENDITURES $6,995,886 $979,183 ($1,685,512) ($2,904,581) $88,875 ($5,646,042)
*Totals may not add due to rounding. (1)Budget, as adopted May 24, 2017. Source: School District Annual Financial Reports and Budget.
[THE REMAINDER OF THIS PAGE INTENTIONALLY LEFT BLANK]

15
TAXING POWERS OF THE SCHOOL DISTRICT
In General
Subject to statutory limitations imposed by the Taxpayer Relief Act, Act No. 1 of the Special Session of 2006, as amended (see “The Taxpayer Relief Act (Act 1)” herein), the School District is empowered by the School Code and other statutes to levy the following taxes:
1. A basic annual tax on all real property taxable for school purposes, not to exceed 25 mills on each dollar ofassessed valuation, to be used for general school purposes.
2. An unlimited ad valorem tax on the property taxable for school purposes to provide funds:
a. for minimum salaries and increments of the teaching and supervisory staff;b. to pay rentals due any municipality authority or non-profit corporation or due the State Public School
Building Authority;c. to pay interest and principal on any indebtedness incurred pursuant to the Local Government Unit Debt
Act, or any prior or subsequent act governing the incurrence of indebtedness of the school district; andd. to pay for the amortization of a bond or note issue which provided a school building prior to the first Monday
of July, 1959.
3. An annual per capita tax on each resident or inhabitant over 18 years of age of not more than $5.00.
4. Additional taxes subject to division with other political subdivisions authorized to levy similar taxes on the sameperson, subject, business, transaction or privilege, under Act No. 511, enacted December 31, 1965, as amended(“The Local Tax Enabling Act”). These taxes, which may include, among others, an additional per capita tax, awage and other earned income tax, a real estate transfer tax, a gross receipts tax, a local services tax and anoccupation tax, shall not exceed, in the aggregate, an amount equal to the product of the market valuation of realestate in the School District (as certified by the State Tax Equalization Board of the Commonwealth – “STEB”)multiplied by twelve mills. All local taxing authorities are required by the Local Tax Enabling Act to exemptdisabled veterans and members of the armed forces reserve who are called to active duty at any time during the taxyear from any local services tax and to exempt from any local services tax levied at a rate in excess of $10 thosepersons whose total income and net profits from all sources within the political subdivision is less than $12,000 forthe tax year. The Local Tax Enabling Act also authorizes, but does not require, taxing authorities to exempt from percapita, occupation, and earned income taxes and any local services tax levied at a rate of $10 or less per year, anyperson whose total income from all sources is less than $12,000 per year.
The Taxpayer Relief Act (Act 1)
Under Act 1, a school district may not levy any new tax for the support of the public schools which was not levied in the previous fiscal year, raise the rate of any earned income and net profits tax if already imposed under the authority of the Local Tax Enabling Act (Act 511), or increase the rate of any tax for school purposes by more than the Index (defined below), unless in each case either (a) such increase is approved by the voters in the school district at a public referendum or (b) one of the exceptions summarized below is applicable and the use of such exception is approved by the Pennsylvania Department of Education (PDE):
1. to pay interest and principal on indebtedness approved (“incurred” as defined by Act 1) (i) prior to September 4,2004, in the case of a school district which had elected to become subject to the provisions of the priorHomeowner Tax Relief Act, Act 72 of 2004, or (ii) prior to June 27, 2006, in the case of a school district whichhad not elected to become subject to Act 72 of 2004; to pay interest and principal on any indebtedness approvedby the voters at referendum (electoral debt); and to pay interest and principal on debt refunding or refinancingdebt for which one of the above exceptions is permitted, as long as the refunding or refinancing incurs noadditional debt other than for costs and expenses related to the refunding or refinancing and the funding ofappropriate debt service reserves;
2. to pay costs incurred in providing special education programs and services to students with disabilities, underspecified circumstances; and
3. to make payments into the State Public School Employees’ Retirement System when the increase in theestimated payments between the current year and the upcoming year is greater than the Index, as determined byPDE in accordance with the provisions of Act 1.

16
Any revenue derived from an increase in the rate of any tax allowed under the exception numbered 1 above may not exceed the anticipated dollar amount of the expenditure, and any revenue derived from an increase in the rate of any tax allowed pursuant to any other exception enumerated above may not exceed the rate increase required, as determined by PDE. If a school district’s petition or request to increase taxes by more than the Index pursuant to one or more of the allowable exceptions is not approved, the school district may submit the proposed tax increase to a referendum.
The Index (to be determined and reported by PDE by September of each year for application to the following fiscal year) is the average of the percentage increase in the statewide average weekly wage, as determined by the State Department of Labor and Industry for the preceding calendar year, and the employment cost index for elementary and secondary schools, as reported by the federal Bureau of Labor Statistics for the preceding 12-month period beginning July 1 and ending June 30. If and when a school district has a Market Value/Income Aid Ratio greater than 0.40 for the prior school year, however, the Index is adjusted upward by multiplying the unadjusted Index by the sum of 0.75 and such Aid Ratio.
The Act 1 Index applicable to the School District in the next, current and prior fiscal years are as follows:
Fiscal Year Index % 2017-18 2.5 2016-17 2.4 2015-16 1.9 2014-15 2.1 2013-14 1.7
Source: Pennsylvania Department of Education website.
In accordance with Act 1, the School District put a referendum question on the ballot at the May, 15, 2007, primary election
seeking voter approval to levy (or increase the rate of) an earned income and net profits tax (“EIT”) or a personal income tax (“PIT”) and use the proceeds to reduce local real estate taxes by a homestead and farmstead exclusion. This referendum question was not approved by the voters. A board of school directors may submit, but is not required to submit, a referendum question to the voters at the municipal election in any later year seeking approval to levy or increase the rate of an EIT or a PIT for the purpose of funding homestead and farmstead exclusions, but the proposed rate of the EIT or PIT shall not exceed the rate that is required to provide the maximum homestead and farmstead exclusions allowable under law.
SET FORTH ABOVE IS A SUMMARY OF PORTIONS OF ACT 1. THIS SUMMARY IS NOT INTENDED TO BE AN
EXHAUSTIVE DISCUSSION OF THE PROVISIONS OF ACT 1 NOR A LEGAL INTERPRETATION OF ANY PROVISION OF ACT 1, AND A PROSPECTIVE PURCHASER OF THE BONDS SHOULD REVIEW THE FULL TEXT OF ACT 1 AS A PART OF ANY DECISION TO PURCHASE THE BONDS.
Status of the Bonds Under Act 1
No exception to the referendum requirement is expected for any new taxes required to pay the debt service on the Bonds if a tax increase greater than the Index is required. The School District believes that it has included sufficient new tax millage in its 2017/18 budget to cover the full amount of the debt service on the Bonds without exceeding the 2017/18 Index (although the actual tax increase may exceed the 2017/18 Index as a result of the other available and approved (non-debt related) exceptions to the Index). Legislation Limiting Unreserved Fund Balances
Pennsylvania Act No. 2003-48 (enacted December 23, 2003) prohibits a school district from increasing real property taxes, unless the school district has adopted a budget for such school year that includes an estimated ending unreserved undesignated fund balance which is not more than a specified percentage of the total budgeted expenditures, as set forth below:
Total Budgeted Expenditures Estimated Ending Unreserved Undesignated Fund Balance
as a Percentage of Total Budgeted Expenditures Less than or equal to $11,999,999 12.0% Between $12,000,000 and $12,999,999 11.5% Between $13,000,000 and $13,999,999 11.0% Between $14,000,000 and $14,999,999 10.5% Between $15,000,000 and $15,999,999 10.0% Between $16,000,000 and $16,999,999 9.5% Between $17,000,000 and $17,999,999 9.0% Between $18,000,000 and $18,999,999 8.5% Greater than or equal to $19,000,000 8.0%*
“Estimated ending unreserved fund balance” is defined in Act 2003-48 as that portion of the fund balance which is
appropriable for expenditure or not legally or otherwise segregated for a specific or tentative future use, projected for the close of the school year for which a school district’s budget was adopted and held in the general fund accounts of the school district. *Applicable to the School District.

17
Tax Levy Trends
Table 6 which follows shows the recent trend of tax rates levied by the School District. Table 7 shows the comparative trend of real property tax rates for the School District, the Borough, Townships, and the County.
TABLE 6
WEST CHESTER AREA SCHOOL DISTRICT TAX RATES
Chester Delaware Real Estate Wage and
County County Transfer(1) Income(1) (mills) (mills) (%) (%)
2013-14 18.6700 13.7800 1.00 1.00 2014-15 19.2100 13.6500 1.00 1.00 2015-16 19.5779 13.9059 1.00 1.00 2016-17 20.0982 14.7113 1.00 1.00 2017-18 20.6841 15.2086 1.00 1.00
(1)Subject to sharing providing the municipality levies the tax. Source: School District officials.
TABLE 7 WEST CHESTER AREA SCHOOL DISTRICT
COMPARATIVE REAL PROPERTY TAX RATES (Mills on Assessed Value)
Fiscal Year 2013-14 2014-15 2015-16 2016-17 2017-18
School District Chester County 18.6700 19.2100 19.5779 20.0982 20.6841 Delaware County 13.6200 13.6500 13.9059 14.7113 15.2086 East Bradford Township 0.3400 0.3400 0.3400 1.0000 1.0000 East Goshen Township 1.2500 1.2500 1.2500 1.2500 1.2500 Thornbury Township 0.8400 0.9950 0.9950 0.9950 0.9950 Thornbury Township (Delaware County) 0.0000 0.0000 0.0000 0.0000 0.0000 West Chester Borough 6.9600 6.9600 6.9600 6.9600 6.9600 West Goshen Township 2.0000 2.0000 2.0000 2.0000 2.0000 West Whiteland Township 0.7190 0.7190 0.7190 0.7190 0.7190 Westtown Township 3.5000 3.5000 3.5000 3.5000 3.5000 Chester County 4.1630 4.1630 4.1630 4.1630 4.3690
Source: Chester County and Delaware County websites.
[THE REMAINDER OF THIS PAGE INTENTIONALLY LEFT BLANK]
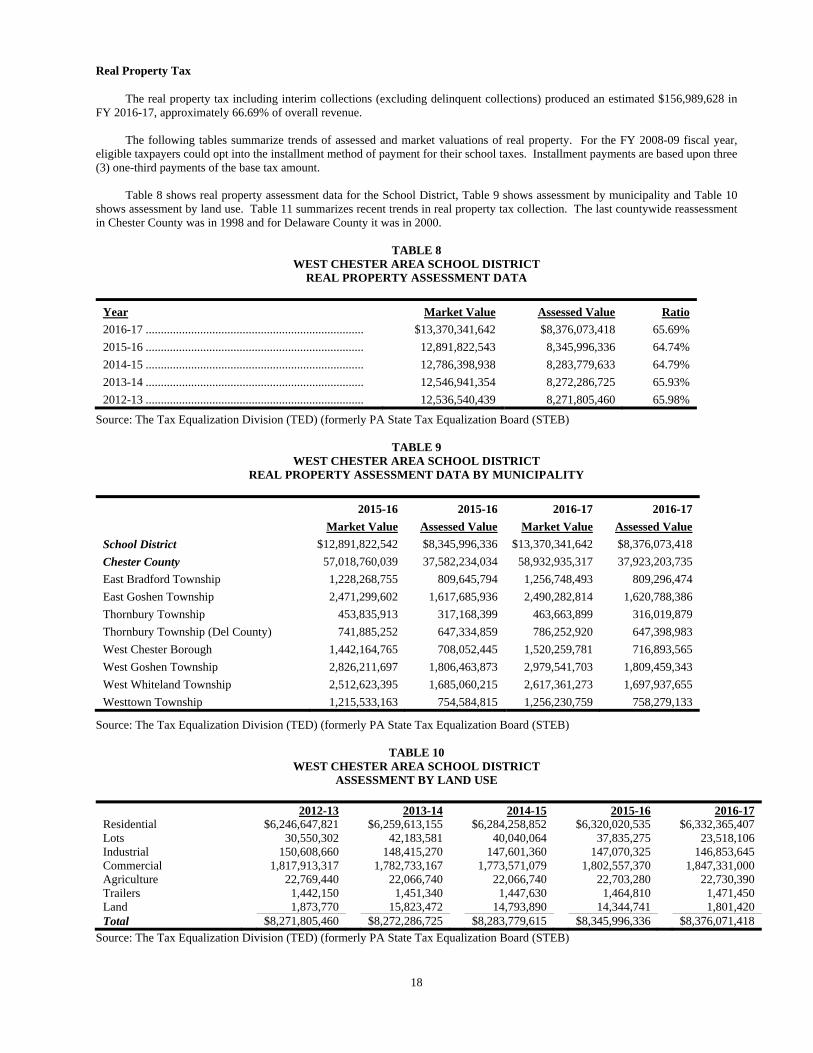
18
Real Property Tax
The real property tax including interim collections (excluding delinquent collections) produced an estimated $156,989,628 in FY 2016-17, approximately 66.69% of overall revenue.
The following tables summarize trends of assessed and market valuations of real property. For the FY 2008-09 fiscal year, eligible taxpayers could opt into the installment method of payment for their school taxes. Installment payments are based upon three (3) one-third payments of the base tax amount.
Table 8 shows real property assessment data for the School District, Table 9 shows assessment by municipality and Table 10
shows assessment by land use. Table 11 summarizes recent trends in real property tax collection. The last countywide reassessment in Chester County was in 1998 and for Delaware County it was in 2000.
TABLE 8
WEST CHESTER AREA SCHOOL DISTRICT REAL PROPERTY ASSESSMENT DATA
Year Market Value Assessed Value Ratio
2016-17 ........................................................................ $13,370,341,642 $8,376,073,418 65.69%
2015-16 ........................................................................ 12,891,822,543 8,345,996,336 64.74%
2014-15 ........................................................................ 12,786,398,938 8,283,779,633 64.79%
2013-14 ........................................................................ 12,546,941,354 8,272,286,725 65.93%
2012-13 ........................................................................ 12,536,540,439 8,271,805,460 65.98%
Source: The Tax Equalization Division (TED) (formerly PA State Tax Equalization Board (STEB)
TABLE 9 WEST CHESTER AREA SCHOOL DISTRICT
REAL PROPERTY ASSESSMENT DATA BY MUNICIPALITY
2015-16 2015-16 2016-17 2016-17
Market Value Assessed Value Market Value Assessed Value
School District $12,891,822,542 $8,345,996,336 $13,370,341,642 $8,376,073,418
Chester County 57,018,760,039 37,582,234,034 58,932,935,317 37,923,203,735
East Bradford Township 1,228,268,755 809,645,794 1,256,748,493 809,296,474
East Goshen Township 2,471,299,602 1,617,685,936 2,490,282,814 1,620,788,386
Thornbury Township 453,835,913 317,168,399 463,663,899 316,019,879
Thornbury Township (Del County) 741,885,252 647,334,859 786,252,920 647,398,983
West Chester Borough 1,442,164,765 708,052,445 1,520,259,781 716,893,565
West Goshen Township 2,826,211,697 1,806,463,873 2,979,541,703 1,809,459,343
West Whiteland Township 2,512,623,395 1,685,060,215 2,617,361,273 1,697,937,655
Westtown Township 1,215,533,163 754,584,815 1,256,230,759 758,279,133
Source: The Tax Equalization Division (TED) (formerly PA State Tax Equalization Board (STEB)
TABLE 10 WEST CHESTER AREA SCHOOL DISTRICT
ASSESSMENT BY LAND USE
2012-13 2013-14 2014-15 2015-16 2016-17 Residential $6,246,647,821 $6,259,613,155 $6,284,258,852 $6,320,020,535 $6,332,365,407 Lots 30,550,302 42,183,581 40,040,064 37,835,275 23,518,106 Industrial 150,608,660 148,415,270 147,601,360 147,070,325 146,853,645 Commercial 1,817,913,317 1,782,733,167 1,773,571,079 1,802,557,370 1,847,331,000 Agriculture 22,769,440 22,066,740 22,066,740 22,703,280 22,730,390 Trailers 1,442,150 1,451,340 1,447,630 1,464,810 1,471,450 Land 1,873,770 15,823,472 14,793,890 14,344,741 1,801,420 Total $8,271,805,460 $8,272,286,725 $8,283,779,615 $8,345,996,336 $8,376,071,418
Source: The Tax Equalization Division (TED) (formerly PA State Tax Equalization Board (STEB)

19
TABLE 11 WEST CHESTER AREA SCHOOL DISTRICT REAL PROPERTY TAX COLLECTION DATA
Current Current Year Total Total Assessed Adjusted Collections Collections Collections Collections
Year Valuation Mills Levied(1) Amount as Percent Amount(2) as Percent 2011-12 ................... $8,267,705,393 18.3600 $149,159,276 $143,252,119 96.04% $147,068,533 98.59% 2012-13 ................... 8,228,527,694 18.6700 150,509,123 144,033,647 95.70% 148,103,524 98.40% 2013-14 ................... 8,254,223,475 18.6700 150,888,350 145,796,697 96.63% 149,162,602 98.85% 2014-15 .................. 8,322,991,732 19.2100 156,297,569 151,076,254 96.66% 154,322,267 98.74% 2015-16 ................... 8,364,493,464 19.5779 160,086,202 155,266,376 96.99% 158,266,705 98.86% 2016-17 ................... 8,438,369,400 20.0982 166,104,714 160,634,511 96.71% 164,114,354 98.80%
(1)Plus penalties, less discounts and exonerations. (2)Includes real property assessments plus delinquent collections. Source: School District officials.
The ten largest real property taxpayers, together with 2017-18 assessed values, are shown on Table 12 which follows. The aggregate assessed value of these ten taxpayers totals approximately 3.67% of total assessed value.
TABLE 12
WEST CHESTER AREA SCHOOL DISTRICT TEN LARGEST REAL PROPERTY TAXPAYERS, 2017-18
2017-18
Owner Property Assessed Value
Exton Square Inc. Shopping Mall $66,363,880
Arhc Properties Wellington Senior Living 41,550,000
QVC Realty Industrial Bldg./TV Shopping 32,132,000
Main Street At Exton LP Shopping Center 33,282,510
Pointe Apartments Owner L.P. Apartment Complex 26,592,000
HCRI Pa Properties Holding (1) Bellingham Senior Living 26,323,360
TRC Valley Creek (2) Business Complex 22,767,190
Exton Crossing Apartments Apartment Complex 21,023,480
Whiteland Investors LP Shopping Center 19,320,000
Hankin Family Limited Partnership Residential Apartments Complex 17,331,650
Total $306,686,070
(1) There is pending both a school district appeal and also a taxpayer appeal. (2) There is pending a school district appeal. *As of January 1, 2017.
Other Taxes
Under Act 511, the School District collected an estimated $27,451,544 in taxes in FY 2016-17. Among the taxes authorized by Act 511, the Real Estate Transfer Tax and Wage and Income Taxes are levied by the School District. The Act 511 limit, equal to 12 mills on the market value of real property, was approximately $1,547,018,705.
Real Estate Transfer. The School District levies a tax of 0.5% of the value of real estate transfers. In FY 2016-17 the School District’s collected portion of this tax yielded an estimated $6,115,024 of total revenue.
Wage and Income Tax. The School District levies a tax of 0.5% of the earned income of residents. In FY 2016-17 the School District’s collected portion of this tax yielded $21,336,520 of total revenue.

20
DEBT AND DEBT LIMITS Commonwealth Aid to School Districts
Pennsylvania school districts receive financial assistance from the Commonwealth in a number of forms, all subject to statutory provisions and annual appropriation by the Pennsylvania General Assembly.
The largest subsidy, the basic instructional subsidy, is allocated to all school districts based on (1) the per pupil market value of assessable real property in the school district; (2) the per pupil earned income in the school district; and (3) the school district's tax effort, as compared with the tax effort of other school districts in the Commonwealth. School districts also receive subsidies for special education, pupil transportation; vocational education, health service and debt service are also received by the school district. Current Lack of State Appropriations for Debt Service Subsidies
Commonwealth law presently provides that the School District will receive, subject to state legislative appropriation, reimbursement from the Commonwealth for a portion of debt service paid on the Bonds following final approval by the Pennsylvania Department of Education (“DOE”). Commonwealth reimbursement is calculated based on the “Reimbursable Percentage” assigned to the Bonds by the DOE and the School District's permanent Capital Account Reimbursement Fraction (“CARF”) (27.54%) or the wealth based Market Value Aid Ratio (“MVAR”) currently (10.00%), whichever is higher. The Reimbursable Percentage is determined through a process known as the “Planning and Construction Workbook” or “PlanCon”.
Based on the current PlanCon program, School District officials have estimated that the Reimbursable Percentage of the 2017 Bonds will be 0.00% (there has been no determination by the DOE). The School District's CARF (which is higher than the MVAR) is 27.54%. The product of these two factors is 0.00%, which is the estimated percentage of debt service which may be reimbursed by the Commonwealth, subject to annual appropriation. In future years, this percentage may change as the School District’s MVAR changes, or as a result of future legislation regarding changes to, or even elimination of, the PlanCon program.
In May of 2016, the Commonwealth enacted appropriation legislation known as Act 25 (“Act 25”), which contains
authorization for the Commonwealth Finance Authority (“CFA”) to issue up to $2.5 billion of debt to fund PlanCon reimbursements to school districts. Act 25 also instituted a moratorium on new projects entering the PlanCon process while an advisory committee established under Act 25 considers amendments to the PlanCon reimbursement program. This new moratorium went into effect on May 15, 2016 and is scheduled to expire on June 30, 2017. As of the date of this Official Statement, an extension to the moratorium beyond June 30, 2017 is being discussed by the General Assembly but no legislation that has been adopted has been signed by the Governor.
On October 31, 2016, CFA issued its Revenue Bonds, Series A of 2016 (Federally Taxable) in the total amount of
$758,185,000 to provide for PlanCon reimbursement owed to all Pennsylvania school districts. It is expected that proceeds of this issue will be used to provide PlanCon reimbursement that is owed to the School District for past and current fiscal years. However, the School District cannot be certain that any future PlanCon reimbursement will be received by PDE as the ability for CFA to issue additional bonds in the future to fund future PlanCon reimbursements owed to school districts may impact the availability of PlanCon reimbursements payable to the School District. Any failure by the Commonwealth to adopt a timely budget and enact necessary spending authorizations could have a material adverse effect upon the School District’s anticipated receipt of PlanCon reimbursements.
There can be no assurances that the School District will be able to successfully apply for, be awarded, and receive sufficient
PlanCon reimbursement for the costs of the any current or future projects of the School District. A failure by the School District to receive such reimbursement could force the School District to apply other available funds, if any, toward the completion costs of the Project and may have a material adverse effect on the financial resources of the School District to fund other obligations, including payment of debt service on the Bonds.
Legislation has been introduced from time to time in the Pennsylvania legislature containing language that would revise or
even abolish the debt service reimbursement program for Pennsylvania school districts. As of the date hereof none of these proposals have been signed into law. To the extent that any future legislation contains material changes to the PlanCon program as currently is structured, the amount of PlanCon reimbursement to the School District may be positively or negatively affected, which could materially impact the amount of local funds needed to be raised by the School District to pay debt service or its debt obligations.
[THE REMAINDER OF THIS PAGE INTENTIONALLY LEFT BLANK]

21
Debt Statement
Table 13 which follows shows the debt of the West Chester Area School District as of September 1, 2017 and includes the new issuance of the Bonds.
TABLE 13
WEST CHESTER AREA SCHOOL DISTRICT DEBT STATEMENT
(As of September 1, 2017)*
Gross
NONELECTORAL DEBT Outstanding
General Obligation Bonds, Series A of 2017 (last maturity 2032) $9,750,000
General Obligation Bonds, Series of 2017 (last maturity 2029) 7,495,000
General Obligation Bonds, Series AA of 2016 (last maturity 2032) 8,500,000
General Obligation Bonds, Series A of 2016 (last maturity 2027) 32,025,000
General Obligation Bonds, Series of 2016 (last maturity 2024) 13,710,000
General Obligation Bonds, Series AA of 2015 (last maturity 2021) 3,650,000
General Obligation Bonds, Series A of 2015 (last maturity 2032) 9,685,000
General Obligation Bonds, Series of 2015 (last maturity 2017) 1,290,000
General Obligation Bonds, Series AA of 2014 (last maturity 2030) 57,010,000
General Obligation Bonds, Series A of 2014 (last maturity 2024) 26,395,000
General Obligation Bonds, Series of 2014 (last maturity 2032) 12,000,000
General Obligation Bonds, Series of 2013 (last maturity 2020) 3,285,000
General Obligation Bonds, Series AA of 2012 (last maturity 2022) 38,985,000
General Obligation Bonds, Series A of 2012 (last maturity 2032) 21,000,000
General Obligation Bonds, Series AA of 2010 (last maturity 2022) 16,075,000
General Obligation Note, Series of 2009 (last maturity 2027) 9,965,000
NONELECTORAL DEBT $270,820,000
LEASE RENTAL DEBT
NET LEASE RENTAL DEBT $0
TOTAL NET NONELECTORAL AND LEASE RENTAL DEBT $270,820,000
* Includes the Bonds offered through this Official Statement.
[THE REMAINDER OF THIS PAGE INTENTIONALLY LEFT BLANK]
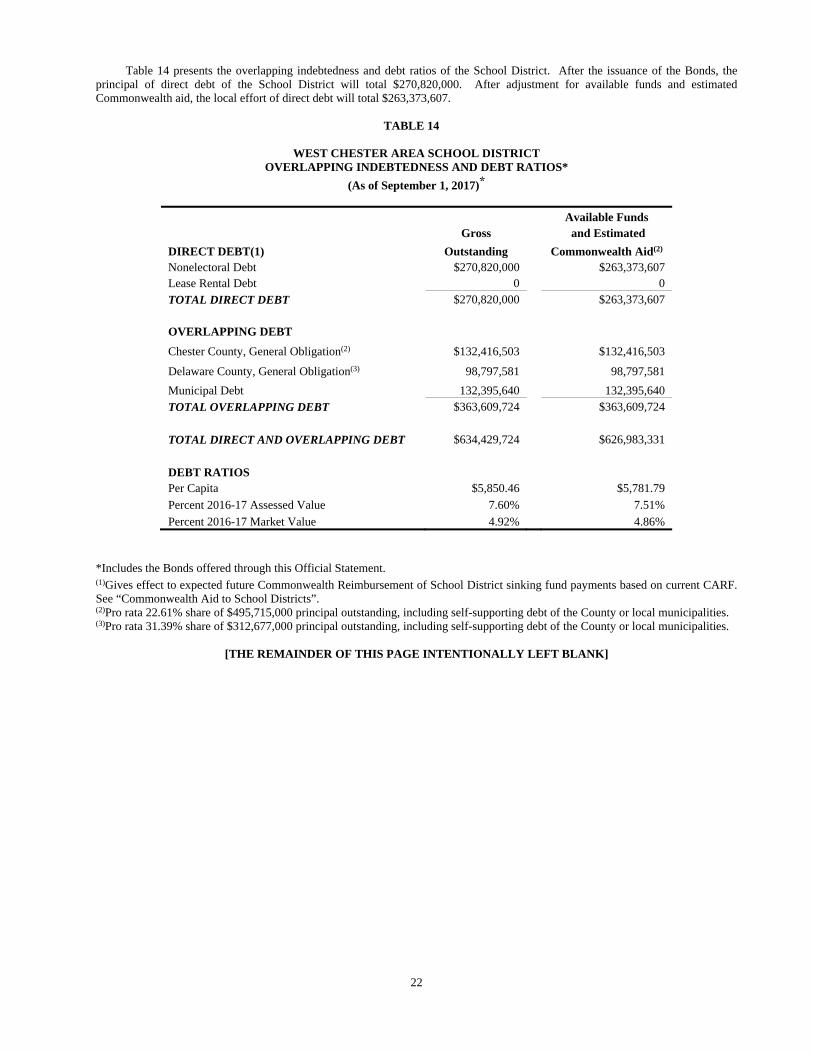
22
Table 14 presents the overlapping indebtedness and debt ratios of the School District. After the issuance of the Bonds, the principal of direct debt of the School District will total $270,820,000. After adjustment for available funds and estimated Commonwealth aid, the local effort of direct debt will total $263,373,607. TABLE 14
WEST CHESTER AREA SCHOOL DISTRICT OVERLAPPING INDEBTEDNESS AND DEBT RATIOS*
(As of September 1, 2017)*
Available Funds Gross and Estimated
DIRECT DEBT(1) Outstanding Commonwealth Aid(2) Nonelectoral Debt $270,820,000 $263,373,607 Lease Rental Debt 0 0
TOTAL DIRECT DEBT $270,820,000 $263,373,607
OVERLAPPING DEBT
Chester County, General Obligation(2) $132,416,503 $132,416,503
Delaware County, General Obligation(3) 98,797,581 98,797,581
Municipal Debt 132,395,640 132,395,640
TOTAL OVERLAPPING DEBT $363,609,724 $363,609,724
TOTAL DIRECT AND OVERLAPPING DEBT $634,429,724 $626,983,331
DEBT RATIOS Per Capita $5,850.46 $5,781.79
Percent 2016-17 Assessed Value 7.60% 7.51%
Percent 2016-17 Market Value 4.92% 4.86%
*Includes the Bonds offered through this Official Statement.
(1)Gives effect to expected future Commonwealth Reimbursement of School District sinking fund payments based on current CARF. See “Commonwealth Aid to School Districts”. (2)Pro rata 22.61% share of $495,715,000 principal outstanding, including self-supporting debt of the County or local municipalities. (3)Pro rata 31.39% share of $312,677,000 principal outstanding, including self-supporting debt of the County or local municipalities.
[THE REMAINDER OF THIS PAGE INTENTIONALLY LEFT BLANK]

23
Debt Limit and Remaining Borrowing Capacity
The statutory borrowing limit of the School District under the Debt Act is computed as a percentage of the School District's “Borrowing Base”. The “Borrowing Base” is defined as the annual arithmetic average of “Total Revenues” (as defined by the Debt Act), for the three full fiscal years ended next preceding the date of incurring debt. The School District calculates its present borrowing base and borrowing capacity as follows:
Total Revenues for FY 2014-15 $213,970,536
Total Revenues for FY 2015-16 220,793,385
Total Revenues for FY 2016-17 (est.) 235,401,338
Total Revenues, All Three Fiscal Years 670,165,259
Annual Arithmetic Average (Borrowing Base) $223,388,419
Under the Debt Act as presently in effect, no school district shall incur any nonelectoral debt or lease rental debt, if the
aggregate net principal amount of such new debt together with any other net nonelectoral debt and lease rental debt then outstanding, would cause the net nonelectoral debt plus net lease rental debt to exceed 225% of the Borrowing Base. The application of the aforesaid percentage to the School District's Borrowing Base produces the following product: Remaining Legal Net Debt Borrowing Limit Outstanding* Capacity Net Nonelectoral and Lease Rental Debt Limit: 225% of Borrowing Base $502,623,942 $270,820,000 $231,803,942 *Includes the Bonds described herein, and does not reflect credits against gross indebtedness that may be claimed for a portion of principal of any debt to be reimbursed by Commonwealth aid.
[THE REMAINDER OF THIS PAGE INTENTIONALLY LEFT BLANK]

24
Debt Service Requirements
Table 15 presents the debt service requirements on the School District's outstanding general obligation indebtedness including debt service on the Bonds.
The School District has never defaulted on the payment of debt service.
TABLE 15
WEST CHESTER AREA SCHOOL DISTRICT DEBT SERVICE REQUIREMENTS*
Obligation of 2017 Total
Year Debt Principal Interest Subtotal Requirements 2017-18 $25,003,523 $0 $105,622 $105,622 $25,109,145 2018-19 25,360,300 5,000 237,650 242,650 25,602,950 2019-20 25,320,793 5,000 237,563 242,563 25,563,356 2020-21 25,303,735 5,000 237,475 242,475 25,546,210 2021-22 25,247,818 5,000 237,388 242,388 25,490,206 2022-23 25,086,363 5,000 237,300 242,300 25,328,663 2023-24 24,506,308 5,000 237,213 242,213 24,748,521 2024-25 24,445,175 5,000 237,100 242,100 24,687,275 2025-26 24,441,455 5,000 236,988 241,988 24,683,443 2026-27 24,335,010 5,000 236,875 241,875 24,576,885 2027-28 24,608,508 5,000 236,763 241,763 24,850,271 2028-29 21,164,828 2,340,000 236,650 2,576,650 23,741,478 2029-30 20,440,515 2,395,000 184,000 2,579,000 23,019,515 2030-31 11,697,840 2,450,000 124,125 2,574,125 14,271,965 2030-32 11,698,965 2,515,000 62,875 2,577,875 14,276,840
Total $338,661,136 $9,750,000 $3,085,585 $12,835,585 $351,496,721
*Totals may not add due to rounding.
Table 16 presents data on the extent to which Commonwealth Aid provides coverage for debt service requirements.
TABLE 16
WEST CHESTER AREA SCHOOL DISTRICT
COVERAGE OF DEBT SERVICE REQUIREMENTS BY COMMONWEALTH AID*
Commonwealth Aid Received (budgeted) $41,423,546.00 Debt Service Requirements (budgeted) $25,546,771.00 Maximum Future Debt Service Requirements after Issuance of Bonds $25,602,950 Coverage of Debt Service Requirements 1.62 Coverage of Maximum Future Debt Service Requirements after Issuance of Bonds 1.62
*Assumes current Commonwealth Aid Ratio. See “Commonwealth Aid to School Districts.” Future Financing
The School District anticipates issuing additional long-term debt of approximately $35,000,000 within the next three (3) years to fund a continuous capital improvements program.

25
LABOR RELATIONS School District Employees
There are approximately 1,397 employees of the School District.
The West Chester Area Education Association (the “Association”), which is affiliated with the Pennsylvania State Education Association (PSEA), covering the professional employees of the School District other than administrators is under a contract which expires June 30, 2022. Secretarial and clerical personnel are represented by the Pennsylvania Education Association (ESPA-PSEA-NEA) under a contract which expires June 30, 2019. Custodial and maintenance personnel are represented by ESPA-PSEA under a contract which expires June 30, 2019. Pension Program
School Districts in Pennsylvania are required to participate in a statewide pension program administered by the Public School Employees Retirement System (PSERS). All of the School District's full-time employees, part-time employees who work more than 80 days in a school year, and hourly employees who work over 500 hours a year participate in the program. However, please note a Pennsylvania Supreme Court decision(1) has removed the hourly de minimis requirement for current members of PSERS regarding the purchase of credit for their part-time school service rendered prior to their being members of PSERS, for purposes of increasing their pension benefits.
Beginning July 1, 1976, certain revisions were made in the pension program. The Retirement Board, previously under the Department of Education of the Commonwealth, became an independent agency. However, the program is still guaranteed by the Commonwealth. Currently, each party to the program contributes a fixed percentage of the employee's salary. Employees belonging to the Public School Employees Retirement System (“PSERS”) prior to July 22, 1983 contribute 5.25% of their salary, and employees who joined the PSERS on or after July 22, 1983 contribute 6.25% of their salary. On February 17, 2002, Governor Ridge signed Act 9 which created a new membership class that sets the employee contribution rate at 7.50% of the employee’s salary for those employees hired on or after July 1, 2001. Act 9 also provides an option for those employees hired prior to July 1, 2001 to elect a contribution rate of 6.50%, if they were hired before July 22, 1983, or 7.50% if they were hired on or after July 22, 1983. Act 120 of 2010 (“Act 120”) was passed by the General Assembly on September 1 and signed by Governor Rendell on November 23, 2010. The benefit reductions contained in this legislation, only impacts individuals who become new members of PSERS on or after July 1, 2011. New members have the option of selecting one of 2 new classes. The members selecting class T-E contribute a base rate of 7.5% with “shared risk” contribution levels between 7.5% and 9.5% and a pension multiplier of 2.0%. Members selecting class T-F contribute a base rate of 10.3% with shared risk contribution levels between 10.3% and 12.3% and a pension multiplier of 2.5%.
The PSERS Board of Trustees certified an annual employer contribution rate of 30.03% for fiscal year 2016-17, which commenced on July 1, 2016. The 30.03% employer contribution rate was composed of 0.83% for health insurance premium assistance and a pension rate of 29.20%. On December 7, 2016 the Board of Trustees certified an annual employer contribution rate of 32.57% for fiscal year 2017-18, which begins July 1, 2017.
The Commonwealth reimburses school employers for not less than 50% of the total employer contribution rate. Contributions
for the School District are as follows:
2012-13 $10,336,175 2013-14 14,359,550 2014-15 18,609,908 2015-16 22,726,052
2016-17 (estimated) 27,068,705 2017-18 (budgeted) 30,112,287
PSERS is also funded through investment earnings and mandatory member contributions. PSERS members contribute from
5.25% to 10.30% of pay depending on their membership class and when they joined PSERS. Members will contribute an average of 7.54% of their salary to fund their retirement benefit in fiscal year 2017-18. Member contributions of approximately $1 billion are expected in fiscal year 2017-18.
In June 2012, the Government Accounting Standards Board (“GASB”) issued “Statement No. 68 Accounting and Financial
Reporting for Pensions – An Amendment of GASB Statement No 27.” The primary objective of this Statement is to improve accounting and financial reporting by state and local governments for pensions. The new accounting standard will require the School District to report in its government-wide financial statements its proportionate share of the new pension liability of the pension systems to which it contributes. GASB 68 is effective for fiscal years beginning after June 15, 2014, which, in the case of the School District will begin with fiscal year ending June 30, 2015. Please see the School District’s Audited Financial Statements for fiscal year ending June 30, 2016 in Appendix E for the net effects of the implementation of GASB 68.
(1)Pennsylvania Sch. Boards Ass'n, Inc. v. Com., Pub. Sch. Employees' Ret. Bd., 580 Pa. 610, 612, 863 A.2d 432, 434 (2004). Source: Pennsylvania School Board Association at www.PSBA.org and PSERS at www.PSERS.state.pa.us

26
Other Post-Employment Benefits (“OPEB”)
The School District provides a defined-benefit post-employment healthcare benefit, which provides medical benefits to eligible retirees and their spouses. The District has four bargaining units which participate in this plan: the West Chester Education Support Personnel, the Service Support personnel, the teachers, and the administrators. In addition, the non-bargaining staff members participate in the plan. Members of the Education support personnel and the Service Support personnel who were at least 50 years old as of 7/1/2012 and had 20 years of service receive a Health Reimbursement Account of $2,000 per year towards single employer health benefit coverage for a maximum of four years. Teachers hired before 7/1/2003 that reach age 50 with 15 years of service in the School District are eligible to receive single plan post-retirement benefits at the same level as current employees. Teachers hired before 7/1/2003 are eligible to receive a Health Reimbursement Account of $20,000 towards single employer health benefit coverage. Administrators that reach age 50 with 12 years of service receive benefits for administrator and spouse for 10 years or until Medicare eligible. Administrators receiving this benefit are required to cost-share for administrator coverage at a rate equal to the higher of the maximum reimbursement provided by PSERS (currently $100 per month) or active employee contribution and 50% of the cost of the spousal coverage cost. Non-bargaining employees receive the same coverage as administrators with no spousal coverage. The employee must retire from service to receive the post-employee benefits and not work for another school district.
The health Insurance plan is a single-employer, defined-benefit OPEB plan. The medical, prescription drug, dental and vision benefits are self-Insured. Only the PC-65 product is fully insured. The medical benefits are administered through Blue Cross and the prescription drug benefits through Caremark. Separate financial statements are not issued for the plan. The term life Insurance is purchased from U.S. Life; the Universal Life coverage is purchased from Genworth Financial. OPEB Funding Policy
As of July 1, 2014, the most recent valuation, the School District has no segregated assets to fund this liability. It is the intention of the School District to pay the premium each year as it comes due. OPEB Funding Progress
The schedule of funding progress of OPEB is as follows:
Actuarial Accrued UAAL as a Actuarial Liability Unfunded Percentage
Actuarial Value of (AAL) - AAL Funded Covered of Covered Valuation Assets Entry Age (UAAL) Ratio Payroll Payroll
Date (a) (b) (b-a) (a/b) (c) [(b-a)/c) 7/1/2014 $ - $13,296,649 $13,296,649 0.00% $83,546,655 15.92% 7/1/2012 $ - $19,107,176 $19,107,176 0.00% $80,033,237 23.87% 7/1/2010 $ - $26,658,307 $26,658,307 0.00% $86,718,957 30.74%
The actuarial valuation of an ongoing plan involves estimates of the value of reported amounts and assumptions about the probability of occurrences of events far into the future. Examples include assumptions about future employment and mortality. Amounts determined regarding the funded status of the plan and the annual required contributions of the employer are subject to continual revisions as actual results are compared with past expectations and new estimates are made into the future. The schedule of funding progress, presented as required supplemental information following the notes to the financial statements, presents Information about the actuarial value of the plan assets. In subsequent years, this schedule will present multi-year trend information about whether the actuarial value of plan assets is increasing or decreasing over time relative to the actuarial accrued liabilities for benefits.
OPEB Actuarial Methods and Assumptions
Projections of benefits for financial reporting purposes ore based on the substantive plan and include the types of benefits provided at the time of each valuation and the historical sharing of benefit costs between the employer and plan members to that point. The actuarial methods and assumptions used include techniques that are designed to reduce the effects of short-term volatility in actuarial accrued liabilities and the actual value of assets, consistent with the long-term perspective of the calculations. In the July 1, 2014 actuarial valuation, the following actuarial assumptions were used:
Interest – 4.5% compounded annually net of investment expenses Amortization method – Level dollar method at the valuation interest rate Amortization period – 30 years Salary increases – 2.5% cost of living + merit 0.25% to 2.75% per year Actuarial valuation cost method – Entry age normal

27
Annual OPEB Cost and Net OPEB Obligations
The School District's annual OPEB cost (expense) is calculated based on the annual required contribution (“ARC”) of the employer. The ARC represents a level of funding that, if paid on an ongoing basis, is projected to cover normal costs each year and to amortize any unfunded actuarial liabilities over a period not to exceed 30 years. The following table shows the components of the School District's annual OPEB cost for the year, the amount actually contributed to the plan, and the changes in the District's net OPEB obligation.
Annual OPEB Cost: Normal Cost ............................................................................ $ 504,701 Amortization of unfunded actuarial accrued liability .............. 1,354,852 Interest on net OPEB Obligation ............................................. 13,208 Funding Adjustment ................................................................ (29,908) ANNUAL OPEB COST .................................................. $1,842,853
Net OPEB Obligation (Asset): Net OPEB Obligation July 1, 2015 ......................................... $ 293,516 OPEB Cost for the year ended June 30, 2016 ......................... 1,842,853 Contributions for year ended June 30, 2016 ............................ (1,730,198) NET OPEB OBLIGATION (ASSET) ............................. $ 406,171
Source: 2016 Audit Report
LITIGATION
At the time of settlement, the President or Vice-President of the Board of School Directors of the School District will deliver a certificate on the Date of Delivery, certifying that there is no litigation pending which challenges the validity or enforceability of the Bonds.
DEFAULTS AND REMEDIES
In the event of the failure of the School District to pay or cause to be paid the interest on or principal of the Bonds, the holders
of the Bonds shall be entitled to certain remedies provided by the Debt Act. Among the remedies, if the failure to pay shall continue for 30 days, holders of the Bonds shall have the right to recover the amount due by bringing actions in assumpsit (contests) in the Court of Common Pleas of Chester or Delaware Counties. The Debt Act provides that any judgment shall have an appropriate priority upon the funds next coming into the treasury of the School District. The Debt Act also provides that upon a default of at least 30 days, holders of at least 25% of the Bonds may appoint a trustee to represent them. The Debt Act provides certain other remedies in the event of default, and further qualifies the remedies hereinbefore described.
TAX EXEMPTION AND OTHER TAX MATTERS Bond Counsel Opinion The information which follows is a summary of Bond Counsel’s opinion. This summary does not purport and should not be construed to be a complete recitation of Bond Counsel’s opinion. A draft of the full text of Bond Counsel’s opinion is appended hereto in Appendix B. Federal Income Tax Matters
On the date of delivery of the Bonds, Rhoads & Sinon LLP, having an office in Harrisburg, Pennsylvania, as Bond Counsel to the School District, will issue an opinion to the effect that under existing statutes, regulations and judicial decisions, interest on the Bonds is excluded from gross income for purposes of federal income taxation and is not an item of tax preference for purposes of the federal alternative minimum tax imposed on individuals and corporations, but that in the case of corporations (as defined for federal income tax purposes) such interest is taken into account in determining adjusted current earnings for purposes of such alternative minimum tax. This opinion of Bond Counsel will assume the accuracy of certifications made by the School District and will be subject to the condition that the School District will comply with all requirements of the Internal Revenue Code of 1986, as amended, that must be satisfied subsequent to the issuance of the Bonds in order that the interest thereon be, and continue to be, excluded from gross income for federal income tax purposes. See the proposed text of the Opinion of Bond Counsel appended to this Official Statement. The School District has covenanted to comply with all such requirements, which include, among others, restrictions upon the yield at which proceeds of the Bonds and other money held for the payment of the Bonds and deemed to be “proceeds” thereof may be invested and the requirement to calculate and rebate any arbitrage that may be generated with respect to investments allocable to the Bonds. Failure to comply with such requirements could cause the interest on the Bonds to be included in gross income retroactive to the date of issuance of the Bonds.

28
Certain maturities of the Bonds may be sold to the public in the initial offering at a price less than the stated redemption price of such Bonds at maturity (that is, at less than par or the stated principal amount), the difference being “original issue discount”. Generally, original issue discount accruing on a tax-exempt obligation is treated as interest excludable from gross income for federal income tax purposes. In addition, original issue discount that has accrued on a tax-exempt obligation is treated as an adjustment to the issue price of the obligation for the purpose of determining taxable gain upon sale or other disposition of such obligation prior to maturity. The Internal Revenue Code of 1986, as amended, provides specific rules for the accrual of original issue discount on tax-exempt obligations for federal income tax purposes. Prospective purchasers of Bonds being sold with original issue discount should consult their tax advisors for further information.
Ownership of the Bonds may result in collateral federal income tax consequences to certain taxpayers, including, without limitation, financial institutions, property and casualty insurance companies, certain subchapter S corporations with substantial passive income and Subchapter C earnings and profits, individual recipients of Social Security or Railroad Retirement benefits and taxpayers who may be deemed to have incurred or continued indebtedness to purchase or carry the Bonds. Bond Counsel will express no opinion as to such collateral tax consequences, and prospective purchasers of the Bonds should consult their tax advisors.
No representation is made or can be made by the School District or any other party associated with the issuance of the Bonds as to whether or not any legislation now or hereafter introduced and enacted will be applied retroactively so as to subject interest on the Bonds to inclusion in gross income for Federal income tax purposes or so as to otherwise affect the marketability or market value of the Bonds. Enactment of any legislation that subjects the interest on the Bonds to inclusion in gross income for federal income tax purposes or otherwise imposes taxation on the Bonds or the interest paid thereon may have an adverse effect on the market value or marketability of the Bonds. Changes in Federal Tax Laws
From time to time, there are Presidential proposals, proposals of various federal committees, and legislative proposals in the Congress and in the states that, if enacted, could alter or amend the federal and state tax matters referred to herein or adversely affect the marketability or market value of the Bonds or otherwise prevent holders of the Bonds from realizing the full benefit of the tax exemption of interest on the Bonds. Further, such proposals may impact the marketability or market value of the Bonds simply by being proposed. It cannot be predicted whether or in what form any such proposal might be enacted or whether if enacted it would apply to bonds issued prior to enactment. In addition, regulatory actions are from time to time announced or proposed and litigation is threatened or commenced which, if implemented or concluded in a particular manner, could adversely affect the market value, marketability or tax status of the Bonds. It cannot be predicted whether any such regulatory action will be implemented, how any particular litigation or judicial action will be resolved, or whether the Bonds would be impacted thereby.
Purchasers of the Bonds should consult their tax advisors regarding any pending or proposed legislation, regulatory initiatives
or litigation. The disclosures and opinions expressed herein are based upon existing legislation and regulations as interpreted by relevant judicial and regulatory authorities as of the date of issuance and delivery of the Bonds, and no opinion is expressed as of any date subsequent thereto or with respect to any proposed or pending legislation, regulatory initiatives or litigation. Pennsylvania Tax Matters
On the date of delivery of the Bonds, Bond Counsel will issue an opinion to the effect that under the laws of the
Commonwealth of Pennsylvania (the “Commonwealth”) as presently enacted and construed, the Bonds are exempt from personal property taxes within the Commonwealth and the interest on the Bonds is exempt from the Commonwealth’s Personal Income Tax and the Commonwealth’s Corporate Net Income Tax. See the proposed text of the Opinion of Bond Counsel appended to this Official Statement.
Profits, gains or income derived from the sale, exchange or other disposition of the Bonds are subject to state and local taxation
within the Commonwealth, in accordance with Pennsylvania Act No. 1993-68. Certain maturities of the Bonds may be sold to the public in the initial offering at a price less than their stated redemption price
at maturity (that is, at an “original issue discount”). For Pennsylvania Personal Income Tax purposes, original issue discount on publicly offered obligations is treated under current regulations of the Pennsylvania Department of Revenue as interest and, for purposes of determining taxable gain upon sale or other distribution of an obligation, the interest on which is exempt from income taxation by the Commonwealth, as an adjustment to basis. For Pennsylvania Corporate Net Income Tax purposes, original issue discount is to be accorded similar treatment, according to a Private Letter Ruling issued by the Office of the Chief Counsel of the Pennsylvania Department of Revenue dated December 2, 1993, but such Private Letter Ruling may be relied upon only by the taxpayer to whom it was addressed.
Prospective purchasers of Bonds issued with original issue discount should consult their tax advisors for further information
and advice concerning the reporting of profits, gains or other income related to a sale, exchange or other disposition of such Bonds for Pennsylvania tax purposes.

29
No representation is made or can be made by the School District, or any other party associated with the issuance of the Bonds, as to whether or not any legislation now or hereafter introduced and enacted in the Commonwealth will be applied, either prospectively or retroactively, so as to subject interest on such Bonds to taxation in the Commonwealth or so as to otherwise affect the marketability or market value of such bonds. Enactment of any legislation that subjects the interest on such bonds to state or local taxes in the Commonwealth or otherwise imposes taxation on such Bonds may have an adverse effect on the market value or marketability of such bonds. Federal Income Tax Interest Expense Deductions for Financial Institutions
Under the Internal Revenue Code of 1986, as amended (the “Code”), financial institutions are disallowed 100 percent of their interest expense deductions that are allocable, by a formula, to tax-exempt obligations acquired after August 7, 1986. An exception, which reduces the amount of the disallowance is provided for certain tax-exempt obligations that are designated or “deemed designated” by the issuer as “qualified tax-exempt obligations” under Section 265 of the Code.
Each of the Bonds has been designated as a “qualified tax-exempt obligation” for purposes and effect contemplated by Section 265 of the Code (relating to expenses and interest relating to tax-exempt income of certain financial institutions).
Financial institutions intending to purchase Bonds should consult with their professional tax advisors to determine the effect of
the interest expense disallowance on their federal income tax liability.
CONTINUING DISCLOSURE UNDERTAKING
In accordance with Rule 15-c2-12 (the “Rule”) promulgated by the Securities and Exchange Commission (the “SEC”), the School District (being an “obligated person” with respect to the Bonds, within the meaning of the Rule), will agree to provide certain financial and operating information to the Municipal Rulemaking Board (the “MSRB”) in an electronic format as prescribed by the MSRB, either directly, or indirectly through a designated agent, in accordance with a Continuing Disclosure Certificate, to be signed by the School District, substantially in the form attached hereto as Appendix C.
With respect to the filing of annual financial and operating information, the School District reserves the right to modify from time to time the specific types of information provided or the format of the presentation of such information to the extent necessary or appropriate as a result of a change in legal requirements or a change in the nature of the School District or it operations or financial reporting, but the School District will agree that any such modification will be done in a manner consistent with the Rule.
The School District is required to give notice of certain events as set forth in Section 6 the Continuing Disclosure Certificate (not all of which will be relevant to the School District). The School District may from time to time choose to file notice of other events in addition to those specified in the Continuing Disclosure Certificate, but does not commit to provide notice of the occurrence of any events except those specifically listed in Section 6 of the Continuing Disclosure Certificate.
The School District acknowledges that its undertaking pursuant to the Rule described herein and in the Continuing Disclosure Certificate is intended to be for the benefit of the holders and beneficial owners of the Bonds and shall be enforceable by the older and beneficial owner of the Bonds, but the right of the holders and beneficial owners of the Bonds to enforce the provisions of the School District’s continuing disclosure undertaking shall be limited to a right to obtain specific enforcement, and any failure by the School District to comply with the provisions of the undertaking shall not be an event of default with respect to the Bonds.
The School District’s obligations with respect to continuing disclosure described herein shall terminate upon the prior defeasance, redemption or payment in full of all of the Bonds or if and when the School District is no longer an “obligated person” with respect to the Bonds, within the meaning of the Rule.
The MSRB has been designated by the SEC to be the central and sole repository for continuing disclosure information filed by issuers of municipal securities since July 1, 2009. Information and notices filed by municipal issuers (and other defined “obligated persons”) with respect to municipal securities issues) are made available through the MSRB’s Electronic Municipal Market Access (EMMA) System, which may be access on the internet at http://www.emma.msrb.org.

30
Continuing Disclosure Filing History
The School District has entered into prior undertakings to provide information pursuant to previous continuing disclosure certificates for other outstanding bond issues. The following table provides information regarding annual filing deadlines and history of filings for the financial information, operating data and material event notices specified in previous continuing disclosure undertakings during the past five years:
Fiscal Year Filing Financial Statements Budget Operating Data
Ending Deadline [1] Filing Date EMMA ID [2] Filing Date EMMA ID [2] Filing Date EMMA ID [2]
6/30/2012 12/27/2012 7/8/2013 [3] EA466432 12/06/2012 EP588966 9/19/2014 EP664194
6/30/2013 12/27/2013 12/18/2013 ER594251 12/18/2013 [4] ER594251 9/19/2014 EP664196
6/30/2014 12/27/2014 12/16/2014 EP674031 12/16/2014 EP674036 12/16/2014 EP674039
6/30/2015 12/27/2015 12/10/2015 EP709068 12/10/2015 EP709080 12/10/2015 EP709075
6/30/2016 12/27/2016 12/12/2016 ES786315 12/12/2016 ES786317 12/12/2016 ES786316
Notes:
[1] For these purposes, assumes the shortest filing deadline of the School District’s previous Continuing Disclosure Agreements in effect during the past five years.
[2] Submission ID is the EMMA Submission ID for each filing. To access a filing, insert the Submission ID to the end of the web address below:
http://emma.msrb.org/ContinuingDisclosureView/ContinuingDisclosureDetails.aspx?submissionId=
[3] Filing of Audited Financial Statements. The District did file its PDE 2057 Annual Financial Report on December 6, 2012 (EMMA ID #EP588966) as an interim filing.
[4] Labeled as the June 30, 2013 budget; however, when the Adobe PDF is launched it is the June 30, 2014 budget.
As outlined in the table above, the School District failed to provide certain annual financial information in a timely manner
during the past five (5) years, as well as “Failure to Timely File Annual Information” notices to the MSRB’s EMMA System. The District recently filed a clarification filing detailing the instances of the past filing failures, and, where appropriate, filed Failure to Timely File Notices. For its fiscal year June 30, 2012, the School District failed to file its Audited Financial Statements in a timely manner; however, it did timely file its PDE-2057 Annual Financial Report for the fiscal year ending June 30, 2012. For fiscal years June 30, 2012 through and including June 30, 2013, the School District failed to file its specified operating data in a timely manner.
With regards to the material events listed in the Continuing Disclosure Certificate, attached hereto as Appendix C, some of the
School District’s bond issues outstanding during the past five (5) years were insured by various bond insurance companies whose ratings by both S&P and Moody’s changed during that period. This information was publicly available from widely accepted information sources at the time of their respective downgrades or upgrades. For informational purposes, the School District filed a summary of rating upgrades and downgrades relating to such bond insurance companies.
Future Continuing Disclosure Compliance
As detailed above, the School District has reviewed its continuing disclosure obligations and corresponding submissions. Upon
discovering any omissions with respect to these filings, the School District acted to bring its continuing disclosure information current, and disclose those omissions as described above. Currently, the School District is not aware of any other outstanding past-due continuing disclosure filings.
In an effort to augment the School District’s procedures and policies intended to maintain future compliance, the School
District has adopted steps intended to facilitate future compliance with its Continuing Disclosure Certificates. These procedures include implementing the MSRB’s EMMA’s internal notification system whereby the School District has set-up email reminders a month in advance for all of the School District’s annual disclosure filings and coordinating filing and event information with the School District’s financial advisor.
A member of the School District’s Director of Business Affairs has been designated as the “compliance officer” responsible for
overseeing ongoing continuing disclosure compliance. Members of the School District’s business office will seek to participate in ongoing continuing education regarding continuing disclosure undertaking if offered by local groups or affiliated organizations such as PASBO, etc. The School District may communicate with its financial advisor, underwriter(s), bond counsel, or solicitor regarding any questions or concerns regarding ongoing continuing disclosure compliance. The School District will also communicate with its local auditor and advise of the School District’s need for financial statements in a timely manner. In the event audited financial statements are not available by the filing deadline, the School District will file with EMMA, if available, its PDE-2057 Annual Financial Report as an interim filing until such audited financial statements are available. Some of the operating data requirements may be found contained within the School District’s financial statements or budget filing and may not be filed separately.

31
RATING
Moody’s Investors Service has assigned an underlying municipal Bond rating of “Aaa, (Stable Outlook)” to the Bonds. Such rating reflects only the view of such organization and any desired explanation of the significance of such rating should be obtained from the rating agency furnishing the same, at the following address: Moody’s Investors Service, 7 World Trade Center, 250 Greenwich Street, New York, New York 10007. Generally, a rating agency bases its rating on the information and materials furnished to it and on investigations, studies and assumptions of its own. There is no assurance that any such rating will continue for any given period of time or that it will not be revised downward or withdrawn entirely by the rating agency, if circumstances so warrant. Any such downward revision or withdrawal of such rating may have an adverse effect on the market price of the Bonds.
UNDERWRITING
The Underwriter has agreed to purchase the Bonds for a purchase price of $9,664,385.40, equal to the par value of the Bonds
less an underwriters’ discount of $68,250.00, less net original issue discount of $17,364.60.
LEGAL OPINIONS
The Bonds are offered when, as and if issued, subject to withdrawal or modification of the offer without notice, and subject to the approving legal opinion of Rhoads & Sinon LLP, Harrisburg, Pennsylvania, Bond Counsel to the School District, to be furnished upon delivery of the Bonds. Certain other legal matters will be passed upon for the School District by Unruh, Turner, Burke & Frees, P.C, of West Chester, Pennsylvania, School District Solicitor.
Neither the Bond Counsel nor the Solicitor has been engaged to verify, and has not independently verified, the accuracy,
completeness or truthfulness of any statements, certifications or financial information set forth in this Official Statement, or otherwise used in connection with the offer and sale of the Bonds set forth in or delivered by the School District officials, except where specifically referred to. They express no opinion with respect to whether the School District in connection with the sale of the Bonds or preparation of this Official Statement has made any untrue statement of a material fact necessary in order to make any statement made therein not misleading.
The various legal opinions to be delivered concurrently with the delivery of the Bonds express the professional judgement of
the attorneys rendering the opinions as to the legal issues explicitly addressed therein. In rendering a legal opinion, the attorneys do not become an insurer or guarantor of that expression of professional judgement of the transaction opined upon, or the future performance of the parties to the transaction. Nor does rendering a legal opinion guarantee the outcome of any legal dispute that may arise out of the transaction.
FINANCIAL ADVISOR
The School District has retained PFM Financial Advisors LLC, Harrisburg, Pennsylvania, as financial advisor (the “Financial
Advisor”) in connection with the preparation, authorization and issuance of the Bonds. The Financial Advisor is not obligated to undertake, and has not undertaken to make, an independent verification or to assume responsibility for the accuracy, completeness, or fairness of the information contained in the Official Statement. PFM Financial Advisors LLC is an independent advisory firm and is not engaged in the business of underwriting, trading or distributing municipal securities or other public securities.
MISCELLANEOUS
This Official Statement has been prepared under the direction of the School District by PFM Financial Advisors LLC,
Harrisburg, Pennsylvania, in its capacity as Financial Advisor to the School District. The information set forth in this Official Statement has been obtained from the School District and from other sources believed to be reliable. Insofar as any statement herein includes matters of opinion or estimates about future conditions, it is not intended as representation of fact, and there is no guarantee that it is, or will be, realized. Summaries or descriptions of provisions of the Bonds, the Resolution, and all references to other materials not purporting to be quoted in full are only brief outlines of some of the provisions thereof. Reference is hereby made to the complete documents, copies of which will be furnished by the School District or the Financial Advisor upon request. The information assembled in this Official Statement is not to be construed as a contract with holders of the Bonds.
The School District has authorized the distribution of this Official Statement. WEST CHESTER AREA SCHOOL DISTRICT Chester and Delaware Counties, Pennsylvania By: /s/ Dr. Ricky Swalm President, Board of School Directors

[ THIS PAGE INTENTIONALLY LEFT BLANK ]

APPENDIX A Demographic and Economic Information
Relating to the West Chester Area School District

[ THIS PAGE INTENTIONALLY LEFT BLANK ]
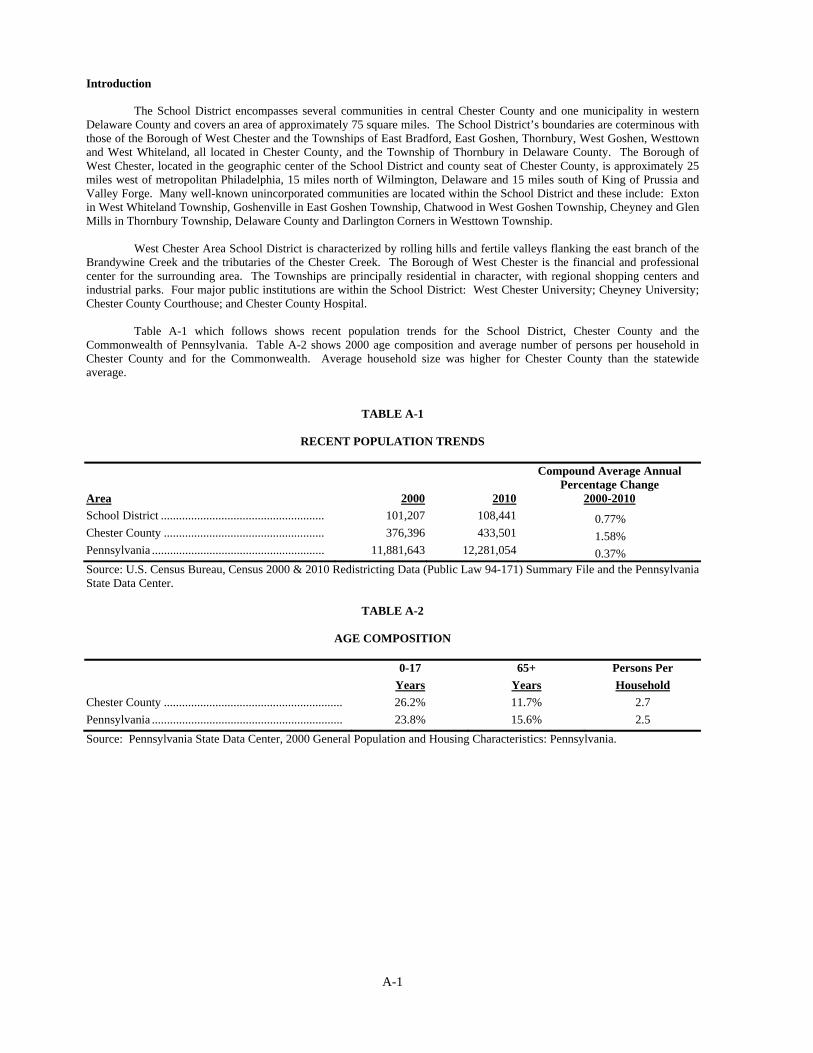
A-1
Introduction The School District encompasses several communities in central Chester County and one municipality in western Delaware County and covers an area of approximately 75 square miles. The School District’s boundaries are coterminous with those of the Borough of West Chester and the Townships of East Bradford, East Goshen, Thornbury, West Goshen, Westtown and West Whiteland, all located in Chester County, and the Township of Thornbury in Delaware County. The Borough of West Chester, located in the geographic center of the School District and county seat of Chester County, is approximately 25 miles west of metropolitan Philadelphia, 15 miles north of Wilmington, Delaware and 15 miles south of King of Prussia and Valley Forge. Many well-known unincorporated communities are located within the School District and these include: Exton in West Whiteland Township, Goshenville in East Goshen Township, Chatwood in West Goshen Township, Cheyney and Glen Mills in Thornbury Township, Delaware County and Darlington Corners in Westtown Township. West Chester Area School District is characterized by rolling hills and fertile valleys flanking the east branch of the Brandywine Creek and the tributaries of the Chester Creek. The Borough of West Chester is the financial and professional center for the surrounding area. The Townships are principally residential in character, with regional shopping centers and industrial parks. Four major public institutions are within the School District: West Chester University; Cheyney University; Chester County Courthouse; and Chester County Hospital. Table A-1 which follows shows recent population trends for the School District, Chester County and the Commonwealth of Pennsylvania. Table A-2 shows 2000 age composition and average number of persons per household in Chester County and for the Commonwealth. Average household size was higher for Chester County than the statewide average.
TABLE A-1
RECENT POPULATION TRENDS
Compound Average Annual
Percentage ChangeArea 2000 2010 2000-2010
School District ...................................................... 101,207 108,441 0.77% Chester County ..................................................... 376,396 433,501 1.58% Pennsylvania ......................................................... 11,881,643 12,281,054 0.37% Source: U.S. Census Bureau, Census 2000 & 2010 Redistricting Data (Public Law 94-171) Summary File and the Pennsylvania State Data Center.
TABLE A-2
AGE COMPOSITION
0-17 65+ Persons Per
Years Years Household
Chester County ........................................................... 26.2% 11.7% 2.7
Pennsylvania ............................................................... 23.8% 15.6% 2.5
Source: Pennsylvania State Data Center, 2000 General Population and Housing Characteristics: Pennsylvania.
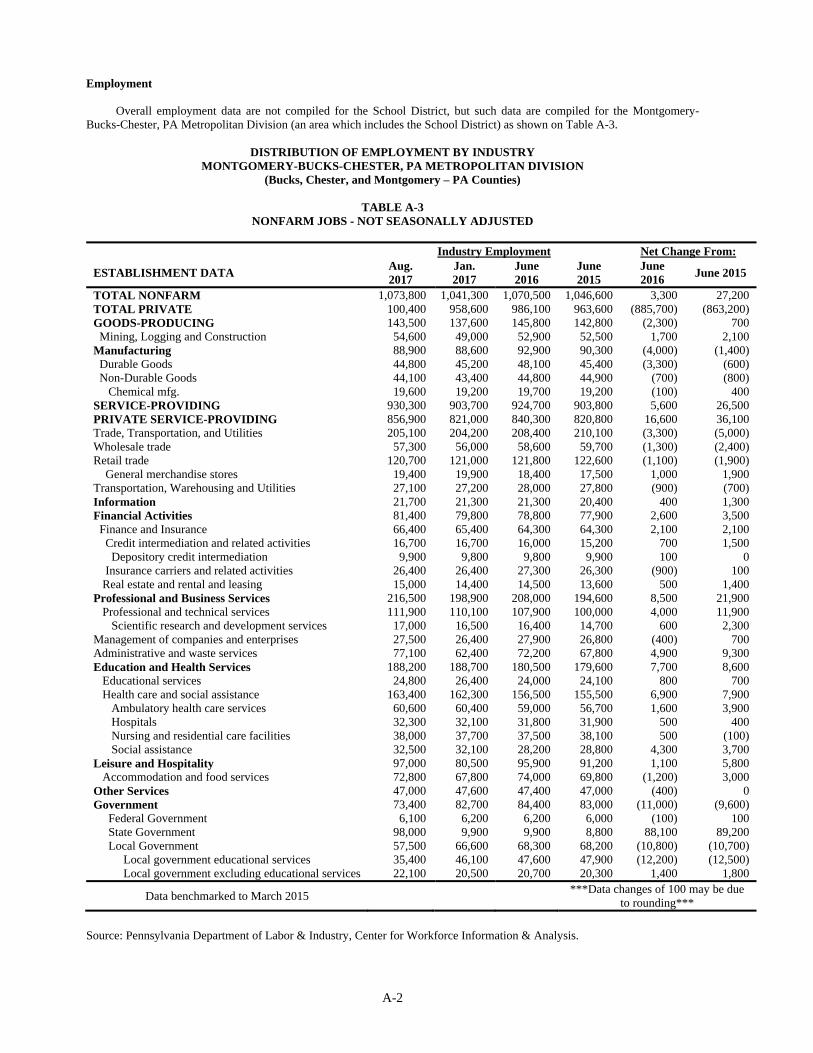
A-2
Employment
Overall employment data are not compiled for the School District, but such data are compiled for the Montgomery-Bucks-Chester, PA Metropolitan Division (an area which includes the School District) as shown on Table A-3.
DISTRIBUTION OF EMPLOYMENT BY INDUSTRY MONTGOMERY-BUCKS-CHESTER, PA METROPOLITAN DIVISION
(Bucks, Chester, and Montgomery – PA Counties)
TABLE A-3 NONFARM JOBS - NOT SEASONALLY ADJUSTED
Industry Employment Net Change From:
ESTABLISHMENT DATA Aug. 2017
Jan. 2017
June 2016
June 2015
June 2016
June 2015
TOTAL NONFARM 1,073,800 1,041,300 1,070,500 1,046,600 3,300 27,200 TOTAL PRIVATE 100,400 958,600 986,100 963,600 (885,700) (863,200) GOODS-PRODUCING 143,500 137,600 145,800 142,800 (2,300) 700 Mining, Logging and Construction 54,600 49,000 52,900 52,500 1,700 2,100 Manufacturing 88,900 88,600 92,900 90,300 (4,000) (1,400) Durable Goods 44,800 45,200 48,100 45,400 (3,300) (600) Non-Durable Goods 44,100 43,400 44,800 44,900 (700) (800) Chemical mfg. 19,600 19,200 19,700 19,200 (100) 400 SERVICE-PROVIDING 930,300 903,700 924,700 903,800 5,600 26,500 PRIVATE SERVICE-PROVIDING 856,900 821,000 840,300 820,800 16,600 36,100 Trade, Transportation, and Utilities 205,100 204,200 208,400 210,100 (3,300) (5,000) Wholesale trade 57,300 56,000 58,600 59,700 (1,300) (2,400) Retail trade 120,700 121,000 121,800 122,600 (1,100) (1,900) General merchandise stores 19,400 19,900 18,400 17,500 1,000 1,900 Transportation, Warehousing and Utilities 27,100 27,200 28,000 27,800 (900) (700) Information 21,700 21,300 21,300 20,400 400 1,300 Financial Activities 81,400 79,800 78,800 77,900 2,600 3,500 Finance and Insurance 66,400 65,400 64,300 64,300 2,100 2,100 Credit intermediation and related activities 16,700 16,700 16,000 15,200 700 1,500 Depository credit intermediation 9,900 9,800 9,800 9,900 100 0 Insurance carriers and related activities 26,400 26,400 27,300 26,300 (900) 100 Real estate and rental and leasing 15,000 14,400 14,500 13,600 500 1,400 Professional and Business Services 216,500 198,900 208,000 194,600 8,500 21,900 Professional and technical services 111,900 110,100 107,900 100,000 4,000 11,900 Scientific research and development services 17,000 16,500 16,400 14,700 600 2,300 Management of companies and enterprises 27,500 26,400 27,900 26,800 (400) 700 Administrative and waste services 77,100 62,400 72,200 67,800 4,900 9,300 Education and Health Services 188,200 188,700 180,500 179,600 7,700 8,600 Educational services 24,800 26,400 24,000 24,100 800 700 Health care and social assistance 163,400 162,300 156,500 155,500 6,900 7,900 Ambulatory health care services 60,600 60,400 59,000 56,700 1,600 3,900 Hospitals 32,300 32,100 31,800 31,900 500 400 Nursing and residential care facilities 38,000 37,700 37,500 38,100 500 (100) Social assistance 32,500 32,100 28,200 28,800 4,300 3,700 Leisure and Hospitality 97,000 80,500 95,900 91,200 1,100 5,800 Accommodation and food services 72,800 67,800 74,000 69,800 (1,200) 3,000 Other Services 47,000 47,600 47,400 47,000 (400) 0 Government 73,400 82,700 84,400 83,000 (11,000) (9,600) Federal Government 6,100 6,200 6,200 6,000 (100) 100 State Government 98,000 9,900 9,900 8,800 88,100 89,200 Local Government 57,500 66,600 68,300 68,200 (10,800) (10,700) Local government educational services 35,400 46,100 47,600 47,900 (12,200) (12,500) Local government excluding educational services 22,100 20,500 20,700 20,300 1,400 1,800
Data benchmarked to March 2015 ***Data changes of 100 may be due
to rounding***
Source: Pennsylvania Department of Labor & Industry, Center for Workforce Information & Analysis.

A-3
Chester County Top 25 Employers 4th Quarter 2016
Initial Data Federal and State Government Entities Aggregated
1 VANGUARD GROUP INC 2 QVC NETWORK INC 3 COUNTY OF CHESTER 4 FEDERAL GOVERNMENT 5 THE CHESTER COUNTY HOSPITAL 6 MAIN LINE HOSPITALS INC 7 GIANT FOOD STORES LLC 8 CERNER HEALTH SERVICES INC 9 PA STATE SYSTEM OF HIGHER EDUCATION 10 THE DEVEREUX FOUNDATION 11 UNITED PARCEL SERVICE INC 12 YMCA OF GREATER BRANDYWINE VALLEY 13 DOWNINGTOWN AREA SCHOOL DISTRICT 14 WEST CHESTER AREA SCHOOL DISTRICT 15 CHESTER COUNTY INTERMEDIATE 16 WAWA INC 17 JANSSEN RESEARCH & DEVELOPMENT LLC 18 WAL-MART ASSOCIATES INC 19 STATE GOVERNMENT* 20 COMCAST CABLEVISION CORP(PA) 21 GEORGE KRAPF JR & SONS INC 22 ACME MARKETS INC 23 WEGMANS FOOD MARKETS INC 24 COMMUNICATIONS TEST DESIGN INC. 25 ADDECCO USA INC.
*State Government includes all state employment except Pennsylvania State University, SEPTA, System of Higher Education, PA College of Technology, and PHEAA.
Source: Center for Workforce Information & Analysis
Table A-4 shows recent trends in labor force, employment and unemployment for Chester County and the Commonwealth.
TABLE A-4
TRENDS IN LABOR FORCE, EMPLOYMENT AND UNEMPLOYMENT NOT SEASONALLY ADJUSTED
Chester County
Time Period Labor Force Employed Unemployed Unemployment Rate 2011 266,600 250,100 16,500 6.20% 2012 270,300 253,600 16,700 6.20% 2013 271,800 256,000 15,800 5.80% 2014 272,300 261,000 11,200 4.10% 2015 276,400 266,200 10,200 3.70%
July 2017 289,800 278,000 11,800 4.10%
Pennsylvania
Time Period Labor Force Employed Unemployed Unemployment Rate 2011 6,397,000 5,885,000 512,000 8.00% 2012 6,466,000 5,954,000 513,000 7.90% 2013 6,460,000 5,982,000 478,000 7.40% 2014 6,352,000 6,033,000 319,000 5.00% 2015 6,424,000 6,094,000 330,000 5.10%
July 2017 6,534,000 6,186,000 349,000 5.30%
Source: Pennsylvania Department of Labor and Industry, Center for Workforce Information and Analysis website.

A-4
Income
The data on Table A-5 shows recent trends in per capita income for the School District, Chester County and the Commonwealth over the 2000-2009 period.
TABLE A-5
RECENT TRENDS IN PER CAPITA INCOME*
Percentage Change 2000 2009 2000-2009
School District .......................................................... $35,713 $41,433 1.66% Chester County ......................................................... 20,601 31,627 4.88% Pennsylvania ............................................................. 14,068 20,880 4.49%
*Income is defined by the Bureau of the Census as the sum of wage and salary income, non-farm self-employment income, net self-employment income, Social Security and Railroad retirement income, public assistance income, interest, dividends, pensions, etc. before deductions for personal income taxes, Social Security, etc. School District income is the population-weighted average for political subdivisions. Source: 2000: U.S. Census Bureau, Summary File 1 (SF 1) and Summary File 3 (SF 3) & 2009: U.S. Census Bureau, 2005-2009 American Community Survey. Commercial Activity
Commercial activity within the School District is centered in the Borough of West Chester and in large shopping centers, including Exton Square and the West Goshen Shopping Center.
Exton Square, a large shopping mall, includes many major shops and the Chester County Library centered around three anchored major retail stores. The enclosed mall is situated four miles north of the Borough of West Chester at the intersection of U.S. Route 30 and 100. Other large shopping centers include: Fairfield Place and Whiteland Towne Center.
Table A-6 shows retail sales for the 2012-2016 period for the County, the PMSA and the Commonwealth.
TABLE A-6
TOTAL RETAIL SALES (000)
2012 2013 2014 2015 2016 Chester County ........................ $ 12,210,801 $ 8,705,297 $ 12,708,571 $ 12,869,709 $ 11,499,691 PMSA ...................................... 94,890,513 89,309,763 91,259,939 92,944,956 96,525,422 Pennsylvania ............................ 188,149,727 187,412,600 199,975,257 198,215,135 207,887,941
Source: The Nielsen Company.
Housing Housing construction has progressed in an orderly fashion during the past decade as former agricultural land has been
developed in accordance with strict zoning guidelines. The School District contains some of the finest single-family residential housing in the greater Delaware Valley area. Most new home construction taking place in the School District is in the $555,000 median price range. The median selling price of all housing within the School District during 2017 was $325,000, as compared with Chester County as a whole of $299,000, according to the Chester County Planning Commission.
Educational Institutions
West Chester University and Cheyney University are located within the School District. Both universities are run by the
Commonwealth of Pennsylvania. West Chester University, which is located in the Borough of West Chester and West Goshen Township, is a multi-purpose university. Cheyney University is located in Thornbury Township, Delaware and Chester Counties. Both universities provide a liberal arts education.
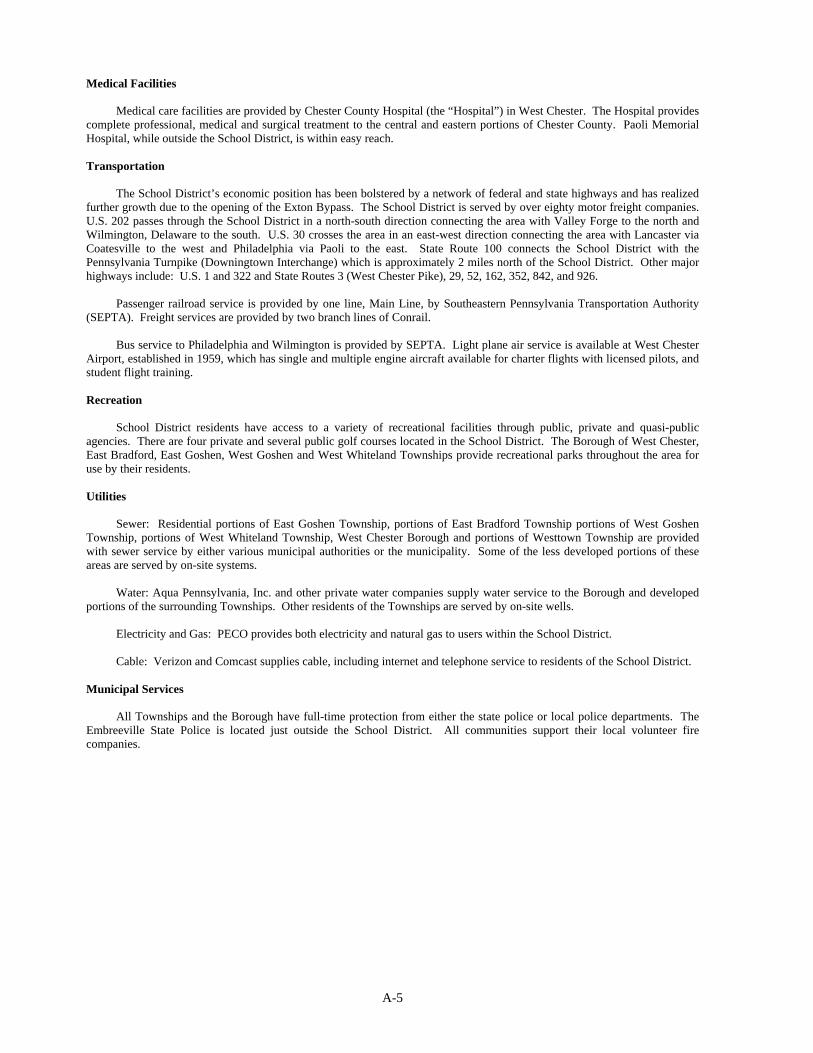
A-5
Medical Facilities
Medical care facilities are provided by Chester County Hospital (the “Hospital”) in West Chester. The Hospital provides complete professional, medical and surgical treatment to the central and eastern portions of Chester County. Paoli Memorial Hospital, while outside the School District, is within easy reach. Transportation
The School District’s economic position has been bolstered by a network of federal and state highways and has realized further growth due to the opening of the Exton Bypass. The School District is served by over eighty motor freight companies. U.S. 202 passes through the School District in a north-south direction connecting the area with Valley Forge to the north and Wilmington, Delaware to the south. U.S. 30 crosses the area in an east-west direction connecting the area with Lancaster via Coatesville to the west and Philadelphia via Paoli to the east. State Route 100 connects the School District with the Pennsylvania Turnpike (Downingtown Interchange) which is approximately 2 miles north of the School District. Other major highways include: U.S. 1 and 322 and State Routes 3 (West Chester Pike), 29, 52, 162, 352, 842, and 926.
Passenger railroad service is provided by one line, Main Line, by Southeastern Pennsylvania Transportation Authority (SEPTA). Freight services are provided by two branch lines of Conrail.
Bus service to Philadelphia and Wilmington is provided by SEPTA. Light plane air service is available at West Chester Airport, established in 1959, which has single and multiple engine aircraft available for charter flights with licensed pilots, and student flight training. Recreation
School District residents have access to a variety of recreational facilities through public, private and quasi-public agencies. There are four private and several public golf courses located in the School District. The Borough of West Chester, East Bradford, East Goshen, West Goshen and West Whiteland Townships provide recreational parks throughout the area for use by their residents. Utilities
Sewer: Residential portions of East Goshen Township, portions of East Bradford Township portions of West Goshen Township, portions of West Whiteland Township, West Chester Borough and portions of Westtown Township are provided with sewer service by either various municipal authorities or the municipality. Some of the less developed portions of these areas are served by on-site systems.
Water: Aqua Pennsylvania, Inc. and other private water companies supply water service to the Borough and developed portions of the surrounding Townships. Other residents of the Townships are served by on-site wells.
Electricity and Gas: PECO provides both electricity and natural gas to users within the School District.
Cable: Verizon and Comcast supplies cable, including internet and telephone service to residents of the School District. Municipal Services
All Townships and the Borough have full-time protection from either the state police or local police departments. The Embreeville State Police is located just outside the School District. All communities support their local volunteer fire companies.

[ THIS PAGE INTENTIONALLY LEFT BLANK ]

APPENDIX B Form of Opinion of Bond Counsel

[ THIS PAGE INTENTIONALLY LEFT BLANK ]

[LETTERHEAD OF BOND COUNSEL]
1058374.1
[Date of Delivery]
Re: WEST CHESTER AREA SCHOOL DISTRICT, Chester and Delaware Counties, Pennsylvania
$9,750,000 Aggregate Principal Amount of General Obligation Bonds, Series A of 2017
___________
OPINION ___________
We have acted as Bond Counsel in connection with the issuance of the General Obligation Bonds, Series A of 2017, in the aggregate principal amount of Nine Million Seven Hundred Fifty Thousand Dollars ($9,750,000) (the “Bonds”), by West Chester Area School District, in Chester and Delaware Counties, Pennsylvania (the “School District”), a public school district of the Commonwealth of Pennsylvania (the “Commonwealth”).
The Board of School Directors of the School District, by a resolution (the “Resolution”), has authorized and secured the issuance of the Bonds. The Resolution provides that the proceeds of the Bonds will be used to plan, design, acquire, construct, furnish and equip additions and improvements to the School District’s existing elementary schools, and to the extent of remaining funds, other buildings and facilities of the School District, and pay the costs of issuing the Bonds, all in accordance with the Local Government Unit Debt Act, 53 Pa.C.S. Chs. 80-82 (the “Act”), of the Commonwealth.
The Resolution contains covenants of the School District to comply with the Internal Revenue Code of 1986, as amended (the “Code”), and applicable regulations promulgated thereunder, to preserve the Federal income tax exemption of the interest on the Bonds. The School District has taken appropriate action to qualify the Bonds as “qualified tax-exempt obligations,” as defined in Section 265(b)(3)(B) of the Code.
As Bond Counsel, we have examined, among other things: the proceedings related to the Bonds, as filed with the Department of Community and Economic Development; an executed counterpart of the Resolution; a certificate of no litigation; a non-arbitrage and rebate compliance certificate of the School District; and usual closing certificates and documents. We have also examined the executed Bonds, and assume that the Bonds, and any separate Bonds that may, from time to time, be issued in exchange therefor, will at all times be issued in registered form as required by the Resolution.
B-1

[Date of Delivery] Page 2
As to questions of fact material to our opinion, we have relied upon the certified proceedings and other certifications of public officials furnished to us without undertaking to verify such facts by independent investigation.
Based on the foregoing, we are of the opinion that:
1. The Bonds are valid and binding general obligations of the School District enforceable in accordance with its terms.
2. The School District has covenanted, in the Resolution, to and with registered owners, from time to time, of the Bonds that shall be outstanding, from time to time, pursuant to the Resolution, that the School District: (i) shall include the amount of the debt service for the Bonds, for each fiscal year of the School District in which such sum is payable, in its budget for that year, (ii) shall appropriate such amounts from its general revenues for the payment of such debt service, and (iii) shall duly and punctually pay or cause to be paid from the sinking fund established under the Resolution or any other of its revenues or funds the principal of and interest on the Bonds at the dates and place and in the manner stated in the Bonds, according to the true intent and meaning thereof; and, for such budgeting, appropriation and payment, the School District has pledged, irrevocably, its full faith, credit, and taxing power.
3. Under the laws of the Commonwealth as presently enacted and construed, the Bonds are exempt from personal property taxes in the Commonwealth and the interest on the Bonds is exempt from the Commonwealth’s Personal Income Tax and the Commonwealth’s Corporate Net Income Tax.
4. Assuming investment and application of the proceeds of the Bonds as set forth in the Resolution and the aforementioned non-arbitrage and rebate compliance certificate, the Bonds are not presently an “arbitrage bonds” as described in Section 103(b)(2) and Section 148 of the Code and applicable regulations promulgated thereunder.
5. Under present statutes, regulations and judicial decisions, interest on the Bonds is excluded from gross income for purposes of federal income taxation and is not an item of tax preference for purposes of the federal alternative minimum tax imposed on individuals and corporations, although it should be noted that in the case of corporations (as defined for federal income tax purposes) such interest is taken into account in determining adjusted current earnings for purposes of such alternative minimum tax. The opinions expressed in this paragraph are subject to the condition that the School District comply with all requirements of the Code that must be satisfied subsequent to the issuance of the Bonds in order that the interest thereon be, or continue to be, excluded from gross income for federal income tax purposes, as the School District has covenanted to do in the Resolution and other aforementioned documents. Failure to comply with certain of such requirements may cause the inclusion of interest on the Bonds in gross income retroactive to the date of issuance of the Bonds.
B-2

[Date of Delivery] Page 3
6. Each of the Bonds is a “qualified tax-exempt obligation” for purposes and effect contemplated by Section 265 of the Code (relating to expenses and interest relating to tax-exempt income of certain financial institutions). The opinion expressed in the preceding sentence is subject to the condition that interest on the Bonds is, and continues to be, excluded from gross income for federal income tax purposes under the Code.
We express no opinion regarding other federal tax consequences arising with respect to the Bonds.
It is to be understood that rights of holders of the Bonds and the enforceability thereof may be subject to bankruptcy, insolvency, reorganization, moratorium, and other similar laws affecting creditors’ rights heretofore or hereafter enacted and that their enforcement may be subject to the exercise of judicial discretion in accordance with general principles of equity.
Very truly yours,
B-3

[ THIS PAGE INTENTIONALLY LEFT BLANK ]

APPENDIX C Form of Continuing Disclosure Certificate

[ THIS PAGE INTENTIONALLY LEFT BLANK ]
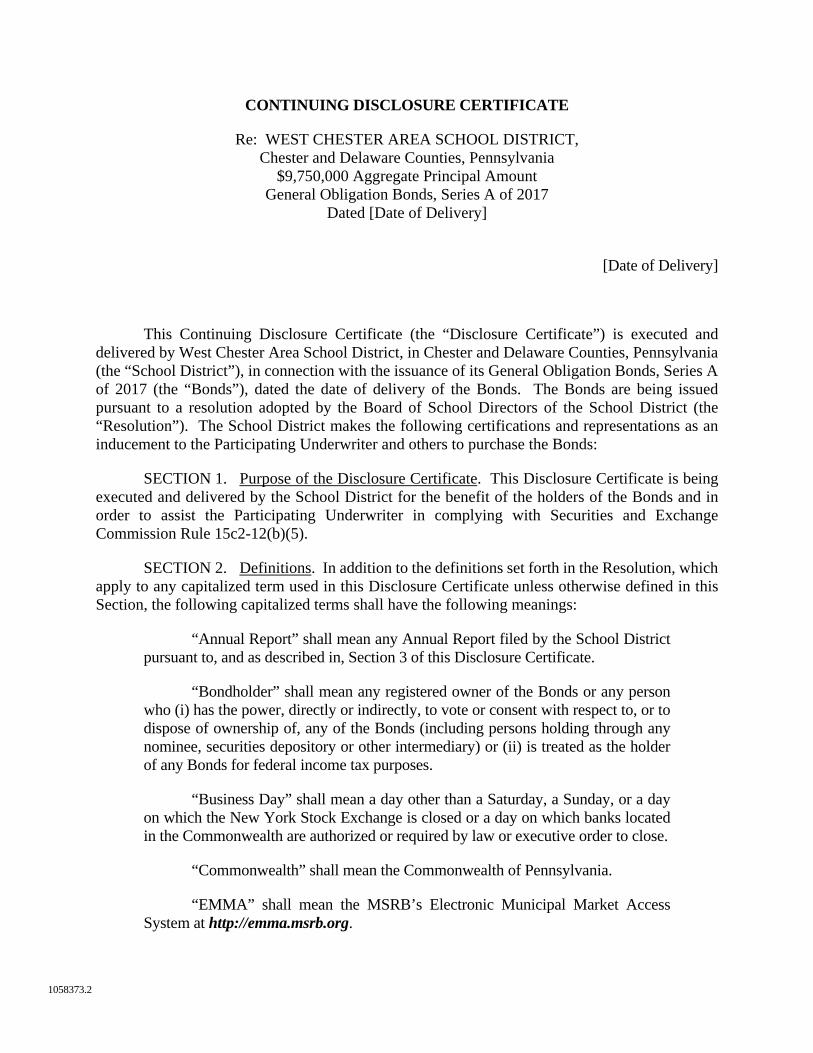
1058373.2
CONTINUING DISCLOSURE CERTIFICATE
Re: WEST CHESTER AREA SCHOOL DISTRICT, Chester and Delaware Counties, Pennsylvania
$9,750,000 Aggregate Principal Amount General Obligation Bonds, Series A of 2017
Dated [Date of Delivery]
[Date of Delivery]
This Continuing Disclosure Certificate (the “Disclosure Certificate”) is executed and delivered by West Chester Area School District, in Chester and Delaware Counties, Pennsylvania (the “School District”), in connection with the issuance of its General Obligation Bonds, Series A of 2017 (the “Bonds”), dated the date of delivery of the Bonds. The Bonds are being issued pursuant to a resolution adopted by the Board of School Directors of the School District (the “Resolution”). The School District makes the following certifications and representations as an inducement to the Participating Underwriter and others to purchase the Bonds:
SECTION 1. Purpose of the Disclosure Certificate. This Disclosure Certificate is being executed and delivered by the School District for the benefit of the holders of the Bonds and in order to assist the Participating Underwriter in complying with Securities and Exchange Commission Rule 15c2-12(b)(5).
SECTION 2. Definitions. In addition to the definitions set forth in the Resolution, which apply to any capitalized term used in this Disclosure Certificate unless otherwise defined in this Section, the following capitalized terms shall have the following meanings:
“Annual Report” shall mean any Annual Report filed by the School District pursuant to, and as described in, Section 3 of this Disclosure Certificate.
“Bondholder” shall mean any registered owner of the Bonds or any person who (i) has the power, directly or indirectly, to vote or consent with respect to, or to dispose of ownership of, any of the Bonds (including persons holding through any nominee, securities depository or other intermediary) or (ii) is treated as the holder of any Bonds for federal income tax purposes.
“Business Day” shall mean a day other than a Saturday, a Sunday, or a day on which the New York Stock Exchange is closed or a day on which banks located in the Commonwealth are authorized or required by law or executive order to close.
“Commonwealth” shall mean the Commonwealth of Pennsylvania.
“EMMA” shall mean the MSRB’s Electronic Municipal Market Access System at http://emma.msrb.org.
- 2 -
“Listed Events” shall mean any of the events listed in Section 5 of this Disclosure Certificate.
“MSRB” shall mean the Municipal Securities Rulemaking Board. As of the date of this Disclosure Certificate, the rules of the MSRB require all filings described herein shall be made using EMMA.
“Official Statement” shall mean the final official statement relating to the Bonds prepared by or on behalf of the School District and distributed in connection with the offering and sale of the Bonds by the Participating Underwriter.
“Participating Underwriter” shall mean any of the original underwriter of the Bonds required to comply with the Rule in connection with the primary offering of the Bonds.
“Rule” shall mean Rule 15c2-12(b)(5) adopted by the SEC under the Securities Exchange Act of 1934, as the same may be amended from time to time.
“SEC” shall mean the United States Securities and Exchange Commission.
SECTION 3. Filing of Annual Reports. The School District agrees to file with the MSRB:
(a) Financial Information. Annually, beginning on April 1, 2018, and on each April 1 thereafter, the following financial information and operating information pertaining to the School District:
(1) financial statements for the most recent fiscal year, prepared in accordance with generally accepted accounting principles for local government units;
(2) a summary of the budget for the then current fiscal year;
(3) the total assessed value and aggregate market value of all taxable real estate for the then current fiscal year;
(4) the taxes and millage rates imposed for the then current fiscal year;
(5) the real property tax collection results for the most recent fiscal year, including (a) the real estate levy imposed (expressed both as a millage rate and an aggregate dollar amount), (b) the dollar amount of real estate taxes collected that represented current collections (expressed as an aggregate dollar amount), (c) the amount of real estate taxes collected that represented taxes levied in prior years (expressed as an aggregate dollar amount), and (d) the total amount of real estate taxes collected (expressed as an aggregate dollar amount);
(b) Audited Financial Statements. If not submitted as part of the annual financial information of the School District in accordance with subparagraph (a) above, then when and if available, audited financial statements of the School District for its most recent completed fiscal year.
- 3 -
Each Annual Report may be submitted as a single document or as separate documents comprising a package, and may cross-reference other information, as provided in this Section of this Disclosure Certificate; provided, however, that if the audited financial statements of the School District for the most recent completed fiscal year are not available to be included in the Annual Report when filed, such audited financial statements may be filed separately from the balance of the Annual Report, as provided in the following paragraph.
Any or all of the items listed above may be incorporated by reference from other documents, including official statements of debt issues of the School District or related public entities, which have been made available to the public on the MSRB’s internet website or filed with the SEC. The School District shall identify each other document so incorporated by reference.
If the audited financial statements of the School District for the most recent fiscal years are not available as of the date on which the Annual Report is to be filed, the audited financial statements shall be filed with the MSRB as soon as they are available, and the Annual Report when filed, shall contain a statement to that effect and a statement of the date by which the School District reasonably expects the audited financial statements to become available and to be filed with the MSRB.
The School District reserves the right to modify from time to time the specific types of information provided or the format of the presentation of such information to the extent necessary or appropriate as a result of a change in legal requirements or a change in the nature of the School District or its operations or financial reporting, but the School District will agree that any such modification will be done in a manner consistent with the Rule.
SECTION 4. Notices of Late Filing of Annual Information. If the School District has failed to file, or is unable to file, an Annual Report with the MSRB within the time set forth in Section 3 above, the School District will file, in a timely manner, a notice with the MSRB stating such fact and, if appropriate, the date by which the School District expects to file the Annual Report.
SECTION 5. Reporting of Listed Events. In a timely manner not in excess of ten (10) Business Days after the occurrence of the event, the School District will file with the MSRB notice of the occurrence of any of the following events with respect to the Bonds:
(a) principal and interest payment delinquencies; (b) non-payment related defaults, if material; (c) unscheduled draws on debt service reserves reflecting financial difficulties; (d) unscheduled draws on credit enhancements reflecting financial difficulties; (e) substitution of credit or liquidity providers, or their failure to perform; (f) adverse tax opinions, the issuance by the Internal Revenue Service of proposed
or final determinations of taxability, Notices of Proposed Issue (IRS Form 5701-TEB) or other material notices or determinations with respect to the tax-exempt status of the Bonds, or other material events affecting the tax-exempt status of the Bonds;
(g) modifications to rights of holders of the Bonds, if material; (h) bond calls, if material, and tender offers;

- 4 -
(i) defeasances; (j) release, substitution, or sale of property securing repayment of the Bonds, if
material; (k) rating changes; (l) bankruptcy, insolvency, receivership or similar event of the School District; (m) the consummation of a merger, consolidation, or acquisition involving the
School District or the sale of all or substantially all of the assets of the School District, other than in the ordinary course of business, the entry into a definitive agreement to undertake such an action or the termination of a definitive agreement relating to any such actions, other than pursuant to its terms, if material; and
(n) appointment of a successor or additional trustee, or the change of name of a trustee, if material.
The School District may from time to time choose to provide notice of the occurrence of
certain other events affecting the Bonds or the School District, in addition to those listed above, if, in the judgment of the School District, such other event is material with respect to the Bonds, but the School District does not undertake to commit to provide any such notice of the occurrence of any material event except those events listed above.
SECTION 6. Manner of Filing. All filings to be made with the MSRB in accordance with this Disclosure Certificate are to be filed in such electronic format as is prescribed by the MSRB and accompanied by such identifying information as is prescribed by the MSRB.
As of the date of this Disclosure Certificate, the rules of the MSRB require all such filings to be made using EMMA.
SECTION 7. Dissemination Agent. The School District may, at any time and from time to time, appoint or engage another person (the “Dissemination Agent”) to assist it in carrying out its obligations under this Disclosure Certificate, and may discharge such Dissemination Agent, with or without appointing a successor and without notice to Bondholders.
SECTION 8. Termination of Disclosure Obligation. The School District’s obligations under this Disclosure Certificate shall terminate upon the prior redemption, defeasance, or payment in full of all of the Bonds or if and when the School District no longer remains an “obligated person” with respect to the Bonds, within the meaning of the Rule.
SECTION 9. Default. In the event of a failure of the School District to comply with any provision of this Disclosure Certificate, any Bondholder may take such actions as may be necessary and appropriate, including seeking mandate or specific performance by court order, to cause the School District to comply with its obligations under this Disclosure Certificate. A default under this Disclosure Certificate shall not be deemed an event of default with respect to the Bonds, and the sole remedy under this Disclosure Certificate in the event of any failure of the School District to comply with this Disclosure Certificate shall be an action to compel performance.

- 5 -
SECTION 10. Beneficiaries. This Disclosure Certificate shall inure solely to the benefit of the School District, the Participating Underwriters and Bondholders, and shall create no rights in any other person or entity.
[SIGNATURE PAGE FOLLOWS]

- 6 -
IN WITNESS WHEREOF, The School District causes this Continuing Disclosure Certificate to be executed on its behalf by the President of the Board of School Directors all as of the date set forth above.
WEST CHESTER AREA SCHOOL DISTRICT, Chester and Delaware Counties, Pennsylvania
By: President of the Board of
School Directors
APPENDIX D Financial Statements
West Chester Area School District West Chester, Pennsylvania
June 30, 2016

[ THIS PAGE INTENTIONALLY LEFT BLANK ]

COMPREHENSIVE
ANNUAL
FINANCIAL REPORT
For the Fiscal Year Ended June 30, 2016
West Chester Area School District 829 Paoli Pike
West Chester, Pennsylvania 19380

[ THIS PAGE INTENTIONALLY LEFT BLANK ]

COMPREHENSIVE ANNUAL FINANCIAL REPORT
For the Fiscal Year Ended June 30, 2016
Prepared by the
West Chester Area School District Business Office
Mr. John Scully, Director of Business Affairs
Mr. Justin Matys, Assistant Director of Business Affairs
Ms. Jennifer Matthews, Controller
Ms. Catherine Hug, Accounting Supervisor
West Chester Area School District 829 Paoli Pike
West Chester, Pennsylvania 19380

WEST CHESTER AREA SCHOOL DISTRICT
TABLE OF CONTENTS
INTRODUCTORY SECTION
Transmittal Letter ...................................................................................................................................... 1
List of Board of School Directors and District Administrators................................................. 7
WCASD Management Team ................................................................................................................... 8
ASBO Certificate of Excellence .............................................................................................................. 9
FINANCIAL SECTION
Independent Auditor’s Report .............................................................................................................. 10
Management’s Discussion and Analysis (MD&A) .......................................................................... 13
(Required Supplementary Information)
BASIC FINANCIAL STATEMENTS:
Entity-wide Financial Statements:
Statement of Net Position ......................................................................................................... 25
Statement of Activities ............................................................................................................... 26
Fund Financial Statements:
Balance Sheet – Governmental Funds ................................................................................. 27
Reconciliation of Balance Sheet – Governmental Funds
to Statement of Net Position .................................................................................................... 28
Statement of Revenues, Expenditures and Changes in
Fund Balances – Governmental Funds ................................................................................ 29

WEST CHESTER AREA SCHOOL DISTRICT
TABLE OF CONTENTS
Reconciliation of Statement of Revenues, Expenditures and Changes
in Fund Balances – Governmental Funds to Statement of Activities ...................... 30
Budgetary Comparison Statement – General Fund ........................................................ 31
Statement of Net Position – Proprietary Fund ................................................................. 32
Statement of Revenues, Expenses and Changes in Net
Position – Proprietary Fund .................................................................................................... 33
Statement of Cash Flows – Proprietary Fund ................................................................... 34
Statement of Net Position – Fiduciary Funds.................................................................... 35
Statement of Changes in Net Position – Fiduciary Fund .............................................. 36
Notes to the Basic Financial Statements ........................................................................................... 37
REQUIRED SUPPLEMENTARY INFORMATION
Schedule of the District’s Proportionate Share of the Net Pension Liability ...................... 64
Schedule of District Contributions ...................................................................................................... 65
SUPPLEMENTARY INFORMATION
Combining Statement of Changes in Assets and Liabilities – All Agency Funds ................ 66
STATISTICAL SECTION
Narrative Explanation of Statistical Section .................................................................................... 67

WEST CHESTER AREA SCHOOL DISTRICT
TABLE OF CONTENTS
FINANCIAL TRENDS
Net Position by Component Unit .......................................................................................................... 68
Changes in Net Position ........................................................................................................................... 69
Fund Balance – Governmental Funds ................................................................................................ 70
Changes in Fund Balance – Governmental Funds ......................................................................... 71
General Fund Revenues by Source ...................................................................................................... 72
General Fund Expenditures by Type .................................................................................................. 73
REVENUE CAPACITY
General Fund - Most Significant Local Revenue Sources ............................................................ 75
Analysis of Assessed Value for Taxable Real Estate ..................................................................... 76
Market Value verses Assessed Value of Taxable Real Estate .................................................... 77
Property Tax Rates - All Direct and Overlapping Governments .............................................. 78
Ten Largest Real Property Taxpayers ................................................................................................ 79
Real Estate Tax Collection as a Ratio of Levy .................................................................................. 80
DEBT CAPACITY
Computation of Non-Electoral Debt Margin .................................................................................... 81
Gross Principal Debt Outstanding ....................................................................................................... 82

WEST CHESTER AREA SCHOOL DISTRICT
TABLE OF CONTENTS
Schedule of Direct and Overlapping Debt ......................................................................................... 83
Ratio of Net General Debt to Assessed Value and Debt per Capita ......................................... 84
DEMOGRAPHIC AND ECONOMIC INFORMATION
Trends in Population, Market Value and Personal Income ....................................................... 85
Key Economic and Housing Indices .................................................................................................... 86
Largest Employers within the School District ................................................................................ 87
OPERATING INFORMATION
Staffing Ratios for Professional Staff .................................................................................................. 88
District Facilities......................................................................................................................................... 89
School District Employees by Function ............................................................................................. 90
Student Enrollment Summary .............................................................................................................. 91
Student Market Share Analysis ............................................................................................................. 92
SINGLE AUDIT
Independent Auditor’s Report on Internal Control Over Financial
Reporting and on Compliance and Other Matters Based on an
Audit of Financial Statements Performed in Accordance with
Government Auditing Standards ........................................................................................................... 93
Independent Auditor’s Report on Compliance for Each Major
Program and on Internal Control Over Compliance Required
by the Uniform Guidance ........................................................................................................................ 95

WEST CHESTER AREA SCHOOL DISTRICT
TABLE OF CONTENTS
Schedule of Findings and Recommendations ................................................................................. 97
Schedule of Expenditures of Federal Awards ................................................................................. 99
Notes to Schedule of Expenditures of Federal Awards ............................................................ 101

WEST CHESTER AREA SCHOOL DISTRICT
INTRODUCTORY SECTION

[ THIS PAGE INTENTIONALLY LEFT BLANK ]

- 1 -
December 6, 2016
Dear Community Member,
We are pleased to present the Comprehensive Annual Financial Report (CAFR) of the West
Chester Area School District for the fiscal year ended June 30, 2016. This District’s Business
Office prepared this report.
The CAFR is published to present complete and accurate financial information on all the
funds and financial activities of the District for the 2015-2016 fiscal year. The Business Office
staff and management are responsible for the accuracy of the statements, notes, schedules
and statistical tables. We believe that the information in the report is a fair presentation of
the financial position and the results of operations of the District based upon a
comprehensive framework of internal controls that have been established for this purpose.
The report is prepared in accordance with generally accepted accounting and financial
reporting principles applicable to governmental entities in the United States of America.
Most importantly, this report will provide the reader with a comprehensive understanding
of the District’s financial affairs.
The Management’s Discussion and Analysis (MD&A), which follows the independent
auditor’s report, provides an overview of the District’s financial performance during the
fiscal year ended June 30, 2016. It should be read in conjunction with this transmittal letter
and the District’s basic financial statements.
- 2 -
Reporting Entity
The West Chester Area School District is an independent reporting entity and a primary
government as defined in the criteria established by the Governmental Accounting
Standards Board (GASB). The basic criteria for determining the inclusion in the reporting
entity is financial accountability and the nature and significance of the relationship.
Profile of the District
The West Chester Area School District was formed by Pennsylvania state law and began
operations on July 1, 1966. The District encompasses several communities in Chester County
and one in western Delaware County. The District covers an area of approximately 75 miles.
The District’s boundaries are coterminous with those of the Borough of West Chester and
the Townships of East Bradford, East Goshen, Thornbury, West Goshen, Westtown and West
Whiteland in Chester County, and the Township of Thornbury in Delaware County. The
Borough of West Chester, located in the geographic center of the District and is the county
seat for Chester County, is approximately 25 miles west of Philadelphia. The Borough of
West Chester is the financial and professional center for the surrounding area. The
Townships are principally residential in character, with regional shopping centers and
industrial parks.
The School District is governed by a nine-member Board of School Directors (the “School
Board”) who are elected for four-year terms. The Superintendent is the chief administrative
officer of the District, with overall responsibility for all aspects of operations including
education. The Director of Business Affairs is responsible for budget and financial
operations. Both of these officials are appointed by the School Board.
The purpose of the District is to provide an education system for Kindergarten through 12th
grade, including regular instruction, special instruction, vocational education and support
services to the approximately 15,700 students that live within the District boundaries. To
accomplish this goal, the District operates ten (10) elementary schools, three (3) middle
schools and three (3) high schools. Additionally, the District is required to pay the tuition
for the 717 children that live within the District boundaries that attend charter schools.
During the year ended June 30, 2016, the District paid $9,455,098 in tuition to charter
schools.

- 3 -
Budget Process
The Board considers preparation of an annual budget to be one of its most important
responsibilities because the budget is the financial reflection of the District’s educational
plan. The budget shall be designed to carry out that plan in a thorough and efficient manner,
to maintain the facilities and to honor District obligations. Budget planning for the District
is an integral part of program planning so that the annual operating budget may effectively
express and implement all programs and activities of the District. Budget planning is a year-
round process involving active participation by administrators, Board members, and
appropriate District personnel.
The District follows the Pennsylvania Public School Code requirements, the procedures
mandated by the Pennsylvania Department of Education and the District policies for annual
General Fund budget approval. One of those requirements is to adopt an annual operating
budget setting forth District expenditures and revenues and to establish the tax levy prior to
the beginning of each fiscal year. The total amount of the budget may not exceed expected
revenue plus a prudent and reasonable contingency and reserve. At least thirty days prior
to adoption of the final budget, the Board prepares and presents a proposed budget, which
is set forth in detail using the forms required by the Pennsylvania Department of Education.
The Board holds one or more public hearings on the annual budget prior to the meeting at
which it is formally adopted.
During the course of the year, the Pennsylvania School Code prohibits spending to exceed
the approved budget. To adjust for price changes and other changes to the original budget
assumptions, the District allows for the transfer of funds among budget line items upon the
recommendation of the Superintendent and the Director of Business Affairs. By law, such
transfers may only be made during the last nine months of the fiscal year and all transfers
require Board approval.
Internal Controls
The objective of a system of internal controls is to provide reasonable, but not absolute,
assurance that the District assets are properly protected and to ensure that financial
transactions, which are relied on in the preparation of financial reports, are accurately
recorded. The concept of reasonable assurance recognizes that the cost of the system of
internal controls should not exceed the benefits likely to be realized and that the valuation

- 4 -
of costs and benefits requires estimates and judgments by management. The District has
established policies and procedures to effectively implement and maintain a system of
internal accounting controls. Management and independent auditors continually evaluate
these policies and procedures to ensure the adequacy and effectiveness of the internal
control structure.
Economic Condition and Outlook
The area’s economy remains healthy, with Chester County economic indicators surpassing
state-wide data. The county has one of the lowest unemployment rates among the
Commonwealth’s 67 counties. Moody’s Investors Service reaffirmed the District’s Triple-A
ratings based on the sizeable and affluent residential tax base, solid financial position that is
expected to remain stable, and manageable debt burden.
That having been said, the District has been impacted by a number of factors. In 2006, the
Pennsylvania General Assembly passed into law Special Session Act 1 of 2006. This law
restricted the amount that School Districts can raise property taxes to within a cost of living
index. Any property tax increases above this cost of living index needs to be approved by
voter referendum. In 2015-2016, the index allowed for a 1.9% increase. The School Board
opted to increase property taxes by the index and the tax rate in Chester County increased
from 19.21 mills to 19.5779 mills.
As the District continues to navigate under the budgetary constraints of Act 1 funding
restrictions, other school districts throughout Pennsylvania incurred a number of
unfavorable budgetary impacts. The Pennsylvania economy, which has a direct effect on the
District’s earned income tax and other local revenues, has seen a slight growth over the past
few years. The District pension program, which is administered by the State, announced
substantial increases in pension rates through the 2016-2017 fiscal year and will then start
to level off for the 2017-2018 fiscal year. The District contribution rate will increase from
the 2015-2016 contribution rate of 25.84% to the projected rate of 32.04% in 2017-2018.
Both federal and state revenues remain relatively flat over the past few years and the District
anticipates minimal increases in the upcoming years.
As a result of the above noted economic conditions, the District’s Comprehensive Plan has
incorporated a financial goal funding priorities based on fiscal realities. Part of the goal
requires the District to control debt spending and fund balance limits. The District continues
to closely monitor economic indicators that will impact the next few budget cycles.
- 5 -
Long-term Financial Planning and Financial Policies
As stated earlier, the District budgeting process is a year-round process. As part of that
process, the Business Office aggressively forecasts revenues and expenditures going five
years into the future. This long-term financial planning is essential to absorbing the
anticipated changes to mandated expenditure patterns and revenue streams. To assist with
this management, the District has many policies in place which include, but are not limited
to, fund balance policies and debt policies.
Major Initiatives
The District is in the middle of a multiyear elementary school renovation project. The most
recent elementary school master plan projects renovating all of the District’s ten (10)
elementary schools between 2011-2012 and 2025-2026. In 2015-2016, the District
completed a majority of the renovations at Fern Hill Elementary School and has completed
phase I of the renovations at Exton Elementary School. The original construction and
renovation of the District buildings is included in the statistical section of the CAFR under
operating information.
In light of the current economic outlooks, the District is cautiously planning the funding of
these projects. The District has always exercised caution and a conservative approach to
borrowing.
The District will be implementing a full-day Kindergarten program for the start of the 2017-
2018 school year. The full-day Kindergarten program will provide for increased
instructional time for our youngest learners, which will allow them the time needed to
master critical literacy and math concepts that form the foundation for their academic
success.
Independent Audit
The District engages an independent certified public accounting firm to audit the District’s
annual financial statements. Barbacane, Thornton & Company LLP, Certified Public
Accountants, have audited the District’s financial statements for the year ended June 30,
2016, and have issued unmodified opinions on the West Chester Area School District’s
financial statements. Their report is located at the beginning of the Financial Section of the
CAFR and complies with applicable guidelines.

- 6 -
Awards
TheAssociationofSchoolBusinessOfficialsInternational(ASBO)awardedtheCertificateofExcellence (COE) in Financial Reporting to theWest Chester Area School District for itsComprehensiveAnnualFinancialReport(CAFR)forthefiscalyearendedJune30,2015.Thisaward confirms the schoolbusinessofficials’ commitment to financial accountability andtransparency. Recognition through the COE program can help strengthen a district’spresentation for bond issuance statements and promotes a high level of excellence infinancialreporting.
Acknowledgements
ThepreparationoftheComprehensiveAnnualFinancialReportonatimelybasiswasmadepossiblebythededicatedserviceoftheentirestaffoftheBusinessOffice.Eachmemberhasoursincereappreciationforcontributionsmadeinthepreparationofthisreport.
Respectfully,
JohnScullyDirectorofBusinessAffairs

- 7 -
WEST CHESTER AREA SCHOOL DISTRICT
2015-2016 School Board Members
Dr. Ricky Swalm School Board President
Sue Tiernan School Board Vice President
Gary Bevilacqua Member
Joyce Chester Member
Karen Herrmann Member
Robin Kaliner Member
Chris McCune Member
Vincent Murphy Member
Kate Shaw Member
District Administrators
Dr. Jim Scanlon Superintendent
Dr. Robert Sokolowski Assistant Superintendent
Dr. Tammi Florio Director of Elementary Education
Dr. Sara Missett Director of Secondary Education
Kevin Campbell Director of Facilities and Operations
Dr. June Garwin Director of Information Technology
Dr. Jeff Ulmer Director of Human Resources
John Scully Director of Business Affairs
Dr. Leigh Ann Ranieri Director of Pupil Services

Su
pe
rinte
nd
ent
Ass
t. D
irect
or
of
Bu
sin
ess
Aff
airs
Ele
me
ntar
y P
rinci
pal
s (1
0)
Hig
h S
choo
l P
rinc
ipal
s (3
)M
idd
le S
cho
ol
Pri
ncip
als
(3)
Info
rma
tion
T
ech
nolo
gy
Se
rvic
es
Ma
nag
er
Inst
ruct
iona
l T
ech
nolo
gy
Coo
rdin
ato
r(k
-12)
Sc
ho
ol B
oa
rd o
f D
ire
cto
rs
Wes
t Che
ster
Are
a Sc
hool
Dis
tric
tM
anag
emen
t T
eam
June
2015
Cur
ricu
lum
S
upe
rvis
ors
(k-1
2)(6
)-
Lang
uage
Art
s/R
eadi
ng-M
ath
-Sci
enc
e-
So
cial
Stu
die
s-F
ine
Art
s/ W
orld
Lan
gua
ge-A
sse
ssm
ent
/Eq
uity
Sp
ecia
l Ed
Su
perv
isor
s (k
-12)
(3)
EL
L/R
eeva
lua
tion
s S
upe
rvis
or(k
-12)
Stu
den
t S
erv
ice
s S
upe
rvis
or(k
-12)
/Gift
ed 9
-1
2
Cap
ital
Pro
gra
ms
Ma
nag
er
Dire
ctor
of B
usin
ess
Affa
irs
Dire
ctor
of
Ele
men
tary
Sch
ool
Edu
catio
n/G
ifted
k-5
Dire
ctor
of H
uman
R
esou
rces
Dire
ctor
of
Tec
hnol
ogy
Dire
ctor
of P
upil
Ser
vice
sD
irect
or o
f Fac
ilitie
s &
Ope
ratio
ns
Dire
ctor
of
Sec
onda
ry S
choo
l E
duca
tion/
Gift
ed 6
-8
MS
Ass
ista
nt
Pri
ncip
als
(6)
Ath
letic
Dir
ect
ors
(3
)
HS
Ass
ista
nt
Pri
ncip
als
(9)
Ass
ista
nt S
uper
inte
nden
t
Dire
ct re
port
Indi
rect
repo
rt
Ass
t. D
irect
or
of
Hum
an
R
eso
urc
es
- 9 -
The Certificate of Excellence in Financial Reporting Award
is presented to
WEST CHESTER AREA SCHOOL DISTRICT
for its Comprehensive Annual Financial Report (CAFR)
for the Fiscal Year Ended June 30, 2015.
The CAFR has been reviewed and met or exceeded
ASBO International’s Certificate of Excellence standards.
Brenda R. Burkett, CPA, CSBA, SFO John D. Musso, CAE, RSBA
President Executive Director

[ THIS PAGE INTENTIONALLY LEFT BLANK ]

WEST CHESTER AREA SCHOOL DISTRICT
FINANCIAL SECTION

-10-
INDEPENDENT AUDITOR’S REPORT
December 6, 2016
Board of School Directors
West Chester Area School District
West Chester, Pennsylvania
Report on the Financial Statements
We have audited the accompanying financial statements of the governmental activities, the business-
type activities, each major fund, and the aggregate remaining fund information of the West Chester
Area School District (“the District”), West Chester, Pennsylvania, as of and for the year ended June 30,
2016, and the related notes to the financial statements, which collectively comprise the District’s basic
financial statements as listed in the table of contents.
Management’s Responsibility for the Financial Statements
Management is responsible for the preparation and fair presentation of these financial statements in
accordance with accounting principles generally accepted in the United States of America; this
includes the design, implementation, and maintenance of internal control relevant to the preparation
and fair presentation of financial statements that are free from material misstatement, whether due to
fraud or error.
Auditor’s Responsibility
Our responsibility is to express opinions on these financial statements based on our audit. We
conducted our audit in accordance with auditing standards generally accepted in the United States
of America and the standards applicable to financial audits contained in Government Auditing
Standards, issued by the Comptroller General of the United States. Those standards require that we
plan and perform the audit to obtain reasonable assurance about whether the financial statements
are free from material misstatement.
An audit involves performing procedures to obtain audit evidence about the amounts and disclosures
in the financial statements. The procedures selected depend on the auditor’s judgment, including the
assessment of the risks of material misstatement of the financial statements, whether due to fraud or
error. In making those risk assessments, the auditor considers internal control relevant to the District’s
preparation and fair presentation of the financial statements in order to design audit procedures that
are appropriate in the circumstances, but not for the purpose of expressing an opinion on the
Barbacane, Thornton & Company LLP
200 Springer Building
3411 Silverside Road
Wilmington, Delaware 19810
T 302.478.8940
F 302.468.4001 www.btcpa.com

-11-
Board of School Directors
West Chester Area School District
effectiveness of the District’s internal control. Accordingly, we express no such opinion. An audit also
includes evaluating the appropriateness of accounting policies used and the reasonableness of
significant accounting estimates made by management, as well as evaluating the overall
presentation of the financial statements.
We believe that the audit evidence we have obtained is sufficient and appropriate to provide a basis
for our audit opinions.
Opinions
In our opinion, the financial statements referred to above present fairly, in all material respects, the
respective financial position of the governmental activities, the business-type activities, each major
fund, and the aggregate remaining fund information of the West Chester Area School District, West
Chester, Pennsylvania, as of June 30, 2016, and the respective changes in financial position and,
where applicable, cash flows thereof, and the respective budgetary comparison schedule for the
general fund for the year then ended in accordance with accounting principles generally accepted
in the United States of America.
Emphasis of Matter
As discussed in Note 1 to the financial statements, the District has adopted the requirements of GASB
Statement No. 72, “Fair Value Measurement and Application.” This statement addresses accounting
and financial reporting issues related to fair value measurements. Our opinion is not modified with
respect to this matter.
Other Matters
Required Supplementary Information
Accounting principles generally accepted in the United States of America require that the
management’s discussion and analysis on pages 13 through 24, the schedule of the District’s
proportionate share of the net pension liability on page 64 and the schedule of District contributions
on page 65 be presented to supplement the basic financial statements. Such information, although
not a part of the basic financial statements, is required by the Governmental Accounting Standards
Board, who considers it to be an essential part of financial reporting for placing the basic financial
statements in an appropriate operational, economic, or historical context. We have applied certain
limited procedures to the required supplementary information in accordance with auditing standards
generally accepted in the United States of America, which consisted of inquiries of management
about the methods of preparing the information and comparing the information for consistency with
management’s responses to our inquiries, the basic financial statements, and other knowledge we
obtained during our audit of the basic financial statements. We do not express an opinion or provide
any assurance on the information because the limited procedures do not provide us with sufficient
evidence to express an opinion or provide any assurance.

-12-
Board of School Directors
West Chester Area School District
Other Information
Our audit was conducted for the purpose of forming opinions on the financial statements that
collectively comprise the District’s basic financial statements. The introductory section, statistical
section, and combining statement of changes in assets and liabilities – all agency funds are
presented for the purposes of additional analysis and are not a required part of the basic financial
statements. The schedule of expenditures of federal awards is presented for purposes of additional
analysis as required by Title 2 U.S. Code of Federal Regulations (CFR) Part 200, Uniform Administrative
Requirements, Cost Principles, and Audit Requirements for Federal Awards, and is also not a required
part of the basic financial statements.
The schedule of expenditures of federal awards and the combining statement of changes in assets
and liabilities – all agency funds are the responsibility of management and were derived from and
relate directly to the underlying accounting and other records used to prepare the basic financial
statements. Such information has been subjected to the auditing procedures applied in the audit of
the basic financial statements and certain additional procedures, including comparing and
reconciling such information directly to the underlying accounting and other records used to prepare
the basic financial statements or to the basic financial statements themselves, and other additional
procedures in accordance with auditing standards generally accepted in the United States of
America. In our opinion, the schedule of expenditures of federal awards and the combining
statement of changes in assets and liabilities – all agency funds are fairly stated, in all material
respects, in relation to the basic financial statements as a whole.
The introductory and statistical sections have not been subjected to the auditing procedures applied
in the audit of the basic financial statements and, accordingly, we do not express an opinion or
provide any assurance on them.
Other Reporting Required by Government Auditing Standards
In accordance with Government Auditing Standards, we have also issued our report dated December
6, 2016, on our consideration of the District’s internal control over financial reporting and on our tests
of its compliance with certain provisions of laws, regulations, contracts, and grant agreements and
other matters. The purpose of that report is to describe the scope of our testing of internal control over
financial reporting and compliance and the results of that testing, and not to provide an opinion on
internal control over financial reporting or on compliance. That report is an integral part of an audit
performed in accordance with Government Auditing Standards in considering the District’s internal
control over financial reporting and compliance.
BARBACANE, THORNTON & COMPANY LLP

- 13 -
WEST CHESTER AREA SCHOOL DISTRICT
MANAGEMENT’S DISCUSSION AND ANALYSIS - UNAUDITED
JUNE 30, 2016
INTRODUCTION
The discussion and analysis of the financial performance of the West Chester Area School District (“the
District") provides an overall review of the District’s financial activities for the fiscal year ended June 30,
2016. The intent of this discussion and analysis is to look at the District’s financial performance as a
whole. Readers also should review the financial statements and the notes to the financial statements
to enhance their understanding of the District’s financial performance.
DISTRICT MISSION STATEMENT
The Districts mission is to educate and inspire our students to achieve their personal best.
DISTRICT PROFILE
The District consists of ten elementary schools, three middle schools, and three high schools, serving
11,474 students. The District serves a 75 square-mile suburban, urban, and rural area in Chester
County, Pennsylvania and is comprised of West Chester Borough and the surrounding townships of
East Goshen, West Goshen, East Bradford, West Whiteland, Westtown, and Thornbury in Chester
County, and Thornbury Township in Delaware County. During 2015-2016, there were nearly 1,000
professional staff, of which over 76 percent held a master’s degree or higher. Seven of the District’s
schools have been awarded as Blue Ribbon Schools by the U.S. Department of Education. All three
West Chester Area School District high schools are: ranked in the top 20 out of 676 high schools in
Pennsylvania by SchoolDigger.com, on Newsweek’s top 500 public high schools in the nation for
2015, and PIAA District and State Qualifiers in multiple sports.
FINANCIAL HIGHLIGHTS
The largest District revenue stream is local property tax. In 2015-2016, the School Board raised
property taxes 1.9 percent, or 0.3679 mills. The taxpayers in Chester County were assessed for
property taxes at 19.5779 mills. (Please note that one mill is equal to one-tenth of a cent, or
$0.001 of assessed value.) The Delaware County tax rate was assessed based upon the
equalized millage calculation, which resulted in a slight increase in tax rate from 13.65 mills in
2014-2015 to 13.9059 mills in 2015-2016.
The Statement of Net Position reflects the actuarially determined net pension liability of
$293,071,000, deferred outflows of resources of $31,150,942 comprising contributions made by
the District made after the measurement date of June 30, 2015, contributions made in excess of
the required contribution made in the year of the measurement date and changes in the
District’s proportionate share of the net pension liability, and deferred inflows of resources of
$1,803,000 comprised of investment returns on pension assets over projected returns and
differences between the actuarially expected and actual experience to be recognized as a
future reduction in pension expense, and a decrease in the liability until fully recognized.

WEST CHESTER AREA SCHOOL DISTRICT
MANAGEMENT’S DISCUSSION AND ANALYSIS - UNAUDITED (CONT’D)
JUNE 30, 2016
- 14 -
On an entity-wide basis, the District's total net position was negative $195,483,012 at June 30,
2016. This represented a decrease of 2.96 percent from the prior year.
On a fund-level reporting basis, compared to the prior year, the District’s General Fund total
revenues, excluding other financing sources, increased 3.18 percent, or $6,802,384. This
increase was driven by property tax revenue growth.
On a fund-level reporting basis, compared to the prior year, the District’s General Fund
expenditures increased $7,607,313, or 3.7 percent. The driving factor in this increase was the
rising cost of employee benefits. The District’s pension contributions increased 25.3 percent, or
$5,560,592.
OVERVIEW OF FINANCIAL STATEMENTS
The accompanying financial statements have been prepared in accordance with GASB Statement
No. 34 and present both entity-wide and fund level financial statements using both the accrual basis
and modified accrual basis of accounting, respectively.
Entity-wide Financial Statements
The first two statements are entity-wide financial statements - the Statement of Net Position and the
Statement of Activities. These provide both long-term and short-term information about the District’s
overall financial status.
The entity-wide statements report information about the District as a whole using accounting methods
similar to those used by private-sector companies. The Statement of Net Position includes all of the
government’s assets, deferred outflows of resources, liabilities, and deferred inflows of resources. All of
the current year’s revenues and expenses are accounted for in the Statement of Activities regardless
of when cash is received or paid.
The two entity-wide statements report the District’s net position and how they have changed. Net
position, the difference between the District’s assets, deferred outflows of resources, liabilities, and
deferred inflows of resources, is one way to measure the District’s financial health or position.
Over time, increases or decreases in the District’s net position are an indication of whether its financial
health is improving or deteriorating, respectively.
To assess the overall health of the District, the reader needs to consider additional nonfinancial
factors, such as changes in the District’s property tax base and the performance of the students.
The entity-wide financial statements of the District are divided into two categories:
Governmental Activities All of the District’s basic services are included here, such as instruction,
administration, and community services. Property taxes and state and federal subsidies and
grants finance most of these activities.

WEST CHESTER AREA SCHOOL DISTRICT
MANAGEMENT’S DISCUSSION AND ANALYSIS - UNAUDITED (CONT’D)
JUNE 30, 2016
- 15 -
Business-type Activities The District operates a food service operation and charges fees to staff
and students to cover the costs of the food service operation.
Fund Level Financial Statements
The remaining statements are fund financial statements that focus on individual parts of the District’s
operations in more detail than the entity-wide statements. The governmental funds statements tell how
the District’s general services were financed in the short term as well as what remains for future
spending. Proprietary fund statements offer short-term and long-term financial information about the
activities that the District operates like a business. For this District, this is our Food Service Fund.
Fiduciary fund statements provide information about financial relationships for which the District acts
solely as a trustee or agent for the benefit of others.
Governmental Funds Most of the District’s activities are reported in governmental funds, which
focus on the determination of financial position and change in financial position, not on income
determination. The District’s major governmental funds are the General Fund, the Capital
Projects Fund, and the Capital Reserve Fund. Governmental funds are reported using the
modified accrual accounting method, which measures cash and all other financial assets that
can readily be converted to cash. The governmental fund statements provide a detailed short-
term view of the District’s operations and the services it provides. Governmental fund
information helps the reader determine whether there are more or fewer financial resources that
can be spent in the near future to finance the District’s programs. The relationship (or
differences) between governmental activities (reported in the Statement of Net Position and the
Statement of Activities) and governmental funds is reconciled in the financial statements.
Proprietary Funds These funds are used to account for District activities that are similar to
business operations in the private sector; or where the reporting is on determining net income,
financial position, changes in financial position, and a significant portion of funding through
user charges. When the District charges customers for services it provides - whether to outside
customers or to other units in the District - these services generally are reported in proprietary
funds. The Food Service Fund is the District’s proprietary fund and is the same as the business-
type activities reported in the entity-wide statements.
Fiduciary Funds The District is the trustee, or fiduciary, for some scholarship funds. All of the
District's fiduciary activities are reported in a separate Statement of Fiduciary Net Position. These
activities are excluded from the District's other financial statements because the District cannot
use these assets to finance its operations.
The financial statements also include notes that explain some of the information in the financial
statements and provide more detailed data.

WEST CHESTER AREA SCHOOL DISTRICT
MANAGEMENT’S DISCUSSION AND ANALYSIS - UNAUDITED (CONT’D)
JUNE 30, 2016
- 16 -
FINANCIAL ANALYSIS OF THE DISTRICT ENTITY-WIDE STATEMENTS
The District's total net position was negative $195,483,012 at June 30, 2016. This represents a
decrease of $5,626,477 over the prior year. The table below presents condensed financial
information for the net position of the District as of June 30, 2016 and 2015.
Statement of Net Position
June 30, 2016 and 2015
Governmental Activities Business-type Activities Totals 2016 2015 2016 2015 2016 2015 ASSETS: Current and other assets $ 84,611,031 $ 80,161,062 $ 1,399,164 $ 1,487,897 $ 86,010,195 $ 81,648,959 Capital assets 293,539,312 302,836,438 402,386 297,638 293,941,698 303,134,076
TOTAL ASSETS 378,150,343 382,997,500 1,801,550 1,785,535 379,951,893 384,783,035
Deferred outflows of resources 38,701,523 30,863,176 - - 38,701,523 30,863,176
LIABILITIES: Current liabilities 40,823,380 41,284,405 356,595 377,358 41,179,975 41,661,763 Long-term liabilities 571,153,453 545,083,983 - - 571,153,453 545,083,983
TOTAL LIABILITIES 611,976,833 586,368,388 356,595 377,358 612,333,428 586,745,746
Deferred inflows of resources 1,803,000 18,757,000 - - 1,803,000 18,757,000
NET POSITION (DEFICIT): Net investment in capital assets 11,063,839 20,989,220 402,386 297,638 11,466,225 21,286,858 Restricted 27,440,218 22,203,300 - - 27,440,218 22,203,300 Unrestricted (deficit) (235,432,024) (234,457,232) 1,042,569 1,110,539 (234,389,455) (233,346,693)
TOTAL NET POSITION (DEFICIT) $(196,927,967) $(191,264,712) $ 1,444,955 $ 1,408,177 $(195,483,012) $(189,856,535)
The governmental activities restricted net position in the amount of $27,440,218 is set aside to fund
capital improvements, the replacement of and additions to public works, and deferred maintenance.
The total unrestricted net position in the amount of negative $234,389,455 included $1,042,569, which
could be used for capital and other expenses within the District’s food service program.
The results of this year's operations as a whole are reported in the Statement of Activities. All expenses
are reported in the first column. Specific charges, grants, revenues, and subsidies that relate directly
to specific expense categories are presented to determine the final amount of the District's activities
that are supported by other general revenues. The largest revenues are property taxes, local taxes,
and the state basic education subsidy.
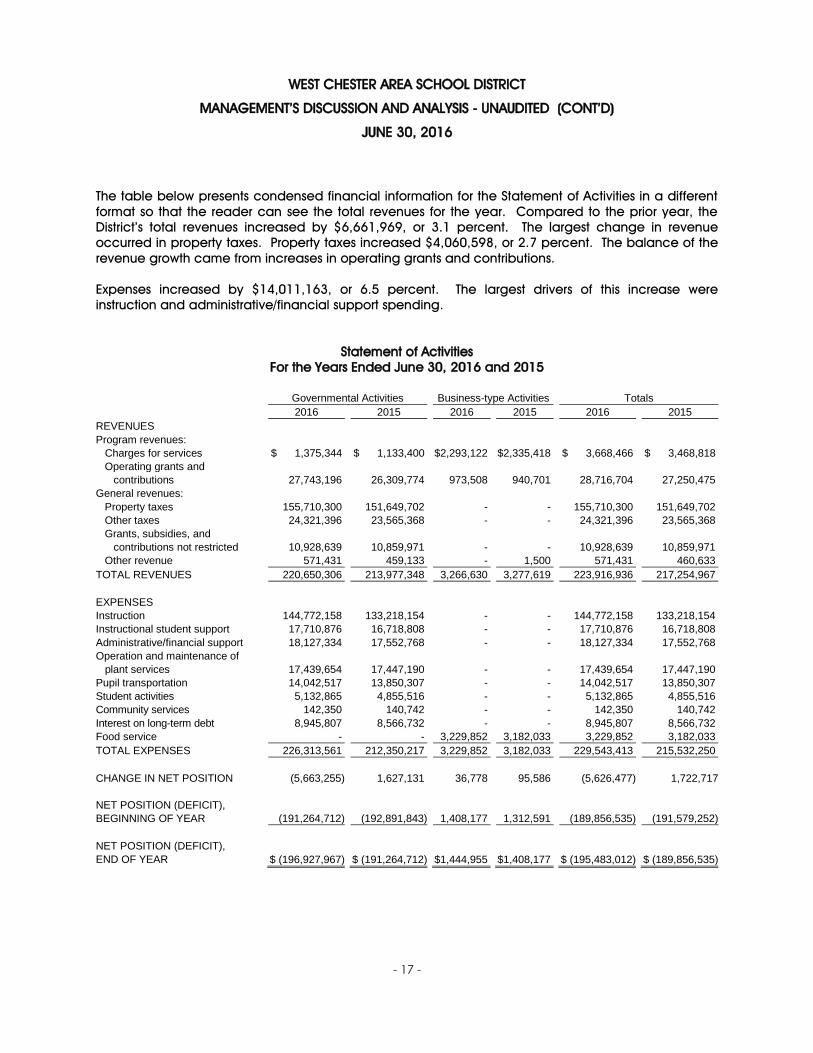
WEST CHESTER AREA SCHOOL DISTRICT
MANAGEMENT’S DISCUSSION AND ANALYSIS - UNAUDITED (CONT’D)
JUNE 30, 2016
- 17 -
The table below presents condensed financial information for the Statement of Activities in a different
format so that the reader can see the total revenues for the year. Compared to the prior year, the
District’s total revenues increased by $6,661,969, or 3.1 percent. The largest change in revenue
occurred in property taxes. Property taxes increased $4,060,598, or 2.7 percent. The balance of the
revenue growth came from increases in operating grants and contributions.
Expenses increased by $14,011,163, or 6.5 percent. The largest drivers of this increase were
instruction and administrative/financial support spending.
Statement of Activities
For the Years Ended June 30, 2016 and 2015
Governmental Activities Business-type Activities Totals 2016 2015 2016 2015 2016 2015 REVENUES Program revenues: Charges for services $ 1,375,344 $ 1,133,400 $2,293,122 $2,335,418 $ 3,668,466 $ 3,468,818 Operating grants and contributions 27,743,196 26,309,774 973,508 940,701 28,716,704 27,250,475 General revenues: Property taxes 155,710,300 151,649,702 - - 155,710,300 151,649,702 Other taxes 24,321,396 23,565,368 - - 24,321,396 23,565,368 Grants, subsidies, and contributions not restricted 10,928,639 10,859,971 - - 10,928,639 10,859,971 Other revenue 571,431 459,133 - 1,500 571,431 460,633 TOTAL REVENUES 220,650,306 213,977,348 3,266,630 3,277,619 223,916,936 217,254,967 EXPENSES Instruction 144,772,158 133,218,154 - - 144,772,158 133,218,154 Instructional student support 17,710,876 16,718,808 - - 17,710,876 16,718,808 Administrative/financial support 18,127,334 17,552,768 - - 18,127,334 17,552,768 Operation and maintenance of plant services 17,439,654 17,447,190 - - 17,439,654 17,447,190 Pupil transportation 14,042,517 13,850,307 - - 14,042,517 13,850,307 Student activities 5,132,865 4,855,516 - - 5,132,865 4,855,516 Community services 142,350 140,742 - - 142,350 140,742 Interest on long-term debt 8,945,807 8,566,732 - - 8,945,807 8,566,732 Food service - - 3,229,852 3,182,033 3,229,852 3,182,033 TOTAL EXPENSES 226,313,561 212,350,217 3,229,852 3,182,033 229,543,413 215,532,250 CHANGE IN NET POSITION (5,663,255) 1,627,131 36,778 95,586 (5,626,477) 1,722,717 NET POSITION (DEFICIT), BEGINNING OF YEAR (191,264,712) (192,891,843) 1,408,177 1,312,591 (189,856,535) (191,579,252) NET POSITION (DEFICIT), END OF YEAR $ (196,927,967) $ (191,264,712) $1,444,955 $1,408,177 $ (195,483,012) $ (189,856,535)

WEST CHESTER AREA SCHOOL DISTRICT
MANAGEMENT’S DISCUSSION AND ANALYSIS - UNAUDITED (CONT’D)
JUNE 30, 2016
- 18 -
EXPENSES
The table below presents condensed financial information on the expenses of the District by function.
The table illustrates both the gross and net costs of services. Unrestricted grants, subsidies, and
contributions are deducted to reflect the amount needed to be funded by other revenue sources.
The amount needed to be funded by other revenue sources increased by $12,219,310, or 7.0
percent more than the prior year. The table for business-type activity reflects condensed financial
activities of the food service program, the only business-type activity of the District.
Total Cost of Services Net Cost of Services GOVERNMENTAL ACTIVITIES 2016 2015 2016 2015 Instruction $ 144,772,158 $ 133,218,154 $ 125,305,348 $ 116,004,704 Instructional student support 17,710,876 16,718,808 15,625,212 14,688,320 Administrative and financial support 18,127,334 17,552,768 16,671,133 16,317,417 Operation and maintenance of plant 17,439,654 17,447,190 15,917,789 16,139,137 Pupil transportation 14,042,517 13,850,307 10,335,388 10,183,760 Student activities 5,132,865 4,855,516 4,252,133 4,048,074 Community services 142,350 140,742 142,211 140,605 Interest on long-term debt 8,945,807 8,566,732 8,945,807 7,385,026 TOTAL GOVERNMENTAL ACTIVITIES $ 226,313,561 $ 212,350,217 $ 197,195,021 184,907,043 Less: Unrestricted grants and subsidies (10,928,639) (10,859,971) TOTAL NEEDS FROM OTHER REVENUE SOURCES $ 186,266,382 $ 174,047,072
Total Cost of Services Net Revenue of Services BUSINESS-TYPE ACTIVITIES 2016 2015 2016 2015 Food service $ 3,229,852 $ 3,182,033 $ (36,778) $ (94,086)
THE DISTRICT FUNDS
General Fund
At June 30, 2016, the District reported a General Fund fund balance of $28,760,978, which represents
13.4 percent of total expenditures and was a decrease of $2,904,581 over the prior year. Of this
amount, the District committed $4,159,909 for the purpose of healthcare rate stabilization. Due to the
nature of self-insuring health insurance claims, the District experiences volatility in annual health
insurance costs. To smooth these expenditures, the District established a health insurance rate
stabilization fund and decreased this commitment by $739,533 to bring the balance of the
commitment to $4,159,909. The District continued its commitment of $2,117,000 for PSERS costs.

WEST CHESTER AREA SCHOOL DISTRICT
MANAGEMENT’S DISCUSSION AND ANALYSIS - UNAUDITED (CONT’D)
JUNE 30, 2016
- 19 -
Lastly, the District assigned $5,471,005 of the fund balance towards tax rate stabilization. These funds
will be used to offset the 2016-2017 budget gaps and reduce the need for future tax increases. The
School Board of West Chester Area School District manages the fund balance to respond to
unforeseen contingencies and economic conditions. This philosophy was established during a
healthy and growing economy within the District and accurate and timely forecasting which allows
the District to constantly monitor economic trends within our community. This philosophy conforms to
the Board’s belief that the tax burden should be aligned with the current funding needs of the District.
The remaining assigned fund balance of $89,487 is assigned for athletic activities.
REVENUE
General Fund Revenues, excluding other financing sources, total $220,756,528, which is an increase
from the collections in the prior year. The table below reflects a comparison of current year revenues
to prior year revenues:
General Fund
Increase/
Variance
Revenues Percentage (Decrease) Over/(Under)
2016 of Total from 2015 Final Budget
Local revenues $182,084,694 82.5% $ 5,300,296 $ 867,553 State sources 35,806,499 16.2% 1,596,573 (847,109) Federal sources 2,865,335 1.3% (94,485) 185,004
TOTAL $220,756,528 100.0% $ 6,802,384 $ 205,448
Local Revenues82.5%
State Sources16.2%
Federal Sources1.3%
2015-2016 General Fund Revenues

WEST CHESTER AREA SCHOOL DISTRICT
MANAGEMENT’S DISCUSSION AND ANALYSIS - UNAUDITED (CONT’D)
JUNE 30, 2016
- 20 -
Local revenues increased by $5,300,296, which can be primarily attributed to a number of factors.
The District’s real estate tax revenues increased $4,481,327 from the prior year due to a 1.9 percent,
or 0.3679 mill, increase in the tax rate. Additionally, earned income taxes increased $758,533,
receipts from other local education agency increased by $172,089, earnings on investment
increased $166,719, and real estate transfer tax increased by $62,210. The increases were offset by
a decrease in delinquent real estate tax collection of $245,684 and decreases in other miscellaneous
revenues of $94,898.
The increase in State revenues is due largely to an increase in the District’s retirement subsidy. The
State reimburses the District for 50 percent of the District’s pension cost. The dramatic increase in the
State pension contribution rate caused both an increase in the annual pension costs as well as an
increase of $2,060,974 in the related retirement subsidy reimbursement. The District did not receive
bond rental subsidy for the 2015-2016 year. This is a decrease from the prior year of $1,181,706. This
decrease is offset by an increase in both basic instructional subsidy and special education subsidy of
$333,538 and $388,215, respectively. Other miscellaneous state revenues decreased by $4,448 from
the prior year.
Federal revenues decreased by 3.2 percent; this was primarily the net effect of an increase in Title II
funding of $80,026 that was offset by a decrease in Medical Assistance funding of $196,367 and a
decrease of $27,437 in Title III spending.
EXPENDITURES
General Fund expenditures, excluding transfers to other governmental funds, totaled $214,590,719.
This was an increase of $7,607,313, or 3.7 percent over the prior year, and it was $2,024,739 under
the approved budget. The expenditures were segregated into various programs depending on the
functions of the activity. These programs and the costs associated with each, as well as comparison
to the costs incurred in the prior year and the final 2015-2016 budget, are as follows:
General Fund
Increase/
Variance
Expenditures
Percentage
(Decrease)
Over/(Under)
2016 of Total from 2015 Final Budget
Instruction $130,495,364
60.7%
$ 8,348,306
$ (490,126)
Support services 60,941,817
28.4%
1,879,520
(1,396,396) Noninstructional services 4,803,105
2.2%
192,923
(138,216)
Debt service 18,350,433
8.7%
(2,183,436)
(1)
TOTAL $214,590,719
100.0%
$ 7,607,313
$ (2,024,739)
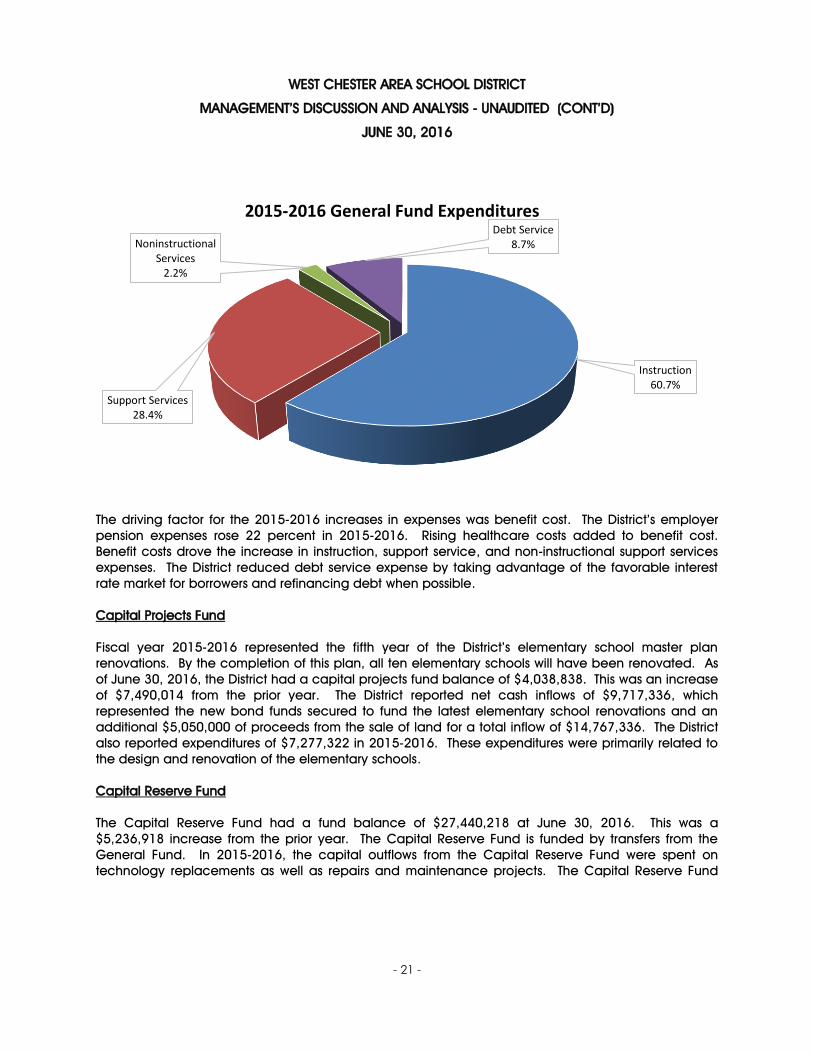
WEST CHESTER AREA SCHOOL DISTRICT
MANAGEMENT’S DISCUSSION AND ANALYSIS - UNAUDITED (CONT’D)
JUNE 30, 2016
- 21 -
The driving factor for the 2015-2016 increases in expenses was benefit cost. The District’s employer
pension expenses rose 22 percent in 2015-2016. Rising healthcare costs added to benefit cost.
Benefit costs drove the increase in instruction, support service, and non-instructional support services
expenses. The District reduced debt service expense by taking advantage of the favorable interest
rate market for borrowers and refinancing debt when possible.
Capital Projects Fund
Fiscal year 2015-2016 represented the fifth year of the District’s elementary school master plan
renovations. By the completion of this plan, all ten elementary schools will have been renovated. As
of June 30, 2016, the District had a capital projects fund balance of $4,038,838. This was an increase
of $7,490,014 from the prior year. The District reported net cash inflows of $9,717,336, which
represented the new bond funds secured to fund the latest elementary school renovations and an
additional $5,050,000 of proceeds from the sale of land for a total inflow of $14,767,336. The District
also reported expenditures of $7,277,322 in 2015-2016. These expenditures were primarily related to
the design and renovation of the elementary schools.
Capital Reserve Fund
The Capital Reserve Fund had a fund balance of $27,440,218 at June 30, 2016. This was a
$5,236,918 increase from the prior year. The Capital Reserve Fund is funded by transfers from the
General Fund. In 2015-2016, the capital outflows from the Capital Reserve Fund were spent on
technology replacements as well as repairs and maintenance projects. The Capital Reserve Fund
Instruction60.7%
Support Services28.4%
Noninstructional Services
2.2%
Debt Service8.7%
2015-2016 General Fund Expenditures

WEST CHESTER AREA SCHOOL DISTRICT
MANAGEMENT’S DISCUSSION AND ANALYSIS - UNAUDITED (CONT’D)
JUNE 30, 2016
- 22 -
received a transfer in of $9,107,247 from the General Fund. This transfer represented general fund
maintenance projects and debt service savings achieved through refinancing three existing bond
issues.
GENERAL FUND BUDGET
During the fiscal year, the Board of School Directors authorizes revisions to the original budget to
accommodate differences from the original budget to the actual expenditures of the District. All
adjustments are confirmed again at the time the annual audit is accepted. This is done after the end
of the fiscal year in accordance with state law. A schedule showing the District's original and final
budget amounts compared with actual amounts is provided in the financial statements.
Due to legislative restrictions, the District must adopt a preliminary budget six months before the start of
the fiscal year. Subsequent to the start of the fiscal year, the District’s projections indicated that future
budget years would experience a budgetary shortfall due to rising pension rates and limited local
revenue increases. In reaction to this anticipated gap, the District has been conservative with
spending. This is evident when reviewing the District’s actual expenditures versus the approved
budget. Total revenues were collected near budgeted amounts at $205,448 over budget, or 0.1
percent. Total expenditures were under the amended budget by $2,024,739, or 0.9 percent.
CAPITAL ASSETS
At June 30, 2016, the District had $293,941,698 invested in a broad range of governmental capital
assets, including land, buildings, and furniture and equipment. This amount represents a net
decrease (including additions, deletions, and depreciation) of $9,192,378, or three percent from the
prior year. The District sold almost 50 acres of land, which resulted in a reduction of land of
$5,318,056. Additionally, the District’s construction-in-progress balance increased by $5,306,372 from
the prior year.
The following schedule depicts the capital assets for the period July 1, 2015 through June 30, 2016.
More detailed information about capital assets is included in the notes to the financial statements.
Governmental Business-type Activities Activities Total Assets
Capital assets: Land $ 28,289,916 $ - $ 28,289,916 Land improvements 15,770,266 - 15,770,266 Buildings 398,442,243 - 398,442,243 Construction-in-progress 13,850,498 - 13,850,498 Furniture and equipment 35,726,095 965,349 36,691,444 TOTAL CAPITAL ASSETS 492,079,018 965,349 493,044,367 TOTAL ACCUMULATED DEPRECIATION 198,539,706 562,963 199,102,669 CAPITAL ASSETS, NET $ 293,539,312 $ 402,386 $ 293,941,698

WEST CHESTER AREA SCHOOL DISTRICT
MANAGEMENT’S DISCUSSION AND ANALYSIS - UNAUDITED (CONT’D)
JUNE 30, 2016
- 23 -
DEBT ADMINISTRATION
As of June 30, 2016, the District had total outstanding bonds and related charges of $290,026,054, an
increase of $587,200 from the prior year. During 2015-2016, the District refinanced $59,095,000 in
outstanding debt to take advantage of the favorable financing market conditions. Based upon a
projection of future debt margins, the retirement of principal on current issues, and estimated future
borrowing, the District is certain that it will not exceed its debt limit.
Debt Service Schedule
June 30, 2016
Principal Principal
Outstanding Maturities/ Outstanding
June 30, 2015 Refinancing Additions June 30, 2016
GENERAL OBLIGATION
BONDS AND NOTES $ 271,826,000 $ 67,111,000 $ 61,900,000 $ 266,615,000 Deferred amounts:
Net issuance premium 17,612,854 2,502,111 8,300,311 23,411,054
LONG-TERM DEBT $ 289,438,854 $ 69,613,111 $ 70,200,311 $ 290,026,054
OTHER LONG-TERM LIABILITIES
Other obligations include accrued vacation pay and severance for specific employees of the District,
and the actuarially determined net pension liability. More detailed information about long-term
liabilities is included in the notes to the financial statements.
THE DISTRICT’S FUTURE
The District forecasts budgetary impacts five years forward. Looking forward, the District is currently
forecasting expenses to outpace revenues, creating a budgetary gap. Local revenue, the Districts
largest budgetary stream, has been slow to recover after the national economic down turn. Interim
real estate tax, earned income tax, growth in real estate tax base, and transfer tax collections all
follow local economic trends. While state and federal funding has increased recently, increases were
driven by pension and social security subsidy increases that are mirrored by the cost and do not assist
in addressing budgetary gaps. Expense growth in the future will continue to be driven by pension and
healthcare costs. The District’s employer pension contribution rate rose to 30.03 percent in 2016-2017
and will continue to increase going forward. The District also projects an annual increase of 7.57
percent per year in health benefits.
WEST CHESTER AREA SCHOOL DISTRICT
MANAGEMENT’S DISCUSSION AND ANALYSIS - UNAUDITED (CONT’D)
JUNE 30, 2016
- 24 -
In response, the District continues to budget conservatively. The District uses fund balance
management techniques to reserve funds for future pension needs, potential healthcare costs and
reduce millage rate impact. The District has changed healthcare plans for all its labor groups in an
attempt to limit healthcare expenses. While currently the District is showing a deficit, the District School
Board and staff are working hard to develop methods to address the District’s long-term financial
needs.
Within the District’s capital funds, the District initiated its 16-year long-term elementary school master
plan, which includes renovations and/or additions to each of its 10 elementary schools. This project
was the continuation of the District’s secondary school renovation program that was completed. The
District has completed its third building renovation and is in progress with the fourth and fifth
renovations. As for the balance of the plan, the District is cautious due to the current financial
environment. The District has always exercised caution in a conservative approach to borrowing,
including waiting until long-term bonds (20-year notes) were capable of being sold at advantageous,
fixed rates of interest.
FINANCIAL MANAGEMENT
Our financial report is designed to provide our citizens, taxpayers, parents, students, investors, and
creditors with a general overview of the District's finances and to show the Board's accountability for
the money it receives. If you have questions about this report or wish to request additional financial
information, please contact Mr. John Scully, Director of Business Affairs at The West Chester Area
School District, 829 Paoli Pike, West Chester, PA 19380, (484) 266-1020.

- 25 -
Primary GovernmentGovernmental Business-type
Activities Activities TotalASSETS AND DEFERRED OUTFLOWS OF RESOURCESASSETSCurrent Assets:
Cash and cash equivalents 18,762,949$ 52,310$ 18,815,259$ Investments 53,490,542 1,197,402 54,687,944 Internal balances (585) 585 - Due from other governments 4,598,096 24,477 4,622,573 Other receivables 1,709,901 96,757 1,806,658 Taxes receivable 3,615,153 - 3,615,153 Prepaid expenses 2,434,975 - 2,434,975 Inventories - 27,633 27,633
Total Current Assets 84,611,031 1,399,164 86,010,195 Noncurrent Assets:
Capital assets Land 28,289,916 - 28,289,916 Construction-in-progress 13,850,498 - 13,850,498 Land improvements 15,770,266 - 15,770,266 Buildings 398,442,243 - 398,442,243 Furniture and equipment 35,726,095 965,349 36,691,444 Less: Accumulated depreciation (198,539,706) (562,963) (199,102,669)
Total Noncurrent Assets 293,539,312 402,386 293,941,698
TOTAL ASSETS 378,150,343 1,801,550 379,951,893
DEFERRED OUTFLOWS OF RESOURCESDeferred amount on refunding 7,550,581 - 7,550,581 Deferred pension contributions 22,053,155 - 22,053,155 Deferred pension 9,097,787 - 9,097,787
TOTAL DEFERRED OUTFLOWS 38,701,523 - 38,701,523
TOTAL ASSETS AND DEFERRED OUTFLOWS OF RESOURCES 416,851,866$ 1,801,550$ 418,653,416$
LIABILITIES AND NET POSITION (DEFICIT)LIABILITIESCurrent Liabilities:
Accounts payable and other current liabilities 22,202,118$ 182,849$ 22,384,967$ Accrued interest 1,500,949 - 1,500,949 Unearned revenues 144,102 173,746 317,848 Bonds and notes payable, net 16,976,211 - 16,976,211
Total Current Liabilities 40,823,380 356,595 41,179,975 Noncurrent Liabilities:
Bonds and notes payable, net 273,049,843 - 273,049,843 Accrued severance and compensated absences 4,626,439 - 4,626,439 Other post-employment benefits 406,171 - 406,171 Net pension liability 293,071,000 - 293,071,000
Total Noncurrent Liabilities 571,153,453 - 571,153,453
TOTAL LIABILITIES 611,976,833 356,595 612,333,428
Deferred pension 1,803,000 - 1,803,000
NET POSITION (DEFICIT)11,063,839 402,386 11,466,225
Restricted for capital projects 27,440,218 - 27,440,218 (235,432,024) 1,042,569 (234,389,455)
TOTAL NET POSITION (DEFICIT) (196,927,967) 1,444,955 (195,483,012)
RESOURCES, AND NET POSITION (DEFICIT) 416,851,866$ 1,801,550$ 418,653,416$
The accompanying notes are an integral part of these financial statements.
WEST CHESTER AREA SCHOOL DISTRICTSTATEMENT OF NET POSITION
JUNE 30, 2016
TOTAL LIABILITIES, DEFERRED INFLOWS OF
Net investment in capital assets
Unrestricted (Deficit)
DEFERRED INFLOW OF RESOURCES

- 26
-
Pro
gram
Rev
enue
sC
hang
es in
Net
Pos
ition
(D
efic
it)O
pera
ting
Cap
ital
Bus
ines
s-C
harg
es f
orG
rant
s an
dG
rant
s an
dG
over
nmen
tal
type
Exp
ense
sS
ervi
ces
Con
trib
utio
nsC
ontr
ibut
ions
Act
iviti
esA
ctiv
ities
Tot
als
PR
IMA
RY
GO
VE
RN
ME
NT
GO
VE
RN
ME
NT
AL
AC
TIV
ITIE
S:
144,
772,
158
$ 54
2,98
6$
18
,923
,824
$ -
$
(1
25,3
05,3
48)
$ -
$
(1
25,3
05,3
48)
$ 17
,710
,876
-
2,08
5,66
4
-
(1
5,62
5,21
2)
-
(15,
625,
212)
18,1
27,3
34
-
1,
456,
201
-
(16,
671,
133)
-
(1
6,67
1,13
3)
17
,439
,654
40
2,30
8
1,
119,
557
-
(15,
917,
789)
-
(1
5,91
7,78
9)
14
,042
,517
-
3,70
7,12
9
-
(1
0,33
5,38
8)
-
(10,
335,
388)
5,13
2,86
5
43
0,05
0
45
0,68
2
-
(4,2
52,1
33)
-
(4,2
52,1
33)
14
2,35
0
-
13
9
-
(142
,211
)
-
(1
42,2
11)
8,
945,
807
-
-
-
(8
,945
,807
)
-
(8
,945
,807
)
226,
313,
561
1,37
5,34
4
27,7
43,1
96
-
(197
,195
,021
)
-
(197
,195
,021
)
BU
SIN
ES
S-T
YP
E A
CT
IVIT
IES
:3,
229,
852
2,29
3,12
2
973,
508
-
-
36
,778
36
,778
229,
543,
413
$ 3,
668,
466
$
28,7
16,7
04$
-$
(197
,195
,021
)
36
,778
(1
97,1
58,2
43)
GE
NE
RA
L R
EV
EN
UE
S15
5,71
0,30
0
-
155,
710,
300
Tax
es le
vied
for
spe
cific
pur
pose
s24
,321
,396
-
24,3
21,3
96
Gra
nts,
ent
itlem
ents
, an
d co
ntri
butio
ns
not
res
tric
ted
to s
peci
fic p
rogr
ams
10,9
28,6
39
-
10
,928
,639
In
vest
men
t ea
rnin
gs39
2,04
7
-
392,
047
Oth
er17
9,38
4
-
179,
384
TO
TA
L G
EN
ER
AL
RE
VE
NU
ES
191,
531,
766
-
19
1,53
1,76
6
CH
AN
GE
IN
NE
T P
OS
ITIO
N(5
,663
,255
)
36,7
78
(5,6
26,4
77)
NE
T P
OS
ITIO
N (
DE
FIC
IT),
BE
GIN
NIN
G O
F Y
EA
R(1
91,2
64,7
12)
1,40
8,17
7
(189
,856
,535
)
NE
T P
OS
ITIO
N (
DE
FIC
IT),
EN
D O
F Y
EA
R(1
96,9
27,9
67)
$ 1,
444,
955
$
(195
,483
,012
)$
Th
e a
cco
mp
an
yin
g n
ote
s a
re a
n in
tegr
al p
art
of
the
se f
ina
nci
al s
tate
me
nts
.
Pro
pert
y ta
xes,
levi
ed f
or g
ener
al p
urpo
ses
TO
TA
L P
RIM
AR
Y G
OV
ER
NM
EN
T
Inte
rest
on
long
-ter
m d
ebt
Foo
d se
rvic
e
WE
ST
CH
ES
TE
R A
RE
A S
CH
OO
L D
IST
RIC
TS
TA
TE
ME
NT
OF
AC
TIV
ITIE
SF
OR
TH
E Y
EA
R E
ND
ED
JU
NE
30
, 2
01
6
TO
TA
L G
OV
ER
NM
EN
TA
L A
CT
IVIT
IES
Inst
ruct
ion
Stu
dent
act
iviti
esC
omm
unity
ser
vice
s
Inst
ruct
iona
l stu
dent
sup
port
Adm
inis
trat
ive
and
finan
cial
sup
port
ser
vice
sO
pera
tion
and
mai
nten
ance
of
plan
t se
rvic
esP
upil
tran
spor
tatio
n
Net
(E
xpen
se)
Rev
enue
and
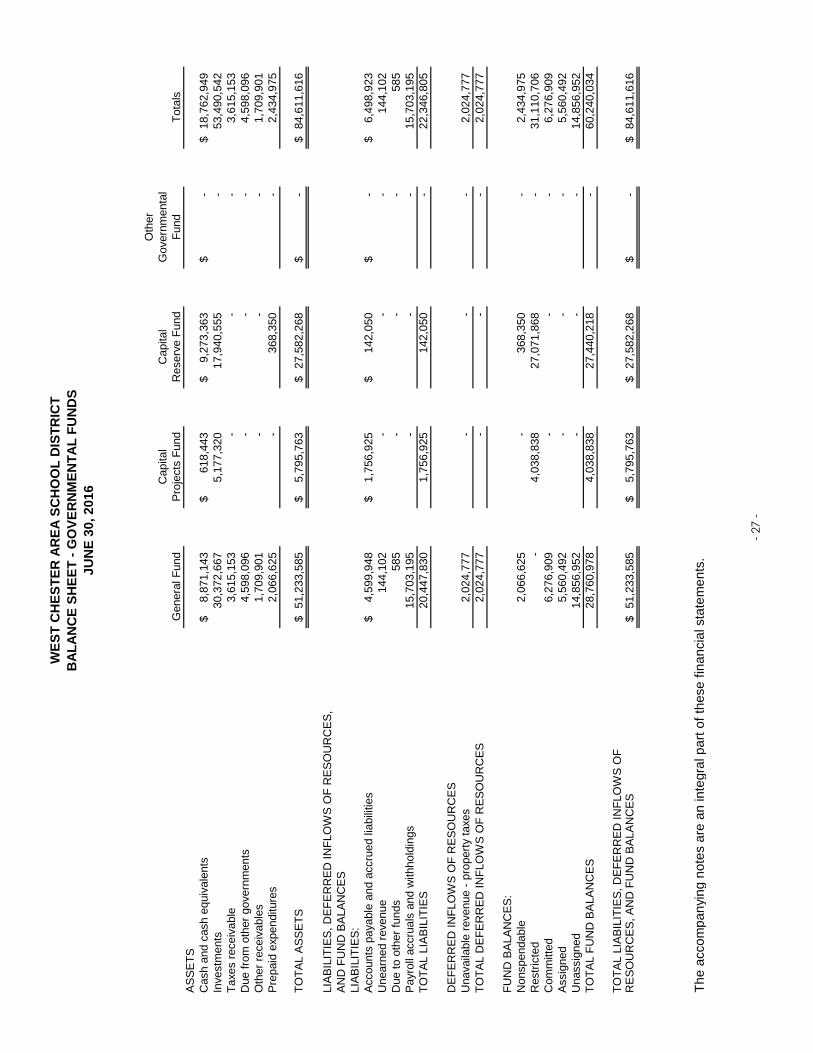
- 27
-
Oth
erC
apita
lC
apita
lG
over
nmen
tal
Gen
eral
Fun
dP
roje
cts
Fun
dR
eser
ve F
und
Fun
dT
otal
sA
SS
ET
S8,
871,
143
$
61
8,44
3$
9,27
3,36
3$
-$
18
,762
,949
$
30,3
72,6
67
5,17
7,32
0
17
,940
,555
-
53
,490
,542
3,
615,
153
-
-
-
3,61
5,15
3
4,
598,
096
-
-
-
4,59
8,09
6
1,
709,
901
-
-
-
1,70
9,90
1
2,
066,
625
-
368,
350
-
2,
434,
975
51,2
33,5
85$
5,
795,
763
$
27
,582
,268
$
-$
84
,611
,616
$
LIA
BIL
ITIE
S,
DE
FE
RR
ED
IN
FLO
WS
OF
RE
SO
UR
CE
S,
AN
D F
UN
D B
ALA
NC
ES
LIA
BIL
ITIE
S:
4,59
9,94
8$
1,75
6,92
5$
142,
050
$
-
$
6,49
8,92
3$
Une
arne
d re
venu
e14
4,10
2
-
-
-
144,
102
58
5
-
-
-
585
15
,703
,195
-
-
-
15
,703
,195
20
,447
,830
1,
756,
925
142,
050
-
22
,346
,805
DE
FE
RR
ED
IN
FLO
WS
OF
RE
SO
UR
CE
SU
nava
ilabl
e re
venu
e -
prop
erty
tax
es2,
024,
777
-
-
-
2,02
4,77
7
T
OT
AL
DE
FE
RR
ED
IN
FLO
WS
OF
RE
SO
UR
CE
S2,
024,
777
-
-
-
2,02
4,77
7
FU
ND
BA
LAN
CE
S:
Non
spen
dabl
e2,
066,
625
-
368,
350
-
2,
434,
975
Res
tric
ted
-
4,03
8,83
8
27
,071
,868
-
31
,110
,706
C
omm
itted
6,27
6,90
9
-
-
-
6,
276,
909
Ass
igne
d5,
560,
492
-
-
-
5,56
0,49
2
14
,856
,952
-
-
-
14
,856
,952
28
,760
,978
4,
038,
838
27,4
40,2
18
-
60,2
40,0
34
RE
SO
UR
CE
S,
AN
D F
UN
D B
ALA
NC
ES
51,2
33,5
85$
5,
795,
763
$
27
,582
,268
$
-$
84
,611
,616
$
Th
e a
cco
mp
an
yin
g n
ote
s a
re a
n in
tegr
al p
art
of
the
se f
ina
nci
al s
tate
me
nts
.
WE
ST
CH
ES
TE
R A
RE
A S
CH
OO
L D
IST
RIC
TB
AL
AN
CE
SH
EE
T -
GO
VE
RN
ME
NT
AL
FU
ND
SJ
UN
E 3
0,
20
16
TO
TA
L A
SS
ET
S
Cas
h an
d ca
sh e
quiv
alen
ts
Inve
stm
ents
Pre
paid
exp
endi
ture
s
Due
fro
m o
ther
gov
ernm
ents
Tax
es r
ecei
vabl
e
Oth
er r
ecei
vabl
es
TO
TA
L LI
AB
ILIT
IES
, D
EF
ER
RE
D I
NF
LOW
S O
F
Acc
ount
s pa
yabl
e an
d ac
crue
d lia
bilit
ies
Due
to
othe
r fu
nds
Pay
roll
accr
uals
and
with
hold
ings
Una
ssig
ned
TO
TA
L F
UN
D B
ALA
NC
ES
TO
TA
L LI
AB
ILIT
IES

- 28 -
TOTAL FUND BALANCES FOR GOVERNMENTAL FUNDS 60,240,034$
293,539,312
2,024,777
7,550,581
(406,171)
Accrued interest (1,500,949)$ Bonds and notes payable in future years, net (290,026,054) Accumulated compensated absences (4,626,439) Net pension liability (293,071,000) (589,224,442)
Deferred outflows of resources:Deferred pension contributions 22,053,155 Deferred outflows - pension 9,097,787
Deferred inflows of resources:Deferred inflows - pension (1,803,000) 29,347,942
TOTAL NET DEFICIT OF GOVERNMENTAL ACTIVITIES (196,927,967)$
The accompanying notes are an integral part of these financial statements.
Deferred inflows and outflows of resources related to the District's net pensionliability are based on the differences between actuarially determined expectedand actual investment returns, changes in the actuarially determined proportionof the District's amount of the total pension liability, differences between actualand expected experience, and pension contributions made after themeasurement date of the net pension liability. These amounts will be amortizedover the estimated remaining average service life of the employees.
WEST CHESTER AREA SCHOOL DISTRICTRECONCILIATION OF BALANCE SHEET - GOVERNMENTAL FUNDS
TO STATEMENT OF NET POSITIONJUNE 30, 2016
Amounts reported for governmental activities in the statement of net positionare different because:
Other post-employment benefits (OPEB) are not financial resources and,therefore, are not reported in the governmental funds.
Long-term liabilities applicable to the governmental activities are not due andpayable in the current period and, therefore, are not reported in thegovernmental funds.
Capital assets used in governmental activities are not financial resources and,therefore, are not reported as assets in the governmental funds. The cost ofassets was $492,079,018, and accumulated depreciation was $198,539,706.
Some of the District's revenues will be collected after year end but are notavailable soon enough to pay the current year's expenditures and, therefore,are reported as unavailable revenue - property taxes in the governmental funds.
Governmental funds report deferred amounts on bond refundings as otherfinancing sources. However, these amounts are reported on the statement ofnet position as deferred outflows of resources and amortized over the life life ofthe refunding debt.

- 29
-
Oth
erC
apita
lC
apita
lG
over
nmen
tal
Gen
eral
Fun
dP
roje
cts
Fun
dR
eser
ve F
und
Fun
dT
otal
sR
EV
EN
UE
S18
2,08
4,69
4$
-$
59,8
32$
-
$
18
2,14
4,52
6$
35,8
06,4
99
-
-
-
35,8
06,4
99
2,86
5,33
5
-
-
-
2,
865,
335
220,
756,
528
-
59,8
32
-
22
0,81
6,36
0
EX
PE
ND
ITU
RE
SC
urre
nt:
Inst
ruct
ion
130,
495,
364
-
1,99
5,01
8
-
13
2,49
0,38
2
S
uppo
rt s
ervi
ces
60,9
41,8
17
116,
980
81
3,90
9
347,
273
62
,219
,979
O
pera
tion
of n
onin
stru
ctio
nal s
ervi
ces
4,80
3,10
5
-
-
-
4,
803,
105
Deb
t se
rvic
e:P
rinc
ipal
8,17
6,00
0
-
-
-
8,
176,
000
Inte
rest
10,1
74,4
33
-
-
-
10,1
74,4
33
Cap
ital o
utla
ys-
7,
160,
342
1,14
8,95
2
-
8,
309,
294
214,
590,
719
7,27
7,32
2
3,
957,
879
347,
273
22
6,17
3,19
3
OV
ER
(U
ND
ER
) E
XP
EN
DIT
UR
ES
6,16
5,80
9
(7
,277
,322
)
(3,8
98,0
47)
(3
47,2
73)
(5
,356
,833
)
OT
HE
R F
INA
NC
ING
SO
UR
CE
S (
US
ES
)R
efun
d of
pri
or y
ear
expe
nditu
res
36,8
57
-
-
-
36
,857
-
-
-
52,2
10,0
00
52,2
10,0
00
-
9,69
0,00
0
-
-
9,
690,
000
Pay
men
t to
ref
und
bond
s-
-
-
(6
0,13
5,70
2)
(6
0,13
5,70
2)
P
rem
ium
on
bond
s is
sued
-
8,79
9
-
8,29
1,51
2
8,
300,
311
Pro
ceed
s fr
om s
ale
of c
apita
l ass
ets
-
5,05
0,00
0
27
,718
-
5,07
7,71
8
-
18
,537
9,10
7,24
7
-
9,
125,
784
Tra
nsfe
rs o
ut(9
,107
,247
)
-
-
(18,
537)
(9,1
25,7
84)
T
OT
AL
OT
HE
R F
INA
NC
ING
SO
UR
CE
S (
US
ES
)(9
,070
,390
)
14,7
67,3
36
9,13
4,96
5
34
7,27
3
15,1
79,1
84
(2,9
04,5
81)
7,
490,
014
5,23
6,91
8
-
9,
822,
351
FU
ND
BA
LAN
CE
S (
DE
FIC
IT),
BE
GIN
NIN
G O
F Y
EA
R31
,665
,559
(3
,451
,176
)
22,2
03,3
00
-
50,4
17,6
83
FU
ND
BA
LAN
CE
S,
EN
D O
F Y
EA
R28
,760
,978
$
4,03
8,83
8$
27,4
40,2
18$
-
$
60
,240
,034
$
Th
e a
cco
mp
an
yin
g n
ote
s a
re a
n in
tegr
al p
art
of
the
se f
ina
nci
al s
tate
me
nts
.
EX
CE
SS
(D
EF
ICIE
NC
Y)
OF
RE
VE
NU
ES
NE
T C
HA
NG
E I
N F
UN
D B
ALA
NC
ES
Bon
ds is
sued
for
ref
undi
ng
Tra
nsfe
rs in
TO
TA
L E
XP
EN
DIT
UR
ES
Bon
ds is
sued
for
cap
ital p
roje
cts
Fed
eral
sou
rces
WE
ST
CH
ES
TE
R A
RE
A S
CH
OO
L D
IST
RIC
TS
TA
TE
ME
NT
OF
RE
VE
NU
ES
, E
XP
EN
DIT
UR
ES
, A
ND
CH
AN
GE
S I
N F
UN
D B
AL
AN
CE
S -
GO
VE
RN
ME
NT
AL
FU
ND
SF
OR
TH
E Y
EA
R E
ND
ED
JU
NE
30
, 2
01
6
TO
TA
L R
EV
EN
UE
S
Loca
l sou
rces
Sta
te s
ourc
es
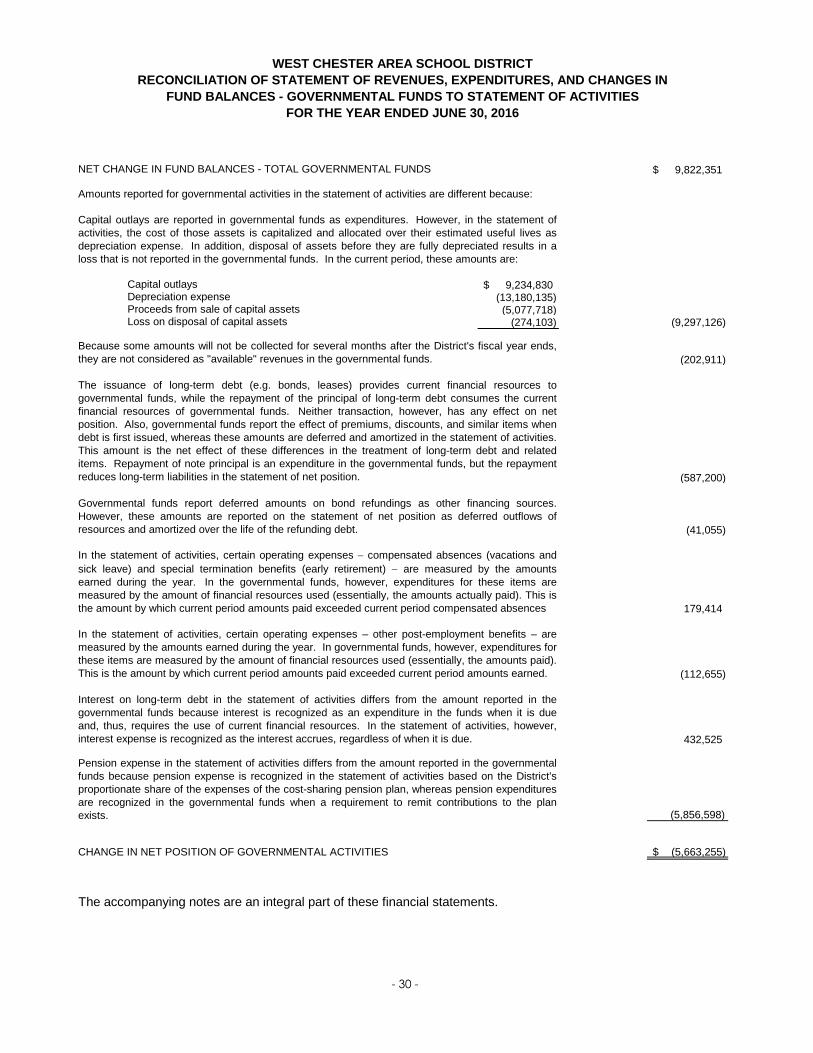
- 30 -
NET CHANGE IN FUND BALANCES - TOTAL GOVERNMENTAL FUNDS 9,822,351$
Amounts reported for governmental activities in the statement of activities are different because:
Capital outlays 9,234,830$ Depreciation expense (13,180,135) Proceeds from sale of capital assets (5,077,718) Loss on disposal of capital assets (274,103) (9,297,126)
(202,911)
(587,200)
(41,055)
179,414
(112,655)
432,525
(5,856,598)
CHANGE IN NET POSITION OF GOVERNMENTAL ACTIVITIES (5,663,255)$
The accompanying notes are an integral part of these financial statements.
Interest on long-term debt in the statement of activities differs from the amount reported in thegovernmental funds because interest is recognized as an expenditure in the funds when it is dueand, thus, requires the use of current financial resources. In the statement of activities, however,interest expense is recognized as the interest accrues, regardless of when it is due.
Pension expense in the statement of activities differs from the amount reported in the governmentalfunds because pension expense is recognized in the statement of activities based on the District'sproportionate share of the expenses of the cost-sharing pension plan, whereas pension expendituresare recognized in the governmental funds when a requirement to remit contributions to the planexists.
Because some amounts will not be collected for several months after the District's fiscal year ends,they are not considered as "available" revenues in the governmental funds.
Governmental funds report deferred amounts on bond refundings as other financing sources.However, these amounts are reported on the statement of net position as deferred outflows ofresources and amortized over the life of the refunding debt.
The issuance of long-term debt (e.g. bonds, leases) provides current financial resources togovernmental funds, while the repayment of the principal of long-term debt consumes the currentfinancial resources of governmental funds. Neither transaction, however, has any effect on netposition. Also, governmental funds report the effect of premiums, discounts, and similar items whendebt is first issued, whereas these amounts are deferred and amortized in the statement of activities.This amount is the net effect of these differences in the treatment of long-term debt and relateditems. Repayment of note principal is an expenditure in the governmental funds, but the repaymentreduces long-term liabilities in the statement of net position.
In the statement of activities, certain operating expenses − compensated absences (vacations andsick leave) and special termination benefits (early retirement) − are measured by the amountsearned during the year. In the governmental funds, however, expenditures for these items aremeasured by the amount of financial resources used (essentially, the amounts actually paid). This isthe amount by which current period amounts paid exceeded current period compensated absences
In the statement of activities, certain operating expenses – other post-employment benefits – aremeasured by the amounts earned during the year. In governmental funds, however, expenditures forthese items are measured by the amount of financial resources used (essentially, the amounts paid).This is the amount by which current period amounts paid exceeded current period amounts earned.
FOR THE YEAR ENDED JUNE 30, 2016
WEST CHESTER AREA SCHOOL DISTRICTRECONCILIATION OF STATEMENT OF REVENUES, EXPENDITURES, AND CHANGES IN
FUND BALANCES - GOVERNMENTAL FUNDS TO STATEMENT OF ACTIVITIES
Capital outlays are reported in governmental funds as expenditures. However, in the statement ofactivities, the cost of those assets is capitalized and allocated over their estimated useful lives asdepreciation expense. In addition, disposal of assets before they are fully depreciated results in aloss that is not reported in the governmental funds. In the current period, these amounts are:

- 31 -
Variance WithFinal Budget
Budgeted Amounts PositiveOriginal Final Actual (Negative)
REVENUES 181,217,141$ 181,217,141$ 182,084,694$ 867,553$ 36,653,608 36,653,608 35,806,499 (847,109) 2,680,331 2,680,331 2,865,335 185,004
220,551,080 220,551,080 220,756,528 205,448
EXPENDITURESCurrent:
InstructionRegular programs, elementary/secondary 89,029,451 89,765,447 89,750,239 15,208 Special programs, elementary/secondary 31,686,192 34,427,348 34,299,536 127,812 Vocational education programs 5,985,970 5,974,407 5,755,521 218,886 Other instructional programs 769,060 767,416 668,126 99,290 Nonpublic school programs 50,872 50,872 21,942 28,930
Total Instruction 127,521,545 130,985,490 130,495,364 490,126 Support services
Pupil personnel 8,724,176 8,715,300 8,637,182 78,118 Instructional staff 5,573,653 5,600,161 5,213,154 387,007 Administration 10,931,643 10,843,944 10,569,909 274,035 Pupil health 2,132,745 2,182,326 2,165,522 16,804 Business 1,879,640 1,879,640 1,859,038 20,602 Operation and maintenance of plant services 17,253,659 15,924,951 15,696,512 228,439 Student transportation services 13,616,878 13,487,098 13,183,652 303,446 Central 3,270,296 3,497,263 3,489,068 8,195 Other support services 207,530 207,530 127,780 79,750
Total Support Services 63,590,220 62,338,213 60,941,817 1,396,396 Operation of noninstructional services
Student activities 4,806,623 4,806,782 4,669,384 137,398 Community services 136,035 134,539 133,721 818
4,942,658 4,941,321 4,803,105 138,216 Debt service
20,810,657 18,350,434 18,350,433 1 216,865,080 216,615,458 214,590,719 2,024,739
EXCESS OF REVENUES OVER EXPENDITURES 3,686,000 3,935,622 6,165,809 2,230,187
OTHER FINANCING SOURCES (USES)- - 36,857 36,857
(8,857,625) (9,107,247) (9,107,247) - (8,857,625) (9,107,247) (9,070,390) 36,857
(5,171,625) (5,171,625) (2,904,581) 2,267,044
FUND BALANCE, BEGINNING OF YEAR 31,665,559 31,665,559 31,665,559 -
FUND BALANCE, END OF YEAR 26,493,934$ 26,493,934$ 28,760,978$ 2,267,044$
The accompanying notes are an integral part of these financial statements.
Principal, interest, and fiscal agent fees
WEST CHESTER AREA SCHOOL DISTRICTBUDGETARY COMPARISON STATEMENT - GENERAL FUND
FOR THE YEAR ENDED JUNE 30, 2016
Total Operation of Noninstructional Services
Local sourcesState sourcesFederal sourcesTOTAL REVENUES
TOTAL OTHER FINANCING USES
NET CHANGE IN FUND BALANCE
TOTAL EXPENDITURES
Interfund transfer outRefund of prior year expenditures

- 32 -
FoodService Fund
ASSETSCURRENT ASSETS:
52,310$ 1,197,402
24,477 Due from other funds 585
96,757 27,633
TOTAL CURRENT ASSETS 1,399,164
CAPITAL ASSETS:402,386
1,801,550$
LIABILITIES AND NET POSITIONCURRENT LIABILITIES:
182,849$ 173,746
TOTAL LIABILITIES 356,595
NET POSITION:402,386
1,042,569 1,444,955
1,801,550$
The accompanying notes are an integral part of these financial statements.
Other receivables
Furniture and equipment, net
WEST CHESTER AREA SCHOOL DISTRICTSTATEMENT OF NET POSITION - PROPRIETARY FUND
JUNE 30, 2016
Cash and cash equivalentsInvestmentsDue from other governments
Inventories, donated commodities
TOTAL LIABILITIES AND NET POSITION
Unearned revenue
TOTAL ASSETS
Investment in capital assetsUnrestricted
Accounts payable and accrued liabilities
TOTAL NET POSITION

- 33 -
FoodService Fund
OPERATING REVENUES2,293,122$ 2,293,122
OPERATING EXPENSES3,172,064
56,040 1,748
3,229,852
(936,730)
NONOPERATING REVENUES69,269
901,501 2,738
973,508
36,778
NET POSITION, BEGINNING OF YEAR 1,408,177
NET POSITION, END OF YEAR 1,444,955$
The accompanying notes are an integral part of these financial statements.
CHANGE IN NET POSITION
TOTAL OPERATING EXPENSES
OPERATING LOSS
TOTAL NONOPERATING REVENUES
State sourcesFederal sourcesInterest income
WEST CHESTER AREA SCHOOL DISTRICT
STATEMENT OF REVENUES, EXPENSES, AND CHANGES IN NET POSITION -
PROPRIETARY FUND
FOR THE YEAR ENDED JUNE 30, 2016
Other operating costs
Food service revenuesTOTAL OPERATING REVENUES
Professional and contract servicesDepreciation

- 34 -
FoodService Fund
CASH FLOWS FROM OPERATING ACTIVITIES:2,419,317$
(3,081,003) (661,686)
CASH FLOWS FROM NONCAPITAL FINANCING ACTIVITIES:59,010
778,702 NET CASH PROVIDED BY NONCAPITAL FINANCING ACTIVITIES 837,712
CASH FLOWS FROM CAPITAL AND RELATED FINANCING ACTIVITIES:(160,788) (160,788)
CASH FLOWS FROM INVESTING ACTIVITIES:(51,528)
2,738 (48,790)
(33,552)
CASH AND CASH EQUIVALENTS, BEGINNING OF YEAR 85,862
CASH AND CASH EQUIVALENTS, END OF YEAR 52,310$
RECONCILIATION OF OPERATING LOSS TO NET CASH USEDBY OPERATING ACTIVITIES:
(936,730)$
operating activities:Depreciation 56,040 Commodities usage 139,582 Changes in assets and liabilities:
Decrease in other receivables 100,278 (Increase) in due from other funds (93) (Decrease) in accounts payable and accrued liabilities (46,774) Increase in unearned revenue 26,011
(661,686)$
139,582$
The accompanying notes are an integral part of these financial statements.
USDA donated commodities
Operating lossAdjustments to reconcile operating loss to net cash used by
NET CASH USED BY OPERATING ACTIVITIES
NET CASH USED BY INVESTING ACTIVITIES
NONCASH NONCAPITAL FINANCING ACTIVITY: SUPPLEMENTAL DISCLOSURE
NET CHANGE IN CASH AND CASH EQUIVALENTS
WEST CHESTER AREA SCHOOL DISTRICTSTATEMENT OF CASH FLOWS - PROPRIETARY FUND
FOR THE YEAR ENDED JUNE 30, 2016
Interest income
NET CASH USED BY OPERATING ACTIVITIESPayments to suppliers
NET CASH USED BY CAPITAL AND RELATED FINANCING ACTIVITIES
Federal sources
Purchase of investment securities and deposits to investment pools
Receipts from customers
Purchase of capital assets
State sources

- 35
-
Tot
alP
rivat
e-S
tude
ntO
ther
Age
ncy
Pur
pose
Act
ivity
Fun
dsA
genc
y F
und
Fun
dsT
rust
AS
SE
TS
432,
065
$
60
,164
$
49
2,22
9$
410,
690
$
432,
065
$
60
,164
$
49
2,22
9$
410,
690
$
LIA
BIL
ITIE
S A
ND
NE
T P
OS
ITIO
NLI
AB
ILIT
IES
:43
2,06
5$
60,1
64$
492,
229
$
-
$
T
OT
AL
LIA
BIL
ITIE
S43
2,06
5
60,1
64
492,
229
-
NE
T P
OS
ITIO
N:
-
-
-
410,
690
T
OT
AL
NE
T P
OS
ITIO
N-
-
-
41
0,69
0
TO
TA
L LI
AB
ILIT
IES
AN
D N
ET
PO
SIT
ION
432,
065
$
60
,164
$
49
2,22
9$
410,
690
$
The
acc
ompa
nyin
g no
tes
are
an in
tegr
al p
art o
f the
se fi
nanc
ial s
tate
men
ts.
Res
tric
ted
Cas
h an
d ca
sh e
quiv
alen
ts
WE
ST
CH
ES
TE
R A
RE
A S
CH
OO
L D
IST
RIC
T
ST
AT
EM
EN
T O
F N
ET
PO
SIT
ION
- F
IDU
CIA
RY
FU
ND
S
JUN
E 3
0, 2
016
TO
TA
L A
SS
ET
S
Oth
er c
urre
nt li
abili
ties

- 36 -
Private-Purpose
TrustADDITIONS
647,151$
647,151
DEDUCTIONS
733,376
733,376
(86,225)
NET POSITION, BEGINNING OF YEAR 496,915
NET POSITION, END OF YEAR 410,690$
The accompanying notes are an integral part of these financial statements.
WEST CHESTER AREA SCHOOL DISTRICTSTATEMENT OF CHANGES IN NET POSITION - FIDUCIARY FUND
FOR THE YEAR ENDED JUNE 30, 2016
Gifts and contributions
CHANGE IN NET POSITION
TOTAL DEDUCTIONS
Grants
TOTAL ADDITIONS

WEST CHESTER AREA SCHOOL DISTRICT
NOTES TO FINANCIAL STATEMENTS
-37-
NOTE 1 SUMMARY OF SIGNIFICANT ACCOUNTING POLICIES
The West Chester Area School District’s (“the District”) financial statements are prepared in
accordance with generally accepted accounting principles ("GAAP"). The Governmental
Accounting Standards Board ("GASB") is responsible for establishing GAAP for state and local
governments through its pronouncements (Statements and Interpretations). The more
significant accounting policies established in GAAP and used by the District are discussed
below.
Reporting Entity
The District is governed by an elected Board of Directors. Generally accepted accounting
principles require that the financial statements present the District and its component units,
entities for which the District is considered to be financially accountable. Blended
component units, although legally separate entities, are, in substance, part of the District's
operations and, therefore, data from these units are required to be combined with data of
the primary school district. Each discretely presented component unit, on the other hand, is
required to be reported in a separate column in the entity-wide financial statements to
emphasize it is legally separate from the District. Based on the application of these
principles, there are no component units presented in the District's financial statements.
Entity-wide and Fund Financial Statements
The entity-wide financial statements (i.e., the statement of net position and the statement of
activities) report information on all of the nonfiduciary activities of the District and its
component units. For the most part, the effect of interfund activity has been removed from
these statements. Governmental activities, which normally are supported by taxes and
intergovernmental revenues, are reported separately from business-type activities, which rely
to a significant extent on fees and charges for services.
The statement of activities demonstrates the degree to which the direct expenses of a given
function or segment is offset by program revenues. Direct expenses are those that are clearly
identifiable with a specific function or segment. Program revenues include 1) charges to
customers or applicants who purchase, use, or directly benefit from goods, services, or
privileges provided by a given function or segment; and 2) grants and contributions that are
restricted to meeting the operational or capital requirements of a particular function or
segment. Taxes and other items not properly included among program revenues are
reported instead as general revenues.
Separate financial statements are provided for governmental funds, proprietary funds, and
fiduciary funds even though the latter are excluded from the entity-wide financial statements.
Major individual governmental funds and major individual enterprise funds are reported as
separate columns in the fund financial statements.

WEST CHESTER AREA SCHOOL DISTRICT
NOTES TO FINANCIAL STATEMENTS
-38-
NOTE 1 SUMMARY OF SIGNIFICANT ACCOUNTING POLICIES (cont'd)
Measurement Focus, Basis of Accounting, and Financial Statement Presentation
The entity-wide financial statements are reported using the economic resources
measurement focus and the accrual basis of accounting, as are the proprietary fund and
fiduciary fund financial statements. Revenues are recorded when earned and expenses are
recorded when a liability is incurred, regardless of the timing of related cash flows. Property
taxes are recognized as revenues in the year for which they are levied. Grants and similar
items are recognized as revenue as soon as all eligibility requirements imposed by the
provider have been met.
Governmental fund financial statements are reported using the current financial resources
measurement focus and the modified accrual basis of accounting. Revenues are
recognized as soon as they are both measurable and available. Revenues are considered
to be available when they are collectible within the current period or soon enough thereafter
to pay liabilities of the current period. For this purpose, the District considers revenues to be
available if they are collected within 60 days of the end of the current fiscal period.
Expenditures generally are recorded when a liability is incurred, as under accrual
accounting. However, debt service expenditures, as well as expenditures related to
compensated absences and claims and judgments, are recorded only when payment is
due.
The District reports the following major government funds:
General Fund The General Fund is the District's primary operating fund. It accounts for all
financial resources, except those required to be accounted for in another fund.
Capital Projects Fund The Capital Projects Fund is used to account for financial resources to
be used for the acquisition or construction of major capital assets other than those financed
by enterprise operations.
Capital Reserve Fund The Capital Reserve Fund is used for funds set aside that are legally
restricted to expenditures for specific purposes.
The District reports one nonmajor fund (debt service), which is used to record certain debt
activity.
The District reports the following major proprietary fund:
Food Service Fund The Food Service Fund (an enterprise fund) is used to account for the
operations of the District's school cafeterias that are financed and operated in a manner
similar to a private business enterprise wherein the intent of the governing body is that the
cost of providing goods or services to the school population on a continuing basis will be
recovered or financed primarily through user charges.

WEST CHESTER AREA SCHOOL DISTRICT
NOTES TO FINANCIAL STATEMENTS
-39-
NOTE 1 SUMMARY OF SIGNIFICANT ACCOUNTING POLICIES (cont'd)
These funds distinguish operating revenues and expenses from nonoperating items.
Operating revenues and expenses generally result from providing services and producing
and delivering goods in connection with the proprietary funds’ principal ongoing operations.
The principal operating revenue of the District’s enterprise fund is food service charges.
Operating expenses for the District’s enterprise fund includes food production costs, supplies,
and administrative costs. All revenues or expenses not meeting this definition are reported as
nonoperating revenues and expenses.
For purposes of the statement of cash flows of proprietary funds, cash equivalents include all
highly liquid debt instruments with original maturities of three months or less.
When both restricted and unrestricted resources are available for use, it is the District's policy
to use restricted resources first, then unrestricted resources as they are needed.
Additionally, the District reports the following fund types:
Fiduciary Funds Fiduciary funds are used to account for assets held by the District in a
trustee capacity or as an agent for individuals, private organizations, or other governments.
These include private-purpose trust funds and agency funds. Private-purpose trust funds
account for resources, including both principal and earnings, which must be expended in
accordance with a trust agreement and are accounted for in essentially the same manner as
proprietary funds. Agency funds are purely custodial and, thus, do not involve measurement
of the results of operations.
Assets, Liabilities, and Net Position or Equity
Deposits and Investments
Under Section 440-1 of the Public School Code of 1949, as amended, the District is permitted
to invest funds consistent with sound business practices in the following types of investments:
– Obligations of (a) the United States of America or any of its agencies or instrumentalities
backed by the full faith and credit of the United States of America; (b) the
Commonwealth of Pennsylvania or any of its agencies or instrumentalities backed by
the full faith and credit of the Commonwealth; or (c) any political subdivision of the
Commonwealth of Pennsylvania or any of its agencies or instrumentalities backed by
the full faith and credit of the political subdivision.
– Deposits in savings accounts or time deposits or share accounts of institutions insured by
the Federal Deposit Insurance Corporation ("FDIC") or the Federal Savings and Loan
Insurance Corporation ("FSLIC") to the extent that such accounts are so insured and, for
any amounts above the insured maximum, provided that approved collateral as
provided by law, therefore, shall be pledged by the depository.
WEST CHESTER AREA SCHOOL DISTRICT
NOTES TO FINANCIAL STATEMENTS
-40-
NOTE 1 SUMMARY OF SIGNIFICANT ACCOUNTING POLICIES (cont'd)
During the year ended June 30, 2016, permitted investments were expanded to include
highly rated commercial paper, bankers’ acceptances, and negotiable certificates of
deposit.
Investments are reported at fair value, except for repurchase agreements and nonnegotiable
certificates of deposit which are reported at cost. In establishing the fair value of investments,
the District uses the following hierarchy. The lowest available level of valuation available is
used for all investments.
Level 1 – Valuations based on quoted market prices in active markets for identical assets or
liabilities that the entity has the ability to access.
Level 2 – Valuations based on quoted prices of similar products in active markets or identical
products in markets that are not active or for which all significant inputs are observable,
directly or indirectly.
Level 3 – Valuations based on inputs that are unobservable and significant to the overall fair
value measurement.
Receivables and Payables
Activity between funds that are representative of lending/borrowing arrangements
outstanding at the end of the fiscal year is referred to as either "due to/from other funds" (i.e.,
the current portion of interfund loans) or "advances to/from other funds" (i.e., the noncurrent
portion of interfund loans). Any residual balances outstanding between the governmental
activities and business-type activities are reported in the entity-wide financial statements as
"internal balances."
All trade and property tax receivables are shown net of any allowance for uncollectibles.
There are no allowances at June 30, 2016.
Taxes are levied on July 1 and payable in the following periods:
Discount Period - July 1 to August 31 - 2% of gross levy
Flat Period - September 1 - October 31
Penalty Period - November 1 - collection - 10% of gross levy
Lien Date - January 15
Prepaid items
Certain payments to vendors reflect costs applicable to future accounting periods and are
reported as prepaid items in both entity-wide and fund financial statements. In both the
governmental funds and the proprietary fund, these payments are reported as expense
when they are consumed in accordance with the consumption method of accounting.

WEST CHESTER AREA SCHOOL DISTRICT
NOTES TO FINANCIAL STATEMENTS
-41-
NOTE 1 SUMMARY OF SIGNIFICANT ACCOUNTING POLICIES (cont'd)
Inventory
All inventories are valued at the lower of cost (first-in, first-out method) or market. Inventories
reported in the governmental funds consist of expendable materials and supplies, which are
recorded as expenditures when purchased. Inventories in the proprietary fund consist of
food and related supplies, and are recorded as expenses when consumed.
Capital Assets
Capital assets, which include property, plant, and equipment, are reported in the applicable
governmental or business-type activities columns in the entity-wide financial statements.
Capital assets are defined by the District as assets with an initial, individual cost of more than
$5,000 and an estimated useful life in excess of one year. Such assets are recorded at
historical cost or estimated historical cost if purchased or constructed. Donated capital
assets are recorded at estimated fair market value at the date of donation. The costs of
normal maintenance and repairs that do not add to the value of the assets or materially
extend assets' lives are not capitalized.
Major outlays for capital assets and improvements are capitalized as projects are
constructed. Interest incurred during construction is not capitalized.
Property, plant, and equipment are depreciated using the straight-line method over the
following estimated useful lives:
Buildings 20 - 40 years
Land improvements 20 years
Furniture and equipment 3 - 20 years
Compensated Absences
It is the District's policy to permit employees to accumulate earned but unused vacation and
sick pay benefits. The liability for unpaid accumulated sick leave is accounted for in the
accrued severance pay. This time is paid out only through severance pay calculations.
District employees who are required to work on a 12-month schedule are credited with
vacation at rates which vary with length of service or job classification. Vacation must be
taken in the year subsequent to when it was earned. If separation of service occurs in the
year subsequent to earning, then the unused balance of the amount earned in the prior year
is paid at separation. The liability at June 30 represents vacation earned at that date that will
be taken in the subsequent year.
WEST CHESTER AREA SCHOOL DISTRICT
NOTES TO FINANCIAL STATEMENTS
-42-
NOTE 1 SUMMARY OF SIGNIFICANT ACCOUNTING POLICIES (cont'd)
Accrued Severance Pay
Administrative personnel who have completed at least 12 years of credited District service
and retire under normal PSERS guidelines receive severance pay in the form of
compensation. Instructional, secretarial, and support personnel who have completed at
least 15 years of credited District service and retire under the normal PSERS guidelines receive
severance pay in the form of compensation. Administrative personnel receive $45 - $80 per
day for every day of accumulated sick and personal days at retirement. Instructional
personnel receive $45 -$80 per day. Secretarial and support personnel receive $65 per day
for every day of accumulated sick and personal days at retirement to a maximum $10,000 of
compensation. Severance pay generally is liquidated by the General Fund.
Long-term Obligations
In the entity-wide financial statements and proprietary fund financial statements, long-term
debt and other long-term obligations are reported as liabilities in the applicable
governmental activities, business-type activities, or proprietary fund type statement of net
position. Bond premiums and discounts are netted against outstanding principal balances
and amortized over the life of the bonds. Bond issuance costs are expensed when incurred.
Deferred amounts on refunding are recorded as deferred inflows or outflows of resources and
amortized over the life of the old debt or the life of the new debt, whichever is shorter. All
amortized amounts are amortized using the straight-line method which approximates the
effective interest method.
In the fund financial statements, governmental fund types recognize bond premiums and
discounts, as well as bond issuance costs, during the current period. The face amount of
debt issued is reported as other financing sources. Premiums received on debt issuances are
reported as other financing sources while discounts on debt issuances are reported as other
financing uses. Issuance costs, whether or not withheld from the actual debt proceeds
received, are reported as debt service expenditures.
Deferred Inflows and Outflows of Resources
In addition to assets and liabilities, the statement of net position includes separate sections for
deferred outflows of resources and deferred inflows of resources. These separate financial
statement elements represent an addition to or consumption of net position that applies to
future periods and so will not be recognized as an outflow of resources (expense) or inflow of
resources (revenue) until then. The District has various items that are reported in these
categories.
The first deferred outflow is the deferred charge on refunding reported in the government-
wide statement of net position. A deferred charge on refunding results from the difference in
the carrying value of refunded debt and its reacquisition price. This amount is deferred and
amortized over the shorter of the life of the refunded or refunding debt.

WEST CHESTER AREA SCHOOL DISTRICT
NOTES TO FINANCIAL STATEMENTS
-43-
NOTE 1 SUMMARY OF SIGNIFICANT ACCOUNTING POLICIES (cont'd)
The second deferred outflow relates to pension contributions made subsequent to the
measurement date of the net pension liability (generally measured one year prior to the date
of the financial statements), and the unamortized portion of contributions made in excess of
the District’s share of its proportionate contributions to its pension plan. Deferred outflows also
encompass the actuarially determined amount of the additional expense resulting from the
change in the District’s share of the net pension liability from year to year. These amounts are
amortized over the actuarially determined estimated remaining service life of all employees
in the plan.
In the statement of net positon, a deferred inflow is recorded when the pension plan’s
investments realize a greater rate of return than the estimated rate of return used as part of
the actuarial valuation of the plan; the excess amount is amortized over five years. A
deferred inflow of resources is also recorded for differences between the actuarially
expected and actual experiences of the Plan, which are amortized over the estimated
remaining service life of all employees in the Plan. See Note 13 for further analysis of
deferred outflows and inflows of resources related to the net pension liability.
Governmental funds report deferred inflows of resources in connection with receivables for
revenues that are not considered to be available to liquidate liabilities of the current period.
Governmental funds also defer revenue recognition with resources that have been received,
but not yet earned. At the end of the current fiscal year, deferred inflows of resources
reported in the general fund resulted from delinquent property taxes receivable.
Fund Equity
Fund balance will be displayed in the following classification (if applicable) depicting the
relative strength of the spending constraints placed on the purposes for which resources can
be used:
Nonspendable – that portion of the fund balance that cannot be spent because it is either in
a nonspendable form or legally or contractually required to be maintained intact.
Restricted – that portion of the fund balance that is constrained to be used for a specific
purpose as per an external party or law.
Committed – that portion of the balance that is to be used for a specific purpose as per
School Board motion. These constraints can be removed or changed by equal level action.
Action to constrain resources should occur prior to the fiscal year end. Direction from the
School Board can commit specific dollar amounts, percentages, or funds related to a
specific activity.

WEST CHESTER AREA SCHOOL DISTRICT
NOTES TO FINANCIAL STATEMENTS
-44-
NOTE 1 SUMMARY OF SIGNIFICANT ACCOUNTING POLICIES (cont'd)
Assigned – that portion of the fund balance that is intended to be used for specific purposes.
The Property and Finance Committee, the Superintendent, or the Director of Business Affairs
may assign amounts for specific purposes.
Unassigned – that portion of the fund balance that represents expendable available
financial resources. It is the residual after the nonspendable, restricted, committed, and
assigned portions are deducted from the total fund balance. A negative unassigned fund
balance may be reported in the other governmental funds (not general fund) if expenditures
incurred for specific purposes exceeded the amounts restricted, committed, or assigned to
those purposes.
When an expenditure is incurred for purposes for which both restricted and unrestricted fund
balances are available, the District considers restricted funds to have been spent first. When
an expenditure is incurred for which committed, assigned, or unassigned fund balances are
available, the District considers amounts to have been spent first out of committed funds, then
assigned funds and, finally, unassigned funds, as needed, unless the School Board, the
Property and Finance Committee, the Superintendent, or the Director of Business Affairs has
provided otherwise in its commitment or assignment actions.
The District is committed to maintaining a prudent level of financial resources to protect
against the needs to reduce service levels because of temporary revenue shortfalls or
unpredicted expenditures. The District’s minimum fund balance policy requires that the
unassigned fund balance equal or exceed five percent of the subsequent year’s general
fund operating expenditures.
Net Position
The entity-wide financial statements report net position in one of three components. Net
investment in capital assets consists of capital assets, net of accumulated depreciation, and
reduced by the outstanding balances of borrowings attributable to acquiring, constructing,
or improving those assets. Net position is reported as restricted when constraints placed on
net position use are either externally imposed by creditors (such as through debt covenants),
grantors, contributors, or laws or regulations of other governments or imposed by law through
constitutional provisions or enabling legislation. Those restrictions affect net position arising
from the capital projects fund. Unrestricted net position consists of net position that does not
meet the definition of “net investment in capital assets” or “restricted.”
Use of Estimates in the Preparation of Financial Statements
The preparation of basic financial statements in conformity with generally accepted
accounting principles requires management to make estimates and assumptions that affect
the amounts reported in the financial statements and accompanying notes. Actual results
may differ from those estimates.

WEST CHESTER AREA SCHOOL DISTRICT
NOTES TO FINANCIAL STATEMENTS
-45-
NOTE 1 SUMMARY OF SIGNIFICANT ACCOUNTING POLICIES (cont'd)
Implementation of GASB Statement
During the year ended June 30, 2016, the District implemented GASB Statement No. 72, “Fair
Value Measurement and Application.” GASB Statement No. 72 provides guidance for
determining a fair value measurement for financial reporting purposes and applying fair
value to certain investments, as well as improving disclosures related to all fair value
measurements. The effects of this statement have been included in the District’s footnote
disclosures.
NOTE 2 BUDGETARY INFORMATION
Budgets are adopted on a basis consistent with generally accepted accounting principles.
An annual appropriated budget is adopted for the general fund. All annual appropriations
lapse at fiscal year end. Project-length financial plans are adopted for all capital projects
funds.
The District follows these procedures in establishing the budgetary data reflected in the
financial statements:
1. The Director of Business Affairs submits to the School Board a proposed operating budget
for the fiscal year commencing the following July 1. The operating budget includes
proposed expenditures and the means of financing them.
2. Public meetings are conducted at the District offices to obtain taxpayer comments.
3. Prior to July 1, the budget is legally enacted through passage of an ordinance.
4. Formal budgetary integration is employed as a management control device during the
year for the general fund.
5. Budgeted amounts are as originally adopted, or as amended by the School Board.
NOTE 3 DEPOSITS
Custodial Credit Risk
Custodial credit risk is the risk that in the event of a bank failure, the government's deposits
may not be returned. The District does not have a policy for custodial credit risk but operates
under the provisions of Commonwealth laws (Act 72). At June 30, 2016, the carrying amount

WEST CHESTER AREA SCHOOL DISTRICT
NOTES TO FINANCIAL STATEMENTS
-46-
NOTE 3 DEPOSITS (cont’d)
of the District's deposits was $19,718,178, and the bank balance was $20,474,343. Of the
bank balance, $250,000 was covered by federal depository insurance. The remaining
balance was fully collateralized. This collateral was held by the depository’s agent on a
pooled basis not in the District’s name.
NOTE 4 INVESTMENTS
The District purchases money market holdings, certificates of deposit ("CDs") and government
agency securities through Fulton Financial Advisors. The money market is a federal money
market fund and maintains a stable net asset value of $1 per share, is rated by a nationally
recognized statistical rating organization, and is subject to an independent annual audit. As
of June 30, 2016, it was rated AAA by a nationally recognized statistical rating agency.
Fulton Financial Advisors is a registered member of the Securities and Exchange Commission
and subject to the Commission’s oversight. These investments are held by a third party.
Investments are in short-term securities in accordance with the District’s investment policy and
school district code. All agency securities purchased are highly rated by a nationally
recognized rating agency. All CDs are purchased at values to stay within the FDIC insurance
limits.
The District categorizes its fair value measurements within the fair value hierarchy established
by generally accepted accounting principles. The District has the following recurring fair
value measurements as of June 30, 2016:
Maturity in Maturity in
Less than Greater than
Fair Value Level 1 Level 2 One Year One Year
General Fund
CRIMS - Certificates of deposit $ 21,306,628 $ - $ 21,306,628 $ 21,306,628 $ -
CRIMS - Money market 1,010,756 1,010,756 - 1,010,756 -
CRMIS - Agencies 7,324,482 - 7,324,482 7,324,482 -
Pennsylvania School District
Liquid Asset Fund (“PSDLAF”) 461,384 461,384 - 461,384 -
Pennsylvania Treasurer’s 461,384
Investment Program (“PTIP”) 269,417 269,417 - 269,417 -
Total General Fund 30,372,667 1,741,557 28,631,110 30,372,667 -
Capital Projects Fund
Pennsylvania Local Government
Investment Trust (“PLGIT”) 5,177,320 5,177,320 - 5,177,320 -
Total Capital Projects Fund 5,177,320 5,177,320 - 5,177,320 -

WEST CHESTER AREA SCHOOL DISTRICT
NOTES TO FINANCIAL STATEMENTS
-47-
NOTE 4 INVESTMENTS (cont’d)
Maturity in Maturity in
Less than Greater than
Fair Value Level 1 Level 2 One Year One Year
Capital Reserve Fund Account
CRIMS - Certificates of deposit 8,574,966 - 8,574,966 7,098,571 1,476,395
CRIMS - Money market 8,111,085 8,111,085 - 8,111,085 -
CRIMS - Agencies 1,249,431 - 1,249,431 1,249,431 -
Pennsylvania School District
Liquid Asset Fund (“PSDLAF”) 779 779 - 779 -
Pennsylvania Local Government
Investment Trust (“PLGIT”) 4,294 4,294 - 4,294 -
Total Capital Reserve Fund Account 17,940,555 8,116,158 9,824,397 16,464,160 1,476,395
Food Service Fund
Pennsylvania Treasurer’s
Investment Program (“PTIP”) 1,197,402 1,197,402 - 1,197,402 -
Total Food Service Fund 1,197,402 1,197,402 - 1,197,402 -
TOTALS $ 54,687,944 $ 16,232,437 $ 38,455,507 $ 53,211,549 $ 1,476,395
Although not registered with the Securities and Exchange Commission and not subject to
regulatory oversight, PSDLAF, PLGIT, and PTIP act like money market mutual funds in that its
objective is to maintain a stable net asset value of $1 per share, is rated by a nationally
recognized statistical rating organization, and is subject to an independent annual audit. As
of June 30, 2016, each was rated as AAA by a nationally recognized statistical rating
agency.
NOTE 5 TAXES RECEIVABLE
Taxes receivable as of year-end for the District, in the aggregate, are as follows:
General Fund
Real estate taxes $ 2,503,071
Transfer taxes 362,493
Earned income taxes 749,589
Total Taxes Receivable $ 3,615,153

WEST CHESTER AREA SCHOOL DISTRICT
NOTES TO FINANCIAL STATEMENTS
-48-
NOTE 5 TAXES RECEIVABLE (cont’d)
The District's evaluation of taxes resulted in no allowance for uncollectible accounts.
Governmental funds report unavailable revenue in connection with receivables for revenues
that are not considered to be available to liquidate liabilities of the current period. At the
end of the current fiscal year, unavailable revenue of $2,024,777 reported in the
governmental funds resulted from delinquent property taxes receivable which was not
collected within 60 days of fiscal year end.
NOTE 6 CAPITAL ASSETS
Capital asset activity for the year ended June 30, 2016 was as follows:
Beginning Ending
Balance Increases Decreases Transfers Balance
GOVERNMENTAL ACTIVITIES
Capital assets not being
depreciated:
Land $ 33,159,800 $ - $ 5,318,056 $ 448,172 $ 28,289,916
Construction-in-progress 8,544,126 8,403,888 - (3,097,516) 13,850,498
Total Capital Assets Not Being
Depreciated 41,703,926 8,403,888 5,318,056 (2,649,344) 42,140,414
Capital assets being depreciated:
Land improvements 15,387,038 - - 383,228 15,770,266
Buildings 396,169,432 6,695 - 2,266,116 398,442,243
Furniture and equipment 35,366,723 824,247 464,875 - 35,726,095
Total Capital Assets Being
Depreciated 446,923,193 830,942 464,875 2,649,344 449,938,604
Accumulated depreciation for:
Land improvements 5,897,184 740,215 - - 6,637,399
Buildings 149,226,227 10,256,224 - - 159,482,451
Furniture and equipment 30,667,270 2,183,696 431,110 - 32,419,856
Total Accumulated Depreciation 185,790,681 13,180,135 431,110 - 198,539,706
Total Capital Assets Being
Depreciated, Net 261,132,512 (12,349,193) 33,765 2,649,344 251,398,898
Governmental Activities, Net $302,836,438 $ (3,945,305) $ 5,351,821 $ - $293,539,312

WEST CHESTER AREA SCHOOL DISTRICT
NOTES TO FINANCIAL STATEMENTS
-49-
NOTE 6 CAPITAL ASSETS (cont’d)
Beginning Ending
Balance Increases Decreases Transfers Balance
BUSINESS-TYPE ACTIVITIES
Capital assets:
Furniture and equipment $ 804,561 $ 160,788 $ - $ - $ 965,349
Total Capital Assets 804,561 160,788 - - 965,349
Accumulated depreciation for:
Furniture and equipment 506,923 56,040 - - 562,963
Total Accumulated Depreciation 506,923 56,040 - - 562,963
Business-type Activities
Capital Assets, Net $ 297,638 $ 104,748 $ - $ - $ 402,386
Depreciation expense was charged to functions/programs of the District as follows:
Governmental activities:
Instruction $ 8,421,361
Instructional student support 1,018,001
Administrative and financial support services 1,071,638
Operation and maintenance of plant services 1,525,859
Pupil transportation 837,980
Student activities 296,796
Community services 8,500
Total Depreciation Expense - Governmental Activities $ 13,180,135
Business-type Activities - Food Service $ 56,040
NOTE 7 INTERFUND RECEIVABLES, PAYABLES, AND TRANSFERS
The composition of interfund balances as of June 30, 2016 is as follows:
Receivable to Payable from Amount
Food Service Fund General Fund $ 585
Interfund receivables and payables exist as a result of a time lag between dates when goods
and services were provided and payments between funds were made. All will be paid within
one year. The general fund transferred $9,107,247 to the capital reserve fund for the year
ended June 30, 2016 to fund future planned capital expenditures.

WEST CHESTER AREA SCHOOL DISTRICT
NOTES TO FINANCIAL STATEMENTS
-50-
NOTE 8 LONG-TERM DEBT
The following summarizes the changes in the long-term liabilities of governmental activities for
the year ended June 30, 2016:
Principal Principal
Outstanding Outstanding Due in
June 30, 2015 Repayments Additions June 30, 2016 One Year
General obligation note,
Series B of 2000 $ 1,246,000 $ 1,246,000 $ - $ - $ -
General obligation bonds,
Refunding Series of 2006 17,295,000 17,295,000 - - -
General obligation bonds,
Refunding Series A of 2006 36,825,000 36,825,000 - - -
General obligation note,
Series of 2009 9,975,000 5,000 - 9,970,000 5,000
General obligation bonds,
Refunding Series A of 2010 4,975,000 4,975,000 - - -
General obligation bonds,
Refunding Series AA of 2010 19,710,000 1,125,000 - 18,585,000 2,510,000
General obligation bonds,
Refunding Series of 2011 8,420,000 515,000 - 7,905,000 525,000
General obligation bonds,
Series A of 2012 21,000,000 - - 21,000,000 -
General obligation bonds,
Series AA of 2012 39,215,000 115,000 - 39,100,000 115,000
General obligation bonds,
Series of 2013 4,795,000 745,000 - 4,050,000 765,000
General obligation bonds,
Series of 2014 12,000,000 - - 12,000,000 -
General obligation bonds,
Series A of 2014 30,885,000 5,000 - 30,880,000 4,485,000
General obligation bonds,
Series AA of 2014 57,635,000 355,000 - 57,280,000 270,000
General obligation bonds,
Series of 2015 7,850,000 3,240,000 - 4,610,000 3,320,000
General obligation bonds,
Series of A of 2015 - - 9,690,000 9,690,000 5,000
General obligation bonds,
Series of AA of 2015 - 565,000 4,880,000 4,315,000 665,000
General obligation bonds,
Series of 2016 - 100,000 15,300,000 15,200,000 1,490,000
General obligation bonds,
Series A of 2016 - - 32,030,000 32,030,000 5,000
271,826,000 67,111,000 61,900,000 266,615,000 14,160,000
Deferred amounts:
Issuance (discounts) premium,
net 17,612,854 2,502,111 8,300,311 23,411,054 2,816,211
LONG-TERM DEBT $289,438,854 $69,613,111 $70,200,311 $290,026,054 $16,796,211

WEST CHESTER AREA SCHOOL DISTRICT
NOTES TO FINANCIAL STATEMENTS
-51-
NOTE 8 LONG-TERM DEBT (cont’d)
General Obligation Bonds
Refunding Series AA of 2010, original principal amount of
$28,220,000, maturing March 15, 2012 through March 15,
2022, bearing interest ranging from 2.00% to 5.00%, interest
payable semi-annually on March 15 and September 15. $ 18,585,000
Refunding Series of 2011, original principal amount of
$9,585,000, maturing February 15, 2013 through February
15, 2029, bearing interest ranging from 2.00% to 3.20%,
interest payable semi-annually on February 15 and August
15. 7,905,000
Series A of 2012, original principal amount of $21,000,000,
maturing May 15, 2014 through May 15, 2032, bearing
interest of 3.00%, interest payable semi-annually on May 15
and November 15. 21,000,000
Refunding Series AA of 2012, original principal amount of
$39,330,000, maturing May 15, 2014 through May 15, 2022,
bearing interest ranging from 2.00% to 5.00%, interest
payable semi-annually on May 15 and November 15. 39,100,000
Refunding Series of 2013, original principal amount of
$8,215,000, maturing October 1, 2013 through October 1,
2020, bearing interest ranging from 2.00% to 4.00%, interest
payable semi-annually on April 1 and October 1. 4,050,000
Series of 2014, original principal amount of $12,000,000,
maturing May 15, 2025 through May 15, 2032, bearing
interest ranging from 3.75% to 4.25%, interest payable semi-
annually on May 15 and November 15. 12,000,000
Refunding Series A of 2014, original principal amount of
$30,890,000, maturing May 15, 2016 through May 15, 2024,
bearing interest ranging from 0.30% to 5.00%, interest
payable semi-annually on May 15 and November 15. 30,880,000

WEST CHESTER AREA SCHOOL DISTRICT
NOTES TO FINANCIAL STATEMENTS
-52-
NOTE 8 LONG-TERM DEBT (cont’d)
Refunding Series AA of 2014, original principal amount of
$57,635,000, maturing May 15, 2016 through May 15, 2030,
bearing interest ranging from 2.00% to 5.00%, interest
payable semi-annually on May 15 and November 15. 57,280,000
Refunding Series of 2015, original principal amount of
$7,850,000, maturing November 15, 2016 through
November 15, 2017, bearing interest ranging from 2.00% to
4.00%, interest payable semi-annually on May 15 and
November 15. 4,610,000
Series A of 2015, original principal amount of $9,690,000,
maturing May 15, 2017 through May 15, 2032, bearing
interest ranging from 1.30% to 2.80%, interest payable semi-
annually on May 15 and November 15. 9,690,000
Refunding Series AA of 2015, original principal amount of
$4,880,000, maturing May 15, 2016 through November 15,
2021, bearing interest ranging from 0.25% to 4.00%, interest
payable semi-annually on May 15 and November 15. The
refunding resulted in a cash flow savings of $145,775 and
an economic benefit of $122,606. 4,315,000
Refunding Series of 2016, original principal amount of
$15,300,000, maturing April 15, 2016 through April 15, 2024,
bearing interest ranging from 1.50% to 5.00%, interest
payable semi-annually on April 15 and October 15. The
refunding resulted in a cash flow savings of $1,839,331 and
economic benefit of $1,831,855. 15,200,000
Refunding Series A of 2016, original principal amount of
$32,030,000, maturing February 15, 2017 through February
15, 2027, bearing interest ranging from 1.35% to 5.00%,
interest payable semi-annually on February 15 and August
15. The refunding resulted in a cash flow savings of
$7,544,117 and economic benefit of $6,766,599. 32,030,000
TOTAL BONDS 256,645,000

WEST CHESTER AREA SCHOOL DISTRICT
NOTES TO FINANCIAL STATEMENTS
-53-
NOTE 8 LONG-TERM DEBT (cont’d)
General Obligation Notes
Series of 2009, original principal amount of $10,000,000,
maturing October 1, 2010 through October 1, 2027, bearing
interest at a rate not to exceed 25%. Interest to be paid
monthly. 9,970,000
TOTAL NOTES 9,970,000
TOTAL BONDS AND NOTES $ 266,615,000
Payments of long-term debt are expected to be funded by the General Fund.
Presented below is a summary of the bonds and notes debt service requirements to maturity
by year:
Principal Interest Total
Year Ending June 30, Maturities Maturities Maturities
2017 $ 14,160,000 $ 10,079,332 $ 24,239,332
2018 14,950,000 10,045,937 24,995,937
2019 15,635,000 9,417,105 25,052,105
2020 16,230,000 8,783,772 25,013,772
2021 16,930,000 8,068,590 24,998,590
2022-2026 93,710,000 28,542,282 122,252,282
2027-2031 85,875,000 9,005,970 94,880,970
2032 9,125,000 302,815 9,427,815
$ 266,615,000 $ 84,245,803 $ 350,860,803
NOTE 9 CHANGES IN OTHER LONG-TERM LIABILITIES
Other long-term liabilities are summarized as follows:
Balance Balance
July 1, 2015 Additions Reductions June 30, 2016
Accrued compensated
absences $ 1,902,509 $ 560,225 $ (658,287) $ 1,804,447
Accrued severance 2,903,344 71,116 (152,468) 2,821,992
$ 4,805,853 $ 631,341 $ (810,755) $ 4,626,439

WEST CHESTER AREA SCHOOL DISTRICT
NOTES TO FINANCIAL STATEMENTS
-54-
NOTE 10 CONTINGENT LIABILITIES
Amounts received or receivable from grantor agencies are subject to audit and adjustment
by grantor agencies, principally, the federal government. Any disallowed claims, including
amounts already collected, may constitute a liability of the applicable funds. The amount, if
any, of expenditures which may be disallowed by the grantor cannot be determined at this
time although the District expects such amounts, if any, to be immaterial.
NOTE 11 CONSTRUCTION COMMITMENTS
As of June 30, 2016, the District had construction projects yet to be completed. The
commitments and amounts completed to date are as follows:
Completed
Contract as of
Amount June 30, 2016 Commitment
Renovations $ 27,268,905 $ 12,344,832 $ 14,924,073
In addition, the District has incurred costs totaling $1,505,666 for project costs that were no
under a formal contract as of June 30, 2016.
NOTE 12 RISK MANAGEMENT
The District self-insures workers’ compensation through its Insurance Consortium. The District's
Insurance Consortium is an association consisting of school districts, intermediate units, and
vocational-technical schools of the Commonwealth of Pennsylvania. The District obtained a
self-insurance exemption from the Commonwealth of Pennsylvania, Department of Labor and
Industry, Bureau of Workers’ Compensation, which allows the District to self-insure workers'
compensation.
Each year, the District is required to deposit funds into the central fund. The District then is
billed monthly for actual claims for the current year paid during the previous month up to the
level of retention. After the level of retention is reached, claim payments are made from the
central fund. At the end of each fiscal year, reserves are established or adjusted on all
outstanding claims. Funds in the central fund at the end of the fiscal year are not refunded.
Total claims paid for the year ended June 30, 2016 were $173,832.
Additionally, the District self-insures group dental, vision, and prescription coverage. The
District has accrued a three-month value for potential claims under dental, vision, and
prescription coverage. Total claims paid for the year ended June 30, 2016 were $7,030,318.

WEST CHESTER AREA SCHOOL DISTRICT
NOTES TO FINANCIAL STATEMENTS
-55-
NOTE 13 EMPLOYEE RETIREMENT SYSTEMS AND PENSION PLANS
The District contributes to the Public School Employees’ Retirement System ("PSERS"), a
governmental cost-sharing multiple-employer defined benefit pension plan that provides
retirement benefits to public school employees of the Commonwealth of Pennsylvania. The
members eligible to participate in the system include all full-time public school employees,
part-time hourly public school employees who render at least 500 hours of service in the
school year, and part-time per diem public school employees who render at least 80 days of
service in the school year in any of the reporting entities in Pennsylvania. PSERS issues a
publicly available comprehensive annual financial report that includes the financial
statements and required supplementary information for the plan. A copy of this report
may be obtained by writing to the Public School Employees’ Retirement System,
P.O. Box 125, Harrisburg, Pennsylvania 17108-0125, or by visiting the PSERS website at
www.psers.state.pa.us.
Benefits Provided
PSERS provides retirement, disability, and death benefits. Members are eligible for monthly
retirement benefits upon reaching (a) age 62, with at least one year of credited service, (b)
age 60 with 30 or more years of credited service, or (c) 35 or more years of service regardless
of age. Act 120 of 2010 (“Act 120”) preserves the benefits of existing members and
introduced benefit reductions for individuals who became new members on or after July 1,
2011. Act 120 created two new membership classes, Membership Class T-E (“Class T-E”), and
Membership Class T-F (“Class T-F”). To qualify for normal retirement, Class T-E and Class T-F
members must work until age 65 with a minimum of three years of service, or attain a total
combination and age and service that is equal to or greater than 92, with a minimum of 35
years of service. Benefits are generally equal to two percent or two and one-half percent,
depending upon the membership class, of the member’s final average salary as defined in
the Code, multiplied by the number of years of credited service. For members whose
membership started prior to July 1, 2011, after completion of five years of service, a
member’s right to the defined benefits is vested, and early retirement may be elected. For
Class T-E and Class T-F members, the right to benefits is vested after 10 years of service.
Participants are eligible for disability retirement benefits after completion of five years of
credited service. Such benefits are generally equal to two percent or two and one-half
percent, depending upon the membership class, of the member’s final average salary as
defined in the Code, multiplied by the number of years of credited service, but not less than
one-third of such salary nor greater than the benefit the member would have had at normal
retirement age. Members over normal retirement age may apply for disability benefits.
Death benefits are payable upon the death of an active member who has reached age 62
with at least one year of credited service (age 65 with at least three years of credited service
for Class T-E and Class T-F members, or who has at least five years of credited service for Class
T-E and Class T-F members). Such benefits are actuarially equivalent to the benefit that would
have been effective if the member had retired on the day before death.

WEST CHESTER AREA SCHOOL DISTRICT
NOTES TO FINANCIAL STATEMENTS
-56-
NOTE 13 EMPLOYEE RETIREMENT SYSTEMS AND PENSION PLANS (cont’d)
Member Contributions
Active members who joined the system prior to July 22, 1983 contributed at 5.25 percent
(Membership Class T-C), or at 6.50 percent (Membership Class T-D) of the member’s qualifying
compensation.
Members who joined the system on or after July 22, 1983, and who were active or inactive as
of July 1, 2001, contribute at 6.25 percent (Membership Class T-C), or at 7.50 percent
(Membership Class T-D) of the member’s qualifying compensation.
Members who joined the system after June 30, 2001 and before July 1, 2011 contribute at
7.50 percent (automatic Membership Class T-D). For all new hires and for members who
elected Class T-D membership, the higher contribution rates began with service rendered on
or after January 1, 2002.
Members who joined the system after June 30, 2011 automatically contribute at the
Membership Class T-E rate of 7.50 percent (base rate) of the member’s qualifying
compensation. All new hires after June 30, 2011, who elect Class T-F membership, contribute
at 10.30 percent (base rate) of the member’s qualifying compensation. Membership Class T-
E and T-F are affected by a “shared risk” provision in Act 120 of 2010 that in future fiscal years
could cause the Membership Class T-E contribution rate to fluctuate between 7.50 percent
and 9.50 percent, and Membership Class T-F contribution rate to fluctuate between 10.30
percent and 12.30 percent.
Employer Contributions
The District’s contractually required annual contribution is based on an actuarially
determined amount that, when combined with the employee contributions, is expected to
finance the costs of benefits earned by employees during the year, with an additional
amount to finance any unfunded accrued liability. For the year ended June 30, 2016, the
rate of the employer contribution was 25.84 percent of covered payroll, allocated 25.00
percent to pensions and 0.84 percent to health insurance assistance. The District’s
contribution to PSERS for the years ended June 30, 2016 was $22,796,485, of which
$22,053,155 was related to pension contributions and $743,330 was related to health
insurance premium assistance.
Pension Liability and Expense, and Deferred Outflows and Inflows of Resources
At June 30, 2016, the District reported a liability of $293,071,000 for its proportionate share of
the net pension liability. The net pension liability was measured as of June 30, 2015, and the
total pension liability used to calculate the net pension liability was determined by rolling
forward the system’s total pension liability as of June 30, 2014 to June 30, 2015. The District’s
proportion of the net pension liability was calculated utilizing the employer’s one-year
reported covered payroll as it relates to the total one-year reported covered payroll.

WEST CHESTER AREA SCHOOL DISTRICT
NOTES TO FINANCIAL STATEMENTS
-57-
NOTE 13 EMPLOYEE RETIREMENT SYSTEMS AND PENSION PLANS (cont’d)
At June 30, 2015, the District’s proportion was 0.6766 percent, which was an increase of
0.0137 percent from its proportion measured as of June 30, 2014.
For the year ended June 30, 2016, the District recognized pension expense of $27,909,753.
At June 30, 2016, the District reported deferred outflows of resources and deferred inflows of
resources related to pensions from the following sources:
Deferred Deferred
Outflows of Inflows of
Resources Resources
Net difference between projected and
actual investment earnings $ - $ 594,000
Changes in proportions 7,478,000 -
Difference between employer contributions and
proportionate share of total contributions 1,619,787 -
Contributions subsequent to the date of
measurement 22,053,155 -
Difference between expected and
actual experience - 1,209,000
$ 31,150,942 $ 1,803,000
Deferred outflows of resources in the amount of $22,053,155 resulted from the District’s
contributions subsequent to the measurement date, which will be recognized as a reduction
of the net pension liability in the year ended June 30, 2016. Other amounts will be reported
as deferred outflows and resources and deferred inflows of resources related to pensions and
will be recognized in pension expense as follows:
Year Ended June 30,
2017 $ 865,753
2018 865,753 2019 865,753 2020 4,697,528
$ 7,294,787
Actuarial Assumptions
The total pension liability as of June 30, 2015 was determined by rolling forward the system’s
total pension liability as of the June 30, 2014 actuarial valuation to June 30, 2015 using the
following actuarial assumptions, applied to all periods included in the measurement:
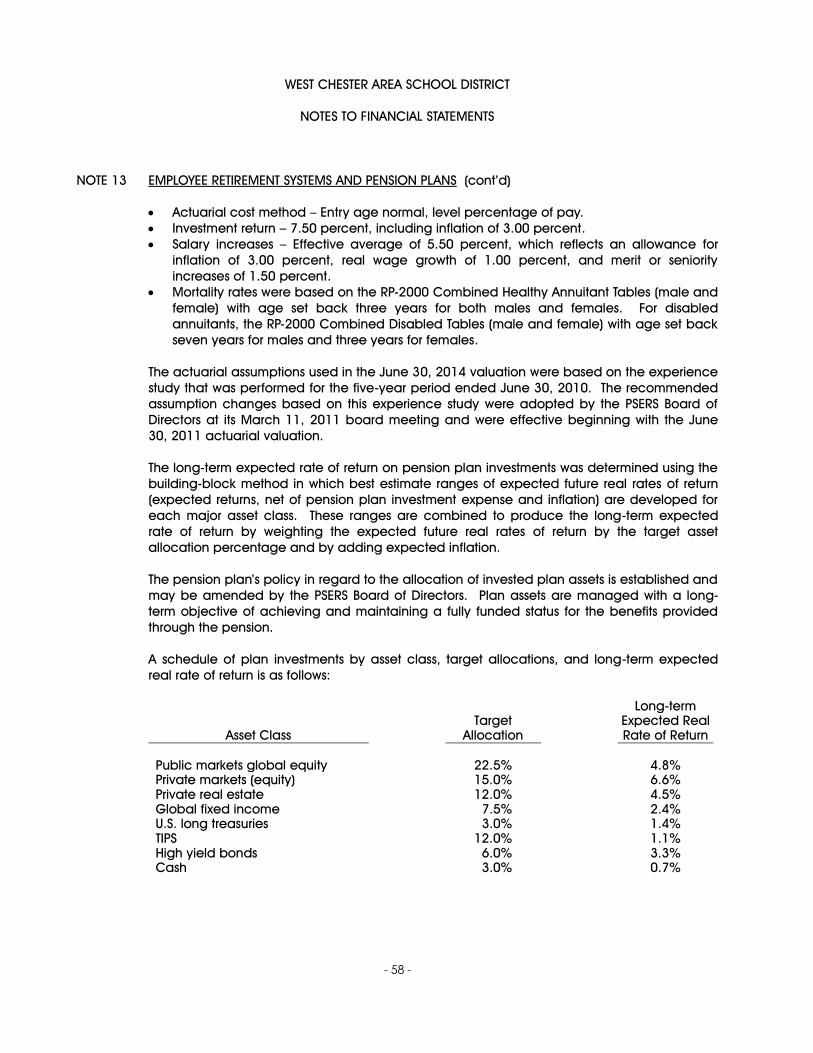
WEST CHESTER AREA SCHOOL DISTRICT
NOTES TO FINANCIAL STATEMENTS
-58-
NOTE 13 EMPLOYEE RETIREMENT SYSTEMS AND PENSION PLANS (cont’d)
Actuarial cost method – Entry age normal, level percentage of pay.
Investment return – 7.50 percent, including inflation of 3.00 percent.
Salary increases – Effective average of 5.50 percent, which reflects an allowance for
inflation of 3.00 percent, real wage growth of 1.00 percent, and merit or seniority
increases of 1.50 percent.
Mortality rates were based on the RP-2000 Combined Healthy Annuitant Tables (male and
female) with age set back three years for both males and females. For disabled
annuitants, the RP-2000 Combined Disabled Tables (male and female) with age set back
seven years for males and three years for females.
The actuarial assumptions used in the June 30, 2014 valuation were based on the experience
study that was performed for the five-year period ended June 30, 2010. The recommended
assumption changes based on this experience study were adopted by the PSERS Board of
Directors at its March 11, 2011 board meeting and were effective beginning with the June
30, 2011 actuarial valuation.
The long-term expected rate of return on pension plan investments was determined using the
building-block method in which best estimate ranges of expected future real rates of return
(expected returns, net of pension plan investment expense and inflation) are developed for
each major asset class. These ranges are combined to produce the long-term expected
rate of return by weighting the expected future real rates of return by the target asset
allocation percentage and by adding expected inflation.
The pension plan’s policy in regard to the allocation of invested plan assets is established and
may be amended by the PSERS Board of Directors. Plan assets are managed with a long-
term objective of achieving and maintaining a fully funded status for the benefits provided
through the pension.
A schedule of plan investments by asset class, target allocations, and long-term expected
real rate of return is as follows:
Long-term
Target Expected Real
Asset Class Allocation Rate of Return
Public markets global equity 22.5% 4.8%
Private markets (equity) 15.0% 6.6%
Private real estate 12.0% 4.5%
Global fixed income 7.5% 2.4%
U.S. long treasuries 3.0% 1.4%
TIPS 12.0% 1.1%
High yield bonds 6.0% 3.3%
Cash 3.0% 0.7%
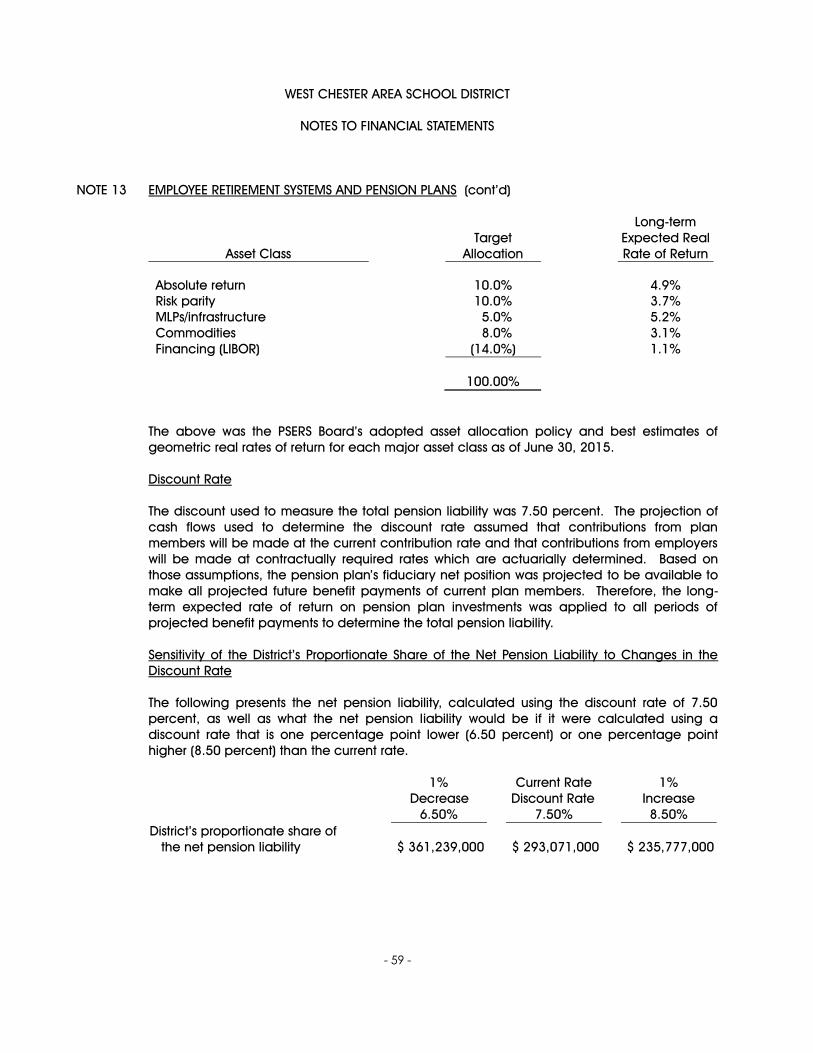
WEST CHESTER AREA SCHOOL DISTRICT
NOTES TO FINANCIAL STATEMENTS
-59-
NOTE 13 EMPLOYEE RETIREMENT SYSTEMS AND PENSION PLANS (cont’d)
Long-term
Target Expected Real
Asset Class Allocation Rate of Return
Absolute return 10.0% 4.9%
Risk parity 10.0% 3.7%
MLPs/infrastructure 5.0% 5.2%
Commodities 8.0% 3.1%
Financing (LIBOR) (14.0%) 1.1%
100.00%
The above was the PSERS Board’s adopted asset allocation policy and best estimates of
geometric real rates of return for each major asset class as of June 30, 2015.
Discount Rate
The discount used to measure the total pension liability was 7.50 percent. The projection of
cash flows used to determine the discount rate assumed that contributions from plan
members will be made at the current contribution rate and that contributions from employers
will be made at contractually required rates which are actuarially determined. Based on
those assumptions, the pension plan’s fiduciary net position was projected to be available to
make all projected future benefit payments of current plan members. Therefore, the long-
term expected rate of return on pension plan investments was applied to all periods of
projected benefit payments to determine the total pension liability.
Sensitivity of the District’s Proportionate Share of the Net Pension Liability to Changes in the
Discount Rate
The following presents the net pension liability, calculated using the discount rate of 7.50
percent, as well as what the net pension liability would be if it were calculated using a
discount rate that is one percentage point lower (6.50 percent) or one percentage point
higher (8.50 percent) than the current rate.
1% Current Rate 1%
Decrease Discount Rate Increase
6.50% 7.50% 8.50%
District’s proportionate share of
the net pension liability $ 361,239,000 $ 293,071,000 $ 235,777,000
WEST CHESTER AREA SCHOOL DISTRICT
NOTES TO FINANCIAL STATEMENTS
-60-
NOTE 13 EMPLOYEE RETIREMENT SYSTEMS AND PENSION PLANS (cont’d)
Pension Plan Fiduciary Net Position
Detailed information about PSERS’ fiduciary net position is available in PSERS Comprehensive
Annual Financial Report, which can be found on the system’s website at
www.psers.state.pa.us.
NOTE 14 OTHER POST-EMPLOYMENT BENEFITS
Plan Description
The District provides a defined-benefit post-employment healthcare benefit, which provides
medical benefits to eligible retirees and their spouses. The District has four bargaining units
which participate in this plan: the West Chester Education Support Personnel, the Service
Support personnel, the teachers, and the administrators. In addition, the non-bargaining staff
members participate in the plan. Members of the Education Support personnel and the
Service Support personnel who were at least 50 years old as of July 1, 2012 and had 20 years
of service receive a Health Reimbursement Account of $2,000 per year towards single
employer health benefit coverage for a maximum of four years. Teachers hired before July 1,
2003 that reach age 50 with 15 years of service in the District are eligible to receive single
plan post-retirement benefits at the same level as current employees. Teachers hired before
July 1, 2003 are eligible to receive a Health Reimbursement Account of $20,000 towards
single employer health benefit coverage. Administrators that reach age 50 with 12 years of
service receive benefits for administrator and spouse for 10 years or until Medicare eligible.
Administrators receiving this benefit are required to cost-share for administrator coverage at a
rate equal to the higher of the maximum reimbursement provided by PSERS (currently $100
per month) or active employee contribution and 50 percent of the cost of the spousal
coverage cost. Non-bargaining employees receive the same coverage as administrators
with no spousal coverage. The employee must retire from service to receive the post-
employee benefits and not work for another school district.
The health insurance plan is a single-employer, defined-benefit OPEB plan. The medical,
prescription drug, dental, and vision benefits are self-insured. Only the PC-65 product is fully
insured. The medical benefits are administered through Blue Cross and the prescription drug
benefits through Caremark. Separate financial statements are not issued for the plan. The
term life insurance is purchased from U.S. Life; the Universal Life coverage is purchased from
Genworth Financial.
Funding Policy
As of July 1, 2014, the most recent valuation, the District has no segregated assets to fund this
liability. It is the intention of the District to pay the premium each year as it comes due.

WEST CHESTER AREA SCHOOL DISTRICT
NOTES TO FINANCIAL STATEMENTS
-61-
NOTE 14 OTHER POST-EMPLOYMENT BENEFITS (cont’d)
Funding Progress
The schedule of funding progress of OPEB is as follows:
Actuarial
Accrued UAAL as a
Actuarial Liability Unfunded Percentage
Actuarial Value of (AAL) - AAL Funded Covered of Covered
Valuation Assets Entry Age (UAAL) Ratio Payroll Payroll
Date (a) (b) (b-a) (a/b) (c) [(b-a)/c]
7/1/2014 $ - $13,296,649 $13,296,649 0.00% $83,546,655 15.92%
7/1/2012 $ - $19,107,176 $19,107,176 0.00% $80,033,237 23.87%
7/1/2010 $ - $26,658,307 $26,658,307 0.00% $86,718,957 30.74%
The actuarial valuation of an ongoing plan involves estimates of the value of reported
amounts and assumptions about the probability of occurrences of events far into the future.
Examples include assumptions about future employment and mortality. Amounts determined
regarding the funded status of the plan and the annual required contributions of the
employer are subject to continual revisions as actual results are compared with past
expectations and new estimates are made into the future.
Actuarial Methods and Assumptions
Projections of benefits for financial reporting purposes are based on the substantive plan and
include the types of benefits provided at the time of each valuation and the historical sharing
of benefit costs between the employer and plan members to that point. The actuarial
methods and assumptions used include techniques that are designed to reduce the effects
of short-term volatility in actuarial accrued liabilities and the actual value of assets, consistent
with the long-term perspective of the calculations. In the July 1, 2014 actuarial valuation, the
following actuarial assumptions were used:
Interest – 4.5% compounded annually net of investment expenses
Amortization method – Level dollar method at the valuation interest rate
Amortization period – 30 years
Salary increases – 2.5% cost of living + merit 0.25% to 2.75% per year
Actuarial valuation cost method – Entry age normal
Annual OPEB Cost and Net OPEB Obligations
The District's annual other post-employment benefit ("OPEB") cost (expense) is calculated
based on the annual required contribution ("ARC") of the employer. The ARC represents a
level of funding that, if paid on an ongoing basis, is projected to cover normal costs each

WEST CHESTER AREA SCHOOL DISTRICT
NOTES TO FINANCIAL STATEMENTS
-62-
NOTE 14 OTHER POST-EMPLOYMENT BENEFITS (cont’d)
year and to amortize any unfunded actuarial liabilities over a period not to exceed 30 years.
The following table shows the components of the District's annual OPEB cost for the year, the
amount actually contributed to the plan, and the changes in the District's net OPEB
obligation.
Annual OPEB Cost:
Normal cost $ 504,701
Amortization of unfunded actuarial accrued liability 1,354,852
Interest on net OPEB obligation 13,208
Funding adjustment (29,908)
ANNUAL OPEB COST $ 1,842,853
Net OPEB Obligation:
Net OPEB obligation July 1, 2015 $ 293,516
OPEB cost for year ended June 30, 2016 1,842,853
Contribution for the year ended June 30, 2016 (1,730,198)
NET OPEB OBLIGATION $ 406,171
NOTE 15 FUND BALANCES
As of June 30, 2016, fund balances are composed of the following:
Capital Capital Total
General Projects Reserve Governmental
Fund Fund Fund Funds
Nonspendable $ 2,066,625 $ - $ 368,350 $ 2,434,975
Restricted:
Capital projects - 4,038,838 27,071,868 31,110,706
Committed:
PSERS 2,117,000 - - 2,117,000
Healthcare 4,159,909 - - 4,159,909
Assigned:
Tax stabilization 5,471,005 - - 5,471,005
Athletic activities 89,487 - - 89,487
Unassigned 14,856,952 - - 14,856,952
Total Fund Balances $ 28,760,978 $ 4,038,838 $ 27,440,218 $ 60,240,034

WEST CHESTER AREA SCHOOL DISTRICT
NOTES TO FINANCIAL STATEMENTS
-63-
NOTE 16 ON-BEHALF PAYMENTS FOR FRINGE BENEFITS
The District recognizes as revenue and expenses contributions made by the Commonwealth
of Pennsylvania to be used for District employees’ social security and pension contributions.
On-behalf payments to the District totaled $3,194,004 and $11,377,972 for social security
and retirement contributions, respectively. These contributions are recorded in the General
Fund as revenue and expenditures.
NOTE 17 DEFICIT NET POSITION
For governmental activities, the unrestricted net deficit amount of $235,432,024 includes the
effect of deferring the recognition of pension contributions made subsequent to the
measurement date of the net pension liability, the unamortized portion of contributions made
in excess of the District’s share of its proportionate contributions to its pension plan, and the
deferred outflows resulting from the change in the District’s share of the net pension liability.
This is offset by the District’s actuarially determined pension liability and the deferred inflows
resulting from the differences between projected and actual investment earnings, and
between actual and expected experiences.
NOTE 18 SUBSEQUENT EVENTS
On July 25, 2016 the District’s Board of Directors voted and approved the agreement of sale
between Whiteland Plaza Associates (seller) and the District (buyer) for the purchase of the
property and facilities located at 782 Springdale Drive in Exton that will serve as the new
home for the District’s administration offices.
Settlement on the new property occurred on September 12, 2016, with plans to relocate
offices to the new property in spring of 2017.
The District has evaluated all subsequent events through December 6, 2016, the date the
financial statements were available to be issued.

[ THIS PAGE INTENTIONALLY LEFT BLANK ]

WEST CHESTER AREA SCHOOL DISTRICT
REQUIRED SUPPLEMENTARY
INFORMATION

- 64 -
JUNE 30, 2015 JUNE 30, 2014
District's proportion of the net pension liability 0.6766% 0.6629%
District's proportion of the net pension liability - dollar value 293,071,000$ 262,381,000$
District's covered employee payroll 87,093,346$ 84,585,517$
District's proportionate share of the net pensionliability as a percentage of its coveredemployee payroll 336.50% 310.20%
Plan fiduciary net position as a percentageof the total pension liability 54.36% 57.24%
In accordance with GASB Statement No. 68, this schedule has been prepared prospectively as the aboveinformation for the preceding years is not readily available. This schedule will accumulate each year untilsufficient information to present a ten-year trend is available.
WEST CHESTER AREA SCHOOL DISTRICTREQUIRED SUPPLEMENTARY INFORMATION
SCHEDULE OF THE DISTRICT'S PROPORTIONATE SHAREOF THE NET PENSION LIABILITY
MEASUREMENT DATE

- 65 -
JUNE 30, 2016 JUNE 30, 2015
Contractually required contribution 22,053,155$ 17,854,136$
Contributions in relation to the contractuallyrequired contribution 22,053,155 17,854,136
Contribution excess -$ -$
District's covered employee payroll 88,212,620$ 87,093,346$
Contributions as a percentage ofcovered-employee payroll 25.00% 20.50%
WEST CHESTER AREA SCHOOL DISTRICTREQUIRED SUPPLEMENTARY INFORMATION
SCHEDULE OF DISTRICT CONTRIBUTIONS
In accordance with GASB Statement No. 68, this schedule has been prepared prospectively as the aboveinformation for the preceding years is not readily available. This schedule will accumulate each year untilsufficient information to present a ten-year trend is available.

[ THIS PAGE INTENTIONALLY LEFT BLANK ]
WEST CHESTER AREA SCHOOL DISTRICT
SUPPLEMENTARY
INFORMATION

- 66 -
Balance BalanceJuly 1, 2015 Additions Deductions July 1, 2016
AGENCY FUND - FUND 40ASSETSCash and cash equivalents 88,254$ 237,133$ 265,223$ 60,164$ TOTAL ASSETS 88,254$ 237,133$ 265,223$ 60,164$
LIABILITIES AND NET POSITIONLIABILITIESOther current liabilities 88,254$ 237,133$ 265,223$ 60,164$
TOTAL LIABILITIES 88,254 237,133 265,223 60,164
NET POSITIONRestricted - - - -
TOTAL NET POSITION - - - -
TOTAL LIABILITIES AND NET POSITION 88,254$ 237,133$ 265,223$ 60,164$
STUDENT ACTIVITY FUND - FUND 50ASSETSCash and cash equivalents 422,327$ 682,220$ 672,482$ 432,065$ TOTAL ASSETS 422,327$ 682,220$ 672,482$ 432,065$
LIABILITIES AND NET POSITIONLIABILITIESOther current liabilities 422,327$ 682,220$ 672,482$ 432,065$
TOTAL LIABILITIES 422,327 682,220 672,482 432,065
NET POSITIONRestricted - - - -
TOTAL NET POSITION - - - -
TOTAL LIABILITIES AND NET POSITION 422,327$ 682,220$ 672,482$ 432,065$
TOTAL AGENCY FUNDSASSETSCash and cash equivalents 510,581$ 919,353$ 937,705$ 492,229$ TOTAL ASSETS 510,581$ 919,353$ 937,705$ 492,229$
LIABILITIES AND NET POSITIONLIABILITIESOther current liabilities 510,581$ 919,353$ 937,705$ 492,229$
TOTAL LIABILITIES 510,581 919,353 937,705 492,229
NET POSITIONRestricted - - - -
TOTAL NET POSITION - - - -
TOTAL LIABILITIES AND NET POSITION 510,581$ 919,353$ 937,705$ 492,229$
WEST CHESTER AREA SCHOOL DISTRICTCOMBINING STATEMENT OF CHANGES IN ASSETS AND LIABILITIES
ALL AGENCY FUNDS

WEST CHESTER AREA SCHOOL DISTRICT
STATISTICAL SECTION

- 67 -
STATISTICAL SECTION
The Statistical Section of the West Chester Area School District’s Comprehensive Annual
Financial Report (CAFR) presents other detailed information to allow the reader a better
understanding of the District’s overall financial health in conjunction with the information
in the financial statements, note disclosures, and required supplementary information.
Contents Pages
Financial Trends ........................................................................................................................................68-74
These schedules contain selected information from current and previous years’
financial statements to allow users to assess financial trends.
Revenue Capacity .......................................................................................................................................75-80
These schedules contain information useful in assessing the District’s ability to
raise own-source revenue.
Debt Capacity ...............................................................................................................................................81-84
These schedules contain information useful in assessing the District’s ability to
afford the existing debt as well as the District’s ability to issue new debt.
Demographic and Economic Information ........................................................................................85-87
These schedules contain information about the socio-economic environment
within which the District’s financial activities take place.
Operating Information .............................................................................................................................88-92
These schedules contain information about the size of the District’s workforce,
the services it provides in relation to other service providers in the area and
District’s facilities.

WEST CHESTER AREA SCHOOL DISTRICT
FINANCIAL TRENDS

- 68
-
Fisc
al Y
ear E
ndin
g Ju
ne 3
0,20
0720
0820
0920
1020
1120
1220
1320
14 2
015
* 2
016
*
Gove
rnm
enta
l Act
iviti
es N
et in
vest
men
t in
capi
tal a
sset
s 3,
547,
104
6,
429,
491
9,
418,
873
8,9
03,1
59
7
,083
,089
8,0
57,1
90
5
,876
,233
7,7
10,4
07
20,
989,
220
11,
063,
839
Rest
ricte
d: C
apita
l Pro
ject
s-
16
,378
,062
13
,811
,178
1
4,64
1,91
9
1
4,50
6,07
8
1
4,32
9,75
9
1
5,64
6,70
1
1
7,67
2,55
1
2
2,20
3,30
0
2
7,44
0,21
8 U
nres
tric
ted
24,2
60,1
11
5,30
8,88
8
8,05
0,93
4
4,01
4,35
3
15,6
06,1
35
21,7
70,0
88
30,8
67,2
82
34,1
01,5
96
(234
,457
,232
)
(2
35,4
32,0
24)
Net
Pos
ition
Gov
ernm
enta
l Act
iviti
es27
,807
,215
28
,116
,441
31
,280
,985
27
,559
,431
37
,195
,302
44
,157
,037
52
,390
,216
59
,484
,554
(1
91,2
64,7
12)
(1
96,9
27,9
67)
Busin
ess-
Type
Act
iviti
es N
et in
vest
men
t in
capi
tal a
sset
s 85
,434
61
,439
12
9,76
8
82,8
65
184,
236
17
1,99
6
169,
778
22
4,32
4
297,
638
40
2,38
6
Unr
estr
icte
d66
4,89
6
774,
183
99
7,55
8
92,2
73
1,01
7,89
6
1,15
5,90
6
1,17
9,94
0
1,08
8,26
7
1,11
0,53
9
1,04
2,56
9
Net
Pos
ition
Bus
ines
s Typ
e Ac
tiviti
es75
0,33
0
83
5,62
2
1,
127,
326
17
5,13
8
1,
202,
132
1,
327,
902
1,
349,
718
1,
312,
591
1,
408,
177
1,
444,
955
Tota
l Prim
ary
Gove
rnm
ent
Net
inve
stm
ent i
n ca
pita
l ass
ets
3,63
2,53
8
6,49
0,93
0
9,54
8,64
1
8,98
6,02
4
7,26
7,32
5
8,22
9,18
6
6,04
6,01
1
7,93
4,73
1
21,2
86,8
58
11,4
66,2
25
Rest
ricte
d: C
apita
l Pro
ject
s-
16
,378
,062
13
,811
,178
14
,641
,919
14
,506
,078
14
,329
,759
15
,646
,701
17
,672
,551
22
,203
,300
27
,440
,218
U
nres
tric
ted
24,9
25,0
07
6,08
3,07
1
9,04
8,49
2
4,10
6,62
6
16,6
24,0
31
22,9
25,9
94
32,0
47,2
22
35,1
89,8
63
(233
,346
,693
)
(2
34,3
89,4
55)
Net
Pos
ition
Prim
ary
Gove
rnm
ent
28,5
57,5
45
28,9
52,0
63
32,4
08,3
11
27,7
34,5
69
38,3
97,4
34
45,4
84,9
39
53,7
39,9
34
60,7
97,1
45
(189
,856
,535
)
(195
,483
,012
)
* N
ote:
Sta
rtin
g in
201
4-15
, the
Dist
rict b
ooke
d th
eir s
hare
of t
he P
SERS
mul
tiple
em
ploy
er p
ensio
n pl
an li
abili
ty to
com
ply
with
GAS
B 67
/68.
Sour
ce:
Dist
rict A
udite
d Fi
nanc
ial S
tate
men
ts
WES
T CH
ESTE
R AR
EA S
CHO
OL
DIST
RICT
Net
Pos
ition
by
Com
pone
nt U
nit (
Full
Accr
ual M
etho
d of
Acc
ount
ing)

- 69
-
Fisc
al Y
ear E
ndin
g Ju
ne 3
0,20
0720
0820
0920
1020
1120
1220
1320
14 2
015
* 2
016
*EX
PEN
SES
Gov
ernm
enta
l Act
iviti
esIn
stru
ctio
n95
,791
,662
10
3,39
7,52
4
10
3,97
3,61
2
11
3,06
8,22
0
11
7,97
2,38
5
11
9,94
1,56
5
12
1,88
2,87
2
12
1,62
7,03
3
13
3,21
8,15
4
14
4,77
2,15
8
In
stru
ctio
nal S
tude
nt S
uppo
rt12
,481
,237
13
,064
,208
13
,634
,029
15
,022
,492
15
,740
,734
14
,597
,033
14
,429
,547
15
,311
,671
16
,718
,808
17
,710
,876
Ad
min
istr
ativ
e &
Fin
anci
al S
uppo
rt S
ervi
ces
13,6
64,8
19
14,0
60,3
74
14,3
90,4
96
14,4
29,4
52
13,9
56,1
05
14,2
11,2
07
14,4
17,2
08
15,6
43,3
60
17,5
52,7
68
18,1
27,3
34
Ope
ratio
n &
Mai
nten
ance
of P
lant
Ser
vice
s16
,260
,118
14
,830
,364
16
,604
,260
19
,486
,401
17
,729
,991
15
,529
,375
16
,984
,316
18
,309
,057
17
,447
,190
17
,439
,654
Pu
pil T
rans
port
atio
n11
,809
,273
12
,846
,908
13
,219
,823
13
,674
,801
13
,469
,612
13
,365
,853
13
,208
,001
13
,420
,543
13
,850
,307
14
,042
,517
St
uden
t Act
iviti
es3,
814,
684
4,02
8,51
6
4,
145,
743
4,23
7,26
9
4,
055,
872
4,09
5,13
2
4,
147,
431
4,37
7,69
0
4,
855,
516
5,13
2,86
5
Co
mm
unity
Ser
vice
s76
,445
81
,960
12
2,16
4
125,
654
12
7,04
1
115,
730
14
5,92
9
116,
354
14
0,74
2
142,
350
In
tere
st o
n Lo
ng T
erm
Deb
t16
,367
,340
13
,695
,699
13
,361
,141
13
,636
,798
12
,076
,323
11
,156
,020
9,
722,
107
10,3
97,4
33
8,56
6,73
2
8,
945,
807
Una
lloca
ted
Depr
ecia
tion
Expe
nse
7,26
3,81
2
9,
898,
713
12,4
84,4
52
-
-
-
-
-
-
-
To
tal G
over
nmen
tal A
ctiv
ities
177,
529,
390
185,
904,
266
191,
935,
720
193,
681,
087
195,
128,
063
193,
011,
915
194,
937,
411
199,
203,
141
212,
350,
217
226,
313,
561
Busi
ness
Typ
e Ac
tiviti
esFo
od S
ervi
ce3,
011,
231
3,08
2,86
5
3,
171,
794
3,14
9,55
6
3,
224,
517
3,31
3,44
2
3,
390,
811
3,49
3,07
8
3,
182,
033
3,22
9,85
2
TOTA
L PR
IMAR
Y G
OVE
RNM
ENT
ACTI
VITI
ES18
0,54
0,62
1
18
8,98
7,13
1
19
5,10
7,51
4
19
6,83
0,64
3
19
8,35
2,58
0
19
6,32
5,35
7
19
8,32
8,22
2
20
2,69
6,21
9
21
5,53
2,25
0
22
9,54
3,41
3
PRO
GRA
M R
EVEN
UE
Gov
ernm
enta
l Act
iviti
esCh
arge
s for
Ser
vice
Inst
ruct
ion
368,
684
40
5,16
7
430,
893
51
6,69
0
759,
951
84
6,71
5
726,
912
43
7,67
5
362,
760
54
2,98
6
Ope
ratio
n &
Mai
nten
ance
of P
lant
Ser
vice
s32
,299
28
,234
32
,844
38
,933
19
9,98
4
220,
596
29
8,04
4
332,
728
34
7,23
3
402,
308
St
uden
t Act
iviti
es14
6,03
1
137,
451
11
8,78
3
120,
723
11
9,43
8
123,
369
41
3,73
7
419,
389
42
3,40
7
430,
050
O
pera
ting
Gra
nts a
nd C
ontr
ibut
ions
21,9
57,6
60
23,2
77,2
08
22,0
35,3
32
22,4
93,6
08
22,3
77,2
51
22,2
38,2
69
23,1
07,3
09
23,7
27,2
27
26,3
09,7
74
27,7
43,1
96
Tota
l Gov
ernm
enta
l Pro
gram
Rev
enue
22,5
04,6
74
23,8
48,0
60
22,6
17,8
52
23,1
69,9
54
23,4
56,6
24
23,4
28,9
49
24,5
46,0
02
24,9
17,0
19
27,4
43,1
74
29,1
18,5
40
Busi
ness
Typ
e Ac
tiviti
esCh
arge
s for
Ser
vice
s2,
531,
512
2,59
7,94
1
2,
704,
187
2,62
4,83
0
2,
511,
962
2,60
4,56
0
2,
549,
584
2,54
9,72
6
2,
335,
418
2,29
3,12
2
O
pera
ting
Gra
nts a
nd C
ontr
ibut
ions
504,
267
52
8,49
4
600,
091
66
3,19
0
786,
659
83
2,38
3
861,
272
90
4,89
8
940,
701
97
3,50
8
Tota
l Bus
ines
s Typ
e Pr
ogra
m R
even
ues
3,03
5,77
9
3,
126,
435
3,30
4,27
8
3,
288,
020
3,29
8,62
1
3,
436,
943
3,41
0,85
6
3,
454,
624
3,27
6,11
9
3,
266,
630
TOTA
L PR
IMAR
Y G
OVE
RNM
ENT
REVE
NU
ES25
,540
,453
26
,974
,495
25
,922
,130
26
,457
,974
26
,755
,245
26
,865
,892
27
,956
,858
28
,371
,643
30
,719
,293
32
,385
,170
NET
REV
ENU
ES (E
XPEN
SES)
Gov
ernm
enta
l Act
iviti
es(1
55,0
24,7
16)
(162
,056
,206
)
(1
69,3
17,8
68)
(170
,511
,133
)
(1
71,6
71,4
39)
(169
,582
,966
)
(1
70,3
91,4
09)
(174
,286
,122
)
(1
84,9
07,0
43)
(197
,195
,021
)
Bu
sine
ss T
ype
Activ
ities
24,5
48
43,5
70
132,
484
13
8,46
4
74,1
04
123,
501
20
,045
(3
8,45
4)
94,0
86
36,7
78
TOTA
L PR
IMAR
Y G
OVE
RNM
ENT
NET
REV
ENU
ES(1
55,0
00,1
68)
(162
,012
,636
)
(1
69,1
85,3
84)
(170
,372
,669
)
(1
71,5
97,3
35)
(169
,459
,465
)
(1
70,3
71,3
64)
(174
,324
,576
)
(1
84,8
12,9
57)
(197
,158
,243
)
GEN
ERAL
REV
ENU
ESPr
oper
ty T
axes
, Lev
ied
for G
ener
al P
urpo
se12
0,23
9,10
4
12
6,71
6,39
1
13
2,99
9,09
1
14
1,80
2,11
1
14
5,00
8,64
5
14
4,01
0,68
9
14
7,19
8,15
6
14
7,27
0,50
4
15
1,64
9,70
2
15
5,71
0,30
0
Ta
xes L
evie
d fo
r Spe
cific
Pur
pose
21,3
55,2
82
20,7
69,4
59
19,6
19,5
21
19,3
73,2
45
19,7
64,9
70
21,5
81,8
47
22,3
88,9
38
23,1
54,7
23
23,5
65,3
68
24,3
21,3
96
Gra
nts,
Ent
itlem
ents
, and
Con
trib
utio
nsN
ot R
estr
icte
d to
Spe
cific
Pro
gram
s8,
036,
082
8,27
2,72
0
12
,382
,310
12
,479
,116
12
,573
,663
10
,654
,228
10
,472
,277
10
,652
,411
10
,859
,971
10
,928
,639
In
vest
men
t Ear
ning
s6,
141,
668
5,20
1,67
2
2,
459,
306
429,
007
13
5,77
2
196,
339
15
5,42
4
137,
174
25
8,28
8
392,
047
G
ain
on S
ale
of A
sset
-
-
-
-
-
9,
929
5,30
0
20
,608
70
,058
-
Oth
er9,
580
122,
733
44
,093
15
2,93
2
103,
408
93
,938
49
6,03
7
146,
367
13
2,28
7
179,
384
To
tal G
ener
al R
even
ues
155,
781,
716
161,
082,
975
167,
504,
321
174,
236,
411
177,
586,
458
176,
546,
970
180,
716,
132
181,
381,
787
186,
535,
674
191,
531,
766
Chan
ge in
Net
Pos
ition
781,
548
(9
29,6
61)
(1,6
81,0
63)
3,
863,
742
5,98
9,12
3
7,
087,
505
10,3
44,7
68
7,05
7,21
1
1,
722,
717
(5,6
26,4
77)
* N
ote:
Beg
inni
ng in
201
4-15
, the
Dis
tric
t boo
ked
thei
r sha
re o
f the
PSE
RS m
ultip
le e
mpl
oyer
pen
sion
pla
n lia
bilit
y to
com
ply
with
GAS
B 67
/68.
Sour
ce:
Dist
rict A
udite
d Fi
nanc
ial S
tate
men
ts
WES
T CH
ESTE
R AR
EA S
CHO
OL
DIS
TRIC
TCh
ange
s in
Net
Pos
ition
(Ful
l Acc
rual
Met
hod
of A
ccou
ntin
g)

- 70
-
Fisc
al Y
ear E
ndin
g Ju
ne 3
0,20
0720
0820
0920
1020
1120
1220
1320
1420
1520
16
Gene
ral F
und
Unr
eser
ved
- Des
igna
ted
for P
SERS
-
-
-
1,20
0,00
0
-
-
-
-
-
-
Unr
eser
ved
- Und
esig
nate
d9,
631,
412
7,
494,
323
7,
861,
943
10
,795
,399
-
-
-
-
-
-
*Non
-Spe
ndab
le-
-
-
-
-
1,
277,
682
1,
918,
300
3,
482,
456
4,
128,
770
2,
066,
625
*R
estr
icte
d-
-
-
-
-
1,
892,
658
1,
894,
735
-
-
-
*C
omm
itted
Pen
sion
-
-
-
-
1,20
0,00
0
3,70
0,00
0
5,00
0,00
0
4,50
0,00
0
2,11
7,00
0
2,11
7,00
0
Hea
lthca
re-
-
-
-
1,
558,
100
2,
677,
700
4,
171,
100
4,
856,
190
4,
899,
442
4,
159,
909
*A
ssig
ned
Ath
letic
act
iviti
es-
-
-
-
95
,549
12
4,16
0
10
2,73
9
11
9,78
2
11
5,70
0
89
,487
T
ax S
tabi
lizat
ion
-
-
-
-
-
3,34
9,20
0
6,83
0,50
0
5,95
1,30
0
5,64
6,42
6
5,47
1,00
5
*Una
ssig
ned
-
-
-
-
15,6
09,0
35
12
,354
,604
12,4
54,5
15
14
,441
,344
14,7
58,2
21
14
,856
,952
Tota
l Gen
eral
Fun
d Fu
nd B
alan
ce9,
631,
412
7,
494,
323
7,
861,
943
11
,995
,399
18,4
62,6
84
25
,376
,004
32,3
71,8
89
33
,351
,072
31,6
65,5
59
28
,760
,978
All o
ther
fund
sRe
serv
ed -
Capi
tal P
roje
cts F
und
-
20,3
41,0
92
6,
965,
394
8,
316,
802
-
-
-
-
-
-
Re
serv
ed -
Capi
tal R
eser
ve F
und
-
16,3
78,0
62
14
,641
,919
13,8
11,1
78
-
-
-
-
-
-
Re
serv
ed -
Non
-Maj
or F
unds
-
307,
300
-
-
-
-
-
-
-
-
Unr
eser
ved
- Cap
ital P
roje
cts F
und
36,1
70,1
15
-
-
-
-
-
-
-
-
-
U
nres
erve
d - C
apita
l Res
erve
Fun
d16
,813
,479
-
-
-
-
-
-
-
-
-
Unr
eser
ved
- Deb
t Ser
vice
Fun
d56
8,75
4
-
-
-
-
-
-
-
-
-
U
nres
erve
d - N
on-M
ajor
Fun
ds31
,874
62
,758
49
,596
75
,606
-
-
-
-
-
-
*N
on-S
pend
able
- Ca
pita
l Res
erve
Fun
d-
-
-
-
-
-
-
-
28
5,00
0
36
8,35
0
*R
estr
icte
d - C
apita
l Pro
ject
s Fun
d-
-
-
-
5,
838,
643
79
3,49
6
7,
119,
899
8,
376,
597
-
4,
038,
838
*R
estr
icte
d - C
apita
l Res
erve
Fun
d-
-
-
-
14
,506
,078
14,3
29,7
59
15
,646
,701
17,6
72,5
51
21
,918
,300
27,0
71,8
68
*A
ssig
ned
- Cap
ital P
roje
cts F
und
-
-
-
-
94,7
00
-
-
-
-
-
*Una
ssig
ned
- Cap
ital P
roje
cts F
und
-
-
-
-
-
-
-
-
(3,4
51,1
76)
-
Tota
l Oth
er F
unds
53,5
84,2
22
37
,089
,212
21,6
56,9
09
22
,203
,586
20,4
39,4
21
15
,123
,255
22,7
66,6
00
26
,049
,148
18,7
52,1
24
31
,479
,056
TOTA
L FU
ND
BALA
NCE
63,2
15,6
34
44
,583
,535
29,5
18,8
52
34
,198
,985
38,9
02,1
05
40
,499
,259
55,1
38,4
89
59
,400
,220
50,4
17,6
83
60
,240
,034
* N
ote:
In
2010
-11,
the
Dist
rict c
hang
ed th
eir f
und
bala
nce
desig
natio
ns to
com
ply
with
GAS
B 54
.So
urce
: Di
stric
ts A
udite
d Fi
nanc
ial S
tate
men
ts
WES
T CH
ESTE
R AR
EA S
CHO
OL
DIST
RICT
Fund
Bal
ance
- G
over
nmen
tal F
unds
(Mod
ified
Acc
rual
Met
hod
of A
ccou
ntin
g)

- 71
-
2006
-07
2007
-08
2008
-09
2009
-10
2010
-11
2011
-12
2012
-13
2013
-14
2014
-15
2015
-16
Gov
ernm
enta
l Fun
d Re
venu
eLo
cal S
ourc
e14
9,46
1,47
8
15
4,42
7,52
7
156,
866,
132
16
3,50
8,93
2
165,
091,
475
16
7,60
0,89
5
171,
550,
034
17
2,12
3,68
5
176,
877,
190
18
2,14
4,52
6
Stat
e So
urce
26,0
79,0
99
27,2
27,7
34
29
,959
,702
28,9
90,2
24
28
,254
,872
28,6
15,8
28
29
,530
,022
31,7
17,8
57
34
,209
,926
35,8
06,4
99
Fe
dera
l Sou
rce
2,64
9,95
0
2,99
1,12
2
3,13
0,01
6
4,60
4,95
0
6,86
6,47
6
4,27
1,70
1
4,04
8,27
5
2,66
1,78
3
2,95
9,82
0
2,86
5,33
5
Tota
l Gov
ernm
enta
l Rev
enue
s17
8,19
0,52
7
18
4,64
6,38
3
189,
955,
850
19
7,10
4,10
6
200,
212,
823
20
0,48
8,42
4
205,
128,
331
20
6,50
3,32
5
214,
046,
936
22
0,81
6,36
0
Gov
ernm
enta
l Exp
endi
ture
sIn
stru
ctio
n95
,704
,318
10
3,56
3,83
2
104,
030,
587
10
5,86
0,03
0
109,
936,
321
11
0,62
2,63
2
114,
302,
116
11
7,34
2,61
8
124,
056,
139
13
2,49
0,38
2
Supp
ort S
ervi
ces
53,2
60,3
08
56,4
97,2
25
58
,954
,157
58,7
54,6
57
56
,682
,210
54,8
93,5
14
56
,041
,159
57,5
81,1
76
59
,939
,165
61,7
55,7
26
N
onin
stru
ctio
nal S
ervi
ces
3,89
1,13
0
4,11
0,47
6
4,13
5,96
2
4,06
2,16
7
3,99
8,18
2
4,05
0,19
8
4,15
9,66
6
4,23
7,96
7
4,61
0,18
2
4,80
3,10
5
Faci
litie
s Acq
uisit
ion
Cons
truc
tion
& Im
prov
emen
t23
,032
,860
16
,104
,197
13,4
34,0
65
9,
175,
433
3,
979,
389
5,
725,
834
15
,543
,569
11,3
35,8
52
13
,509
,139
8,30
9,29
4
Debt
Ser
vice
Prin
cipa
l7,
983,
000
10
,394
,000
11,2
16,0
00
12
,533
,569
9,39
4,00
0
12,1
94,0
00
11
,137
,000
12,6
02,0
00
11
,620
,000
8,17
6,00
0
Debt
Ser
vice
Inte
rest
14,2
73,7
68
13,6
16,6
12
13
,232
,428
12,4
19,7
70
12
,886
,339
11,5
91,5
40
10
,759
,024
11,0
51,7
92
9,
543,
869
10
,174
,433
Bond
Issu
ance
Cos
ts-
-
-
-
-
-
-
-
56
,166
464,
253
Tota
l Gov
ernm
enta
l Exp
endi
ture
s19
8,14
5,38
4
20
4,28
6,34
2
205,
003,
199
20
2,80
5,62
6
196,
876,
441
19
9,07
7,71
8
211,
942,
534
21
4,15
1,40
5
223,
334,
660
22
6,17
3,19
3
Exce
ss (D
efic
ienc
y) o
f Rev
enue
s
O
ver (
Und
er) E
xpen
ditu
res
(19,
954,
857)
(19,
639,
959)
(15,
047,
349)
(5,7
01,5
20)
3,33
6,38
2
1,41
0,70
6
(6,8
14,2
03)
(7,6
48,0
80)
(9,2
87,7
24)
(5,3
56,8
33)
Gov
ernm
enta
l Oth
er F
inan
cing
Sou
rces
Proc
eeds
from
Lon
g-Te
rm D
ebt
70,7
07,5
70
-
10,7
10,3
64
32
,691
,410
35,7
30,0
00
9,
585,
000
68
,545
,000
42,8
90,0
00
65
,485
,000
61,9
00,0
00
In
terf
und
Tran
sfer
s In
4,87
4,87
6
5,18
1,69
8
-
1,34
0,02
2
2,67
6,80
1
1,50
0,00
0
3,80
6,56
0
4,59
9,26
8
8,64
5,91
0
9,12
5,78
4
Oth
er F
inan
cing
Sou
rces
-
-
-
5,05
7
2,96
6,84
5
76,3
10
8,
688,
471
4,
519,
556
5,
861,
632
8,
300,
311
De
bt S
ervi
ce R
efun
ded
(60,
070,
402)
(5,1
81,6
98)
(10,
648,
480)
(22,
310,
000)
(37,
330,
000)
(9,4
84,1
97)
(56,
196,
858)
(35,
443,
421)
(71,
069,
921)
(60,
135,
702)
Sale
of A
sset
s-
-
-
-
-
9,
929
5,
300
26
,540
94,9
83
5,
077,
718
Re
fund
of P
rior Y
ear R
even
ues
-
-
-
-
-
(36,
146)
-
(97,
744)
(82,
898)
-
Refu
nd o
f Prio
r Yea
r Exp
endi
ture
s(1
2,19
0)
(140
)
(7
9,21
8)
(4
,813
)
(107
)
35
,552
411,
520
14,8
80
16
,391
36,8
57
In
terf
und
tran
sfer
s Out
(4,8
74,8
76)
(1
,340
,022
)
(2
,676
,801
)
(1
,500
,000
)
(3
,806
,560
)
(4
,599
,268
)
(8
,645
,910
)
(9
,125
,784
)
To
tal G
over
nmen
tal O
ther
Fin
anci
ng S
ourc
es10
,624
,978
(1
40)
(17,
334)
10,3
81,6
54
1,
366,
738
18
6,44
8
21
,453
,433
11,9
09,8
11
30
5,18
7
15
,179
,184
NET
CH
ANG
E IN
GO
VERN
MEN
TAL
FUN
D B
ALAN
CE(9
,329
,879
)
(19,
640,
099)
(1
5,06
4,68
3)
4,68
0,13
4
4,70
3,12
0
1,59
7,15
4
14,6
39,2
30
4,
261,
731
(8
,982
,537
)
9,
822,
351
GO
VMTL
FU
ND
BALA
NCE
, BEG
INN
ING
OF
YEAR
72,5
45,5
12
63,2
15,6
33
44
,583
,534
29,5
18,8
51
34
,198
,985
38,9
02,1
05
40
,499
,259
55,1
38,4
89
59
,400
,220
50,4
17,6
83
Pr
ior P
erio
d Ad
just
men
t-
1,
008,
000
-
-
-
-
-
-
-
-
GO
VERN
MEN
TAL
FUN
D B
ALAN
CE, E
ND
OF
YEAR
63,2
15,6
33
44,5
83,5
34
29
,518
,851
34,1
98,9
85
38
,902
,105
40,4
99,2
59
55
,138
,489
59,4
00,2
20
50
,417
,683
60,2
40,0
34
De
bt S
ervi
ce a
s % o
f Exp
endi
ture
s4.
0%5.
1%5.
5%6.
2%4.
8%6.
1%5.
3%5.
9%5.
2%3.
8%
Sour
ce:
Dist
rict's
Aud
ited
Fina
ncia
l Sta
tem
ents
WES
T CH
ESTE
R AR
EA S
CHO
OL
DIS
TRIC
TCh
ange
in F
und
Bala
nce
- Gov
ernm
enta
l Fun
ds (M
odifi
ed A
ccru
al M
etho
d of
Acc
ount
ing)

- 72
-
2006
-07
2007
-08
2008
-09
2009
-10
2010
-11
2011
-12
2012
-13
2013
-14
2014
-15
2015
-16
Loca
l14
5,19
5.0
15
0,74
1.3
15
4,57
8.4
16
1,94
2.4
16
5,07
2.4
16
7,58
0.4
17
1,52
4.8
17
2,07
3.7
17
6,78
4.4
18
2,08
4.7
Re
al E
stat
e11
7,75
2.5
12
3,66
2.8
12
9,79
5.3
13
8,33
1.6
14
1,22
0.9
14
0,71
8.6
14
3,41
3.1
14
3,90
4.6
14
8,40
3.7
15
2,70
9.9
Cu
rren
t11
5,78
3.1
12
1,98
8.6
12
8,29
1.6
13
6,99
9.8
14
0,16
0.5
13
9,64
8.0
14
1,83
9.9
14
3,22
5.1
14
7,44
7.7
15
1,92
9.0
In
terim
1,96
9.4
1,
674.
2
1,50
3.6
1,
331.
8
1,06
0.4
1,
070.
6
1,57
3.2
67
9.5
956.
0
78
0.9
Earn
ed In
com
e16
,889
.7
16
,905
.6
16
,764
.4
16
,458
.0
17
,080
.7
18
,095
.8
18
,691
.5
19
,460
.5
19
,360
.0
20
,118
.5
Re
al E
stat
e Tr
ansf
er4,
261.
7
3,66
5.9
2,
666.
5
2,70
6.8
2,
466.
0
3,26
0.7
3,
473.
6
3,72
4.7
4,
145.
2
4,20
7.4
O
ther
Tax
es P
URT
A20
3.9
198.
0
18
8.6
208.
4
21
8.3
225.
3
22
3.8
210.
8
21
4.7
198.
3
De
linqu
ent T
axes
2,44
2.6
2,
810.
3
2,94
4.9
3,
316.
2
2,80
5.7
3,
816.
1
4,06
9.9
3,
365.
9
3,24
6.0
3,
000.
3
Inve
stm
ent E
arni
ngs
3,23
4.1
3,
051.
1
1,67
4.8
28
8.0
118.
4
17
3.6
129.
8
71
.0
16
5.5
332.
2
G
ate
Rece
ipts
-
-
-
-
119.
4
12
3.4
122.
9
13
0.7
136.
3
15
2.9
Oth
er41
0.5
447.
6
54
4.0
633.
4
1,
043.
0
1,16
6.8
1,
400.
2
1,20
5.5
1,
113.
0
1,36
5.2
Stat
e26
,115
.3
27
,318
.3
30
,058
.0
28
,990
.2
28
,254
.9
28
,615
.9
29
,520
.4
31
,717
.8
34
,209
.9
35
,806
.5
St
uden
t Sub
sidie
s20
,481
.7
21
,116
.3
24
,768
.9
23
,568
.9
22
,424
.6
21
,754
.7
21
,204
.2
21
,371
.8
21
,729
.3
21
,234
.5
Ba
sic In
stru
ctio
n6,
710.
6
6,84
4.8
7,
050.
1
6,33
4.1
6,
029.
5
7,05
0.1
7,
047.
0
7,24
7.3
7,
239.
7
7,57
3.2
Sp
ecia
l Edu
catio
n5,
004.
1
5,02
0.6
5,
087.
5
5,06
8.4
5,
080.
8
5,14
6.9
5,
355.
9
5,31
1.1
5,
413.
4
5,80
1.6
Tu
ition
Priv
ate
Hom
e Pl
acem
ent
71.3
73.6
87.4
50.6
-
17
.6
12
1.7
113.
9
11
1.5
179.
4
Tr
ansp
orta
tion
4,97
6.0
4,
371.
1
4,82
8.3
4,
565.
1
4,43
4.4
4,
295.
1
3,71
0.0
3,
750.
5
3,63
7.2
3,
671.
8
Med
ical
, Den
tal &
Nur
se
305.
6
29
6.3
295.
6
28
8.7
273.
8
27
3.9
261.
5
25
6.8
222.
3
25
3.9
Rent
1,33
4.2
1,
437.
4
1,51
9.5
1,
544.
7
1,07
4.7
1,
224.
8
1,15
1.2
1,
160.
4
1,18
1.7
-
Char
ter S
choo
ls1,
294.
4
1,33
7.4
1,
641.
1
1,55
8.4
1,
478.
9
-
-
-
-
-
Re
ady
To L
earn
Blo
ck G
rant
s / A
ccou
ntab
ility
Gra
nts
339.
8
34
8.3
343.
8
34
3.8
322.
4
12
6.6
126.
7
12
6.7
303.
2
39
9.1
Prop
erty
Tax
Rel
ief
-
-
3,59
2.8
3,
734.
6
3,70
8.3
3,
604.
0
3,42
5.3
3,
405.
1
3,62
0.3
3,
355.
4
Oth
er44
5.7
1,38
6.8
32
2.7
80.5
21.9
15.7
4.9
-
-
-
Teac
her S
ubsid
ies
5,63
3.6
6,
202.
0
5,28
9.1
5,
421.
3
5,83
0.2
6,
861.
2
8,31
6.2
10
,346
.1
12
,480
.7
14
,572
.0
So
cial
Sec
urity
3,01
2.1
3,
154.
7
3,23
2.9
3,
278.
1
3,31
9.2
3,
173.
0
3,08
4.5
3,
148.
8
3,16
3.7
3,
194.
0
Retir
emen
t2,
621.
5
3,04
7.3
2,
056.
1
2,14
3.2
2,
511.
1
3,68
8.2
5,
231.
7
7,19
7.3
9,
317.
0
11,3
78.0
Fede
ral
3,87
8.6
4,
231.
6
4,43
8.9
5,
901.
2
6,86
6.5
4,
121.
7
4,05
9.2
2,
661.
8
2,95
9.8
2,
865.
3
Title
I1,
523.
7
1,99
8.5
1,
492.
4
2,01
3.5
1,
675.
2
1,34
1.4
1,
752.
2
459.
6
81
8.0
828.
9
Ti
tle II
357.
0
31
0.3
327.
8
18
2.4
416.
8
31
1.2
249.
0
19
9.4
293.
9
37
4.0
Basic
Edu
catio
n AR
RA F
unds
-
-
-
85
2.0
834.
0
-
-
-
-
-
IDEA
- AR
RA fu
nds
-
-
418.
0
66
9.0
820.
7
-
-
-
-
-
Ed Jo
bs -
ARRA
-
-
-
-
494.
1
7.
3
0.4
-
-
-
Title
I - A
RRA
-
-
-
-
471.
8
24
9.3
-
-
-
-
IDEA
1,22
8.5
1,
240.
5
1,30
8.9
1,
296.
3
1,23
5.6
1,
310.
3
1,28
2.4
1,
154.
7
1,21
5.8
1,
199.
7
MA
Dire
ct S
ervi
ces/
Tim
e St
udy
594.
5
56
2.8
760.
3
72
2.4
768.
6
77
3.4
659.
4
72
2.7
516.
0
30
5.5
Oth
er17
4.9
119.
5
13
1.5
165.
6
14
9.6
128.
8
11
5.8
125.
5
11
6.0
157.
2
Loca
l Tax
es &
Sub
sidi
es17
5,18
8.9
18
2,29
1.3
18
9,07
5.3
19
6,83
3.8
20
0,19
3.7
20
0,31
8.0
20
5,10
4.4
20
6,45
3.4
21
3,95
4.1
22
0,75
6.5
Sour
ce:
Dist
rict B
udge
t Con
trol
For
ecas
t Mod
el
WES
T CH
ESTE
R AR
EA S
CHO
OL
DIST
RICT
GEN
ERAL
FU
ND
REV
ENU
ES B
Y SO
URC
E - M
OD
IFIE
D A
CCRU
AL M
ETH
OD
OF
ACCO
UN
TIN
G (u
naud
ited)
(Tho
usan
ds)
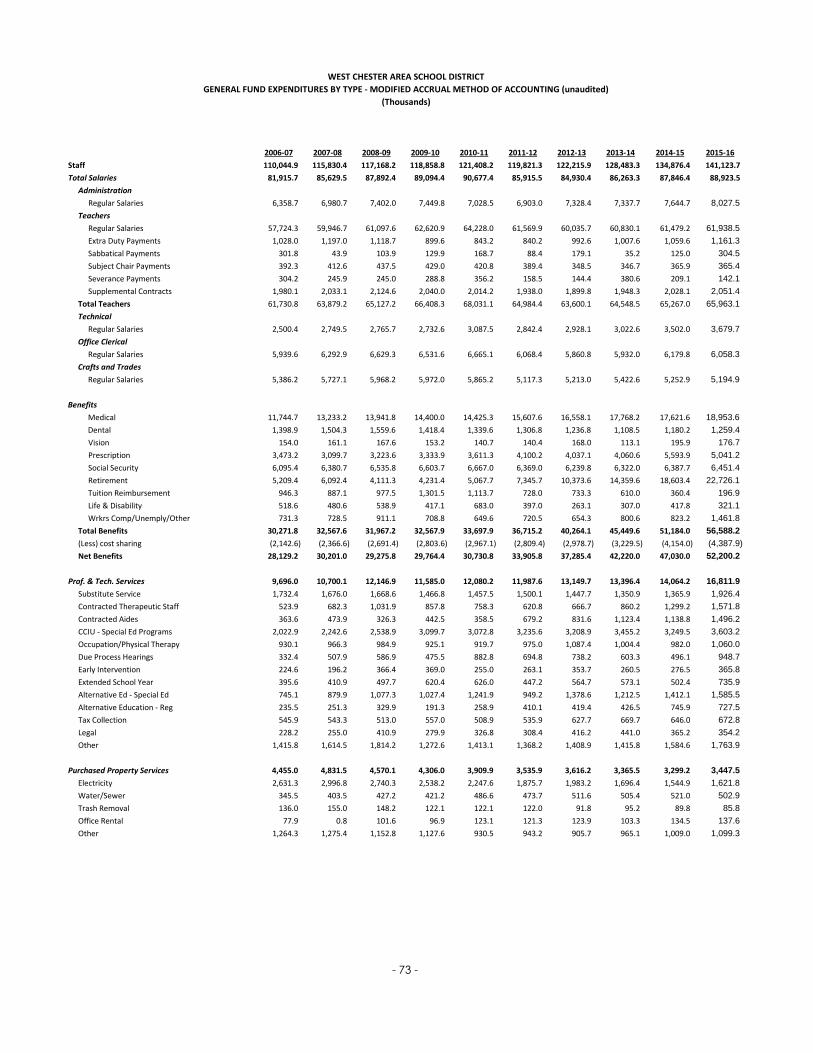
- 73 -
2006-07 2007-08 2008-09 2009-10 2010-11 2011-12 2012-13 2013-14 2014-15 2015-16Staff 110,044.9 115,830.4 117,168.2 118,858.8 121,408.2 119,821.3 122,215.9 128,483.3 134,876.4 141,123.7 Total Salaries 81,915.7 85,629.5 87,892.4 89,094.4 90,677.4 85,915.5 84,930.4 86,263.3 87,846.4 88,923.5
AdministrationRegular Salaries 6,358.7 6,980.7 7,402.0 7,449.8 7,028.5 6,903.0 7,328.4 7,337.7 7,644.7 8,027.5
TeachersRegular Salaries 57,724.3 59,946.7 61,097.6 62,620.9 64,228.0 61,569.9 60,035.7 60,830.1 61,479.2 61,938.5
Extra Duty Payments 1,028.0 1,197.0 1,118.7 899.6 843.2 840.2 992.6 1,007.6 1,059.6 1,161.3
Sabbatical Payments 301.8 43.9 103.9 129.9 168.7 88.4 179.1 35.2 125.0 304.5
Subject Chair Payments 392.3 412.6 437.5 429.0 420.8 389.4 348.5 346.7 365.9 365.4
Severance Payments 304.2 245.9 245.0 288.8 356.2 158.5 144.4 380.6 209.1 142.1
Supplemental Contracts 1,980.1 2,033.1 2,124.6 2,040.0 2,014.2 1,938.0 1,899.8 1,948.3 2,028.1 2,051.4
Total Teachers 61,730.8 63,879.2 65,127.2 66,408.3 68,031.1 64,984.4 63,600.1 64,548.5 65,267.0 65,963.1
TechnicalRegular Salaries 2,500.4 2,749.5 2,765.7 2,732.6 3,087.5 2,842.4 2,928.1 3,022.6 3,502.0 3,679.7
Office ClericalRegular Salaries 5,939.6 6,292.9 6,629.3 6,531.6 6,665.1 6,068.4 5,860.8 5,932.0 6,179.8 6,058.3
Crafts and TradesRegular Salaries 5,386.2 5,727.1 5,968.2 5,972.0 5,865.2 5,117.3 5,213.0 5,422.6 5,252.9 5,194.9
BenefitsMedical 11,744.7 13,233.2 13,941.8 14,400.0 14,425.3 15,607.6 16,558.1 17,768.2 17,621.6 18,953.6
Dental 1,398.9 1,504.3 1,559.6 1,418.4 1,339.6 1,306.8 1,236.8 1,108.5 1,180.2 1,259.4
Vision 154.0 161.1 167.6 153.2 140.7 140.4 168.0 113.1 195.9 176.7
Prescription 3,473.2 3,099.7 3,223.6 3,333.9 3,611.3 4,100.2 4,037.1 4,060.6 5,593.9 5,041.2
Social Security 6,095.4 6,380.7 6,535.8 6,603.7 6,667.0 6,369.0 6,239.8 6,322.0 6,387.7 6,451.4
Retirement 5,209.4 6,092.4 4,111.3 4,231.4 5,067.7 7,345.7 10,373.6 14,359.6 18,603.4 22,726.1
Tuition Reimbursement 946.3 887.1 977.5 1,301.5 1,113.7 728.0 733.3 610.0 360.4 196.9
Life & Disability 518.6 480.6 538.9 417.1 683.0 397.0 263.1 307.0 417.8 321.1
Wrkrs Comp/Unemply/Other 731.3 728.5 911.1 708.8 649.6 720.5 654.3 800.6 823.2 1,461.8
Total Benefits 30,271.8 32,567.6 31,967.2 32,567.9 33,697.9 36,715.2 40,264.1 45,449.6 51,184.0 56,588.2
(Less) cost sharing (2,142.6) (2,366.6) (2,691.4) (2,803.6) (2,967.1) (2,809.4) (2,978.7) (3,229.5) (4,154.0) (4,387.9)
Net Benefits 28,129.2 30,201.0 29,275.8 29,764.4 30,730.8 33,905.8 37,285.4 42,220.0 47,030.0 52,200.2
Prof. & Tech. Services 9,696.0 10,700.1 12,146.9 11,585.0 12,080.2 11,987.6 13,149.7 13,396.4 14,064.2 16,811.9
Substitute Service 1,732.4 1,676.0 1,668.6 1,466.8 1,457.5 1,500.1 1,447.7 1,350.9 1,365.9 1,926.4
Contracted Therapeutic Staff 523.9 682.3 1,031.9 857.8 758.3 620.8 666.7 860.2 1,299.2 1,571.8
Contracted Aides 363.6 473.9 326.3 442.5 358.5 679.2 831.6 1,123.4 1,138.8 1,496.2
CCIU - Special Ed Programs 2,022.9 2,242.6 2,538.9 3,099.7 3,072.8 3,235.6 3,208.9 3,455.2 3,249.5 3,603.2
Occupation/Physical Therapy 930.1 966.3 984.9 925.1 919.7 975.0 1,087.4 1,004.4 982.0 1,060.0
Due Process Hearings 332.4 507.9 586.9 475.5 882.8 694.8 738.2 603.3 496.1 948.7
Early Intervention 224.6 196.2 366.4 369.0 255.0 263.1 353.7 260.5 276.5 365.8
Extended School Year 395.6 410.9 497.7 620.4 626.0 447.2 564.7 573.1 502.4 735.9
Alternative Ed - Special Ed 745.1 879.9 1,077.3 1,027.4 1,241.9 949.2 1,378.6 1,212.5 1,412.1 1,585.5
Alternative Education - Reg 235.5 251.3 329.9 191.3 258.9 410.1 419.4 426.5 745.9 727.5
Tax Collection 545.9 543.3 513.0 557.0 508.9 535.9 627.7 669.7 646.0 672.8
Legal 228.2 255.0 410.9 279.9 326.8 308.4 416.2 441.0 365.2 354.2
Other 1,415.8 1,614.5 1,814.2 1,272.6 1,413.1 1,368.2 1,408.9 1,415.8 1,584.6 1,763.9
Purchased Property Services 4,455.0 4,831.5 4,570.1 4,306.0 3,909.9 3,535.9 3,616.2 3,365.5 3,299.2 3,447.5
Electricity 2,631.3 2,996.8 2,740.3 2,538.2 2,247.6 1,875.7 1,983.2 1,696.4 1,544.9 1,621.8
Water/Sewer 345.5 403.5 427.2 421.2 486.6 473.7 511.6 505.4 521.0 502.9
Trash Removal 136.0 155.0 148.2 122.1 122.1 122.0 91.8 95.2 89.8 85.8
Office Rental 77.9 0.8 101.6 96.9 123.1 121.3 123.9 103.3 134.5 137.6
Other 1,264.3 1,275.4 1,152.8 1,127.6 930.5 943.2 905.7 965.1 1,009.0 1,099.3
WEST CHESTER AREA SCHOOL DISTRICTGENERAL FUND EXPENDITURES BY TYPE - MODIFIED ACCRUAL METHOD OF ACCOUNTING (unaudited)
(Thousands)
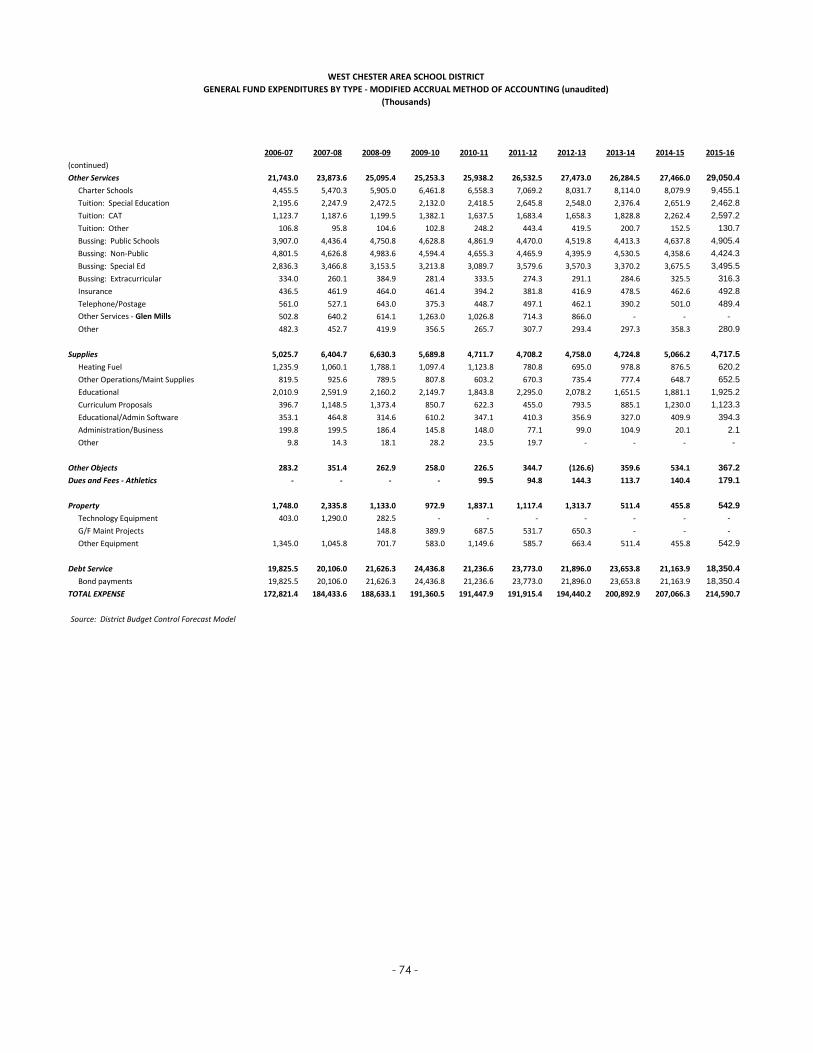
- 74 -
2006-07 2007-08 2008-09 2009-10 2010-11 2011-12 2012-13 2013-14 2014-15 2015-16
WEST CHESTER AREA SCHOOL DISTRICTGENERAL FUND EXPENDITURES BY TYPE - MODIFIED ACCRUAL METHOD OF ACCOUNTING (unaudited)
(Thousands)
(continued)Other Services 21,743.0 23,873.6 25,095.4 25,253.3 25,938.2 26,532.5 27,473.0 26,284.5 27,466.0 29,050.4
Charter Schools 4,455.5 5,470.3 5,905.0 6,461.8 6,558.3 7,069.2 8,031.7 8,114.0 8,079.9 9,455.1
Tuition: Special Education 2,195.6 2,247.9 2,472.5 2,132.0 2,418.5 2,645.8 2,548.0 2,376.4 2,651.9 2,462.8
Tuition: CAT 1,123.7 1,187.6 1,199.5 1,382.1 1,637.5 1,683.4 1,658.3 1,828.8 2,262.4 2,597.2
Tuition: Other 106.8 95.8 104.6 102.8 248.2 443.4 419.5 200.7 152.5 130.7
Bussing: Public Schools 3,907.0 4,436.4 4,750.8 4,628.8 4,861.9 4,470.0 4,519.8 4,413.3 4,637.8 4,905.4
Bussing: Non-Public 4,801.5 4,626.8 4,983.6 4,594.4 4,655.3 4,465.9 4,395.9 4,530.5 4,358.6 4,424.3
Bussing: Special Ed 2,836.3 3,466.8 3,153.5 3,213.8 3,089.7 3,579.6 3,570.3 3,370.2 3,675.5 3,495.5
Bussing: Extracurricular 334.0 260.1 384.9 281.4 333.5 274.3 291.1 284.6 325.5 316.3
Insurance 436.5 461.9 464.0 461.4 394.2 381.8 416.9 478.5 462.6 492.8
Telephone/Postage 561.0 527.1 643.0 375.3 448.7 497.1 462.1 390.2 501.0 489.4
Other Services - Glen Mills 502.8 640.2 614.1 1,263.0 1,026.8 714.3 866.0 - - -
Other 482.3 452.7 419.9 356.5 265.7 307.7 293.4 297.3 358.3 280.9
Supplies 5,025.7 6,404.7 6,630.3 5,689.8 4,711.7 4,708.2 4,758.0 4,724.8 5,066.2 4,717.5
Heating Fuel 1,235.9 1,060.1 1,788.1 1,097.4 1,123.8 780.8 695.0 978.8 876.5 620.2
Other Operations/Maint Supplies 819.5 925.6 789.5 807.8 603.2 670.3 735.4 777.4 648.7 652.5
Educational 2,010.9 2,591.9 2,160.2 2,149.7 1,843.8 2,295.0 2,078.2 1,651.5 1,881.1 1,925.2
Curriculum Proposals 396.7 1,148.5 1,373.4 850.7 622.3 455.0 793.5 885.1 1,230.0 1,123.3
Educational/Admin Software 353.1 464.8 314.6 610.2 347.1 410.3 356.9 327.0 409.9 394.3
Administration/Business 199.8 199.5 186.4 145.8 148.0 77.1 99.0 104.9 20.1 2.1
Other 9.8 14.3 18.1 28.2 23.5 19.7 - - - -
Other Objects 283.2 351.4 262.9 258.0 226.5 344.7 (126.6) 359.6 534.1 367.2
Dues and Fees - Athletics - - - - 99.5 94.8 144.3 113.7 140.4 179.1
Property 1,748.0 2,335.8 1,133.0 972.9 1,837.1 1,117.4 1,313.7 511.4 455.8 542.9
Technology Equipment 403.0 1,290.0 282.5 - - - - - - -
G/F Maint Projects 148.8 389.9 687.5 531.7 650.3 - - -
Other Equipment 1,345.0 1,045.8 701.7 583.0 1,149.6 585.7 663.4 511.4 455.8 542.9
Debt Service 19,825.5 20,106.0 21,626.3 24,436.8 21,236.6 23,773.0 21,896.0 23,653.8 21,163.9 18,350.4
Bond payments 19,825.5 20,106.0 21,626.3 24,436.8 21,236.6 23,773.0 21,896.0 23,653.8 21,163.9 18,350.4
TOTAL EXPENSE 172,821.4 184,433.6 188,633.1 191,360.5 191,447.9 191,915.4 194,440.2 200,892.9 207,066.3 214,590.7
Source: District Budget Control Forecast Model

WEST CHESTER AREA SCHOOL DISTRICT
REVENUE CAPACITY

- 75
-
Fisc
al
Year
Mill
age
Rate
Curr
ent R
eal
Esta
te T
axes
Inte
rim R
eal
Esta
te T
axes
Delin
quen
t Rea
l Es
tate
Tax
esAc
t 511
Tax
es *
Oth
er L
ocal
Re
venu
esTo
tal L
ocal
Re
venu
es
2006
-07
15.1
611
5,78
3,14
8
1,96
9,35
8
2,
442,
606
21,1
51,3
84
3,88
4,88
9
14
5,23
1,38
5
2007
-08
15.7
912
1,98
8,63
3
1,67
4,19
2
2,
810,
278
20,5
71,4
97
3,79
2,58
6
15
0,83
7,18
6
2008
-09
16.8
512
8,29
1,63
2
1,50
3,63
5
2,
944,
871
19,4
30,9
06
2,49
9,92
1
15
4,67
0,96
4
2009
-10
17.8
513
6,99
9,77
1
1,33
1,74
9
3,
316,
209
19,1
64,8
15
1,12
9,73
7
16
1,94
2,28
1
2010
-11
18.3
614
0,16
0,46
2
1,06
0,39
1
2,
805,
694
19,5
46,7
06
1,49
9,14
7
16
5,07
2,40
0
2011
-12
18.3
613
9,64
8,02
1
1,07
0,63
7
3,
816,
141
21,3
56,5
08
1,68
9,12
7
16
7,58
0,43
4
2012
-13
18.6
714
1,83
9,87
1
1,57
3,19
6
4,
069,
877
22,1
65,1
52
1,87
8,00
1
17
1,52
6,09
8
2013
-14
18.6
714
3,22
5,11
3
679,
486
3,
365,
905
23,1
85,2
05
1,60
3,09
9
17
2,05
8,80
8
2014
-15
19.2
114
7,44
7,71
7
955,
973
3,
246,
013
23,5
05,2
23
1,62
9,47
2
17
6,78
4,39
8
2015
-16
19.5
815
1,92
9,04
3
780,
930
3,
000,
329
24,3
25,9
67
2,04
8,42
5
18
2,08
4,69
4
* A
ct 5
11 T
axes
incl
ude
Earn
ed In
com
e an
d Re
al E
stat
e Tr
ansf
er T
axes
Sour
ce:
Dist
rict A
nnua
l Fin
anci
al R
epor
t (AF
R)
WES
T CH
ESTE
R AR
EA S
CHO
OL
DIST
RICT
Gen
eral
Fun
d - M
ost S
igni
fican
t Loc
al R
even
ue S
ourc
es(M
odifi
ed a
ccru
al m
etho
d of
acc
ount
ing)

- 76
-
LAN
D U
SE D
ESCR
IPTI
ON
2006
-07
# of
Par
cels
Asse
ssm
ent
Tota
l20
07-0
8 #
of P
arce
lsAs
sess
men
t To
tal
2008
-09
# of
Par
cels
Asse
ssm
ent
Tota
l20
09-1
0 #
of P
arce
lsAs
sess
men
t To
tal
2010
-11
# of
Par
cels
Asse
ssm
ent
Tota
lCH
ESTE
R CO
UN
TYN
ot Id
entif
ied
97
3,77
2,80
3
18
8
10
,326
,250
21
3,04
5,79
0
-
-
1
47,8
20
Co
mm
erci
al P
rope
rtie
s1,
571
1,
335,
505,
835
1,
572
1,
348,
537,
398
1,59
3
1,38
9,07
6,24
8
1,63
2
1,40
8,30
5,03
3
1,65
2
1,38
2,77
5,45
3
Farm
Pro
pert
ies
72
23,6
79,6
30
73
23,6
27,6
60
73
23
,523
,120
72
23
,568
,250
72
23
,464
,210
In
dust
rial P
rope
rtie
s90
15
1,18
5,99
0
88
14
9,88
6,68
0
89
150,
726,
520
90
151,
028,
920
90
151,
052,
080
Resid
entia
l Pro
pert
ies
29,5
28
5,
884,
835,
936
29
,611
5,92
8,69
0,15
6
29
,676
5,96
5,41
9,35
7
29,7
78
6,
013,
563,
931
29
,838
6,01
2,58
8,03
1
Vaca
nt L
and
959
69,8
42,3
10
981
69,0
79,4
00
1,
088
68
,860
,100
1,
046
64
,943
,920
1,
061
59
,182
,350
TO
TAL
CHES
TER
COU
NTY
32,3
17
7,
468,
822,
504
32
,513
7,53
0,14
7,54
4
32
,540
7,60
0,65
1,13
5
32,6
18
7,
661,
410,
054
32
,714
7,62
9,10
9,94
4
DELA
WAR
E CO
UN
TYCo
mm
erci
al/I
ndus
tria
l7
3,88
6,90
0
7
3,88
6,90
0
14
8,
533,
463
15
8,90
4,95
3
12
6,
868,
373
Resid
entia
l/Far
ms/
Vaca
nt L
and
2,06
7
589,
333,
521
2,06
7
623,
278,
141
2,
179
63
3,53
1,31
8
2,
187
63
7,52
7,89
5
2,
190
63
0,72
6,09
3
TO
TAL
DELA
WAR
E CO
UN
TY2,
074
59
3,22
0,42
1
2,
074
62
7,16
5,04
1
2,19
3
642,
064,
781
2,20
2
646,
432,
848
2,20
2
637,
594,
466
GRA
ND
TOTA
L34
,391
8,06
2,04
2,92
5
34,5
87
8,
157,
312,
585
34,7
33
8,
242,
715,
916
34
,820
8,30
7,84
2,90
2
34,9
16
8,
266,
704,
410
LAN
D U
SE D
ESCR
IPTI
ON
2011
-12
# of
Par
cels
Asse
ssm
ent
Tota
l20
12-1
3 #
of P
arce
lsAs
sess
men
t To
tal
2013
-14
# of
Par
cels
Asse
ssm
ent
Tota
l20
14-1
5 #
of P
arce
lsAs
sess
men
t To
tal
2015
-16
# of
Par
cels
Asse
ssm
ent
Tota
lCH
ESTE
R CO
UN
TYN
ot Id
entif
ied
-
-
-
-
-
-
Com
mer
cial
Pro
pert
ies
1,65
9
1,36
5,47
7,33
9
1,67
7
1,39
1,81
0,64
9
1,
714
1,
369,
224,
799
1,
712
1,
365,
713,
429
1,
709
1,
367,
742,
137
Fa
rm P
rope
rtie
s70
22
,838
,800
70
22
,769
,440
68
22,0
66,7
40
68
22,0
66,7
40
69
22,7
03,2
80
Indu
stria
l Pro
pert
ies
89
150,
689,
470
89
148,
943,
570
88
14
6,75
0,18
0
88
14
5,93
6,27
0
87
14
5,40
5,23
5
Re
siden
tial P
rope
rtie
s29
,917
6,01
5,06
7,37
5
30,0
33
6,
012,
449,
332
30,1
45
6,
044,
809,
459
30
,250
6,06
3,26
2,56
0
30,3
65
6,
115,
048,
985
Va
cant
Lan
d1,
044
69
,623
,000
1,
308
55
,913
,330
1,16
2
50,7
55,9
00
1,16
3
49,3
19,2
10
1,09
0
47,5
41,3
20
TOTA
L CH
ESTE
R CO
UN
TY32
,779
7,62
3,69
5,98
4
33,1
77
7,
631,
886,
321
33,1
77
7,
633,
607,
078
33
,281
7,64
6,29
8,20
9
33,3
20
7,
698,
440,
957
DELA
WAR
E CO
UN
TYCo
mm
erci
al/I
ndus
tria
l14
8,
533,
463
14
8,53
3,46
3
14
8,
533,
463
14
8,53
3,46
3
14
8,
533,
463
Resid
entia
l/Far
ms/
Vaca
nt L
and
2,19
0
628,
332,
131
2,18
9
629,
392,
646
2,
193
62
9,10
5,93
4
2,
192
63
3,89
1,76
1
2,
194
63
8,80
1,39
6
TO
TAL
DELA
WAR
E CO
UN
TY2,
204
63
6,86
5,59
4
2,
203
63
7,92
6,10
9
2,20
7
637,
639,
397
2,20
6
642,
425,
224
2,20
8
647,
334,
859
GRA
ND
TOTA
L34
,983
8,26
0,56
1,57
8
35,3
80
8,
269,
812,
430
35,3
84
8,
271,
246,
475
35
,487
8,28
8,72
3,43
3
35,5
28
8,
345,
775,
816
Sour
ce:
Coun
ty L
and
Use
Cod
e Re
port
WES
T CH
ESTE
R AR
EA S
CHO
OL
DIST
RICT
ANAL
YSIS
OF
ASSE
SSED
VAL
UE
FOR
TAXA
BLE
REAL
EST
ATE
(una
udite
d)

- 77 -
As of June 30th
Market Value Chester County (000)
Market Value Delaware
County (000)
Total Market Value (000)
Assessed Value(000)
Ratio of Market Value to Assessed
Value
2005 7,866,747 492,988 8,359,734 8,062,043 104%
2006 9,008,526 582,243 9,590,769 8,157,313 118%
2007 9,086,864 610,170 9,697,034 8,242,716 118%
2008 10,393,941 674,163 11,068,104 8,307,843 133%
2009 10,480,758 671,018 11,151,776 8,266,704 135%
2010 11,334,739 690,551 12,025,290 8,260,562 146%
2011 11,311,170 682,225 11,993,395 8,269,812 145%
2012 11,830,153 706,388 12,536,541 8,271,246 152%
2013 11,841,643 705,298 12,546,941 8,288,723 151%
2014 12,049,694 736,705 12,786,399 8,345,776 153%
Source: State Tax Equalization Board
WEST CHESTER AREA SCHOOL DISTRICTMarket Value versus Assessed Value of Taxable Real Estate

- 78
-
Ches
ter C
ount
y
Fisc
al
Year
Wes
t Che
ster
Ar
ea S
choo
l Di
stric
tCh
este
r Co
unty
Tow
nshi
p of
Ea
st B
radf
ord
Tow
nshi
p of
Ea
st G
oshe
nTo
wns
hip
of
Thor
nbur
yTo
wns
hip
of
Wes
t Gos
hen
Tow
nshi
p of
W
est
Whi
tela
ndTo
wns
hip
of
Wes
ttow
nBo
roug
h of
W
est C
hest
er20
06-0
715
.16
3.80
0.07
1.25
0.84
1.50
0.60
1.50
5.21
2007
-08
15.7
93.
800.
071.
250.
841.
500.
602.
005.
6020
08-0
916
.85
3.97
0.07
1.25
0.84
1.50
0.60
2.00
5.60
2009
-10
17.8
53.
970.
071.
250.
842.
000.
602.
005.
8020
10-1
118
.36
3.97
0.07
1.25
0.84
2.00
0.60
2.50
6.96
2011
-12
18.3
63.
970.
341.
250.
842.
000.
602.
506.
9620
12-1
318
.67
4.16
0.34
1.25
0.84
2.00
0.72
3.50
6.96
2013
-14
18.6
74.
160.
341.
251.
002.
000.
723.
506.
9620
14-1
519
.21
4.16
0.34
1.25
1.00
2.00
0.72
3.50
6.96
2015
-16
19.5
84.
161.
001.
251.
002.
000.
723.
506.
96So
urce
: Ch
este
r Cou
nty
web
site
Dela
war
e Co
unty
Fisc
al
Year
Wes
t Che
ster
Ar
ea S
choo
l Di
stric
tDe
law
are
Coun
tyTo
wns
hip
of
Thor
nbur
y20
06-0
711
.02
4.45
0.00
2007
-08
11.8
74.
450.
0020
08-0
912
.94
4.83
0.00
2009
-10
14.1
64.
830.
0020
10-1
114
.25
5.18
0.00
2011
-12
14.2
25.
180.
0020
12-1
313
.78
5.30
0.00
2013
-14
13.6
25.
450.
0020
14-1
513
.65
5.60
0.00
2015
-16
13.9
15.
600.
00So
urce
: De
law
are
Coun
ty w
ebsit
e
WES
T CH
ESTE
R AR
EA S
CHO
OL
DIST
RICT
Prop
erty
Tax
Rat
es -
All D
irect
and
Ove
rlapp
ing
Gov
ernm
ents
(Mill
s)
Not
e:Ef
fect
ive
June
30,2
007,
Penn
sylv
ania
law
has
impo
sed
rest
rictio
nson
asc
hool
dist
rict's
abili
tyto
incr
ease
tax
rate
s.Th
eSt
ate
rest
ricts
incr
ease
sto
tax
rate
sto
nom
ore
than
apr
e-ca
lcul
ated
inde
x.A
dist
rictm
ayap
ply
fore
xcep
tions
with
the
Stat
eto
incr
ease
the
tax
rate
abov
eth
ein
dex.

- 79
-
2015
-16
2006
-07
Nam
eTo
wns
hip
Type
of P
rope
rty
Taxa
ble
Asse
ssed
Va
lue
Perc
ent o
f Di
stric
t's
Tota
l Val
ueRa
nk
Taxa
ble
Asse
ssed
Va
lue
Perc
ent o
f Di
stric
t's
Tota
l Val
ueRa
nk
Exto
n Sq
uare
, Inc
.W
est W
hite
land
Shop
ping
Mal
l78
,683
,200
0.94
%1
110,
168,
920
1.37
%1
QVC
Wes
t Gos
hen
Indu
st. B
ldg.
/TV
Shop
ping
35,6
96,5
300.
43%
248
,371
,130
0.60
%2
Mai
n St
reet
at E
xton
Wes
t Whi
tela
ndSh
oppi
ng C
ente
r28
,553
,560
0.34
%3
31,5
09,6
600.
39%
3TR
C Va
lley
Cree
k As
soc.
Wes
t Whi
tela
ndBu
sines
s Com
plex
28,5
00,0
000.
34%
4HC
RI P
A Pr
oper
ties
East
Gos
hen
Seni
or L
ivin
g Co
mpl
ex22
,849
,280
0.27
%5
Exto
n Cr
ossin
g Ap
artm
ents
Wes
t Whi
tela
ndAp
artm
ent C
ompl
ex21
,023
,480
0.25
%6
Whi
tela
nd In
vest
ors L
PW
est W
hite
land
Apar
tmen
t Com
plex
19,3
20,0
000.
23%
7Ha
nkin
Fam
ily L
TD P
rtsp
East
Gos
hen
Apar
tmen
t Com
plex
17,3
28,7
500.
21%
816
,180
,450
0.20
%9
Wes
ttow
n Ap
artm
ent
Wes
ttow
nAp
artm
ent C
ompl
ex16
,636
,690
0.20
%9
16,6
36,6
900.
21%
7Fe
rn H
ill L
LCW
est G
oshe
nM
edic
al C
ompl
ex16
,617
,370
0.20
%10
Exto
n W
hite
land
Dev
. Co.
Wes
t Whi
tela
ndSh
oppi
ng C
ente
r21
,460
,000
0.27
%4
Nat
iona
l Pro
pert
ies
Wes
t Whi
tela
ndAp
artm
ent C
ompl
ex21
,023
,480
0.26
%5
Whi
tela
nd A
ssoc
iate
sW
est W
hite
land
Shop
ping
Cen
ter
19,3
20,0
000.
24%
6Ha
nkin
Gro
upW
est W
hite
land
Apar
tmen
t Com
plex
16,4
53,1
800.
21%
8W
alm
art &
Sam
's Cl
ubW
est W
hite
land
Shop
ping
Cen
ter
13,9
29,2
000.
17%
10
Tota
l Ass
esse
d Va
lue-
-Ten
Lar
gest
Tax
paye
rs28
5,20
8,86
031
5,05
2,71
0
Tota
l Dis
tric
t Ass
esse
d Va
lue
8,34
5,77
5,81
68,
062,
042,
925
Sour
ce:
Dist
rict F
act B
ooks
WES
T CH
ESTE
R AR
EA S
CHO
OL
DIST
RICT
TEN
LAR
GES
T RE
AL P
ROPE
RTY
TAXP
AYER
S(U
naud
ited)

- 80 -
REAL ESTATE TAX COLLECTION AS A RATIO OF LEVY
CURRENT COLLECTIONFISCAL YEAR
ASSESSED VALUATION MILLS (2)
ADJUSTED LEVY AMOUNT (1), (3) PERCENT
2006-07 8,062,042,925 15.16 119,874,910 115,783,148 96.6%
2007-08 8,157,312,585 15.79 126,309,274 121,988,633 96.6%
2008-09 8,242,715,916 16.85 136,344,630 131,884,468 96.7%
2009-10 8,307,842,902 17.85 145,858,549 140,734,362 96.5%
2010-11 8,266,704,410 18.36 149,229,022 143,868,716 96.4%
2011-12 8,260,561,578 18.36 149,159,276 143,252,119 96.0%
2012-13 8,269,812,430 18.67 150,508,760 145,265,121 96.5%
2013-14 8,271,246,475 18.67 151,204,093 146,630,222 97.0%
2014-15 8,288,723,433 19.21 155,654,493 151,068,019 97.1%
2015-16 8,345,775,816 19.58 159,721,081 155,284,474 97.2%
Source: District Tax Records
(2) One mill of tax is equal to $1.00 for every $1,000 of assessed valuation of real estate property(3) Does not include delinquent or interim taxes collected.
WEST CHESTER AREA SCHOOL DISTRICT
(1) 2008-09 through 2010-11 Includes revenue received from State designated for school district property tax

[ THIS PAGE INTENTIONALLY LEFT BLANK ]

WEST CHESTER AREA SCHOOL DISTRICT
DEBT CAPACITY

- 81
-
2006
-07
2007
-08
2008
-09
2009
-10
2010
-11
2011
-12
2012
-13
2013
-14
2014
-15
2015
-16
Tota
l Gen
eral
Fun
d Re
venu
es*
175,
188,
902
184,
383,
429
189,
079,
944
196,
838,
806
200,
193,
855
200,
328,
038
205,
516,
382
206,
453,
328
213,
970,
536
220,
793,
385
Less
Req
uire
d De
duct
ions
if in
clud
ed in
tota
l
Rent
al a
nd S
inki
ng F
und
Reim
burs
emen
t1,
334,
225
1,
437,
374
1,
519,
538
1,
558,
427
1,
074,
696
1,
224,
820
1,
151,
153
1,
160,
377
1,
181,
706
-
Sale
of P
rope
rty
and
Non
-re
curr
ing
reve
nue
-
-
10,3
64
5,05
7
-
-
97
3
-
-
-
Fund
Tra
nsfe
r-
2,
086,
849
-
-
-
-
-
-
-
-
Net
Rev
enue
s1,
334,
225
3,
524,
223
1,
529,
902
1,
563,
484
1,
074,
696
1,
224,
820
1,
152,
126
1,
160,
377
1,
181,
706
-
Borr
owin
g Ba
se
173,
854,
677
180,
859,
206
187,
550,
042
195,
275,
323
199,
119,
159
199,
103,
218
204,
364,
256
205,
292,
951
212,
788,
830
220,
793,
385
Mul
tiplie
r22
5%22
5%22
5%22
5%22
5%22
5%22
5%22
5%22
5%22
5%
Tota
l Non
elec
tora
l Deb
t Lim
it39
1,17
3,02
3
40
6,93
3,21
4
42
1,98
7,59
5
43
9,36
9,47
6
44
8,01
8,10
8
44
7,98
2,24
1
45
9,81
9,57
6
46
1,90
9,13
9
47
8,77
4,86
7
49
6,78
5,11
6
325,
945,
000
315,
556,
000
304,
530,
000
302,
533,
000
291,
539,
000
279,
630,
000
287,
443,
000
285,
016,
000
271,
826,
000
266,
615,
000
Tota
l Deb
t Mar
gin
65,2
28,0
23
91
,377
,214
117,
457,
595
136,
836,
476
156,
479,
108
168,
352,
241
172,
376,
576
176,
893,
139
206,
948,
867
230,
170,
116
Ratio
of D
ebt L
imit
to D
ebt M
argi
n17
%22
%28
%31
%35
%38
%37
%38
%43
%46
%
Sour
ce:
Dist
rict A
nnua
l Fin
anci
al S
tate
men
ts P
DE 2
057
* In
clud
es o
ther
fina
ncin
g so
urce
s
Less
Am
ount
Deb
t App
licab
le to
Deb
t Li
mit
WES
T CH
ESTE
R AR
EA S
CHO
OL
DIST
RICT
COM
PUTA
TIO
N O
F N
ON
-ELE
CTO
RAL
DEBT
MAR
GIN

- 82
-
Em
mau
s S
erie
s AA
of
2010
S
erie
s 201
1 S
erie
s A o
f 20
12
Ser
ies A
A of
20
12
Ser
ies 2
013
Ser
ies 2
014
Ser
ies A
201
4 S
erie
s AA
2014
S
erie
s 201
5 S
erie
s A 2
015
Ser
ies A
A 20
15
Ser
ies 2
016
Ser
ies A
201
6 Fi
scal
Yea
rN
ote
2009
GO
RG
OR
GO
BG
OR
GO
RG
OB
GO
RG
OR
GO
RG
OB
GO
RG
OR
GO
RTo
tal
2016
-20
175,
000
2,51
0,00
0
52
5,00
0
-
11
5,00
0
765,
000
-
4,48
5,00
0
27
0,00
0
3,32
0,00
0
5,
000
66
5,00
0
1,49
0,00
0
5,
000
14
,160
,000
2017
-20
185,
000
1,79
5,00
0
54
0,00
0
-
7,
835,
000
795,
000
-
5,00
0
270,
000
1,
290,
000
5,00
0
680,
000
1,
725,
000
5,00
0
14,9
50,0
00
2018
-20
195,
000
3,16
0,00
0
54
5,00
0
-
8,
295,
000
815,
000
-
5,00
0
280,
000
-
5,00
0
710,
000
1,
810,
000
5,00
0
15,6
35,0
00
2019
-20
205,
000
3,29
0,00
0
56
0,00
0
-
7,
875,
000
825,
000
-
800,
000
29
0,00
0
-
5,
000
73
5,00
0
1,84
0,00
0
5,
000
16
,230
,000
2020
-20
2165
0,00
0
3,42
0,00
0
57
0,00
0
-
7,
360,
000
850,
000
-
1,08
5,00
0
29
5,00
0
-
5,
000
75
5,00
0
1,93
5,00
0
5,
000
16
,930
,000
2021
-20
263,
190,
000
4,41
0,00
0
3,
090,
000
20,0
00
7,
620,
000
-
10
,000
24,5
00,0
00
12
,670
,000
-
25
,000
770,
000
6,
400,
000
31,0
05,0
00
93
,710
,000
2026
-20
316,
110,
000
-
2,
075,
000
16,5
35,0
00
-
-
9,
340,
000
-
43
,205
,000
-
7,
610,
000
-
-
1,00
0,00
0
85
,875
,000
2031
-20
32-
-
-
4,44
5,00
0
-
-
2,
650,
000
-
-
-
2,
030,
000
-
-
-
9,
125,
000
Tota
l Prin
cipa
l9,
970,
000
18
,585
,000
7,
905,
000
21,0
00,0
00
39,1
00,0
00
4,05
0,00
0
12
,000
,000
30
,880
,000
57
,280
,000
4,
610,
000
9,69
0,00
0
4,
315,
000
15,2
00,0
00
32,0
30,0
00
266,
615,
000
Sour
ce:
Dist
rict D
ebt S
ervi
ce S
ched
ules
WES
T CH
ESTE
R AR
EA S
CHO
OL
DIS
TRIC
TG
ROSS
PRI
NCI
PAL
DEB
T O
UTS
TAN
DIN
G

- 83 -
Gross Debt Outstanding
Percentage Applicable to this
Governmental Unit
Net Share of Debt
Chester County Direct Debt
West Chester Area School District 266,615,000 100% 266,615,000
Overlapping Debt
Township of East Bradford - 100% - (1), (2)
Township of East Goshen 4,652,778 100% 4,652,778 (1), (2)
Township of Thornbury - 100% - (1), (2)
Township of West Goshen 6,252,000 100% 6,252,000 (1), (2)
Township of West Whiteland 12,790,000 100% 12,790,000 (1), (2)
Township of Westtown 13,380,000 100% 13,380,000 (1), (2)
Borough of West Chester 32,974,794 100% 32,974,794 (1), (3)
Chester County 550,121,272 20% 110,725,351 (1), (2), (4)
Total Direct and Overlapping Chester County Debt 447,389,923
Delaware County Direct Debt
West Chester Area School District 266,615,000 100% 266,615,000
Overlapping Debt
Township of Thornbury 188,164 100% 188,164 (1), (5)
Delaware County 327,081,000 1% 4,697,504 (1), (4), (5)
Total Direct and Overlapping Delaware County Debt 271,500,668
(1) As of December 31, 2015(2) Source: County of Chester(3) Source: West Chester Borough(4) Percentage of County Debt was derived by taking WCASD population as a Percentage of County(5)
WEST CHESTER AREA SCHOOL DISTRICTSCHEDULE OF DIRECT AND OVERLAPPING DEBT
Source: County of Delaware CAFR

- 84
-
Fisc
al Y
ear
Asse
ssed
Valu
e (1
)
Gro
ss B
onde
d De
bt (5
)
Debt
Se
rvic
e M
onie
s Av
aila
ble
Net
Bon
ded
Debt
Ratio
of N
et
Bond
ed D
ebt t
o As
sess
edPo
pula
tion
Net
Bo
nded
De
bt p
er
Capi
ta
Estim
ated
Pers
onal
Inco
me
(4)
Perc
ent o
f Pe
rson
al
Inco
me
2006
-07
8,06
2,04
2,92
5
316,
695,
000
-
316,
695,
000
3.
9%10
1,20
7
(3
) 3,
129
6,60
8,31
1,06
5
4.8%
2007
-08
8,15
7,31
2,58
5
307,
140,
000
-
307,
140,
000
3.
8%10
1,20
7
(3
) 3,
035
6,60
8,31
1,06
5
4.6%
2008
-09
8,24
2,71
5,91
6
296,
990,
000
-
296,
990,
000
3.
6%10
1,20
7
(3
) 2,
934
6,60
8,31
1,06
5
4.5%
2009
-10
8,30
7,84
2,90
2
285,
915,
000
-
285,
915,
000
3.
4%
1
08,4
41 (
2)
2,63
7
7,
080,
655,
095
4.
0%
2010
-11
8,26
6,70
4,41
0
275,
895,
000
-
275,
895,
000
3.
3%
1
08,4
41 (
2)
2,54
4
7,
080,
655,
095
3.
9%
2011
-12
8,26
0,56
1,57
8
265,
010,
000
-
265,
010,
000
3.
2%
1
08,4
41 (
2)
2,44
4
7,
080,
655,
095
3.
7%
2012
-13
8,26
9,81
2,43
0
273,
900,
000
-
273,
900,
000
3.
3%
1
08,4
41 (
2)
2,52
6
7,
080,
655,
095
3.
9%
2013
-14
8,27
1,24
6,47
5
272,
605,
000
-
272,
605,
000
3.
3%
1
08,4
41 (
2)
2,51
4
7,
080,
655,
095
3.
8%
2014
-15
8,28
8,72
3,43
3
260,
605,
000
-
260,
605,
000
3.
1%
1
08,4
41 (
2)
2,40
3
7,
080,
655,
095
3.
7%
2015
-16
8,34
5,77
5,81
6
256,
645,
000
-
256,
645,
000
3.
1%
1
08,4
41 (
2)
2,36
7
7,
080,
655,
095
3.
6%
(1)
Sour
ce:
Dist
rict F
act B
ook
(2)
Sour
ce:
2010
Cen
sus
(3)
Sour
ce:
2000
Cen
sus
(4)
Use
s 199
9 Ho
useh
old
Med
ian
Inco
me
from
Che
ster
Cou
nty
Plan
ning
Com
miss
ion
(5)
Sour
ce:
Dist
rict A
udit
Repo
rt
WES
T CH
ESTE
R AR
EA S
CHO
OL
DIS
TRIC
TRA
TIO
OF
NET
GEN
ERAL
DEB
T TO
ASS
ESSE
D VA
LUE
AND
DEBT
PER
CAP
ITA
(Una
udite
d)

[ THIS PAGE INTENTIONALLY LEFT BLANK ]

WEST CHESTER AREA SCHOOL DISTRICT
DEMOGRAPHIC AND ECONOMIC INFORMATION

- 85
-
Wes
t Che
ster
Are
aSc
hool
Dis
tric
tPo
pula
tion
(3)
Che
ster
Cou
nty
Popu
latio
n (1
)
Pen
nsyl
vani
a Po
pula
tion
(1)
Uni
ted
Stat
es
Popu
latio
n (1
)
1970
Not
Ava
ilabl
e27
8,31
111
,758
,458
203,
302,
031
1980
68,1
7031
6,66
011
,855
,687
226,
542,
199
1990
81,1
7237
6,39
611
,881
,643
248,
709,
873
2000
94,1
1443
3,50
112
,281
,054
281,
421,
906
2010
100,
413
498,
886
12,7
02,3
7930
8,74
5,53
820
11*
101,
738
503,
662
12,7
41,3
1031
1,58
2,56
420
12*
102,
075
506,
575
12,7
64,4
7531
3,87
3,68
520
13*
102,
782
509,
468
12,7
73,8
0131
6,12
8,83
920
14*
103,
324
512,
784
12,7
87,2
0931
8,85
7,05
620
15*
104,
062
515,
939
12,8
02,5
0332
1,41
8,82
0
*As
est
imat
ed b
y U
S Ce
nsus
Bur
eau
Wes
t Che
ster
Are
aSc
hool
Dis
tric
tM
arke
t Val
ue
Wes
t Che
ster
Are
aSc
hool
Dis
tric
tAd
just
ed P
erso
nal I
ncom
ePe
nnsy
lvan
ia
Mar
ket V
alue
Penn
sylv
ania
Ad
just
ed P
erso
nal I
ncom
e (2
)
2006
$9,5
90,7
69,2
00$3
,884
,233
,497
$605
,480
,139
,100
$249
,837
,190
,420
2007
$9,6
97,0
33,7
00$4
,643
,670
,427
$619
,322
,425
,100
$281
,225
,923
,639
2008
$11,
064,
906,
900
$4,4
51,0
51,8
40$6
91,1
49,9
96,7
00$2
84,9
72,2
35,5
5720
09$1
1,15
1,77
6,00
0 $4
,217
,565
,767
$699
,875
,265
,754
$269
,983
,839
,121
2010
$12,
025,
290,
349
$4,5
99,6
71,7
65$7
53,8
47,4
57,9
18$2
85,0
34,2
94,2
2620
11$1
1,99
3,39
4,60
5 $4
,245
,577
,671
$756
,045
,821
,766
$2
95,3
45,1
08,4
0620
12$1
2,53
6,54
0,44
0 $4
,698
,094
,232
$7
76,7
36,8
93,3
11
$312
,219
,585
,188
20
13$1
2,54
6,94
1,35
5 $4
,502
,829
,867
$7
81,3
62,1
58,7
48
$311
,032
,689
,690
20
14$1
2,78
6,39
8,93
8 N
ot A
vaila
ble
$801
,633
,782
,130
N
ot A
vaila
ble
2015
$12,
891,
822,
543
Not
Ava
ilabl
e$8
10,8
05,7
01,7
62
Not
Ava
ilabl
e
(1)
Sour
ce:
US
Cens
us (2
) So
urce
: PA
Dep
t of E
duca
tion
(3)
Ches
ter C
ount
y Pl
anni
ng C
omm
issio
nWES
T CH
ESTE
R AR
EA S
CHO
OL
DIST
RICT
Tren
ds in
Pop
ulat
ion,
Mar
ket V
alue
and
Per
sona
l Inc
ome

- 86 -
Household IncomeTotal
households 1999
less than $50,000
$50,000 to $100,000
$100,000 or more
Median Household
Income, 1999 (1)
Chester County 158,025 44,509 46,175 67,341 65,295 West Chester Area (2) 37,583 10,777 11,783 15,023
Labor Force and EmploymentPopulation 16
years and over, 2010 Total Employed Unemployed (1)
PennsylvaniaChester County 378,828 261,929 249,690 12,239
West Chester Area (2) 74,680 53,141 51,129 2,012
Housing ValueTotal Owner
Occupied Units, 2010
Less than $150,000
$150,000 to $300,000
$300,001 to $400,000
$400,001 to $500,000
$500,001 or more (1)
Chester County 106,254 11,071 49,959 26,969 14,268 3,987 West Chester Area (2) 26,707 1,189 7,645 6,640 5,140 6,093
(1) Source: U S Census Bureau American Community Survey 2005-2009(2) West Chester Area is comprised of all Chester County West Chester Area municipalities
6.5%N/A
Housing Value
West Chester Area Median Home Value in 2000 = $182,500
WEST CHESTER AREA SCHOOL DISTRICTKey Economic and Housing Indices
Household Income, 2010
Civilian Labor Force, 2010
Unemployment Rate, 20108.5%

- 87
-
Nam
ePr
oduc
t or S
ervi
ce
2015
-16
Appr
oxim
ate
Empl
oym
ent
Rank
% o
f To
tal
2006
-07
Appr
oxim
ate
Empl
oym
ent
Rank
% o
f To
tal
QVC
Net
wor
k, In
c.Ho
me
Shop
ping
Net
wor
k2,
784
15.
4%1,
443
52.
8%
Wes
t Che
ster
Uni
vers
ityEd
ucat
ion
2,57
12
5.0%
1,59
14
3.1%
Penn
Med
icin
e Ch
este
r Cou
nty
Hosp
ital
Heal
th C
are
Serv
ices
2,19
63
4.3%
2,07
52
4.1%
Ches
ter C
ount
yCo
unty
Gov
ernm
ent
1,77
24
3.5%
2,58
91
5.1%
Wes
t Che
ster
Are
a Sc
hool
Dist
rict
Educ
atio
n1,
556
53.
0%1,
431
62.
8%
Uni
ted
Parc
el S
ervi
ce, I
nc.
Deliv
ery
Serv
ices
1,30
26
2.5%
1,23
29
2.4%
John
son
& Jo
hnso
n Se
rvic
es In
c.Dr
ug R
esea
rch
and
Test
ing
1,25
67
2.5%
Gia
nt F
ood
Stor
es L
LCG
roce
ry97
68
1.9%
Com
cast
Cab
le C
omm
unic
atio
nsTe
leco
mm
unic
atio
n92
79
1.8%
Com
mun
icat
ions
Tes
t Des
ign,
Inc.
Com
mun
icat
ion
Engi
neer
ing
653
101.
3%
QVC
Pub
lishi
ng, I
nc.
Div.
QVC
Net
wor
k2,
048
34.
0%
Peop
le 2
.0, I
nc.
Staf
fing
Agen
cies
1,31
97
2.6%
Ther
akos
Heal
th C
are
Prod
ucts
1,28
58
2.5%
Synt
hes S
pine
Co.
LP
Med
ical
Tec
hnol
ogy
1,23
110
2.4%
Tota
l15
,993
16,2
44
Not
e: %
of T
otal
Em
ploy
men
t use
s 201
0 To
tal W
est C
hest
er C
omm
unity
em
ploy
ed p
opul
atio
n of
51,
129
Sour
ce:
Dist
rict E
IT C
olle
ctio
n re
cord
s, D
istric
t Fac
t Boo
k Ch
este
r Cou
nty
Plan
ning
Com
miss
ion
WES
T CH
ESTE
R AR
EA S
CHO
OL
DIST
RICT
LARG
EST
EMPL
OYE
RS W
ITHI
N T
HE S
CHO
OL
DIST
RICT
Una
udite
d

WEST CHESTER AREA SCHOOL DISTRICT
OPERATING INFORMATION

- 88 -
Fiscal YearNumber of
School Staff *Number ofStudents
RatioStudents/Staff
2006-07 974.53 11,789 12.1
2007-08 1,006.50 11,667 11.6
2008-09 999.20 11,684 11.7
2009-10 996.78 11,810 11.8
2010-11 987.70 11,825 12.0
2011-12 976.10 11,822 12.1
2012-13 972.40 11,688 12.0
2013-14 971.80 11,659 12.0
2014-15 971.60 11,624 12.0
2015-16 971.30 11,483 11.8
* Includes: teachers, librarians, guidance counselors, nurses, supervisors, school administratorsand social workers.
Source: District Fact Book
WEST CHESTER AREA SCHOOL DISTRICTSTAFFING RATIOS FOR PROFESSIONAL STAFF

- 89
-
DIS
TRIC
T FA
CILI
TIES
Orig
inal
Site
Sept
. 30th
Cons
truc
tion
Addi
tion
and/
orAr
eaBu
ildin
g20
15Bu
ildin
gD
ate
Reno
vatio
n D
ate
Gra
des
(Acr
es)
Sq. F
t.En
rollm
ent
B. R
ustin
Hig
h Sc
hool
2003
-06
-9-
1212
3.20
283,
000
1,25
8
East
Hig
h Sc
hool
1973
1976
/92/
93/0
49-
1262
.60
314,
453
1,27
2
East
/Fug
ett A
thle
tic F
ield
s20
04-
-43
.35
----
-
Hend
erso
n Hi
gh S
choo
l19
5119
56/6
4/76
/94/
98/0
49-
1230
.56
287,
351
1,22
8
Hend
erso
n-N
orth
Cam
pus A
thle
tics
2006
--
28.4
0-
----
E. N
. Pei
rce
Mid
dle
Scho
ol19
6319
98/0
1/03
6-8
26.7
013
6,25
091
2
G. A
. Ste
tson
Mid
dle
Scho
ol19
5919
61/9
8/03
/07
6-8
38.4
013
4,85
798
6
J. R.
Fug
ett M
iddl
e Sc
hool
1969
2009
6-8
*16
3,34
088
4
East
Bra
dfor
d El
emen
tary
1958
1966
/70/
89/2
013
K-5
18.2
058
,367
404
East
Gos
hen
Elem
enta
ry19
5519
60/6
4/67
/95/
01K-
520
.80
67,8
3241
2
Exto
n El
emen
tary
1940
1953
/57/
91/9
2/93
/00
K-5
13.1
066
,265
465
Fern
Hill
Ele
men
tary
1955
1960
/89/
2014
K-5
20.0
064
,555
510
Gle
n Ac
res E
lem
enta
ry19
6619
97K-
511
.70
59,9
3150
0
Hills
dale
Ele
men
tary
1976
2007
K-5
20.9
070
,631
554
Mar
y C.
How
se E
lem
enta
ry19
6219
65/9
7K-
515
.24
65,2
8751
8
Penn
Woo
d El
emen
tary
1966
1970
/89/
01/2
012
K-5
18.6
064
,350
543
Sara
h W
. Sta
rkw
eath
er E
lem
enta
ry19
9119
98K-
537
.90
75,0
9458
0
Wes
ttow
n-Th
ornb
ury
Elem
enta
ry19
5419
56/8
9/20
12K-
511
.70
55,5
5645
7
Faci
litie
s & O
pera
tions
Cen
ter
1999
--
3.20
24,5
88---
-
Spel
lman
Adm
inist
ratio
n19
2419
52/5
5/77
/99
Adm
in17
.60
42,8
45---
-
56
2.15
2,03
4,55
211
,483
* F
uget
t acr
eage
incl
uded
in E
ast H
S sit
e ar
ea
WES
T CH
ESTE
R AR
EA S
CHO
OL
DIS
TRIC
T

- 90
-
Func
tions
Ele
men
tary
M
iddl
e H
igh
Oth
erTo
tal
1100
Reg
ular
307
.90
168
.00
224
.00
17.5
0
7
17.4
0
1200
Spe
cial
5
8.80
28.
20
3
5.10
14
3.20
2
65.3
0
1300
Voc
atio
nal
1
4.20
13.
20
2
7.40
1400
Oth
er In
stru
ctio
nal
-
2100
Sup
port
Ser
vice
s- S
tude
nts
19.6
0
15
.00
34.0
0
12
.00
8
0.60
2200
Sup
port
Ser
vice
s- In
stru
ctio
nal
15.0
0
6.
00
7.
10
12
.45
4
0.55
2300
Sup
port
Ser
vice
s- A
dmin
istra
tion
25.0
0
15
.00
21.0
0
10
.00
7
1.00
2400
Sup
port
Ser
vice
s- P
upil
Heal
th
10.0
0
3.
00
6.
00
7.
00
26.
00
2500
Sup
port
Ser
vice
s- B
usin
ess O
ffice
14
.00
1
4.00
2600
Ope
ratin
g &
Mai
nten
ance
of P
lant
Ser
vice
s 34
.00
18.0
0
33
.00
42.4
0
1
27.4
0
2700
Stu
dent
Tra
nspo
rtat
ion
Serv
ices
3.
50
3.
50
2800
Sup
port
Ser
vice
s- C
entr
al
23.0
5
23.
05
3000
Ope
ratio
n of
Non
-Inst
ruct
iona
l Ser
vice
s9.
00
9.
00
Tota
l 201
5-16
FTE
s47
0.30
26
7.40
38
2.40
28
5.10
1,
405.
20
Sour
ce:
Dist
rict P
erso
nnel
Bud
get D
ocum
enta
tion
WES
T CH
ESTE
R AR
EA S
CHO
OL
DIST
RICT
SCHO
OL
DIST
RICT
EM
PLO
YEES
BY
FUN
CTIO
NFo
r the
201
5-16
Fis
cal Y
ear

- 91
-
Scho
ol Y
ear:
2006
-07
2007
-08
2008
-09
2009
-10
2010
-11
2011
-12
2012
-13
2013
-14
2014
-15
2015
-16
Kind
erga
rten
At S
ept.
3066
057
862
866
061
163
061
655
758
452
5
(hal
f-tim
e)En
d of
Yea
r66
858
462
065
860
964
660
957
160
454
6
**Ki
nder
gart
en73
7775
7474
7676
9079
90
(full-
time)
7069
7774
7472
7675
5176
Grad
es 1
-5At
Sep
t. 30
4,38
84,
316
4,25
84,
290
4,35
14,
379
4,37
74,
431
4,36
34,
328
End
of Y
ear
4,38
54,
295
4,23
04,
277
4,35
14,
385
4,32
74,
434
4,33
94,
321
Grad
es 6
-8At
Sep
t. 30
2,79
32,
821
2,80
32,
801
2,81
92,
790
2,76
32,
687
2,79
02,
782
End
of Y
ear
2,78
82,
782
2,76
22,
800
2,81
22,
777
2,72
82,
670
2,76
72,
780
Grad
es 9
-12
At S
ept.
303,
875
3,87
53,
920
3,98
53,
970
3,94
73,
855
3,90
13,
808
3,75
8
End
of Y
ear
3,79
53,
795
3,84
53,
908
3,89
43,
896
3,81
53,
853
3,76
43,
751
TOTA
L-Se
pt.3
011
,789
11,6
6711
,684
11,8
1011
,825
11,8
2211
,687
11,6
6611
,624
11,4
83
TOTA
L-En
d of
Yea
r11
,706
11,5
2511
,534
11,7
1711
,740
11,7
7611
,555
11,6
0311
,525
11,4
74
Incr
ease
/Dec
reas
eat
Sep
tem
ber 3
067
(122
)17
126
15(3
)(1
35)
(21)
(42)
(141
)
**St
uden
ts a
re p
ulle
d fr
om th
e ha
lf-tim
e K
& p
lace
d in
full-
time
K
WES
T CH
ESTE
R AR
EA S
CHO
OL
DIST
RICT
STU
DEN
T EN
ROLL
MEN
T SU
MM
ARY

WEST CHESTER AREA SCHOOL DISTRICTSTUDENT MARKET SHARE ANALYSIS
- 92 -
2006-07 2007-08 2008-09 2009-10 2010-11 2011-12 2012-13 2013-14 2014-15 2015-16Total Out-of-District 5,035 4,945 4,948 4,772 4,371 4,334 4,322 4,073 4,034 4,164 % of Total 29.9% 29.8% 29.7% 28.8% 27.0% 26.8% 27.0% 25.9% 25.8% 26.6%Total In-District 11,789 11,667 11,684 11,810 11,825 11,822 11,687 11,666 11,624 11,483 % of Total 70.1% 70.2% 70.3% 71.2% 73.0% 73.2% 73.0% 74.1% 74.2% 73.4%
Total Students 16,824 16,612 16,632 16,582 16,196 16,156 16,009 15,739 15,658 15,647 District Share Change Year-to-Year 0.70% 0.23% 0.03% 1.38% 2.51% 0.22% -0.23% 1.53% 0.16% -1.14%
WCASD 11,789 11,667 11,684 11,810 11,825 11,822 11,687 11,666 11,624 11,483 Elementary 5,121 4,971 4,961 5,024 5,036 5,085 5,069 5,078 5,026 4,943 % of Total 30.4% 29.9% 29.8% 30.3% 31.1% 31.5% 31.7% 32.3% 32.1% 31.6% Secondary 6,668 6,696 6,723 6,786 6,789 6,737 6,618 6,588 6,598 6,540 % of Total 39.6% 40.3% 40.4% 40.9% 41.9% 41.7% 41.3% 41.9% 42.1% 41.8%
Out-Of-District 5,035 4,945 4,948 4,772 4,371 4,334 4,322 4,073 4,034 4,164 Elementary 3,733 3,707 3,705 3,542 3,320 3,299 3,268 3,040 3,040 3,131 Private 186 160 185 196 171 185 188 181 227 229 % of Total 1.1% 1.0% 1.1% 1.2% 1.1% 1.1% 1.2% 1.2% 1.4% 1.5% Religious - Catholic 2,391 2,321 2,241 2,125 1,973 1,850 1,805 1,682 1,618 1,615 % of Total 14.2% 14.0% 13.5% 12.8% 12.2% 11.5% 11.3% 10.7% 10.3% 10.3% Religious - Other 448 446 448 394 325 375 336 248 270 329 % of Total 2.7% 2.7% 2.7% 2.4% 2.0% 2.3% 2.1% 1.6% 1.7% 2.1% Charter 418 501 543 545 583 610 656 670 706 717 % of Total 2.5% 3.0% 3.3% 3.3% 3.6% 3.8% 4.1% 4.3% 4.5% 4.6% Special Education 115 103 100 117 103 114 107 91 69 78 % of Total 0.7% 0.6% 0.6% 0.7% 0.6% 0.7% 0.7% 0.6% 0.4% 0.5% Home School 175 176 188 165 165 165 176 168 150 163 % of Total 1.0% 1.1% 1.1% 1.0% 1.0% 1.0% 1.1% 1.1% 1.0% 1.0% Secondary 1,302 1,238 1,243 1,230 1,051 1,035 1,054 1,033 994 1,033 Private 66 58 54 49 33 39 46 35 40 38 % of Total 0.4% 0.3% 0.3% 0.3% 0.2% 0.2% 0.3% 0.2% 0.3% 0.2% Religious - Catholic 1,014 970 947 939 814 803 819 762 725 812 % of Total 6.0% 5.8% 5.7% 5.7% 5.0% 5.0% 5.1% 4.8% 4.6% 5.2% Religious - Other 153 139 148 142 140 123 98 84 93 82 % of Total 0.9% 0.8% 0.9% 0.9% 0.9% 0.8% 0.6% 0.5% 0.6% 0.5% CCIU 16 23 32 37 23 31 32 90 73 66 % of Total 0.1% 0.1% 0.2% 0.2% 0.1% 0.2% 0.2% 0.6% 0.5% 0.4% Alternative 53 48 62 63 41 39 59 62 63 35 % of Total 0.3% 0.3% 0.4% 0.4% 0.3% 0.2% 0.4% 0.4% 0.4% 0.2% Home School - - - - - - - - - -
TOTAL NO. STUDENTS 16,824 16,612 16,632 16,582 16,196 16,156 16,009 15,739 15,658 15,647 Elementary 8,854 8,678 8,666 8,566 8,356 8,384 8,337 8,118 8,066 8,074 Secondary 7,970 7,934 7,966 8,016 7,840 7,772 7,672 7,621 7,592 7,573
TOTAL NO OF BIRTHS (AGE 5) 1,264 1,236 1,191 1,248 1,234 1,150 1,155 1,123 1,177 1,035 TOTAL NO. STUDENTS 16,824 16,612 16,632 16,582 16,196 16,156 16,009 15,739 15,658 15,647 Elementary 8,854 8,678 8,666 8,566 8,356 8,384 8,337 8,118 8,066 8,074 Secondary 7,970 7,934 7,966 8,016 7,840 7,772 7,672 7,621 7,592 7,573
Facility Breakdown% Public 70.1% 70.2% 70.3% 71.2% 73.0% 73.2% 73.0% 74.1% 74.2% 73.4%Schools Facilities Not WCASD% Private 1.5% 1.3% 1.4% 1.5% 1.3% 1.4% 1.5% 1.4% 1.7% 1.7%% Religious 23.8% 23.3% 22.8% 21.7% 20.1% 19.5% 19.1% 17.6% 17.3% 18.1%% Charter 2.5% 3.0% 3.3% 3.3% 3.6% 3.8% 4.1% 4.3% 4.5% 4.6%% Special Education 0.7% 0.6% 0.6% 0.7% 0.6% 0.7% 0.7% 0.6% 0.4% 0.5%% CCIU 0.1% 0.1% 0.2% 0.2% 0.1% 0.2% 0.2% 0.6% 0.5% 0.4%% Alternative 0.3% 0.3% 0.4% 0.4% 0.3% 0.2% 0.4% 0.4% 0.4% 0.2%% Home School 1.0% 1.1% 1.1% 1.0% 1.0% 1.0% 1.1% 1.1% 1.0% 1.0%Total 100.0% 100.0% 100.0% 100.0% 100.0% 100.0% 100.0% 100.0% 100.0% 100.0%

WEST CHESTER AREA SCHOOL DISTRICT
SINGLE AUDIT

-93-
INDEPENDENT AUDITOR’S
REPORT ON INTERNAL CONTROL
OVER FINANCIAL REPORTING AND ON
COMPLIANCE AND OTHER MATTERS BASED
ON AN AUDIT OF FINANCIAL STATEMENTS
PERFORMED IN ACCORDANCE WITH
GOVERNMENT AUDITING STANDARDS
December 6, 2016
Board of School Directors
West Chester Area School District
West Chester, Pennsylvania
We have audited, in accordance with the auditing standards generally accepted in the United States
of America and the standards applicable to financial audits contained in Government Auditing
Standards issued by the Comptroller General of the United States, the financial statements of the
governmental activities, the business-type activities, each major fund, and the aggregate remaining
fund information of the West Chester Area School District (“the District”) as of and for the year ended
June 30, 2016, and the related notes to the financial statements, which collectively comprise the
District’s basic financial statements, and have issued our report thereon dated December 6, 2016.
Internal Control Over Financial Reporting
In planning and performing our audit of the financial statements, we considered the District’s internal
control over financial reporting (“internal control”) to determine the audit procedures that are
appropriate in the circumstances for the purpose of expressing our opinions on the financial
statements, but not for the purpose of expressing an opinion on the effectiveness of the District’s
internal control. Accordingly, we do not express an opinion on the effectiveness of the District’s
internal control.
A deficiency in internal control exists when the design or operation of a control does not allow
management or employees, in the normal course of performing their assigned functions, to prevent,
or detect and correct, misstatements on a timely basis. A material weakness is a deficiency, or a
combination of deficiencies, in internal control, such that there is a reasonable possibility that a
material misstatement of the entity’s financial statements will not be prevented, or detected and
corrected on a timely basis. A significant deficiency is a deficiency, or a combination of deficiencies,
in internal control that is less severe than a material weakness, yet important enough to merit attention
by those charged with governance.
Our consideration of internal control was for the limited purpose described in the first paragraph of this
section and was not designed to identify all deficiencies in internal control that might be material
weaknesses or significant deficiencies. Given these limitations, during our audit we did not identify
any deficiencies in internal control that we consider to be material weaknesses. However, material
weaknesses may exist that have not been identified.
Barbacane, Thornton & Company LLP
200 Springer Building 3411 Silverside Road
Wilmington, Delaware 19810
T 302.478.8940
F 302.468.4001
www.btcpa.com

-94-
Board of School Directors
West Chester Area School District
Compliance and Other Matters
As part of obtaining reasonable assurance about whether the District’s financial statements are free
from material misstatement, we performed tests of its compliance with certain provisions of laws,
regulations, contracts, and grant agreements, noncompliance with which could have a direct and
material effect on the determination of financial statement amounts. However, providing an opinion
on compliance with those provisions was not an objective of our audit, and accordingly, we do not
express such an opinion. The results of our tests disclosed no instances of noncompliance or other
matters that are required to be reported under Government Auditing Standards.
Purpose of this Report
The purpose of this report is solely to describe the scope of our testing of internal control and
compliance and the results of that testing, and not to provide an opinion on the effectiveness of the
entity’s internal control or on compliance. This report is an integral part of an audit performed in
accordance with Government Auditing Standards in considering the entity’s internal control and
compliance. Accordingly, this communication is not suitable for any other purpose.
BARBACANE, THORNTON & COMPANY LLP

-95-
INDEPENDENT AUDITOR’S
REPORT ON COMPLIANCE FOR EACH
MAJOR PROGRAM AND ON INTERNAL CONTROL
OVER COMPLIANCE REQUIRED BY
THE UNIFORM GUIDANCE
December 6, 2016
Board of School Directors
West Chester Area School District
West Chester, Pennsylvania
Report on Compliance for the Major Federal Program
We have audited the West Chester Area School District’s (“the District”) compliance with the types of
compliance requirements described in the OMB Compliance Supplement that could have a direct
and material effect on the District’s major federal program for the year ended June 30, 2016. The
District’s major federal program is identified in the summary of auditor’s results section of the
accompanying schedule of findings and recommendations.
Management’s Responsibility
Management is responsible for compliance with federal statutes, regulations, and the terms and
conditions of its federal awards applicable to its federal programs.
Auditor’s Responsibility
Our responsibility is to express an opinion on compliance for the District’s major federal program
based on our audit of the types of compliance requirements referred to above. We conducted our
audit of compliance in accordance with auditing standards generally accepted in the United States
of America; the standards applicable to financial audits contained in Government Auditing
Standards, issued by the Comptroller General of the United States; and the audit requirements of Title
2 U.S. Code of Federal Regulations Part 200, Uniform Administrative Requirements, Cost Principles,
and Audit Requirements for Federal Awards (“Uniform Guidance”). Those standards and the Uniform
Guidance require that we plan and perform the audit to obtain reasonable assurance about whether
noncompliance with the types of compliance requirements referred to above that could have a
direct and material effect on a major federal program occurred. An audit includes examining, on a
test basis, evidence about the District’s compliance with those requirements and performing such
other procedures as we considered necessary in the circumstances.
We believe that our audit provides a reasonable basis for our opinion on compliance for each major
federal program. However, our audit does not provide a legal determination of the District’s
compliance.
Barbacane, Thornton & Company LLP
200 Springer Building
3411 Silverside Road
Wilmington, Delaware 19810
T 302.478.8940
F 302.468.4001 www.btcpa.com

-96-
Board of School Directors
West Chester Area School District
Opinion on the Major Federal Program
In our opinion, the District complied, in all material respects, with the types of compliance
requirements referred to above that could have a direct and material effect on its major federal
program for the year ended June 30, 2016.
Report on Internal Control Over Compliance
Management of the District is responsible for establishing and maintaining effective internal control
over compliance with the types of compliance requirements referred to above. In planning and
performing our audit of compliance, we considered the District’s internal control over compliance with
the types of requirements that could have a direct and material effect on its major federal program to
determine the auditing procedures that are appropriate in the circumstances for the purpose of
expressing an opinion on compliance for each major federal program and to test and report on
internal control over compliance in accordance with the Uniform Guidance, but not for the purpose of
expressing an opinion on the effectiveness of internal control over compliance. Accordingly, we do
not express an opinion on the effectiveness of the District’s internal control over compliance.
A deficiency in internal control over compliance exists when the design or operation of a control over
compliance does not allow management or employees, in the normal course of performing their
assigned functions, to prevent, or detect and correct, noncompliance with a type of compliance
requirement of a federal program on a timely basis. A material weakness in internal control over
compliance is a deficiency, or combination of deficiencies, in internal control over compliance, such
that there is a reasonable possibility that material noncompliance with a type of compliance
requirement of a federal program will not be prevented, or detected and corrected, on a timely
basis. A significant deficiency in internal control over compliance is a deficiency, or a combination
of deficiencies, in internal control over compliance with a type of compliance requirement of a
federal program that is less severe than a material weakness in internal control over compliance, yet
important enough to merit attention by those charged with governance.
Our consideration of internal control over compliance was for the limited purpose described in the first
paragraph of this section and was not designed to identify all deficiencies in internal control over
compliance that might be material weaknesses or significant deficiencies. We did not identify any
deficiencies in internal control over compliance that we consider to be material weaknesses.
However, material weaknesses may exist that have not been identified.
The purpose of this report on internal control over compliance is solely to describe the scope of our
testing of internal control over compliance and the results of that testing based on the requirements of
the Uniform Guidance. Accordingly, this report is not suitable for any other purpose.
BARBACANE, THORNTON & COMPANY LLP

- 97 -
WEST CHESTER AREA SCHOOL DISTRICT
SCHEDULE OF FINDINGS AND RECOMMENDATIONS
PART A - SUMMARY OF AUDITOR’S RESULTS
Financial Statements
Type of auditor’s report issued [unmodified, qualified, adverse, or disclaimer]:
Unmodified
Internal control over financial reporting:
Material weakness(es) identified? Yes X No
Significant deficiency(ies) identified? Yes X None reported
Noncompliance material to financial
statements noted? Yes X No
Federal Awards
Internal control over major programs:
Material weakness(es) identified? Yes X No
Significant deficiency(ies) identified? Yes X None reported
Type of auditor’s report issued on compliance for major programs [unmodified, qualified, adverse, or
disclaimer]:
Unmodified
Any audit findings disclosed that are
required to be reported in accordance
with the Uniform Guidance? Yes X No
Identification of major programs:
CFDA Numbers Name of Federal Program or Cluster
10.553, 10.555 Child Nutrition Cluster
Dollar threshold used to distinguish between
Type A and Type B programs: $ 750,000
Auditee qualified as low-risk auditee? X Yes No
- 98 -
WEST CHESTER AREA SCHOOL DISTRICT
SCHEDULE OF FINDINGS AND RECOMMENDATIONS
PART B - FINDINGS RELATED TO FINANCIAL STATEMENTS
STATUS OF PRIOR YEAR FINDINGS
None.
CURRENT YEAR FINDINGS AND RECOMMENDATIONS
None.
PART C - FINDINGS RELATED TO FEDERAL AWARDS
STATUS OF PRIOR YEAR FINDINGS
None.
CURRENT YEAR FINDINGS AND RECOMMENDATIONS
None.

- 99
-
Pas
s-A
ccru
edA
ccru
edP
asse
dF
eder
alT
hrou
ghP
rogr
amT
otal
(Une
arne
d)(U
near
ned)
Thr
ough
Fed
eral
Gra
ntor
/Pas
s-th
roug
hS
ourc
eC
FD
AG
rant
or's
Gra
nt P
erio
dor
Aw
ard
Rec
eive
dR
even
ueR
even
ueR
even
ueto
Gra
ntor
/Pro
gram
or
Clu
ster
Titl
eC
ode
Num
ber
Num
ber
Beg
inni
ng -
End
ing
Am
ount
for
Yea
r07
/01/
15R
ecog
nize
dE
xpen
ditu
res
06/3
0/16
Sub
reci
pien
tsU
.S. D
epar
tmen
t o
f E
du
cati
on
Pas
sed
thro
ugh
PA
Dep
artm
ent o
f Edu
catio
n
Titl
e I G
rant
s to
Loc
al E
duca
tion
Age
ncie
sI
84.0
1001
3-16
0470
07/0
1/15
-09/
30/1
682
8,86
7$
77
3,85
4$
-$
82
8,86
7$
828,
867
$
55
,013
$
-
$
Titl
e I G
rant
s to
Loc
al E
duca
tion
Age
ncie
sI
84.0
1001
3-15
0470
07/0
3/14
-09/
30/1
581
8,06
4
53
,808
53,8
08
-
-
-
-
T
otal
CF
DA
#84
.010
827,
662
53
,808
82
8,86
7
828,
867
55
,013
-
Eng
lish
Lang
uage
Acq
uisi
tion
Gra
nts
I84
.365
010-
1604
7007
/01/
15-0
9/30
/16
106,
810
71,2
07
-
62,5
49
62
,549
(8,6
58)
-
Eng
lish
Lang
uage
Acq
uisi
tion
Gra
nts
I84
.365
010-
1504
7007
/01/
14-0
9/30
/15
107,
785
21,5
57
(4
,504
)
26,0
61
26
,061
-
-
T
otal
CF
DA
#84
.365
92,7
64
(4
,504
)
88,6
10
88
,610
(8,6
58)
-
Impr
ovin
g T
each
er Q
ualit
y S
tate
Gra
nts
I84
.367
020-
1604
7007
/01/
15-0
9/30
/16
276,
481
184,
765
-
112,
392
11
2,39
2
(72,
373)
-
Im
prov
ing
Tea
cher
Qua
lity
Sta
te G
rant
sI
84.3
6702
0-15
0470
07/0
3/14
-09/
30/1
527
7,59
6
20
3,43
5
(58,
122)
261,
557
26
1,55
7
-
-
Impr
ovin
g T
each
er Q
ualit
y S
tate
Gra
nts
I84
.367
020-
1404
7007
/01/
13-0
9/30
/14
276,
775
18,4
36
18
,436
-
-
-
-
Tot
al C
FD
A #
84.3
6740
6,63
6
(39,
686)
373,
949
37
3,94
9
(72,
373)
-
Pas
sed
thro
ugh
Inte
rmed
iate
Uni
t 1ID
EA
Spe
cial
Edu
catio
n -
Gra
nts
to S
tate
sI
84.0
2706
2-16
-0-0
3209
/30/
15-0
9/29
/16
10,0
00
-
-
6,
023
6,02
3
6,
023
-
Pas
sed
thro
ugh
Che
ster
Cou
nty
I.U.
IDE
A S
peci
al E
duca
tion
- G
rant
s to
Sta
tes
I84
.027
62-1
5000
2407
/01/
15-0
9/30
/16
1,18
9,21
5
792,
810
-
1,18
9,21
5
1,
189,
215
396,
405
-
ID
EA
Spe
cial
Edu
catio
n -
Gra
nts
to S
tate
sI
84.0
2762
-140
0024
07/0
1/14
-09/
30/1
51,
208,
173
52
6,07
4
526,
074
-
-
-
-
T
otal
CF
DA
#84
.027
1,31
8,88
4
52
6,07
4
1,
195,
238
1,19
5,23
8
40
2,42
8
-
IDE
A S
peci
al E
duca
tion
- P
resc
hool
Gra
nts
I84
.173
131-
1500
24B
07/0
1/15
-09/
30/1
64,
502
-
-
4,
502
4,50
2
4,
502
-
TO
TA
L U
.S. D
EP
AR
TM
EN
T O
F E
DU
CA
TIO
N2,
645,
946
535,
692
2,49
1,16
6
2,
491,
166
380,
912
-
U.S
. Dep
artm
ent
of
Hea
lth
an
d H
um
anS
ervi
ces
Pas
sed
thro
ugh
PA
Dep
t of P
ublic
Wel
fare
Titl
e X
IX M
edic
al A
ssis
tanc
e P
rogr
amI
93.7
78N
/A07
/01/
15-0
6/30
/16
25,1
87
25,1
87
-
25,1
87
25
,187
-
-
TO
TA
L U
.S. D
EP
AR
TM
EN
T O
F H
EA
LT
H A
ND
25,1
87
-
25,1
87
25
,187
-
-
HU
MA
N S
ER
VIC
ES
Con
tinue
d on
nex
t pag
e.
WE
ST
CH
ES
TE
R A
RE
A S
CH
OO
L D
IST
RIC
TS
CH
ED
UL
E O
F E
XP
EN
DIT
UR
ES
OF
FE
DE
RA
L A
WA
RD
SF
OR
TH
E Y
EA
R E
ND
ED
JU
NE
30,
201
6

- 100
-
Pas
s-A
ccru
edA
ccru
edP
asse
dF
eder
alT
hrou
ghP
rogr
amT
otal
(Une
arne
d)(U
near
ned)
Thr
ough
Fed
eral
Gra
ntor
/Pas
s-th
roug
hS
ourc
eC
FD
AG
rant
or's
Gra
nt P
erio
dor
Aw
ard
Rec
eive
dR
even
ueR
even
ueR
even
ueto
Gra
ntor
/Pro
gram
or
Clu
ster
Titl
eC
ode
Num
ber
Num
ber
Beg
inni
ng -
End
ing
Am
ount
for
Yea
r07
/01/
15R
ecog
nize
dE
xpen
ditu
res
06/3
0/16
Sub
reci
pien
tsF
eder
al E
mer
gen
cy M
anag
emen
t A
gen
cyP
asse
d th
roug
h P
A E
mer
genc
y M
anag
emen
t Age
ncy
Pub
lic A
ssis
tanc
e G
rant
I97
.036
FE
MA
-426
7-D
R-
PA
0716
1169
303
/23/
16-0
9/23
/16
68,6
32
-
-
68
,632
68,6
32
68
,632
-
TO
TA
L F
ED
ER
AL
EM
ER
GE
NC
Y M
AN
AG
EM
EN
T A
GE
NC
Y-
-
68,6
32
68
,632
68,6
32
-
U.S
. Dep
artm
ent
of
Ag
ricu
ltu
re
Pas
sed
thro
ugh
PA
Dep
artm
ent o
f Agr
icul
ture
Val
ue o
f US
DA
Don
ated
Com
mod
ities
I10
.555
N/A
07/0
1/15
-06/
30/1
6N
/A15
1,57
0
-
12
3,93
7
123,
937
(2
7,63
3)
-
Val
ue o
f US
DA
Don
ated
Com
mod
ities
I10
.555
N/A
07/0
1/14
-06/
30/1
5N
/A-
(1
5,64
5)
15
,645
15,6
45
-
-
Pas
sed
thro
ugh
PA
Dep
artm
ent o
f Edu
catio
nN
atio
nal S
choo
l Lun
ch P
rogr
amI
10.5
5536
207
/01/
15-0
6/30
/16
N/A
641,
542
31
,102
62
7,45
9
627,
459
17
,019
-
T
otal
CF
DA
#10
.555
793,
112
15
,457
76
7,04
1
767,
041
(1
0,61
4)
-
Sch
ool B
reak
fast
Pro
gram
I10
.553
365
07/0
1/15
-06/
30/1
6N
/A13
7,16
0
8,17
0
13
4,46
0
134,
460
5,
470
-
Tot
al C
FD
A #
10.5
5313
7,16
0
8,17
0
13
4,46
0
134,
460
5,
470
-
TO
TA
L U
.S.
DE
PA
RT
ME
NT
OF
AG
RIC
UL
TU
RE
930,
272
23
,627
90
1,50
1
901,
501
(5
,144
)
-
TO
TA
L F
ED
ER
AL
AW
AR
DS
3,60
1,40
5$
55
9,31
9$
3,
486,
486
$
3,48
6,48
6$
44
4,40
0$
-
$
SP
EC
IAL
ED
UC
AT
ION
CLU
ST
ER
(ID
EA
) (C
FD
A's
#84
.027
AN
D #
84.1
73)
1,31
8,88
4$
52
6,07
4$
1,
199,
740
$
1,19
9,74
0$
40
6,93
0$
-
$
CH
ILD
NU
TR
ITIO
N C
LUS
TE
R (
CF
DA
's #
10.5
53 A
ND
#10
.555
)93
0,27
2$
23,6
27$
901,
501
$
90
1,50
1$
(5,1
44)
$
-
$
Sou
rce
Cod
e:
I - In
dire
ct F
undi
ng
WE
ST
CH
ES
TE
R A
RE
A S
CH
OO
L D
IST
RIC
TS
CH
ED
UL
E O
F E
XP
EN
DIT
UR
ES
OF
FE
DE
RA
L A
WA
RD
SF
OR
TH
E Y
EA
R E
ND
ED
JU
NE
30,
201
6

- 101 -
WEST CHESTER AREA SCHOOL DISTRICT
NOTES TO SCHEDULE OF EXPENDITURES OF FEDERAL AWARDS
NOTE A BASIS OF PRESENTATION
The schedule of expenditures of federal awards reflects federal expenditures for all
individual grants which were active during the fiscal year.
NOTE B BASIS OF ACCOUNTING
The District uses the modified accrual method of recording transactions except as noted
for the accounting of donated commodities in Note C. Revenues are recorded when
measurable and available. Expenditures are recorded when incurred.
NOTE C NONMONETARY FEDERAL AWARDS - DONATED COMMODITIES
The Commonwealth of Pennsylvania distributes federal surplus food to institutions
(schools, hospitals, and prisons) and to the needy. Expenditures reported in the
schedule of expenditures of federal awards under CFDA #10.555 (Value of USDA
Commodities) represent surplus food consumed by the District during the 2015-2016
fiscal year. The District has food commodities totaling $27,633 in inventory as of June
30, 2016.
NOTE D ACCESS PROGRAM
The ACCESS Program is a medical assistance program that reimburses local educational
agencies for direct eligible health-related services provided to enrolled special needs
students. Reimbursements are federal source revenues but are classified as fee-for-
service and are not considered federal financial assistance. The amount of ACCESS
funding recognized for the year ended June 30, 2016 was $280,350.
NOTE E INDIRECT COST
The District has not elected to use the 10 percent de minimis indirect cost rate allowed
under Uniform Guidance. For the year ended June 30, 2016, there were no indirect costs
included in the schedule of expenditures of federal awards.