9.4 the potential role for cloud-scale numerical …
TRANSCRIPT

9.4THE POTENTIAL ROLE FOR CLOUD-SCALE NUMERICAL WEATHER PREDICTION FOR
TERMINAL AREA PLANNING AND SCHEDULINGLloyd A. Treinish*and Anthony P. Praino
IBM Thomas J. Watson Research Center, Yorktown Heights, NY
1. INTRODUCTIONA number of operations in the aviation industry,particularly in the terminal area, are weather-sensitive tolocal conditions in the short-term (3 to 18 hours). Often,they are reactive due to unavailability of appropriatepredicted data at the required temporal and spatial scale.Hence, whatever planning that may be applied to theseprocesses to enable proactive efforts utilize either histor-ical weather data as a predictor of trends or the results ofsynoptic- to meso-beta-scale weather models. Since thistime range is beyond what is feasible with modern now-casting techniques, near-real-time assessment of obser-vations of current weather conditions may have theappropriate geographic locality, by its very nature isonly directly suitable for reactive response.
According to the Air Transportation Association,air traffic delays caused by weather cost the airlinesabout $4.2B in 2000, of which $1.3B was estimated tobe avoidable. Hence, meso-gamma-scale numericalweather models operating at higher resolution in spaceand time with more detailed physics may offer greaterprecision and accuracy within a limited geographicregion such as a terminal area, for problems with short-term weather sensitivity (e.g., Mass et al, 2002; Gall andShapiro, 2000).
Conceptually, improvements in the quality andlead-time of local weather forecasts derived from suchmodels could enable air traffic controllers and dispatch-ers to develop more effective alternative flight paths toreroute aircraft around hazardous weather. Airline offi-cials could initiate recovery plans before weather-induced disruptions actually occur, rescheduling passen-gers and aircraft in affected areas, thereby improvingsafety and efficiency. Airport terminal operators couldmore efficiently schedule and staff aircraft deicing andsnow removal operations during the winter (e.g., Chang-non, 2003 and Dutton, 2002).
Many of these ideas were recognized in the past,although practical deployment with a sufficient balanceof physics and throughput has been limited untilrecently. For example, Carpenter et al 1999 discussesthe use of the Advanced Regional Prediction System(ARPS) to support airport terminal operations. Theyimplemented nested forecasts at 27, 9 and 3 km resolu-tion focusing on specific large airports in the midwest-ern United States.
2. PREVIOUS WORKTo begin to address these issues, we build upon our
earlier work, the implementation of an operational test-bed, dubbed "Deep Thunder", which has been custom-ized for transportation applications. This prototype
provides nested 24-hour forecasts, which are typicallyupdated twice daily, for the New York City metropolitanarea to 1 km resolution utilizing explicit, bulk cloudmicrophysics. The work began with building a capabil-ity sufficient for operational use. In particular, the goalis to provide weather forecasts at a level of precisionand fast enough to address specific business problems.Hence, the focus has been on high-performance comput-ing, visualization, and automation while designing,evaluating and optimizing an integrated system thatincludes receiving and processing data, modelling, andpost-processing analysis and dissemination. Part of therationale for this focus is practicality. Given the time-critical nature of weather-sensitive transportation opera-tions, if the weather prediction cannot be completed fastenough, then it has no value. Such predictive simula-tions need to be completed at least an order of magni-tude faster than real-time. But rapid computation isinsufficient if the results cannot be easily and quicklyutilized. Thus, a variety of fixed and highly interactiveflexible visualizations have also been implemented,including ones focused on support of operational deci-sion-making in transportation. The concept behindDeep Thunder in this context is clearly to be comple-mentary to what the National Weather Service (NWS)does and to leverage their investment in making data,both observations and models, available. The idea,however, is to have highly focused modelling by geog-raphy and application with a greater level of precisionand detail than what is ordinarily available (Treinish andPraino, 2004).
Deep Thunder has recently been extended to alsoprovide forecasts for the Chicago, Kansas City, Balti-more and Washington metropolitan areas at 2 km resolu-tion. Therefore, high-resolution (1-2 km) coverage ofeleven airport terminal areas is currently being provided(i.e., JFK, LGA, EWR, HPN, ORD, GYY, MDW, DCA,IAD, BWI, MCI). All of the processing, modelling andvisualization are completed in one to two hours on rela-tively modest hardware to enable sufficiently timely dis-semination of forecast products for terminal areaapplications at reasonable cost.
2.1 Forecast Model DescriptionThe model used for the Deep Thunder project is
non-hydrostatic with a terrain-following coordinate sys-tem and includes interactive, nested grids. It is a highlymodified version of the Regional Atmospheric Model-ing System (Pielke et al, 1992), the details of which aredescribed in Treinish and Praino, 2004. It includes fullbulk cloud microphysics (e.g., liquid and ice) to enableexplicit prediction of precipitation. Operationally, a 3-way nested configuration is utilized via stereographicprojection. Each nest is a 62 x 62 grid at 16, 4 and 1 kmresolution, respectively (i.e., 976 x 976 km2, 244 x 244km2 and 61 x 61 km2), focused on New York City. Forthe other three geographic areas, the three-way nests are
*Corresponding author address: Lloyd A. Treinish, IBM T.J. Watson Research Center, 1101 Kitchawan Road, York-town Heights, NY 10598, [email protected], http://www.research.ibm.com/people/l/lloydt

66 x 66 at 32, 8 and 2 km resolution, respectively. All ofthe operational domains are illustrated in Figure 1. Thespecific locations of the various configurations werechosen to include the major airports operating in theparticular metropolitan area within the highest-resolu-tion (1 or 2 km) nest. Figure 1 places all of the forecastdomains in a geographic context, which shows a map ofthe eastern two-thirds of the continental United States.On the map are three regions associated with each of thefour aforementioned metropolitan areas. They corre-spond to the triply nested, multiple resolution forecast-ing domains used to produce each high-resolutionweather forecast. The outer nests are in gray, the inter-mediate nests are in magenta and the inner nests are inwhite.
Figure 1. Model Nesting Configurations.The three nests employ 48, 12 and 3 second time
steps, respectively for New York and 100, 25, 6.25 sec-ond time steps, respectively for the other areas. Thetime steps were chosen to ensure computational stabilityand to also accommodate strong vertical motions thatcan occur during modelling of severe convection. Eachnest employs the same vertical grid using 31 stretchedlevels with the lowest level at 48 m above the ground, aminimum vertical grid spacing of 100 m, a stretch factorof 1.12 and a maximum grid spacing of 1000 m. At thepresent time, two 24-hour forecasts are produced daily,typically initiated at 0Z and 12Z for New York, whilethe others are initiated at 6Z and 18Z. Additional runsare scheduled with initialization at other times either on-demand or during interesting weather events.
3. APPROACHIn order to evaluate the potential utility of this class
of numerical weather prediction for terminal operations,we pose a question: could the availability of such fore-casts enable some weather-related ground delays to beavoided? We begin by determining particular days in2002 and 2003, when there was a significant grounddelay associated with weather at any of the three largeairports run by the Port Authority of New York and NewJersey, all of which are within the 1 km forecasting
region (i.e., EWR, JFK and LGA). We then classifythese days into two categories. The first is days whensevere or otherwise significant weather was reported inthis geographic region by the local office of the NationalWeather Service (NWS) at Upton, NY and/or theNOAA Storm Prediction Center (SPC, 2004). We thenneed to determine what type of and when specificweather forecast information was available for potentialuse in airport operations. Since we do not have accessto the direct forecasts utilized by either the Federal Avi-ation Administration (FAA) nor the Port Authority forsuch purposes, we utilize the zone forecasts produced bythe Upton NWS office as a proxy. We attempt toaddress the questions, do these forecasts point to suffi-ciently severe weather or not? If the latter, then were thedelays possible due to the FAA not having sufficientinformation needed to impose the appropriate trafficflow management restrictions?
The second category is days when there was a NWSforecast of severe weather, which resulted in the FAAissuing a ground delay, but the disrupting weather nevermaterialized. For both categories, we compare forecastsproduced for those specific days by Deep Thunder. Inthe first case, we consider if our forecasts indicatedweather sufficiently severe to impact terminal opera-tions. In the second, we determine if our forecasts illus-trate a lack of severe weather in this geographic region.
4. WEATHER DELAYS FOR 2002 AND 2003For both 2002 and 2003, there were many days with
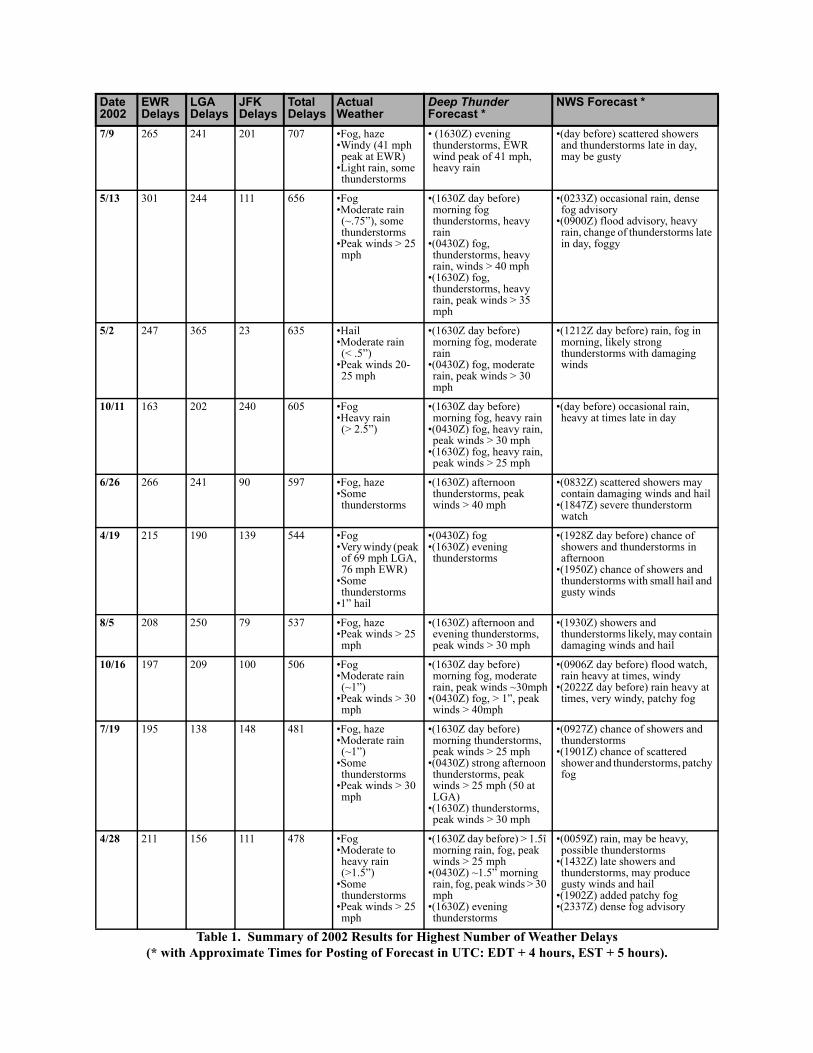
a large number of weather-related delays reported by theOPSNET for EWR, JFK and LGA (FAA, 2004), whichare used to evaluate the quality of available forecasts.This information is summarized in Tables 1 and 2, for2002 and 2003, respectively. For each year, they list thetop ten days with the total number of delays at the threeairports. The number of delays reported are for eachoccurrence that is greater than 15 minutes in length.
Although these data are considered at face-value,there are a few issues. For example, there appears to beless weather sensitivity at JFK in comparison to theother two airports. This will need to be investigated fur-ther, but is beyond the scope of this initial paper.
The sixth column in each table is a summary of thereported weather with information. It should be notedthat for the most part, these days do not correspond tothose cited as having severe weather by NWS or SPC.Many of the significant convective events and winterevents have been compared to the forecasts produced byDeep Thunder (e.g., Praino and Treinish, 2004, andTreinish and Praino, 2005). Some of these will be dis-cussed later in this paper.
The seventh and eighth columns summarize theDeep Thunder forecast and the NWS forecast as well asthe approximate time of their availability in parentheses.Since one or more forecasts may be relevant for theweather on a particular day, the sequence of forecastsand their updates are indicated in both columns.
Date2002
EWR Delays
LGA Delays
JFK Delays
Total Delays
Actual Weather
Deep Thunder Forecast *
NWS Forecast *
7/9 265 241 201 707 •Fog, haze•Windy (41 mph peak at EWR)
•Light rain, some thunderstorms
• (1630Z) evening thunderstorms, EWR wind peak of 41 mph, heavy rain
•(day before) scattered showers and thunderstorms late in day, may be gusty
5/13 301 244 111 656 •Fog•Moderate rain (~.75”), some thunderstorms
•Peak winds > 25 mph
•(1630Z day before) morning fog thunderstorms, heavy rain
•(0430Z) fog, thunderstorms, heavy rain, winds > 40 mph
•(1630Z) fog, thunderstorms, heavy rain, peak winds > 35 mph
•(0233Z) occasional rain, dense fog advisory
•(0900Z) flood advisory, heavy rain, change of thunderstorms late in day, foggy
5/2 247 365 23 635 •Hail•Moderate rain (< .5”)
•Peak winds 20-25 mph
•(1630Z day before) morning fog, moderate rain
•(0430Z) fog, moderate rain, peak winds > 30 mph
•(1212Z day before) rain, fog in morning, likely strong thunderstorms with damaging winds
10/11 163 202 240 605 •Fog•Heavy rain (> 2.5”)
•(1630Z day before) morning fog, heavy rain
•(0430Z) fog, heavy rain, peak winds > 30 mph
•(1630Z) fog, heavy rain, peak winds > 25 mph
•(day before) occasional rain, heavy at times late in day
6/26 266 241 90 597 •Fog, haze•Some thunderstorms
•(1630Z) afternoon thunderstorms, peak winds > 40 mph
•(0832Z) scattered showers may contain damaging winds and hail
•(1847Z) severe thunderstorm watch
4/19 215 190 139 544 •Fog•Very windy (peak of 69 mph LGA, 76 mph EWR)
•Some thunderstorms
•1” hail
•(0430Z) fog•(1630Z) evening thunderstorms
•(1928Z day before) chance of showers and thunderstorms in afternoon
•(1950Z) chance of showers and thunderstorms with small hail and gusty winds
8/5 208 250 79 537 •Fog, haze•Peak winds > 25 mph
•(1630Z) afternoon and evening thunderstorms, peak winds > 30 mph
•(1930Z) showers and thunderstorms likely, may contain damaging winds and hail
10/16 197 209 100 506 •Fog•Moderate rain (~1”)
•Peak winds > 30 mph
•(1630Z day before) morning fog, moderate rain, peak winds ~30mph
•(0430Z) fog, > 1”, peak winds > 40mph
•(0906Z day before) flood watch, rain heavy at times, windy
•(2022Z day before) rain heavy at times, very windy, patchy fog
7/19 195 138 148 481 •Fog, haze•Moderate rain (~1”)
•Some thunderstorms
•Peak winds > 30 mph
•(1630Z day before) morning thunderstorms, peak winds > 25 mph
•(0430Z) strong afternoon thunderstorms, peak winds > 25 mph (50 at LGA)
•(1630Z) thunderstorms, peak winds > 30 mph
•(0927Z) chance of showers and thunderstorms
•(1901Z) chance of scattered shower and thunderstorms, patchy fog
4/28 211 156 111 478 •Fog•Moderate to heavy rain (>1.5”)
•Some thunderstorms
•Peak winds > 25 mph
•(1630Z day before) > 1.5î morning rain, fog, peak winds > 25 mph
•(0430Z) ~1.5” morning rain, fog, peak winds > 30 mph
•(1630Z) evening thunderstorms
•(0059Z) rain, may be heavy, possible thunderstorms
•(1432Z) late showers and thunderstorms, may produce gusty winds and hail
•(1902Z) added patchy fog•(2337Z) dense fog advisory
Table 1. Summary of 2002 Results for Highest Number of Weather Delays
(* with Approximate Times for Posting of Forecast in UTC: EDT + 4 hours, EST + 5 hours).
Table 2. Summary of 2003 Results for Highest Number of Weather Delays (* with Approximate Times for Posting of Forecast in UTC: EDT + 4 hours, EST + 5 hours).
Date2003
EWR Delays
LGA Delays
JFK Delays
Total Delays
Reported Weather
Deep Thunder Forecast *
NWS Forecast *
9/4 394 413 3 810 •Fog, haze, low visibility
•Light rain, some thunderstorms
• (1630Z day before) morning moderate showers, fog
•(0430Z) fog•(1630Z) light rain, fog
•Occasional showers
6/4 450 252 57 759 •Fog•Heavy rain (>2”), flooding
•Some thunderstorms
•(0430Z) heavy rain (>2”), fog
•(day before) flood watch•Moderate to heavy rain (1-2”)
11/5 367 263 79 699 •Fog, low visibility•Light to heavy rain (.2 - 1.1”), some thunderstorms
•(0430Z) light rain, fog•(1630Z) moderate rain and fog
•(0910Z) areas of fog, light rain•(1747Z) dense fog advisory
9/3 244 293 81 618 •Fog•Moderate rain (~.3”), some thunderstorms
•(1630Z day before) morning moderate to heavy rain, fog
•(1630Z) fog
•(day before) light rain, patchy fog
•(1005Z) heavy rain likely
7/11 306 296 0 602 •Fog, haze, low visibility
•Moderate rain (~.3î), some thunderstorms
•(1630Z day before) fog•(0430Z) some thunderstorms, fog
•(1630Z) some afternoon thunderstorms, fog
•(0129Z) occasional shower and chance of heavy thunderstorms
•(0746Z) showers likely with scattered, gusty thunderstorms
12/11 316 232 1 580 •Fog, low visibility•Heavy rain (~.5-1”)
•Peak winds > 40 mph
•(1630Z day before) morning moderate showers, fog, peak winds > 40 mph
•(0430Z) moderate to heavy rain (.5-1”), winds > 40 mph, fog
•(1630Z) moderate rain (.1-.5”), peak winds > 30 mph, fog
•(1143Z day before) heavy rain expected, fog
•(1730Z day before) flood watch, heavy rain
•(1700Z) dense fog
9/15 280 276 0 556 •Fog, low visibility•Light to moderate rain (0-.4”)
•(1630Z day before) fog•(0430Z) light rain, fog
•(0151Z) chance of showers, patchy fog
•(0758Z) chance of showers, thunderstorms
7/21 285 162 107 554 •Fog, haze•Thunderstorms•Peak winds 30-40 mph
•(0430Z) light rain, fog, winds 25-32 mph
•(1630Z) fog, peak winds 25-32 mph
•(1855Z) severe thunderstorms possible
•(2030Z) severe thunderstorm watch, gusts to 70 mph, hail
5/11 283 188 78 549 •Fog, haze, low visibility
•Light rain (LGA)•Peak winds 20-30 mph
•(1630Z day before) morning thunderstorms
•(0430Z) fog, light showers, peak winds 20-30 mph)
•(1630Z) fog, light showers (LGA), peak winds 25-35 mph
•(0530Z) slight risk for severe thunderstorm late afternoon/evening
•(2015Z) dense fog advisory
3/6 182 244 118 544 •Fog•Ice, glaze•Significant snow (~3”, ~.5” liquid)
•(1630Z day before) morning light rain, changing to snow, fog
•(0430Z) mixed precipitation (~1” liquid), fog
•(1630Z) mostly snow (~.5”liquid), freezing during the late afternoon and evening, fog
•(1926Z day before) possible snow (2-3”)
•(0145Z) winter weather advisory
•(0958Z) snow, may be heavy, starting with rain/sleet

From the data used to prepare Tables 1 and 2, it isclear that the most common weather that leads to delaysat these airports is fog (19 out of 20 cases). In 15 out ofthe 20 examples, Deep Thunder forecasted the observedfog. In contrast, NWS forecasted fog in only eightcases, half of which were significantly later than theDeep Thunder forecasts. In only one case, July 19,2002, did NWS correctly predict fog when Deep Thun-der did not.
On only three days did Deep Thunder miss a fore-cast of some significant weather at the airports (May 2,2002: thunderstorms, April 19, 2002: very high winds,July 21, 2003: thunderstorms). However, other aspectsof the reported weather on those days were correctlypredicted. The NWS forecasts incorrectly indicatedinformation about winds for December 11, 2002; July21, 2002; May 13, 2003; May 2, 2003 and August 5,2003. On the other hand, the NWS forecasts had longlead times for several precipitation events, especiallythose more on a synoptic scale (e.g., June 4, 2002;March 6, 2002; July 9, 2003; October 11, 2003 andOctober 16, 2003).
5. SPECIFIC CASE STUDIESNone of the examples outlined in Tables 1 and 2
showed a delay for which there was no significantweather. While further analysis of other days withdelays of a lesser magnitude will uncover that situation,it is also worth considering a few other days in 2002 and2003 during which severe weather or significant delaysdid occur.
5.1 August 2, 2002The reported weather delays for August 2, 2002
were relatively minor compared to the examples cited
earlier (162, 27 and 126 for EWR, JFK and LGA,respectively). However, the average ground stopreported in OPSNET for that day was quite high (almost127 minutes average for a total of 18026 minutes in theregion, mostly at EWR). In particular, severe thunder-storms occurred between 2000 EDT and 2300 EDT thatevening at EWR with heavy rainfall (> 1.6”) and windgusts over 30 mph as well as hail. The NationalWeather Service forecasts provided the following infor-mation in time sequence:
• The day and evening before:scattered showers and thunderstorms• 1100 EDT: strong thunderstorms possible late this afternoon• 1336 EDT: strong thunderstorms possible late this afternoon with gusty winds• 1652 EDT: severe thunderstorm watch, damag-ing winds and hail
In contrast, consider Figures 2 and 3, which showthe Deep Thunder forecasts for that evening. Figure 2 isfor a model run initialized at 0Z and was available atabout 0030 EDT. Figure 3 is for a model run initializedat 12Z and was available at about 1230 EDT. Both fig-ures represent a type of meteogram that is orientedtoward interpretation by the non-meteorologist. Eachconsists of three panels showing surface data and onepanel to illustrate upper air data. In all cases, the vari-ables are shown as a function of time interpolated to aspecific location (EWR -- Newark International Air-port). The plots on the left each show two variableswhile those on the right show one. The top left plot pre-sents temperature (blue) and pressure (red). The bottomleft panel shows humidity (blue) and total precipitation(red).
Figure 2. Deep Thunder Forecast for EWR -- August 2, 2002 Initialized at 0Z.

Figure 3. Deep Thunder Forecast for EWR -- August 2, 2002 Initialized at 12Z.
Since the precipitation is accumulated through themodel run, the slope of the curve will be indicative ofthe predicted rate of precipitation. Therefore, when theslope is zero, it is not raining. In addition, the model cal-culations require some time to "spin-up" the microphys-ics to enable precipitation. Therefore, there willtypically be no precipitation in the first hour or two ofmodel results. The top right plot illustrates forecastedwinds -- speed (blue) and direction (red). The winddirection is shown via the arrows that are attached to thewind speed plot. The arrows indicate the predicted(compass) direction to which the wind is going. The bot-tom right plot is a colored log-contour map of forecastedtotal (water and ice) cloud water density as a function ofelevation and time. This "cross-sectional" slice can pro-vide information related to storms, fog, visibility, etc.predicted at this location. Portions of the plot in blackimply time or elevations where there are little or noclouds. Areas in yellow, orange and red imply whenand where the relatively densest clouds are forecasted,following the color legend on the top of the panel.
Using these figures, the earlier model run shows thethunderstorm beginning at about 1815 EDT. The latterforecast corrects the timing with precipitation beginningat about 2100 EDT and stopping at about 2345 EDT.The overall magnitude of the predicted storm has a posi-tive bias. The total precipitation is high (2.9 inches vs.1.62 inches) and the peak winds have a positive bias ofabout 10 mph. On the other hand, the timing is correctwithin the temporal resolution of the weather stationobservations.
5.2 September 23, 2003As a weak cold front approached the east coast of
the United States on the morning of September 23,2003, showers and thunderstorms developed just ahead
of it. Many of them evolved into severe thunderstorms,spawning two F1 tornadoes in northeastern New Jerseybetween 0805 EDT and 0835 EDT, and two additionalF1s in eastern Pennsylvania. There were reports of highwinds with gusts up to 80 mph. In addition, about 2.5inches of rain fell in the area in about 30 minutes. Therewere over 100 trees uprooted as well as a number ofdamaged buildings and downed power lines.
The Deep Thunder forecast for this event is summa-rized in Figure 4. Both panels show a terrain map, col-ored by a forecast of total precipitation, where darkershades of blue indicate heavier accumulations. The mapis marked with the location of major cities or airports aswell as river, coastline and county boundaries within the4 km nest. In addition, there are colored arrows indicat-ing predicted winds, with the lighter color being fasterwinds and the arrow direction corresponding to thedirection to which the wind is flowing. Above the ter-rain is a forecast of clouds, represented by a three-dimensional translucent white surface of total cloudwater density (water and ice) at a threshold of 10-3 kgwater/kg air. Within the cloud surface is translucentcyan surface of forecast reflectivities at a threshold of45 dbZ. This combination is indicative of a well-formedsquall line associated with strong convection.
The top panel of Figure 4 is from a model forecastinitialized at 0Z on September 23, 2003. Operationally,this forecast provided approximately a seven-hour lead-time for the event with initialization data from 12 hoursbefore the event. However, the forecasted squall linewas biased toward the north and roughly 90 to 120 min-utes late. A subsequent run, initialized with 6Z data,corrected both of those biases and is illustrated with thecorresponding visualization in the bottom panel. Opera-tionally, the lead time is reduced to 90 to 120 minutes.

Figure 4. Deep Thunder Forecasts of Severe Thunderstorm Event of September 23, 2003.In contrast, the overnight forecast from the National
Weather Service indicated that there was “a chance ofthunderstorms, rain may be heavy”. At 0826 EDT, atornado warning was issued. In addition, Allan et al,2004, cite this same event with a very short term fore-
cast of radar echo tops as an extension of their on-goingTerminal Convective Weather Forecast programdeployed at the same airports discussed in this paper.However, their forecast is complementary in that it pro-vided information with a lead time of only up to an hour.

6. DISCUSSIONMuch of the work focused on improved weather
forecasts in terminal areas is dedicated to the analysis oflocal radar observations. The goal is complementary tothe effort discussed herein -- for near-real-time responsein the 0 to 2 hour time frame (e.g., Wolfson et al, 2004and Evans, Allan and Robinson, 2004).
6.1 Other Recent NWP EffortsGiven the near-real-time availability of input data,
lowered cost of high-performance computing systemsand growing quality of modelling codes, the capabilityof operating high-resolution numerical weather predic-tion systems has become more feasible in recent years.Only a few have focused on potential applications forapplied such modelling to winter forecasting (Xu et al,2004). In particular, they have attempted to improve thequality of short-term forecasts by assimilating theresults of the type of radar used for the aforementionednowcasting. They cite a snow event on December 11,2002 and the limitations in their ability to predict thekey features of that event covering the New York Citymetropolitan area at 3.3 km. In contrast, the operationalDeep Thunder forecasts for LGA for that event areshown in Figure 5 (0Z and 12Z, respectively). The 0Zforecast has the snow beginning about two hours earlierthan the local observations report with the 12Z correct-ing that time. The 12Z forecast has the snow endingabout two hours before the actual snow stopped. Therewas a positive bias in the liquid equivalent (1.2 inchesvs. 0.9 inches) In addition, the 12Z forecast also cap-tured the two snow bands observed by radar.
Xu et al ran their system operationally for the win-ter 2004 season focused on Baltimore at 3.3 km resolu-tion, but also included the New York area at 10 kmresolution. They cite a late winter snowstorm on March16 in which their forecast was late in predicting the startof the event by one to two hours. The operational DeepThunder forecasts for this event are shown in Figure 6
for both BWI (at 16 km resolution) on the left-hand sideas well as LGA (at 1 km resolution) on the right-handside, for three model run cycles, initialized at 0Z (top),6Z (middle) and 12Z (bottom). The first two forecastsincluded the start of the snow, and correctly predictedthe time at both airport locations within the temporalresolution of the available observations. The 12Z cyclealso had the start time correct for LGA. Both the 6Z and12Z forecasts had the snow ending a couple of hoursearlier than was observed at both airports. The 12Zforecast for LGA has the snow tapering off for a fewhours, which was not observed. For both airports, theforecasted liquid equivalent was about twice what wasobserved.
6.2 Forecast AssessmentThe example events discussed herein show signifi-
cant and consistent skill associated with Deep Thunder’sforecasts of fog, convective thunderstorms and wintersnow events compared to other sources of forecasts.This would appear to be the result of using both a high-resolution grid and a more sophisticated cloud micro-physics scheme compared to what Xu et al or what isavailable to the NWS from the National Centers forEnvironmental Prediction. The overall architecture ofthe system has permitted the practical operation of thiscapability in the New York City metropolitan area forover three years (Treinish and Praino, 2004).
A delay occurrence in the OPSNET data for oneairport may mean that some aircraft were delayed on theground more than 15 minutes at another airport due toan anticipation of bad weather at the destination in thenext few hours. This factor has not been considered inthe analysis discussed herein, which could be mani-fested by not having significant weather at the time ofthe delay. Therefore, the determination of whether ornot the FAA fails to impose a traffic flow managementrestriction when bad weather was forecasted but did notoccur has not been fully addressed.
Figure 5. Deep Thunder Precipitation and Humidity Forecast for LGA for December 11, 2002 Initialized at 00Z (left) and 12Z (right).

Figure 6. Deep Thunder Precipitation and Humidity Forecast for BWI (Left at 16 km Resolution) and LGA (Right at 1 km Resolution) for March 16, 2004 Initialized at 00Z (top), 06Z (middle) and 12Z (bottom)..
7. CONCLUSIONS AND FUTURE WORKThis is an on-going effort. The results to date illus-
trate a practical implementation with good skill at fore-casting weather events of relevance to airport terminaloperators. But they also point to several next steps.
The first step focuses on improvements in overallforecast quality, especially for storm timing and precipi-tation totals. Initially, new, higher-resolution data setsbecoming available via NOAAport (e.g., 12 km Eta anddaily sea surface temperature) with other data sets willbe utilized improve the model initial conditions. Furthertuning of the microphysics will also be addressed toreduce its efficiency in aggregation.
Additional analysis of the New York forecasts anddelays at the airports is required as well as their exten-sion to the other major terminal areas now beingaddressed by Deep Thunder. The goal of this plannedwork is to better estimate the economic benefit of thisclass of numerical weather prediction in two separatecategories.
1. The standard forecast used at a terminal arearesults in a traffic flow management alarm. Hence,the FAA issues ground delays in anticipation of bad
weather that does not materialize. As a result,many aircraft are needlessly delayed on the groundand flights are cancelled, leading to massive disrup-tions and unnecessary costs to the airlines. WouldDeep Thunder have correctly predicted safeweather for such days?2. The standard forecast used at a terminal arearesults in a missed alert when the FAA issues littleor no ground delays and bad weather materializes.In this situation, many aircraft are delayed in the airand/or are diverted to other airports. This alsoresults in disruptions and unnecessary costs. WouldDeep Thunder have correctly predicted the hazard-ous weather for such days?Hence, the next step is to further identify days with
exceptionally high and low ground delays and thencompare them to predicted weather. Days with a highincidence of ground delays but no bad weather would becase 1. Days with little or no ground delays with badweather would be case 2.
8. ACKNOWLEDGEMENTSWe thank Igor Frolow of IBM Business Consulting
Services, Austin, TX for his time and ideas about appli-

cations of Deep Thunder for terminal area operations aswell as his review of this paper.
The OPSNET data referenced in the paper (FAA,2004) are available courtesy of the Federal AviationAdministration and provided to us via Igor Frolow.
The zone forecasts and weather observations refer-enced in the paper are available courtesy of the NationalWeather Service as provided via their NOAAport satel-lite receiver system.
This work is supported by the Mathematical Sci-ences Department and the Exploratory Server SystemsDepartment at the IBM Thomas J. Watson ResearchCenter.
9. REFERENCESAllan, S., R. DeLaura, B. Martin, D. Clark and C. Gross.
Advanced Terminal Weather Products Demonstra-tion in New York Proceedings of the 11th Confer-ence on Aviat ion, Range and AerospaceMeteorology, October 2004, Hyannis, MA.
Carpenter, R.L. Jr., K .K. Droegemeier, G. M. Bassett, S.S. Weygandt, D. E. Jahn, S. Stevenson, W. Qualleyand R. Strasser. Storm-scale numerical weatherprediction for commercial and military aviation,Part 1: Results from operational tests in 1998. Pro-ceedings of the Eighth Conference on Aviation,Range and Aerospace Meteorology, January,1999, Dallas, TX, pp. 209-211.
Changnon, S. D. Measures of Economic Impacts ofWeather Extremes. Bulletin of the AmericanMeteorological Society, 84, no. 9, pp. 1231-1235,September 2003.
Dutton, J. A. Opportunities and Priorities in a New Erafor Weather and Climate Services. Bulletin of theAmerican Meteorological Society, 83, no. 9, pp.1303-1311, September 2002.
Evans, J. E., S. Allan and M. Robinson. QuantifyingDelay Reduction Benefits for Aviation ConvectiveWeather Decision Support Systems. Proceedingsof the 11th Conference on Aviation, Range andAerospace Meteorology, October 2004, Hyannis,MA.
Federal Aviation Administration. Aviation Policy andP l ans D a t a S y s t em (http://www.apo.data.faa.gov), 2004.
Gall, R. and M. Shapiro. The Influence of Carl-GustafRossby on Mesoscale Weather Prediction and anOutlook for the Future. Bulletin of the AmericanMeteorological Society, 81, no. 7, pp. 1507-1523,
July 2000.Mass, C. F., D. Owens, K. Westrick and B. A. Colle.
Does Increasing Horizontal Resolution ProduceMore Skillful Forecasts. Bulletin of the AmericanMeteorological Society, 83, no. 3, pp. 407-430,March 2002.
Pielke, R. A., W. R. Cotton, R. L. Walko, C. J. Trem-back, W. A. Lyons, L. D. Grasso, M. E. Nicholls,M.-D. Moran, D. A. Wesley, T. J. Lee and J. H.Copeland. A Comprehensive Meteorological Mod-eling System - RAMS. Meteorology and Atmo-spheric Physics, 49, 1992, pp. 69-91.
Praino, A. P. and L. A. Treinish. Winter Forecast Per-formance an Operational Mesoscale NumericalModelling System in the Northeast U.S. -- Winter2002-2003. Proceedings of the 20th Conferenceon Weather Analysis and Forecasting/16th Con-ference on Numerical Weather Prediction, Janu-ary 2004, Seattle, WA.
Praino, A. P. and L. A. Treinish. Convective forecastperformance of an operational mesoscale model-ling system. To be published in Proceedings of the21th International Conference on InteractiveInformation and Processing Systems for Meteo-rology, Oceanography and Hydrology, January2005, San Diego, CA.
Storm Prediction Center. Storm report data for pastdays (http://www.spc.noaa.gov/climo), 2004.
Treinish, L. A. and A. P. Praino. Customization of aMesoscale Numerical Weather Prediction Systemfor Transportation Applications. Proceedings ofthe 20th International Conference on InteractiveInformation and Processing Systems for Meteo-rology, Oceanography and Hydrology, January2004, Seattle, WA.
Wolfson, M. M., B. E. Forman, K. T. Calden, W. J.Dupree, R. J. Johnson, R. A. Boldi, C. A. Wilson, P.E. Bieringer, E. B. Mann and J. P. Morgan. Tactical0-2 Hour Convective Weather Forecasts for theFAA. Proceedings of the 11th Conference on Avi-ation, Range and Aerospace Meteorology, Octo-ber 2004, Hyannis, MA.
Xu, M., A. Crook, Y. Liu and R. Rasmussen. Real-TimeAnalysus and Short-Term Forecasting of Snow-bands Using a Mesoscale Model. Proceedings ofthe 11th Conference on Aviation, Range andAerospace Meteorology, October 2004, Hyannis,MA.