9.0-plant design appendix b
DESCRIPTION
jnjTRANSCRIPT

1
Appendix B. Information for the Preliminary Design of Fifteen Chemical Processes
The purpose of the process designs contained in this appendix is to provide the reader with a preliminary description of several common chemical processes. The designs provided are the result of preliminary simulation using the CHEMCAD process simulation software and often contain simplifying assumptions such as ideal column behavior (shortcut method using the Underwood-Gilliland method) and in some cases the use of ideal thermodynamics models (K-value = ideal gas, enthalpy = ideal). These designs are used throughout the book in the end-of-chapter problems and provide a starting point for detailed design. The authors recognize that there are additional complicating factors, such as nonideal phase equilibrium behavior (such as azeotrope formation and phase separation), feed stream impurities, different catalyst selectivity, side reaction formation, and so on. The presence of any one of these factors may give rise to significant changes from the preliminary designs shown here. Thus, the student, if asked to perform a detailed process design of these (or other) processes, should take the current designs as only a starting point and should be prepared to do further research into the process to ensure that a more accurate and deeper understanding of the factors involved is obtained.
Following is a list of the sections and projects discussed in this appendix:
B.1 Dimethyl Ether (DME) Production, Unit 200
B.2 Ethylbenzene Production, Unit 300
B.3 Styrene Production, Unit 400
B.4 Drying Oil Production, Unit 500
B.5 Production of Maleic Anhydride from Benzene, Unit 600
B.6 Ethylene Oxide Production, Unit 700
B.7 Formalin Production, Unit 800
B.8 Batch Production of L-Phenylalanine and L-Aspartic Acid, Unit 900
B.9 Acrylic Acid Production via the Catalytic Partial Oxidation of Propylene, Unit 1000
B.10 Production of Acetone via the Dehydrogenation of Isopropyl Alcohol (IPA), Unit 1100
B.11 Production of Heptenes from Propylene and Butenes, Unit 1200
B.12 Design of a Shift Reactor Unit to Convert CO to CO2, Unit 1300
B.13 Design of a Dual-Stage Selexol Unit to Remove CO2 and H2S from Coal-Derived Synthesis Gas, Unit 1400
B.14 Design of a Claus Unit for the Conversion of H2S to Elemental Sulfur, Unit 1500
B.15 Modeling a Downward-Flow, Oxygen-Blown, Entrained-Flow Gasifier, Unit 1600

2
B.1. Dimethyl Ether (DME) Production, Unit 200
DME is used primarily as an aerosol propellant. It is miscible with most organic solvents, has a high solubility in water, and is completely miscible in water and 6% ethanol [1]. Recently, the use of DME as a fuel additive for diesel engines has been investigated due to its high volatility (desirable for cold starting) and high cetane number. The production of DME is via the catalytic dehydration of methanol over an acid zeolite catalyst. The main reaction is
In the temperature range of normal operation, there are no significant side reactions.
B.1.1. Process Description
A preliminary process flow diagram for a DME process is shown in Figure B.1.1, in which 50,000 metric tons per year of 99.5 wt% purity DME product is produced. Due to the simplicity of the process, an operating factor greater than 0.95 (8375 h/y) is used.
Fresh methanol, Stream 1, is combined with recycled reactant, Stream 13, and vaporized prior to being sent to a fixed-bed reactor operating between 250°C and 370°C. The single-pass conversion of methanol in the reactor is 80%. The reactor effluent, Stream 7, is then cooled prior to being sent to the first of two distillation columns: T-201 and T-202. DME product is taken overhead from the first column. The second column separates the water from the unused methanol. The methanol is recycled back to the front end of the process, and the water is sent to wastewater treatment to remove trace amounts of organic compounds.
Stream summaries, utility summaries, and equipment summaries are presented in Tables B.1.1–B.1.3.

3
Figure B.1.1. Unit 200: Dimethyl Ether Process Flow Diagram
Table B.1.1. Stream Table for Unit 200

4
Table B.1.2. Utility Summary Table for Unit 200
Table B.1.3. Major Equipment Summary for Unit 200

5
B.1.2. Reaction Kinetics
The reaction taking place is mildly exothermic with a standard heat of reaction, ΔHreac (25°C) = –11,770 kJ/kmol. The equilibrium constant for this reaction at three different temperatures is given below:
The corresponding equilibrium conversions for pure methanol feed over the above temperature range are greater than 99%. Thus this reaction is kinetically controlled at the conditions used in this process.

6
The reaction takes place on an amorphous alumina catalyst treated with 10.2% silica. There are no significant side reactions at less than 400°C. At greater than 250°C the rate equation is given by Bondiera and Naccache [2] as:
where k0 = 1.21 × 10⁶ kmol/(m3cat.h.kPa), E0 = 80.48 kJ/mol, and pmethanol = partial pressure of methanol (kPa).
Significant catalyst deactivation occurs at temperatures greater than 400°C, and the reactor should be designed so that this temperature is not exceeded anywhere in the reactor. The design given in Figure B.1.1 uses a single packed bed of catalyst, which operates adiabatically. The temperature exotherm occurring in the reactor of 118°C is probably on the high side and gives an exit temperature of 368°C. However, the single-pass conversion is quite high (80%), and the low reactant concentration at the exit of the reactor tends to limit the possibility of a runaway.
In practice the catalyst bed might be split into two sections, with an intercooler between the two beds. This has an overall effect of increasing the volume (and cost) of the reactor and should be investigated if catalyst damage is expected at temperatures lower than 400°C. In-reactor cooling (shell-and-tube design) and cold quenching by splitting the feed and feeding at different points in the reactor could also be investigated as viable alternative reactor configurations.
B.1.3. Simulation (CHEMCAD) Hints
The DME-water binary system exhibits two liquid phases when the DME concentration is in the 34% to 93% range [2]. However, upon addition of 7% or more alcohol, the mixture becomes completely miscible over the complete range of DME concentration. In order to ensure that this nonideal behavior is simulated correctly, it is recommended that binary vapor-liquid equilibrium (VLE) data for the three pairs of components be used in order to regress binary interaction parameters (BIPs) for a UNIQUAC/UNIFAC thermodynamics model. If VLE data for the binary pairs are not used, then UNIFAC can be used to estimate BIPs, but these should be used only as preliminary estimates. As with all nonideal systems, there is no substitute for designing separation equipment using data regressed from actual (experimental) VLE.
B.1.4. References
1. “DuPont Talks about Its DME Propellant,” Aerosol Age, May and June 1982.
2. Bondiera, J., and C. Naccache, “Kinetics of Methanol Dehydration in Dealuminated H-Mordenite: Model with Acid and Basic Active Centres,” Applied Catalysis 69 (1991): 139–148.
B.2. Ethylbenzene Production, Unit 300

7
The majority of ethylbenzene (EB) processes produce EB for internal consumption within a coupled process that produces styrene monomer. The facility described here produces 80,000 tonne/y of 99.8 mol% ethylbenzene that is totally consumed by an on-site styrene facility. As with most EB/styrene facilities, there is significant heat integration between the two plants. In order to decouple the operation of the two plants, the energy integration is achieved by the generation and consumption of steam within the two processes. The EB reaction is exothermic, so steam is produced, and the styrene reaction is endothermic, so energy is transferred in the form of steam.
B.2.1. Process Description [1, 2]
The PFD for the EB process is shown in Figure B.2.1. A refinery cut of benzene is fed from storage to an on-site process vessel (V-301), where it is mixed with the recycled benzene. From V-301, it is pumped to a reaction pressure of approximately 2000 kPa (20 atm) and sent to a fired heater (H-301) to bring it to reaction temperature (approximately 400°C). The preheated benzene is mixed with feed ethylene just prior to entering the first stage of a reactor system consisting of three adiabatic packed-bed reactors (R-301 to R-303), with interstage feed addition and cooling. Reaction occurs in the gas phase and is exothermic. The hot, partially converted reactor effluent leaves the first packed bed, is mixed with more feed ethylene, and is fed to E-301, where the stream is cooled to 380°C prior to passing to the second reactor (R-302), where further reaction takes place. High-pressure steam is produced in E-301, and this steam is subsequently used in the styrene unit. The effluent stream from R-302 is similarly mixed with feed ethylene and is cooled in E-302 (with generation of high-pressure steam) prior to entering the third and final packed-bed reactor, R-303. The effluent stream leaving the reactor contains products, by-products, unreacted benzene, and small amounts of unreacted ethylene and other noncondensable gases. The reactor effluent is cooled in two waste-heat boilers (E-303 and E-304), in which high-pressure and low-pressure steam, respectively, is generated. This steam is also consumed in the styrene unit. The two-phase mixture leaving E-304 is sent to a trim cooler (E-305), where the stream is cooled to 80°C, and then to a two-phase separator (V-302), where the light gases are separated and, because of the high ethylene conversion, are sent overhead as fuel gas to be consumed in the fired heater. The condensed liquid is then sent to the benzene tower, T-301, where the unreacted benzene is separated as the overhead product and returned to the front end of the process. The bottoms product from the first column is sent to T-302, where product EB (at 99.8 mol% and containing less than 2 ppm diethylbenzene [DEB]) is taken as the top product and is sent directly to the styrene unit. The bottoms product from T-302 contains all the DEB and trace amounts of higher ethylbenzenes. This stream is mixed with recycle benzene and passes through the fired heater (H-301) prior to being sent to a fourth packed-bed reactor (R-304), in which the excess benzene is reacted with the DEB to produce EB and unreacted benzene.
8
The effluent from this reactor is mixed with the liquid stream entering the waste-heat boiler (E-303).
Stream summary tables, utility summary tables, and major equipment specifications are shown in Tables B.2.1–B.2.3.
B.2.2. Reaction Kinetics
The production of EB takes place via the direct addition reaction between ethylene and benzene:
The reaction between EB and ethylene to produce DEB also takes place:
Additional reactions between DEB and ethylene yielding triethylbenzene (and higher) are also possible. However, in order to minimize these additional reactions, the molar ratio of benzene to ethylene is kept high, at approximately 8:1. The production of DEB is undesirable, and its value as a side product is low. In addition, even small amounts of DEB in EB cause significant processing problems in the downstream styrene process. Therefore, the maximum amount of DEB in EB is specified as 2 ppm. In order to maximize the production of the desired EB, the DEB is separated and returned to a separate reactor in which excess benzene is added to produce EB via the following equilibrium reaction:
The incoming benzene contains a small amount of toluene impurity. The toluene reacts with ethylene to form ethyl benzene and propylene:
The reaction kinetics derived for a new catalyst are given as
where i is the reaction number above (B.2.i), and the following relationships pertain:
The units of ri are kmol/s/m3-reactor, the units of Ci are kmol/m3-gas, and the units of ko,i vary depending upon the form of the equation.

9
Figure B.2.1. Unit 300: Ethylbenzene Process Flow Diagram

10
Table B.2.1. Stream Table for Unit 300

11

12
Table B.2.2. Utility Summary Table for Unit 300
Table B.2.3. Major Equipment Summary for Unit 300

13

14
B.2.3. Simulation (CHEMCAD) Hints
A CHEMCAD simulation is the basis for the design. The thermodynamics models used were K-val = UNIFAC and Enthalpy = Latent Heat.
It should be noted that in the simulation a component separator was placed after the high-pressure flash drum (V-302) in order to remove noncondensables from Stream 16 prior to entering T-301. This is done in order to avoid problems in simulating this tower. In practice, the noncondensables would be removed from the overhead reflux drum, V-303, after entering T-301.
As a first approach, both towers were simulated as Shortcut columns in the main simulation, but subsequently each was simulated separately using the rigorous TOWER module. Once the rigorous TOWER

15
simulations were completed, they were substituted back into the main flowsheet and the simulation was run again to converge. A similar approach is recommended. The rigorous TOWER module provides accurate design and simulation data and should be used to assess column operation, but using the shortcut simulations in the initial trials speeds up overall conversion of the flowsheet.
B.2.4. References
1. William J. Cannella, “Xylenes and Ethylbenzene,” Kirk-Othmer Encyclopedia of Chemical Technology, online version (New York: John Wiley and Sons, 2006).
2. “Ethylbenzene,” Encyclopedia of Chemical Processing and Design, Vol. 20, ed. J. J. McKetta (New York: Marcel Dekker, 1984), 77–88.
B.3. Styrene Production, Unit 400
Styrene is the monomer used to make polystyrene, which has a multitude of uses, the most common of which are in packaging and insulated Styrofoam beverage cups. Styrene is produced by the dehydrogenation of ethylbenzene. Ethylbenzene is formed by reacting ethylene and benzene. There is very little ethylbenzene sold commercially, because most ethylbenzene manufacturers convert it directly into styrene.
B.3.1 Process Description [1, 2]
The process flow diagram is shown in Figure B.3.1. Ethylbenzene feed is mixed with recycled ethylbenzene, heated, and then mixed with high-temperature, superheated steam. Steam is an inert in the reaction, which drives the equilibrium shown in Equation (B.3.1) to the right by reducing the concentrations of all components. Because styrene formation is highly endothermic, the superheated steam also provides energy to drive the reaction. Decomposition of ethylbenzene to benzene and ethylene, and hydrodealkylation to give methane and toluene, are unwanted side reactions shown in Equations (B.3.2) and (B.3.3). The reactants then enter two adiabatic packed beds with interheating. The products are cooled, producing steam from the high-temperature reactor effluent. The cooled product stream is sent to a three-phase separator, in which light gases (hydrogen, methane, ethylene), organic liquid, and water exit in separate streams. The hydrogen stream is further purified as a source of hydrogen elsewhere in the plant. The benzene/toluene stream is currently returned as a feed stream to the petrochemical facility. The organic stream containing the desired product is distilled once to remove the benzene and toluene and distilled again to separate unreacted ethylbenzene for recycle from the styrene product.

16
The styrene product can spontaneously polymerize at higher temperatures. Because product styrene is sent directly to the polymerization unit, experience suggests that as long as its temperature is maintained at less than 125°C, there is no spontaneous polymerization problem. Because this is less than styrene’s normal boiling point, and because low pressure pushes the equilibrium in Equation (B.3.1) to the right, much of this process is run at vacuum.
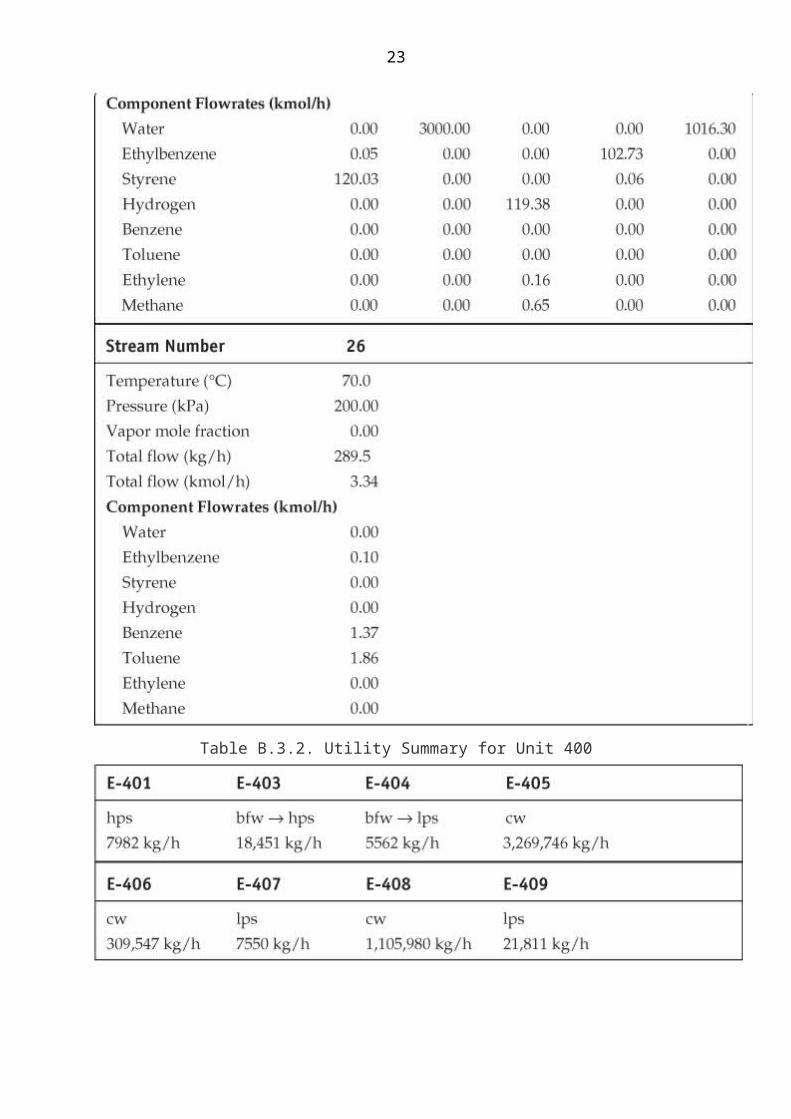
Stream tables, utility summaries, and major equipment summaries are given in Tables B.3.1, B.3.2, and B.3.3, respectively.
B.3.2. Reaction Kinetics
The styrene reaction may be equilibrium limited, and the equilibrium constant is given as Equation (B.3.4).
where T is in K and P is in bar.
Figure B.3.1. Unit 400: Styrene Process Flow Diagram

17
Table B.3.1. Stream Tables for Unit 400

18

19

20
Table B.3.2. Utility Summary for Unit 400

21
Table B.3.3. Major Equipment Summary for Unit 400

22
23
The equilibrium calculation is given as
total = N + 1 + x includes N moles of inert steam
where P is in bar.
Equation (B.3.5) can be used to generate data for equilibrium conversion, x, versus P, T, and N.
The kinetic equations are adapted from Snyder and Subramaniam [3]. Subscripts on r refer to reactions in Equations (B.3.1)–(B.3.3), and the positive activation energy can arise from nonelementary kinetics; it is thought that perhaps these kinetics are an elementary approximation to nonelementary kinetics.
where p is in bar, T is in K, R = 1.987 cal/mol K, and ri is in mol/m3-reactor s.
You should assume that the catalyst has a bulk density of 1282 kg/m3, an effective diameter of 25 mm, and a void fraction = 0.4.
B.3.3 Simulation (CHEMCAD) Hints
Results for the simulation given here were obtained using SRK as the K-value and enthalpy options in the thermodynamics package.
B.3.4 References
1. Shiou-Shan Chen, “Styrene,” Kirk-Othmer Encyclopedia of Chemical Technology, online version (New York: John Wiley and Sons, 2006).
2. “Styrene,” Encyclopedia of Chemical Processing and Design, Vol. 55, ed. J. J. McKetta, (New York: Marcel Dekker, 1984), 197–217.
3. Snyder, J. D., and B. Subramaniam, “A Novel Reverse Flow Strategy for Ethylbenzene Dehydrogenation in a Packed-Bed Reactor,” Chem. Engr. Sci. 49 (1994): 5585–5601.
B.4. Drying Oil Production, Unit 500

24
Drying oils are used as additives to paints and varnishes to aid in the drying process when these products are applied to surfaces. The facility manufactures drying oil (DO) from acetylated castor oil (ACO). Both of these compounds are mixtures. However, for simulation purposes, acetylated castor oil is modeled as palmitic (hexadecanoic) acid (C15H31COOH) and drying oil is modeled as 1-tetradecene (C14H28). In an undesired side reaction, a gum can be formed, which is modeled as 1-octacosene (C28H56).
B.4.1 Process Description
The process flow diagram is shown in Figure B.4.1. ACO is fed from a holding tank where it is mixed with recycled ACO. The ACO is heated to reaction temperature in H-501. The reaction does not require a catalyst, since it is initiated at high temperatures. The reactor, R-501, is simply a vessel with inert packing to promote radial mixing. The reaction is quenched in E-501. Any gum that has been formed is removed by filtration. There are two holding vessels, V-502 A/B. One of them is used to hold reaction products, while the other one feeds the filter (not shown). This allows a continuous flow of material into Stream 7. In T-501 the ACO is separated and recycled, and in T-502, the DO is purified from the acetic acid. The contents of Streams 11 and 12 are cooled (exchangers not shown) and sent to storage.
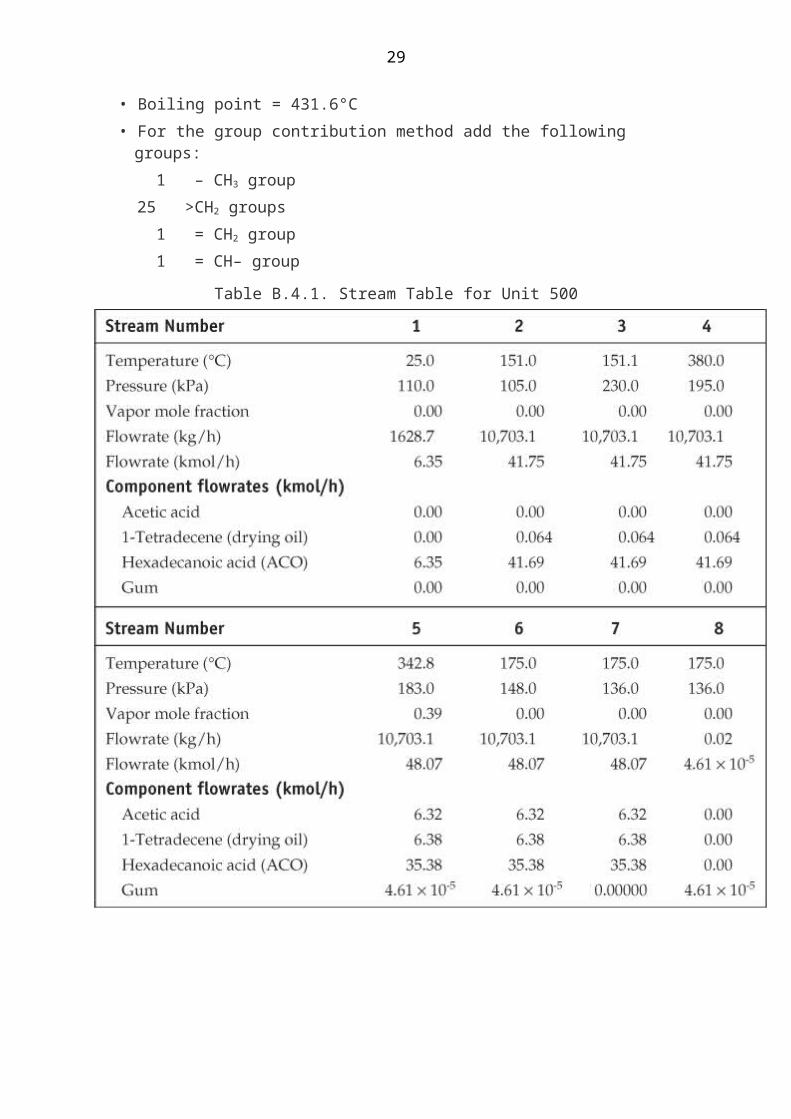
Stream summary tables, utility summary tables, and major equipment specifications are shown in Tables B.4.1–B.4.3.
B.4.2 Reaction Kinetics
The reactions and reaction kinetics are adapted from Smith [1] and are as follows:
where
and
The units of reaction rate, ri, are kmol/m3s, and the activation energy is in cal/mol (which is equivalent to kcal/kmol).

25
Figure B.4.1. Unit 500: Drying Oil Process Flow Diagram
B.4.3 Simulation (CHEMCAD) Hints
If you want to simulate this process and 1-octacosene is not a compound in your simulator’s database, you can add gum as a compound to the simulator databank using the following physical properties:
• Molecular weight = 392
• Boiling point = 431.6°C
• For the group contribution method add the following groups:
1 – CH3 group
25 >CH2 groups
1 = CH2 group
1 = CH– group

26
Table B.4.1. Stream Table for Unit 500

27
Table B.4.2. Utility Summary Table for Unit 500

28
Table B.4.3. Major Equipment Summary for Unit 500
29
B.4.4 Reference
1. Smith, J. M., Chemical Engineering Kinetics, 3rd ed. (New York: John Wiley and Sons, 1981), 224–228.
B.5. Production Of Maleic Anhydride From Benzene, Unit 600
Currently, the preferred route to maleic anhydride in the United States is via isobutene in fluidized-bed reactors. However, an alternative route via benzene may be carried out using a shell-and-tube reactor, with catalyst in the tubes and a cooling medium being circulated through the shell [1, 2].
B.5.1 Process Description
A process flow diagram for the reactor section of the maleic anhydride process is shown in Figure B.5.1. Benzene is vaporized in E-601, mixed with compressed air, and then heated in a fired heater, H-601, prior to being sent to a packed-bed catalytic reactor, R-601, where the following reactions take place:

30
All the reactions are highly exothermic. For this reason, the ratio of air to benzene entering the reactor is kept very high. A typical inlet concentration (Stream 6) of approximately 1.5 vol% of benzene in air is used. Cooling is achieved by circulating molten salt (a mixture of sodium nitrite and sodium nitrate) cocurrently through the shell of the reactor and across the tubes containing the catalyst and reactant gases. This molten salt is cooled in two external exchangers—E-602 and E-607—prior to returning to the reactor.
The reactor effluent, Stream 7—containing small amounts of unreacted benzene, maleic anhydride, quinone, and combustion products—is cooled in E-603 and then sent to an absorber column, T-601, which has both a reboiler and condenser. In T-601, the vapor feed is contacted with recycled heavy organic solvent (dibutyl phthalate), Stream 9. This solvent absorbs the maleic anhydride, quinone, and small amounts of water. Any water in the solvent leaving the bottom of the absorber, T-601, reacts with the maleic anhydride to form maleic acid, which must be removed and purified from the maleic anhydride. The bottoms product from the absorber is sent to a separation tower, T-602, where the dibutyl phthalate is recovered as the bottoms product, Stream 14, and recycled back to the absorber. A small amount of fresh solvent, Stream 10, is added to account for losses. The overhead product from T-602, Stream 13, is sent to the maleic acid column, T-603, where 95 mol% maleic acid is removed as the bottoms product.
The overhead stream is taken to the quinone column, T-604, where 99 mol% quinone is taken as the top product and 99.9 mol% maleic anhydride is removed as the bottoms product. These last two purification columns are not shown in Figure B.5.1 and are not included in the current analysis.
Stream summaries, utility summaries, and equipment summaries are presented in Tables B.5.1–B.5.3.

31
Figure B.5.1. Unit 600: Maleic Anhydride Process Flow Diagram

32
Table B.5.1. Stream Table for Unit 600
Table B.5.2. Utility Summary Table for Unit 600

33
Table B.5.3. Major Equipment Summary for Unit 600

34

35
B.5.2 Reaction Kinetics
The reactions and reaction kinetics [3] given in Equations (B.5.1)–(B.5.4) are given by the expression
where
The units of reaction rate, ri, are kmol/m3(reactor)s, the activation energy is given in cal/mol (which is equivalent to kcal/kmol), the units of ki are m3(gas)/m3 (reactor)s, and the units of concentration are kmol/m3(gas).
The catalyst is a mixture of vanadium and molybdenum oxides on an inert support. Typical inlet reaction temperatures are in the range of 350°C to 400°C. The catalyst is placed in 25 mm diameter tubes that are 3.2 m long. The catalyst pellet diameter is 5 mm. The maximum temperature that the catalyst can be exposed to without causing irreversible damage (sintering) is 650°C. The packed-bed reactor should be costed as a shell-and-tube exchanger. The heat transfer area should be calculated based on the total external area of the catalyst-filled tubes required from the simulation. Because of the high temperatures involved, both the shell and the tube material should be stainless steel. An overall heat transfer coefficient for the reactor should be set as 100 W/m2°C. (This is the value specified in the simulation.)
B.5.3 Simulation (CHEMCAD) Hints
The CHEMCAD simulation used to generate the PFD shown in Figure B.5.1 has several simplifications that are valid for this system. The removal of trace amounts of noncondensables is achieved after the absorber using a component separator, which avoids problems with column convergence downstream. The formation of maleic acid is

36
simulated by using a stoichiometric reactor and setting the conversion of water to 1.
Tower T-601, the maleic anhydride scrubber, is simulated using the rigorous tower simulator. Tower T-602, the dibutyl phthalate tower, is simulated using the Shortcut column module. Currently, there is no experimental vapor pressure data for the components in this simulation. It appears that the vapor pressures of the components differ widely, and no azeotropes are known at this time. For this reason, the ideal vapor pressure K-value option and the latent heat enthalpy option are used.
In order to simulate the temperature spike in the reactor, the reactor is simulated as a cocurrent, packed-bed kinetic reactor, with a molten salt stream as the utility. This configuration provides a greater temperature differential at the front end of the reactor, where the reaction rate is highest. Countercurrent flow could be investigated as an alternative. The kinetics given above are used in the simulation. Dimensions of the reactor tubes are given in Section B.5.2.
B.5.4 References
1. Felthouse, T. R., J. C. Burnett, B. Horrell, M. J. Mummey, and Y-J Kuo, “Maleic Anhydride, Maleic Acid, and Fumaric Acid,” Kirk-Othmer Encyclopedia of Chemical Technology, online version (New York: John Wiley and Sons, 2001).
2. “Maleic Acid and Anhydride,” Encyclopedia of Chemical Processing and Design, Vol. 29, ed. J. J. McKetta (New York: Marcel Dekker, 1984), 35–55.
3. Wohlfahrt, Emig G., “Compare Maleic Anhydride Routes,” Hydrocarbon Processing, June 1980, 83–90.
B.6. Ethylene Oxide Production, Unit 700
Ethylene oxide is a chemical used to make ethylene glycol (the primary ingredient in antifreeze). It is also used to make polyethylene oxide, and both the low-molecular-weight and high-molecular-weight polymers have many applications including as detergent additives. Because ethylene oxide is so reactive, it has many other uses as a reactant. However, because of its reactivity, danger of explosion, and toxicity, it is rarely shipped outside the manufacturing facility but instead is often pumped directly to a nearby consumer.
B.6.1 Process Description [1, 2]
The process flow diagram is shown in Figure B.6.1. Ethylene feed (via pipeline from a neighboring plant) is mixed with recycled ethylene and mixed with compressed and dried air (drying step not shown), heated, and then fed to the first reactor. The reaction is exothermic, and medium-pressure steam is made in the reactor shell. Conversion in the reactor is kept low to enhance selectivity for the desired product. The reactor effluent is cooled, compressed, and sent to a scrubber, where ethylene oxide is absorbed by water. The vapor from the scrubber is heated, throttled, and sent to a second reactor, followed by a second series of

37
cooling, compression, and scrubbing. A fraction of the unreacted vapor stream is purged, with the remainder recycled to recover unreacted ethylene. The combined aqueous product streams are mixed, cooled, throttled, and distilled to produce the desired product. The required purity specification is 99.5 wt% ethylene oxide.
Figure B.6.1. Unit 700: Ethylene Oxide Process Flow Diagram

38
Table B.6.1. Stream Table for Unit 700

39

40

41
Table B.6.2 Utility Summary Table for Unit 700

42
Table B.6.3. Major Equipment Summary for Unit 700

43

44
Stream summary tables, utility summary tables, and major equipment specifications are shown in Tables B.6.1–B.6.3.
B.6.2 Reaction Kinetics
The pertinent reactions (adapted from Stoukides and Pavlou [3]) are as follows:
The kinetic expressions are, respectively,

45
The units for the reaction rates are moles/m3 s. The pressure unit is bar. The activation energy numerator is in cal/mol. The catalyst used for this reaction is silver on an inert support. The support consists of 7.5 mm diameter spheres that have a bulk density of 1250 kg/m3 and a void fraction of 0.4.
B.6.3 Simulation (CHEMCAD) Hints
The following thermodynamics packages are strongly recommended for simulation of this process.
• K-values: Use a global model of PSRK but use UNIFAC as a local model for T-701 and T-702.
• Enthalpy: Use SRK.
B.6.4 References
1. Dever, J. P., K. F. George, W. C. Hoffman, and H. Soo, “Ethylene Oxide,” Kirk-Othmer Encyclopedia of Chemical Technology, online version (New York: John Wiley and Sons, 2004).
2. “Ethylene Oxide,” Encyclopedia of Chemical Processing and Design, Vol. 20, ed. J. J. McKetta (New York: Marcel Dekker, 1984), 274 –318.
3. Stoukides, M., and S. Pavlou, “Ethylene Oxidation on Silver Catalysts: Effect of Ethylene Oxide and of External Transfer Limitations,” Chem. Eng. Commun. 44 (1986): 53–74.

46
B.7. Formalin Production, Unit 800
Formalin is a 37 wt% solution of formaldehyde in water. Formaldehyde and urea are used to make urea-formaldehyde resins that subsequently are used as adhesives and binders for particle board and plywood.
B.7.1 Process Description [1, 2]
Unit 800 produces formalin (37 wt% formaldehyde in water) from methanol using the silver catalyst process. Figure B.7.1 illustrates the process.
Air is compressed and preheated, fresh and recycled methanol is pumped and preheated, and these two streams are mixed to provide reactor feed. The feed mixture is about 39 mol% methanol in air, which is greater than the upper flammability limit for methanol. (For methanol, UFL = 36 mol%; LFL = 6 mol%.) In the reactor, the following two reactions occur:
The reactor is a unique configuration, in which the silver catalyst is in the form of wire gauze, suspended above a heat exchanger tube bank. Because the net reaction is very exothermic, the heat generated in the adiabatic reactor section must be removed quickly, hence the close proximity of the heat-exchanger tubes. The heat exchanger resembles a pool boiler, with a pool of water on the shell side. If the temperature of the effluent is too high, the set point on the steam pressure line is lowered to increase the vaporization of boiler feed water (bfw). In general, the liquid-level controller on the bfw is adjusted to keep the tube bundle fully immersed. The reactor effluent enters an absorber in which most of the methanol and formaldehyde are absorbed into water, with most of the remaining light gases purged into the off-gas stream. The methanol, formaldehyde, and water enter a distillation column, in which the methanol overhead is recycled; the bottoms product is a formaldehyde/water mixture that contains ≤ 1wt% methanol as an inhibitor. This mixture is cooled and sent to a storage tank, which is sized at four days’ capacity. This storage tank is essential, because some of the downstream processes are batch. The composition in the storage tank exceeds 37 wt% formaldehyde, so the appropriate amount of water is added when the downstream process draws from the storage tank. This is not shown in the PFD (Figure B.7.1).
Figure B.7.1. Unit 800: Formalin Process Flow Diagram
Storage of formaldehyde/water mixtures is tricky. At high temperatures, undesirable polymerization of formaldehyde is inhibited, but formic acid formation is favored. At low temperatures, acid formation is inhibited, but

47
polymerization is favored. There are stabilizers that inhibit polymerization, but they are incompatible with resin formation. Methanol, at concentrations between 5 wt% and 15 wt%, can also inhibit polymerizaton, but no separation equipment for methanol currently exists on site, and methanol greater than 1 wt% also causes defective resin production. With ≤1 wt% methanol, the storage tank contents must be maintained between 35°C and 45°C.
Stream summary tables, utility summary tables, and major equipment specifications are shown in Tables B.7.1–B.7.3.
B.7.2 Reaction Kinetics
Due to the very high temperature and large surface area of the wire gauze, the reaction may be considered to be instantaneous.
B.7.3 Simulation (CHEMCAD) Hints
Solutions of formaldehyde and water are very nonideal. Individually, the volatilities are, from most volatile to least volatile, formaldehyde, methanol, and water. However, formaldehyde associates with water so that when this three-component mixture is distilled, methanol is the light key and water is the heavy key. The formaldehyde will “follow” the water. The ESDK K-value package in CHEMCAD simulates this appropriately and was used for the simulation presented here. Latent heat should be used for enthalpy calculations. The expert system will recommend these choices. Alternatively, the data provided in Table B.7.4 can be used directly or to fit an appropriate nonideal VLE model.

48
Table B.7.1. Stream Table for Unit 800

49
Table B.7.2. Utility Summary Table for Unit 800
Table B.7.3. Major Equipment Summary for Unit 800

50
When simulating an entire process, it is recommended to first use the Shortcut distillation column within the process for the methanol-water/formaldehyde distillation. A rigorous column solver should then be used as a separate item to simulate the column based on the results obtained from the Shortcut column. However, due to the nonideality of the thermodynamics, the actual column simulation using the rigorous column will probably require many more stages than predicted by the shortcut simulation, possibly twice the number. Once the parameters for the rigorous column have been established, the Shortcut column can be replaced by the rigorous column and the simulation rerun to get a converged simulation.

51
Table B.7.4. K-values for Formaldehyde/Water/Methanol System [3]
B.7.4 References
1. Gerberich, H. R., and G. C. Seaman, “Formaldehyde,” Kirk-Othmer Encyclopedia of Chemical Technology, online version (New York: John Wiley and Sons, 2004).
2. “Formaldehyde,” Encyclopedia of Chemical Processing and Design, Vol. 23, ed. J. J. McKetta (New York: Marcel Dekker, 1984), 350–371.
3. Gmehling, J., U. Onken, and W. Arlt, Vapor-Liquid Equilibrium Data Collection, Chemistry Data Series (Aqueous-Organic Systems, Supplement 1), Vol. 1, Part 1a, DECHEMA, 1981, 474–475.
B.8. Batch Production Of L-Phenylalanine And L-Aspartic Acid, Unit 900
Phenlyalanine and L-aspartic acid are amino acids. When they bond together, the corresponding di-peptide methyl ester is aspartame, known by the brand name NutraSweet or Equal. Production of both amino acids can be accomplished via fermentation of genetically altered bacteria. Production rates of 1000 and 1250 tonnes/y of L-aspartic acid and L-phenylalanine are desired.
B.8.1 Process Description
To accomplish a fermentation process, bacteria must grow in the presence of appropriate nutrients that facilitate the production of the desired product. In a processing context, the fermentation reactor must first be primed with the bacteria and the nutrients. The nutrient feed includes the reactant that the bacteria metabolize to produce the desired amino acid. Air is also sparged into the fermenter as a source of oxygen. All of these feeds are passed through sterilization filters prior to entering the reactor. The bacteria are then allowed to multiply, and the desired product, an amino acid in this case, is produced. In this process, both products are extracellular. After the desired production level of the amino acid is reached, the fermentation broth pH is lowered by addition of sulfuric acid, the bacteria are removed from the fermentation broth by

52
filtration, and the product stream is sent to a holding tank. The addition of acid titrates the amino acid, making it positively charged. The addition of acid is done only for phenylalanine, because L-aspartic acid bypasses the ion exchange column and is crystallized directly via precipitation from solution.
In this process, both amino acids are produced in the same facility. Because fermentation is involved and production levels are low compared with typical commodity chemicals, batch processes are involved. In batch processes, the key variable is the batch time, or the length of time that the unit is allowed to run. For example, in a batch reactor, the batch time is analogous to the space time in a continuous reactor.
The separation sequence is a continuous process, which is accomplished by a continuous feed from the holding tank. This is not uncommon in batch facilities, because many separation processes are more easily accomplished in the continuous mode. The separation sequence for the two amino acids differs slightly. Phenylalanine is isolated using ion exchange followed by crystallization; in contrast, L-aspartic acid is crystallized directly from the filtered fermentation broth. For phenylalanine, it is adsorbed on the ion exchange resin and subsequently eluted using a basic solution. The addition of base neutralizes the positive charge to promote desorption from the ion exchange resin. For both amino acids, filtration follows crystallization. The product is then sent to storage. The process is shown in Figure B.8.1.
The use of batch processing requires batch scheduling of the type discussed in Chapter 3, which allows use of the same equipment to manufacture both amino acids in the same facility. In this description, only the PFD, reactor calculations, and general descriptions of the separation units are presented. The design of individual equipment, the utility consumption, and the production schedule for the plant are left as exercises for the student. A description of a process to produce four amino acids (including the two amino acids in this process) in the same facility is available at http://www.che.cemr.wvu.edu/publications/projects/large_proj/batch-production_of_amino_acids.pdf. This process description includes possible batch schedules for both the reactors and the separation section.
B.8.2 Reaction Kinetics
L-Aspartic Acid. The reaction of fumaric acid to form L-aspartic acid is an enzymatic conversion carried out using the aspartase activity of bacteria Escherichia coli (E. coli) cells according to the following reaction:
The bacteria cells are suspended in a matrix polyacrylamide gel, and the reacting species must diffuse in and out of the matrix. The diffusivities of the substrate (fumaric acid) and product (L-aspartic acid) in the gel

53
decrease as their concentrations increase due to the tendency of the gel to shrink at low pH.
The kinetic model for this reaction follows a Michaelis-Menten form for a reversible reaction, which rearranges to
where
CFA is the concentration of fumaric acid (kmol/m3).
CAA is the concentration of L-aspartic acid (kmol/m3).
is the concentration of ammonium ions (kmol/m3).
K is a reaction equilibrium constant (m3/kmol).
Va is the apparent rate of production of L-aspartic acid (kmol/h/kg-gel).
Va,max is the apparent maximum rate of production of L-aspartic acid (kmol/h/kg-gel).
Ka,M is the apparent Michaelis constant for the reaction (kmol/m3).
Reaction rate parameters have been modified from reference [1] and are used for the current process using a 1.0 M substrate solution at a reaction temperature of 32°C.

54
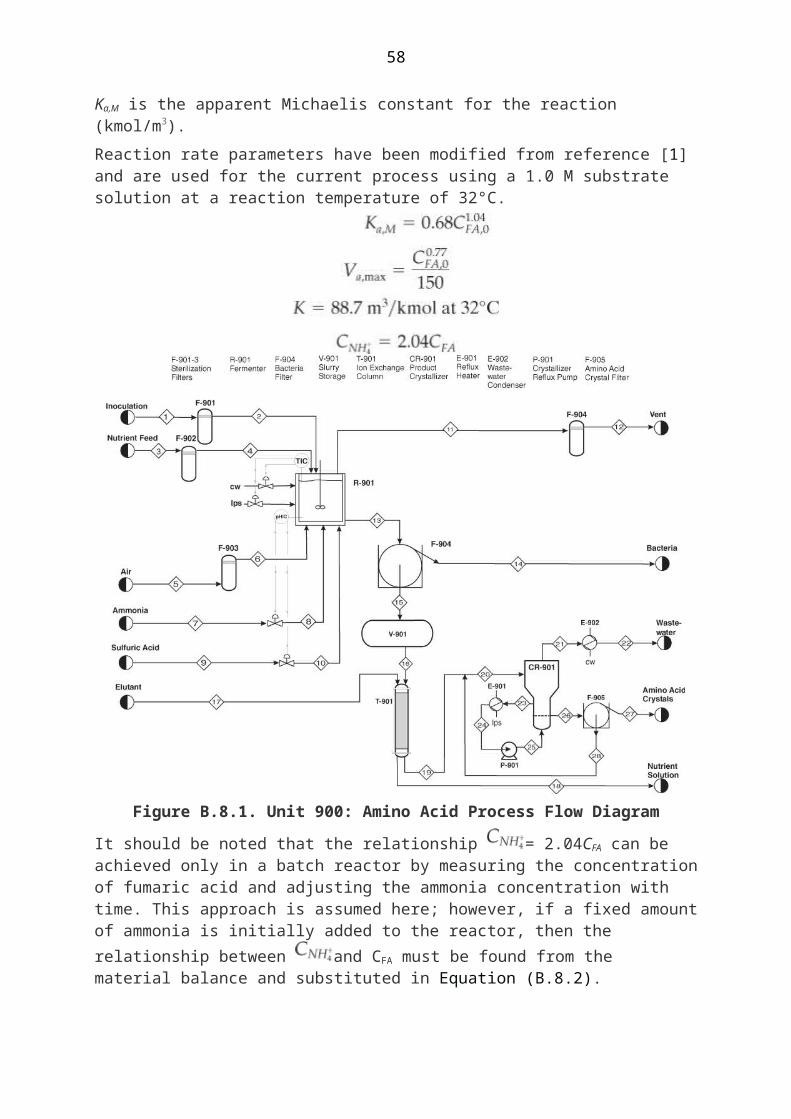
Figure B.8.1. Unit 900: Amino Acid Process Flow Diagram
It should be noted that the relationship = 2.04CFA can be achieved only in a batch reactor by measuring the concentration of fumaric acid and adjusting the ammonia concentration with time. This approach is assumed here; however, if a fixed amount of ammonia is initially added to
the reactor, then the relationship between and CFA must be found from the material balance and substituted in Equation (B.8.2).
Substituting the above values into Equation (B.8.2) and using the conversion, X, of fumaric acid (CFA = CFA,0(1 – X) and CAA = CFA,0X), we get
where
V is the volume of the reacting mass in the reactor (m3).
W is the weight of the gel (kg) = V(1-ε)ρbead.
εis the void fraction of beads in the reacting mass.
ρbead is the bead density (kg/m3).
Substituting into Equation (B.8.3), we have

55
For the specified initial concentration of fumaric acid of 1.0M = 1 kmol/m3 and with ρbead ~ 1000 kg/m3 and assuming a voidage of 0.5, Equation (B.8.4) simplifies to
Separating variables and integrating Equation (B.8.5) yield the conversion as a function of batch reaction time. This relationship is shown in Figure B.8.2.
Figure B.8.2. Conversion of Fumaric Acid to L-Aspartic Acid as a Function of Reaction Time
Preliminary Sizing of Reactor R-901. For a conversion of 45% (90% of equilibrium), a reaction time of approximately 30 h is required. Assuming that an additional 5 h is required for filling, cleaning, and heating, the total time for the reaction step is 35 h.
Using a reactor size of 37.9 m3 (10,000 gal) and assuming a 90% fill volume and a voidage of 0.5, the amount of fumaric acid fed to the batch is (37.9)(0.9)(0.5) = 17.04 m3, or 17.04 kmol (17.04 × 116 = 1977 kg). The amount of L-aspartic acid produced = (17.04)(0.45) = 7.67 kmol = (7.67)(133) = 1020 kg.
Production rate of L-aspartic acid from a 10,000 gallon reactor is 1020 kg/batch using a batch time of 35 h.
L-Phenylalanine. L-phenylalanine is produced via fermentation using a mutant Brevibacterium lactofermentum 2256 (ATCC No. 13869) known as No. 123 [2]. The rate equations for biomass (bacteria, X), substrate (mainly glucose, S), and product (L-phenylalanine, P) are described by Monod kinetics.

56
where
X is the concentration of bacteria (kg/m3).
S is the concentration of substrate (glucose) (kg/m3).
P is the concentration of product (L-phenylalanine) (kg/m3).
μm is the maximum specific growth rate (h–1).
Ks is the Monod constant (kg/m3).
YXS is biomass yield.
YPS is product yield.
According to Tsuchida et al. [2], for a culture medium containing 13% glucose, 1% ammonium sulfate, and 1.2% fumaric acid (plus other trace nutrients, etc.) the yield of L-phenylalanine was 21.7 mg/ml after 72 h of cultivation at a temperature of 31.5°C. This represents a yield of approximately 16.7% from glucose by weight. Other amino acids are also produced in small quantities (<5 kg/m3), with lysine making up approximately 50%.
To obtain a kinetic model of the growth of bacteria and subsequent production of L-phenylalanine and depletion of glucose, the parameters in Equations (B.8.6)–(B.8.8) were back-calculated to give best-fit profiles of X, S, and P compared to published values ([2], Figure 4). The parameter values are shown in Table B.8.1, and the profiles are plotted in Figure B.8.3.
Preliminary Sizing of Reactor R-901. For a reaction time of approximately 60 h, the final concentration of L-phenylalanine is 21.0 kg/m3. Assuming an additional 5 h for filling, cleaning, and heating gives a total reactor step time of 65 h.

57
Table B.8.1. Best-Fit Parameters for Monod Kinetics Using Brevibacterium lactofermentum 2256 (ATCC No. 13869) Strain No.
123
Using a 37.9 m3 (10,000 gal) reactor for the fermentation and assuming that a 90% fill volume is used, the volume of reactants is (37.9)(0.9) = 34.11 m3.
The amount of L-phenylalanine produced in a 60 h batch reaction is (34.11)(21.0) = 716 kg.
Production rate of L-aspartic acid from a 10,000 gallon reactor is 716 kg/batch, with a reactor step time of 65 h.
Preliminary Information on Other Equipment. As mentioned in the process description, the production of both L-aspartic acid and L-phenylalanine follows similar paths. A brief discussion of the unit operations involved with the separation and purification of the final products is in order, because these operations are not typical of the unit operations covered in this text. Size information is not included for the equipment described next; however, estimates of processing times, where applicable, are given.
Filtration of Bacteria. After reaction, the bacteria must be filtered from the mother liquor prior to storage. The bacteria tend to give rise to slimy filter cakes, and the filtration of such material is best accomplished using a rotary drum filter utilizing a precoat. Typical precoating materials are dolomite, perlite, and cellulose, and these are applied to the drum in a two-stage process prior to filtration. The precoating process involves depositing a layer of the precoat material (5–15 cm thick) on the drum prior to the filtration operation. Once the precoat has been applied, the filtration starts, and the biomass forms a thin layer on the precoat. This layer of biomass is continuously removed, along with a thin layer of the precoat material, using a sharp-edged “Doctor” blade. Additional information is given at http://www.solidliquid-separation.com [3]. Without doing detailed calculations, it is difficult to determine the time required for the precoat stage and filtration stages. For this project you may assume that these steps take 25 h and 5 h, respectively.
58
Figure B.8.3. Concentration Profiles as a Function of Reaction Time
Intermediate Storage. The fermentation broth (free of solids, or biomass) leaving the filters is stored in an intermediate storage tank prior to being sent to the ion exchange column (for L-phenylalanine) and on to the crystallizer. The use of an intermediate storage vessel allows the remainder of the process to operate as a continuous process.
Ion Exchange Column. The ion exchange columns operate as semibatch processes. Hydrochloric acid is added to the L-phenylalanine-containing solution and is passed through freshly regenerated ion exchange resin such as Dow’s DOWEX MARATHON C [4]. The resin captures the positively charged amino acid. Once the bed is full, it is back-washed with a basic solution of ammonium or sodium hydroxide, which breaks the resin amino acid bond. The resin is subsequently washed free of the hydroxide, and the cycle starts again.
Continuous Crystallizer and Filtration. Draft tube baffle crystallizers can be used for the crystallization of L-aspartic acid and L-phenylalanine. These crystallizers offer the advantages of high circulation rates for efficient mixing. Fines removal is facilitated through the use of baffles, and a certain amount of product classification (crystal size control) is obtained through the elutriating leg. Batch crystallizers could also be used, but product quality and efficiency suffer. The saturated liquid from the crystallizer, containing amino acid crystals, is sent to a filter (such as a rotary drum filter), where the crystals are removed and sent for washing, drying, and packaging. The saturated liquid is returned to the crystallizer for further product recovery, thereby increasing the efficiency of the operation. Both amino acids can be crystallized at temperatures greater than 100°C. Therefore, the crystallization may take place at ambient pressure by removing the excess water through evaporation. The solubilities of L-aspartic acid and L-phenylalanine at 100°C are 67 g/liter and 100 g/liter, respectively.
B.8.3 References
1. Takamatch, T., K. Yamashita, and A. Sumi, “Kinetics of Production of L-Aspartic Acid by Aspartase of Immobilized E. Coli Cells,”

59
Japanese Journal of Fermentation Technology 58, no. 2 (1980): 129–133.
2. Tsuchida, T., K. Kubota, Y. Morinaga, H. Matsui, H. Enei, and F. Yoshinga, “Production of L-Phenylalanine by a Mutant of Brevibacterium lactofermentum 2256,” Agric. Bio. Chem. 51, no. 8 (1987): 2095–2101.
3. http://www.solidliquid-separation.com.
4. DOWEX MARATHON C data sheet, http://www.dow.com/PublishedLiterature/dh_0082/0901b80380082af5.pdf?filepath=liquidseps/pdfs/noreg/17701593.pdf&fromPage=GetDoc.
B.9. Acrylic Acid Production Via The Catalytic Partial Oxidation Of Propylene [1, 2, 3, 4, 5], Unit 1000
Acrylic acid (AA) is used as a precursor for a wide variety of chemicals in the polymer and textile industries. There are several chemical pathways to produce AA, but the most common one is via the partial oxidation of propylene. The usual mechanism for producing AA utilizes a two-step process in which propylene is first oxidized to acrolein and then further oxidized to AA. Each reaction step usually takes place over a separate catalyst and at different operating conditions. The reaction stoichiometry is given below:
Several side reactions may occur, most resulting in the oxidation of reactants and products. Some typical side reactions are given below:
Therefore, the typical process setup consists of a two-reactor system, with each reactor containing a separate catalyst and operating at conditions so as to maximize the production of AA. The first reactor typically operates at a higher temperature than the second.
As with any reaction involving the partial oxidation of a fuel-like feed material (propylene), considerable attention must be paid to the composition of hydrocarbons and oxygen in the feed stream. In the

60
current design, a fluidized-bed reactor is used, which provides essentially isothermal conditions in the reactor and, with the addition of large amounts of steam, allows safe and stable operation. The second safety concern is associated with the highly exothermic polymerization of AA, which occurs in two ways. First, if this material is stored without appropriate additives, then free radical initiation of the polymerization can occur. This potentially disastrous situation is discussed by Kurland and Bryant [1]. Second, AA dimerizes when in high concentrations at temperatures greater than 90°C, and thus much of the separation sequence must be operated under high vacuum in order to keep the bottom temperatures in the columns below this temperature.
B.9.1. Process Description
The process shown in Figure B.9.1 produces 50,000 metric tons per year of 99.9% by mole AA product. The number of operating hours is taken to be 8000/y, and the process is somewhat simplified because there is only one reactor [5]. It is assumed that both reactions take place on a single catalyst to yield AA and by-products. It is imperative to cool the products of reaction quickly to avoid further oxidation reactions, and this is achieved by rapidly quenching the reactor effluent with a cool recycle, Stream 8, of dilute aqueous AA in T-1001. Additional recovery of AA and acetic acid (a by-product) is achieved in the absorber, T-1002. The stream leaving the absorption section is a dilute aqueous acid, Stream 9. This is sent to a liquid-liquid extractor, T-1003, to remove preferentially the acid fraction from the water prior to purification. There are many possible solvents that can be used as the organic phase in the separation; high solubility for AA and low solubility for water are desirable. Some examples include ethyl acrylate, ethyl acetate, xylene, diisobutyl ketone, methyl isobutyl ketone, and diisopropyl ether (DIPE), which is used here. The organic phase from T-1003 is sent to a solvent recovery column, T-1004, where the diisopropyl ether (and some water) is recovered overhead and returned to the extractor. The bottom stream from this column, Stream 14, contains virtually all the AA and acetic acid in Stream 9. This is sent to the acid purification column, T-1005, where 95% by mole acetic acid by-product is produced overhead, and 99.9% by mole AA is produced as a bottoms product and cooled prior to being sent to storage.

61
Figure B.9.1. Unit 1000: Production of Acrylic Acid from Propylene PFD (The point where Streams 1 and 2 are mixed with Stream 3 to
form Stream 4 actually occurs within Reactor R-1001.)
The aqueous phase from the extractor, Stream 12, is sent to a wastewater column, T-1006, where a small amount of DIPE is recovered overhead and returned to the extractor. The bottoms product, containing water and trace quantities of solvent and acid, is sent to wastewater treatment. Process stream information and preliminary equipment summaries are given in Tables B.9.1 and B.9.2, respectively. A utility summary is also provided in Table B.9.3.
B.9.2. Reaction Kinetics and Reactor Configuration
The reactions taking place are kinetically controlled at the conditions used in the process; that is, equilibrium lies far to the right. The reaction kinetics for the catalyst used in this process are given below:
where
Table B.9.1. Stream Table for Unit 1000

62
Table B.9.2. Preliminary Equipment Summary Table for Unit 1000

63
Table B.9.3. Utility Summary Table for Unit 1000
Partial pressures are in kPa, and the activation energies and preexponential terms for re-actions 1–3 are as follows:

64
The reactor configuration used for this process is a fluidized bed, and it is assumed that the bed of catalyst behaves as a well-mixed tank—that is, it is isothermal at the temperature of the reaction (310°C). The gas flow is assumed to be plug flow through the bed, with 10% of the gas bypassing the catalyst. This latter assumption is made in order to simulate the gas channeling that occurs in real fluid-bed reactors.
B.9.3. Simulation (CHEMCAD) Hints
The use of a liquid-liquid extractor requires the use of a thermodynamic package (or physical property data) that reflects the fact that two phases are formed and that significant partitioning of the AA and acetic acid occurs, with the majority going to the organic phase (in this case DIPE). Distribution coefficients for the organic acids in water and DIPE as well as mutual solubility data for water/DIPE are desirable. The process given in Figure B.2 was simulated using a UNIFAC thermodynamics package and the latent heat enthalpy option on CHEMCAD and should give reasonable results for preliminary process design. Much of the process background material and process configuration was taken from the 1986 AIChE student contest problem in reference [5]. The kinetics presented above are fictitious but should give reasonable preliminary estimates of reactor size.
B.9.4 References
1. Kurland, J. J., and D. B. Bryant, “Shipboard Polymerization of Acrylic Acid,” Plant Operations Progress 6, no. 4 (1987): 203–207.
2. Kirk-Othmer Encyclopedia of Chemical Technology, 3rd ed., Vol. 1 (New York: John Wiley and Sons, 1978), 330–354.
3. Encyclopedia of Chemical Processing and Design, ed. J. J. McKetta and W. A. Cunningham, Vol. 1 (New York: Marcel Dekker, 1976), 402–428.
4. Sakuyama, S., T. Ohara, N. Shimizu, and K. Kubota, “A New Oxidation Process for Acrylic Acid from Propylene,” Chemical Technology, June 1973, 350.
5. “1986 Student Contest Problem,” The AIChE Student Annual 1986, ed. B. Van Wie and R. A. Wills (AIChE, 1986), 52–82.
B.10. Production Of Acetone Via The Dehydrogenation Of Isopropyl Alcohol (IPA) [1, 2, 3, 4], Unit 1100
The prevalent process for the production of acetone is as a by-product of the manufacture of phenol. Benzene is alkylated to cumene, which is further oxidized to cumene hydroperoxide and finally cleaved to yield

65
phenol and acetone. However, the process shown in Figure B.10.1 and discussed here uses isopropyl alcohol (IPA) as the raw material. This is a viable commercial alternative, and a few plants continue to operate using this process. The primary advantage of this process is that the acetone produced is free from trace aromatic compounds, particularly benzene. For this reason, acetone produced from IPA may be favored by the pharmaceutical industry due to the very tight restrictions placed on solvents by the Food and Drug Administration (FDA). The reaction to produce acetone from IPA is as follows:
Figure B.10.1. Unit 1100: Production of Acetone from Isopropyl Alcohol PFD
The reaction conditions are typically 2 bar and 350°C, giving single-pass conversions of 85%–92%.
B.10.1. Process Description
Referring to Figure B.10.1, an azeotropic mixture of isopropyl alcohol and water (88 wt% IPA) is fed into a surge vessel (V-1101), where it is mixed with the recycled unreacted IPA/water mixture, Stream 14. This material is then pumped and vaporized prior to entering the reactor. Heat is provided for the endothermic reaction using a circulating stream of molten salt, Stream 4. The reactor effluent, containing acetone, hydrogen, water, and unreacted IPA, is cooled in two exchangers prior to entering the phase separator (V-1102). The vapor leaving the separator is scrubbed with water to recover additional acetone, and then this liquid is combined with the liquid from the separator and sent to the separations section. Two towers are used to separate the acetone product (99.9 mol%) and to remove the excess water from the unused IPA, which is then recycled back to the front end of the process as an azeotropic mixture. Stream summaries, preliminary equipment, and utility summaries are given in Tables B.10.1, B.10.2, and B.10.3, respectively.
B.10.2. Reaction Kinetics

66
The reaction to form acetone from isopropyl alcohol (isopropanol) is endothermic, with a standard heat of reaction of 62.9 kJ/mol. The reaction is kinetically controlled and occurs in the vapor phase over a catalyst. The reaction kinetics for this reaction are first order with respect to the concentration of alcohol and can be estimated from the following equation [3, 4]:
where
In practice, several side reactions can occur to a small extent. Thus, trace quantities of propylene, diisopropyl ether, acetaldehyde, and other hydrocarbons and oxides of carbon can be formed [1]. The noncondensables are removed with the hydrogen, and the aldehydes and ethers may be removed with acid washing or adsorption. These side reactions are not accounted for in this preliminary design.
For the design presented in Figure B.10.1, the reactor was simulated with catalyst in 2-in (50.4 mm) diameter tubes, each 20 ft (6.096 m) long, and with a cocurrent flow of a heat transfer medium on the shell side of the shell-and-tube reactor. The resulting arrangement gives a 90% conversion of IPA per pass.
B.10.3. Simulation (CHEMCAD) Hints
Isopropyl alcohol and water form a minimum boiling point azeotrope at 88 wt% isopropyl alcohol and 12 wt% water. Vapor-liquid equilibrium (VLE) data are available from several sources and can be used to back-calculate binary interaction parameters or liquid-phase activity coefficients. The process presented in Figure B.3 and Table B.6 was simulated using the UNIQUAC VLE thermodynamics package and the latent heat enthalpy option in the CHEMCAD simulator. This package correctly predicts the formation of the azeotrope at 88 wt% alcohol.
B.10.4 References
1. Kirk-Othmer Encyclopedia of Chemical Technology, 3d ed., Vol. 1 (New York: John Wiley and Sons, 1976), 179–191.
2. Shreve’s Chemical Process Industries, 5th ed., ed. G. T. Austin (New York: McGraw-Hill, 1984), 764.
3. Encyclopedia of Chemical Processing and Design, Vol. 1, ed. J. J. McKetta and W. A. Cunningham (New York: Marcel Dekker, 1976), 314–362.
4. Sheely, C. Q., Kinetics of Catalytic Dehydrogenation of Isopropanol, Ph.D. Thesis, University of Illinois, 1963.
B.11. Production Of Heptenes From Propylene And Butenes [1], Unit 1200
The background information for this process is taken from Chauvel et al. [1]. This example is an illustration of a preliminary estimate of a process

67
to convert a mixture of C3 and C4 unsaturated hydrocarbons to 1-heptene and other unsaturated products. The market for the 1-heptene product would be as a highoctane blending agent for gasoline or in the production of plasticizers. Based on preliminary market estimates, a production capacity of 20,000 metric tons per year of 1-heptene using 8000 operating hours/y was set. This process differs from the other examples in Appendix B in several ways. First, the raw materials to the process contain a wide variety of chemicals. This is typical for oil refinery and some petrochemical operations. Second, no specific kinetic equations are given for the reactions. Instead, the results of laboratory tests using the desired catalyst at different conditions and using different feed materials are used to guide the process engineer to an optimum, or close to an optimum, reactor configuration. The flowsheet in Figure B.11.1 and stream, equipment summary, and utility summary tables, Tables B.11.1–B.11.3, have been developed using such information. It should be noted that a preliminary economic analysis, and hence the feasibility of the process, can be determined without this information, as long as yield and conversion data are available and the reactor configuration can be estimated.
Table B.10.1. Stream Table for Unit 1100
Table B.10.2. Preliminary Equipment Summary Table for Unit 1100

68
Table B.10.3. Utility Summary Table for Unit 1100
B.11.1. Process Description
Two liquid feed streams containing propylene and butene and a stream of catalyst slurried with 1-hexene are mixed at a pressure of approximately 8 bar prior to being sent to the reactor. The reactor consists of five

69
essentially well-mixed sections, with similar concentrations in each section. Heat removal is achieved by using pump-arounds from each stage through external heat exchangers. The reactor effluent is partially vaporized before being fed to the first of three distillation columns. The first column (T-1201) removes the unreacted C3 and C4 components, which are used subsequently as fuel (Stream 7) or sent to LPG storage (Stream 6). The next column (T-1202) separates the 1-hexene product overhead (Stream 10) and sends the bottoms stream to the final column (T-1203). In T-1203, the main 1-heptene product (Stream 13) is taken overhead, and the C8 and heavier compounds are taken as the bottoms product (Stream 14). The bottoms product is processed off-site to remove the heavy material and to recover spent catalyst.
Figure B.11.1. Unit 1200: Production of Heptenes from Propylene and Butenes PFD
B.11.2. Reaction Kinetics
The process given in Figure B.11.1 is based on the liquid-phase catalytic co-dimerization of C3 and C4 olefins using an organometallic catalyst. This catalyst is slurried with a small volume of the hexenes product and fed to the reactor with the feed streams. The volume of the catalyst stream is small compared with the other streams and is not included in the material

70
balance given in Table B.11.1. In 1976 (CEPCI = 183), consumption of catalyst amounted to $9.5/1000 kg of 1-heptene product [1].
The primary reactions that take place are as follows:
Table B.11.1. Stream Table for Unit 1200

71
Table B.11.2. Preliminary Equipment Summary Table for Unit 1200

72

73
Table B.11.3. Utility Summary Table for Unit 1200
In order to maximize the selectivity of the heptene reaction, several reactor configurations were considered [1]. The reactor configuration that maximized the heptene production, in a minimum volume, was found to be a plug flow reactor in which the butene feed was introduced at one end and the propylene stream was injected along the side of the reactor. However, due to other considerations such as reactor complexity, it was finally decided to use a reactor with five equal stages in which the concentration in each stage is maintained approximately the same. Heat removal and mixing in each stage are accomplished by withdrawing a stream of material and pumping it through an external heat exchanger and back into the same stage of the reactor. The liquid cascades downward from stage to stage by means of liquid downcomers. The inside of the reactor can thus be considered similar to a five-plate distillation column (without vapor flow). The distribution of the feeds into the different stages is not shown in Figure B.11.1, and the dimensions of the reactor are taken directly from Chauvel et al. [1].

74
B.11.3. Simulation (CHEMCAD) Hints
All the hydrocarbon components used in the simulation can be considered to be well behaved, that is no azeotrope formation. The simulations were carried out using the SRK VLE and enthalpy packages using the CHEMCAD simulator.
B.11.4. Reference
1. Chauvel, A., P. Leprince, Y. Barthel, C. Raimbault, and J-P Arlie, Manual of Economic Analysis of Chemical Processes, trans. R. Miller and E. B. Miller (New York: McGraw-Hill, 1976), 207–228.
B.12. Design of a Shift Reactor Unit to Convert Co To Co2, Unit 1300
The water-gas shift (WGS) reaction has been traditionally used to produce hydrogen from syngas, which comprises CO and H2. This process can also be used for producing combustion gas with lower levels of carbon from a carbon-rich syngas. The shift reaction is mildly exothermic and equilibrium limited. Therefore, the extent of reaction becomes limited as the temperature increases along the length of the reactor. A two-stage process with interstage cooling is used to achieve the desired extent of conversion. A higher temperature results in a higher reaction rate, and a chromia-promoted iron oxide catalyst is used in the first stage. The second stage operates at a comparatively lower temperature, where a copper-zinc catalyst is used. The main reaction is
B.12.1. Process Description
A process flow diagram for a water-gas shift (WGS) reaction system is shown in Figure B.12.1. The objective of the process is to achieve an overall 90% conversion of CO in the process. Syngas, Stream 1, is first heated in H-1301 before being mixed with steam. The effluent from the first-stage reactor, R-1301, is cooled in E-1301 before being sent to the second reactor stage, R-1302. The residual heat in the effluent from the second-stage reactor is utilized by raising low-pressure steam in E-1302. The reactor effluent is further cooled using cooling water in E-1303 before being sent to the flash separator, V-1301. The off-gas from V-1301 is usually sent to a hydrogen-recovery process or to a combustion system. The bottom product from V-1301 is sent to the wastewater treatment unit.
B.12.2. Reaction Kinetics
The rate equation representing midlife activity of a typical WGS reactor catalyst is given by Rase [1] as
where

75
In this process, the steam/CO ratio can be manipulated to affect the CO conversion. The optimum values can be determined by an economic analysis. A higher steam/CO ratio may result in a shorter overall reactor length and less residual CO, but it adds to the cost due to the use of steam and a larger diameter of the reactor(s) to accommodate the larger flowrate. Table B.12.1 shows stream data for a process using a steam/CO ratio of 3 (molar basis).
B.12.3. Simulation (Aspen Plus) Hints
An Aspen Plus simulation is the basis for the design. The Peng-Robinson equation of state is used for the process side. The Ergun equation is used for calculating the pressure drop in the reactors. It should be noted that the steam/CO ratio affects not only the extent of CO conversion but also the temperature in the reactors. The maximum allowable temperature for the catalysts indicated in Table B.12.3 should not be violated.

76
Figure B.12.1. Unit 1300: Shift Reactor Unit Flow Diagram

77
Table B.12.1. Stream Table for Unit 1300
Table B.12.2. Utility Summary Table for Unit 1300

78
Table B.12.3. Major Equipment Summary for Unit 1300
B.12.4. Reference
1. Rase, H. F., Chemical Reactor Design for Process Plants, Vol. 2: Case Studies and Design Data (New York: John Wiley and Sons, 1977).
B.13. Design of a Dual-Stage Selexol Unit to Remove Co2 and H2S From Coal-Derived Synthesis Gas, Unit 1400
CO2 capture and sequestration from coal-derived syngas is being strongly considered to reduce environmental pollution. Because of a number of advantages, such as lower solvent loss, higher selectivity toward H2S, better thermal stability, better water solubility, and lower circulation rate [1], dimethyl ether of polyethylene glycol (DEPG, Selexol) is very suitable for selective capture of CO2 and H2S when the partial pressure of these acid gases is high.

79
B.13.1. Process Description
A process flow diagram for the dual-stage Selexol unit [1] is shown in Figure B.13.1. The objective of the plant design is to achieve an overall 80% capture of CO2 in the process and to ensure that the H2S content of the clean gas is less than 5 ppmv. In addition, the H2S concentration in Stream 14 should be 45 mol%. In this project, the dual-stage Selexol unit is configured for selective removal of H2S (first stage) and CO2 (second stage) from the sour syngas using the Selexol solvent. Most of the H2S in the syngas is absorbed in the semi-lean solvent as it passes through the H2S absorber. The off-gas from the top of the H2S absorber is sent to the CO2 absorber. A portion of the loaded solvent from the bottom of the CO2 absorber is cooled in a water cooler, chilled, and then sent to the H2S absorber. The rich solvent from the bottom of the H2S absorber is heated by exchanging heat with the lean solvent from the stripper. Then, the syngas goes to a flash vessel (V-1403), called an H2S concentrator, that helps to decrease the CO2 content in the rich solvent. The vapor from the flash vessel is recycled back to the H2S absorber. The bottom stream from the flash vessel goes to the Selexol stripper, which uses a combination of stripping steam and a reboiler for regenerating the solvent. The stripper off-gas, Stream 14, goes to the Claus unit, where the H2S concentration must be maintained at a desired value for maintaining the Claus furnace temperature. Along with the stripper, the H2S concentrator plays a key role in generating the desired H2S concentration in the feed to the Claus unit. Makeup solvent is mixed with the stripped solvent and sent to the top tray of the CO2 absorber. The remaining portion of the loaded solvent from the bottom of the CO2 absorber is heated and sent through a series of two flash vessels, called medium-pressure (MP) and low-pressure (LP) flash vessels, respectively, to recover CO2 for compression in preparation for storage. The semi-lean solvent leaving the LP flash vessel is pumped by P-1402 and then chilled before returning to the fourth tray of the CO2 absorber. An NH3 vapor-compression cycle is usually considered for refrigeration. For simplicity, it can be assumed that a refrigerant is available at –20°C.
B.13.2. Simulation (Aspen Plus) Hints
In this study, the solvent, Selexol, is represented by an Aspen Plus databank component with an average molecular weight of 280. The perturbed chain SAFT (PC-SAFT) EOS based on the statistical associating fluid theory (SAFT) is used to represent the thermophysical and transport property of the Selexol system accurately [2]. The DEPG vapor pressure, liquid density, heat capacity, viscosity, and thermal conductivity of the solvent have been regressed in Aspen Plus using published data [3]. Available data in the open literature on vapor-liquid equilibrium between the DEPG solvent and the selected species have been used to adjust the binary interaction parameters [4].
As mentioned before, the plant should be designed for 80% CO2 capture, for capturing H2S such that the H2S concentration in Stream 14 is about 45 mol%. Because of a very high selectivity of H2S in Selexol (H2S solubility is about nine times that of CO2 in the Selexol solvent), the H2S

80
content of the clean gas becomes much less than 5 ppmv when 80% CO2 is captured. Consequently, two design blocks (or controllers) are used. One design block maintains 80% CO2 capture by manipulating the flowrate of Stream 10. The other design block maintains the H2S concentration in Stream 14 by manipulating the operating pressure of V-1403. This flowsheet contains a number of recycle streams along with the design blocks. In addition, considerable mass and heat integration exists. Therefore, an appropriate solution strategy must be considered to avoid convergence failure. In Section 16.3 a number of approaches to solve such problems were outlined. The equation-oriented (EO) method is suggested for this problem where a few iterations can be performed using the sequential modular approach to generate a reasonable initial guess.
Figure B.13.1. Unit 1400: Selexol Unit Flow Diagram
In Table B.13.3, it can be noted that the duty of heat exchanger E-1403 is very high. Consequently, a large heat-exchange area is calculated. Usually, a proprietary, plate-type heat exchanger is used for this service, which can provide a very high heat-exchange area and achieve a temperature approach as low as 5°C. This can significantly reduce the duties of E-1406 and E-1407.

81
It should be noted that Stream 5 contains a high amount of H2. To recover the H2, the solvent can be flashed in a vessel that operates at a higher pressure than V-1401, and H2 can be recycled to T-1402. This introduces another recycle stream. For simplicity, this option is not considered here. Interested students are encouraged to implement this option for H2 recovery.
Table B.13.1. Stream Table for Unit 1400*

82

83

84
Table B.13.2. Utility Summary Table for Unit 1400

85
Table B.13.3. Major Equipment Summary for Unit 1400

86
B.13.3. References
1. Bhattacharyya, D., R. Turton, and S. E. Zitney, “Steady State Simulation and Optimization of an Integrated Gasification Combined Cycle (IGCC) Plant with CO2 Capture,” Ind. Eng. Chem. Res. 50 (2011): 1674–1690.
2. Gross, J., and G. Sadowski, “Perturbed-Chain SAFT: An Equation of State Based on a Perturbation Theory for Chain Molecules,” Ind. Eng. Chem. Res. 40 (2001): 1244–1260.

87
3. Aspen Plus Model of the CO2 Capture Process by Selexol, 2008, pp. 1–22; www.aspentech.com.
4. Xu, Y., R. P. Schutte, and L. G. Hepler, “Solubilities of Carbon Dioxide, Hydrogen Sulfide and Sulfur Dioxide in Physical Solvents,” Can. J. Chem. Eng. 70 (1992): 569–573.

88
B.14. Design of a Claus Unit For the Conversion of H2S to Elemental Sulfur, Unit 1500The Claus process is one of the most common processes for sulfur recovery from acid gases generated in oil and gas refining. The Claus unit is designed to recover sulfur from the acid gas recovered from an acid-gas removal (AGR) unit and the sour gas produced from a sour-water stripper (SWS).
B.14.1. Process Description
The PFD of the Claus process is shown in Figure B.14.1. The Claus unit is designed so that it can process acid and sour-water gases generated in the operation of an integrated gasification combined cycle (IGCC) power plant. Efficient design of a Claus process depends upon high recovery of sulfur and complete destruction of other impurities such as methane and ammonia [1–4]. It should be noted that elemental sulfur, in the operating temperature range of the Claus unit, can exist as S2 and S8, among others. For simplicity, only these two sulfur species will be considered.
Acid gas, Stream 2, from an acid-gas removal unit and sour-water gas, Stream 3, from the sour-water stripper are preheated in E-1502 and E-1503, respectively, with high-pressure steam and sent to the reaction furnace, H-1501, for combustion. Preheated, enriched oxygen from an air separation unit (ASU) is used as the oxidant in H-1501. Within the furnace, incomplete combustion of hydrogen sulfide to sulfur dioxide is carried out. Additionally, partial combustion of ammonia can also take place. It is desired that only one-third of the hydrogen sulfide contained in the gases be combusted to form a 2/1 ratio of hydrogen sulfide to sulfur dioxide. This 2/1 ratio of hydrogen sulfide to sulfur dioxide is required to maximize sulfur yield in the downstream reactors. Primary combustion reactions within H-1501 are
These highly exothermic reactions increase the temperature substantially (to about 1450°C) in H-1501. Several side reactions take place. The side reaction shown in Equation (B.14.6) destroys any ammonia not combusted in Reaction (B.14.2).

89
The hot process gas is then cooled in E-1504 to generate high-pressure steam and to quench the reactions taking place. At high operating temperatures, such as those in H-1501, sulfur exists primarily as S2. As the cooling takes place in E-1504, the equilibrium shifts as shown in Equation B.14.7. Due to the equilibrium shift, the primary sulfur species present at the outlet of E-1504 is S8.
Further cooling is carried out in E-1505 by generating low-pressure steam. This cooled process gas is then sent to V-1501 to separate the liquid sulfur. The process gas is then sent to the first stage of a two-stage process. The process gas is heated in E-1506 with high-pressure steam before being sent to the reactor R-1501, where hydrogen sulfide and sulfur dioxide react in a 2/1 ratio to form elemental sulfur via Equation (B.14.8) (known as the Claus reaction). The reactor effluent is then cooled by generating low-pressure steam in E-1507. The liquid sulfur is then removed in V-1502. The process gas is again preheated in E-1508 with high-pressure steam. The heated gas is sent to the second-stage catalytic reactor R-1502, where the reaction shown in Equation (B.14.8) takes place. The reactor effluent is cooled in E-1509 using cooling water to condense the formed sulfur. The process gas is then sent to a tail-gas treatment unit (not modeled here).
B.14.2. Reaction Kinetics
Modeling of H-1501 can be simplified by assuming two zones within H-1501: an oxygen-rich zone (known as the flame zone) where faster, exothermic combustion reactions prevail, followed by an oxygen-deficient zone (known as the anoxic zone) where slower, endothermic equilibrium reactions take place.
The combustion reactions will take place homogeneously within the gas phase. The rate equations are of the form [1]
where i is the equation number (B.14, i), and
The units of ri are kmol/s/m3-reactor, the units of pi are atm, and the units of ko,i vary depending upon the form of the equation.
The rate equations for the reactions in Equations (B.14.3) through (B.14.6) are [1]

90
The units of ri are kmol/s/m3-reactor, the units of pi are atm, and the units of Ci are kmol/m3.
The temperature dependence of the equilibrium between S2 and S8 shown in Equation (B.15.7) is given as [1]
The reaction in Equation (B.14.7) is modeled in E-1504.
Equation (B.14.8) is catalyzed in R-1501 and R-1502 by either an alumina or a titanium catalyst. Since Equation (B.14.8) is equilibrium limited and mildly exothermic, the maximum allowable temperature of the catalyst is not a concern. However, significant catalyst deactivation occurs when the temperature is lowered below the dew point of sulfur, since the sulfur will deposit on the catalyst. For this reason, each reactor is operated at a sufficiently high temperature to ensure that no sulfur condenses and deposits on the catalyst. The rate equation for Equation (B.14.8) is [1]
The units of r8 are mol/s/kg-cat, and the units of pi are atm.
B.14.3 Simulation (Aspen Plus) Hints
Due to the low-pressure operation, the ideal gas law was used to model the Claus process. It should be noted that the Aspen Plus model of H-1501 was achieved by dividing it into two zones: H-1501A to model the flame region, and H-1501B to model the anoxic region. Both sections of the furnace are modeled as adiabatic reactors. As substoichiometric oxygen is provided in the furnace to produce an H2S/SO2 ratio of 2/1, H-1501A is modeled as a PFR in which the combustion Equations (B.14.1) and (B.14.2) are considered. This is followed by H-1501B, a PFR, in which Equations (B.14.3) through (B.14.6) are considered. Splitting the reaction

91
furnace into two zones is computationally efficient, since the rates of the combustion reactions occurring in the flame region are greatly different from the reactions occurring in the anoxic region. Very fine discretization is required to capture the rapid changes in composition and temperature that occur as a result of the combustion reactions. For the slower equilibrium reactions occurring in the anoxic region, a much coarser discretization can be used. If all reactions are modeled in parallel and the discretization is not fine enough, the model will fail to converge due to the rapid combustion reactions. If, however, the discretization is fine enough to capture the rapid changes due to the combustion reactions, the time for convergence will unnecessarily be increased due to the very fine discretization used for the equilibrium reactions that is not required.
It should be noted that because only combustion reactions are modeled in H-1501A, the actual size of H-1501A is not significant for steady-state simulations as long as oxygen is completely consumed. It should also be noted that in “real” Claus furnaces, a waste heat boiler is an integral part of the furnace and is located at the end of the anoxic zone. For convenience, this exchanger is modeled separately as E-1504.
Physical properties data for S2 and S8, if not available in a process simulator databank, can be found in Perry’s handbook [5].

92
Figure B.14.1. Unit 1500: Claus Unit Process Flow Diagram

93
Table B.14.1. Stream Table for Unit 1500

94

95
Table B.14.2. Utility Summary Table for Unit 1500

96
Table B.14.3. Major Equipment Summary for Unit 1500

97
B.14.4. References
1. Jones, D., D. Bhattacharyya, R. Turton, and S. E. Zitney, “Rigorous Kinetic Modeling and Optimization Study of a Modified Claus Unit for an Integrated Gasification Combined Cycle (IGCC) Power Plant with CO2 Capture,” Ind. Eng. Chem. Res., dx.doi.org/10.1021/ie201713n (2012).
2. Monnery, W. D., K. A. Hawboldt, A. Pollock, and W. Y. Svrcek, “New Experimental Data and Kinetic Rate Expression for the Claus Reaction,” Chemical Engineering Science 55 (2000): 5141–5148.
3. Hawboldt, K. A., “Kinetic Modeling of Key Reactions in the Modified Claus Plant Front End Furnace,” Ph.D. thesis, Department of Chemical and Petroleum Engineering, University of Calgary, Canada, 1998.

98
4. Monnery, W. D., K. A. Hawboldt, A. E. Pollock, and W. Y. Svrcek, “Ammonia Pyrolysis and Oxidation in the Claus Furnace,” Ind. Eng. Chem. Res. 40 (2001): 144–151.
5. Perry, R. H., and D. W. Green, eds., Perry’s Chemical Engineers’ Handbook, 7th ed. (New York: McGraw-Hill, 1997).
B.15. Modeling a Downward-Flow, Oxygen-Blown, Entrained-Flow Gasifier, Unit 1600
Gasifiers can be used for generating syngas from coal, petroleum coke (petcoke), biomass, and similar feedstocks. In a gasifier, substoichiometric oxygen is provided to generate syngas with a higher CO/CO2 ratio. Gasification reactions finally result in substantial conversion of carbon (as high as 98% to 99%). There are various types of gasifiers. In this project, a model of a downward-flow, oxygen-blown, entrained-flow gasifier will be developed.
B.15.1. Process Description
A process flow diagram of the oxygen-blown, entrained-flow gasifier is shown in Figure B.15.1. Illinois no. 6 coal, Stream 1, is mixed with water, Stream 2, to form a slurry. Usually, the slurry is produced in a tank by mixing coal with the appropriate amount of water and then agitating for hours. For simplicity, uniform mixing can be assumed. The slurry along with oxygen (95% pure by weight), Stream 3, is sent to the gasifier. In a typical gasifier operation, the oxygen-to-coal ratio is manipulated to maintain the gasifier exit temperature so that the ash remains molten and it can flow down the gasifier wall. However, it is difficult to measure the gasifier exit temperature reliably and precisely due to the harsh conditions. Therefore, only a ratio controller is shown in Figure B.15.1. The water-to-coal ratio is manipulated to maintain the viscosity of the slurry. A number of reactions take place in a gasifier. For simplicity, only the key reactions will be considered. As the coal enters the gasifier, it gets thermally decomposed, releasing the volatile matter (VM) and tar and leaving behind a high-carbon residue commonly known as char and ash, which contains a number of minerals such as silicon dioxide (SiO2), aluminum oxide (Al2O3), iron oxide (Fe2O3), calcium oxide (CaO), and magnesium oxide (MgO). The quantity of the VM can be obtained from the proximate analysis of the coal. The tar produced during the devolatilization reaction cracks further, generating gaseous species and char. For simplicity, char and ash can be assumed to be graphitic carbon and pure silicon dioxide, respectively. The product yield due to devolatilization and tar cracking can be calculated by using the METC Gasifier Advanced Simulation (MGAS) model developed by Syamlal and Bissett [1]. This model is based on analytical data of the coal such as proximate and ultimate assays, tar composition, and so on, from extensive laboratory-scale experiments that characterize the coal. It is assumed that all the sulfur in the coal is converted to H2S, and all the nitrogen is converted to NH3. In addition, higher hydrocarbons produced are neglected. As both the devolatilization and tar cracking reactions are usually rapid, they can be combined, and the combined yield of product can be written as

99
Subsequently, the following reactions take place:
A number of other reactions also take place in the gasifier. For example, hydrogen gasification of char results in methane. Methane participates in methane-steam reforming and methane-CO2 reforming reactions. There are a number of reactions involving NH3 that are also not considered here for simplicity. It is very difficult, if not impossible, to calculate precisely the carbon conversion in a gasifier by using the blocks available in commercial process simulators. Complex hydrodynamics, strong interaction between various species, presence of multiple phases, difficulty in characterizing coal, char, tar, and ash are some of the key issues that are difficult to model in a process simulator. For this reason, some deviations from the experimental/literature data will be observed in the Stream 4 results reported in Table B.15.4.
B.15.2. Reaction Kinetics
The product yield (on a mass basis) due to devolatilization and tar cracking (Reaction [B.15.1]) for Illinois no. 6 coal is calculated from Syamlal and Bissett [1] and reported in Table B.15.2.
Table B.15.1. Proximate and Ultimate Analysis of Illinois No. 6 Coal (as Received)

100
Table B.15.2. Product Yield (Mass Basis) in Reaction (B.15.1) for Illinois No. 6 Coal
The reaction kinetics for Reaction (B.15.2) is given by Westbrook and Dryer [2]:
The reaction kinetics for Reaction (B.15.3) is given by Westbrook and Dryer [2]:
The reaction kinetics for Reaction (B.15.4) is given by Jones and Lindstedt [3]:
For the char combustion reaction, Equation (B.15.5), the kinetics of the surface reactions available in the open literature for a shrinking-core model [4] is used. For incorporating in a process simulator, the rate expression has been simplified by assuming that the diffusive resistance in the ash layer is the dominating resistance to mass transfer. Further, it is assumed that the char particles have a diameter of 400 μm, and the average operating pressure of the gasifier is 24.5 atm. Subsequently, the reaction kinetics for Equation (B.15.5) can be written as
The kinetics for Equation (B.15.6) is given by Wen et al. [5]:
The kinetics for Equation (B.15.7) is given by Wen and Onozaki [5]:

101
The kinetics for Equation (B.15.8) is given by Wen and Onozaki [5]:
In Equation (B.15.15),
In the equations provided before, the activation energy is given in kJ/kmol, the units of concentration are kmol/m3[[FR 3]] (gas), and T is in K whenever a specific unit is needed.
B.15.3. Simulation (Aspen Plus) Hints
In Section 13.7, fundamentals of solids modeling were discussed. Since coal is a heterogeneous mixture of complex materials, it is difficult to calculate its physical properties accurately. Its enthalpy and density can be calculated using appropriate correlations or by using experimental data, if available, at the operating conditions of the gasifier. Coal is declared as type “NC” (nonconventional) in Aspen Plus. The chosen “enthalpy model” is “HCOALGEN,” which is a special model for calculating enthalpy of streams comprising coal. A number of empirical correlations are available for calculating heat of combustion, heat of formation, and heat capacity. This enthalpy model can be chosen under Data | Properties | Advanced | NC Props. Selection of correlations can be done by choosing the appropriate “options code” value under “option code” number. The heat of combustion is calculated by the available IGT (Institute of Gas Technology) correlation (option code number 1, value 5), the standard heat of formation is calculated by a heat of combustion-based correlation (option code number 2, value 1), and the heat capacity is calculated by Kirov correlation (option code number 3, value 1). Elements are considered to be in their standard states at 298.15 K and 1 atm (option code number 4, value 1). For calculating the coal density, density model “DCOALIGT” is chosen. This model can be selected under Data|Properties|Advanced|NC Props. This model uses the IGT correlation for density. For using the models “HCOALGEN” and “DCOALIGT,” the proximate, ultimate, and sulfur analyses of coal are needed. The analysis is entered under the tab “Component Attr.” of the Stream 1 specification window as per the data provided in Table B.15.1. Sulfur is assumed to be equally distributed in the following “elements”: “pyritic,” “sulfate,” and “organic.” In addition, carbon, sulfur, and ash are declared as type “solid,” and all other species are declared as “conventional.” Stream class “MIXCINC” was chosen so that the substream types “MIXED,” “CISOLID,” and “NC” are created to support the conventional, solid, and nonconventional species. To promote rapid devolatilization (Equation [B.15.1]) and subsequent combustion of the volatiles (Equations [B.15.2] through [B.15.4]) within a short distance from the entrance of the

102
gasifier, the gasifier burner is designed to promote recirculation of a part of the hot combustion products. The homogeneous and heterogeneous reactions (Equations [B.15.2] through [B.15.8]) continue to take place through the gasifier. To represent these phenomena, a multizonal model can be developed by dividing the gasifier R-1601 into three zones as shown in Figure B.15.2. The first zone is represented by the block R-1601A, where only the reaction in Equation (B.15.1) takes place. R-1601A can be simulated as an “RYield” block. The combustion of the gaseous species (Equations [B.15.2] through [B.15.4]) is considered in the block R-1601B. It is clear from the rate expressions given in Equations (B.15.9) through (B.15.11) that they are very rapid at the gasifier operating temperature (above 1000°C). The oxygen provided is much in excess of the stoichiometric requirement for combustion of the volatiles that get produced in Equation (B.15.1). As a result, reactor R-1601B can be modeled as an “RStoic” reactor in Aspen Plus. The temperature of R-1601A is specified at 500°C, and the required heat is removed from R-1601B. All the homogeneous and heterogeneous reactions (Equations [B.15.2] through [B.15.8]) are considered in R-1601C, which is a PFR. The heat loss to the environment from the gasifier wall is considered by specifying a uniform heat flux from the reactor. Equation (B.15.11) shows that the kinetics of Equation (B.15.4) is very fast. As the gasifier temperature shoots up in the initial region of the gasifier due to the exothermic combustion reactions, reactor R-1601C may fail to converge. The pre-exponential factor in Equation (B.15.11) can be reduced by two to three orders of magnitude to avoid convergence failure. This modification will have negligible effect in the simulation results.
The stream data for the intermediate streams, Stream 51 and Stream 52, are provided in Table B.15.3. Since solids are included in this table and in Table B.15.4, mass flowrates (instead of molar flowrates that are commonly reported in other examples) are given.

103
Table B.15.3. Stream Table for the Intermediate Streams in Unit 1600

104
Figure B.15.1. Unit 1600: Flow Diagram of a Downward-Flow, Oxygen-Blown, Entrained-Flow Gasifier

105
Figure B.15.2. Unit 1600: Multizonal Approach for Modeling a Downward-Flow, Oxygen-Blown, Entrained-Flow Gasifier
(Instrumentation Lines Not Shown) (Note: This is not a process flow diagram; it is a representation of the simulation strategy.)

106
Table B.15.4. Stream Table for Unit 1600
Table B.15.5. Major Equipment Summary for Unit 1600
B.15.4. References
1. Syamlal, M., and L. A. Bissett, “METC Gasifier Advanced Simulation (MGAS) Model,” Technical Note, NITS Report No. DOE/METC-92/4108, 1992.
2. Westbrook, C. K., and F. L. Dryer, “Simplified Mechanism for the Oxidation of Hydrocarbon Fuels in Flames,” Combustion Sci. Tech. 27 (1981): 31–43.
3. Jones, W. P., and R. P. Lindstedt, “Global Reaction Schemes for Hydrocarbon Combustion,” Combustion and Flame 73 (1988): 233–249.

107
4. Wen, C. Y., and T. Z. Chaung, “Entrainment Coal Gasification Modeling,” Ind. Eng. Chem Process Des. Dev. 18 (1979): 684–695.
5. Wen, C. Y., H. Chen, and M. Onozaki, “User’s Manual for Computer Simulation and Design of the Moving Bed Coal Gasifier,” DOE/MC/16474-1390, 1982.
The Professional and Personal Technology Brands of Pearson
Prev Appendix C. Design Projects