(9 :;. theory and practice of overfisidng: a ......theory and practice of overfishing: a southeast...
TRANSCRIPT

146 (9 :;.
THEORY AND PRACTICE OF OVERFISIDNG:A SOUTHEAST ASIAN PERSPECTIVEa)
by
Daniel PaulyInternational Center for Living Aquatic Resources Management
M.C.P.O. Box 1501, Makati
Metro Manila, Philippines
ABSTRACT
A brief review is given of the demersal and pelagic fisheries of Southeast Asia, with emphasison biological and socioeconomic factors (such as, for example, the presence of inshore shrimp stocksand mass unemployment, respectively) and which tend to promote over-exploitation of marine fishresources.
It is shown that several models routinely used by fishery biologists to assess Southeast Asianfish stocks tend to lead to management advice that is less conservative than warranted. Straightforwardremedies exist for the latter set of problems. On the other hand, non-traditional approaches wiIIhave
to be identified to deal with .problems related to resource over-exploitation.
Introduction
This contribution is an attempt to discuss overfishing, with emphasis on those aspects of the phenomenonthat are relevant to Southeast Asia. The following forms of over fishing wiII be discussed:
i) growth overfishing,ii) recruitment overfishing,iii) ecosystem overfishing,
. iv) economic overfishing.(Conceptual and operational definitions of these four forms of overfishing will be given below).
Southeast Asia is extremely diverse, both in terms of its peoples, cultures and natural resources and has
therefore frequently been labelled as the "Europe of Asia". This comparison, in the context of the presentcontribution begs the question as to whether Southeast Asian fisheriesare in a state of overfishingsimilar to that
of Northern Europe, whose fisheries have been stated to dissipate a potential rent of about 109 US$ annually
(Gulland 1982).
The central core of Southeast Asia is formed by the countries forming the Association of Southeast Asian
Nations, or ASEAN (i.e., Brunei, Indonesia, Malaysia, Philippines, Singapore and Thailand). Closely related tothese through cultural, historic and economic ties are Burma to the west, Vietnam, Kampuchea and the southernChina coast (including Hong Kong and Taiwan) to the east and Papua New Guinea to the south.
As can b~ seen from Table 1 (column E), the economies of these countries differ widely, with GNP per
capita ranging from values well above US$6,OOOper year for Singapore and Brunei to values of the below USS200per year.
Overall marine landings from the countries listed in Table 1 are of about 6.7 milIion tonnes annually, 01
which about 64% consist of demersal resources(i.e., animal caught near the sea bottom using gears such as ottertrawl), which themselves consist of 11.40/0penaeid shrimp.
a) ICLARM Contribution No. 356. Prepared for presentation at the 22nd Session of the Indo-Pacific Fishery Commission. Darwin,
Australia, 16-26 February 1987.

147
Table 1. Selected statistics relevant to the fisheries of the countries mentioned in this contribution.
A. Country. ASEAN countries are in italics; China is not included, because only its South China Sea coast belongs to'Southeast Asia.
B. Area in km2 x 103, from Anon. (1985, p. 6-7).
C. Coastline length in km, from Marr (1976) except for Burma (from Anon. 1982), and PNG (from Frielink 1983).
D. Population in millions, from Anon. /1985, p. 6-7).
E. Annual per capita income (USS), from Hinton (1985): note large per capita income .for Brunei, due to relatively large oil revenues.
F. Annual marine landings in metric tons x 103, from FAD Statistics for 1983, except for PNG which is from P. Dalzell and A. Wright (PNG
Dept. of Primary Industry, pers. comm.); figure excludes tuna and baitfish, whose fishery essentially stopped in 1981, as well as beche-de-mer
and pearl shells.
O. Demersal component of marine landings in metric tons x 103, from FAD Statistics for 1983, except for PNG which is based on data in
Wright and Richards (1985) and which consists mainly of reef fishes, for Kampuchea whose value of 27 (from Aoyama 1973) refers to
pre-war(1971)trawler catches and for Burma and Vietnam whose demersalcomponent was set at approximately 90070and SOOJoof their total marinecatch, respectively.
H. Penaeid shrimp production in metric tons x 103, from FAD Statistics for 1983 (and including aquaculture production), except for Burma
(Price and Kyaw Htin 1984), Brunei (Currie 1982), Kampuchea (Aoyama 1973) and PNG (Anon. 1979). Note that the latter fishery
conducted in the Gulf of Papua also catches about 7,000 tons of fish per year, all of which is discarded. The figure for Kampuchea (trawler
catch of shrimp in 1971) is dated and is given here to serve as minimum estimate of potential yield.
The latter as will be shown below are extremely important both in terms of their higher value (usuallyabout 10times the value of the demersal fish with which they are caught), and in terms of their nearshore distribution,about which more will be said later. Figure 1 presents a map of the distribution of major shrfmping grounds inSoutheast Asia, along with averaged annual catches in thousand tonnes.
Forms of overfishing occurring in Southeast Asia
Growth overfishing is that aspect of overfishing that is conceptually easiest to grasp, and which is easiest
to theoretically account for. It i~in layman's terms what occurs when-jfish are caught before 'they had "a chanceto grow" (note that growth overfishing has nothing to do with fish reproduction which is dealt with under "recruitmentoverfishing" -see below). The converse of growth over fishing is growth underfishing which is what occurs when
fish are caught at such an advanced age that their death rate (as due to natural causes) exceeds the rate at which
they grow~ The methods most commonly used to identify the level of fishing and associated mesh size whichmaximizethe yield from a given number of young fish (i.e., "recruits") have been developed by Beverton and Holt(1957). Massive growth over fishing occurs in Southeast Asian stocks, as will be discussed further below.
Recruitment overfishing is what occurs when so few adult fish are left in a given exploited stock that theproduction and/or survival of eggs (and larvae) is reduced to the extent that recruitment to a fishery is impaired.
Many of the concepts related to recruitment overfishing have been first formulated by Ricker (1954).
- ----
A B C D E F G H
Brunei 5.80 163 0.2 12,000 3 3 0.5Burma 677 2,800 37 200 443 400 1.0lndonesia 1,919 36,800 169 500 1,600 900 130Kampuchea 181 435 6.2 95 51 27 1.3Malaysia 329 3,400 16 1,800 726 523 76.5Papua New Guinea 462 10,000 3.3 800 13 11.2 1.0
Philippines 300 17,500 57 800 127 704 55.7Singapore 0.62 140 2.6 6,500 191 17.1 0.0Thailand 5.40 2,580 53 700 2,100 1,.770 174Vietnam 330 2,310 61 170 505 250 49.1

49~~" ~24v ~
) ~£~
1300E1000E ~"..00
100N
~ ~O
~
~ ~ c::>
Q~
10°55
c::::>
~O~ ~~ 10°5
1000E 1100E 1200E 1300E
Fig. 1. Major shrimping grounds of Southeast Asia (shaded), with average annual catch (1976-1978) for each area10 tbousaads of metric tODS(from SCSP1981, with figures for Brunei, Burma, Kampuchea and Vietnam addedw__ T 1).

149
Recruitment overfishing is usually harder to detect than growth overfishing, and one of the. few (or theonly?) "stock recruitment" curves so far derived for a Southeast fish stock is shown here as Figure 2.
Fig. 2. Stock-recruitment data of false trevally (Lactarius lactarius)in the Gulf of Thailand, fitted with Rickercurves(GM and AM) (from Pauly 1984a).
Ecosystem overfishing has been defined elsewhere as what takes place in a [ multispeciesJ stock whenthe decline (through fishing) of the originally abundant stocks is not fully compensated for by the contemporaryor subsequent increase of the biomass of other exploitable animals" (pauly 1979). A now exemplery case of ecosystemoverfishing is the Gulf of Thailand, where species (e.g., slipmouths, Fam: Leiognathidae) that were extremelyabundant when the fishery began were partially replaced (e.g., by squids, Loligo spp.) but where this and other
species replacement failed by far to compensate for the enormous drop in overall catch per effort (Table 2).
Economic overfishing occurs when less than maximum economic yield is obtained from a fishery, i.e.,when fishing effort exceeds that needed to maximize the economic rent (or pure profits) from a fishery. It will beshown below that concepts such as this, far from being irrelevant to fishery biologists, are in fact highly compatiblewith biologically sound management, particularly in Southeast Asian waters.
A partial list of overfishing effects on single and multispecies stocks is given in Table 3.
--
350[ rooD300 6,000
::0(I)(')
250 5,000 Eo-+en- ..U) 5'0-
4,000 §)( 200 . 1968- ::;11) en= 0:3 .....
t; 150 1967 3,000CU .a:: c
2.
1001-1 1969'\,(\e./ I '12,000. en-+
01971
Virgin 'stock I 000
(')
50 "e "'"
,
01,000 1,500 2pOO 2,500 3pOO
Spawning stock (XI03f)

Table 1. M,an calch composilion (In kg ptr lrawllng hour) during sUrY,yacODdDcl,dby R/V Pramong1 and R/V Pramong 9 In walen < 50 m or Ih. Cuir or Thanand..
Groups identified 1961b 1963 1966 1967 1968 1969 1970 1971 1972 1973 1974 197$ 1976 1977 1978 1979 1980 1981 1982
leiognalhidae $3.00 71.$0 20.02 10.87 14.37 10.$9 10.2$ 2.98 4.86 6.00 1.70 2.$3 (2.64) (2.76) (2.87) (2.98) (3.09) (3.21) 3.32
Carangidae 44.00 19.70 9.89 9.11 9.90 9.2$ 9.08 3.89 3.83 2.8$ 2.62 2.34 1.91 2.22 2.32 2.$2 2.3$ 1.1$ 1.30
Nemiplervs spp. 3$.00 18.40 1$.31 11.78 7.46 7.40 8.61 7.31 4.73 3.20 3.07 $.89 $.7$ $.34 3.99 4.98 4.73 4.39 3.77
Seiaenidae 1.00 18.30 2.60 4.$4 2.68 0.63 1.46 0.61 0.70 0.17 0.1$ 0.12 0.16 0.30 2.$S 0.06 0.40 0.14 0.07Mullidae 1.00 16.10 S.9O 9.74 7.24 6.14 3.77 2.74 1.91 1.96 0.89 1.60 !.S4 1.07 1.22 0.6S 0.78 O.SI 0.37
Rays 114.891 14.80 9.63 4.77 2.17 2.99 2.86 1.3S 1.22 I.S4 O.I 1.14 0.63 0.61 I.IS 0.31 0.17 0.31 0.10
Saurida spp. IS.OO 11.30 $.34 4.$1 S.42 S.29 6.64 3.07 3.32 1.87 . 2.29 1.6S 2.91 3.02 2.76 2.79 3.39 2.70 2.67
Taehysuridae 10.00 7.40 3.S9 2.14 1.79 1.31 1.44 0.98 0.4S 0.61 0.41 0.33 0.29 0.24 0.34 0.27 0.24 0.14 0.00
LoUgo spp. (2.14 ) 6.10 8.04 9,13 10.60 11.61 US 11.03 14.23 9.94 14.28 6.42 9.27 8.31 8.99 6.79 6.98 7.28 8.61
Scolopsis spp. 4.00 7.60 4.74 3.28 2.6S 3.91 2.62 1.91 1.38 0.98 0.71 0.74 0.87 0.72 0.6S 0.37 O.SS O.SS 0.48
Priaeanlhus spp. $.00 S.6O 4.08 7.17 6.22 7.4S 7.38 S.21 1.89 2.43 S.44 2.10 2.87 2.33 3.11 3.87 4.09 4.41 3.78Sharks 12.11 ) 2.10 1.86 1.64 1.04 0.60 0.7$ 0.60 0.S4 0.4S 0.28 0.14 0.21 0.30 O.IS 0.19 O.OS 0.21 0.12
Sphyroena SI'lP. 3.00 2.10 1.74 1.37 0.74 1.14 1.43 0.3S 0.31 O.IS 0.22 0.16 O.IS 0.17 0.36 0.S2 0.29 0.34 0.30
Thenus spp. 3.00 2.00 0.72 0.34 0.3S 0.29 0.19 0.13 0.11 O.OS 0.04 0.03 0.04 0.06 0.03 0.02 0.01 0.01 0.12
LUljanidal: 8.00 !.SO 4.76 4.02 3.83 3.01 2.2S 0.99 0.S6 0.S4 0.41 0.43 0.7S 0.20 O.SO 0.77 0.47 0.49 0.89
Plcclorhynchidae 2.00 1.30 1.17 1.37 0.9S 1.09 0.63 0.23 0.14 0.09 0.14 0.11 0.09 0.07 0.09 0.06 0.20 O.OS 0.02
Trichiuridae 10.00 0.90 1.01 1.24 1.46 0.74 0.94 0.69 0.8S 1.02 0.84 2.87 1.86 1.2$ 0.98 2.10 0.39 0.29 0.7SSerranidae 2.00 0.80 1.23 1.37 1.0S 0.9S 0.86 O.SI 0.33 0.33 0.21 0.4S O.SI 0.S9 0.41 0.66 0.63 0.47 0.4SRaslrelliger negleelus (0.96) 0.80 0.19 0.37 0.$1 1.03 I.S4 0.40 0.16 0.22 0.08 0.14 0.09 0.08 0.19 0.41 0.17 0.14 0.2SCrabs (0.84) 0.70 0.92 0.61 0.70 0.86 1.32 I.\S 1.61 0.91 1.60 1.00 0.7$ 0.8S ' 0.87 1.12 1.0S 0.66 0.$1Laelar/us laelarius 2.00 0.60 0.S9 0.19 0.23 0.10 0.02 0.03 0.01 0.00 0.00 0.00 0.01 0.00 0.00 0.00 0.00 0.00 0.00
Shrimps (0.72) 0.60 0.27 0.12 0.09 0.11 O.IS 0.26 0.22 0.10 0.09 0.16 0.24 0.31 0.24 0.24 0.42 0.29 0.37Pomadas)'s spp. (0.48) 0.40 0.41 0.32 0.21 0.30 0.16 O.OS 0.06 0.08 O.OS 0.01 0.01 0.01 0.02 0.01 0.02 0.00 O.OS
Seomberomorvs spp. 0.20 0.40 0.61 0.47 0.82 1.08 0.S6 0.33 0.38 O.SS 0.44 0.30 0.30 0.27 0.28 0.3S 0.S2 0.18 0.41
Pampus spp. (0.48) 0.40 0.27 0.16 0.19 0.13 0.09 O.OS O.OS 0.04 0.17 0.03 0.01 0.03 0.03 0.01 0.02 0.00 0.02Psellodes erumei (0.48) 0.40 0.99 0.63 0.S8 0.6S 0.S6 0.71 O.SI 0.30 0.2S 0.36 0.24 0.24 0.22 0.16 0.20 0.17 0.09
Chirocenlrvs spp. (0.24) 0.20 0.19 0.13 0.30 0.17 0.23 O.IS 0.10 0.14 0.22 0.13 0.17 0.21 0.23 0.43 0.24 0.22 0.20
Raehycenlron eanadus (0.24) 0.20 0.24 0.33 0.23 0.21 0.22 0.09 0.13 0.08 0.17 0.02 0.10 0.10 0.06 0.12 0.07 O.OS 0.07Lethrinidae 0.30 0.20 0.47 0.86 0.33 0.28 0.2S 0.11 0.16 O.OS O.OS 0.04 0.16 0.11 O.OS 0.09 0.13 0.11 0.04
Muroenesox spp. (0.12) 0.10 0.24 0.16 0.21 0.66 0.26 0.29 0.21 0.12 0.14 0.30 0.18 0.17 0.18 0.08 0.14 0.12 0.12Rhinobatidae (O.S) (1.18) 0.62 0.6S 0.84 0.43 0.40 0.48 0.06 0.11 0.01 0.09 0'.02 0.09 0.02 0.01 0.01 0.00 0.00
Anadonlosloma spp. (O.SS) (0.46) 0.24 O.IS 0.30 0.36 0.21 0.11 0.02 0.01 0.01 0.01 0.00 0.00 0.00 0.00 0.04 0.00 0.03Gerridae (1S.38) (12.86) (6.76) S.93 3.13 3.06 2.SS 1.49 0.8S 0.49 1.41 0.69 1.11 0.80 0.S4 O.OS 0.09 0.06 0.04
Raslrelliger kanogurla (0.96) (0.80) 0.42 0.66 0.63 0.96 0.86 0.47 0.36 0.26 0.26 0.18 0.20 0.28 0.4S 0.40 0.2S 0.20. 0.22Bothidae (1.44) (1.20) 0.63 0.33 0.38 0.36 0.32 0.S2 0.S8 0.26 0.16 0.3S 0,18 0.14 0.00 0.00 0.00 0.00 0.00Cynoglossidae (0.28) (0.23) 0.12 0.06 0.04 0.14 0.07 0.24 0.31 0.13 0.06 0.37 0.09 0.10 0.09 0.11 0.14 0.10 0.04
Sepia spp. [1.86 ) (S.32) 2.80 1.87 2.10 2.33 2.62 2.28 2.97 L87 3.10 2.31 2.41 2.39 2.43 2.36 1.84. 1.71 1.27Misc. fish S4.63 14.40 12.37 12.44 13.79 14.77 IS.14 12.S2 13.01 12.02 13.80 11.4S 18.S0 11.24 13.7S IS.80 13.9 8.11 12.4S
TOlal calch (includingmisc. fish) 297.80 248.9$ 130.98 114.84 10S.$4 102.37 97.24 66.31 63.12 $1.92 S7.68 46.99 S7.22 46.98 $1.12 S1.66 48.14 38.77 43.36
No. or hauls 133 200 713 713 719 720 718 720 720 718 S40 480 261 $79 436 23$ 24S IS9. 21S
0 '!Wed on Tkws (196'. 1971)lor 1963.I97JInd on Eiamsa'ird and Dhamnl,om (1979. 1980).Eiamsa.1Id(1981). o..,nprascnpom (1981).Vadhan.akul tf .1. (1985) and MeemcskuJ(1986) lor 1974.1981;values in round brackets are Inter or <X'..pol"ed.\0'Sued onTicws(1962).with'IaluaInroundbracketscxltapolaledusina" In1%3caleh:valuainsquarebrackcuorlainaDrrertrrtd10"sharksand ra)'s"and"ccphalopods"andwereusi,ncd 10lowerWa in rclaLionto theirvaluaIn1963..-1

151
Table 3. Some Effects of Biological and Economic Overfishingin (Multispecies)Stocks
Single Species Fisheries
i) reduction of size (length and weight) of the animals caught, hence:-- usually a reduction in value per unit weight--- usually higher handling, sorting and processing costs per unit weight
ii) reduction of biomass on the ground, hence--- reduction of catch per unit effort (and hence returns) of individual vessels
Hi) reduction of total catch (at high levels of effort), hence--- lowered overall food supply--- increased prices-- need to import substitutesand hence, increased nutritional deficiency among poorer segments of the population.
iv) increased fluctuation of stock due to reduced number of age groups in stock and to reduced "buffering"of recruitment fluctuations, hence .
-- more frequent occurrence of periods with extremely low catches
--increasing risk of occasional recruitment failure, inclusive of total collapse of stock fishery
v) lowered income among fishermen; hence--a multitude of social ills such as violent conflicts between pauperized small-scale fishermen and
their "industrial" competitors
Multispecies Fisheries
i) same as (i) to (v) above, plus:
ii) massive changes in species composition of catch, i.e.--- disappearance of previously important species,__ increase of unmarketable species ("trash fish") and/or squids (see Larkin and Gasey 1982,
Pauly 1985)--- reduction in average value of species mix.
Examples of stock assessment practices that promote overfishing
It is common "knowledge" -at least among fishery biologists -that fishermen, or "politicians" are at
fault when over fishing o~curs, since all that fishery biologists do is give conservative advice which goes unheeded.
However, I shall show in the following paragraphs that a number of models routinely used by fishery
biologists to formulate management advice have the common feature of suggesting management goals that induceoverfishing.
Example I. Using e"oneous techniques for fitting surplus yield models to time series of catch-and-effort data.
The most commonly used models for fishing management are various surplus production models, such as
those proposed by Schaefer (1957) or Fox (1970). Notwithstandin~ their original assumptions (which strictly applyonly to single species stocks), these models are routinely applied to multispecies situations, and "MSY" estimatesand their associated level of effort ( Hf ") proposed as management goals. (Gulland 1983).msy
Numerous authors (notably in contributions to the Can. J. Fish. Aquat. Sci.) have shown that these
models tend to overestimate both MSY and fmsy when marked annual variations of recruitment occur.
No instance of this point being considered has come to my attention for Southeast Asia, but this is easy to
explain given that the mathematical reasoning presented by these authors is, too obscure to most practioners.

152
On the other hand, no real excuse is available for not heeding Gulland's (1969) straightforward advice of
explicitly accounting for lags in the response of the catch to the change in effort, e.g., by averaging effort over a
period corresponding to the lifespan of the fish in single or multispecies stocks. As can be seen on Fig. 3, this simple
adjustment has the effect of reducing estimatesof MSY and fmsy, i.e., of providing both biologically more correctand also more conservative advice.
.r:::.o-ao
. .. .
c::)Cc«
AM,no lags (I)
AM, lags included (2)
GM,no lags (3)
GM,lags included (4)
Fishing effort
Fig. 3. Schematic representation of the impact of regression type (AM or predictive vs GM or functional) and"lagged" effort (i.e., mean of contemporaryeffort + effort of precedingyear)on a highscatterdata set as typicallyobtained from tropical fisheries (adapted from Fig. 10.3 in Pauly 1984a).Note declinefrom (1) to (4) of "MSY"
and "fmsy" estimates (see text).
In a similar vein, it can only be wondered why authors keep using arithmetic mean (AM) or predictiveregression for their elf vs. effort plots, given that this regression type assumes the data on the abscissa scale, i.e.,effort to be measured without error (Ricker 1973) which is clearly unrealistic.
Rather, one should use a geometric mean (GM) or functional regression, i.e., use instead of
clf = a + b f ...1)
a plot of
clf = a' + b' f
where b' = b/lrl
...2)
...3)
where Irl is the absolute value of the correlation betweenclf and f values and where
a' = (crf - I)/b'
I
...4)I
As may be seen in figure 3, this simple, statistically appropriate, modification automatically accounts for uncertainty I
in the data by "translating" a low value of r into lower estimates of MSY and fmsy
--- - ---

... -- -
153
Example II. Estimating optimum mesh sizesfrom length-per-recruit analyses based on the assumption of knife-edgeselection.
For reasons such as the lack of computers, programmable calculators and the like at the time they developedtheir theory, Beverton and Holt (1957) incorporated in their otherwise rather realistic model the assumption that
meshsize selection by a gear such as trawl is "knife-edged", i.e., all fish below a certain length ("Lc") are assumedto be able to escape through the mesh of the net, while all fish above that length are assumed to be caught. Theseauthors were also able to show, with reference to more extensive computations involving realistic selection ogives
that the assumption of knife-edge selection had little or no impact on their yield per recruit analyses and estimatesof optimum mesh size in relatively large fish such as plaice and other North Sea fishes.
Figure 4 shows the results of incorporating realistic selection ogives into yield per recruit-anaJysis (i.e., inthe method used to estimate optimum mesh sizes), in the small fish typical of Southeast Asian demersal stocks,
as compared to results based on the knife-edge assumption. As might be seen the differences are profound. Allone needs to add here is that to date all estimate s of optimum mesh sizes performed in Southeast Asia and inneighboring areas (e.g., Sainsbury 1984 and Table 3) assumed knife-edg~ selection, and that most textbooks ofstockassessment continue to advocate the knife-edge assumption, even for gillnet selection curve (e.g., Gulland1983).
Example Ill. Continuing the use of Gul/and's equation for potential yield estimates.
Gulland (1970) proposed, as a rule of thumb, that the fishing mortality generating MSY (= Fmsy ) shouldbeapproximately equal to M, the rate of natural mortality in a stock, and used an equation based on this assumption,i.e.,
MSY = 1/2 x M x unexploitedbiomass ...5)
to estimate (potential) MSY in a variety of tropical stocks, including multispecies stocks (for which a mean valueorM is extremely hard to define). The equation continues to be used widely although it has been shown to be grosslymisleadingby a number of authors, notably Francis (1976) and particularly Beddington and Cooke (1983) who
showedthat Fmsy = M, applies only in fisheswith lowvaluesof M, such as, for example,North Sea plaice, andthat Fmsy is much smaller than M when the latter is high -as occursin the small, short -lived species characteristicof tropical waters (Pauly 1980).
Although more could be put forward, these three examples should suffice to illustrate the contention thatfisherybiologists far from being innocent observers of the over fishing scene have contributed to it and continue to10 so -through over optimistic estimation of potential yields (or of sustained yields in exploited fisheries), as wellas through overoptimistic advice as to appropriate levels of fishing effort and mesh size.
[ Lest this last paragraph be misunderstood, I hasten to add here that I do belong to the group of fisherybiologists that is being criticized here. Also, I suspect that fisheries economists commit similar mistakes, e.g., by
not considering all factors, including hidden subsidies when they estimate fishing costs. J
Particular features of Southeast Asian fisheries that make them particularly susceptible to overfishing (adapted In.part from Pauly and Neal 1985)
Item I: 'The co-occurrence of penaeid shrimp and the bulk of the demersal fISh stocks.
In 1980, the price per kg (live weight) of medium quality penaeid shrimp in the Philippines was about 56
pesos(8 Philippine P = lUS$ in 1980). During the same period, the price of medium quality demersal fish wasabout 7 pesos/kg (Anon. 1981). The 8: 1 ratio between these two prices, which is typical of the situation prevailingin Southeast Asia is one of the root causes of a number of biological, technological and social problems besetting
the demersal fisheries of this region. These problems, although they form a continuum may be split into 3 sets,as follows:

154
Assumingknife -edgeselection
-.-2 0.030oQ)'-'-Q)a.
"0
Q)':;'Q)>
0.030 Using a realisticselection ogive
-.QQ)
0::
0.010
Fig. 4. Effect of the "knife-edge assumption" on yield-per-recruit estimates In a single species stock of small fishor shrimp Note that overoptimistic estimates are generated when the unrealistic knife-edge assumption Is made
(Adapted from Pauly and Soriano 1986 ) .
o 0.2 0.4
Exploitation
0.6 0.8
rate (F/Z)
Table 4. Optimum mesh size for the cod-end of Southeast Asian trawlers as estimated using various methods
(present mesh size is usually 2 cm or less).
Area/country Sources and remarks
Southern South China Sea
Malacca Strait
Inner Gulf of Thailand
Brunei
San Miguel Bay,
Philippinesa
San Miguel Bay,Philippinesa
Southern Samar Sea,
Philippines
No. of species (groups)in<;luded in analysis
Optimum cod-end
mesh size (cm)
Sinoda et al. (1979) based onoriginal method derived fromconsiderations in Jones (1976).
Results apply to landed weightsand values.
Meemeskul (1979) based onmethod of Sinoda et al. (1979).
Lindley (1982), based on anapproach suggested by Jones(1976).
Based on landed weight. Smithet al. (1983), using method ofSinoda et al. (1979).
Based on landed value, Smith
et al. (1983), using method ofSinoda et al. (1979).
Silvestre (1986), based on anoriginal model which assumedknife-edge recruitment and/orselection.
44 4.5- 5.5
'One of the 16 groups was "penaeid shrimp"; their inclusion. and their high price had surprisingly liule impact on overaU mesh sizeestimate. .
38 4.5 - 5.5
51 4.5- 5.5
numerous, but emphasison 4 spp. of Leiognathidae
4
16 504
16 5.3
10 3.5
--

155
- problems in assessing the shrimp and associated fish stocks, inclusive of the problems associated withaccounting for the biological interaction between fish and shrimp (Larkin and Gasey 1982, Pauly 1982,1984b);
technological problems arising from the attempts to catch only one part of the exploited shrimp/fishcomplex (e.g., catching shrimp but no fish or vice ver.sa);
- social problems arising from fishing on inshore fishing grounds by trawlers aiming at shrimp concentrations.
As will be noticed, these problems do not include the "bycatch" problem per se, due to the fact that mostfish caught in Southeast Asia are landed even when taken incidentally with shrimp. Exceptions are the demersal
fISheriesof Malaysia, the shrimp fisheries in the Arafura Sea (Naamin 1984)and in the Gulf of Papua (see Table 1).The relatively short duration of fishing trips which is interrelated with the lack of ice usage or the use of too little ice
(Baasch et al. 1976) enables shrimp fishermen to land fish more easily than, e.g., in most shrimp fisheries in thewestern hemisphere. Perhaps more important is the fact that there is typically a ready market for all bycatch inSoutheast Asia for use as human food, fish meal, animal or fish feed or fish sauce. Other than for human food,the bycatch need not be in good condition to be marketed.
All of the above problems occur because shrimp occur in commercially exploitable quantities in SoutheastAsia only in habjtats which are also the habitats of a large number of fish, and often in which the fish occur
predominantly as juveniles.
In fact, the co-occurrence of certain species of shrimp with certain species offish led to some fish speciesbeingreferred to as "shrimp indicators"; such species are, for example, Bombay duck (Harpodon neheros), croakers(Fam:Sciaenidae) and hairtail (Fam: Trichiuridae) (Unar and Naamin 1984). Other indicator species are Leiognathusequulus and Leiognathus splendens (Rapson and McIntosh 1972).
This implies that in Southeast Asia, at least, attempts to. "disentangle" the smaIl-scale inshore fisheries from
the trawl fisheries by classical legislative or adm1nistrative means (exclusive zones, bans on inshore fishing fortrawlers, and others) will generally not work because the offshore stocks, defined roughly as those occurring atdepths greater than 50 m, simply cannot support commercial trawl fisheries. Figure 5 shows the reason why.
The development of gear capable of selectively catching shrimp or at least increasing the proportion of
shrimp in catches was at its onset driven by two considera~ions, neither of them necessarily related to attempts toreduce fish mortality per se. They were:
- to reduce the turtle bycatch,
- to reduce the time spent sorting the shrimp from the overall catch.
The first of these considerations affected mainly the USA segment of the Gulf of Mexico shrimp fishery(Watsonand Seidel 1980), and is related to concerns that are external to the fishery itself (i.e., to conserve turtles).The second consideration is often due to economic considerations within the fishery itself and may in the longtermbe more successful, especially when the reduction of the fish bycatch can be demonstrated to benefit the finfish
fisheries. Figure 6 illustrates schematically some technological approaches to reducing shrimp bycatch (see alsoSternin and Allsopp 1982).
Within Southeast Asia, research on fish-excluding devices on shrimp trawlers has been conducted mainly
in Indonesia, notably in the Arafura Sea. Reports of these experiments have been presented by Sujastani (1984and Figure 6). Some conclusions from these experiments are:
"The application of [ a bycatch excluding device J for shrimping is very useful for fishery management.It conserves fishery resources, saves operational time for sorting and reduces waste. The simultaneous
implementation of (a bycatch excluding device and mesh-size. regulation for (the) shrimping industry inthe Arafura Sea (...) has been an ideal management measure."
The effectiveness of the bycatch excluding device (BED) is reported to stem from the feature that, whilereducing the shrimp catch to an insignificant extent, it reduces the fish catch to a large exte'nt, thus markedly

156
Little exploited stocksAdjusted catch/effort (kg/h) Catch/effort (kglh)
09 1~0 290 390 00 100 200 300
50 50
-E E- -.c 100-CoQ)
o
of: 100c.Q)
o
150. Ph"ili ppines.
(1946-47, all shelf)
150 Burma(1979-'82, aU shelf)
200 200
Fig. 5. Depth distribution of some Southeast Asian demersa
~
stOCkS'as established from trawling surveys using
similar gears, or through appropriate conversion factors. Not similarity of the two little-exploited stocks, and theabsence of the shallow water "bulge" in the exploited stoc s, suggestive of a concentration of trawl effort inshallow waters (graphs based on data in Warfel and Manaco 1950, Pauly et aI. 1984, Saeger 1983, Saeger et al.1976 and Sujastani et al. 1976, respectively).
Strongly explbited stocksCatch/effort (kglh) Cateh/effort (kglh)
09 100 20000
100 200I I
-I I I I 7 I
'-;>
E
-;:50001 J 001
c.Q)
0
lQO Iocr . t 100
Southern Samar Sea Nort Java Coast I Malacca Strait(1979 -aO,phi Iippines) (1-97 ,Indones ia) (1975, Indonesia)
157
BagA
BED~~
I, I'I ,
,~""""- "
"- ""
Reverse barrier
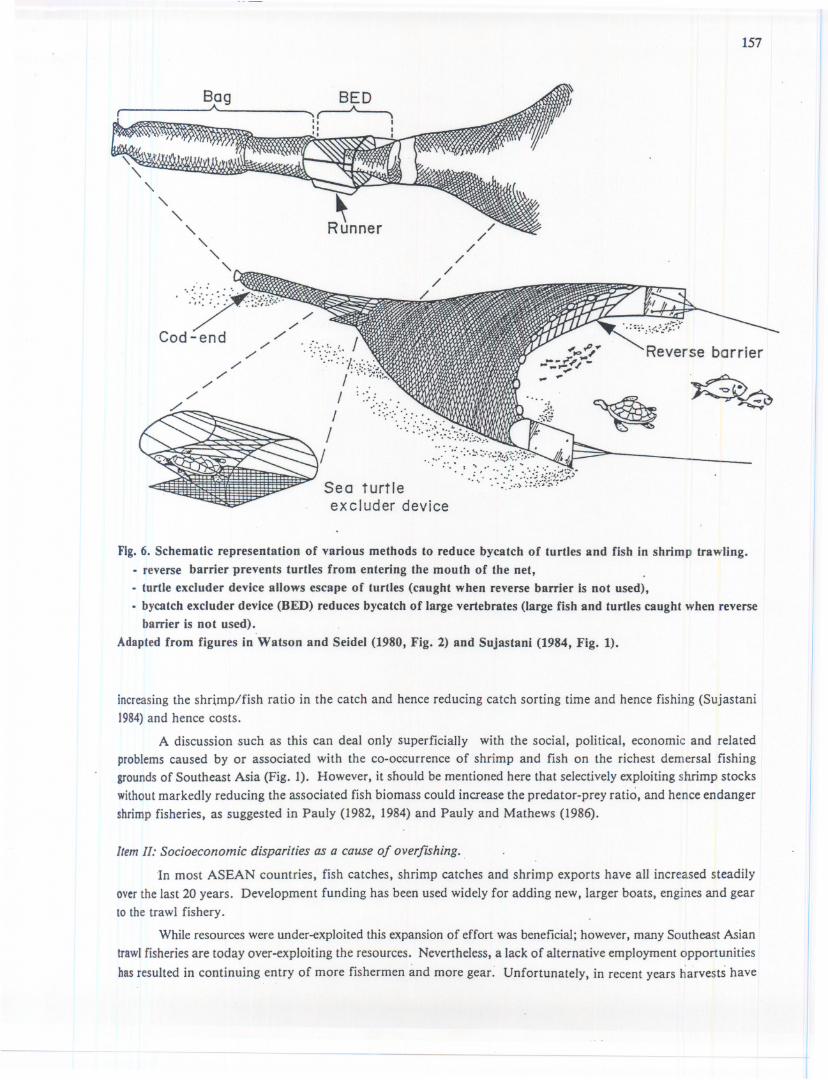
Fig. 6. Schematic representation of various methods to reduce bycatch of turtles and fish in shrimp trawling.. reverse barrier prevents turtles from entering the mouth of the net,. turtle excluder device allows escape of turtles (caught when reverse barrier Is not used),. bycatch excluder device (BED) reduces bycatch of large vertebrates (large fish and turtles caught when reverse
barrier is not used).
Adapted from figures in Watson and Seidel (1980, Fig. 2) and Sujastani (1984, Fig. 1).
increasingthe shrimp/fish ratio in the catch and hence reducing catch sorting time and hence fishing (Sujastani1984)and hence costs.
A discussion such as this can deal only superficiaJIy with the social, political, economic and related
problems caused by or associated with the co-occurrence of shrimp and fish on the richest demersal fishinggroundsof Southeast Asia (Fig. I). However, it should be mentioned here that selectively exploiting shrimp stockswithoutmarkedly reducing the associated fish biomass could increase the predator-prey ratio, and hence endangershrimp fisheries, as suggested in Pauly (1982, 1984) and Pauly and Mathews (1986).
Item II: Socioeconomic disparities as a cause of overj"lShing.
In most ASEAN countries, fish catches, shrimp catches and shrimp exports have all increased steadily
overthe last 20 years. Development funding has been used widely for adding new, larger boats, engines and gearto the trawl fishery.
While resources were under-exploited this expansion of effort was beneficial; however, many Southeast Asiantrawlfisheriesare today over-exploitingthe resources. Nevertheless,a lackof alternativeemploymentopportunities
hasresulted in continuing entry of more fishermen and more gear. Unfortunately, in recent years harvestS have

u __ ....
158
been increasing relatively slowly compared to earlier years and have not kept pace with demand. Kent (1983) hasnoted that in Thailand, Malaysia and the Philippines, seafood exports have expanded sharply while per capitaconsumption of seafood has declined. In Malaysia {or example, per capita availability of fish declined 30070between1967 and 1975. An increasing amount of the fish bycatch consists of small fish, often the juveniles of importantcommercial species (Sinoda et 01. 1978), which are used for animal feed (e.g., for cultured catfish in Thailand).The importance of the fish catch in relation to shrimp fisheries will be examined further below.
Although shrimp fisheries utilizing a variety of gears have existed probably for centuries, the introductionto Southeast Asia of other trawls and the larger vessels used to fish them brought about a major transition. To
fully understand the impact of this transition it must be kept in mind that numbers of small-scale fishermenutilizing other small gears for fish and shrimp were increasing simultaneously. Trawling has created a "trashfisb".industry; as trawling has increased, landings and usage of bycatch have also increased (Sinoda et 01. 1978).
Boonyubol and Pramokchutima (1984) observed that total catch of food fish has increased only slightly since 1963in Thailand; however, the "trashfish" catch has increased dramatically as is demonstrated by the increased numberof fish meal factories from 6 in 1967 to 95 in 1980. The high value of the shrimp taken by trawlers "subsidizes"the harvesting of fish populations at densities lower than would be economical if only the fish were taken.
The net effect of the situation is the conflict between trawl fishermen and small-scale fishermen usingtraditional gears (Fig. 7). It is not surprising that there are fewer fish as a result of shrimp trawling, or thatsmall-scale fishermen catch less than previously, or that the small-scale fishermen recognize the trawlers as one ofthe causes of their problems: Outside of total bans as in Indonesia, efforts to restrict trawling on traditional
, small-scale fishing ground near shore are largely ineffective because these grounds yield the best shrimp catches.The small-scale fishermen have no tenure rights to the resources or the areas fished and' thus tension mountsbetween the many poor fishermen and small number of well-equipped trawl owners and operators. Traditionalfishing and management systems have eroded and few viable alternative systems are in sight, short of radicalmeasures such as the trawling ban implemented in Indonesia (Sardjono 1980).
-Q)::3-
..cOU >
~
° 0U ......
..cOeJ).-o Q)J-3:
c-
...."..... ........... ."...............
G I . ..................... ..........................ea r . ................................
. . ...................................." ..".. . . . . . . . . . . . . . . . . . . . . ., ... . . . . ... . . . . . . . . . . . . . . . . . .. :.:.:.:.:.: .G..~...
(...
)..2. ..:.:.:.:.:.:.:............... . . . .... . . . . . . . .. . .. ... ear s .............. . '...' ' ............ ..... ... . ............. . . . . . . . . . . . . . . ... . . . . . . . . . . . . . . . . . . . . . . . . . . . . .. . .1 1.I.' I.'... '. I.'. ' ' ' '. ........ . . . . . . ,.. . . . . . . . .......................................................................
Outside
Time
Fig. 7. Schematic re.presentation of the basic cause for conflicts between two types of gears exploiting a commol(multispecies) stock with a flat-topped surplus-produCtioncurve. Note that environmental and/or economicfluctuations may trigger off outside intervention ("management"), without being the actual reason why Olltgroup is "squeezed" by the other-which is actually due to gear(s) 2 being economically more efficient-or maRheavily subsidized-than the other. (see Larkin et 01. 1984 for a detailed discussion of this moded).

159
Discussion
The shrimp trawling problem discussed above is an example of the broader, general problem of conflictsbetween large-scale, expansive gear users and the small-scale, poor fishermen. Management agencies havegenerallybeen unable to formulate rational non-contradictory sets of management goals under these circumstances
(Lawson1978and see contributions in Pauly and Murphy 1982). In fact, they are serving two masters and politicalexpediencydictates that stated management goals appear to serve both the interests of the large-scale commercialfishermenand the poor small-scale fishermen. Thus, management goals often simultaneously include increasingtotalsustained harvest, increasing exports, increasing employment, improving distribution of benefits among thefishermenand improving the economic efficiency of the industry.
Among the various pressure groups striving to influence management decisions, the group most likely toprevail is that of the wealthy boat owners and exporters of high-priced fishery products (particularly shrimp)especiallyif the country concerned is "hungry for foreign exchange". Poor fishermen in Southeast Asia faceextremedifficulties in organizing themselves and thus have less opportunity to state their ca'se.
Fishery management schemes which do not address these issues, and especially the crushing povertyexperiencedby most fishermen and their families in Southeast Asia (as well as in other parts of the developing world),arebound to fail.
Acknowledgements
I would like to thank Ms. Matana Boonyubol (Fisheries Department, Bangkok) for providing me the thedataand references used to extend Table 2 beyond 1970.
References
ANON,1979
ANON,1981
ANON,1982
Fisheries research. Fisheries Division, Department of Primary Industry, Annual Report 1978. PortMoresby, Papua New Guinea. 98 pp.
Fish market news. Fish. Marketing Review, Manila 3(1):51-60.
Notes on fisheries in Burma. Socialist Republic of the Union of Burma, Min. Agr. & Forests. 23 pp.
ANON, Asia 1986 Yearbook. Far Eastern Econ. Rev., HongKong. 272 pp.1985
AOYAMA, T., The South China Sea Fisheries demersal resources. South China Sea Development and1973 Coordinating Programme. SCS/DEV /73/3. Manila. 80'pp.
BAASCH, H., P. JARCHAU, H. VON WESTERNHAGEN AND M. ZUREK, Fisherei auf den Philippinen
1976 und Moglichkeiten ihrer Forderung. Mimeographed Report, Fed. Min. Econ. Coop. Fed. Rep. ofGermany, Bonn. 133 pp.
BEDDINGTON, J .R. AND J .G. COOKE, The potential yield of fish stocks. FAO Fish. Tech. Pap. 242. Rome,1983 47 pp.
BEVERTON, R.J.H. AND S.H. HOLT, On the dynamics of exploited fish populations. Fish. Invest. Ministr.1957 Agric. Fish. Food Greal Brit. Ser. 2. Sea Fish 19. 533 pp.
BOONYUBOL, M. AND S. PRAMOKCHUTIMA, Trawl fisheries in the Gulf of Thailand. ICLARM1984 Translations 4. International Center for Living Aquatic Resources Management, Manila. 12 pp.
CHARNPRASERTPORN, T., An analysis of demersal fish catches taken from Otter-board trawling survey in the1982 Gulf of Thailand, 1980. Demersal Fish. Rep. No.1. Mar. Fish. Div., Dept. of Fish., Bangkok,
Thailand (in Thai).

160
CURIE, D.J., Studies on the biology of penaeid prawns and the prawn fishery in the Brunei estuary. Monogr.1982 Brunei Mus. J. 5:134-188.
EIAMSA-ARD, M., An analysis of demersal fish catches taken from otterboard trawling survey in the Gulf of1981 Thailand, 1979.DemersalFish. Rep. No.1. Mar. Fish. Div., Dept. ofFish., Bangkok, Thailand (in
Thai).
EIAMSA-ARD, M. AND D. DHAMNIYOM, An analysis of demersal fish catches taken from otterboard1979 trawling survey in the Gulf of Thailand, 1977. DemersalFish. Rep. No.1. Mar. Fish. Div., Dept.
of Fish., Bangkok, Thailand (in Thai).
EIAMSA-ARD, M. AND D. SHAMNIYOM, An analysis of demersal fish catches taken from otterboard1980 trawling survey in the gulf of Thailand, 1978.DemersalFish. Rep. No.2. Mar. Fish. Div., Dept. of
Fish, Bangkok, Thailand (in Thai).
FOX, W.W., An exponential model for optimizingexploited fishpopulations. Trans. Amer. Fish. Soc. 99:80-88.1970
FRANCIS, R.C., Relationship of fishing mortality to natural mortality at the level of maximum sustainable1974 yield under the logistic stock production model. J. Fish. Res. Board Can. 31:1539-1542.
FRIELINK, A.B., JR., Coastal fisheries in Papua New Guinea: the current situation. Fisheries Division,1983 Department of Primary Industry, Res. Rep. 83-10.Port Moresby, Papua New Guinea. 33 pp.
GULLAND, J.A., Manual of methods for fish stock assessment. Part I. Fish population analysis. FAO Man.1969 Fish. Ser. 3. pag. var.
GULLAND, J.A., editor, The fish resources of the oceans. FAO Fish. Tech. Pap. 97. Rome. 425 pp.1970
GULLAND, J .A., Long-term potential effects from management of the fish resources of the North Atlantic.1982 J. Cons. Int. Explor. Mer. 40(1):8-16.
GULLAND, J.A., Fish stock assessment. ~ Manual of basic methods. FAO/Wiley, New York, 223 pp.1983
HINTON, H.C., . East Asia and the Western Pacific. 1984. Skye Corporation, Stryker-Post Publications,1985 Washington. 104 pp.
JONES, R., Mesh regulation in the demersal fisheries of the South China Sea. FAO/UNDP South China
1976 Sea Fisheries Development and Coordinating Programme. SCS/76/WP/36. Manila 79 pp.
KENT, G., The pattern of fish trade. ICLARM Newsl. 6(2):12-13.1983
LARKIN, P.A., C.W. CLARK, N. DAAN, S. DUTT. V. HONGSKUL, S.A. LEVIN, G.G. NEWMAN, D.1984 PAULY, G. RADACH AND H.K. ROSENTHAL, Group Report: Strategies for Multispecies
Management p. 287-301 In R.M. May (ed) Exploitation of Marine Communities. DahleIIIKonferenzen, Springer-Verlag, Berlin.
LARKIN, P.A. AND W. GAZEY, Applications of ecological simulation models to management of tropical1982 multispecies fisheries, p. 123-140. In D. Pauly and G.I. Murphy (eds.) Theory and management o(
tropical fisheries. ICLARM Conference Proceedings 9, 360 pp.
LAWSON, R., Incompatibilities and coriflicts in fisheries planning in Southeast Asia. Southeast Asian J. Soc.1978 Sci. 6(1/2): 11.5-135.
LINDLEY, R.H., Cod-end escapement from a demersal trawl with particular reference to the Leiognathidae.1982 Monogr. Brunei Mus. J. 5:99-114.
MARR, J.C., Fishery and resource management in Southeast Asia. Resources for the Future, RFF/PISFA
1976 Pap. 7. Washington. 62 pp.

161
MEEMESKUL,Y., Optimum mesh size for the trawl fishery in the Gulf of Thailand. Indo. Pac. Fish. Counc.
1979 RRD/II/79/INF/13. 20 pp.
MEEMESKUL, Y., An analysis of demersal fish catches taken from otterboard trawling survey in the Gulf of
1986 Thailand, 1982. Mar. Fish. Div., Dept. of Fish., Bangkok, Thailand (in Tha.i).
NAAMIN,N., Population dynamics of banana prawn (Penaeus mergu;ensis de man) in the Arafura Sea, with
alternative management plan. [ In Indonesian.] Ph. D. diss. Bogor Agricultural University,Bogor, Indonesia. 256 pp.
PAULY,D., Biological overfishing of tropical stocks. ICLARM Newsl. 2(3):3-4.1979
PAULY,D., On the interrelationships between natural mortalitv, growth parameters and mean environmental1980 temperature in 175 fish stocks. J. Cons. Int. Explor. Mer 39(3):175-192.
PAULY, D., A method to estimate the stock-recruitment relationship of shrimp. Trans. Amer. Fish. Soc.1982 111:13-20.
PAULY, D., Fish population dynamics in tropical waters: a manual for use with programmable calculators.1984a ICLARM.Studies and Reviews 8, 325 pp.
PAULY, D., Reply to comments on prerecruit mortality in Gulf of Thailand shrimp stocks. Trans. Amer.1984b Fish. Soc. 113:404-406..
PAULY, D., The population dynamics of short-lived species, with emphasis on squids. NAFO Scientific1985 Council Studies No. 9:143-154.
PAULY, D. AND C.P. MATHEWS, Kuwait's finfish ca~ch three times more than its trawlers. NAGA, tht1986 ICLARM Quart. 9(1):11-12.
PAULY,D. AND G.I. MURPHY, editors, Theory and management of tropical fisheries. ICLARM Confere.nce1982 Proceedings 9, 360 pp.
PAULY,D. AND R. NEAL, Shrimp vs. fish in Southeast Asian fisheries: the biological, technological and social.1985 problems, p. 487-510 In A. Yanez-Arancibia (ed.) Recursos Pesqueros Potenciales de Mexico: la pesca
acompanante del camaron. Prog. Univ. de Alimentos; lost. Cienc. del Mary Limnol., lost. Nacl. de Pesca,UNAM, Mexico, D.F. .748 pp.
PAULY,D., SANN AUNG, L. RIJA VEC AND"HTUN HTEIN, The marine living resources of Burma: a short
1982 review, p. 96-108. In Report of the 4th Sessionof the Standing Committee on ResourcesResearchand Development of the Indo Pacific Fisheries Commission, Jakarta, 23-29 August 1982. .FAOFish. Rep. No. 3.18. Rome. 108 pp.
PAULY, D. AND M. SORIANO, Some practical extensions to Beverton and Holt's yield-per-recruit model, p.1986 491-496.In: J.L. Maclean, L.B. Dizon and L.V. Hosillos (eds.) The First Asian Fisheries Forum.
Asian Fisheries Society, Manila, Philippines.
POPE, J.G., Stock assessment in multispecies fisheries, with special reference to the trawl fishery in the Gulf1979 of Thailand. South China Sea Fisheries Development and Coordinating Programme.
SCS/DEV /79/19, Manila, 106 pp.
PRICE, A.R.G. AND KYAW HTIN, Preliminary stock assess~ent of the marine shrimp resources is Burma.1984 FI:DP/BUR/77/003/Field Document 4. FAO, Rome. 28 pp.
RAPSON, A.M. AND C.R. McINTOSH, Prawn surveys in Papua New Guinea. Res. Bull. Dept. Agr. Stock1972 Fish. 3, Port Moresby. 98 pp.
RICKER, W.E., Stock and recruitment. J. Fish. Res. Board Can. 11:559-623.1954
RICKER, W.E., Linear regression in fishery research. J. Fish."Res. Board Can. 30:409-434.1973

162
SAEGER, J., editor, Results of the Samar Sea survey. University of the Philippines in the Visayas, COllege of1983 Fisheries. Tech. Rep. Dept. Mar. Fish. 3:1-191.
SAEGER, J., P. MARTOSUBROTO AND D. PAULY, First report of the Indonesian-German Demersal1976 Fisheries Project: results of a trawling survey in the Sunda Shelf area. Contrib. Dem. Fish.
Proj./Mar. Fish. Res. Inst. (1):3-46. Jakarta.
SAINSBURY, K.J., Optimum mesh size for tropical multispecies trawl fisheries. J. Cons. Int. Explor. Mex1984 41(2):129-139.
SARDJONO, I., Trawlers banned in Indonesia. ICLARM Newsl. 3(4):3.1980
SCHAEFER, M.B., A study of the dynamics of the fishery for yellowfin tuna in the eastern tropical Pacific1957 Ocean. Inter-Amer. Trop. Tuna Comm., Bull, 2:247-268.
SCSP, Report of the workshop on the biology and resources of penaeid shrimps in the South China Sea1981 area. Part II. 30 June-5 July 1980. Kota Kinabalu, Sabah, Malaysia. South China Sea Fisheries
Development and Coordinating Programme. SCS/GEN/81/30. Manila. 143 pp.
SIL VESTRE, G.T., Preliminary a!lalysis of the'optimum mesh size for the demersal trawl fishery of the Samar1986 Sea, Philippines. University of the Philippines in the Visayas, College of Fisheries Tech. Rep. Dept.
Mar. Fish. 7:43-65.
SINODA, M., PANG YONG LIM AND SEN MIN TAN, Preliminary study of trash fish landed at Kangkar fish1978 market in Singapore. Bull. Jap. Soc. Sci. Fish. 44(6):595-600.
SINODA, M., S.M. TAN, Y. WATANABE AND Y. MEEMESKUL, A lJ1ethod for estimating the best cod-end1979 mesh size in the South China Sea area. Bull. Choshi Mar. Lab., Chiba Univ. 11:65-80.
SMITH, I.R., D. PAULY AND A.N. MINES, Small-scale fisheries of San Miguel Bay, Philippines: options for
1983 management and research. ICLARM Technical Reports II, 80 pp.
STERNIN, V. AND W.H.L. ALLSOP, Strategies to avoid bycatch in shrimp trawlings, p. 61-64. In Fish1982 bycatch...bonus from the sea. Report of a Technical Consultation on shrimp bycatch utilization
held in Georgetown, Guyana, 27-30 October 1981. Ottawa, Ont., CIID 1983. 175 pp.
SUJASTANI, T., The bycatch excluder device, p. 91-95. In: Report of the 4th Session of the Standing Committee1982. on Resources Research and Development of the Indo-Pacific Fishery Commission, 23-29 August
1982 Jakarta. FAO Fish. Rep. No. 318. Rome. 108 pp.
SUJASTANI, T., P. MARTOSUBROTO AND D. PAULY, A review of the demersal fishery of Indonesia in the1976 Malacca Strait, based on recent surveys and catch and effort data p. 23-47. In Report of the
workshop on the fisheries resources of the Malacca Strait, Part I. SCS/GEN/76. Manila. 85 pp.
TIEWS, K., Experimental trawl fishing in the Gulf of Thailand and its results regarding the possibilities of1962 trawl fisheries development in Thailand. Veroff. Inst. Kust.-u. Binnenfisch. (25):1-53.
TIEWS, K., Bottom fish resources investigations in the Gulf of Thailand and an outlook on further1965 possibilities to develop the marine fisheries in Southeast Asia. Arch. Fischwiss. 16(1):67-108.
TIEWS, K., Fishery development and management in Thailand. Arch. Fischwiss. 24(1-3):271-300.1972
UNAR; M. AND N. NAAMIN, A review ofthe Indonesian shrimp fisheries and their management, p. 104-1001984 In J.A. Gulland and B.1. Rothschild (eds.) Penaeid shrimps: their biology and management.
Fishing News Books, Farnham, England, 312 pp.
VADH~NAKUL, S., Y. MEEMESKUL AND S. PRAMOKCHUTIMA, An analysis of demersal fish catches1985 taken from otterboard trawling survey in the Gulf of Thailand, 1981. Demersal Fish. Rep. No. S.
Mar. Fish. Div., Dept. of Fish., Bangkok, Thailand (in Thai).

163
NARFEL,G.E. AND P.R. MANACOP, Otter trawl explorations in Philippine waters. U.S. Dept. Int. Fish.1950 Wildl.ServoRes.Rep. 25.49 pp.
WATSON,J.W. AND W.R. SEIDEL, Evaluation of techniques to decrease sea turtle mortalities in the1980 southeastern United States shrimp fishery. ICES CM B-31. 8 pp.
WRIGHT,A. AND A.H. RICHARDS, A multispeciesfishery associatedwith coral reefs in the Tigak Islands,1985 Papua New Guinea. Asian Mar. Bioi. 2:69-94.
-