9. post-eocene record of eolian deposition at sites …
TRANSCRIPT

Weissel, J., Peirce, J., Taylor, E., Alt, J., et al., 1991Proceedings of the Ocean Drilling Program, Scientific Results, Vol. 121
9. POST-EOCENE RECORD OF EOLIAN DEPOSITION AT SITES 752, 754, AND 756,EASTERN INDIAN OCEAN1
Steven A. Hovan2 and David K. Rea2
ABSTRACT
The late Cenozoic history of eolian sedimentation in the eastern Indian Ocean was developed from samples recoveredduring drilling of Sites 752, 754, and 756. Temporal changes in the mass accumulation rate of eolian material reflect majorclimatic shifts in the southern African source region. A significant drop in dust mass flux values occurs near the end of thelower Oligocene. Younger sediments are characterized by a gradual reduction in dust accumulation rates until the middleMiocene after which values remain consistently low throughout the late Cenozoic, although a slight increase in eolianaccumulation rate occurs near 2.5 Ma. This pattern of dust mass flux appears related to the supply of dust-sized particlesin the source region and represents a shift in the climatic regime of southern Africa to increasingly more arid conditionsthroughout the late Cenozoic.
INTRODUCTION
A major objective of Ocean Drilling Program (ODP) Leg 121was to investigate spatial and temporal paleoclimatic changesusing sediments recovered in the eastern Indian Ocean. Changesin the mass flux of eolian dust result from changes in the supplyof dust-sized particles at the eolian source region and are relatedto the climatic character of the source region (Pye, 1989). Sedi-ments recovered during Leg 121 (Fig. 1) provide an opportunityto study Cenozoic changes in continental climate conditions ofthe Southern Hemisphere and measure their response to majorglobal events like the development of large ice sheets over Ant-arctica and the Arctic Ocean.
In the pelagic ocean, away from the influence of hemipelagic,turbidite, and ice-rafting depositional processes, the terrigenouscomponent of sediments is predominantly eolian dust (Fergusonet al., 1970; Leinen and Heath, 1981; Leinen et al., 1986). Mostof this material originates in semi-arid to arid regions of conti-nents and is transported long distances in the middle to uppertroposphere by zonal wind systems. Temporal changes in the massflux of dust to the ocean are primarily controlled by the supply ofmaterial in the source region. For shorter time scales on the orderof years up to perhaps 500 k.y., arid to humid changes in thesource region climate are responsible for variations in the massflux of dust (Prospero et al., 1981; Rea et al., 1985; Prospero andNees, 1986; Hovan et al., 1989). On longer time scales, the fluxof eolian dust is related not only to regional climatic conditions(Fig. 2) but also to the overall supply of deflatable dust materialon the continent (Pye, 1989). That is, both climatic shifts fromhumid to arid and from hyperarid to arid result in increased dustfluxes from the source region because each create conditions thatform more fine-grained sedimentary particles available for trans-port. Sustained arid climatic conditions allow depletion of thesupply of dust-sized particles in the source region. Thus, aridregions like southern Africa and Australia, although climaticallyconducive to being a major source of eolian transported material,actually produce very low fluxes of continental dust since thesupply of dust-sized particles from those regions has been de-
1 Weissel, J., Peirce, J., Taylor, E., Alt, J., et al., 1991. Proc. ODP, Sci. Results,121: College Station, TX (Ocean Drilling Program).
2 Department of Geological Sciences, The University of Michigan, Ann Arbor,MI 48109-1063, U.S.A.
pletedfor millions of years (Lancaster, 1984; Prospero, 1985). Assignificant changes in the supply of dust particles occur in thesource region during major shifts in climatic conditions, eoliansediments from the eastern Indian Ocean should provide a generalpaleoclimatic history of the Australian or African source regions,recording both the timing of major climatic changes and thetemporal stability of climate regimes.
METHODSThe eolian component was isolated using a series of chemical
extractions as detailed by Rea and Janecek (1981). Carbonateswere removed by treating each sample with a weak acetic acidsolution. A buffered sodium citrate and sodium hydrosulfidesolution was used to remove oxides, hydroxides, and zeolites, andwarm sodium carbonate baths were used to dissolve biogenicsilica. The resulting precision of this method determined fromduplicate analyses is approximately ±5%. Since this proceduredoes not remove volcanogenic material, smear slides were madefor each of the extracted samples to provide semiquantitative,visual estimates of the amount of volcanic material present. Ex-tracted samples containing a large proportion of volcanic materialare noted in the text; the quantity of the total extracted sample lessvolcanogenic material is taken to be the terrigenous eolian mate-rial.
The mass accumulation rate (MAR) of eolian material to theseafloor can be determined by multiplying the weight percentageof eolian material by the linear sedimentation rate (LSR) anddry-bulk density (DBD) for each sample:
Eolian MAR [mg (cm2 k.y.)-1] = % extracted LSR (cm k.y.-1)DBD [g (cm3)"1) 1000
Linear sedimentation rates were determined using Leg 121 nann-ofossil zonations (Peirce, Weissel, et al., 1989) and geochronology ofBerggren et al. (1985). The dry-bulk density of each sample wascalculated from porosity values measured from the bulk sedimentwater content.
RESULTSDuring drilling on Broken Ridge at Sites 752 and 754 (Fig. 1),
we recovered sediments consisting of foraminifer or foraminifer-bearing nannofossil ooze deposited from the late Eocene throughthe Pleistocene. A disconformity at about 30 Ma separates an
219

S. A. HOVAN, D. K. REA
1 ON
10 S
2 0
3 0 '
4 0
6 0 '
751O0750O°748\
7 4 9 I >746|
*
•
Δ
•
o®
DSDP s.
ODP
ODP
ODP
ODP
ODP
Leg
Leg
Leg
Leg
Leg
Contour >nterva
tes
1 15
1 16
1 19
1 2 0
121
s
s
s
s
s
tes
tes
tes
tes
tes
• 3000 m
70°E 90° 100 120°
Figure 1. Index map of the eastern Indian Ocean showing the location of Leg121 drill sites, as well as other ODP/DSDP drill sites in the eastern IndianOcean.
apparently complete Neogene section from upper Eocene pelagicooze (Peirce, Weissel, et al., 1989). Sediments recovered fromSite 756 on Ninetyeast Ridge (Fig. 1) range in age from earlyOligocene to Pleistocene and are dominantly nannofossil oozewith foraminifer contents varying between 5% and 20% (Peirce,Weissel, et al., 1989). Linear sedimentation rates at all three siteswere generally low throughout the cored intervals varying be-tween 1.1 cm/k.y. and 0.2 cm/k.y., with the lowest values occur-ring during the late Oligocene and Miocene (Tables 1, 2, and 3).
Extracted material percentages never exceed 10% by weightof the total sediment (Figs. 3 and 4; Tables 1, 2, and 3). Since theextracted fraction contains a combination of both continental dustand volcanogenic material, smear slides were made for eachextracted sample to identify which samples contained a signifi-cant volcanic component. Large spikes of increased abundance ofextracted material occur near the end of the early Miocene and arerelated to input of volcanic material. The remaining samplescontain no appreciable volcanogenic contamination. In general,sediments from the Oligocene and lower Miocene sections con-tain the greatest percentage of dust. Abundances gradually de-clined throughout this period until the middle Miocene, and dustconcentrations and fluxes remained consistently low for the restof the Cenozoic (Figs. 3 and 4). Sediments from Sites 752 and 754
show a two-fold increase in eolian percentages at about 2.5 Macoincident with an upper Pliocene 51 8O enrichment (Fig. 3). Themass accumulation rate of extracted material ranges betweenabout 0.1 and 35 mg (cm2 k.y.)"1 and exhibits the same generalfeatures observed in the percentage data. The eolian flux recordfrom Site 754, however, displays an additional increase fromabout 50 to 60 mbsf which is not present in the percentage databut occurs in conjunction with higher LSR values for that interval.
IMPLICATIONS OF THE EOLIAN RECORD
The most striking characteristic of the eolian flux pattern insediments of Sites 752, 754, and 756 is the extremely low rate ofaccumulation throughout most of the late Cenozoic. These lowrates appear to characterize the Southern Hemisphere; similarlylow dust fluxes were observed in Deep Sea Drilling Project(DSDP) Legs 91 and 92 sediments from the southeast PacificOcean (Schramm and Leinen, 1987; Bloomstine and Rea, 1986).Eolian sediments from the North Pacific, however, accumulate atrates 1 or 2 orders of magnitude greater than their SouthernHemisphere counterparts (Rea and Janecek, 1982; Rea et al.,1990) reflecting the overall decreased availability of fine sedi-mentary particles in Southern Hemisphere source regions. Tem-poral changes in the supply of dust-sized particles in the sourceregion are the primary control over the late Cenozoic pattern ofdust accumulation in the pelagic ocean. Paleoposition reconstruc-tions show crust at Site 756 originated during the late Eocene near50°S and slowly drifted northward to its present latitude near 27°S(Peirce, Weissel, et al., 1989). Sites 752 and 754 similarly driftednorthward to their present positions near 31°S during this interval.Provided past zonal wind circulation patterns were similar to thepresent, most of the dust deposited at these sites would have beentransported from the vast desert regions of southern Africa bywesterly upper tropospheric winds (Oort, 1983). Thus, accumu-lated eolian material at these sites most likely provides a distalrecord of the supply of fine-grained sedimentary particles fromsouthern Africa.
The Oligocene record of eolian accumulation is characterizedby a marked drop in dust flux at the end of the early Oligocene(Fig. 4). Although this change occurs near an age boundary, thedecrease in eolian percentages during this interval suggests thatit is not simply an artifact of our age model (Fig. 4; Table 3). Thus,an important change must have occurred in the source region ofeolian dust at the beginning of the late Oligocene which severelyreduced the amount of fine sedimentary particles available foreolian transport. Pye (1989) suggests that a reduction in dust fluxwill occur if regional climatic conditions shift from either semi-arid to more humid or from arid to more arid (Fig. 2). Studiesinvolving the sediments and landforms of southern African desertregions suggest arid to semi-arid conditions have prevailedthroughout much of the past 20 Ma and possibly much longer(Lancaster; 1981) Thus, the reduction in dust flux values at theend of the lower Oligocene appears to represent a sustained shiftto more arid climatic conditions in the southern Africa eoliansource region.
After the major flux decrease at the end of the early Oligocene,dust accumulation rates continued to decline gradually during thelate Oligocene and early Miocene (Figs. 3 and 4) until the middleMiocene when eolian accumulation rates dropped to extremelylow values generally less than 1.5 mg (cm2 k.y.)"1 and remainedconsistently low until the present. The eolian record at Site 754shows a period of higher accumulation rates during the middleMiocene. Since the eolian percentage data from Site 754 correlatewell with the eolian percentage records from Sites 752 and 756and show no increase at this time (Figs. 3 and 4), this portion ofthe eolian accumulation record probably reflects differences inthe calculated linear sedimentation rates and may not represent a
220

POST-EOCENE RECORD OF EOLIAN DEPOSITION
hyperarid | arid •emi- rid •ub-humtd humid
RELATIVE NUMBER OF ANNUAL DUST STORMS(aft r Py , 1989)
DUST POTENTIAL
300 400 500 600 700
MEAN ANNUAL PRECIPITATION (mm)
Figure 2. Schematic diagram representing the relationship between dust production and
climate in the source region.
true increase in the input of eolian material to Site 754. Thus, themiddle Miocene reduction in dust accumulation coincides with alarge increase in δ 1 8 θ associated with ice volume growth onAntarctica (Figs. 3 and 4) and apparently marks a further shift togreater aridity in southern African climate (Fig. 2). Extremely lowdust accumulation rates since the middle Miocene imply that theeolian source region has remained under stable hyperarid condi-tions, essentially "blown dry" of dust particles, throughout muchof the entire late Cenozoic. Eolian accumulation rates increaseslightly near 2.5 Ma reflecting a greater supply of dust particlesin southern Africa as would occur during a shift to relatively lessarid regional climate conditions. Lancaster (1981, 1984) identi-fied a Quaternary increase in annual rainfall throughout the Kala-hari region of southern Africa based on extensive dune systemswhich have become fixed by savanna vegetation. These climaticchanges occur coincident with late Pliocene continental icegrowth reflected in the δ 1 8 θ record (Fig. 3).
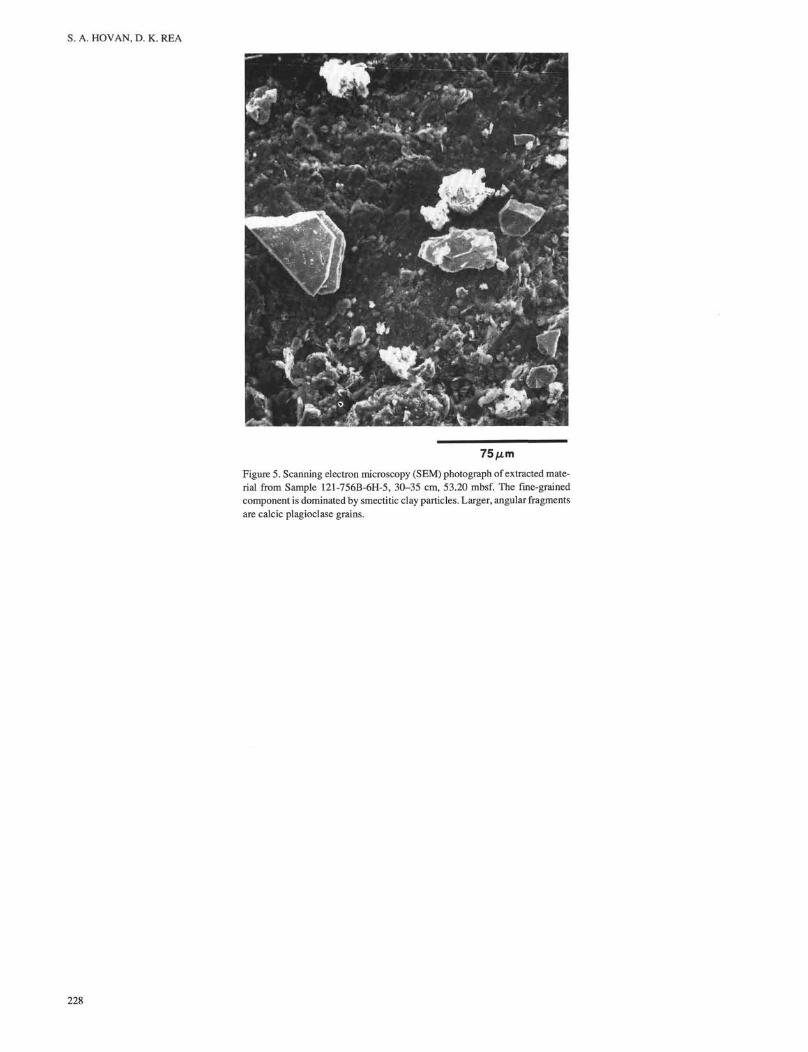
The major spikes in extracted percentage and flux values forthe middle Miocene (Figs. 3 and 4) are associated with input ofvolcanogenic material and reported for these sediments (Peirce,Weissel, et al., 1989). X-ray diffraction analysis of samples fromSite 756 (Sample 121-756B-6H-5, 30-35 cm) showed them to becomposed mainly of two types of volcanic material, smectiticclays, and calcic Plagioclase grains (Fig. 5). The size of thePlagioclase grains ranges from 10 µm to 175 µm. A large abun-dance of grains this size cannot be explained by normal atmos-pheric transport processes and may reflect a local source or nearbyerosional reworking of previously deposited basaltic-volcano-genic material.
CONCLUSIONS
Isolation and analysis of eolian material in sediments fromSites 752, 754, and 756 provide a distal record of paleoclimaticvariation in the southern Africa eolian source region. Temporalvariations in the mass flux of dust suggest that climatic conditionsin southern Africa shifted to more arid conditions near the begin-ning of the late Oligocene. Regional climates experienced a fur-ther shift to hyperaridity during the middle Miocene. Such
conditions appear to have prevailed for much of the late Cenozoicexcept for a slight decrease in aridity near 2.5 Ma.
ACKNOWLEDGMENTS
We thank Tom Janecek and Eric Barron for reviews of thismanuscript. Janice Pappas was responsible for eolian extractionsfrom the Broken Ridge samples. This work was supported byfunds from JOI-USSAC and from the National Science Founda-tion via grant no. OCE-8811299.
REFERENCES
Berggren, W. A., Kent, D. V., Flynn, J. J., and Van Couvering, J. A.,1985. Cenozoic geochronology. Geol. Soc. Am. Bull., 96:1407-1418.
Bloomstine, M. K., and Rea, D. K., 1986. Post-middle Oligocene eoliandeposition from the trade winds of the southeast Pacific. In Leinen,M., Rea, D. K., et al., Init. Repts. DSDP, 92: Washington (U.S. Govt.Printing Office), 331-340.
Ferguson, W. S., Griffin, J. J., and Goldberg, E. D., 1970. Atmosphericdusts from the North Pacific: a short note on long range eoliantransport. /. Geophys. Res., 75:1137-1139.
Hovan, S. A., Rea, D. K., Pisias, N. G., and Shackleton, N. J., 1989. Adirect link between the China loess and marine δ 1 8 θ records: aeolianflux to the North Pacific. Nature, 340:296-298.
Lancaster, N., 1981. Palaeoenvironmental implications of fixed dunesystems in southern Africa. Palaeogeogr., Palaeoclimatol., Pa-laeoecol, 33:327-346.
, 1984. Aridity in southern Africa: age, origins and expression inlandforms and sediments. In Vogel, J. C. (Ed.), Late CainozoicPaleaeoclimates of the Southern Hemisphere, Rotterdam (A. A.Balkema Publishers), 433-444.
Leinen, M., Cwienk, D., Heath, G. R., Biscaye, P. E., Kolla, V., Thiede,J., and Dauphin, J. P., 1986. Distribution of biogenic silica and quartzin recent deep-sea sediments. Geology, 14:199-203.
Leinen, M., and Heath, G. R., 1981. Sedimentary indicators of atmos-pheric circulation in the Northern Hemisphere during the Cenozoic.Palaeogeogr., Palaeoclimatol., Palaeoecol., 36:1-21.
Oort, A. H., 1983. Global atmospheric circulation statistics, 1958-1973.NOAA Prof. Pap., 14:115-173.
Peirce, J., Weissel, J., et al., 1989. Proc. ODP, Init. Repts., 121: CollegeStation, TX (Ocean Drilling Program).
221

S. A. HOVAN, D. K. REA
Prospero, J. M., 1985. Records of past continental climates in deep-seasediments. Nature, 315:279-280.
Prospero, J. M., Glaccum, R. A., and Nees, R. T., 1981. Atmospherictransport of soil dust from Africa to South America. Nature, 289:570-572.
Prospero, J. M., and Nees, R. T., 1986. Impact of the North Africandrought and El Nino on mineral dust in the Barbados trade winds.Nature, 320:735-738.
Pye, K., 1989. Processes of fine particle formation, dust source regions,and climatic changes. In Leinen, M., and Sarnthein, M. (Eds.), Paleo-climatology and Paleometeorology: Modern and Past Patterns ofGlobal Atmospheric Transport: Boston (Kluwer Acad. Publ.), 3-30.
Rea, D. K., Hovan, S. A., and Janecek, T. R., in press. Late Quaternaryflux of eolian dust to the pelagic ocean. In Hay, W. W. (Ed.), Geoma-terial Fluxes, Glacial to Recent. National Research Council, Wash-ington (Nat. Acad. Sci. Press).
Rea, D. K., and Janecek, T. R., 1981. Mass accumulation rates of thenon-authigenic, inorganic, crystalline (eolian) component of deep-seasediments from the western mid-Pacific Mountains, DSDP Site 463.
In Theide, J., Valuer, T. L., et al. Init. Repts. DSDP, 62: Washington(U.S. Govt. Printing Office), 653-659.
, 1982. Late Cenozoic changes in atmospheric circulation de-duced from North Pacific eolian sediments. Mar. Geoi, 49:149-167.
Rea, D. K., and Leinen, M., 1988. Asian aridity and the zonal westerlies:late Pleistocene and Holocene record of eolian deposition in theNorthwest Pacific Ocean. Palaeogeogr., Palaeoclimatol., Palaeoe-col., 66:1-8.
Rea, D. K., Leinen, M., and Janecek, T. R., 1985. Geologic approach tothe long-term history of atmospheric circulation. Science, 227:721-725.
Schramm, C. T., and Leinen, M., 1987. Eolian transport to Hole 595Afrom the Late Cretaceous through the Cenozoic. In Menard, H. W.,Natland, J. H., Jordan, T. H., Orcutt, J. A., et al., Init. Repts. DSDP,91: Washington (U.S. Govt. Printing Office), 469-473.
Date of initial receipt: 7 March 1990Date of acceptance: 3 October 1990Ms 121B-125
222

POST-EOCENE RECORD OF EOLIAN DEPOSITION
Table 1. Data for calculating the mass accumulation rates of the extracted compo-nent in samples from Hole 752A.
Core, section,interval (cm)
121-752A-
1H-1, 30-351H-2, 30-351H-3, 30-351H-4, 30-351H-5, 30-351H-6, 30-352H-1, 30-352H-2, 25-302H-3, 27-322H-4, 25-302H-5, 25-302H-6, 25-303H-1, 25-303H-2, 25-303H-3, 25-303H-5, 25-303H-6, 25-304H-1, 25-304H-2, 25-304H-4, 25-304H-5, 25-304H-6, 25-305H-1, 25-305H-2, 25-305H-3, 25-305H-4, 25-305H-5, 30-355H-6, 25-306H-1, 25-306H-2, 25-306H-3, 25-306H-4, 25-306H-5, 25-307H-1, 25-307H-2, 25-307H-3, 25-307H-4, 25-307H-5, 25-307H-6, 25-308H-1, 25-308H-2, 25-308H-3, 25-308H-4, 25-308H-5, 25-308H-6, 25-309H-1, 25-309H-2, 25-309H-3, 25-309H-4, 25-309H-5, 25-309H-6, 25-3010H-1, 25-3010H-2, 25-3010H-3, 25-3010H-4, 25-3010H-5, 25-3010H-6, 25-30
Depth(mbsf)
0.301.803.304.806.307.808.60
10.0511.5713.0414.5516.0518.0519.5521.0524.0525.5527.5529.0532.0533.5535.0537.0538.5540.0541.5543.1044.5546.6548.1549.6551.1552.6556.3557.8259.3560.8562.3563.8566.0567.5569.0570.5572.0573.5575.6577.1578.6580.1581.6583.1585.2586.7588.2589.7591.2592.75
Linearsedimentation
rate(cm/k.y.)
0.230.230.230.400.400.400.400.400.550.550.550.550.550.430.430.430.420.420.420.420.420.420.420.420.420.420.420.420.420.420.420.420.420.420.420.540.540.540.540.540.540.540.540.540.280.280.280.280.280.280.280.280.280.280.280.280.04
Dry-bulkdensity(g/cm3)
1.101.041.091.171.191.121.141.161.131.121.141.161.131.101.121.111.121.001.031.071.061.171.071.181.111.101.181.141.271.191.241.221.191.181.191.131.130.950.941.081.090.980.951.101.081.321.591.141.241.211.271.111.061.091.001.091.08
Extracted(%)
0.340.360.320.320.320.510.380.270.140.160.130.150.150.170.120.140.200.210.240.270.310.270.280.110.180.170.200.240.270.270.210.220.350.370.380.460.580.960.510.910.830.590.420.490.750.450.600.580.750.710.891.080.590.480.540.650.92
Extractedflux
mg/(cm2 k.y.)
0.90.90.81.51.52.31.71.20.91.00.80.91.00.80.60.71.00.91.01.21.41.31.20.50.80.81.01.21.41.41.11.11.81.81.92.83.64.92.65.34.83.12.22.92.31.72.71.82.62.43.23.41.71.51.52.00.4
223

S. A. HO VAN, D. K. REA
Table 2. Data for calculating the mass accumulation rates of the extracted compo-nent in samples from Hole 754A.
Core, section,interval (cm)
121-754A-
1H-1, 30-351H-2, 30-351H-3, 30-351H-4, 30-352H-1, 30-352H-2, 30-352H-3, 30-352H-4, 30-352H-5, 30-352H-6, 30-353H-1, 30-353H-2, 30-353H-3, 30-353H-4, 30-353H-5, 30-353H-6, 30-354H-1, 30-354H-2, 30-354H-3, 30-354H-4, 30-354H-5, 30-354H-6, 30-355H-1, 30-355H-2, 30-355H-3, 30-355H-4, 30-355H-5, 30-355H-6, 30-355H-7, 30-356H-1, 30-356H-2, 30-356H-3, 30-356H-4, 30-356H-5, 30-356H-6, 30-357H-1, 30-357H-2, 30-357H-3, 30-357H-4, 30-357H-5, 30-357H-6, 30-358H-1, 30-358H-2, 30-358H-3, 30-358H-4, 30-358H-5, 30-358H-6, 30-358H-7, 30-359H-2, 30-359H-3, 30-359H-4, 30-359H-5, 30-359H-6, 30-3510H-2, 30-3510H-3, 30-3510H-5, 30-3510H-6, 30-3511H-1, 30-3511H-2, 30-3511H-3, 30-3511H-4, 30-3511H-6, 30-3512H-1, 30-3512H-2, 30-3512H-3, 30-3512H-4, 30-3512H-5, 30-3512H-6, 30-3512H-7, 30-3513X-1, 30-3513X-2, 30-3513X-3, 30-35
Depth(mbsf)
0.301.803.304.806.407.909.40
10.9012.4013.9016.0017.5019.0020.5022.0023.5025.6027.1028.6030.1031.6033.1035.2036.7038.2039.7041.2042.7044.2044.8046.3047.8049.3050.8052.3054.4055.9057.4058.9060.4061.9064.2965.6067.1068.6070.1071.6073.1075.3076.8078.3079.8081.3085.0086.5089.5091.0093.2094.7096.2097.70
100.70102.90104.40105.90107.40108.90110.40111.90112.60114.10115.60
Linearsedimentation
rate(cm/k.y.)
0.30.30.30.30.30.80.80.60.60.60.60.80.50.50.50.50.60.60.60.60.60.60.30.30.30.30.30.30.30.30.3
.2
.2
.2
.2
.2
.2
.2
.2
.2
.2
.2
.2
.2
.2
.2
.2
.20.60.60.60.60.60.40.40.60.60.80.80.80.80.80.80.80.80.80.20.20.20.20.20.3
Dry-bulkdensity(g/cm3)
0.92
:
::
::
1.051.091.051.141.061.211.271.101.101.061.021.171.051.071.091.041.071.051.141.101.081.001.061.111.041.07).981.091.121.101.011.161.111.11.18
1.141.19.22.17.20.20.13.16.15.16.17.19.15.11.02.10.09.14.19.22.26.07.24.23.26.12.08.08.04.12
1.141.171.231.071.151.15
Extracted(%)
0.190.210.160.180.140.210.210.230.150.110.120.100.120.100.100.150.150.110.100.090.090.110.150.120.170.120.150.120.180.180.210.130.250.200.150.300.290.460.230.260.310.180.210.280.250.270.220.240.520.681.000.680.410.410.620.390.250.230.360.300.300.480.160.190.250.320.370.310.370.360.610.88
Extractedflux
mg/(cm2 k.y.)
0.60.70.60.60.51.72.01.81.00.70.80.80.60.50.50.8LO0.70.70.60.70.70.40.30.50.30.40.30.50.50.61.53.32.62.04.13.96.33.33.54.32.52.83.73.33.63.03.23.54.45.94.32.61.82.92.71.81.93.42.72.84.01.31.51.92.70.70.60.80.71.23.5
224

POST-EOCENE RECORD OF EOLIAN DEPOSITION
Table 3. Data for calculating the mass accumulation rates of the extracted compo-nent in samples from Hole 756B.
Core, section,interval (cm)
121-756B-
1H-1, 30-351H-2, 30-351H-3, 30-351H-4, 30-351H-5, 30-351H-6, 30-352H-1, 35-402H-2, 30-352H-3, 30-352H-4, 30-352H-5, 30-352H-6, 30-353H-1, 30-353H-2, 30-353H-3, 30-353H-4, 30-353H-5, 30-353H-6, 30-354H-1, 30-354H-2, 30-354H-3, 30-354H-4, 30-354H-5, 30-354H-6, 30-354H-7, 30-355H-1, 30-355H-2, 30-355H-3, 30-355H-4, 30-355H-5, 30-355H-6, 30-355H-7, 30-356H-1, 30-356H-2, 30-356H-3, 30-356H-4, 30-356H-5, 30-356H-6, 30-356H-7, 30-357H-1, 30-357H-2, 30-357H-3, 30-357H-4, 30-357H-5, 30-357H-6, 30-357H-7, 30-358H-1, 30-358H-2, 30-358H-3, 30-358H-4, 30-358H-5, 30-358H-6, 30-358H-7, 30-359H-1, 30-359H-2, 30-359H-3, 30-359H-4, 30-359H-5, 30-359H-6, 30-359H-7, 30-3510H-1, 30-3510H-2, 30-3510H-3, 30-3510H-4, 30-3510H-5, 30-3510H-6, 30-3510H-7, 30-3511H-1, 30-3511H-2, 30-3511H-3, 30-3511H-4, 30-3511H-5, 30-3511H-6, 30-3511H-7, 30-35
Depth(mbsf)
0.301.803.304.806.307.808.85
10.3011.8013.3014.8016.3018.4019.9021.4022.9024.4025.9028.0029.5031.0032.5034.0035.5037.0037.6039.1040.6042.1043.6045.1046.6047.2048.7050.2051.7053.2054.7056.2056.5058.0059.5061.0062.5064.0065.5065.9067.4068.9070.4071.9073.4074.9075.5077.0078.5080.0081.5083.0084.5085.2086.7088.2089.7091.2092.7094.2094.9096.4097.9099.40
100.90102.40103.90
Linearsedimentation
rate(cm/k.y.)
0.00.30.30.30.30.30.30.30.30.60.60.60.60.60.60.40.40.40.40.40.40.40.20.20.20.20.20.20.20.20.20.20.20.30.30.30.30.30.30.30.30.30.30.30.30.30.30.30.30.30.30.30.30.30.30.30.30.30.30.30.30.30.30.30.30.30.30.50.50.50.50.50.50.5
Dry-bulkdensity(g/cm3)
.06
.13
.17
.12
.19
.19
.19
.20
.22
.18
.23
.16
.22
.22
.21
.21
.22
.22
.11
.131.121.141.121.091.141.101.121.161.161.201.161.181.141.141.071.101.021.051.081.001.131.091.151.091.131.18.15.16.19.25.23.24.32.14.26.31.27.28.27.34.34.28.26.31.30.32.30.24.22.17.17.26.20.31
Extracted(* )
0.410.270.300.320.260.260.200.240.260.320.340.260.340.280.240.220.140.180.150.190.220.330.300.290.300.270.270.300.210.440.470.280.530.531.562.909.541.640.950.981.634.652.683.391.301.281.671.541.541.301.391.451.521.521.661.601.611.592.051.951.632.102.162.002.361.872.612.682.473.823.912.733.581.85
Extractedflux
mg/(cm2 k.y.)
0.10.91.11.10.90.90.70.91.02.42.71.92.72.21.81.10.70.90.70.91.01.60.70.60.70.60.60.70.51.01.10.71.21.95.4
10.331.4
5.53.33.15.9
16.49.9
11.94.74.96.25.75.95.25.55.85.85.06.16.15.95.97.57.56.37.87.97.68.97.19.9
16.815.322.823.317.521.812.3
225

S. A. HO VAN, D. K. REA
Site 752 2 3 4 0.0
Depth(mbsf)
20 -
0.5 1.00.0 0.4 0.8 1.2 0
80
100 LSR(cm/k.y.)
%ExtractedExtracted Flux
mg/(cm2 k.y.)
Site 7544 0.0 0.4 0.8 1.2 0.0 0.5 1.0 0
20 -
Depth(mbsf)
40 -
6 0 -
80 -
100
120 LSR(cm/k.y.)
%ExtractedExtracted Flux
mg/(cm2 k.y.)
Figure 3. Variations in δ 1 8 θ , linear sedimentation rate (LSR), and extracted sediment accumulation rates in samples from Sites 752 and 754.
226

Depth
δ 1 8 θ LSR
(‰) (cm/k.y.)
l 2 3 4 o.o 0.2 0.4 0.6 0.8 so
%CaCθ3 %Extracted Extracted Rux
mg/(cm2k.y.)
100 0 1 2 3 4 5 0 5 10 15 2 0 2 5
20-
40-
60-
80-
100-
Q
"I
Figure 4. Variations in δ 1 8 θ , LSR, CaCθ3 and extracted sediments in samples from Site 756. Oxygen isotope data from Rea et al. (this volume).
S. A. HO VAN, D. K. REA
m
m Φ ... I f
Efe
) .14 Lj
'I * '{
4
mm
ß" •
••
:
75µmFigure 5. Scanning electron microscopy (SEM) photograph of extracted mate-rial from Sample 121-756B-6H-5, 30-35 cm, 53.20 mbsf. The fine-grainedcomponent is dominated by smectitic clay particles. Larger, angular fragmentsare calcic Plagioclase grains.
228