9 october 2017 q2fy18 results preview - sakshi business · space, we reiterate our buy rating on...
TRANSCRIPT

Gradual path to recovery GST continues to drag earnings growth in second quarter but certain pockets of market like Auto, Cement & Metals & Mining showing early signs of pick up. Cement is expected to report double digit volume growth, which coupled with stable pricing will lead to healthy earnings growth amongst the larger players. Within the auto space, all the three Auto Ancillary stocks under coverage are expected to report strong growth. We expect higher YoY as well as QoQ earnings across the board from our metals & mining universe, led by favourable outcomes on three key areas – i) higher volumes, ii) higher realisations and iii) lower RM costs. We expect the Pharma sector to continue to report subdued numbers due to GST implementation & pricing pressure in the US generic market. Similarly, GST is expected to impact both broadcasters and print players as FMCG, Retail & Real estate companies cut advertising spends. We expect our banking universe to report modest growth in both NII / PAT following weak loan growth, NIM compression, lower other income (both fees and treasury gains) and accelerated provisioning. Our preferred picks are certain gems with strong future outlook like Tata Metaliks, Orient Refractories, Ramco Cement, JK Cement, Deccan Cement, Jagran Prakashan, FIEM Industries, Mayur Uniquoters, Aurobindo Pharma, Sanofi India & CARE.
Sector View: Outlook on the Metals & Mining universe to continue to remain positive on back of uptick in volumes, realizations & lower raw material costs. We expect our banking universe to report modest growth in both NII / PAT following weak loan growth, NIM compression, lower other income (both fees and treasury gains) and accelerated provisioning. For the Auto sector considering GST and BS-IV transitions are behind now, we believe 2HFY18 will witness stronger performance from CVs whereas PVs and 2Ws are likely to benefit on account of good monsoon progression, government focus on rural India and 7th pay commission. We continue to remain positive on the cement sector and expect companies under coverage to report double digit volume growth on YoY basis, however EBIDTA growth would remain under check due to cost pressures. In the media sector GST is expected to impact all players due to cut in ad spends across categories. We expect the pharma sector to remain under pressure due to GST implementation and pricing pressure in the US market.
Earnings: Within the metal & mining space we expect strong YoY earnings growth from HZL/Vedanta/JSW among largecaps and Graphite/Tata Sponge/Tata Metaliks in midcaps. We expect weak results from IFGL and Ratnamani. On account of good volume growth across different segments, Fiem, Mayur Uniquoters & Swaraj Engine are likely report strong numbers in this quarter. We expect a positive earnings surprise from Karnataka Bank in the banking space & GIC Housing Finance in the NBFC space. We expect micro-lending institutions to report weak NII growth / report losses for the quarter. In consumer companies we expect IFB Industries & Mirza to post healthy revenue growth, while the Dish TV could disappoint on both subscriber addition & ARPU. Within the cement sector we expect strong EBITDA growth from ACC & Ambuja in the large cap space and Star cement in the mid cap space. From the pharma space we expect a positive earnings surprise from Dr. Reddy’s Labs & Aurobindo Pharma.
Valuations: The quarter gone by was another strong quarter for Indian and global indices, with both BSE midcap and smallcap indices registering 5% return with the gush of domestic liquidity finding its way to the equity market & leading to multiple expansions across sectors and ideas. We like within the metals space stocks like Hindalco/Vedanta in largecaps and Orient Refractories/Tata Metaliks in midcaps. In the cement space we like JK Cement and the two south-India based cement companies, TRCL & Deccan Cement. In the Auto space we like Fiem Industries and Mayur uniquoters. In the media/consumer space we like Jagran Prakashan, La opala & Info edge. From the banking space, we like ICICI Bank/SBI in largecaps, Karnataka Bank in midcaps. Our Top Sells remain as M&M Financials, JK Lakshmi Cement & Orient Cement.
Positive earnings surprise
Y/E Mar (Rs mn) EBITDA
Q2FY18E YoY (%) QoQ (%)
Hindustan Zinc 30,570 47.2 28.2 Vedanta 61,454 31.8 26.1 JSW Steel 32,873 11.1 25.6 Graphite India 807 472.6 127.2 Tata Sponge 432 154.9 11.8 Tata Metaliks 672 47.4 35.7 Karnataka Bank 3192 37.2 3.1 GICHF 808 36.0 (8.6) Orient Cement 873 426.5 (25.3) ACC 3,831 40.0 (39.8) Ambuja Cement 4,155 15.9 (17.7) Star Cement 821 39.4 (48.3) IFB Industries 403 22.9 92.8 Mirza International 497 31.5 13.7 Abbott India 1,260 19.0 104.5 Aurobindo Pharma 10,265 10.5 22.0 Marksans Pharma 330 NA 13.8 Sanofi India 1,805 24.7 56.4
Source: Companies, Centrum Research Estimate, #PPOP
Negative earnings surprise
Y/E Mar (Rs mn) EBITDA
Q2FY18E YoY (%) QoQ (%)
IFGL Refactories 277 (5.0) 12.6 Ratnamani Metals 534 3.1 13.4 Shree Cement 4,382 (33.2) (35.6) Ramco Cements 2,223 (27.6) (11.8) Dish TV 2,102 (20.5) 4.5 ENIL 267 15.6 60.1 DB Corp 1,440 (4.3) (22.7) Sun Pharma 15,090 (52.4) 37.7 FDC 730 (12.4) 105.6
Source: Companies, Centrum Research Estimates
Top Buys Co. Name Rating CMP* (Rs) TP (Rs)
JK Cements Buy 972 1,310
Star Cement Buy 104 152 Ramco Cements Buy 705 820
FIEM Industries Buy 916 1,260
Mayur Uniquoters Buy 383 435
SUN TV Buy 780 840
Jagran Prakashan Buy 177 235
Info Edge Buy 1,060 1,090
Dish TV Buy 71 96
Aurobindo Pharma Buy 746 970 Sanofi India Buy 4,076 4,900
Orient Refractories Buy 149 170
Tata Metaliks Buy 717 890
Source: Centrum Research, *as on 6 October 2017
Top Sells Co. Name Rating CMP* (Rs) TP (Rs)
Ambuja Sell 279 200
JK Lakshmi Sell 395 360
Orient Cement Sell 155 114
Shree Cement Sell 18,775 13,340 Glaxo SmithKline Pharma Sell 2,415 1,390
MMFS Sell 419 250
Source: Centrum Research, *as on 6 October 2017
Centrum Equity Research Team +91 22 4215 9000
9 October 2017
INDIA
Q2FY18 Results Preview
In the interest of timeliness, this document is not edited.
Centrum Equity Research is available on Bloomberg, Thomson Reuters and FactSet

2 Q2FY18 Results Preview
Table of Contents
Cement & Building materials .......................................................................................................................................... 3
Financials ........................................................................................................................................................................... 12
Media / Consumer ......................................................................................................................................................... 21
Metals & Mining .............................................................................................................................................................. 27
Pharmaceuticals ............................................................................................................................................................. 35
Miscellaneous .................................................................................................................................................................. 46

Volume growth momentum picking up We expect aggregate EBITDA of the cement companies under our coverage to rise 6% YoY in Q2FY18 led by strong 12% YoY volume growth and 2% NSR increase amid 4% YoY cost inflation. Companies in the north and east markets have registered strong volume during the quarter. We expect strong EBITDA growth by Orient Cement, ACC, Ambuja Cements and Star Cement. Weak demand in south (ex-AP/Telangana should lead to YoY EBITDA decline for Ramco Cements and Deccan Cements under our coverage). We also estimate sharp EBIDTA fall YoY for Shree Cement. In the building materials segment, we expect Visaka Ind (VIL) to sustain its strong margin YoY.
Aggregate volume of companies under coverage to grow 12% YoY: We estimate strong industry sales in Q2FY18, driven by increased offtake in the north markets and continued demand momentum in the eastern and AP/Telangana markets. West and central markets sales are expected to be flat/marginally down YoY. In south, poor offtake in Tamil Nadu and Kerala markets continues to hurt overall growth. Thus the aggregate sales volume of the 10 companies under our coverage is expected to rise 12% YoY. We estimate strong 10%+ YoY volume growth from UltraTech, ACC, Ambuja, JK Cement, and JK Lakshmi. Star Cement’s volume dipped 23% YoY in Q2FY18 as the company has been cutting sales outside NE region (low margin business).
Aggregate EBITDA to rise 6% YoY: We expect average cement NSR (net of GST benefits) of companies in north/central/eastern regions to decline ~5%/3%/4% QoQ and by ~1%/3% QoQ in the west/south regions. Thus, average pan-India NSR should be lower by ~2% QoQ (seasonal impact of good monsoon across most parts in India). Thus, we expect average NSR of the 10 companies under our coverage to fall 2% QoQ but to rise 2% YoY. However, in our view, aggregate opex of these 10 companies should rise 4% YoY owing to higher fuel and diesel prices YoY (even though these have flattened on QoQ basis) despite operating leverage gains. Hence, unitary EBITDA should moderate 4% YoY to Rs859/MT. Among the covered companies, we estimate Orient Cement to see maximum upswing in its EBITDA (427% YoY on low base of last year), followed by 35%+ YoY increase in EBITDA of ACC, Ambuja and Star Cement. We estimate 27%+ EBITDA decline in case of Shree Cement and Ramco Cements and 14% YoY EBITDA fall for Deccan Cement.
Other building products – Visaka’s strong margin to sustain during the quarter: We expect sales uptick in ACS roofing business should boost building product segment margin amid lower offtake in textiles. Thus, we estimate VIL to deliver a modest 2% YoY EBITDA decline on the high base of last year. Lower tax, however, should aid 6% YoY PAT growth.
Stock recommendations: In our view, cement demand should remain buoyant led by sustained government led projects and good monsoon for second consecutive year. These alongwith slowing pace of new capacity addition and increased industry consolidation should boost pricing power. Thus, industry’s margin should expand despite fuel/freight inflation. GST is also expected to reduce logistics cost for the cement sector. In the large cap space, we like the market leader – UltraTech (strong volume growth visibility for next 2-3 years alongwith efficient cost structure) and recommend Buy on declines. In the mid cap space, we reiterate our Buy rating on Ramco Cements and Deccan Cement (debt free, superior return ratios, strong free cashflow outlook), Star Cement (leadership presence in lucrative NE region, strong return ratios). We remain negative on Shree Cement (expensive valuations), Ambuja Cements (expensive valuations amid limited growth outlook), JK Lakshmi and Orient Cement (both have large ongoing/expected capex to keep leverage at elevated levels). Even ACC would suffer on volume growth next year onwards. We continue to like VIL on account of its steady operational performance and growth outlook across all its three business segments.
Stock Price Performance (%)*
Company Name 1M 3 M 6 M 12 M
ACC (3.7) 8.1 16.8 6.7
Ambuja Cements (1.4) 10.0 14.5 10.3
Deccan Cement 0.0 0.4 (3.3) 8.3
JK Cements (4.6) 0.4 5.0 6.8
JK Lakshmi (7.8) (16.0) (12.8) (22.2)
Orient Cement (5.2) 0.1 6.9 (30.1)
Ramco Cements (2.2) (0.1) 5.0 13.4
Shree Cement 2.4 2.2 6.7 6.9
Star Cement (8.6) (17.1) (1.4) 35.6
UltraTech Cement (5.3) (4.1) (4.4) (0.7)
Visaka industries (VIL) 6.2 31.7 121.2 278.5
Nifty 0.6 3.2 7.7 14.6
Source: Bloomberg; * as on 06 October 2017
Current Rating and Target Prices
Company Name Rating *CMP (Rs) TP (Rs)
ACC Hold 1,740 1,520
Ambuja Cement Sell 279 200
Deccan Cement Buy 572 740
JK Cements Buy 972 1,310
JK Lakshmi Sell 395 360
Orient Cement Sell 155 114
Ramco Cements Buy 705 820
Shree Cement Sell 18,775 13,340
Star Cement Buy 104 152
UltraTech Cement Hold 3931 3,790
Visaka industries (VIL) Buy 709 620
Source: Centrum Research Estimates, * as on 06 October 2017
Rajesh Kumar Ravi, [email protected]; 91 22 4215 9643 Vinay Menon, [email protected]; 91 22 4215 9141
Quarterly Estimates Summary
Y/E Mar (Rs mn) Net Sales (Rs mn) EBITDA (Rs mn) EBITDA Margin (%) Adj. PAT (Rs mn)
Q2FY18E YoY (%) QoQ (%) Q2FY18E YoY (%) QoQ (%) Q2FY18E YoY (pp) QoQ (pp) Q2FY18E YoY (%) QoQ (%)
ACC ** 29,801 18.2 (13.7) 3,831 40.0 (39.8) 12.9 2.0 (5.6) 1,515 84.7 (53.6) Ambuja ** 23,554 15.9 (17.7) 4,155 37.1 (36.2) 17.6 2.7 (5.1) 3,625 30.8 (7.6) Deccan Cement 1,323 3.6 (2.4) 233 (14.3) (5.2) 17.6 (3.7) (0.5) 110 (18.2) (3.3) JK Cement 10,761 16.5 3.3 1,792 12.8 (9.4) 16.7 (0.6) (2.3) 564 37.9 (28.9) JK Lakshmi 7,714 17.7 (14.4) 928 (0.9) (22.9) 12.0 (2.3) (1.3) 116 (53.6) (59.1) Orient Cement 5,068 31.7 (10.8) 873 426.5 (25.3) 17.2 12.9 (3.3) 176 (54.7) Ramco Cements 9,610 (0.9) (3.0) 2,223 (27.6) (11.8) 23.1 (8.5) (2.3) 1,338 (35.4) (14.1) Shree Cement 20,936 4.3 (17.5) 4,382 (33.2) (35.6) 20.9 (11.8) (5.9) 1,964 (32.6) (55.4) Star Cement 2,708 (18.6) (36.8) 821 39.4 (48.3) 30.3 12.6 (6.7) 237 5,835.9 (77.9) UltraTech Cement 63,850 17.0 (3.6) 12,987 12.5 (16.8) 20.3 (0.8) (3.2) 4,203 (30.1) (52.8) Aggregate 1,75,325 13.7 (10.3) 32,225 5.7 (26.7) 18.4 (1.4) (4.1) 17,814 (15.6) (45.2) Visaka Industries 1,939 (3.2) (37.3) 260 (1.7) (44.4) 13.4 0.2 (1.7) 94 6.4 (59.3)
Source: Companies, Centrum Research Estimates Note: ** Y/E Dec (Data for Q3CY17E)
INDIA
Cement & Building materials 9 October 2017
.
Centrum Equity Research is available on Bloomberg, Thomson Reuters and FactSet

4 Q2FY18 Results Preview
Exhibit 1: Estimates Summary – Cement Companies
Company Rating CMP*
(Rs) TP (Rs) Adj EPS (Rs) EV/EBITDA (x) EV/MT (USD) RoCE (%)
FY17 FY18E FY19E FY17 FY18E FY19E FY17 FY18E FY19E FY17 FY18E FY19E
ACC Hold 1,740 1,520 34.2 43.6 62.3 18.0 16.7 13.0 123 144 140 7.3 9.1 12.4
Ambuja Cement Sell 279 200 4.9 7.0 8.4 15.0 21.8 18.2 131 212 211 6.7 7.2 8.3
Deccan Cement Buy 572 740 33.3 40.2 55.5 6.8 6.8 4.8 46 51 46 11.5 12.7 15.9
JK Cements Buy 972 1,310 35.4 55.2 79.8 10.5 10.3 8.0 87 100 92 8.9 11.1 13.7
JK Lakshmi Sell 395 360 7.0 11.0 19.7 17.5 13.2 10.0 90 88 84 7.8 7.3 9.4
Orient Cement Sell 155 114 (1.6) 6.2 6.1 25.1 13.2 10.0 86 89 87 1.4 7.7 7.0
Ramco Cements Buy 705 820 27.3 35.4 43.5 13.9 13.5 10.9 154 181 175 11.9 14.7 16.3
Shree Cement Sell 18,775 13,340 384.4 507.4 484.0 21.4 21.8 18.2 286 351 248 19.4 21.0 17.0
Star Cement Buy 104 152 4.1 6.9 7.8 9.5 8.4 6.9 177 191 127 12.0 16.5 17.0
UltraTech Cement Hold 3931 3,790 96.2 103.6 147.2 19.3 18.4 13.5 218 209 193 9.0 9.1 10.1
Source: Companies, Centrum Research Estimates, * as on 06 October 2017, (1USD= Rs65)
Exhibit 2: Estimates Summary – Other Building Materials
Company Rating CMP* (Rs) TP (Rs) Adj EPS (Rs) EV/EBITDA (x) P/E (x) RoCE (%)
FY17 FY18E FY19E FY17 FY18E FY19E FY17 FY18E FY19E FY17 FY18E FY19E
Visaka Ind BUY 709 620 32.1 34.0 40.9 4.0 10.3 8.6 5.7 20.9 17.4 8.4 9.3 10.5
Source: Companies, Centrum Research Estimates, * as on 06 October 2017
,,
Exhibit 3: Operational Estimates for Cement Companies
Y/E Mar (Rs mn) Sales Volume (mn MT) NSR (Rs/ MT) EBITDA (Rs/ MT))
Q2FY18E YoY (%) QoQ (%) Q2FY18E YoY (%) QoQ (%) Q2FY18E YoY (%) QoQ (%)
ACC ** 5.85 15.4 (13.2) 4,700 3.0 (2.2) 623 21.3 (31.9)
Ambuja Cement** 5.10 11.1 (16.0) 4,619 4.4 (2.0) 815 23.4 (24.0)
Deccan Cement 0.34 - (0.4) 3,890 3.6 (2.0) 685 (14.3) (4.8)
JK Cement 2.20 14.6 3.5 4,887 1.6 (0.2) 814 (1.6) (12.4)
JK Lakshmi 1.96 13.9 (14.4) 3,944 3.3 - 474 (13.0) (9.9)
Orient Cement 1.26 7.2 (10.0) 4,028 22.9 (0.9) 694 391.3 (17.0)
Ramco Cements 2.13 4.6 (1.0) 4,515 (5.3) (2.0) 1,044 (30.8) (11.0)
Shree Cement 4.96 8.5 (15.7) 4,021 1.2 (3.0) 869 (33.2) (25.0)
Star Cement 0.47 (23.0) (33.4) 5,471 8.8 (3.0) 1,735 80.9 (22.3)
UltraTech Cement 12.96 15.9 (1.7) 4,926 0.9 (2.0) 1,002 (3.0) (15.3)
Aggregate 37.23 12.1 (9.0) 4,618 2.3 (1.7) 859 (4.1) (19.8)
Source: Companies, Centrum Research Estimates, **Q3CY17. For JK Cement and UltraTech, Sales volume, NSR and EBITDA/Mt are blended numbers (Grey+White)

5 Q2FY18 Results Preview
Major input costs trends during Q2FY18
Exhibit 4: Crude price (Brent) up 2% QoQ, +11% YoY Exhibit 5: Diesel prices up 1% QoQ and up 7% YoY
Source: Bloomberg, Centrum Research Source: Bloomberg, Centrum Research
Exhibit 6: Domestic petcoke price were flat QoQ but were 17% higher YoY in Q2FY18
Exhibit 7: Indonesian coal is down 4% QoQ, but is still higher by 40% YoY
Source: Bloomberg, Centrum Research Source: Bloomberg, Centrum Research
Exhibit 8: Domestic HR Coil prices (used for Pre Engg Buildings) down 1% QoQ but is higher by 24% YoY
Source: Industry, Centrum Research
20
30
40
50
60
70
Jan
-15
Ap
r-15
Jul-1
5
Oct
-15
Jan
-16
Ap
r-16
Jul-1
6
Oct
-16
Jan
-17
Ap
r-17
Jul-1
7
Oct
-17
USD
/Bb
l
Brent
40
45
50
55
60
65
Jan
-15
Ap
r-15
Jul-1
5
Oct
-15
Jan
-16
Ap
r-16
Jul-1
6
Oct
-16
Jan
-17
Ap
r-17
Jul-1
7
Oct
-17
Rs/K
G
Diesel prices
3,000
4,000
5,000
6,000
7,000
8,000
Jan
-15
Ap
r-15
Jul-1
5
Oct
-15
Jan
-16
Ap
r-16
Jul-1
6
Oct
-16
Jan
-17
Ap
r-17
Jul-1
7
Oct
-17
Rs/M
T
Domestic Petcoke
3,000
4,000
5,000
6,000
7,000
8,000Ja
n-1
5
Ap
r-15
Jul-1
5
Oct
-15
Jan
-16
Ap
r-16
Jul-1
6
Oct
-16
Jan
-17
Ap
r-17
Jul-1
7
Oct
-17
Rs/M
T
Indonesian Coal
20,000
25,000
30,000
35,000
40,000
45,000
Jan
-15
Ap
r-15
Jul-1
5
Oct
-15
Jan
-16
Ap
r-16
Jul-1
6
Oct
-16
Jan
-17
Ap
r-17
Jul-1
7
Oct
-17
Domestic ex-mill HRC (Rs/MT)

6 Q2FY18 Results Preview
Building Materials - Cement
ACC (Rating: HOLD; Target price: Rs1,520)
Exhibit 9: Result Expectation - Consolidated
Particulars Q3CY17E Q3CY16 YoY (%) Q2CY17 QoQ (%)
Sales Volume (mn MT) 5.9 5.1 15.4 6.7 (13.2)
NSR (Rs/MT) 4,700 4,562 3.0 4,805 (2.2)
Sales (Rs mn) 29,801 25,215 18.2 34,533 (13.7)
EBITDA (Rs mn) 3,831 2,737 40.0 6,369 (39.8)
EBITDA margin (%) 12.9 10.9 200bps 18.4 (559)bps
EBITDA (Rs/MT) 623 513 21.3 914 (31.9)
Net profit (Rs mn) 1,515 820 84.7 3,262 (53.6)
Adj PAT margin (%) 5.1 3.3 183bps 9.4 (436)bps
Source: Company, Centrum Research Estimates
We expect ACC to deliver strong earnings growth during the quarter led by good ramp up in east sales. We estimate overall volume to increase 15% YoY. We also estimate 3% NSR increase YoY.
We expect higher NSR and volume YoY to boost unitary EBITDA by 21% YoY to Rs623/MT.
Thus, these should drive consolidated revenue/ EBITDA/PAT growth of 18%/40%/85% YoY.
Ambuja Cements (Rating: SELL; Target price: Rs200)
Exhibit 10: Result Expectation - Standalone Particulars Q3CY17E Q3CY16 YoY (%) Q2CY17 QoQ (%)
Sales Volume (mn MT) 5.10 4.6 11.1 6.1 (16.0)
NSR (Rs/MT) 4,619 4,426 4.4 4,714 (2.0)
Sales (Rs mn) 23,554 20,314 15.9 28,613 (17.7)
EBITDA (Rs mn) 4,155 3,032 37.1 6,510 (36.2)
EBITDA margin (%) 17.6 14.9 272bps 22.8 (511)bps
EBITDA (Rs/MT) 815 660 23.4 1,073 (24.0)
Net profit (Rs mn) 3,625 2,770 30.8 3,922 (7.6)
Adj PAT margin (%) 15.4 13.6 175bps 13.7 168bps
Source: Company, Centrum Research Estimates
Buoyed by higher demand in the north and east markets, we expect Ambuja’s sales volume to rise 11% YoY. Strong price recovery in the west and east markets should drive 4% NSR growth YoY.
Thus, we estimate unitary EBITDA to rise 23% YoY to Rs815/MT. We factor in a modest 1% cost inflation as operating leverage gain should offset input/freight cost inflation.
Subsequently, we expect its standalone Net sales/EBITDA/PAT to grow 16%/37%31% YoY.
7 Q2FY18 Results Preview
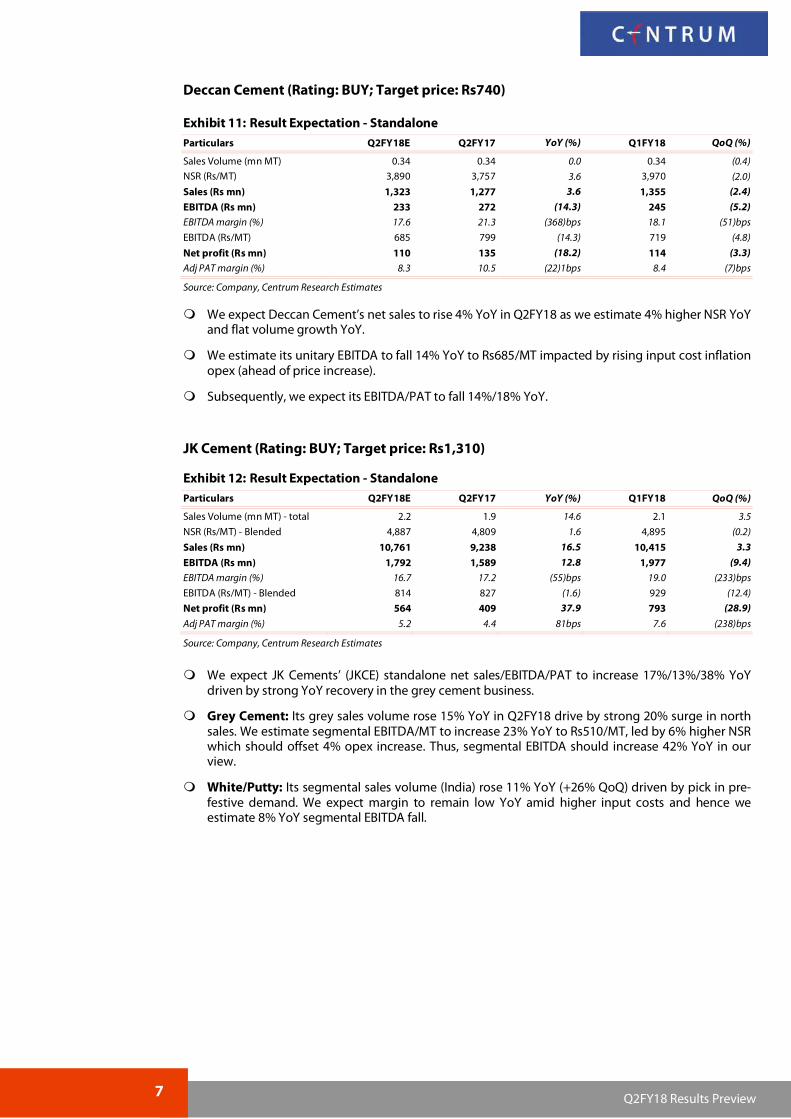
Deccan Cement (Rating: BUY; Target price: Rs740)
Exhibit 11: Result Expectation - Standalone Particulars Q2FY18E Q2FY17 YoY (%) Q1FY18 QoQ (%)
Sales Volume (mn MT) 0.34 0.34 0.0 0.34 (0.4)
NSR (Rs/MT) 3,890 3,757 3.6 3,970 (2.0)
Sales (Rs mn) 1,323 1,277 3.6 1,355 (2.4)
EBITDA (Rs mn) 233 272 (14.3) 245 (5.2)
EBITDA margin (%) 17.6 21.3 (368)bps 18.1 (51)bps
EBITDA (Rs/MT) 685 799 (14.3) 719 (4.8)
Net profit (Rs mn) 110 135 (18.2) 114 (3.3)
Adj PAT margin (%) 8.3 10.5 (22)1bps 8.4 (7)bps
Source: Company, Centrum Research Estimates
We expect Deccan Cement’s net sales to rise 4% YoY in Q2FY18 as we estimate 4% higher NSR YoY and flat volume growth YoY.
We estimate its unitary EBITDA to fall 14% YoY to Rs685/MT impacted by rising input cost inflation opex (ahead of price increase).
Subsequently, we expect its EBITDA/PAT to fall 14%/18% YoY.
JK Cement (Rating: BUY; Target price: Rs1,310)
Exhibit 12: Result Expectation - Standalone Particulars Q2FY18E Q2FY17 YoY (%) Q1FY18 QoQ (%)
Sales Volume (mn MT) - total 2.2 1.9 14.6 2.1 3.5
NSR (Rs/MT) - Blended 4,887 4,809 1.6 4,895 (0.2)
Sales (Rs mn) 10,761 9,238 16.5 10,415 3.3
EBITDA (Rs mn) 1,792 1,589 12.8 1,977 (9.4)
EBITDA margin (%) 16.7 17.2 (55)bps 19.0 (233)bps
EBITDA (Rs/MT) - Blended 814 827 (1.6) 929 (12.4)
Net profit (Rs mn) 564 409 37.9 793 (28.9)
Adj PAT margin (%) 5.2 4.4 81bps 7.6 (238)bps
Source: Company, Centrum Research Estimates
We expect JK Cements’ (JKCE) standalone net sales/EBITDA/PAT to increase 17%/13%/38% YoY driven by strong YoY recovery in the grey cement business.
Grey Cement: Its grey sales volume rose 15% YoY in Q2FY18 drive by strong 20% surge in north sales. We estimate segmental EBITDA/MT to increase 23% YoY to Rs510/MT, led by 6% higher NSR which should offset 4% opex increase. Thus, segmental EBITDA should increase 42% YoY in our view.
White/Putty: Its segmental sales volume (India) rose 11% YoY (+26% QoQ) driven by pick in pre-festive demand. We expect margin to remain low YoY amid higher input costs and hence we estimate 8% YoY segmental EBITDA fall.

8 Q2FY18 Results Preview
JK Lakshmi Cement (Rating: SELL; Target price: Rs360)
Exhibit 13: Result Expectation - Standalone Particulars Q2FY18E Q2FY17 YoY (%) Q1FY18 QoQ (%)
Sales Volume (mn MT) 2.0 1.7 13.9 2.3 (14.4)
NSR (Rs/MT) 3,944 3,816 3.3 3,944 0.0
Sales (Rs mn) 7,714 6,556 17.7 9,011 (14.4)
EBITDA (Rs mn) 928 937 (0.9) 1,203 (22.9)
EBITDA margin (%) 12.0 14.3 (226)bps 13.4 (132)bps
EBITDA (Rs/MT) 474 545 (13.0) 527 (9.9)
Net profit (Rs mn) 116 249 (53.6) 283 (59.1)
Adj PAT margin (%) 1.5 3.8 (230)bps 3.1 (164)bps
Source: Company, Centrum Research Estimates
We expect JK Lakshmi Cement’s net sales to rise 18% YoY in Q2FY18 led by strong 14% volume growth and 3% higher NSR YoY. In our view, its volume growth should benefit from higher sales in north and east markets.
Unitary EBITDA should fall 13% YoY to Rs474/MT driven by higher opex. Thus, we expect EBITDA to fall marginally by 1% YoY.
We estimate PAT to decline 54% YoY driven by higher capital charges and higher tax outgo.
Orient Cement (Rating: SELL; Target price: Rs114)
Exhibit 14: Result Expectation - Standalone Particulars Q2FY18E Q2FY17 YoY (%) Q1FY18 QoQ (%)
Sales Volume (mn MT) 1.3 1.2 7.2 1.4 (10.0)
NSR (Rs/MT) 4,028 3,278 22.9 4,065 (0.9)
Sales (Rs mn) 5,068 3,848 31.7 5,682 (10.8)
EBITDA (Rs mn) 873 166 426.5 1,169 (25.3)
EBITDA margin (%) 17.2 4.3 1,292bps 20.6 (334)bps
EBITDA (Rs/MT) 694 141 391.3 836 (17.0)
Net profit (Rs mn) 176 (294) 389 (54.7)
Adj PAT margin (%) 3.5 (7.6) 1,112bps 6.9 (337)bps
Source: Company, Centrum Research Estimates
We expect Orient Cement’s net sales to rise 32% YoY in Q2FY18 as we factor in 7% YoY volume increase (-10% QoQ) and 23% higher NSR YoY (-1% QoQ).
We expect its unitary cost to rise 6% YoY. However, a strong NSR on last year’s low base should lead to unitary EBITDA increasing 391% to Rs694/MT. Hence, we estimate EBITDA to rebound 427% YoY.
Thus, buoyed by strong operating results, we expect the company to report PAT of Rs176mn vs. a loss of Rs294mn YoY.
9 Q2FY18 Results Preview
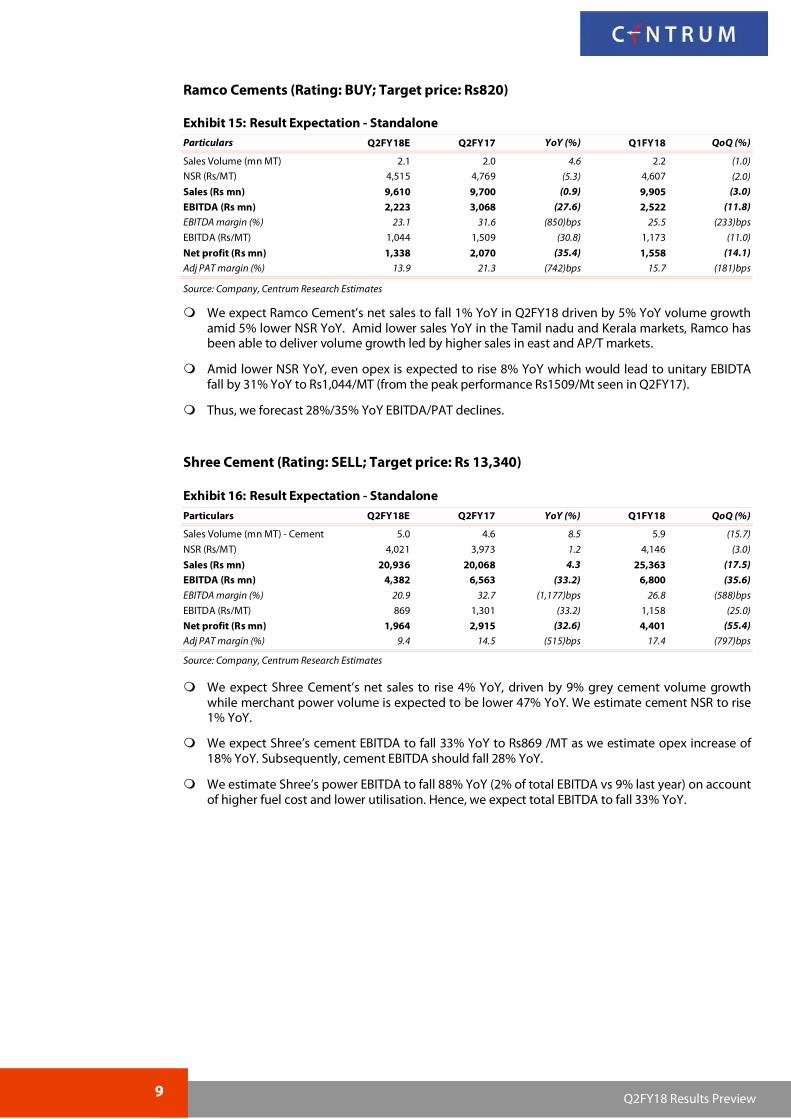
Ramco Cements (Rating: BUY; Target price: Rs820)
Exhibit 15: Result Expectation - Standalone Particulars Q2FY18E Q2FY17 YoY (%) Q1FY18 QoQ (%)
Sales Volume (mn MT) 2.1 2.0 4.6 2.2 (1.0)
NSR (Rs/MT) 4,515 4,769 (5.3) 4,607 (2.0)
Sales (Rs mn) 9,610 9,700 (0.9) 9,905 (3.0)
EBITDA (Rs mn) 2,223 3,068 (27.6) 2,522 (11.8)
EBITDA margin (%) 23.1 31.6 (850)bps 25.5 (233)bps
EBITDA (Rs/MT) 1,044 1,509 (30.8) 1,173 (11.0)
Net profit (Rs mn) 1,338 2,070 (35.4) 1,558 (14.1)
Adj PAT margin (%) 13.9 21.3 (742)bps 15.7 (181)bps
Source: Company, Centrum Research Estimates
We expect Ramco Cement’s net sales to fall 1% YoY in Q2FY18 driven by 5% YoY volume growth amid 5% lower NSR YoY. Amid lower sales YoY in the Tamil nadu and Kerala markets, Ramco has been able to deliver volume growth led by higher sales in east and AP/T markets.
Amid lower NSR YoY, even opex is expected to rise 8% YoY which would lead to unitary EBIDTA fall by 31% YoY to Rs1,044/MT (from the peak performance Rs1509/Mt seen in Q2FY17).
Thus, we forecast 28%/35% YoY EBITDA/PAT declines.
Shree Cement (Rating: SELL; Target price: Rs 13,340)
Exhibit 16: Result Expectation - Standalone Particulars Q2FY18E Q2FY17 YoY (%) Q1FY18 QoQ (%)
Sales Volume (mn MT) - Cement 5.0 4.6 8.5 5.9 (15.7)
NSR (Rs/MT) 4,021 3,973 1.2 4,146 (3.0)
Sales (Rs mn) 20,936 20,068 4.3 25,363 (17.5)
EBITDA (Rs mn) 4,382 6,563 (33.2) 6,800 (35.6)
EBITDA margin (%) 20.9 32.7 (1,177)bps 26.8 (588)bps
EBITDA (Rs/MT) 869 1,301 (33.2) 1,158 (25.0)
Net profit (Rs mn) 1,964 2,915 (32.6) 4,401 (55.4)
Adj PAT margin (%) 9.4 14.5 (515)bps 17.4 (797)bps
Source: Company, Centrum Research Estimates
We expect Shree Cement’s net sales to rise 4% YoY, driven by 9% grey cement volume growth while merchant power volume is expected to be lower 47% YoY. We estimate cement NSR to rise 1% YoY.
We expect Shree’s cement EBITDA to fall 33% YoY to Rs869 /MT as we estimate opex increase of 18% YoY. Subsequently, cement EBITDA should fall 28% YoY.
We estimate Shree’s power EBITDA to fall 88% YoY (2% of total EBITDA vs 9% last year) on account of higher fuel cost and lower utilisation. Hence, we expect total EBITDA to fall 33% YoY.

10 Q2FY18 Results Preview
Star Cement (Rating: BUY; Target price: Rs 152)
Exhibit 17: Result Expectation - Consolidated
Particulars Q2FY18E Q2FY17 YoY (%) Q1FY18 QoQ (%)
Sales Volume (mn MT) - external 0.5 0.6 (23.0) 0.7 (33.4)
NSR (Rs/MT) 5,471 5,027 8.8 5,640 (3.0)
Sales (Rs mn) 2,708 3,328 (18.6) 4,287 (36.8)
EBITDA (Rs mn) 821 589 39.4 1,586 (48.3)
EBITDA margin (%) 30.3 17.7 1,261bps 37.0 (670)bps
EBITDA (Rs/MT) 1,735 959 80.9 2,234 (22.3)
Net profit (Rs mn) 237 4 5,835.9 1,075 (77.9)
Adj PAT margin (%) 8.8 0.1 864bps 25.1 (1,630)bps
Source: Company, Centrum Research Estimates
We expect Star Cement’s consolidated net sales to fall 19% YoY driven by 23% YoY fall in sales volume. Volume decline is driven by both lower sales in NE region as well as Star’s sales reduction outside NE region where margin is lower vs NE region sales.
Amid weak offtake, NSR should increase 9% YoY, owing to strong price rebound across east and NE region YoY. Further, unitary opex should also reduce 8% YoY boosted by lower fuel cost, overhead cost rationalisation and lead distance reduction (ie fall in outside NE region sales).
Thus, we estimate unitary EBIDTA to soar 81% YoY to Rs1735/MT, thus boosting consolidated EBITDA growth by 39%. On a low base of last year, PAT should zoom 58x YoY.
UltraTech Cement (Rating: Hold; Target price: Rs3,790)
Exhibit 18: Result expectation - Standalone Particulars Q2FY18E Q2FY17 YoY (%) Q1FY18 QoQ (%)
Sales Volume (mn MT) 13.0 11.2 15.9 13.2 (1.7)
NSR (Rs/MT) 4,926 4,883 0.9 5,026 (2.0)
Sales (Rs mn) 63,850 54,589 17.0 66,265 (3.6)
EBITDA (Rs mn) 12,987 11,548 12.5 15,601 (16.8)
EBITDA margin (%) 20.3 21.2 (81)bps 23.5 (320)bps
EBITDA (Rs/MT) 1,002 1,033 (3.0) 1,183 (15.3)
Net profit (Rs mn) 4,203 6,011 (30.1) 8,906 (52.8)
Adj PAT margin (%) 6.6 11.0 (443)bps 13.4 (686)bps
Source: Company, Centrum Research Estimates
We expect UltraTech Cement’s standalone sales volume to soar 16% YoY driven by both organic volume uptick and impact of JPA amalgamation. We estimate NSR to increase 1% YoY. Thus, net sales should rise 17% YoY in Q2FY18.
However, we estimate unitary EBITDA to marginally fall by 3% YoY to Rs1,002/MT as we estimate higher input costs as well as higher opex for JPA’s assets initially. Thus, we estimate EBITDA to grow 13% YoY.
Despite EBITDA growth, we estimate PAT to fall 30% YoY due to the impact of JPA amalgamation (lower utilisation and increase in capital cost).

11 Q2FY18 Results Preview
Building Materials – Others
Visaka Industries (Rating: BUY; Target price: Rs620)
Exhibit 19: Result Expectation Particulars Q2FY18E Q2FY17 YoY (%) Q1FY18 QoQ (%)
BP Sales Volume (K MT) 156.9 145.8 7.6 252.8 (37.9)
Yarn Sales Volume ( MT) 1.9 2.5 (24.7) 2.6 (28.2)
Sales (Rs mn) 1,939 2,004 (3.2) 3,092 (37.3)
EBITDA (Rs mn) 260 264 (1.7) 467 (44.4)
EBITDA margin (%) 13.4 13.2 20bps 15.1 (172)bps
Adj PAT (Rs mn) 94 88 6.4 230 (59.3)
Adj PAT margin (%) 4.8 4.4 44bps 7.4 (260)bps
Source: Company, Centrum Research Estimates
We expect Visaka Industries’ net revenues to decline 3% YoY in Q2FY18 largely led by fall in textiles revenues amid pick up in Building product sales. We expect overall EBITDA to fall a modest 2% YoY (on a good base of last year) impacted by lower textiles offtake (GST impact). Lower tax outgo should however lead to PAT increase of 6% YoY.
Building product segment: We expect segmental revenue to rise 8% YoY driven by uptick in ACS sales YoY and as CBP exports bottom out during the quarter. Overall, we estimate segmental OPM to further expand by 50bps YoY on the high base of 14.2% in Q2FY17, boosting segmental EBITDA by 11% YoY.
Textile segment: Segmental utilisation has been hit post GST thus leading to both lower revenues and EBITDA. We estimate segmental EBITDA to fall 52% YoY to Rs29mn.

Subdued performance On a broader basis, we expect our banking universe to report yet another quarter of subdued performance on both revenue / profitability front. Weak loan growth, decline in NIM (QoQ), lower treasury gains and elevated provisioning are the key negatives for the quarter. On the flip-side, sequential decline in slippages (across all major banks), investment gains following sale of stake in subsidiaries (SBI, ICICI Bank) and QoQ improvement in NIM (Karnataka Bank, ICICI Bank) are the key positives. We stick to our preference for ICICI Bank and SBI in the large-cap space; prefer the old private sector banking space. Asset financing companies will report strong quarter on both growth / profitability front. Affordable housing space (GICHF) is expected to report lower growth / challenges on recovery front. The micro-lending space will continue to report loss as they provide for past dues / operating related costs following transition. Underlying business activities remains slow, yet steady and is positive for the overall rating agencies space.
Banking: Systemic credit growth has remained anaemic and with elevated deposit growth has impacted the margins on an aggregate basis. Adjusted for SBI, we expect our banking universe to report modest growth in both NII / loans. The trend in fee income growth is set to remain muted; a favourable yield movement during the quarter, however will see banks report decent treasury gains (though on a lower side QoQ). The quarter saw ICCI Bank and SBI sell part of the stake in their insurance business. These investment gains, in our view will be utilised towards creation of contingent provisions. Slippages for the coverage universe are set to moderate/decline QoQ; however following lower recovery (unlike the previous quarter), overall GNPA are expected to remain at elevated levels on both YoY / QoQ basis. Provisions will remain higher as banks provide for NPA ageing and regulatory requirement towards certain stressed accounts in addition to standard asset provisions. We thus expect profit growth to remain muted for the quarter.
NBFCs –AFCs and HFCs: Industry-wide auto volumes, especially PV, tractors and LCV have been on a rise and bodes well for AFCs coverage – MMFS and Sundaram Finance. Our channel checks have pointed for relatively better recoveries on a YoY basis; and also on a QoQ basis (following the seasonality factor). We thus expect our AFC universe to report 18.4% / 23.3% growth in NII / PPOP on back of healthy ~14% YoY growth in AuM. Provisioning will remain elevated for MMFS (ageing of older NPAs); however on the back of a low-base and recovery in earnings, we see MMFS report strong 92% YoY growth in PAT. Sundaram Finance will see stable loan-loss provisioning/ 5% YoY growth in PAT. While we remain positive on the opportunities in the affordable housing space (EWS / MIG – I and MIG-II), the pace of activities therein remains slow YTD. This in addition to implementation of RERA has impacted overall loan growth. Further, the after effect of demonetisation and longer than expected time towards effective implementation of GST has impacted the cash flow of the end-user, thus impacting asset quality trends in the LAP portfolio. We thus see GICHF report lower loan growth / continued elevated slippages. However, a favourable borrowing profile, positively impacting spreads will see overall NII / PAT grow 29.6% YoY / 20% YoY.
Rating Agencies; Micro-Lending Institutions: While systemic banking credit growth has remained muted and will impact BLR linked rating revenues, underlying trends in the corporate bond market has remained encouraging. This in addition to continued efforts by the regulatory authorities in reviving the overall rating opportunity bodes well for both CARE and CRISIL. We expect CARE and CRISIL (combined) to report 9.1% YoY / 7.4% YoY growth in Sales/ EBIDTA. Micro-lending institutions - our channel checks including commentaries from rating agencies have pointed to improvement in collection efficiency. According to ICRA, the collection efficiency in the microfinance sector has increased to 93% in July 2017 from a low of 87% in December 2016. Excluding certain pockets of Maharashtra, overall recovery trends have been encouraging and broad based (ie across all states). However, with stickiness in PAR-90, overall provisioning is set to remain elevated. Transition to the Small Finance Bank (SFB) model will see operating costs remain higher. This in addition to providing for unpaid dues will impact profitability. We see Ujjivan to report yet another quarter of loss.
Recommendation: Our choice of stocks remain the same - we continue to prefer ICICI Bank and SBI in the large-cap banking space given the healthy core operating profit and strong capital position. We like the old private sector banks as they offer a strong play on both earnings and valuation multiple expansions. On the NBFC front, loan growth momentum remains intact and we stick with our preference for Sundaram Finance over MMFS. Even as we factor in strong earnings growth, we believe current valuations for MMFS are expensive for the given set of RoE’s. Micro-lending institutions will report losses following transition related costs (SFB perspective) and provisioning for unpaid dues. While we remain structurally positive on the rating agencies (CARE, CRISIL) and the housing space (GICHF), near term concerns on growth/ current valuations offer limited upside.
Stock Price performance (%)*
Co. Name 1-Mth 3-Mth 6-Mth YTD
Axis Bank 2.1 0.0 (1.1) (5.2)
ICICI Bank (7.9) (6.1) 6.5 19.1
City Union Bank 1.4 (0.7) 17.9 31.8
DCB Bank (1.0) (3.9) 9.2 48.4
Karnataka Bank (4.0) (11.5) 0.3 18.8
SBIN (6.4) (8.3) (12.4) (0.0)
GICHF (6.2) (8.7) 15.7 53.5
MMFS (6.0) 16.4 25.6 11.0
SUF (1.0) 4.7 2.4 23.7
CARE Ratings (8.2) (11.8) (13.7) (4.2)
CRISIL (6.4) (10.3) (9.9) (27.4)
Ujjivan Financial (10.9) 4.0 (16.7) (28.2)
Bank Nifty (0.4) 3.2 11.9 24.7
PSU Bank Nifty (4.6) (8.2) (12.3) (2.8)
Nifty 0.6 3.2 7.7 14.6
Source: Bloomberg; * as on 6 October 2017
Rating and target prices
Co Name Rating CMP* TP (Rs)
Axis Bank Hold 503 530
ICICI Bank Buy 273 340
City Union Bank Hold 164 150
DCB Bank Ltd Hold 186 172
Karnataka Bank Buy 147 200
SBI Buy 257 340
GIC Housing Fin. Hold 513 530
MMFS Sell 419 250
Sundaram Finance Buy 1,680 2,000
CARE Hold 1,399 1,600
CRISIL Hold 1,781 2,160
Ujjivan Finance Hold 334 350
Source: Centrum Research Estimates; * as on 6 October 2017
Aalok Shah, [email protected]; 91 22 4215 9075
Gaurav Jani, [email protected]; 91.22 4215 9110
INDIA
Financials 9 October 2017
Centrum Equity Research is available on Bloomberg, Thomson Reuters and FactSet

13 Q2FY18 Results Preview
Exhibit 20: Quarterly preview
Co Name Net interest income (Rs mn) Pre-provisioning profit (Rs mn) Net profit (Rs mn)
Q2FY18E % YoY % QoQ Q2FY18E % YoY % QoQ Q2FY18E % YoY % QoQ
Axis Bank 47,204 4.6 2.3 42,084 2.6 (1.9) 11,557 262.6 (11.5)
ICICI Bank# 56,597 7.7 1.2 73,127 (31.2) 41.1 23,977 (22.7) 17.0
City Union Bank 3,379 12.2 (1.3) 2,886 21.9 (2.8) 1,311 6.0 (6.6)
DCB Bank 2,366 24.3 1.5 1,307 29.6 (4.2) 587 21.1 (10.0)
Karnataka Bank 4,444 11.9 4.7 3,192 37.2 3.1 1,370 10.7 2.4
SBIN# 1,93,054 33.7 9.7 1,72,652 53.8 45.4 24,660 (2.8) 22.9
GIC Housing 955 29.6 (2.4) 808 36.0 (8.6) 413 20.1 2.3
MMFS 9,468 20.9 10.1 5,799 28.7 18.5 1,817 91.6 283.5
Sundaram Finance 3,225 11.6 1.0 2,189 11.0 12.8 1,337 4.7 13.9
CARE Ratings 871 7.5 41.8 635 6.2 62.0 463 7.1 30.5
CRISIL* 4,249 9.5 4.5 1,161 8.2 13.2 750 (6.0) 11.6
Ujjivan Financial 1,795 (19.7) 8.0 451 (62.3) 1.3 -230.1 NA NA
Source: Centrum Research Estimates. * denotes Net sales /EBIDTA. *CRISIL is a Dec ending company. #includes gains on stake sale.
Exhibit 21: Valuation summary
Bank / NBFC Rating CMP (Rs)*
TP (Rs)
P/ ABV (x) P/ E (x) RoA (%) RoE (%)
FY17 FY18E FY19E FY17 FY18E FY19E FY17 FY18E FY19E FY17 FY18E FY19E
Axis Bank Hold 503 530 2.6 2.3 1.9 32.7 16.6 12.7 0.6 1.2 1.4 6.8 12.4 14.5
ICICI Bank Buy 273 340 2.2 2.1 2.0 16.3 16.4 15.1 1.3 1.3 1.3 10.7 11.0 11.9
City Union Bank Hold 164 150 3.1 2.7 2.3 19.6 17.6 15.2 1.5 1.5 1.5 15.2 14.7 15.0
DCB Bank Ltd Hold 186 172 2.9 2.3 2.1 26.6 22.3 17.3 0.9 1.0 1.0 10.8 11.3 12.0
Karnataka Bank Buy 147 200 1.1 1.0 0.9 9.2 7.3 5.7 0.7 0.9 1.0 10.2 10.7 12.4
SBI Buy 257 340 2.1 1.8 1.5 19.5 21.1 9.1 0.4 0.3 0.6 7.0 5.5 10.2
GIC Housing Fin. Hold 513 530 3.3 2.8 2.4 18.7 16.2 13.3 1.7 1.6 1.6 18.8 18.8 19.7
MMFS Sell 419 250 4.9 4.7 3.9 59.2 27.8 20.8 0.9 1.6 1.9 6.4 12.6 15.1
Sundaram Finance Buy 1,680 2,000 5.1 4.5 3.9 37.7 32.9 27.3 2.7 2.8 2.9 14.0 14.2 15.1
CARE Hold 1,399 1,600 8.3 7.4 6.7 27.2 25.5 22.1 47.3 45.5 47.2 33.4 30.7 31.8
CRISIL Hold 1,781 2,160 19.4 16.8 14.5 38.9 34.4 28.9 49.2 52.4 56.9 32.3 34.5 37.4
Ujjivan Finance Hold 334 350 2.3 2.4 2.1 38.0 19.1 19.3 2.9 0.8 2.2 14.1 4.2 13.1
Source: Company, Centrum Research Estimates. *as on 6th Oct, 2017 #ROA for rating agencies is RoCE.

14 Q2FY18 Results Preview
Banking
Axis Bank - HOLD; Target price Rs530
We expect loans to grow 12.5% YoY led by continued focus at retail / SME portfolio. NII at Rs47.2bn is expected to grow 4.6% YoY. We expect NIM at 3.06% to decline 24bps YoY / remain flat QoQ.
Operating profit at Rs42.1bn is expected to grow 2.6% YoY. We do not expect any major surprise either on fee income front / operating costs end.
Q2FY17 saw bank report elevated slippages and thus the accelerated provisioning as the quarter large part of its watchlist portfolio slip into NPA. We do not expect a similar trend in the current quarter. However, while we see slippages run-rate stabilise, provisioning cost is set to remain high as the bank provides for a) NPA ageing b) IBC related cases and c) standard asset provisioning.
Adjusted for provisioning and taxes, we expect PAT at Rs11.6bn. Management commentaries on watch list exposure will be closely monitored.
Stock trades at 1.9x FY19E ABV. We have a Hold rating on the stock with TP at Rs530.
Exhibit 22: Quarterly Estimates Rs mn Q2FY18E Q2FY17 % YoY Q1FY18 % QoQ
Net interest income 47,204 45,139 4.6 46,161 2.3 Pre-provisioning profit 42,084 41,002 2.6 42,912 (1.9) Profit after tax 11,557 3,187 262.6 13,056 (11.5) GNPA 2,35,963 1,63,787 44.1 2,20,309 7.1 GNPA (%) 5.94 4.17 177bps 5.03 91bps NIM (%) calc. 3.06 3.31 (24bps) 3.06 1bp
Source: Company, Centrum Research Estimates.
ICICI Bank – BUY; Target price Rs 340
We expect ICICI Bank to report 7.7% yoy growth in NII led by 4.5% YoY growth in loans and further improvement in margins to 2.9%. Loan growth would continue to be driven by strong traction in its domestic loans, especially retail segment.
Q2’17 included profit on sale of investment in life insurance business. The current quarter saw ICICI Bank sell stake in its general insurance business.
Growth in fee income is expected to remain modest. Reported operating profit at Rs73.1bn is expected to decline 31.2% YoY. However, adjusted for the investment gains, operating profit at Rs52.1bn have grown 5.2% YoY.
The pace of incremental slippages is set to decline QoQ. We however have built in accelerated provisions including creation of provision buffers as the bank utilises the gain on sale of stake in its general insurance business towards provisions.
Reported net profit for the quarter at Rs23.9bn is expected to decline 23% YoY. Retain Buy, with an SOTP-based TP of Rs340. ICICI Bank is our preferred pick in the large-cap banking space.
Exhibit 23: Quarterly Estimates Rs mn Q2FY18E Q2FY17 % YoY Q1FY18 % QoQ
Net interest income 56,597 52,533 7.7 55,898 1.2
Pre-provisioning profit 73,127 1,06,364 (31.2) 51,833 41.1
Profit after tax (reported) 23,977 31,026 (22.7) 20,490 17.0
GNPA 4,51,486 3,21,786 40.3 4,31,476 4.6
GNPA (%) 9.47 6.82 265bps 7.99 148bps
NIM (%) calc. 2.94 2.84 10bps 2.92 2bps
Source: Company, Centrum Research Estimates.

15 Q2FY18 Results Preview
City Union Bank - HOLD; Target price Rs150
We expect CUBK to report 12.2% YoY growth in NII on the back of 15% YoY growth in loans and hence we expect a contraction in margins owing to the NIM being at its peak. We expect NIM (calc) at 3.7% to decline 2bps YoY/ 17bps QoQ.
Operating profit at Rs2.9bn is expected to rise 21.9% YoY.
Management has guided for 175-200bps of slippages and we have factored the same into our estimates. We are building in credit cost at 175bps for Q2’18.
Net profit, after adjusting for the same at Rs1.3bn is set to grow 5.9% YoY. Stock trades at 2.3x FY19E ABV. We have a Hold rating with TP at Rs150.
Exhibit 24: Quarterly Estimates Rs mn Q2FY18E Q2FY17 % YoY Q1FY18 % QoQ
Net interest income 3,379 3,012 12.2 3,424 (1.3) Pre-provisioning profit 2,886 2,368 21.9 2,970 (2.8) Profit after tax 1,311 1,238 6.0 1,403 (6.6) GNPA 7,861 5,980 31.5 7,350 7.0 GNPA (%) 3.11 2.69 42bps 3.05 6bps NIM (%) calc. 3.69 3.71 (2bps) 3.86 (17bps)
Source: Company, Centrum Research Estimates
DCB Bank – HOLD; Target price Rs172
We expect DCB Bank to report 24.3%/ 22% YoY growth in NII/ loans for the quarter. NIM at 3.71% is expected to contract 14bps QoQ / improve 5bps YoY.
We expect cost / average assets to stabilise and improve as the bank now focuses at improving efficiency. Operating profit at Rs1.3bn is expected to rise 29.6% YoY.
While the recent past has seen constraints on working capital cycle, we do not foresee any major delinquencies risk for DCB bank given its customer profile and appraisal policies.
After adjusting for provisions and taxes, we see net profit at Rs587mn rise 21% YoY.
Exhibit 25: Quarterly Estimates Rs mn Q2FY18E Q2FY17 % YoY Q1FY18 % QoQ
Net interest income 2,366 1,903 24.3 2,332 1.5
Pre-provisioning profit 1,307 1,009 29.6 1,364 (4.2)
Profit after Tax 587 485 21.1 652 (10.0)
GNPA 3,179 2,554 24.5 2,853 11.4
GNPA (%) 1.80 1.75 5bps 1.74 6bps
NIM (%) calc. 3.71 3.66 5bps 3.85 (14bps)
Source: Company, Centrum Research Estimates
Karnataka Bank – BUY; Target price Rs200
We expect the bank to report 11.9% YoY growth in NII led by 11% YoY growth in loans and QoQ expansion in NIM to 2.7% levels. Our NIM expansion is based on the premise of a) improvement in the loan-deposit ratio b) move towards reduction in saving bank deposit rates (the bank has ~70% of its SA deposits in less than Rs10mn) and c) further reduction in RIDF portfolio.
Operating profit at Rs3.2bn is set to improve 37% YoY. We expect slippages to come in at 440bps; credit cost is built in at 145bps.
Net profit, adjusted for the same at Rs1.37bn is expected to grow 10.7% YoY. We have a Buy rating on the stock with TP of Rs200.
Exhibit 26: Quarterly Estimates Rs mn Q2FY18E Q2FY17 % YoY Q1FY18 % QoQ
Net interest income 4,444 3,973 11.9 4,244 4.7
Pre-provisioning profit 3,192 2,328 37.2 3,097 3.1
Profit after Tax 1,370 1,238 10.7 1,339 2.4
GNPA 18,495 13,445 37.6 16,910 9.4
GNPA (%) 4.55 3.64 91bps 4.34 21bps
NIM (%) calc. 2.73 2.72 1bp 2.66 7bps
Source: Company, Centrum Research Estimates

16 Q2FY18 Results Preview
State Bank of India – BUY; Target price Rs340
We expect SBI to report healthy growth in NII on both YoY and QoQ basis. Loan growth, on a QoQ basis, though is expected to remain lower. We are building in 33.7% YoY / 9.7% QoQ growth in NII. NIM (calc) at 2.4% is expected to improve both on a YoY and QoQ basis.
Q2’18 saw SBI sell its 8% stake in its life insurance business. Operating profit (including gains on sell of stake) is expected to increase 54% YoY. Adjusted for the same, we expect operating profit to grow by mere 4% YoY.
We expect overall trend in fresh delinquencies to decline on a QoQ basis. The pace of provisioning however is expected to remain higher and we have factored the same into our estimates. We also see SBI utilise the gains on stake sale to create excessive provisioning against certain accounts. Commentaries on watchlist exposure for the combined entity will be closely watched.
Adjusted for the above including taxes, we expect the bank to post net profit at Rs24.7bn. Retain Buy, with an SOTP-based TP of Rs340.
Q2’17 nos are on a standalone basis due to non-availability of data .
Exhibit 27: Quarterly Estimates
Rs mn Q2FY18E Q2FY17
(standalone) % YoY
Q1FY18
% QoQ
Net interest income 1,93,054 1,44,375 33.7 1,76,060 9.7
Pre-provisioning profit 1,72,652 1,12,242 53.8 1,18,745 45.4
Profit after tax 24,660 25,382 (2.8) 20,065 22.9
GNPA 19,65,680 10,57,830 85.8 18,80,685 4.5
GNPA (%) 10.84 7.14 370bps 9.97 87bps
NIM (%) calc 2.42 2.20 22bps 2.39 3bps
Source: Company, Centrum Research Estimates.

17 Q2FY18 Results Preview
Housing Finance Companies
GIC Housing Finance – HOLD; Target price Rs530
We expect GICHF to report 29.6% YoY growth in NII led by 17.7% YoY growth in its loans. NIM (calc) at 3.8% is expected to improve on a YoY basis. On a QoQ basis, the same however is expected to see moderation as GICHF a) resorts to lowering its lending rates to retain its customers and b) overall reduction in lending yields on incremental business.
However, with a comfortable borrowing profile, we do not see any major risk to spreads in the current quarter.
Operating profit at Rs808mn is expected to rise 36% YoY.
Asset quality related pressure persists and management have highlighted for stickiness in NPA’s for the next two quarters. We thus have built in accelerated provisions into our estimates.
After providing for the same including taxes, we expect PAT to grow 20.1% YoY to Rs413mn.
While we remain positive on the stock, post the sharp run-up, current valuations at 2.3x FY19E ABV offer limited upside. We retain Hold on the stock with TP at Rs530.
Exhibit 28: Quarterly Estimates Rs mn Q2FY18E Q2FY17 % YoY Q1FY18 % QoQ
Net interest income 955 737 29.6 979 (2.4)
Pre-provisioning profit 808 594 36.0 884 (8.6)
Profit after tax 413 344 20.1 404 2.3
NIM (calc) 3.80 3.46 34bps 4.07 (27bps)
Source: Company, Centrum Research Estimates.

18 Q2FY18 Results Preview
Asset financing companies
M&M Financial Services – SELL; Target price Rs250
We expect MMFS to report 20.9% YoY growth in NII led by 14.5% YoY growth in AuM’s. Value of asset financed for Q2’18 is expected to grow 13% YoY.
Shift in AuM portfolio towards high yielding segments and a soft borrowing regime will aid MMFS report improvement in its NIM. We expect NIM to improve on both YoY and QoQ basis.
Operating profit at Rs5.8bn is expected to grow 28.7% YoY. Better monsoon, improved crop yield and income levels in our view will aid in lower incremental slippages and higher recoveries. One, though needs to watch for underlying trend with respect to earlier dues.
We thus expect NPA to increase 15% YoY. After providing for the same including tax related provisioning, we expect net profit at Rs1.8bn to increase 91.6% YoY.
Even as we factor in strong earnings growth over FY17-19E, we believe valuations are at the higher end of the band when seen in the context of exit RoEs as at end-FY19E. Retain Sell. Higher-than-expected volume growth, lower-than-expected fresh delinquencies remain key risks to our estimates.
Exhibit 29: Quarterly Estimates
Rs mn Q2FY18E Q2FY17 % YoY Q1FY18 % QoQ
Net interest income 9,468 7,830 20.9 8,597 10.1
Pre-provisioning profit 5,799 4,504 28.7 4,894 18.5
Profit after tax 1,817 948 91.6 474 283.5
GNPA 54,603 47,481 15.0 50,142 8.9
GNPA (%) 10.87 11.00 (13bps) 10.54 34bps
Source: Company, Centrum Research Estimates
Sundaram Finance – BUY; Target price Rs2,000
We expect Sundaram Finance to report 11% YoY growth in disbursements / 11.6% YoY rise in NII for Q2’18. On the AuM front, we expect growth to come in at 13.5% YoY.
In our recent interactions, management have pointed to increased focus towards segments of CV, tractors and CE segment. Growth trajectory therein will be closely watched.
Operating profit at Rs2.19bn is expected to rise 11.0% YoY.
Asset quality trends remain comfortable, and after providing for the same including tax related provisioning, we expect SUF to report 4.7% YoY growth in net profit to Rs1.34bn.
As for the Sundaram Home Finance business, we will watch for management’s commentaries following its slow pace of growth and asset quality related risks. We will also watch for developments in the insurance business and the AMC segment.
Value unlocking through demerger of non-financial services into a separate entity and subsequent listing of the same remains the near term trigger.
Exhibit 30: Quarterly Estimates
Rs mn Q2FY18E Q2FY17 % YoY Q1FY18 % QoQ
Net interest income 3,225 2,889 11.6 3,191 1.0
Pre-provisioning profit 2,189 1,972 11.0 1,941 12.8
Profit after tax 1,337 1,277 4.7 1,173 13.9
Source: Company, Centrum Research Estimates

19 Q2FY18 Results Preview
Credit Rating Agencies
CARE Rating – HOLD; TP Rs1,600
While banking credit growth has remained muted and will impact BLR linked rating revenue, corporate bond market continues to witness stronger growth. SME related rating business too will aid in overall growth in revenue.
We expect CARE to report 7.5% YoY growth in revenues and will be led by 11.1% YoY growth in overall volume of debt rated. Pricing pressure continues and will impact revenue growth.
EBIDTA is expected to grow 6.2% YoY to Rs635mn. We expect EDBITA margins to come in at ~73% levels (moderation of 91bps over Q2’17 levels). The compression in EBIDTA margins is also following larger focus on the SME rating business.
Trend in non-interest income is expected to be along the past quarters. Adjusted for taxes, net profit at Rs463mn is expected to grow 7.1% YoY.
Exhibit 31: Quarterly Estimates Rs mn Q2FY18E Q2FY17 % YoY Q1FY18 % QoQ
Net sales 871 810 7.5 614 41.8
EBIDTA 635 598 6.2 392 62.0
EBIDTA margins (%) 73.0 73.9 (91bps) 63.9 910bps
Profit after Tax (reported) 463 432 7.1 355 30.5
Source: Company, Centrum Research Estimates
CRISIL– HOLD; TP Rs2,160
We expect CRISIL to report 9.5% YoY growth in overall revenues led by 11% YoY growth in research revenues and 15% YoY growth in advisory services. Rating revenues are expected to grow by 5.5% YoY, led by traction on domestic business (the corporate bond market) in addition to continued traction from GAC.
EBIDTA is expected to grow 8.2% YoY to Rs1.16bn. We expect EDBITA margins at 27.3%
Reported PAT is expected to decline 6% YoY to Rs750mn.
CRISIL owns 8.9% stake in CARE. Q3’17 results will see negative impact (MTM) of this investment under the other comprehensive income line item.
Exhibit 32: Quarterly Estimates
Rs mn Q3CY17E Q3CY16 % YoY Q2CY17 % QoQ
Net sales 4,249 3,881 9.5 4,065 4.5
EBIDTA 1,161 1,074 8.2 1,026 13.2
EBIDTA margins (%) 27.3 27.7 (33bps) 25.2 211bps
Profit after Tax (reported) 750 798 (6.0) 673 11.6
Source: Company, Centrum Research Estimates.

20 Q2FY18 Results Preview
Micro-lending institutions
Ujjivan Financial Services – Hold; Target Price – Rs350
We expect the pace of disbursements in Q2FY18, to be a tad better as compared to the last quarter as most of the demonetisation related pain is behind however stress in certain states remains, which will arrest AuM growth to some extent. Consequently, we expect AuM to increase by 2.4% YoY which is also owing to a higher base effect, as Q2FY17 was characterised by healthy disbursements and lower repayments (AuM growth was ~60% in that quarter).
On the operational front we don’t expect a negative surprise in terms of the operating expenses but due to subdued total income the cost to income ratio to be 77% and resultantly the operating profit is expected to be Rs 451mn (-62.3% YoY).
Q1’18 GNPA stood at 6.16%. With relatively slow pace of recovery in affected areas of Karnataka, and Maharashtra, we expect provisioning to remain elevated. Resultantly we are factoring in credit costs of Rs 800mn for the quarter.
Consequently, we expect Ujjivan to report net loss of Rs230mn.
Exhibit 33: Quarterly Estimates
Rs mn Q2FY18E Q2FY17 % YoY Q1FY18 % QoQ
Net Interest Income# 1,795 2,235 (19.7) 1,662 8.0
Pre-provisioning profit 451 1,196 (62.3) 446 1.3
Profit after tax (230) 730 NA (749) NA
Source: Company, Centrum Research Estimates # ex-other income

Washout quarter Ad revenue is expected to be impacted for all players due to cut in ad spends across categories. Months of July and August posted significant decline while early festive season offered some relief to the companies. Broadcasters such as ZEEL and Sun TV are expected to post 2% ad growth each. Hindi print companies would likely post 2-4% ad growth. In a seasonally weak quarter, Dish TV would disappoint both on subscriber addition and ARPU. While overall margins for our media coverage would post a decline, we believe the companies would benefit from GST due to input credit set-off. We expect positive surprises from IFB Industries, Mirza International and negative surprises from Dish TV, ENIL, DB Corp.
GST continues to impact advertisement growth: There was significant decline in ad revenues in the months of July & August due to implementation of GST as key categories such as FMCG, retail, real estate cut spends. Broadcasters such as ZEEL and Sun TV are expected to post ad growth of 2% each. Print industry continues to be impacted with ad revenue growth of mere 4% for DB Corp and 2.2% for Jagran Prakashan. HMVL and English business of HT Media are expected to post a decline of 2% and 5% respectively. Radio players like Music Broadcast would post ad growth of 6.5% while ENIL would post flat ad revenues. Dish TV would post disappointing revenues on the back of flat QoQ subscriber addition and mere 1.3% QoQ growth in ARPU.
Operating profit to decline on margin compression: Operating profit for our media coverage is expected to decline by 2.2% YoY on the back of lower revenues and margin compression of 21bps. ZEEL is expected to post margin expansion on the back of sale of sports business while Sun TV would post a decline of 175bps. Among print companies, we expect HT Media to post margin expansion on prudent cost management while both DB Corp and Jagran would post margin compression. Dish TV would post a steep margin decline on higher fixed cost, low revenue growth. Info Edge would continue to post double digit growth in recruitment leading to margin expansion.
Consumer demand continues to remain low: Consumer companies continue to be impacted on the back of subdued demand and implementation of GST. La Opala is expected to post a 9.7% revenue growth while we expect Speciality Restaurants to post 6.7% revenue decline on closure of restaurants and lower same store sales growth. Mirza International is expected to post 8% YoY growth lead by domestic business while exports would post a decline. IFB Industries is expected to post healthy 29% revenue growth due to market share gain.
Recommendation: We have a Buy recommendation on Sun TV while maintaining Hold on ZEEL due to valuations. Among print companies, Jagran continues to be our top pick followed by DB Corp and HT Media. While we maintain our Sell rating on ENIL on steep valuations, we have a BUY rating on Info Edge and Dish TV. In the consumer space we have a Buy on Mirza International and La Opala, while we have a Hold on IFB Industries.
Stock price performance (%)*
Company Name 1 Mth 3 Mth 6 Mth 1 Yr
DB Corp 0.9 (0.2) (3.2) (1.9)
Dish TV (11.5) (10.3) (30.9) (25.8)
ENIL (7.6) (16.1) (3.0) (2.8)
HT Media 0.1 19.4 15.4 14.3
Info Edge 11.0 2.2 26.8 8.2
Jagran Prakashan 1.1 (2.5) (4.8) (10.3)
Sun TV Network (5.0) (4.9) (0.2) 49.7
Zee Entertainment 0.2 4.1 (5.7) (6.0)
IFB Industries (0.3) (2.6) 14.7 65.9
La Opala 9.9 0.5 (6.1) (4.3)
Mirza International 2.3 3.1 84.6 70.5
Speciality Rest (9.5) (6.2) 34.0 31.5
Sarla Performance 3.2 (3.9) (20.1) (30.5)
Nifty 0.6 3.2 7.7 14.6
Source: Bloomberg; *as on 6 Oct 2017
Recommendations & target prices
Companies Rating TP (Rs) *CMP (Rs)
DB Corp Buy 470 377
Dish TV Buy 96 71
ENIL Sell 565 807
HT Media Buy 102 97
Info Edge Buy 1,090 1,060
Jagran Prakashan Buy 235 177
Sun TV Network Buy 840 780
Zee Entertainment Hold 545 521
IFB Industries Hold 605 732
La Opala Buy 555 508
Mirza International Buy 205 165
Speciality Restaurant Hold UR 111
Sarla Performance Buy 75 50
Source: Centrum Research; *as on 5 Oct 2017
Ankit Kedia, [email protected]; 91 22 4215 9634
VVarshit Shah, [email protected]; 91 22 4215 9495
Summary Estimates
Y/E March (Rsmn) Net Sales (Rsmn) EBITDA (Rsmn) EBITDA Margin (%) Adj. PAT (Rsmn)
Q2FY18E YoY (%) QoQ (%) Q2FY18E YoY (%) QoQ (%) Q2FY18E Q2FY17 Q1FY18 Q2FY18E YoY (%) QoQ (%)
DB Corp 5,590 3.7 (5.9) 1,440 (4.3) (22.7) 25.8 27.9 31.4 838 (5.3) (23.9)
Dish TV 7,537 (2.9) 2.0 2,102 (20.5) 4.5 27.9 34.0 27.2 (104) NM NM
ENIL 1,288 (0.6) 23.4 267 15.6 60.1 20.8 17.8 16.0 82 3.9 396.7
HT Media 5,807 (3.6) (3.1) 727 44.0 (9.0) 12.5 8.4 13.3 345 11.7 (16.9)
Info Edge 2,289 9.0 2.9 794 14.2 12.9 34.7 33.1 31.6 664 (17.1) 3.4
Jagran Prakashan 5,791 3.0 (2.1) 1,541 0.7 (4.5) 26.6 27.2 27.3 815 3.2 (5.9)
Sun TV Network 6,543 4.6 (16.8) 4,763 2.1 6.2 72.8 74.5 57.0 2,667 (1.4) 6.0
Zee Entertainment 15,766 (7.0) 2.4 4,666 (4.6) (3.7) 29.6 28.9 31.4 3,217 0.1 5.6
Total 50,611 (1.5) (2.2) 16,300 (2.2) (1.1) 32.2 32.4 31.8 8,524 (10.1) 0.7 IFB Industries 5,688 29.4 15.7 403 22.9 92.8 7.1 7.5 4.3 216 21.3 192.7
La Opala 766 9.7 64.0 317 31.0 70.4 41.4 34.7 39.8 212 23.3 67.9
Mirza International 2,703 8.0 7.2 497 31.5 13.7 18.4 15.1 17.3 240 46.7 19.1
Speciality Restaurant 743 (6.7) 2.9 (1) NM NM (0.2) 0.6 (2.8) (44) NM NM
Sarla Performance 834 3.0 5.5 179 (11.4) 14.0 21.5 24.9 19.9 109 (19.9) 21.1
Total 10,734 16.7 14.0 1,395 20.8 44.0 13.0 12.6 10.3 732 17.4 71.6
Source: Companies, Centrum Research Estimates
INDIA
Media / Consumer 9 October 2017
Centrum Equity Research is available on Bloomberg, Thomson Reuters and FactSet

22 Q2FY18 Results Preview
Exhibit 34: Valuation Summary
Company Rating TP
(Rs) *CMP
(Rs)
Adj. EPS dil. (Rs) P/E (x) EV/EBITDA (x) RoE (%)
FY17 FY18E FY19E FY17 FY18E FY19E FY17 FY18E FY19E FY17 FY18E FY19E
DB Corp Buy 470 377 20.4 22.9 26.9 18.3 16.5 14.0 10.4 9.1 7.6 25.1 25.0 26.4
Dish TV Buy 96 71 1.1 0.7 2.1 85.9 99.1 33.5 10.8 8.3 6.8 23.4 13.5 28.5
ENIL Sell 565 807 11.4 13.7 23.5 66.4 59.0 34.3 28.7 26.2 18.4 6.6 7.4 11.6
HT Media Buy 102 97 7.4 9.7 11.0 11.1 10.0 8.8 2.2 1.9 0.9 7.9 9.5 9.9
Info Edge Buy 1,090 1,060 17.2 21.2 25.4 48.8 49.9 41.7 38.7 38.5 30.7 11.0 12.4 13.5
Jagran Prakashan Buy 235 177 10.6 13.5 15.3 16.8 13.1 11.6 8.2 7.1 6.1 18.4 19.9 21.8
Sun TV Network Buy 840 780 26.1 29.9 35.5 18.9 26.1 22.0 9.9 14.6 12.3 27.5 27.8 29.6
Zee Entertainment Hold 545 521 12.7 14.6 17.9 37.2 35.8 29.2 22.6 22.5 18.3 21.2 19.6 20.8
IFB Industries Hold 605 732 12.6 17.4 27.6 34.9 42.1 26.6 17.6 23.3 15.9 11.5 14.0 18.8
La Opala Buy 555 508 9.9 13.1 17.7 53.6 39.0 28.7 32.2 24.7 17.7 21.7 24.1 26.7
Mirza International Buy 205 165 5.9 7.5 8.9 15.1 22.0 18.4 7.6 10.9 9.2 15.0 16.7 17.3
Speciality Restaurant Hold UR 111 -4.8 -2.0 0.0 NM NM NM 441.2 65.4 21..3 NM NM NM
Sarla Performance Buy 75 50 4.9 5.1 5.8 10.2 9.8 8.7 12.8 7.6 6.5 14.8 13.9 14.3
Source: Company, Centrum Research Estimates; *as on 06 Oct 2017
DB Corp (Rating: BUY; Target Price: Rs470)
Exhibit 35: Quarterly Estimates
(Rsmn) Q2FY18E Q2FY17 Q1FY18 QoQ (%) YoY (%)
Sales 5,590 5,391 5,943 (5.9) 3.7
EBIDTA 1,440 1,505 1,864 (22.7) (4.3)
EBIDTA Margin (%) 25.8 27.9 31.4 (560)bps (216)bps
PAT 838 885 1101 (23.9) (5.3)
Source: Company, Centrum Research Estimates
We expect 4% YoY growth in print ad revenues, while radio business is expected to grow by 15%. Digital revenues are expected to decline by 10% YoY. Circulation revenue growth is expected to be 9% on the back of increase in circulation and pricing.
Operating margins are expected to decline by 216bps to 25.8% while operating profit is expected to decline 4.3% YoY to Rs1,440mn. Investment in circulation would impact margins.
We expect PAT to de-grow 5.3% to Rs838mn.
Dish TV (Rating: BUY; Target Price: Rs96)
Exhibit 36: Quarterly Estimates
(Rsmn) Q2FY18E Q2FY17 Q1FY18 QoQ (%) YoY (%)
Sales 7,537 7,763 7,389 2.0 (2.9)
EBIDTA 2,102 2,642 2,012 4.5 (20.5)
EBIDTA Margin (%) 27.9 34.0 27.2 66 bps (615)bps
PAT (104) 701 (139) (25.5) (114.8)
Source: Company, Centrum Research Estimates
We expect an addition of 0.19mn net subscribers in the quarter while ARPU is expected to increase 1.3% QoQ to Rs149. Dish TV could post a revenue of Rs7,537mn, down 3% YoY.
We expect operating margins to decline by 615bps YoY to 27.9%, with operating profit at Rs2,102mn.
We expect the company to post PAT loss of Rs104mn.

23 Q2FY18 Results Preview
ENIL (Standalone) (Rating: Sell; Target Price: Rs565)
Exhibit 37: Quarterly Estimates
(Rsmn) Q2FY18E Q2FY17 Q1FY18 QoQ (%) YoY (%)
Sales 1,288 1,296 1,044 23.4 (0.6)
EBIDTA 267 231 167 60.1 15.6
EBIDTA Margin (%) 20.8 17.8 16.0 476bps 291bps
PAT 82 79 17 396.7 3.9
Source: Company, Centrum Research Estimates
Revenue is expected to be flat at Rs1,288mn due to low spends on rollout of GST and management strategy to increase yields.
Margins are expected to expand by 291bps YoY to 20.8%. Operating profit would grow by 15.6% YoY to Rs267mn.
Adjusted PAT is set to grow by 4% YoY to Rs82mn.
HT Media (Consolidated) (Rating: BUY; Target Price: Rs102)
Exhibit 38: Quarterly Estimates
(Rsmn) Q2FY18E Q2FY17 Q1FY18 QoQ (%) YoY (%)
Sales 5,807 6,022 5,990 (3.1) (3.6)
EBIDTA 727 505 799 (9.0) 44.0
EBIDTA Margin (%) 12.5 8.4 13.3 (82)bps 413bps
PAT 345 309 415 (16.9) 11.7
Source: Company, Centrum Research Estimates
We expect total revenues to decline by 3.6% to Rs5807mn. Overall ad revenue to decline 5% YoY, led by 7% decline for English while Hindi would decline by 2% YOY. Radio revenue is expected to grow 24% YoY on new station launches.
We estimate operating margin at 12.5%, up 413bps YoY, due to stable newsprint prices and cost cutting initiatives. Operating profit to grow 44% YoY to Rs727mn.
We expect PAT to grow 11.7% YoY to Rs345mn.
Info Edge (Standalone) (Rating: BUY; Target Price: Rs1,090)
Exhibit 39: Quarterly Estimates
(Rsmn) Q2FY18E Q2FY17 Q1FY18 QoQ (%) YoY (%)
Sales 2,289 2,100 2,225 2.9 9.0
EBIDTA 794 695 703 12.9 14.2
EBIDTA Margin (%) 34.7 33.1 31.6 (150)bps 160bps
PAT 664 801 642 3.4 (17.1)
Source: Company, Centrum Research Estimates
We expect 9% YoY increase in sales on the back of healthy 11% growth in the recruitment business and healthy 22%YoY growth in jeevansaathi.com. 99acres is expected to post a low single digit decline.
OPM is expected to expand by 160bps to 34.7%. Operating profit will grow 14.2% YoY to Rs794mn.
PAT would decline 17.1% to Rs664mn on the back of lower other income.

24 Q2FY18 Results Preview
Jagran Prakashan (Consolidated) (Rating: BUY; Target Price: Rs235)
Exhibit 40: Quarterly Estimates
(Rsmn) Q2FY18E Q2FY17 Q1FY18 QoQ (%) YoY (%)
Sales 5,791 5,620 5,913 (2.1) 3.0
EBIDTA 1,541 1,530 1613 (4.5) 0.7
EBIDTA Margin (%) 26.6 27.2 27.3 (67)bps (61)bps
PAT 815 790 866 (5.9) 3.2
Source: Company, Centrum Research Estimates
We expect a 3% YoY growth in revenues, with 2.2% YoY growth in print ad revenues while circulation revenue growth is expected at 1.5% YoY. We expect the radio business to post 6.5% YoY growth.
Operating margin is expected to decline by 61bps to 26.6%, while operating profit is set to remain flat at Rs1,541mn.
Adjusted PAT could grow by 3.2% YoY to Rs815mn.
Sun TV (Rating: Buy; Target Price: Rs840)
Exhibit 41: Quarterly Estimates
(Rsmn) Q2FY18E Q2FY17 Q1FY18 QoQ (%) YoY (%)
Sales 6,543 6,255 7,863 (16.8) 4.6
EBIDTA 4,763 4,663 4,484 6.2 2.1
EBIDTA Margin (%) 72.8 74.5 57.0 1,577 bps (175)bps
PAT 2,667 2,704 2516 6.0 (1.4)
Source: Company, Centrum Research Estimates
We expect the company to post a 4.6% YoY growth in revenue and a 2% growth in ad revenue. We expect 10.6% YoY growth in DTH revenues and a 21% increase in cable subscription revenues.
EBITDA margin is expected to contract by 175bps, with mere 2% YoY growth in operating profit to Rs4,763mn.
PAT is expected to decline 1.4% YoY to Rs2,667mn.
Zee Entertainment Enterprises (Rating: Hold; Target Price: Rs545)
Exhibit 42: Quarterly Estimates
(Rsmn) Q2FY18E Q2FY17 Q1FY18 QoQ (%) YoY (%)
Sales 15,766 16,954 15,403 2.4 (7.0)
EBIDTA 4,666 4,892 4,844 (3.7) (4.6)
EBIDTA Margin (%) 29.6 28.9 31.4 (185)bps 74 bps
Adj PAT 3,217 3,213 3,047 5.6 0.1
Source: Company, Centrum Research Estimates
Revenue is expected to decline 7% YoY on the sale of its sports business. Ad revenue is expected to grow by mere 2%. Subscription revenues would post a decline of 15% YoY while international subscription revenues would decline by 13% on appreciating Rupee.
EBITDA margin is expected to be at 29.6% on back of the sale of its sports business. EBITDA is set to decline 4.6% to Rs4666mn.
Adj PAT is expected to be flat to Rs3217mn.

25 Q2FY18 Results Preview
IFB Industries (Rating: HOLD; Target price: Rs605)
Exhibit 43: Quarterly Estimates (Rsmn) Q2FY18E Q2FY17 Q1FY18 QoQ (%) YoY (%)
Sales 5688 4394 4917 15.7 29.4
EBIDTA 403 328 209 92.8 22.9
EBIDTA Margin (%) 7.1 7.5 4.3 283bps (38)bps
PAT 216 178 74 192.7 21.3
Source: Company, Centrum Research Estimates
We expect sales to grow 29.4% on the back of healthy growth in the home appliance category.
We expect operating profit to increase by 23% to Rs403mn and margins to contract by 38bps YoY to 7.1% on the back of impact of GST.
Adjusted PAT is also expected to grow by 21.3% to Rs216mn.
La Opala RG (Rating: BUY; Target price: Rs555)
Exhibit 44: Quarterly Estimates (Rsmn) Q2FY18E Q2FY17 Q1FY18 QoQ (%) YoY (%)
Sales 766 698 467 64.0 9.7
EBIDTA 317 242 186 70.4 31.0
EBIDTA Margin (%) 41.4 34.7 39.8 156bps 671bps
PAT 212 172 126 67.9 23.3
Source: Company, Centrum Research Estimates
We expect sales to grow by healthy 9.7% on the back of double digit volume growth.
Operating profit will grow by 31% to Rs317mn. Operating margins are likely to expand 671bps on strong revenue growth and lower ad spends.
Adjusted PAT is expected to expand by 23% to Rs212mn on higher other income.
Mirza International (Rating: BUY; Target price: Rs205)
Exhibit 45: Quarterly Estimates (Rsmn) Q2FY18E Q2FY17 Q1FY18 QoQ (%) YoY (%)
Sales 2703 2503 2521 7.2 8.0
EBIDTA 497 378 437 13.7 31.5
EBIDTA Margin (%) 18.4 15.1 17.3 105 bps 329 bps
PAT 240 164 201 19.1 46.7
Source: Company, Centrum Research Estimates
We expect sales to grow by 8% on the back of a 10% decline in footwear exports and the leather business. The domestic branded business is expected to grow by 80% YoY.
Operating profit is expected to grow by 32% to Rs497mn, with margins expanding by 329bps to 18.4% on product mix change.
Adjusted PAT would grow by 46.7% to Rs240mn

26 Q2FY18 Results Preview
Speciality Restaurants (Rating: Hold; Target price: Under Review)
Exhibit 46: Quarterly Estimates (Rsmn) Q2FY18E Q2FY17 Q1FY18 QoQ (%) YoY (%)
Sales 743 796 722 2.9 (6.7) EBIDTA (1) 5 (20) (93.6) (127.1) EBIDTA Margin (%) (0.2) 0.6 (2.8) 265bps (78)bps PAT (44) (26) (65) (31.5) 72.4
Source: Company, Centrum Research Estimates
We expect sales to decline by 6.7% due to a significant slowdown in discretionary spends and closure of restaurants.
We expect the company to post an operating loss of a mere Rs1mn.
The company is expected to report a loss of Rs44mn against loss of Rs26mn in Q2FY17.
Sarla Performance Fibers (Rating: BUY; Target price: Rs75)
Exhibit 47: Quarterly Estimates (Rsmn) Q2FY18E Q2FY17 Q1FY18 QoQ (%) YoY (%)
Sales 834 810 791 5.5 3.0 EBIDTA 179 202 157 14.0 (11.4) EBIDTA Margin (%) 21.5 24.9 19.9 161 bps (348)bps PAT 109 136 90 21.1 (19.9)
Source: Company, Centrum Research Estimates
We expect sales to grow by 3% YoY to Rs834mn on the back of high single digit growth in the domestic business while the Sarla Flex would post a steep double digit decline.
We expect operating profit to decline by 11.4% to Rs179mn and operating margin to contract by 348bps on the back of losses in the US operations.
Adjusted PAT would decline by 20% to Rs109mn.

Good times continue We expect higher YoY as well as QoQ earnings across the board from our metals & mining universe, led by i) an uptick in volumes, largely steady realisations & lower RM costs for ferrous producers, ii) higher LME prices QoQ coupled with better volumes for non-ferrous producers, and iii) steady performance from refractory producers led by higher volume benefits (steel production up 5.1% YoY) mitigated by increasing RM costs. We expect strong YoY earnings growth from HZL/Vedanta/JSW among largecaps and Graphite India/ Tata Sponge/Tata Metaliks in midcaps. We expect weak results only from IFGL and Ratnamani. We maintain our preference for Hindalco/Vedanta and select midcaps like Orient Refractories/Tata Metaliks/Tata Sponge. Ferrous – better sequential spreads: Steel prices were higher in the domestic
market as global steel prices picked up materially (CIS & China prices up 20%+ QoQ) which led to domestic prices getting aligned to import parity but the price improvement was largely back-ended. We expect blended realisations to remain muted QoQ due to lag effect and inferior product mix. Volumes remained strong for large producers and EBITDA/t is expected to improve led by lower raw material costs. Tata Sponge’s earnings would recover sharply led by strong realisations & hence better spreads. Tata Metaliks is expected to report robust YoY growth led by higher pig iron volumes and cost optimisation projects. Ratnamani is expected to deliver flattish YoY earnings led by subdued volumes due to lower order book.
Non-Ferrous – sharp uptick in realisations to prop up earnings: LME prices for base metals were higher QoQ by 5-14% led by zinc & lead and rupee flat QoQ thereby impacting realisations positively. Coal costs are expected to increase due to higher e-auction prices & lower availability. HZL would deliver higher earnings QoQ led by higher LME prices. Earnings at Hindalco would remain solid, while Vedanta is expected to deliver a sharp QoQ increase in earnings led by higher contribution from majority of businesses on account of better realisations.
Refractories & midcaps – Solid performance to continue: Refractory producers are expected to deliver a steady quarter as the increase in domestic steel production (up 5.1% YoY in Q2) together with strong exports led by global pick up in steel production. However, increase in raw material costs is expected to put pressure on margins. Orient is expected to lead the revenue growth in the sector with benefit from higher export sales. Graphite India’s earnings would pick up materially led by higher realisations due to successful renegotiations of earlier contracts. Oriental carbon is expected to report earnings growth led by volume ramp-up at its new capacity.
Recommendation: In largecaps, we remain neutral on the ferrous space, while we remain constructive on the non-ferrous space and prefer Hindalco/Vedanta over Tata Steel/JSW Steel. Among midcaps, we continue to like Orient Refractories and Ratnamani Metals. We are positive on select ferrous midcap stocks like Tata Metaliks and Tata Sponge due to their strong business model and growth prospects. Graphite India which was initiated by us in June’17 has more than tripled from our IC price of Rs138 and we believe that further upside could be limited in the same.
Stock Price Performance (%)*
Company Name 1 M 3M 6 M 1 Yr
Tata Steel 5.9 25.0 37.8 77.4
JSW Steel (2.1) 19.3 26.4 46.2
Vedanta 2.5 26.9 20.7 65.2
Hindalco 2.1 28.7 29.4 58.4
Hindustan Zinc 4.1 19.3 10.7 27.6
Vesuvius India (2.7) 0.3 5.8 29.0
IFGL Refractories (12.6) 10.4 23.8 118.8
Orient Refractories (8.9) (1.1) 9.1 31.8
Graphite India 76.5 171.3 271.3 511.4
Ratnamani Metals (0.6) 7.2 11.8 58.9
Oriental Carbon 15.6 20.2 42.7 102.0
Tata Sponge 11.0 13.1 30.3 54.4
Tata Metaliks 2.8 (4.7) 16.6 75.4
NSE CNX Nifty 0.6 3.2 7.7 14.6
NSE CNX Metals 3.0 20.2 18.0 40.6
Source: Bloomberg; *as on 06 October2017
Rating and Target Prices Companies Rating CMP (Rs)* TP (Rs)
Tata Steel Hold 692 705
JSW Steel Hold 258 210
Vedanta Buy 327 300
Hindalco Buy 251 250
Hindustan Zinc Hold 319 270
Vesuvius India Hold 1,363 1,265
IFGL Refractories Hold 280 320
Orient Refractories Buy 149 170
Graphite India Buy 471 250
Ratnamani Metals Buy 893 935
Oriental Carbon Hold 1,412 1,140
Tata Sponge Buy 928 1010
Tata Metaliks Buy 717 890
Source: Centrum Research, * as on 06 October2017
Abhisar Jain, CFA [email protected]; 91 22 4215 992
Summary Estimates (Consolidated)
Y/E Mar (Rs mn) Net Sales EBITDA EBITDA % PAT-adj.*
Q2FY18E YoY (%) QoQ (%) Q2FY18E YoY (%) QoQ (%) Q2FY18E YoY(bps) QoQ (bps) Q2FY18E YoY (%) QoQ (%)
Tata Steel 3,21,808 22.4 9.5 48,204 62.3 (3.1) 14.9 365 (192) 15,328 NM (0.3)
JSW Steel 1,61,908 22.4 10.1 32,873 11.1 25.6 20.3 (206) 250 10,554 45.3 69.1
Vedanta 2,19,893 38.6 20.3 61,454 31.8 26.1 27.9 (146) 129 23,374 86.7 53.3
Hindalco (Std) 1,00,952 12.0 3.3 12,980 12.2 13.1 12.9 3 111 4,676 6.5 61.5
Hindustan Zinc 53,299 51.2 16.5 30,570 47.2 28.2 57.4 (155) 526 24,430 28.5 30.2
Vesuvius India Ltd# 2,506 12.4 4.4 464 8.1 0.5 18.5 (73) (72) 279 9.4 2.5
IFGL Refractories Ltd 1,994 3.2 0.8 277 (5.0) 12.6 13.9 (120) 146 133 (25.4) 18.5
Orient Refractories Ltd 1,500 13.4 5.9 278 10.6 16.4 18.5 (48) 168 189 12.3 16.0
Graphite India Ltd (Std) 4,585 45.8 30.6 807 472.6 127.2 17.6 1312 748 572 258.9 94.2
Ratnamani Metals & Tubes 3,278 1.8 11.3 534 3.1 13.4 16.3 20 31 276 (3.3) 19.7
Oriental Carbon & Chemicals 800 14.8 3.3 238 12.9 (6.3) 29.8 (52) (306) 151 2.7 3.6
Tata Sponge 2,002 44.3 14.4 432 154.9 11.8 21.6 935 (50) 338 110.5 10.6
Tata Metaliks 4,038 25.1 4.3 672 47.4 35.7 16.6 252 385 364 67.6 19.0
Source: Company, Centrum Research Estimates *PAT adjusted for forex and extraordinary items, #Q2FY18E is Q3CY17E for Vesuvius, *NM- Not Meaningful
INDIA
Metals & Mining 9 October 2017
Centrum Equity Research is available on Bloomberg, Thomson Reuters and FactSet

28 Q2FY18 Results Preview
Valuation Summary – Coverage Universe
Company
Rating CMP**
(Rs) TP
(Rs) EPS-Adj. (Rs) P/E (x) EV/EBITDA(x) P/BV(x)
FY17 FY18E FY19E FY17 FY18E FY19E FY17 FY18E FY19E FY17 FY18E FY19E
Tata Steel Hold 692 705 41.4 74.0 82.6 9.1 9.3 8.4 6.2 6.7 6.1 1.0 1.7 1.5
JSW Steel Hold 258 210 14.3 18.1 20.8 11.2 14.2 12.4 6.5 7.9 7.3 1.5 2.2 1.9
Vedanta Buy 327 300 19.2 27.8 34.9 9.6 11.8 9.4 3.9 6.0 5.1 1.5 2.8 2.4
Hindalco Buy 251 250 9.1 24.4 27.1 16.4 10.3 9.2 6.5 7.0 6.5 0.7 1.1 1.0
Hindustan Zinc Hold 319 270 19.7 21.2 22.3 12.0 15.1 14.3 8.6 9.7 8.9 3.2 3.6 3.1
Vesuvius India# Hold 1,363 1,265 43.7 53.6 63.2 20.5 25.4 21.6 10.8 14.1 11.9 3.2 4.2 3.7
IFGL Refractories Hold 280 320 12.3 13.1 17.1 11.5 21.4 16.4 5.5 9.1 7.4 0.7 1.4 1.3
Orient Refractories Buy 149 170 5.7 6.4 7.7 17.9 23.0 19.3 10.8 14.4 11.9 4.5 5.5 4.7
Graphite India Buy 471 250 3.6 16.5 41.5 22.8 28.5 11.4 31.5 18.1 7.2 0.9 4.5 3.5
Ratnamani Metals Buy 893 935 30.9 36.0 43.0 19.0 24.8 20.8 10.3 12.9 10.9 2.4 3.2 2.9
OCCL Hold 1,412 1,140 51.2 69.2 83.8 13.5 20.4 16.9 9.0 13.2 10.9 2.2 3.8 3.2
Tata Sponge Buy 928 1,010 38.2 74.0 80.6 15.7 12.6 11.5 5.5 5.8 4.7 1.1 1.5 1.3
Tata Metaliks Buy 717 890 46.2 72.1 88.0 7.7 9.9 8.1 6.4 7.0 5.9 4.3 4.8 3.1
Source: Company, Centrum Research Estimates, #FY17=CY16 and so on, ** as on 06 October 2017
Quarterly trends
Exhibit 48: Global HRC price trend Exhibit 49: Global non-ferrous price trend s
Source: Bloomberg, Centrum Research Source: Bloomberg, Centrum Research
Exhibit 50: Metal price trend
(In US$/t) Q2FY18 Q2FY17 YoY% Q1FY18 QoQ%
Ferrous
HRC CIS Export 529 372 42.2 436 21.3
China Domestic 598 411 45.5 470 27.2
Northern Europe 605 474 27.6 586 3.2
Iron Ore China 62% Fe - CFR 72 58 23.8 64 12.2
Coal Coking coal spot (Aus) - FOB 164 116 41.4 178 (7.9)
Coking coal contract 170 92 84.8 194 (12.4)
Thermal coal 6700Kcal - FOB 85 64 32.8 81 5.5
Non-Ferrous (LME) Aluminium 2,008 1,620 24.0 1,911 5.1
Copper 6,345 4,775 32.9 5,662 12.1
Zinc 2,955 2,251 31.3 2,595 13.9
Lead 2,327 1,868 24.6 2,163 7.6
Metal Premiums Aluminium - Japan 92 76 21.1 117 (21.4)
USD/INR (average) 64.3 67.0 (4.0) 64.4 (0.2)
USD/INR (closing) 65.3 66.6 (2.0) 64.5 1.2
Source: Bloomberg, Centrum Research
200
300
400
500
600
700
Sep
-13
Mar
-14
Au
g-14
Jan
-15
Jul-1
5
Dec
-15
May
-16
Oct
-16
Ap
r-17
Sep
-17
China Domestic Price CIS Export priceNorthern Europe US Midwest
1,000
1,500
2,000
2,500
3,000
3,500Se
p-1
3
Mar
-14
Au
g-14
Jan
-15
Jul-1
5
Dec
-15
May
-16
Oct
-16
Ap
r-17
Sep
-17
LME-Al LME-Zn LME-Pb

29 Q2FY18 Results Preview
Tata Steel (Rating: HOLD; Target Price: Rs705)
Exhibit 51: Quarterly Estimates
Tata Steel – Cons (Rs mn) Q2FY18E Q2FY17 YoY (%) Q1FY18 QoQ (%)
Net sales 3,21,808 2,62,919 22.4 2,93,868 9.5
EBITDA 48,204 29,700 62.3 49,740 (3.10
EBITDA (%) 14.9 11.3 365 bps 16.8 (192)bps
Other Income 1,500 1,084 38.4 1,555 (3.5)
PAT-adj* 15,328 99 NM 15,379 (0.3)
Tata Steel -Standalone
Net sales 1,42,636 1,05,227 35.6 1,28,356 11.1
EBITDA 34,821 19,148 81.9 29,663 17.4
EBITDA (%) 24.2 18.1 610 bps 22.9 129bps
PAT-adj* 12,945 3,138 312.5 11,232 15.2
Standalone Operations Sales volume (MT) 3.1 2.6 19.7 2.8 14.1
Blended realisations/tonne (Rs) 45,471 40,163 13.2 46,675 (2.6)
EBITDA/tonne (Rs) 11,100 7,308 51.9 10,786 2.9
Source: Company, Centrum Research Estimates *adjusted for exceptional item, *NM- Not Meaningful
We expect consolidated revenue to increase by 22.4% YoY to ~Rs321bn. We expect sales volumes of ~3.1 MT in India (up 20% YoY) and 2.6 MT in Europe. Blended realisations are expected to be lower QoQ in domestic operations due to higher share of basic grade steel which would negate the sequential price increase in domestic market, and realisations in European operations are likely to be higher QoQ by ~3%.
We expect a consolidated EBITDA margin of 14.9%. EBITDA/t at domestic operations is expected to be higher by 52% YoY and higher by 2.9% QoQ at Rs11100, led by lower raw material costs. We expect European operations to show lower profitability on QoQ basis led by lower spreads with delayed impact of higher coking coal costs. We expect EBITDA/t of US$65 in European operations (vs US$81 in Q1). Consolidated EBITDA at ~Rs48.2bn is expected to be higher by ~62% YoY but lower by 3% QoQ
Consolidated adjusted PAT is expected at Rs15.3bn. The impact of British pension settlement of GBP550mn would be included in Q2 results as part of exceptional items.
JSW Steel (Rating: HOLD; Target Price: Rs210)
Exhibit 52: Quarterly Estimates JSW Steel –Cons (Rs mn) Q2FY18E Q2FY17 YoY (%) Q1FY18 QoQ (%)
Net sales 1,61,908 1,32,278 22.4 1,46,990 10.1
EBITDA 32,873 29,586 11.1 26,170 25.6
EBITDA (%) 20.3 22.4 (206)bps 17.8 250bps
PAT after MI- adj* 10,554 7,265 45.3 6,240 69.1
Operations-Steel Business Sales volume (MT) 3.8 3.8 -0.5 3.4 11.8
Blended realisations/tonne (Rs) 41,589 33,973 22.4 42,121 (1.3)
Blended EBITDA/tonne (Rs) 8,576 7,741 10.8 7,600 12.8
Source: Company, Centrum Research Estimates *adjusted for exceptional items and forex loss/ (gain)
We expect sales volumes to remain flat YoY at 3.8MT in line with the company’s yearly sales plan and led by aggressive marketing efforts in domestic & export markets. Realisations are expected to be higher by 22.4% on YoY basis. Realisations in flats have improved in domestic market but the increase was more back-ended and due to lower share of value added products in overall mix, we expect realisations to remain marginally lower QoQ
We expect EBITDA of Rs32.8bn, up ~11% YoY with an EBITDA margin of 20.3%. We expect steel business EBITDA/t of Rs8576, up 10.8% YoY and 12.8% QoQ. Sequential improvement in EBITDA would be led by lower raw material costs.
Consolidated adjusted PAT is expected at Rs10.6bn.

30 Q2FY18 Results Preview
Vedanta (Rating: BUY; Target Price: Rs300)
Exhibit 53: Quarterly Estimates
Vedanta (Rs mn) Q2FY18E Q2FY17 YoY (%) Q1FY18 QoQ (%)
Net sales 2,19,893 1,58,596 38.6 1,82,850 20.3
EBITDA 61,454 46,632 31.8 48,740 26.1
EBITDA (%) 27.9 29.4 (146)bps 26.7 129bps
Group PAT - adj.* 23,374 12,521 86.7 15,250 53.3
Source: Company, Centrum Research Estimates *After adjusting for Forex loss/(gain) & exceptional
We expect EBITDA to pick up materially on both YoY and QoQ basis led by higher profitability at majority of businesses. Zinc operations at HZL would contribute higher led by higher realizations and volumes. Merchant power operations are expected to report muted earnings led by lower PLF’s in the wake of coal shortages. Lower utilisation at VAL-1 due to earlier pot outages and higher coal costs would negate higher LME prices and keep EBITDA performance from the aluminium business muted. Zinc international business is expected to report better volumes and coupled with higher realisations would report strong earnings, while iron ore operations would see lower contribution led by seasonal factors and lower realisations. Copper operations are expected to deliver steady earnings performance.
We see consolidated EBITDA of Rs61.5bn, with a margin of 27.9%.
Group adjusted PAT is expected at ~Rs23.4bn.
Hindustan Zinc (Rating: HOLD; Target Price: Rs270)
Exhibit 54: Quarterly Estimates Hindustan Zinc (Rs mn) Q2FY18E Q2FY17 YoY (%) Q1FY18 QoQ (%)
Net sales 53,299 35,257 51.2 45,760 16.5
EBITDA 30,570 20,767 47.2 23,840 28.2
EBITDA (%) 57.4 58.9 (155)bps 52.1 526bps
PAT 24,430 19,019 28.5 18,760 30.2
Zinc sales volume (Tonne) 1,95,000 1,49,000 30.9 1,90,000 2.6
Lead sales volume (Tonne) 39,000 32,000 21.9 34,000 14.7
Silver sales volume (Kg) 1,35,000 1,08,000 25.0 1,10,000 22.7
Source: Company, Centrum Research Estimates
We expect revenue to increase ~51% YoY led by higher realizations as well as higher volumes in line with the yearly mine plan. Zinc volumes are expected to be higher at 195kt, up 31% YoY while lead volumes are expected at 39kt, up 22% YoY. Zinc LME was higher by ~31% YoY while lead LME was up 25% YoY.
EBITDA is expected to increase ~47% YoY to Rs30.6bn led by higher realisations and volumes. We expect EBITDA margin of 57.4%.
PAT is expected to be at Rs24.4bn, up 28.5% YoY.

31 Q2FY18 Results Preview
Hindalco Industries (Rating: BUY; Target Price: Rs250)
Exhibit 55: Quarterly Estimates
Hindalco - standalone (Rs mn) Q2FY18E Q2FY17 YoY (%) Q1FY18 QoQ (%)
Net sales 1,00,952 90,123 12.0 97,700 3.3
EBITDA 12,980 11,564 12.2 11,477 13.1
EBITDA (%) 12.9 12.8 3 bps 11.7 111bps
PAT 4,676 4,389 6.5 2,896 61.5
Volumes (Tonne)
Aluminium 3,25,526 3,20,000 1.7 2,99,000 8.9
Copper 1,00,952 90,123 12.0 97,700 3.3
Source: Company, Centrum Research Estimates,
We expect revenue to be higher by ~12% YoY led by higher volumes and better LME realizations though negated partially by hedges. Aluminium volumes are expected to be at ~325kt, driven by optimum output at all smelters. Copper volumes are expected to be strong at 100kt.
EBITDA is expected to be up ~12% YoY to Rs13bn, and is expected to be higher QoQ due to benefits of higher volumes and higher realisations partially negated by the sequential increase in commodity prices & hedges at lower LME prices. We expect EBITDA margin of 12.9%. All-in aluminium prices were up 24% YoY and 3.6% QoQ. We expect aluminium division EBITDA of Rs9.5bn (vs Rs8.8bn in Q1) with blended EBITDA/t of US$453, while the copper business would deliver steady results (EBITDA of Rs3.5bn).
Standalone PAT is expected to be at Rs4.7bn.
Graphite India (Rating: BUY; Target Price: Rs250)
Exhibit 56: Quarterly Estimates Graphite India (Rs mn) Q2FY18E Q2FY17 YoY (%) Q1FY18 QoQ (%)
Net sales (Rsmn) 4,585 3,146 45.8 3,510 30.6
EBITDA (Rsmn) 807 141 472.6 355 127.2
EBITDA (%) 17.6 4.5 1312bps 10.1 748bps
PAT (Rsmn) 572 159 258.9 294 94.2
Capacity Utilization (%) 90 75 1500 bps 95 (500)bps
Source: Company, Centrum Research Estimates
We expect revenues to increase 46% YoY to Rs4.6bn led by higher volumes as well as sharp uptick in realisations as company was able to renegotiate its existing supply contracts in the wake of sharp uptick in electrode prices. Capacity utilisation during the quarter is expected at 90% due to higher demand for electrodes from EAF producers.
EBITDA is expected to increase 473% YoY and 127% QoQ to Rs807mn, led by strong realisations and low base effect. We expect EBITDA margin of 17.6% during the quarter.
PAT is expected to increase 259% YoY to Rs572mn.

32 Q2FY18 Results Preview
Vesuvius India (Rating: HOLD; Target Price: Rs1,265)
Exhibit 57: Quarterly Estimates
Vesuvius India Ltd (Rs mn) Q3CY17E Q3CY16 YoY (%) Q2CY17 QoQ (%)
Net sales 2,506 2,230 12.4 2,400 4.4
EBITDA 464 429 8.1 461 0.5
EBITDA (%) 18.5 19.2 (73)bps 19.2 (72)bps
PAT 279 255 9.4 272 2.5
Source: Company, Centrum Research Estimates
We expect revenue to rise 12.4% YoY, largely on account of higher volumes and increased sales to its large customers like Tata Steel, Essar and JSW Steel. Q3CY17 domestic steel production went up 5.1% YoY and would support the company’s revenue growth.
EBITDA is expected to be higher by ~8% YoY to Rs464mn, led by lower gross margins due to an increase in raw material costs. We expect the EBITDA margin to shrink 73bps to 18.5%.
PAT is expected to be higher by 9.4% YoY to Rs279mn.
IFGL Refractories (Rating: HOLD; Target Price: Rs320)
Exhibit 58: Quarterly Estimates IFGL-Cons (Rs mn) Q2FY18E Q2FY17 YoY (%) Q1FY18 QoQ (%)
Net sales 1,994 1,932 3.2 1,978 0.8
EBITDA 277 292 (5.0) 246 12.6
EBITDA (%) 13.9 15.1 (120)bps 12.5 146bps
PAT-adj. 133 178 (25.4) 112 18.5
Source: Company, Centrum Research Estimates
We expect revenue to increase by 3.2% YoY to Rs1,994mn. EI Ceramics’ revenue will likely remain flat whereas IFGL Kandla is expected to deliver superior performance led by higher volumes through full ramp-up of expanded capacity. Monocon and Hoffman are expected to deliver better profitability QoQ. Standalone performance is expected to improve YoY supported by higher sales in both domestic and export markets.
EBITDA is expected to increase by 12.6% QoQ to Rs277mn led by higher contribution from higher margins subs and improvement in the standalone business. We expect cons. EBITDA margin of 13.29%. We expect EBITDA to be lower YoY on account of high base effect of overseas business in last year Q2.
PAT is expected to increase by 18.5% QoQ to Rs133mn.
Orient Refractories (Rating: BUY; Target Price: Rs170)
Exhibit 59: Quarterly Estimates Orient Refractories (Rs mn) Q2FY18E Q2FY17 YoY (%) Q1FY18 QoQ (%)
Net sales 1,500 1,322 13.4 1,417 5.9
EBITDA 278 251 10.6 238 16.4
EBITDA (%) 18.5 19.0 (48)bps 16.8 168bps
PAT 189 168 12.3 163 16.0
Source: Company, Centrum Research Estimates
We expect revenue to increase ~13% YoY to Rs1.5bn, led mainly by higher volumes on account of higher steel production. Higher exports to both RHI and non-RHI customers would aid revenues.
EBITDA is expected to increase by 11% YoY to Rs278mn. We expect EBITDA margin of 18.5% down 48bps YoY led by lower gross margins on account of higher raw material costs.
PAT is expected to be up 12% YoY to Rs189mn.

33 Q2FY18 Results Preview
Oriental Carbon & Chemicals (Rating: HOLD; Target Price: Rs1,140)
Exhibit 60: Quarterly Estimates
Oriental Carbon - Standalone (Rs mn) Q2FY18E Q2FY17 YoY (%) Q1FY18 QoQ (%)
Net sales 800 696 14.8 774 3.3
EBITDA 238 211 12.9 255 (6.3)
EBITDA (%) 29.8 30.3 (52)bps 32.9 (306)bps
PAT 151 147 2.7 146 3.6
Source: Company, Centrum Research Estimates
We expect revenue to increase 14.8% YoY to Rs800mn led by higher volumes driven by ramp-up of a new expansion at Mundra and higher volumes in domestic and new markets of China & the US. Realisations are expected to remain flat QoQ due to benign input prices.
EBITDA is expected to increase 13% YoY to Rs238mn. We expect an EBITDA margin of 29.8% as the focus on cost control and economies of scale would yield margin benefits. We expect EBITDA to decline QoQ due to high base effect.
PAT is expected to increase 2.7% YoY to Rs151mn.
Ratnamani Metals & Tubes (Rating: BUY; Target Price: Rs935)
Exhibit 61: Quarterly Estimates
Ratnamani Metals & Tubes (Rs mn) Q2FY18E Q2FY17 YoY (%) Q1FY18 QoQ (%)
Net sales 3,278 3,219 1.8 2,945 11.3
EBITDA 534 518 3.1 471 13.4
EBITDA (%) 16.3 16.1 20 bps 16.0 31bps
PAT 276 285 (3.3) 231 19.7
Volumes (tonne)
SS pipes & tubes 4,800 4,499 6.7 4,493 6.8
CS pipes & tubes 30,000 41,767 (28.2) 31,641 (5.2)
Realizations (Rs/t) SS pipes & tubes 3,10,000 3,04,606 1.8 2,88,785 7.3
CS pipes & tubes 48,000 41,294 16.2 47,738 0.5
Source: Company, Centrum Research Estimates
We expect revenue to remain largely flattish YoY at Rs3.3bn led by a muted order book earlier and the execution of the same accordingly. The sharp uptick in orders was seen in H1FY18 and the execution of the same is expected in H2FY18. We expect both CS and SS divisions to report marginally higher volumes YoY. Realisation in case of the CS segment is expected to remain flat whereas the SS segment could witness realisation growth of 7% QoQ.
EBITDA is expected to increase ~3% YoY to Rs534mn. We expect EBITDA margin of 16.3%.
PAT is expected to fall 3% YoY to Rs276mn.
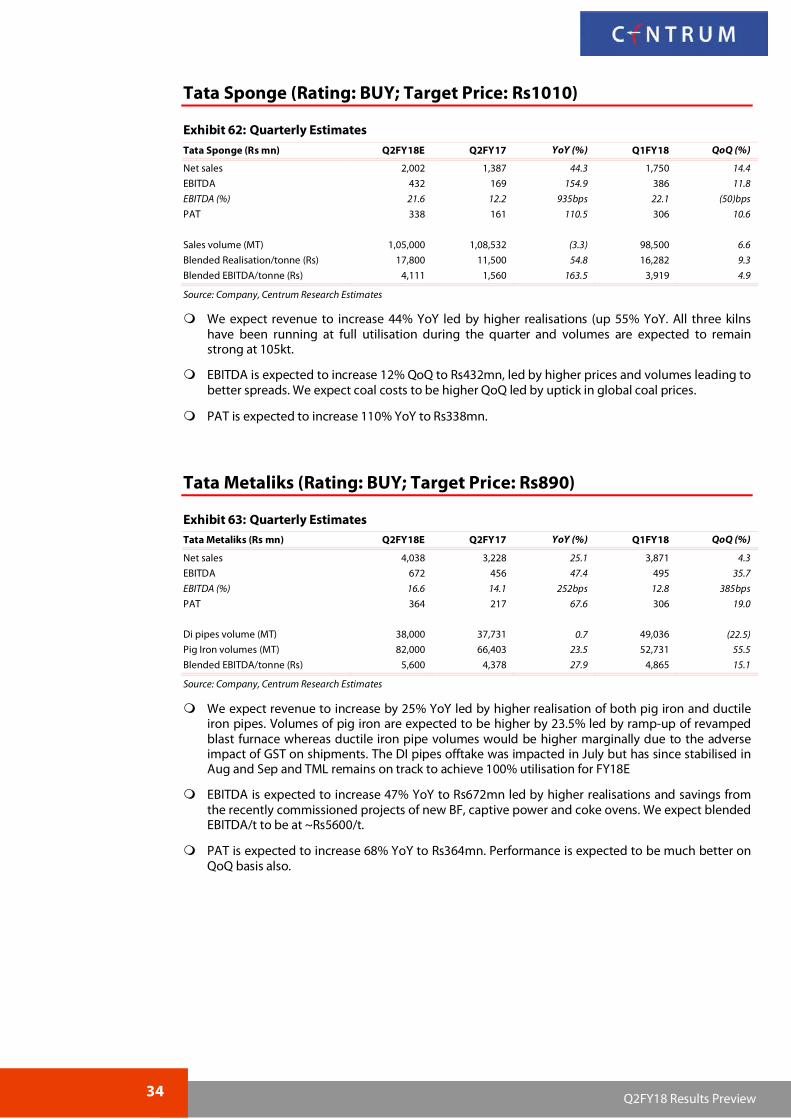
34 Q2FY18 Results Preview
Tata Sponge (Rating: BUY; Target Price: Rs1010)
Exhibit 62: Quarterly Estimates
Tata Sponge (Rs mn) Q2FY18E Q2FY17 YoY (%) Q1FY18 QoQ (%)
Net sales 2,002 1,387 44.3 1,750 14.4
EBITDA 432 169 154.9 386 11.8
EBITDA (%) 21.6 12.2 935bps 22.1 (50)bps
PAT 338 161 110.5 306 10.6
Sales volume (MT) 1,05,000 1,08,532 (3.3) 98,500 6.6
Blended Realisation/tonne (Rs) 17,800 11,500 54.8 16,282 9.3
Blended EBITDA/tonne (Rs) 4,111 1,560 163.5 3,919 4.9
Source: Company, Centrum Research Estimates
We expect revenue to increase 44% YoY led by higher realisations (up 55% YoY. All three kilns have been running at full utilisation during the quarter and volumes are expected to remain strong at 105kt.
EBITDA is expected to increase 12% QoQ to Rs432mn, led by higher prices and volumes leading to better spreads. We expect coal costs to be higher QoQ led by uptick in global coal prices.
PAT is expected to increase 110% YoY to Rs338mn.
Tata Metaliks (Rating: BUY; Target Price: Rs890)
Exhibit 63: Quarterly Estimates Tata Metaliks (Rs mn) Q2FY18E Q2FY17 YoY (%) Q1FY18 QoQ (%)
Net sales 4,038 3,228 25.1 3,871 4.3
EBITDA 672 456 47.4 495 35.7
EBITDA (%) 16.6 14.1 252bps 12.8 385bps
PAT 364 217 67.6 306 19.0
Di pipes volume (MT) 38,000 37,731 0.7 49,036 (22.5)
Pig Iron volumes (MT) 82,000 66,403 23.5 52,731 55.5
Blended EBITDA/tonne (Rs) 5,600 4,378 27.9 4,865 15.1
Source: Company, Centrum Research Estimates
We expect revenue to increase by 25% YoY led by higher realisation of both pig iron and ductile iron pipes. Volumes of pig iron are expected to be higher by 23.5% led by ramp-up of revamped blast furnace whereas ductile iron pipe volumes would be higher marginally due to the adverse impact of GST on shipments. The DI pipes offtake was impacted in July but has since stabilised in Aug and Sep and TML remains on track to achieve 100% utilisation for FY18E
EBITDA is expected to increase 47% YoY to Rs672mn led by higher realisations and savings from the recently commissioned projects of new BF, captive power and coke ovens. We expect blended EBITDA/t to be at ~Rs5600/t.
PAT is expected to increase 68% YoY to Rs364mn. Performance is expected to be much better on QoQ basis also.

On the recovery path We expect the pharma sector to report subdued results for Q2FY18 due to regulatory issues from USFDA, pricing pressure in the US generic market and after effects of GST implementation in the domestic market. However, re-stocking by the trade in the domestic market and faster approval of ANDAs from US FDA would drive the future growth. The 14 pharma companies under our coverage would post revenue/EBIDTA/net profit decline of 3%/18%/25% YoY in Q2FY18. We expect margins of these companies to decline 410bps to 21.8% in Q2FY18 from 25.9% in Q2FY17. The domestic market has grown by 10.0% on TTM basis and is expected to grow at ~11% in FY18 due to re-stocking by trade from Q2FY18 onwards. Aurobindo Pharma (APL), Abbott India (AIL), Sanofi India (SIL) and Lupin remain our top pharma picks. We expect positive surpises from Marksans Pharma (MPL) and SIL and negative surprises from Sun Pharma (SPIL). Domestic Pharma Market declined due to GST: As per AIOCD AWCS MAT data,
the domestic pharma market grew 10.0% during Sept’16 - August’17 (TTM) due to uncertainties of GST in July and August’17. The domestic pharma market has recovered from September’17 onwards due to re-stocking by the trade. There is no major price change under GST for pharma products as the GST rate is 12%. The Government has revised the prices of NLEM products upwards by 2.9% to compensate for higher tax rate under GST. That said, the price increase of up to 10% in non-NLEM products, volume growth and new product launches are likely to drive the domestic pharma market up by ~11% in FY18. We expect the growth momentum to continue, driven by growing demand in lifestyle segments.
Companies Under Coverage to Report 3% Sales Decline: For Q2FY18, we expect our pharma universe to report 3% YoY decline in revenues, 18% decline in EBIDTA and 25% decline in net profit. We expect EBIDTA margin to decline by 410bps YoY to 21.8% from 25.9% due to the decline in revenues. Companies under our coverage constitute ~34% of the domestic market and are likely to get affected by GST de-stocking. We expect the US revenues of the companies to get impacted by pricing pressure in the US due to consolidation of distributors and faster ANDA approvals by US FDA leading to increased competition.
Moving Towards Bright Future: The pharma sector has sailed through the uncertainty on the regulatory front, price decline in NLEM products, pricing pressure in the US and increased competition in the US generic market. Around 35% of abbreviated new drug application (ANDA) approvals from USFDA are in favour of Indian companies which would help them gain additional market share in the US. We expect pharma MNCs in India to perform well in the future from the launch of line extension of existing brands.
Recommendation and Key Risks: We expect pharma companies to report good growth in the domestic and global markets due to re-stocking by trade, new product introductions, changes in lifestyles and enhanced exports. There is a shortage of several products in the US, especially injectables which would benefit Indian companies. APL, AIL, SIL and Lupin remain our preferred picks in the pharma sector. Key risks: 1) Appreciation of rupee against the dollar and 2) regulatory risks for manufacturing facilities
Stock Price Performance (%)* Company Name 1 M 3M 6 M 1 Yr
Abbott India (2.1) (2.6) (13.8) (14.2) Aurobindo Pharma 0.2 9.2 11.3 (12.9) Biocon 5.0 3.4 (5.5) 9.7 Cipla 4.6 7.8 (0.8) 1.1 Dr. Reddy's Labs 7.6 (10.9) (12.5) (22.7) FDC 8.4 2.8 (7.4) (14.5) Glaxo SK Pharma (2.0) (6.8) (12.1) (17.6) Granules India (5.6) (15.7) (13.6) 1.2 Lupin 5.0 (3.6) (28.0) (29.9) Marksans Pharma 22.0 15.1 (7.7) (14.0) Merck (12.4) (1.0) (3.3) 48.7 Pfizer (3.1) (3.0) (6.3) (8.4) Sanofi India 1.8 (1.9) (13.3) (2.4) Sun Pharma 7.8 (2.8) (22.8) (29.6) Cnx Pharma 4.9 (1.3) (9.5) (17.5) Nifty 0.3 3.2 7.7 14.6
Source: Bloomberg; *as on 6th October 2017
Revision in target prices Company Rating CMP* (Rs) Target price Rs
Abbott India Buy 4,162 5,240 Aurobindo Pharma Buy 746 970 Biocon Hold 351 380 Cipla Buy 585 610 Dr. Reddy's Labs Hold 2,376 2,480 FDC Buy 190 210 Glaxo SK Pharma Sell 2,415 1,390 Granules India Buy 122 180 Lupin Buy 1,039 1,240 Marksans Pharma Buy 48 50 Merck * Hold 1,062 1,080 Pfizer Hold 1,779 1,690 Sanofi India * Buy 4,076 4,900 Sun Pharma Hold 530 490
Source: Centrum Research Estimates, * Y/E end December *as on 6th October 2017
Nifty vs. Pharma Index
Source: Bloomberg
Ranjit Kapadia, [email protected]; 91 22 4215 9645
Summary Estimates Particulars NET SALES (Rs mn) EBIDTA (Rs mn) EBIDTA Margin (%) NET PROFIT (Rs mn) (Y/E March) Q2FY18E YoY(%) QoQ(%) FY18E Q2FY18E YoY(%) QoQ(%) FY18E Q2FY18E Q2FY17 Q1FY18 Q2FY18E YoY(%) QoQ(%) FY18E
Abbott India 8,100 11.1 13.3 33,807 1,260 19.0 104.5 5,068 15.6 14.5 8.6 920 22.7 90.9 3,588 Aurobindo Pharma 39,815 5.5 8.2 1,72,090 10,265 10.5 22.0 40,664 25.8 24.6 22.9 6,695 10.6 29.7 26,444 Biocon 10,890 14.1 16.6 47,844 2,970 23.8 54.6 12,748 27.3 25.2 20.6 1,610 9.7 98.0 8,388 Cipla 38,960 3.9 10.5 1,63,929 7,760 14.0 20.0 30,444 19.9 18.1 18.3 3,760 6.2 (11.5) 16,327 Dr. Reddy's Labs 37,730 4.3 13.2 1,51,334 6,780 8.1 109.8 28,124 18.0 17.3 9.7 3,310 7.2 397.0 15,314 FDC 3,040 4.0 24.2 11,203 730 (12.4) 105.6 2,487 24.0 28.5 14.5 566 (15.5) 93.8 1,879 Glaxo SK Pharma 7,800 (2.4) 28.5 33,660 1,350 (4.1) 585.3 5,346 17.3 17.6 3.2 950 (3.7) 139.0 3,643 Granules India 4,010 10.2 3.9 17,339 850 14.6 10.4 3,685 21.2 20.4 19.9 460 12.7 24.7 2,181 Lupin 41,340 (3.6) 6.8 1,83,779 9,420 (8.4) 22.6 41,417 22.8 24.0 19.9 5,265 (20.5) 47.0 22,022 Marksans Pharma 2,350 30.2 6.3 9,537 330 NA 13.8 1,257 14.0 -0.1 13.1 160 3,900.0 16.8 633 Merck * 2,970 10.4 11.8 11,317 505 12.0 82.3 1,528 17.0 16.8 10.4 340 23.6 68.3 985 Pfizer 4,800 (13.9) 11.0 20,852 911 (0.1) 18.9 3,866 19.0 16.4 17.7 628 7.2 9.8 2,633 Sanofi India * 7,060 13.1 17.5 27,306 1,805 24.7 56.4 6,371 25.6 23.2 19.2 1,255 55.7 70.3 3,856 Sun Pharma 67,090 (18.7) 8.1 3,08,395 15,090 (52.4) 37.7 69,489 22.5 38.4 17.6 9,770 (56.3) 55.6 43,108
Source: Companies, Centrum Research Estimates; *Y/E Dec
65
75
85
95
105
115
125
Oct
-16
Oct
-16
Nov
-16
Dec
-16
Dec
-16
Jan-
17
Feb
-17
Feb
-17
Mar
-17
Apr
-17
Apr
-17
May
-17
Jun-
17
Jun-
17
Jul-1
7
Aug
-17
Aug
-17
Sep-
17
Oct
-17
CNX PHARMA NIFTY
INDIA 9 October 2017 Pharmaceuticals
Centrum Equity Research is available on Bloomberg, Thomson Reuters and FactSet

36 Q2FY18 Results Preview
Summary Valuations
Particulars (Y/E March)
Rating Target Price Rs.
CMP Rs.#
Mkt Cap Rs mn
EPS Rs P/E (x) EV/EBIDTA (x) P/BV(x)
FY17 FY18E FY19E FY17 FY18E FY19E FY17 FY18E FY19E FY17 FY18E FY19E
Abbott India Buy 5,240 4,162 88,443 130.2 168.9 218.3 35.6 25.7 19.9 22.0 15.9 12.1 7.1 5.6 4.7
Aurobindo Pharma Buy 970 746 4,37,156 39.3 45.2 53.6 19.0 13.9 11.7 13.5 9.9 8.1 4.7 3.1 2.5
Biocon Hold 380 351 2,10,600 11.5 14.6 21.1 25.3 23.6 16.4 17.7 16.1 11.8 1.2 3.7 9.0
Cipla Buy 610 585 4,70,633 12.5 20.3 25.3 44.1 27.1 21.8 19.0 15.3 12.1 3.6 3.2 2.8
Dr. Reddy's Labs Hold 2,480 2,376 3,93,941 77.9 92.4 118.1 39.5 28.4 22.2 22.7 17.0 14.4 4.2 3.3 3.0
FDC Buy 210 190 33,934 10.9 10.5 12.2 18.6 17.9 15.5 16.9 16.2 14.7 2.8 2.3 2.1
Glaxo SK Pharma Sell 1,390 2,415 2,04,551 34.4 43.0 57.8 88.8 58.4 43.5 59.5 38.3 29.1 12.9 10.5 10.1
Granules India Buy 180 122 27,901 7.2 9.5 12.9 17.4 12.1 8.9 10.5 7.9 6.0 3.2 2.4 1.9
Lupin Buy 1,240 1,039 4,69,109 56.6 48.8 53.9 26.8 25.2 22.8 16.8 15.0 13.4 5.1 3.6 3.2
Marksans Pharma Buy 50 48 19,647 0.2 1.5 2.7 198.5 29.6 17.2 44.3 16.1 10.8 4.2 3.7 3.1
Merck * Hold 1,080 1,062 17,629 45.7 59.4 76.9 17.9 12.5 13.6 8.0 9.6 7.1 2.1 1.7 2.1
Pfizer Hold 1,690 1,779 81,389 53.5 57.5 73.5 33.3 30.9 24.2 23.3 21.1 16.9 3.4 3.2 2.9
Sanofi India * Buy 4,900 4,076 93,870 129.0 153.4 196.0 33.3 27.7 21.7 17.7 15.7 12.2 5.7 5.2 4.6
Sun Pharma Hold 490 530 12,71,470 32.7 18.1 18.7 22.4 32.9 31.7 16.8 19.1 18.3 4.3 3.4 3.1
Source: Company, Centrum Research Estimates; * Year end December , #CMP as on 6th October 2017
Domestic Pharma Market – impacted by GST transition
The domestic pharma market is expected to grow ~11% in FY18, driven by a strong demand for drugs in the lifestyle segment, 2.9% increase in the prices of NLEM products, new products and line extension launches. The domestic pharma market has grown at 10.0% during TTM from September’16 to August’17. The growth rate came down to single digit to 8.6% in July and 7.3% in August’17 due to GST impact. However, there is no major change in drug prices under GST. We expect re-stocking by trade from Seprember’17 onwards. This would lead to higher revenues by the pharma companies from Q3FY18 onwards. Moreover, some manufacturing facilities have been cleared by US FDA. We expect supplies to US to commence from these facilities.
As per AIOCD AWCS MAT August’17 data, the domestic pharma market was placed at Rs1,139bn and grew at 7.3%. The domestic market crossed the Rs1,000bn mark in June’16 and has grown over Rs1,000bn for the last fifteen months. Over the next three years, the domestic pharma market is likely to grow at 11-14% due to the sharp growth in lifestyle segments including CVS, CNS, anti-diabetic, anticancer and gastrointestinal.
The following table indicates month-wise and MAT (TTM) market size and growth rates:
Exhibit 64: Domestic Pharma Market Performance
MAT(TTM) ended Month TTM
Sales Rs bn Gr. Rate% Sales Rs bn Gr. Rate%
Sept'16 97.9 12.6 1,038 10.9
Oct'16 95.1 8.3 1,057 10.2
Nov'16 93.9 15.3 1,070 10.8
Dec'16 91.3 7.2 1,078 10.4
Jan'17 91.0 10.1 1,096 10.8
Feb'17 89.8 7.1 1,101 10.2
Mar'17 89.9 9.6 1,111 10.3
April'17 94.7 8.3 1,119 10.5
May'17 94.0 7.2 1,129 10.4
June'17 94.6 7.5 1,137 10.1
July'17 92.8 (2.4) 1,134 8.6
August'17 103.2 2.4 1,139 7.3
Average 94.0 7.8 1,101 10.0
Source: AIOCD AWACS data

37 Q2FY18 Results Preview
Coverage Companies revenue expected to decline by 3% YoY
For Q2FY18, we expect a lacklustre performance from the pharma companies under our coverage. The fourteen pharma companies under our coverage are expected to post a 3% YoY decline in revenues, 18% YoY decline in EBIDTA and 25% YoY decline in net profit. This is due to the higher base in Q2FY17 (180-day exclusivity for generic Glumetza and generic Gleevac) and de-stocking impact by the trade in July’17. We expect margins for these companies to decline 410bps YoY to 21.8% from 25.9%. The lower global growth is also attributed to currency fluctuations in emerging markets, regulatory issues, severe competition in the US, consolidation of retail chains leading to pricing pressures in the US, faster approvals by USFDA leading to increased competition from more players.
Despite the GST transition impact, the domestic pharma market is expected to report good growth of ~11% in FY18. We expect increase in working capital by the pharma companies as there is a delay in receving the input credit under GST. On the global front, ~35% ANDA approvals by US FDA are in favour of Indian pharma companies. We expect faster ANDA approvals by the US FDA in FY18, which would help companies to generate additional revenues in the US generic market.
Pharma companies under our coverage constitute ~34% of the domestic pharma market. The AIOCD AWACS Data for August’17 indicates that eight companies that have grown faster than the market were: Sun Pharma, Abbott Group, Lupin, Glaxo SmithKline Pharma, Sanofi India, FDC , Merck and Biocon. Overall, the growth of the companies under our coverage was 4.2% better than the market growth of 2.4%.
The table below presents sales and growth rates for July-August’17 for companies under our coverage.
Exhibit 65: Pharma Companies Under Coverage
Company (in Rs mn) July'17 August'17
Sales Gr. Rate% Sales Gr. Rate%
Pharma industry 92,795 (2.4) 1,03,167 2.4 Sun Pharma 7,767 (3.1) 8,710 4.0 Abbott Group 5,833 4.5 6,450 8.0 Cipla 4,099 (11.1) 4,634 (3.2) Lupin 3,056 2.0 3,431 8.9 Glaxo SK Pharma 2,764 (2.5) 3,189 8.6 Pfizer 2,181 (11.9) 2,462 (3.1) Sanofi India 2,130 (2.0) 2,267 4.8 Dr. Reddy's Labs 2,075 2.2 2,224 (0.8) FDC 814 (8.2) 913 3.8 Merck 580 5.6 594 8.3 Biocon 320 11.9 327 6.4 Total 31,619 (1.1) 35,201 4.2
Source: AIOCD AWACS MAT data
Margin Expected to decline by 410bps YoY We expect the margins of the 14 pharma companies under our universe to decline by 410bps YoY to 21.8% from 25.9% due to:
Higher base in Q2FY17 with 180-days exclusivity for generic Glumetza for Lupin and for generic Gleevec for Sun Pharma
Impact of channel consolidation in the US leading to pricing pressures
Increase in competition in the US due to faster approval of ANDAs by US FDA resulting in entry of new players
Impact of of GST implementation
Impact of price reduction by NPPA
Net Profit Likely to decline by 25%YoY
We expect the net profit of the pharma companies under our coverage to decline 25% YoY in Q2FY18 due to 3% YoY decline in revenues and 410bps decline in EBIDTA margin.
Top Picks
Aurobindo Pharma (APL), Abbott India (AIL), Sanofi India (SIL) and Lupin are our top picks in the pharma sector. We expect these companies to report superior results in the long-term. We expect positive surpises from Marksans Pharma (MPL) and SIL and negative surprises for Sun Pharma (SPIL).

38 Q2FY18 Results Preview
Global Pharma Market – Regulatory Challenges
Indian generic manufacturers cater to ~45% of the US’ generic demand by volume and are likely to benefit from the strong growth of generics in the US market. Indian pharma companies account for ~35% ANDA approvals by US FDA. The continuous introduction of generic products and specialty products in the US market is likely to drive growth. Alembic, Ajanta Pharma, Alkem Labs, Aurobindo, Cipla, Divis Labs, Dr. Reddy’s Labs (DRL), Glenmark Pharma, Ipca Labs, Granules India, Lupin, Marksans Pharma, Natco Pharma, Strides Arcolab, SPIL and Zydus Cadila are the pharma companies likely to benefit from the US’ generic market. However, some major pharma companies such as Divis Labs, DRL, SPIL, Wockhardt, Ipca Labs, Neuland Labs are facing regulatory issues with the US FDA. We expect these companies to resolve the pending 483s and invite US FDA for re-inspection during 2017. We expect some of these plants to get cleared by US FDA during 2017. The performance of these companies is likely to be impacted till their facilities are re-inspected and cleared by regulatory authorities.
Indian pharma companies have suffered due to the consolidation of distribution channels in the US to the extent of 8-9% of their revenues. The major companies have migrated to specialty and difficult to manufacture products for the US market to protect their margins. The faster ANDA approvals by US FDA has led to entry of new players in the US generic market leading to higher competition. In the emerging markets, Indian pharma companies have suffered due to currency fluctuations and lower purchasing power. Hence, the generic manufacturers suffer from pricing pressure, regulatory challenges and currency fluctuations.
Our TPs are based on March’19E EPS/ December’18E EPS for the companies under our coverage.
Abbott India (Rating – Buy; Target Price – Rs5,240)
We expect Abbott India’s (AIL) revenue to grow by 11% YoY and 13% QoQ to Rs8.10bn in Q2FY18 mainly due to good growth of its flagship brands Thyronorm, Duphaston, Duphalac, Cremaffin, Zolfresh, Cremaffin Plus, Ensure and Prothiaden. All these products have grown by over 15% in the domestic market. These brands are likely to be future growth drivers.
AIL’s EBIDTA margin is set to grow by 110bps YoY to 15.6% in Q2FY18 from 14.5% in Q2FY17 due the decline in the material cost. We expect the material cost to decline by 120bps to 57.7% from 58.9% of revenues. We expect personnel expenses to increase marginally by 10bps to 12.0% from 11.9% of revenues. Other expenses are likely to grow by 10bps YoY to 14.8% from 14.7% of revenues.
AIL’s net profit is likely to grow by 23% YoY to Rs920mn in Q2FY18 from Rs750mn in Q2FY17 led by higher revenues and margin improvement.
We expect the company to report superior performance in FY18, driven by its strong brands, new product launches and marketing thrust. AIL has launched several new products in FY17 and these are likely to drive future growth. AIL is among our top picks in the pharma sector.
Exhibit 66: Quarterly Estimates
Y/E Mar (Rsmn) Q2FY18E Q2FY17 YoY (%) Q1FY18 QoQ (%) FY18E
Net sales 8,100 7,294 11.1 7,147 13.3 33,807
EBIDTA 1,260 1,059 19.0 616 104.5 5,068
EBIDTA Margin (%) 15.6 14.5 8.6 15.0
Net profit 920 750 22.7 482 90.9 3,588
Net margin (%) 11.4 10.3 6.7 10.6
Source: Company, Centrum Research Estimates

39 Q2FY18 Results Preview
Aurobindo Pharma (Rating – Buy; Target Price – Rs970)
We expect Aurobindo Pharma’s (APL) revenues to grow by 5% YoY and 8% QoQ to Rs39.81bn in Q2FY18. Its high-margin formulation business (83% of revenues) should grow at 10.0% YoY at Rs33.05bn due to additional revenues from generic Renvela (sevelamer carbonate), where APL was the sole player during July-September’17. The low-margin API business (17% of revenues) is set to decline 12% YoY and grow at 8% on a QoQ basis to Rs6.75bn.
The company’s EBIDTA margin is expected to improve by 120bps YoY to 25.8% in Q2FY18 from 24.6% in Q2FY17, mainly due to high margin generic Renvela revenues in the US market. We expect margins to improve by 290bps QoQ. We expect material cost to decline 230bps to 39.7% from 42.0% due to the change in the product mix. We expect personnel expenses to increase by 100bps to 12.3% from 11.3% due to additional manpower and annual increments. Other expenses would grow by 10bps to 22.2% from 22.1%.
We expect APL’s net profit to grow by 11% YoY to Rs6.70bn in Q2FY18 from Rs6.06bn in Q2FY17, due to margin improvement and higher other income.
We expect the company to report impressive performance in the US market in FY18 due to its rich product pipeline and pending ANDAs with the US FDA. The acquired Actavis in Europe has been turned around and has become profitable. The acquired Natrol business in the US is well-integrated. The company does not have a pending 483 from the US FDA for its manufacturing facilities.
The company’s injectables business could show good growth in the US due to additional approvals expected in FY18. We expect the ARV and controlled substance businesses to report good performance. We expect the growth momentum to continue in FY18 as the company has plans to launch 19 new products in the US market.
APL is among our top pharma picks.
Exhibit 67: Quarterly Estimates Particulars (Rs mn) Q2FY18E Q2FY17 YoY (%) Q1FY18 QoQ (%) FY18E
Total income 39,815 37,755 5.5 36,788 8.2 1,72,090 EBIDTA 10,265 9,292 10.5 8,416 22.0 40,664 EBIDTA Margin (%) 25.8 24.6 22.9 23.6 Net profit 6,695 6,056 10.6 5,183 29.2 26,444 Net margin % 16.8 16.0
14.1
15.4
Source: Company, Centrum Research Estimates
Biocon (Rating – Hold; Target Price – Rs380)
We expect Biocon’s revenues to grow 14% YoY and grow by 17% QoQ to Rs10.89bn in Q2FY18. We expect the company’s small molecules business (38% of revenues) to grow by 5% YoY to Rs4.25bn due to severe competition for statins in the US and other markets. Its biologics business (19% of revenues) consisting of insulin & analogues and monoclonal antibodies (MABs) is likely to grow by 35%YoY at Rs2.10bn due to good growth of insulins in the emerging markets and additional supplies from Malaysia facility. Its domestic formulations (13% of revenues) to grow 10% YoY to Rs1.50bn due to GST implementation impact. We expect the CRAMS business (30% of revenues) consisting of Syngene and Clinigene to grow 12% YoY to Rs3.40bn from Rs3.03bn, with good growth from major MNC pharma companies.
The company’s EBIDTA margin is expected to grow by 210bps YoY to 27.3% in Q2FY18 from 25.2% in Q2FY17 due to the decline in material cost and other expenses. Biocon’s material cost is likely to decline by 160bps to 34.6% from 36.2% with enhanced capacity of insulin and good growth of research services. Personnel expenses are expected to grow by 220bps to 21.1% from 18.9% of revenues due to commencement of Malaysia facility. Other expenses are likely to decline by 270bps to 17.0% from 19.7%.
The company’s other income is expected to grow 51% YoY to Rs580mn in Q2FY18 from Rs384mn in Q2FY17.
Biocon’s net profit is likely to grow by 10% YoY to Rs1.61bn in Q2FY18 from Rs1.47bn in Q2FY17 due to good sales growth and margin improvement.
We expect the company to perform better in the future due to the recent approval of insulin glargine in Japan and the commencement of an insulin manufacturing facility in Malaysia. The Malaysian insulin facility is approved by EU.
Our target price is under review and would be relooked post the results. We see scope for revision in earnings which could lead to an increase in the target price.

40 Q2FY18 Results Preview
Exhibit 68: Quarterly Estimates
Particulars (Rs mn) Q2FY18E Q2FY17 YoY (%) Q1FY18 QoQ (%) FY18E
Total income 10,890 9541 14.1 9,337 16.6 47,844
EBIDTA 2,970 2400 23.8 1,921 54.6 12,748
EBIDTA Margin (%) 27.3 25.2 20.6 26.6
Net profit 1610 1467 9.7 813 98.0 8388
Net margin (%) 14.8 15.4 8.7 17.5
Source: Company, Centrum Research Estimates
Cipla (Rating – Buy; Target Price – 610)
We expect Cipla’s revenues to grow 4% YoY and grow by 11% QoQ to Rs38.96bn in Q2FY18 due to the after effects of GST implementation in the domestic market and pricing pressure in the US market. We expect Cipla’s domestic business (40% of revenues) to grow at 6% YoY to Rs15.50bn in Q2FY18 from Rs14.67bn in Q2FY17. The company’s N. America business (17% of revenues) is likely to decline by 2% YoY to Rs6.5bn due to pricing pressure. Cipla’s S.Africa business (14% of revenues) is expected to grow by 19% YoY to Rs5.44bn. The company’s emerging market business (20% of revenues) should decline by 6% YoY. Export of API (3% of revenues) is expected to grow by 5% YoY to Rs1.15bn from Rs1.10bn.
We expect Cipla’s EBIDTA margin to grow by 180bps YoY to 19.9% in Q2FY18 from 18.1% in Q2FY17. We expect its material cost to decline by 230bps YoY to 33.2% from 35.5% due to changes in its product mix. Personnel expenses are expected to increase by 20bps YoY to 18.2% from 18.0%. Other expenses are likely to grow by 30bps to 28.7% from 28.4% due to the increase in R&D expenses. Cipla’s tax rate is likely to grow to 31.1% from 16.2% of PBT.
The company’s net profit is expected to grow by 6% YoY in Q2FY18 to Rs3.76bn from Rs3.54bn in Q2FY17 due to lower sales growth and a higher tax rate.
Exhibit 69: Quarterly estimates
PARTICULARS (Rs mn) Q2FY18E Q2FY17 YoY Gr% Q1FY18 QoQ% FY18E
Total income 38,960 37510 3.9 35,250 10.5 1,63,929
EBIDTA 7,760 6,806 14.0 6,465 20.0 30,444
EBIDTA margin % 19.9 18.1
18.3
18.6
Net profit 3,760 3,541 6.2 4,249 (11.5) 16,327
Net margin % 9.7 9.4
12.1
10.0
Source: Company, Centrum Research Estimates
Dr. Reddy’s Labs (Rating – Hold; Target Price – Rs2,480)
We expect Dr. Reddy’s Labs (DRL) to report revenue growth of 4% YoY and growth of 13% QoQ to Rs37.73bn in Q2FY18 due to pricing pressure in the US and the absence of new launches as one of its facilities is under the USFDA scanner. Its global generic business (82% of revenues) is expected to grow 6% YoY and grow by 12% QoQ to Rs30.80bn due to strong growth in Europe and emerging markets. We expect DRL’s PSAI business (15% of revenues) to decline by 3% YoY and grow by 21% QoQ to Rs5.63bn.
We expect DRL’s EBIDTA margin to grow by 70bps YoY to 18.0% in Q2FY18 from 17.3% in Q2FY17. DRL’s material cost is likely to increase by 170bps to 25.7% YoY, personnel expenses are likely to decline by 30bps to 22.3%, selling expenses are likely to decline by 70bps to 9.1% due to due to lower sales growth. Other expenses are likely to decline by 140bps to 24.9% from 26.3% due to lower remedial measure expenses.
Net profit should grow by 7% YoY to Rs3.31bn in Q2FY18 due to margin improvement.
Exhibit 70: Quarterly Estimates
PARTICULARS (Rs mn) Q2FY18E Q2FY17 YoY Gr% Q1FY18 QoQ FY18E % Var.
Net sales 37,730 36,163 4.3 33,332 13.2 1,51,334 (75.1)
EBIDTA 6,780 6,270 8.1 3,232 109.8 28,124 (75.9)
EBIDTA margin % 18.0 17.3
9.7
18.6
Net profit 3,310 3,089 7.2 666 397.0 15,314 (78.4)
Net margin (%) 8.8 8.5
2.0
10.1
Source: Company, Centrum Research Estimates

41 Q2FY18 Results Preview
FDC (Rating – Buy; Target Price – Rs210)
We expect FDC to report a revenue growth of 4% YoY and a growth of 24% QoQ to Rs3.04bn in Q2FY18 due to the after effects of GST implementation.
The EBIDTA margin is set to decline by 450bps YoY to 24.0% from 28.5% on a higher base. FDC’s material cost is expected to grow by 90bps to 32.6% from 31.7% of revenues due to the change in product mix. Its other expenses are likely to increase by 230bps to 26.3% from 24.0% of revenues, due to the thrust on marketing. The company’s personnel expenses are likely to grow by 120bps to 17.1% from 15.9% due to the annual increments.
We expect FDC’s net profit to decline by 16% YoY to Rs566mn in Q2FY18 from Rs670mn in Q2FY17 due to margin decline. We expect FDC’s tax rate to increase to 28.0% from 25.5% of PBT.
Exhibit 71: Quarterly Estimates
PARTICULARS (Rs mn) Q2FY18E Q2FY17 YoY Gr% Q1FY18 QoQ Gr % FY18E
Total income 3,040 2,923 4.0 2,448 24.2 11,203
EBIDTA 730 833 (12.4) 355 105.6 2,487
EBIDTA Margin (%) 24.0 28.5
14.5
22.2
Net profit 566 670 (15.5) 292 93.8 1,879
Net margin (%) 18.6 22.9
11.9
16.8
Source: Company, Centrum Research Estimates
Glaxo SmithKline Pharma (Rating – Sell ; Target Price – Rs1,390)
We expect Glaxo SmithKline Pharma’s (GSK) revenues to decline 2% YoY and grow by 29% QoQ to Rs7.80bn in Q2FY18 due to after effects of GST implementation. GSK’s vaccine brands Varilrix and Synflorix are likely to report strong growth.
We expect EBIDTA margin to decline by 30bps YoY to 17.3% from 17.6% due to the increase in personnel cost and other expenses. We expect material cost to decline by 550bps to 39.7% from 45.2% due to a change in the product mix with higher sales of vaccines. We expect personnel cost to increase by 200bps YoY to 17.9% from 15.9% due to annual increments. Other expenses are expected to grow by 370bps to 25.0% from 21.3% due to thrust on marketing.
GSK’s net profit is set to decline by 4% YoY to Rs950mn in Q2FY18 from Rs987mn in Q2FY17.
We expect the future growth to be driven by vaccines including the acquired vaccine Rabipur from Novartis India. We have a Sell rating on the scrip due to its rich valuations.
Exhibit 72: Quarterly Estimates
Particulars (Rsmn) Q2FY18E Q2FY17 YoY (%) Q1FY18 QoQ (%) FY18E
Net sales 7,800 7,991 (2.4) 6,071 28.5 33,660
EBIDTA 1,350 1,408 (4.1) 197 585.3 5,346
EBIDTA Margin (%) 17.3 17.6
3.2
15.9
Net profit 950 987 (3.7) 139 583.5 3,643
Net margin (%) 12.2 12.4
2.3
10.8
Source: Company, Centrum Research Estimates

42 Q2FY18 Results Preview
Granules India (Rating – Buy; Target Price – Rs180)
We expect Granules India’s (GIL) revenues to grow by 10% YoY and 4% QoQ to Rs4.01bn in Q2FY18. The sales composition would be as follows: API 38%, PFI 21% and finished dosages 41%.
We expect the EBIDTA margin to improve by 80bps YoY to 21.2% in Q2FY18 from 20.4% in Q2FY17 due to the reduction in material cost with higher sales of finished dosages. We expect material cost to decline by 590bps to 45.6% from 51.5% due to the change in the product mix, with increased sales of high-margin formulations. We expect personnel cost to grow by 80bps to 10.1%. Other expenses are expected to grow by 440bps to 23.1% from 18.7% due to higher R & D and marketing costs.
GIL’s net profit is set to grow at 13% YoY to Rs460mn in Q2FY18 from Rs408mn in Q2FY17 due to margin improvement.
We expect GIL’s future growth to be driven by the approval of Ibuprofen tablets of strengths 400mg, 600mg and 800mg from the USFDA and marketing of Omeprazole and sodium bicarbonate OTC capsules in the US market and supply of anti HIV API Abacavir. We expect Omnichem JV to report better performance as the Vizag facility is approved by US FDA.
Exhibit 73: Quarterly Estimates
PARTICULARS (Rs mn) Q2FY18E Q2FY17 YoY Gr% Q1FY18 QoQ Gr % FY18E
Total income 4,010 3,638 10.2 3,860 3.9 17,339
EBIDTA 850 742 14.6 770 10.4 3,685
EBIDTA Margin (%) 21.2 20.4
19.9
21.3
Net profit 460 408 12.7 369 24.7 2,181
Net margin (%) 11.5 11.2 9.6 12.6
Source: Company, Centrum Research Estimates
Lupin (Rating – Buy; Target Price – Rs1,240)
We expect Lupin’s revenues to decline 4% YoY to Rs41.34bn in Q2FY18 and grow by 7%QoQ. Its domestic business (25% of its revenues) is expected to grow by 5% YoY to Rs10.50bn in Q2FY18 from Rs9.96bn in Q2FY17 due to after effects of GST implementation. We expect the US formulation businesses (41% of revenues) to decline by 16% YoY to Rs16.8bn from Rs19.98bn due to the increased competition in Glumetza and Fortamet generics in the US market and the absence of 180-days exclusivity of generic Glumetza in the US market. Lupin’s Asia Pacific formulations (15% of revenues) are expected to grow 12% YoY to Rs6.20bn.
We expect EBIDTA margin to decline by 120bps YoY to 22.8% in Q2FY18 from 24.0% in Q2FY17 due to an increase in material cost and personnel expenses. The company’s material cost is likely to grow by 190bps to 30.9% from 29.0% due to a change in its product mix with lower sales from N. America. Its personnel expenses are expected to grow by 120bps to 17.8% from 16.6% of revenues due to addition of Gavis’ employees. Other expenses are likely to decline by 200bps to 28.5% from 30.5%.
Lupin’s net profit would decline by 21% YoY to Rs5.27bn in Q2FY18 from Rs6.62bn in Q2FY17 due to the absence of 180-days exclusivity for generic Glumetza in the US. We expect Lupin to benefit from the acquisition of Gavis, US, FY18 onwards.
Lupin is among out top pick in the pharma sector.
Exhibit 74: Quarterly Estimates
PARTICULARS (Rs mn) Q2FY18E Q2FY17 YoY Gr% Q1FY18 QoQ Gr % FY18E
Total income 41,340 42,905 (3.6) 38,696 6.8 1,83,779
EBIDTA 9,420 10,280 (8.4) 7,684 22.6 41,417
EBIDTA Margin (%) 22.8 24.0
19.9
22.5
Net profit 5,265 6,622 (20.5) 3,581 47.0 22,022
Net margin (%) 12.7 15.4
9.3
12.0
Source: Company, Centrum Research Estimates

43 Q2FY18 Results Preview
Marksans Pharma (Rating – Buy; Target Price – Rs50)
We expect Marksans Pharma’s (MPL) revenue to grow by 30% YoY and grow by 6% QoQ to Rs2.35bn in Q2FY18 due to the clearance of its Goa facility by UK MHRA. MPL’s UK business (46% of revenues) is likely to grow by 77% YoY to Rs1,080mn from Rs612mn as the Goa facility is cleared by UK MHRA without any observations in Form 483. The company’s US business (40% of revenues) is expected to grow to Rs950mn due to integration of Time Cap Labs (TCL) during the year and commencement of supplies to Walgreen from Q1FY17.
The EBIDTA margin is likely to improve by 1,410bps YoY to 14.0% in Q2FY18 from (0.1)% in Q2FY17 due to commencement of supplies to Relonchem, UK. We expect material cost to decline by 480bps at 56.2% from 61.0%. Its personnel cost is expected to decline by 250bps to 17.0% from 19.5%. Other expenses are likely to decline by 680bps to 12.8% from 19.6% due to higher revenues from UK market. The company has recently launched Metrformin ER tablets in the US generic market.
MPL is set to report Rs160mn net profit in Q2FY18 against Rs4mn in Q2FY17.
Exhibit 75: Quarterly Estimates
PARTICULARS (Rs mn) Q2FY18E Q2FY17 YoY Gr% Q1FY18 QoQ Gr % FY18E
Total income 2,350 1,804 30.2 2,211 6.3 9,537
EBIDTA 330 (3) NA 290 13.8 1,257
EBIDTA Margin (%) 14.0 (0.1) 13.1 13.2
Net profit 160 4 3,900.0 137 16.8 633
Net margin (%) 6.8 0.2
6.2
6.6
Source: Company, Centrum Research Estimates
Merck (Rating – Hold; Target Price – Rs1,080)
For Q3CY17, we expect Merck to report revenue growth of 10% YoY and a growth of 12% QoQ to Rs2.97bn. Pharma sales (77% of revenues) are expected to grow by 11% YoY to Rs2.30bn. Chemical business (23% of revenues) is likely to grow by 10% YoY to Rs670mn from Rs610mn. The company is reducing its dependence on the low-margin chemicals business and concentrating on the high-margin pharma business. We expect the company’s flagship brands Livogen, Evion, Concor and Livogen Z to drive future growth.
The company’s EBIDTA margin should improve by 20bps YoY to 17.0% from 16.8% due to the decline in material cost. Merck’s material cost is likely to decline by 530bps YoY to 37.2% from 42.5% due to a change in the product mix with higher sales of its high margin formulation business. Its personnel cost is likely to be maintained at 14.8%. Other expenses could increase by 500bps YoY to 31.0% from 26.0% due to a thrust on marketing.
Merck’s net profit is set to grow 24% YoY to Rs340mn in Q3CY17 from Rs275mn in Q3CY16 due to margin improvement and lower tax rate. We expect tax rate to decline to 33.3% from 36.0% of PBT.
Exhibit 76: Quarterly Estimates
Particulars (Rs mn) Q3CY17E Q3CY16 YoY% Q2CY17 QoQ% CY17E
Net sales 2,970 2,689 10.4 2,656 11.8 11,317
EBIDTA 505 451 12.0 277 82.3 1,528
EBIDTA Margin (%) 17.0 16.8 10.4 13.5
Net Profit 340 275 23.6 202 68.3 985
Net margin (%) 11.4 10.2
7.6
8.7
Source: Company, Centrum Research Estimates
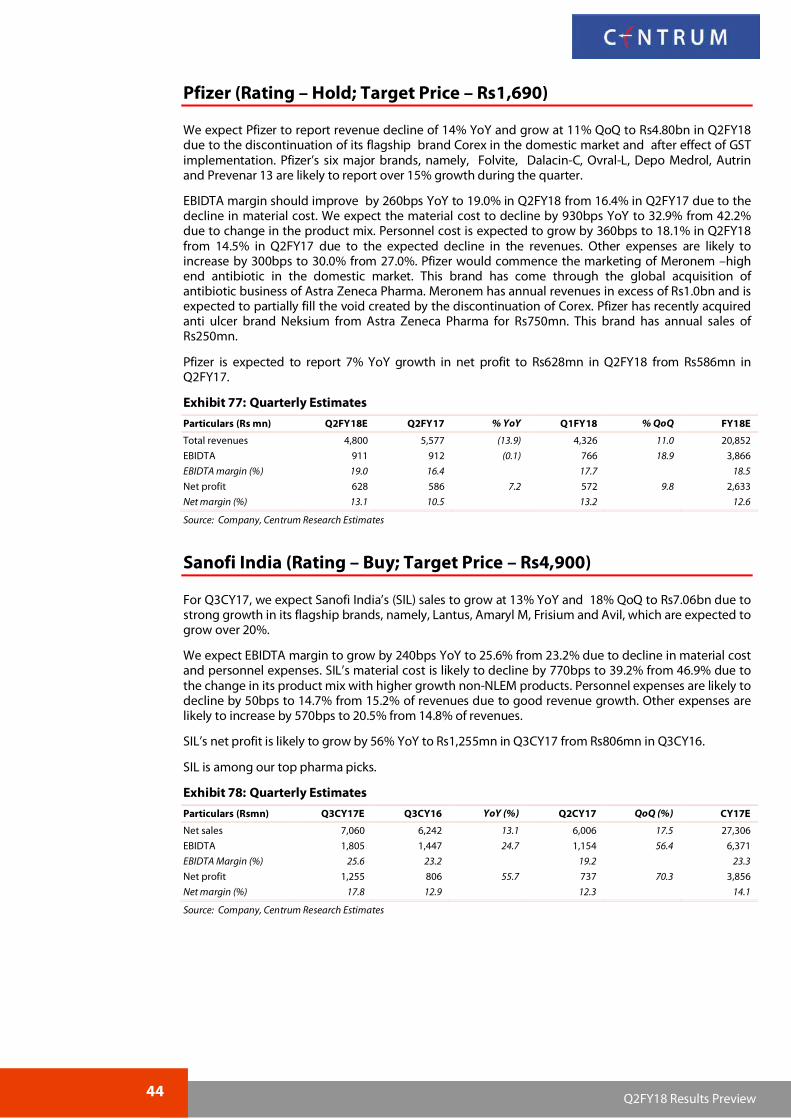
44 Q2FY18 Results Preview
Pfizer (Rating – Hold; Target Price – Rs1,690)
We expect Pfizer to report revenue decline of 14% YoY and grow at 11% QoQ to Rs4.80bn in Q2FY18 due to the discontinuation of its flagship brand Corex in the domestic market and after effect of GST implementation. Pfizer’s six major brands, namely, Folvite, Dalacin-C, Ovral-L, Depo Medrol, Autrin and Prevenar 13 are likely to report over 15% growth during the quarter.
EBIDTA margin should improve by 260bps YoY to 19.0% in Q2FY18 from 16.4% in Q2FY17 due to the decline in material cost. We expect the material cost to decline by 930bps YoY to 32.9% from 42.2% due to change in the product mix. Personnel cost is expected to grow by 360bps to 18.1% in Q2FY18 from 14.5% in Q2FY17 due to the expected decline in the revenues. Other expenses are likely to increase by 300bps to 30.0% from 27.0%. Pfizer would commence the marketing of Meronem –high end antibiotic in the domestic market. This brand has come through the global acquisition of antibiotic business of Astra Zeneca Pharma. Meronem has annual revenues in excess of Rs1.0bn and is expected to partially fill the void created by the discontinuation of Corex. Pfizer has recently acquired anti ulcer brand Neksium from Astra Zeneca Pharma for Rs750mn. This brand has annual sales of Rs250mn.
Pfizer is expected to report 7% YoY growth in net profit to Rs628mn in Q2FY18 from Rs586mn in Q2FY17.
Exhibit 77: Quarterly Estimates
Particulars (Rs mn) Q2FY18E Q2FY17 % YoY Q1FY18 % QoQ FY18E
Total revenues 4,800 5,577 (13.9) 4,326 11.0 20,852
EBIDTA 911 912 (0.1) 766 18.9 3,866
EBIDTA margin (%) 19.0 16.4
17.7
18.5
Net profit 628 586 7.2 572 9.8 2,633
Net margin (%) 13.1 10.5
13.2
12.6
Source: Company, Centrum Research Estimates
Sanofi India (Rating – Buy; Target Price – Rs4,900)
For Q3CY17, we expect Sanofi India’s (SIL) sales to grow at 13% YoY and 18% QoQ to Rs7.06bn due to strong growth in its flagship brands, namely, Lantus, Amaryl M, Frisium and Avil, which are expected to grow over 20%.
We expect EBIDTA margin to grow by 240bps YoY to 25.6% from 23.2% due to decline in material cost and personnel expenses. SIL’s material cost is likely to decline by 770bps to 39.2% from 46.9% due to the change in its product mix with higher growth non-NLEM products. Personnel expenses are likely to decline by 50bps to 14.7% from 15.2% of revenues due to good revenue growth. Other expenses are likely to increase by 570bps to 20.5% from 14.8% of revenues.
SIL’s net profit is likely to grow by 56% YoY to Rs1,255mn in Q3CY17 from Rs806mn in Q3CY16.
SIL is among our top pharma picks.
Exhibit 78: Quarterly Estimates
Particulars (Rsmn) Q3CY17E Q3CY16 YoY (%) Q2CY17 QoQ (%) CY17E
Net sales 7,060 6,242 13.1 6,006 17.5 27,306
EBIDTA 1,805 1,447 24.7 1,154 56.4 6,371
EBIDTA Margin (%) 25.6 23.2
19.2
23.3
Net profit 1,255 806 55.7 737 70.3 3,856
Net margin (%) 17.8 12.9 12.3 14.1
Source: Company, Centrum Research Estimates

45 Q2FY18 Results Preview
Sun Pharma (Rating – Hold; Target Price – Rs490)
We expect Sun Pharma Industries (SPIL) to report 19% YoY decline in revenues and a growth of 8% QoQ to Rs67.09bn. We expect the domestic business (30% of revenues) to decline by 1% YoY to Rs19.90bn from Rs20.09bn due to after effects of GST implementation. Its US formulation business (36% of revenues) is likely to decline by 35%YoY to Rs24.3bn from Rs37.14bn due to expected lower growth of Taro, pricing pressure in the US market and consolidation of distributors in the US and absence of 180-days exclusivity for generic Gleevec. Emerging markets (17% of revenues) are expected to grow by 3% YoY to Rs11.60bn in Q2FY18 from Rs11.26bn in Q2FY17. RoW formulations (11% of revenues) are likely to grow by 36%YoY to Rs7.20bn from Rs5.28bn due to strong demand in these markets.
SPIL’s EBIDTA margin is likely to decline by 1,590bps YoY to 22.5% in Q2FY18 from 38.4% in Q2FY17 due to the absence of 180-days exclusivity for generic Gleevec, pricing pressure in the US and currency fluctuations in the emerging markets. We expect material cost to increase by 320bps to 25.5% from 22.3% due to the change in the product mix and pricing pressure in the US generic market. Personnel cost is likely to increase by 550bps to 20.0% from 14.5% of revenues due to lower sales growth. We expect other expenses to grow by 720bps to 32.0% from 24.8% due to increase in R & D expenditure.
SPIL’s net profit is likely to dip 56% YoY to Rs9.77bn in Q2FY18 from Rs22.35bn in Q2FY17 due to lower revenue growth and sharp decline in margins.
Exhibit 79: Quarterly estimates
PARTICULARS (Rs mn) Q2FY18E Q2FY17 YoY% Q1FY18 QoQ% FY18E
Net sales 67,090 82,503 (18.7) 62,088 8.1 3,08,395
EBIDTA 15,090 31,677 (52.4) 10,956 37.7 69,489
EBIDTA Margin (%) 22.5 38.4
17.6
22.5
Net Profit 9,770 22,352 (56.3) 6,279 55.6 43,108
Net margin (%) 14.6 27.1
10.1
14.0
Source: Company, Centrum Research Estimates

Exhibit 80: Quarterly Estimates Summary
Y/E Mar (Rs mn) Net Sales (Rs mn) EBITDA (Rs mn) EBITDA Margin (%) PAT (Rs mn)
Q2FY18E YoY(%) QoQ(%) Q2FY18E YoY(%) QoQ(%) Q2FY18E Q2FY17 Q1FY18 Q2FY18E YoY(%) QoQ(%)
Mayur Uniquoters 1,382 13.9 (1.9) 373 16.4 (8.1) 27.0 26.4 28.8 231 16.4 (10.1)
FIEM Industries 3,174 8.8 9.2 368 2.2 19.6 11.6 12.4 10.6 147 4.6 42.4
Swaraj Engines 2,325 30.0 19.9 386 32.3 19.6 16.6 16.3 16.6 265 37.5 23.1
Source: Company, Centrum Research Estimate
Exhibit 81: Estimates Summary – Auto Ancillary Companies
Company Rating
CMP* (Rs)
TP (Rs) EPS Rs P/E (x) EV/EBIDTA (x) P/BV(x)
FY17 FY18E FY19E FY17 FY18E FY19E FY17 FY18E FY19E FY17 FY18E FY19E
Mayur Uniquoters Buy 381 435 17.5 19.6 22.8 21.6 19.5 16.8 12.4 11.2 9.7 4.4 3.8 3.2
FIEM Industries Buy 903 1,260 25.0 44.9 66.0 30.3 20.1 13.7 12.7 9.3 7.0 3.2 2.5 2.2
Swaraj Engines Hold 2,021 2,169 55.4 74.2 90.9 22.5 27.2 22.2 12.6 16.8 13.9 5.5 8.6 8.1
Source: Company, Centrum Research Estimates, * as on 6 October 2017
INDIA
Miscellaneous 9 October 2017
Centrum Equity Research is available on Bloomberg, Thomson Reuters and FactSet

47 Q2FY18 Results Preview
Mayur Uniquoters (Rating: BUY; Target Price: Rs435)
Exhibit 82: Quarterly Estimates
Mayur Uniquoters (Rs mn) Q2FY18E Q2FY17 Q1FY18 YoY (%) QoQ (%)
Net sales 1,382 1,214 1,408 13.9 (1.9)
EBITDA 373 320 405 16.4 (8.1)
EBITDA (%) 27.0 26.4 28.8 58 bps (183) bps
PAT 231 198 257 16.4 (10.1)
Source: Company, Centrum Research Estimates
We expect Mayur’s revenues to increase 13.9% YoY/ (1.9%) QoQ to Rs1,382mn, on the back of decent recovery in volumes during the quarter as post implementation of GST the company has been seeing increase in demand. Mayur is expected to be one of the biggest beneficiaries of GST implementation in the long run.
Further, recovery is expected in the footwear volumes as a result of the ongoing festive season. The management had highlighted in the last conference call that the utilization levels were gradually inching up post GST implementation.
We expect the company to report EBITDA margins of 27% (up 58bps YoY and down 183bps QoQ). During 1QFY18, Mayur had reported strong margin level, around 29%. In our view gradually it will stabilize in the range of 26%-27%.
PAT is expected to improve by a good 16.4% YoY to Rs231mn in Q2FY18E.
FIEM Industries (Rating: BUY; Target Price: Rs1,260)
Exhibit 83: Quarterly Estimates
FIEM Industries (Rs mn) Q2FY18E Q2FY17 Q1FY18 YoY (%) QoQ (%)
Net sales 3,174 2,918 2,907 8.8 9.2
EBITDA 368 360 308 2.2 19.6
EBITDA (%) 11.6 12.4 10.6 (74) bps 101 bps
PAT 147 141 103 4.6 42.4
Source: Company, Centrum Research Estimates
We expect FIEM’s revenue to increase 8.8% YoY/ 9.2% QoQ to Rs3,174mn, on the back of good sales volumes posted by key automotive clients such as Honda 2Ws and TVS Motors during the quarter and a de-growth in the LED segment.
The second quarter witnessed a very strong uptick in sales volumes for its clients, however HMSI saw a slower growth in the month of September, which brought down the blended overall sales volume growth during Q2FY18 to 16%.
We expect the company to report EBITDA margins of 11.6% (down 74bps YoY and up 101bps QoQ) impacted by a decline in the LED business. We expect losses in the LED business to be curtailed on QoQ basis, leading to a sequential improvement in margins.
Subsequently PAT is expected to deliver a small growth of 4.6% YoY to Rs147mn in Q2FY18E.

48 Q2FY18 Results Preview
Swaraj Engines (Rating: HOLD; Target Price: Rs2,169)
Exhibit 84: Quarterly Estimates
Swaraj Engines (Rs mn) Q2FY18E Q2FY17 Q1FY18 YoY (%) QoQ (%)
Net sales 2,325 1,789 1,940 30.0 19.9
EBITDA 386 292 323 32.3 19.6
EBITDA (%) 16.6 16.3 16.6 30 bps (4) bps
PAT 265 193 215 37.5 23.1
Source: Company, Centrum Research Estimates
We expect Swaraj Engines’ revenue to increase 30% YoY/ 19.9% QoQ to Rs2,325mn, on the back of strong Swaraj tractors’ domestic sales expected during the quarter, as M&M posted a strong growth of 35.3% in domestic tractor market during Q2FY18. Swaraj Engines is expected to register overall engine sales of 28,953 units, a YoY growth of 29.3%.
We expect the company to report EBITDA margins of 16.6% (up 30bps YoY and down 4bps QoQ). The company had witnessed its highest margin of 16.6% during Q1FY18 in the past six years. With expected strong sales growth, we expect the company will be able to maintain its strong margin profile.
On the back of strong sales and continued high margin performance, PAT is expected to grow by 37.5% YoY to Rs265mn in Q2FY18E.
Awanish Chandra Vikas Rajpal [email protected], +91 22 4215 9815 [email protected], +91 22 4215 9771 (Dir)

49
Q1FY28 Results Preview
Appendix A
Disclaimer
Centrum Broking Limited (“Centrum”) is a full-service, Stock Broking Company and a member of The Stock Exchange, Mumbai (BSE) and National Stock Exchange of India Ltd. (NSE). Our holding company, Centrum Capital Ltd, is an investment banker and an underwriter of securities. As a group Centrum has Investment Banking, Advisory and other business relationships with a significant percentage of the companies covered by our Research Group. Our research professionals provide important inputs into the Group's Investment Banking and other business selection processes.
Recipients of this report should assume that our Group is seeking or may seek or will seek Investment Banking, advisory, project finance or other businesses and may receive commission, brokerage, fees or other compensation from the company or companies that are the subject of this material/report. Our Company and Group companies and their officers, directors and employees, including the analysts and others involved in the preparation or issuance of this material and their dependants, may on the date of this report or from, time to time have "long" or "short" positions in, act as principal in, and buy or sell the securities or derivatives thereof of companies mentioned herein. Centrum or its affiliates do not own 1% or more in the equity of this company Our sales people, dealers, traders and other professionals may provide oral or written market commentary or trading strategies to our clients that reflect opinions that are contrary to the opinions expressed herein, and our proprietary trading and investing businesses may make investment decisions that are inconsistent with the recommendations expressed herein. We may have earlier issued or may issue in future reports on the companies covered herein with recommendations/ information inconsistent or different those made in this report. In reviewing this document, you should be aware that any or all of the foregoing, among other things, may give rise to or potential conflicts of interest. We and our Group may rely on information barriers, such as "Chinese Walls" to control the flow of information contained in one or more areas within us, or other areas, units, groups or affiliates of Centrum. Centrum or its affiliates do not make a market in the security of the company for which this report or any report was written. Further, Centrum or its affiliates did not make a market in the subject company’s securities at the time that the research report was published.
This report is for information purposes only and this document/material should not be construed as an offer to sell or the solicitation of an offer to buy, purchase or subscribe to any securities, and neither this document nor anything contained herein shall form the basis of or be relied upon in connection with any contract or commitment whatsoever. This document does not solicit any action based on the material contained herein. It is for the general information of the clients of Centrum. Though disseminated to clients simultaneously, not all clients may receive this report at the same time. Centrum will not treat recipients as clients by virtue of their receiving this report. It does not constitute a personal recommendation or take into account the particular investment objectives, financial situations, or needs of individual clients. Similarly, this document does not have regard to the specific investment objectives, financial situation/circumstances and the particular needs of any specific person who may receive this document. The securities discussed in this report may not be suitable for all investors. The securities described herein may not be eligible for sale in all jurisdictions or to all categories of investors. The countries in which the companies mentioned in this report are organized may have restrictions on investments, voting rights or dealings in securities by nationals of other countries. The appropriateness of a particular investment or strategy will depend on an investor's individual circumstances and objectives. Persons who may receive this document should consider and independently evaluate whether it is suitable for his/ her/their particular circumstances and, if necessary, seek professional/financial advice. Any such person shall be responsible for conducting his/her/their own investigation and analysis of the information contained or referred to in this document and of evaluating the merits and risks involved in the securities forming the subject matter of this document.
The projections and forecasts described in this report were based upon a number of estimates and assumptions and are inherently subject to significant uncertainties and contingencies. Projections and forecasts are necessarily speculative in nature, and it can be expected that one or more of the estimates on which the projections and forecasts were based will not materialize or will vary significantly from actual results, and such variances will likely increase over time. All projections and forecasts described in this report have been prepared solely by the authors of this report independently of the Company. These projections and forecasts were not prepared with a view toward compliance with published guidelines or generally accented accounting principles. No independent accountants have expressed an opinion or any other form of assurance on these projections or forecasts. You should not regard the inclusion of the projections and forecasts described herein as a representation or warranty by or on behalf of the Company, Centrum, the authors of this report or any other person that these projections or forecasts or their underlying assumptions will be achieved. For these reasons, you should only consider the projections and forecasts described in this report after carefully evaluating all of the information in this report, including the assumptions underlying such projections and forecasts.
The price and value of the investments referred to in this document/material and the income from them may go down as well as up, and investors may realize losses on any investments. Past performance is not a guide for future performance. Future returns are not guaranteed and a loss of original capital may occur. Actual results may differ materially from those set forth in projections. Forward-looking statements are not predictions and may be subject to change without notice. Centrum does not provide tax advice to its clients, and all investors are strongly advised to consult regarding any potential investment. Centrum and its affiliates accept no liabilities for any loss or damage of any kind arising out of the use of this report. Foreign currencies denominated securities are subject to fluctuations in exchange rates that could have an adverse effect on the value or price of or income derived from the investment. In addition, investors in securities such as ADRs, the value of which are influenced by foreign currencies effectively assume currency risk. Certain transactions including those involving futures, options, and other derivatives as well as non-investment-grade securities give rise to substantial risk and are not suitable for all investors. Please ensure that you have read and understood the current risk disclosure documents before entering into any derivative transactions.
This report/document has been prepared by Centrum, based upon information available to the public and sources, believed to be reliable. No representation or warranty, express or implied is made that it is accurate or complete. Centrum has reviewed the report and, in so far as it includes current or historical information, it is believed to be reliable, although its accuracy and completeness cannot be guaranteed. The opinions expressed in this document/material are subject to change without notice and have no obligation to tell you when opinions or information in this report change.
This report or recommendations or information contained herein do/does not constitute or purport to constitute investment advice in publicly accessible media and should not be reproduced, transmitted or published by the recipient. The report is for the use and consumption of the recipient only. This publication may not be distributed to the public used by the public media without the express written consent of Centrum. This report or any portion hereof may not be printed, sold or distributed without the written consent of Centrum.
The distribution of this document in other jurisdictions may be restricted by law, and persons into whose possession this document comes should inform themselves about, and observe, any such restrictions. Neither Centrum nor its directors, employees, agents or representatives shall be liable for any damages whether direct or indirect, incidental, special or consequential including lost revenue or lost profits that may arise from or in connection with the use of the information.
This document does not constitute an offer or invitation to subscribe for or purchase or deal in any securities and neither this document nor anything contained herein shall form the basis of any contract or commitment whatsoever. This document is strictly confidential and is being furnished to you solely for your information, may not be distributed to the press or other media and may not be reproduced or redistributed to any other person. The distribution of this report in other jurisdictions may be restricted by law and persons into whose possession this report comes should inform themselves about, and observe any such restrictions. By accepting this report, you agree to be bound by the fore going limitations. No representation is made that this report is accurate or complete.

50
Q1FY28 Results Preview
The opinions and projections expressed herein are entirely those of the author and are given as part of the normal research activity of Centrum Broking and are given as of this date and are subject to change without notice. Any opinion estimate or projection herein constitutes a view as of the date of this report and there can be no assurance that future results or events will be consistent with any such opinions, estimate or projection.
This document has not been prepared by or in conjunction with or on behalf of or at the instigation of, or by arrangement with the company or any of its directors or any other person. Information in this document must not be relied upon as having been authorized or approved by the company or its directors or any other person. Any opinions and projections contained herein are entirely those of the authors. None of the company or its directors or any other person accepts any liability whatsoever for any loss arising from any use of this document or its contents or otherwise arising in connection therewith.
Centrum and its affiliates have not managed or co-managed a public offering for the subject company in the preceding twelve months. Centrum and affiliates have not received compensation from the companies mentioned in the report during the period preceding twelve months from the date of this report for service in respect of public offerings, corporate finance, debt restructuring, investment banking or other advisory services in a merger/acquisition or some other sort of specific transaction.
As per the declarations given by research analyst and and/or any of their family members do not serve as an officer, director or any way connected to the company/companies mentioned in this report. Further, as declared by them, they have not received any compensation from the above companies in the preceding twelve months. They does not hold any shares by them or through their relatives or in case if holds the shares then will not to do any transactions in the said scrip for 30 days from the date of release such report. Our entire research professionals are our employees and are paid a salary. They do not have any other material conflict of interest of the research analyst or member of which the research analyst knows of has reason to know at the time of publication of the research report or at the time of the public appearance.
While we would endeavour to update the information herein on a reasonable basis, Centrum, its associated companies, their directors and employees are under no obligation to update or keep the information current. Also, there may be regulatory, compliance or other reasons that may prevent Centrum from doing so.
Non-rated securities indicate that rating on a particular security has been suspended temporarily and such suspension is in compliance with applicable regulations and/or Centrum policies, in circumstances where Centrum is acting in an advisory capacity to this company, or any certain other circumstances.
This report is not directed to, or intended for distribution to or use by, any person or entity who is a citizen or resident of or located in any locality, state, country or other jurisdiction where such distribution, publication, availability or use would be contrary to law or regulation or which would subject Centrum Broking Limited or its group companies to any registration or licensing requirement within such jurisdiction. Specifically, this document does not constitute an offer to or solicitation to any U.S. person for the purchase or sale of any financial instrument or as an official confirmation of any transaction to any U.S. person unless otherwise stated, this message should not be construed as official confirmation of any transaction. No part of this document may be distributed in Canada or used by private customers in United Kingdom.
The information contained herein is not intended for publication or distribution or circulation in any manner whatsoever and any unauthorized reading, dissemination, distribution or copying of this communication is prohibited unless otherwise expressly authorized. Please ensure that you have read “Risk Disclosure Document for Capital Market and Derivatives Segments” as prescribed by Securities and Exchange Board of India before investing in Indian Securities Market.
ACC price chart Ambuja Cements price chart JK Cements price chart
JK Lakshmi price chart Visaka Industries price chart Orient Cement price chart
Ramco Cements price chart Shree Cement price chart Deccan Cement price chart
900
1100
1300
1500
1700
1900
Oct-14 Apr-15 Oct-15 Apr-16 Oct-16 Apr-17 Oct-17
ACC Ltd
100
150
200
250
300
Oct-14 Apr-15 Oct-15 Apr-16 Oct-16 Apr-17 Oct-17
Ambuja Cements Ltd
0
200
400
600
800
1000
1200
Oct-14 Apr-15 Oct-15 Apr-16 Oct-16 Apr-17 Oct-17
JK Cement Ltd
0
100
200
300
400
500
600
Oct-14 Apr-15 Oct-15 Apr-16 Oct-16 Apr-17 Oct-17
JK Lakshmi Cement Ltd
50
250
450
650
850
Oct-14 Apr-15 Oct-15 Apr-16 Oct-16 Apr-17 Oct-17
Visaka Industries Ltd
100
150
200
250
Oct-14 Apr-15 Oct-15 Apr-16 Oct-16 Apr-17 Oct-17
Orient Cement
50
150
250
350
450
550
650
750
850
Oct-14 Apr-15 Oct-15 Apr-16 Oct-16 Apr-17 Oct-17
Ramco Cements Ltd/The
0
5000
10000
15000
20000
25000
Oct-14 Apr-15 Oct-15 Apr-16 Oct-16 Apr-17 Oct-17
Shree Cement Ltd
0
200
400
600
800
Oct-14 Apr-15 Oct-15 Apr-16 Oct-16 Apr-17 Oct-17
Deccan Cements Ltd

51
Q1FY28 Results Preview
Axis Bank price chart ICICI Bank price chart City Union Bank price chart
DCB Bank price chart Karnataka Bank price chart M & M Financial Services price chart
State Bank of India price chart GIC Housing price chart CARE price chart
Sundaram Finance price chart Ujjivan Financial Services price chart Crisil price chart
DB Corp price chart Dish TV price chart ENIL price chart
0
100
200
300
400
500
600
700
Oct-14 Apr-15 Oct-15 Apr-16 Oct-16 Apr-17 Oct-17
AXIS BANK LTD
140
190
240
290
340
390
Oct-14 Apr-15 Oct-15 Apr-16 Oct-16 Apr-17 Oct-17
ICICI BANK LTD
0
50
100
150
200
Oct-14 Apr-15 Oct-15 Apr-16 Oct-16 Apr-17 Oct-17
CITY UNION BANK LTD
0
50
100
150
200
250
Oct-14 Apr-15 Oct-15 Apr-16 Oct-16 Apr-17 Oct-17
DCB BANK LTD
70
90
110
130
150
170
190
May
-16
Jun-
16
Jul-1
6
Aug
-16
Sep-
16
Oct
-16
Nov
-16
Dec
-16
Jan-
17
Feb
-17
Mar
-17
Apr
-17
May
-17
Jun-
17
Jul-1
7
Aug
-17
Sep-
17
Karnataka Bank
150
200
250
300
350
400
450
500
Oct-14 Apr-15 Oct-15 Apr-16 Oct-16 Apr-17 Oct-17
MAHINDRA & MAHINDRA FIN SECS
100
150
200
250
300
350
Oct-14 Apr-15 Oct-15 Apr-16 Oct-16 Apr-17 Oct-17
STATE BANK OF INDIA
50100150200250300350400450500550600650
Oct-14 Apr-15 Oct-15 Apr-16 Oct-16 Apr-17 Oct-17
GIC HOUSING FINANCE LTD
300500700900
11001300150017001900
Aug
-15
Oct
-15
Dec
-15
Feb
-16
May
-16
Jul-1
6
Sep-
16
Nov
-16
Jan-
17
Mar
-17
May
-17
Jul-1
7
Sep-
17
CARE
1000
1200
1400
1600
1800
Oct-14 Apr-15 Oct-15 Apr-16 Oct-16 Apr-17 Oct-17
SUNDARAM FINANCE LTD
50
150
250
350
450
550
May
-16
Jun-
16
Jul-1
6
Aug
-16
Sep-
16
Oct
-16
Nov
-16
Dec
-16
Jan-
17
Feb
-17
Mar
-17
Apr
-17
May
-17
Jun-
17
Jul-1
7
Aug
-17
Sep-
17
Ujjivan Financial Services
1500
1700
1900
2100
2300
2500
Oct-14 Apr-15 Oct-15 Apr-16 Oct-16 Apr-17 Oct-17
CRISIL LTD
250
300
350
400
450
Oct-14 Apr-15 Oct-15 Apr-16 Oct-16 Apr-17 Oct-17
DB Corp
0
50
100
150
Oct-14 Apr-15 Oct-15 Apr-16 Oct-16 Apr-17 Oct-17
Dish TV
100
300
500
700
900
1100
Oct-14 Apr-15 Oct-15 Apr-16 Oct-16 Apr-17 Oct-17
ENIL
Star Cement price chart UltraTech Cement price chart
100
110
120
130
140
Jun-17 Jul-17 Jul-17 Aug-17 Sep-17 Oct-17
Star Cement Ltd
1100
2100
3100
4100
5100
Oct-14 Apr-15 Oct-15 Apr-16 Oct-16 Apr-17 Oct-17
UltraTech Cement Ltd

52
Q1FY28 Results Preview
HT Media price chart Info Edge price chart Jagran Prakashan price chart
IFB Industries price chart Sun TV Network price chart Zee Entertainment price chart
La Opala price chart Mirza International price chart Speciality Rest chart
Sarla Performance
Source: Bloomberg, Centrum Research
60708090
100110120130140150
Oct-14 Apr-15 Oct-15 Apr-16 Oct-16 Apr-17 Oct-17
HT Media
600700800900
1000110012001300
Oct
-14
Jan-
15
Apr
-15
Jul-1
5
Oct
-15
Dec
-15
Mar
-16
Jun-
16
Sep-
16
Dec
-16
Mar
-17
Jun-
17
Sep-
17
Info Edge
50
100
150
200
250
Oct-14 Apr-15 Oct-15 Apr-16 Oct-16 Apr-17 Oct-17
Jagran Prakashan
0
200
400
600
800
1000
Oct-14 Apr-15 Oct-15 Apr-16 Oct-16 Apr-17 Oct-17
IFB Industries Ltd
250
450
650
850
1050
Oct-14 Apr-15 Oct-15 Apr-16 Oct-16 Apr-17 Oct-17
Sun TV Network
150200250300350400450500550600650
Oct-14 Apr-15 Oct-15 Apr-16 Oct-16 Apr-17 Oct-17
Zee Entertainment
0
200
400
600
800
Oct-14 Apr-15 Oct-15 Apr-16 Oct-16 Apr-17 Oct-17
La Opala
0
50
100
150
200
Oct-14 Apr-15 Oct-15 Apr-16 Oct-16 Apr-17 Oct-17
Mirza Internatio
50
100
150
200
250
Oct-14 Apr-15 Oct-15 Apr-16 Oct-16 Apr-17 Oct-17
Speciality Restaurants Ltd
0
20
40
60
80
100
Oct-14 Apr-15 Oct-15 Apr-16 Oct-16 Apr-17 Oct-17
Sarla Performance
Tata Steel price chart Hindustan Zinc price chart JSW Steel India price chart
Graphite India Vedanta price chart IFGL Refractories price chart
0
200
400
600
800
Oct-14 Apr-15 Oct-15 Apr-16 Oct-16 Apr-17 Oct-17
TATA IN EQUITY
50
100
150
200
250
300
350
Oct-14 Apr-15 Oct-15 Apr-16 Oct-16 Apr-17 Oct-17
HZ IN EQUITY
0
50
100
150
200
250
300
Oct-14 Apr-15 Oct-15 Apr-16 Oct-16 Apr-17 Oct-17
JSTL IN EQUITY
0
100
200
300
400
500
600
Oct-14 Apr-15 Oct-15 Apr-16 Oct-16 Apr-17 Oct-17
GRIL IN EQUITY
0
100
200
300
400
Oct-14 Apr-15 Oct-15 Apr-16 Oct-16 Apr-17 Oct-17
VEDL IN EQUITY
0
100
200
300
400
Oct-14 Apr-15 Oct-15 Apr-16 Oct-16 Apr-17 Oct-17
IFGL IN EQUITY

53
Q1FY28 Results Preview
Hindalco price chart Vesuvius India price chart Orient Refractories price chart
Tata Sponge price chart Ratnamani Metals price chart OCCL price chart
Tata Metaliks price chart
Abbott India price chart Aurobindo Pharma price chart Biocon price chart
Cipla price chart Dr. Reddy's Labs price chart FDC price chart
Lupin price chart Granules India price chart Merck price chart
0
50
100
150
200
250
300
Oct-14 Apr-15 Oct-15 Apr-16 Oct-16 Apr-17 Oct-17
HNDL IN EQUITY
0
500
1000
1500
2000
Oct-14 Apr-15 Oct-15 Apr-16 Oct-16 Apr-17 Oct-17
VI IN EQUITY
0
50
100
150
200
Oct-14 Apr-15 Oct-15 Apr-16 Oct-16 Apr-17 Oct-17
ORIENT IN EQUITY
0
200
400
600
800
1000
Oct-14 Apr-15 Oct-15 Apr-16 Oct-16 Apr-17 Oct-17
TTSP IN EQUITY
0
200
400
600
800
1000
Oct-14 Apr-15 Oct-15 Apr-16 Oct-16 Apr-17 Oct-17
RMT IN EQUITY
0
500
1000
1500
Oct-14 Apr-15 Oct-15 Apr-16 Oct-16 Apr-17 Oct-17
OTCC IN EQUITY
0
200
400
600
800
1000
Oct-14 Apr-15 Oct-15 Apr-16 Oct-16 Apr-17 Oct-17
TML IN EQUITY
100
2100
4100
6100
8100
Oct-14 Apr-15 Oct-15 Apr-16 Oct-16 Apr-17 Oct-17
Abbott India Ltd
0
200
400
600
800
1000
Oct-14 Apr-15 Oct-15 Apr-16 Oct-16 Apr-17 Oct-17
Aurobindo Pharma Ltd
050
100150200250300350400450
Oct-14 Apr-15 Oct-15 Apr-16 Oct-16 Apr-17 Oct-17
Biocon Ltd
300
400
500
600
700
800
Oct-14 Apr-15 Oct-15 Apr-16 Oct-16 Apr-17 Oct-17
Cipla Ltd/India
1000
2000
3000
4000
5000
Oct-14 Apr-15 Oct-15 Apr-16 Oct-16 Apr-17 Oct-17
Dr Reddy's Laboratories Ltd
50
100
150
200
250
300
Oct-14 Apr-15 Oct-15 Apr-16 Oct-16 Apr-17 Oct-17
FDC Ltd/India
400650900
115014001650190021502400
Oct-14 Apr-15 Oct-15 Apr-16 Oct-16 Apr-17 Oct-17
Lupin Ltd
0
50
100
150
200
Oct-14 Apr-15 Oct-15 Apr-16 Oct-16 Apr-17 Oct-17Granules India Ltd
500
700
900
1100
1300
1500
Oct-14 Apr-15 Oct-15 Apr-16 Oct-16 Apr-17 Oct-17
Merck Ltd/India

54
Q1FY28 Results Preview
Disclosure of Interest Statement
1 Business activities of Centrum Broking Limited (CBL) Centrum Broking Limited (hereinafter referred to as “CBL”) is a registered member of NSE (Cash, F&O and Currency Derivatives Segments), MCX-SX (Currency Derivatives Segment) and BSE (Cash segment), Depository Participant of CDSL and a SEBI registered Portfolio Manager.
2 Details of Disciplinary History of CBL CBL has not been debarred/ suspended by SEBI or any other regulatory authority from accessing /dealing in securities market.
3 Registration status of CBL: CBL is registered with SEBI as a Research Analyst (SEBI Registration No. INH000001469) Ranjit Kapadia is registered with SEBI as Research Analyst (SEBI Registration No. INH000001352).
Cement
Disclosure of Interest Statement
1 Business activities of Centrum Broking Limited (CBL) Centrum Broking Limited (hereinafter referred to as “CBL”) is a registered member of NSE (Cash, F&O and Currency Derivatives Segments), MCX-SX (Currency Derivatives Segment) and BSE (Cash segment), Depository Participant of CDSL and a SEBI registered Portfolio Manager.
2 Details of Disciplinary History of CBL CBL has not been debarred/ suspended by SEBI or any other regulatory authority from accessing /dealing in securities market.
3 Registration status of CBL: CBL is registered with SEBI as a Research Analyst (SEBI Registration No. INH000001469)
ACC Ambuja Cement
JK Cements
JK Lakshmi
Orient Cement
Ramco Cements
Shree Cement
Star Ferro & Cement UltraTech Visaka
Industries Deccan
Cements
4 Whether Research analyst’s or relatives’ have any financial interest in the subject company and nature of such financial interest
No No No No No No No No No No No
5 Whether Research analyst or relatives have actual / beneficial ownership of 1% or more in securities of the subject company at the end of the month immediately preceding the date of publication of the document.
No No No No No No No No No No No
6 Whether the research analyst or his relatives has any other material conflict of interest No No No No No No No No No No No
7 Whether research analyst has received any compensation from the subject company in the past 12 months and nature of products / services for which such compensation is received
No No No No No No No No No No No
8 Whether the Research Analyst has received any compensation or any other benefits from the subject company or third party in connection with the research report
No No No No No No No No No No No
9 Whether Research Analysts has served as an officer, director or employee of the subject company No No No No No No No No No No No
10 Whether the Research Analyst has been engaged in market making activity of the subject company. No No No No No No No No No No No
Pfizer price chart Sanofi India price chart Sun Pharma price chart
Marksans Pharma price chart Glaxo SK Pharma price chart
FIEM Industries price chart Mayur Uniquoters price chart Swaraj Engines price chart
Source: Bloomberg, Centrum Research
400
900
1400
1900
2400
2900
Oct-14 Apr-15 Oct-15 Apr-16 Oct-16 Apr-17 Oct-17
Pfizer Ltd/India
1900
2900
3900
4900
5900
Oct-14 Apr-15 Oct-15 Apr-16 Oct-16 Apr-17 Oct-17
Sanofi India Ltd
0
500
1000
1500
Oct-14 Apr-15 Oct-15 Apr-16 Oct-16 Apr-17 Oct-17
Sun Pharmaceutical Industries Ltd
0
50
100
150
Oct-14 Apr-15 Oct-15 Apr-16 Oct-16 Apr-17 Oct-17
Marksans Pharma Ltd
1500
2000
2500
3000
3500
4000
Oct-14 Apr-15 Oct-15 Apr-16 Oct-16 Apr-17 Oct-17
GlaxoSmithKline Pharmaceuticals Ltd
0
500
1000
1500
2000
Oct-14 Apr-15 Oct-15 Apr-16 Oct-16 Apr-17 Oct-17
FIEM Industries Ltd
300
350
400
450
500
550
Oct-14 Apr-15 Oct-15 Apr-16 Oct-16 Apr-17 Oct-17
Mayur Uniquoters Ltd
200
700
1200
1700
2200
2700
Oct-14 Apr-15 Oct-15 Apr-16 Oct-16 Apr-17 Oct-17
Swaraj Engines Ltd
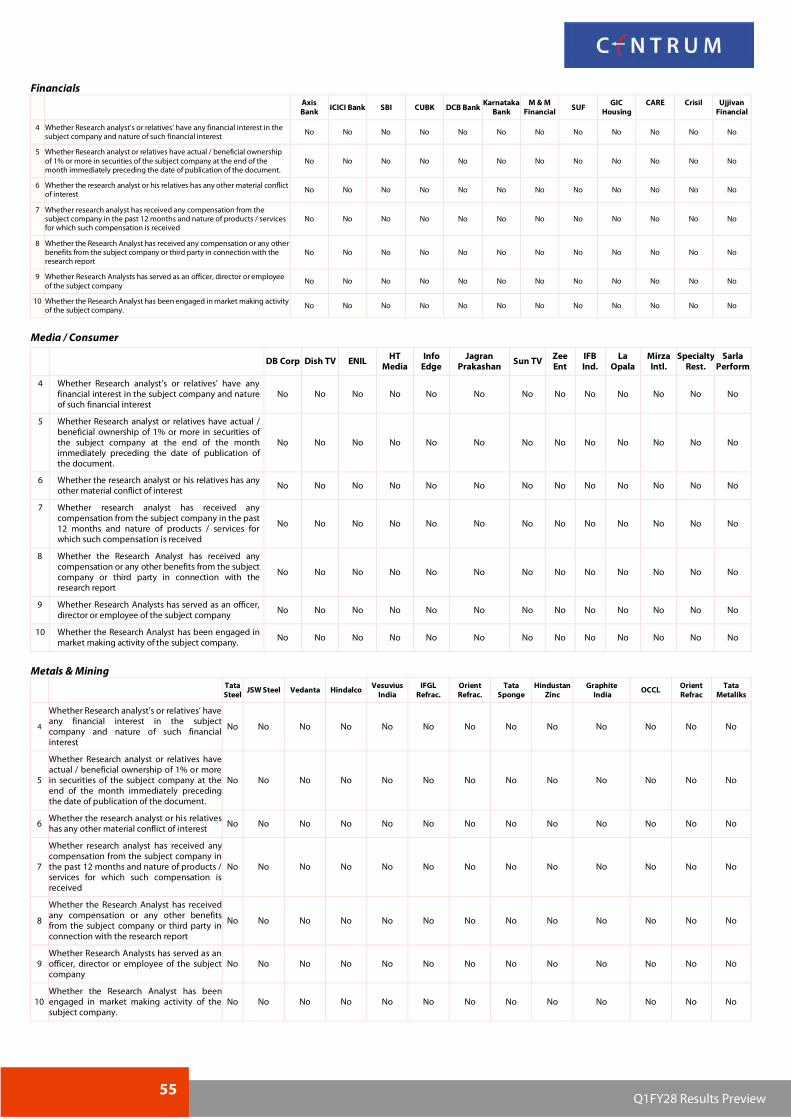
55
Q1FY28 Results Preview
Financials
Axis Bank ICICI Bank SBI CUBK DCB Bank
Karnataka Bank
M & M Financial SUF
GIC Housing
CARE Crisil Ujjivan Financial
4 Whether Research analyst’s or relatives’ have any financial interest in the subject company and nature of such financial interest No No No No No No No No No No No No
5 Whether Research analyst or relatives have actual / beneficial ownership of 1% or more in securities of the subject company at the end of the month immediately preceding the date of publication of the document.
No No No No No No No No No No No No
6 Whether the research analyst or his relatives has any other material conflict of interest No No No No No No No No No No No No
7 Whether research analyst has received any compensation from the subject company in the past 12 months and nature of products / services for which such compensation is received
No No No No No No No No No No No No
8 Whether the Research Analyst has received any compensation or any other benefits from the subject company or third party in connection with the research report
No No No No No No No No No No No No
9 Whether Research Analysts has served as an officer, director or employee of the subject company
No No No No No No No No No No No No
10 Whether the Research Analyst has been engaged in market making activity of the subject company. No No No No No No No No No No No No
Media / Consumer
DB Corp Dish TV ENIL HT
Media Info
Edge Jagran
Prakashan Sun TV Zee
Ent IFB Ind.
La Opala
Mirza Intl.
Specialty Rest.
Sarla Perform
4 Whether Research analyst’s or relatives’ have any financial interest in the subject company and nature of such financial interest
No No No No No No No No No No No No No
5 Whether Research analyst or relatives have actual / beneficial ownership of 1% or more in securities of the subject company at the end of the month immediately preceding the date of publication of the document.
No No No No No No No No No No No No No
6 Whether the research analyst or his relatives has any other material conflict of interest No No No No No No No No No No No No No
7 Whether research analyst has received any compensation from the subject company in the past 12 months and nature of products / services for which such compensation is received
No No No No No No No No No No No No No
8 Whether the Research Analyst has received any compensation or any other benefits from the subject company or third party in connection with the research report
No No No No No No No No No No No No No
9 Whether Research Analysts has served as an officer, director or employee of the subject company No No No No No No No No No No No No No
10 Whether the Research Analyst has been engaged in market making activity of the subject company. No No No No No No No No No No No No No
Metals & Mining
Tata
Steel JSW Steel Vedanta Hindalco Vesuvius
India IFGL
Refrac. Orient Refrac.
Tata Sponge
Hindustan Zinc
Graphite India
OCCL Orient Refrac
Tata Metaliks
4
Whether Research analyst’s or relatives’ have any financial interest in the subject company and nature of such financial interest
No No No No No No No No No No No No No
5
Whether Research analyst or relatives have actual / beneficial ownership of 1% or more in securities of the subject company at the end of the month immediately preceding the date of publication of the document.
No No No No No No No No No No No No No
6 Whether the research analyst or his relatives has any other material conflict of interest No No No No No No No No No No No No No
7
Whether research analyst has received any compensation from the subject company in the past 12 months and nature of products / services for which such compensation is received
No No No No No No No No No No No No No
8
Whether the Research Analyst has received any compensation or any other benefits from the subject company or third party in connection with the research report
No No No No No No No No No No No No No
9 Whether Research Analysts has served as an officer, director or employee of the subject company
No No No No No No No No No No No No No
10 Whether the Research Analyst has been engaged in market making activity of the subject company.
No No No No No No No No No No No No No

56
Q1FY28 Results Preview
Pharma
Abbott India
Aurobindo Pharma Biocon Cipla
Dr. Reddy's
Labs FDC
Glaxo SK Pharma Granules
India Lupin Merck Pfizer Sanofi India
Sun Pharma
Marksans Pharma
4 Whether Research analyst’s or relatives’ have any financial interest in the subject company and nature of such financial interest
No No No No No No No No No No No No No No
5 Whether Research analyst or relatives have actual / beneficial ownership of 1% or more in securities of the subject company at the end of the month immediately preceding the date of publication of the document.
No No No No No No No No No No No No No No
6 Whether the research analyst or his relatives has any other material conflict of interest No No No No No No No No No No No No No No
7 Whether research analyst has received any compensation from the subject company in the past 12 months and nature of products / services for which such compensation is received
No No No No No No No No No No No No No No
8 Whether the Research Analyst has received any compensation or any other benefits from the subject company or third party in connection with the research report
No No No No No No No No No No No No No No
9 Whether Research Analysts has served as an officer, director or employee of the subject company No No No No No No No No No No Yes No No No
10 Whether the Research Analyst has been engaged in market making activity of the subject company. No No No No No No No No No No No No No No
Miscellaneous
FIEM Industries Mayur Uniquoters Swaraj Engines
4 Whether Research analyst’s or relatives’ have any financial interest in the subject company and nature of such financial interest No No No
5 Whether Research analyst or relatives have actual / beneficial ownership of 1% or more in securities of the subject company at the end of the month immediately preceding the date of publication of the document. No No No
6 Whether the research analyst or his relatives has any other material conflict of interest No No No
7 Whether research analyst has received any compensation from the subject company in the past 12 months and nature of products / services for which such compensation is received No No No
8 Whether the Research Analyst has received any compensation or any other benefits from the subject company or third party in connection with the research report
No No No
9 Whether Research Analysts has served as an officer, director or employee of the subject company No No No
10 Whether the Research Analyst has been engaged in market making activity of the subject company. No No No
Rating Criteria
Rating Market cap < Rs20bn Market cap > Rs20bn but < 100bn Market cap > Rs100bn Buy Upside > 20% Upside > 15% Upside > 10% Hold Upside between -20% to +20% Upside between -15% to +15% Upside between -10% to +10% Sell Downside > 20% Downside > 15% Downside > 10%
Member (NSE and BSE)
Regn No.: CAPITAL MARKET SEBI REGN. NO.: BSE: INB011454239 CAPITAL MARKET SEBI REGN. NO.: NSE: INB231454233
DERIVATIVES SEBI REGN. NO.: NSE: INF231454233 (TRADING & CLEARING MEMBER)
CURRENCY DERIVATIVES: MCX-SX INE261454230 CURRENCY DERIVATIVES:NSE (TM & SCM) – NSE 231454233
Depository Participant (DP) CDSL DP ID: 120 – 12200
SEBI REGD NO. : CDSL : IN-DP-CDSL-661-2012
PORTFOLIO MANAGER
SEBI REGN NO.: INP000004383
Website: www.centrum.co.in Investor Grievance Email ID: [email protected]
Compliance Officer Details: Kavita Ravichandran
(022) 4215 9842; Email ID: [email protected]
Centrum Broking Ltd. (CIN :U67120MH1994PLC078125) Registered Office Address Bombay Mutual Building ,
2nd Floor, Dr. D. N. Road,
Fort, Mumbai - 400 001
Corporate Office & Correspondence Address Centrum House
6th Floor, CST Road, Near Vidya Nagari Marg, Kalina, Santacruz (E), Mumbai 400 098.