9-month report 2008...growth of 18 percent was achieved if currency fluctuations are excluded. in...
TRANSCRIPT

20089-Month Report
I International Trade Fair Hogatec, Düsseldorf, Sep. 28 - Oct. 1, 2008

I Key figures
At a glance2
Thousands of euros
Sales
Sales abroad as a percentage of sales
Cost of sales
as a percentage of sales
Gross profit
as a percentage of sales
Sales and service expenses
as a percentage of sales
Research and development expenses
as a percentage of sales
General administration expenses
as a percentage of sales
EBIT – earnings before interest and taxes
as a percentage of sales
EBT – earnings before taxes
as a percentage of sales
Group earnings
as a percentage of sales
per share in euros
Cash flow from operating activities
per share in euros
Balance sheet total
Equity as a percentage of the balance
sheet total
Working capital (without liquid funds)
as a percentage of sales
Employees (as an annual average)
Sales per employee
81,184
84%
34,401
42.4%
46,783
57.6%
20,748
25.6%
3,370
4.2%
3,985
4.9%
19,854
24.5%
19,783
24.4%
14,630
18.0%
1.29
1,096
74.1
-1%
- 1%-pt.
+2%
-3%
+11%
+11%
-1%
-9%
-10%
+1%
+12%
-11%
3rd Quarter 2008
3rd Quarter 2007
Change
81,705
85%
33,679
41.2%
48,026
58.8%
18,689
22.9%
3,024
3.7%
4,021
4.9%
21,865
26.8%
21,941
26.9%
14,428
17.7%
1.27
978
83.5
249,743
85%
101,141
40.5%
148,602
59.5%
65,242
26.1%
9,534
3.8%
12,024
4.8%
62,507
25.0%
62,876
25.2%
46,239
18.5%
4.07
53,332
4.69
191,902
118,793
61.9%
69,444
27.8%
1,081
231.0
+6%
+/- 0%-pts.
+5%
+7%
+13%
+10%
+2%
+3%
+3%
+17%
+35%
+31%
+15%
+8%
+13%
-6%
9 Months 2008
9 Months 2007
Change
235,626
85%
96,445
40.9%
139,181
59.1%
57,505
24.4%
8,660
3.7%
11,740
5.0%
60,515
25.7%
60,949
25.9%
39,379
16.7%
3.46
39,487
3.47
145,956
102,895
70.5%
64,072
27.2%
957
246.2

3Management Report
I Economic report
Dear Shareholders,Dear Business Partners,
Many thanks for your interest in RATIONAL AG.
With the following report we would like to inform you about the last 9 months of business performance of RATIONAL AG, as well as provide you with an outlook on the further development of the company during fiscal year 2008.
Downturn in the global economy
The global economy is currently undergoing a downswing. Almost all industrialized countries may be on the brink of a recession. Even the emerging economies are likely to show signs of weakness. The burst of inflation caused by global prices for raw materials, the corrections in real estate markets and the dramatically worsening crisis in financial markets in recent months are significant factors in this downturn. What is more, the strong euro has put pressure on exports. Growth forecasts by various organizations are continuously being revised downwards and exhibit major uncertainties as regards the next 12 months.
Sales growth up 6 percent
In the first 9 months of 2008, RATIONAL achieved sales of 249.7 million euros (previous year 235.6 million euros). This is equivalent to growth of 6 percent. If negative currency effects are eliminated, sales are up by 9 percent. With a rise in sales of 25 percent, growth in Asia has, as expected, been particularly strong, and now accounts for 12 percent of group sales (previous year 10 percent). In the Americas too, above-average growth of 18 percent was achieved if currency fluctuations are excluded. In Europe, the market where sales are at their strongest, sales growth stood at 5 percent after excluding negative currency effects.
In the 3rd quarter of 2008, sales of 81.2 million euros in total were merely on par with the previous year’s figure (81.7 million euros). We consider the main reason for this development to be the huge uncertainty resulting from the global financial crisis and the consequent generally manifested reluctance to invest.
EBIT growth up 3 percent / Group Earnings up 17 percent
For the first nine months of 2008, EBIT is 62.5 million euros compared to 60.5 million euros in the previous year. This equates to a growth of 3 percent. The EBIT margin is 25.0 percent compared to 25.7 percent in 2007.
Due to the lack of sales growth, EBIT fell in the 3rd quarter from 21.9 million euros in 2007 to 19.9 million euros in the current year. Nevertheless, thanks to the fall in raw material prices and selective efficiency increases throughout the company, an EBIT margin of 24.5 percent could be achieved.

Group earnings rose significantly in the first 9 months by 17 percent to 46.2 million euros (previous year 39.4 million euros). In addition to the rise in EBIT, this can in particular be traced back to the much reduced tax rate.
Operating cashflow up 35 percent
Operating cashflow grew in the first 9 months of 2008 by 13.8 million euros to 53.3 million euros (previous year 39.5 million euros). This growth of 35 percent is the result of increased operating income, the lower tax rate and improvements in working capital.
Cashflow from investment activities of 25.8 million euros reflects the investments in the new third plant plus the expansion and technological upgrading of machinery. Cashflow from financing activities includes in particular the dividend of 51.2 million euros distributed in May.
Cash funds at September 30, 2008 stand at 45.4 million euros compared to 32.2 million euros at the same time the previous year.
Sound asset structure
With an equity ratio of 62 percent (previous year 70 percent) and an equity-assets ratio of 185 percent, RATIONAL has an extremely sound asset structure. This guarantees latitude and considerable independence even when financial markets are under great pressure.
The new limescale free SelfCooking Center® from RATIONAL – Intelligent care for maximum operational reliability and environmental protection, with no increase in price
The new CareControl System automatically detects the current level of soiling and the general care requirements of the SelfCooking Center® and calculates - just in time - the ideal cleaning process in every case. As a result, the consumption of chemicals, water and energy is reduced, which is better for the environment.
Special scale-dissolving ingredients contained in the care tabs prevent limescale building up in the first place. Maximum operational reliability – even without expensive water softeners or time-consuming descaling – is guaranteed at all times. Thanks to intelligent cleaning the SelfCooking Center® with CareControl is kept hygienic, clean and sparkling - virtually overnight.
Alan Bird from "The Ivy" restaurant in London, UK, has this to say: “With our combi-steamer a technician had to come out to change and descale the water filter at least four times a year. The service costs for water filters and descaling the combi-steamer alone cost us around 900 euros a year, sometimes even more. Our new SelfCooking Center® with CareControl is completely reliable, fault-free and doesn’t require constant descaling.”
Management Report4

Institute for Food Hygiene and Techno
logy
HYG
IE
NE CERTIFICATE
Confirmed by Univ.-Prof. Dr. Dr. Dr. h. c. mult. A. Stolle,Institute for Food Hygiene and Technology,
Ludwig-Maximilians University, Munich
Please clean + care
CareControl
laterCleanJetcare
Please clean + care
CareControl
laterCleanJetcare
SelfCooking Center® – The World's First CareControl
Easily biodegradableto OECD 301B
Intelligent care for maximum operational reliability
CareControl®
2-yearRATIONALwarranty

2-year warranty for all appliances
Innovative care products extend the service life of the SelfCooking Center®. The entire system is continuously cleaned and maintained, not simply the cooking cabinet.
So it goes consequently that with immediate effect RATIONAL is to offer a 2-year warranty for all appliances. This all-round worry-free package means optimal planned security for customers, with calculable costs.
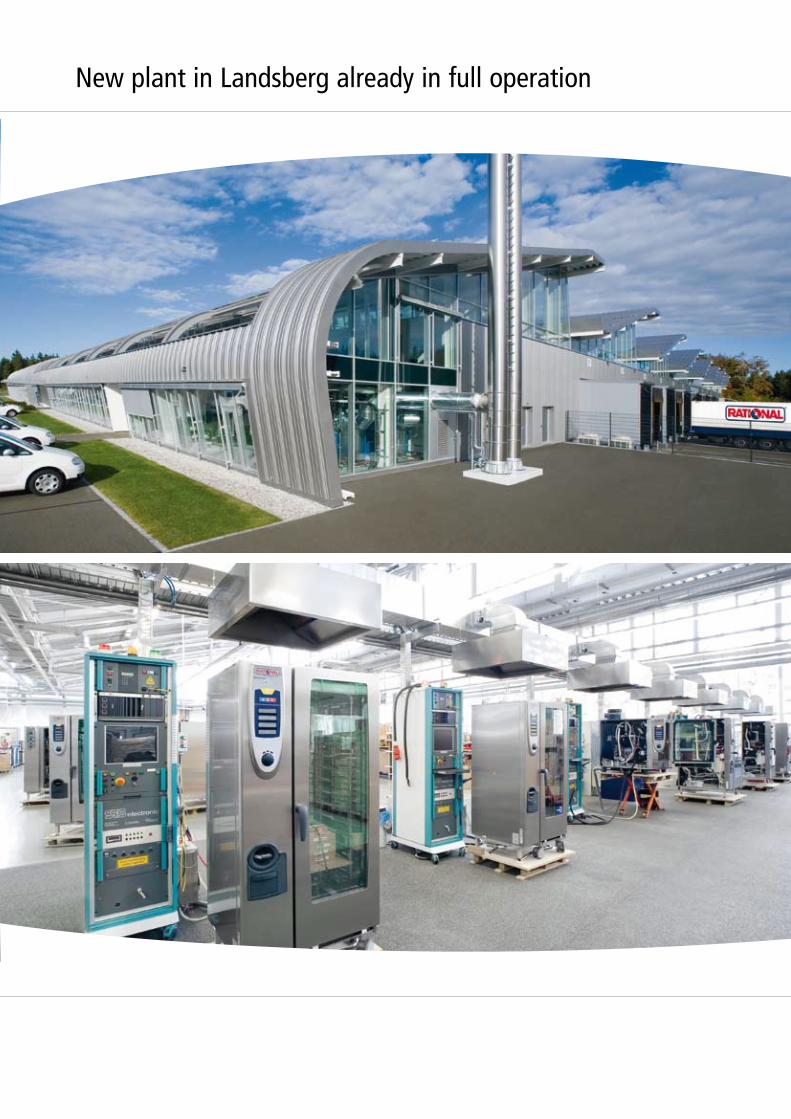
New third plant in Landsberg already in full operation
After a construction phase lasting just around a year, production in the new third plant in Landsberg went live at the start of July 2008.
A total of 24 million euros was invested in the new plant. This was the biggest individual investment in RATIONAL’s corporate history and has created a new platform for future economies of scale and targeted productivity improvements.
The design of the new plant was inspired by the latest ideas on process optimization, workplace layout and security. The process chain, from delivery, assembly and testing to packaging and shipping, has been optimized, the distances covered by employees have been significantly reduced. Assembly capacity has been expanded by 50 percent to at least 60,000 appliances a year thanks to the new plant.
Timely and open provision of information
Members of the board of RATIONAL AG represented the company at numerous roadshows in Europe and the US in the third quarter of 2008. Shareholders, analysts and interested parties were also impressed by the sustained corporate quality at the company’s headquarters in Landsberg. Most analysts are currently recommending buying RATIONAL AG shares.
Opportunities and risks
RATIONAL has a global risk management system, which ensures that opportunities and risks are detected and analysed at an early stage and that appropriate corrective measures are taken. The effects of the financial market crisis on the real economy, and the buying resistance this is causing over and above a normal recession, represents also for RATIONAL a new risk not previously encountered in this form.
Management Report6
I Risk report
New plant in Landsberg already in full operation

Revenue and profit forecast for 2008
The large rationalization and cost reduction effect and, correspondingly, the short time RATIONAL appliances take to pay for themselves make using RATIONAL technology especially attractive even in economically challenging times.
In order to specifically aid the development of the business, it has been decided to further expand the sales capacities in the principal markets of the world, given the high available free market potential of around 75 percent of the 2.5 million professional kitchens worldwide.
We are also expecting additional positive effects on the development of the business from the launch of the new limescale free SelfCooking Center® with CareControl and the introduction of the 2-year warranty for all RATIONAL and FRIMA appliances.
Because, firstly, of the current difficult economic environment overall and secondly, of the additional anticyclical sales and marketing activities, we expect total sales of around 355 million euros, EBIT of 93 million euros and group earnings of 68 million euros in fiscal 2008.
Landsberg am Lech, November 3, 2008
RATIONAL AGThe Executive Board
Management Report8
I Prospects

RATIONAL AG once again honoured for top-class entrepreneurial performance
At a formal ceremony in Munich’s Residence on July 30, 2008, the “BAVARIA’S BEST 50” award was presented by Emilia Müller, Bavarian Minister of Economic Affairs, Infrastructure, Transport and Technology. RATIONAL AG was honoured for its overall entrepreneurial performance but above all for continuous growth and for creating new high-skill jobs.
from left to right: Ralf Broschulat (member of the executive board, Ernst & Young AG, Wirtschaftsprüfungsgesellschaft), Peter Wiedemann (CTO, RATIONAL AG), Franz Ehelechner (RATIONAL AG), Dr. Günter Blaschke (CEO, RATIONAL AG), Emilia Müller (Bavarian Minister of Economic Affairs, Infrastructure, Transport and Technology)
RATIONAL – Bavaria's Best 50

9-Month Report10
I Income Statement RATIONAL Group
Thousands of euros
Sales
Cost of sales
Gross profit
Sales and service expenses
Research and development expenses
General administration expenses
Other operating income
Other operating expenses
Earnings before interest and taxes (EBIT)
Financial results
Earnings before taxes (EBT)
Taxes on income
Group earnings
Retained earnings brought forward
Retained earnings
Average number of shares (undiluted)
Earnings per share (undiluted) in euros relating to the
consolidated results and the number of shares
Average number of shares (diluted)
Earnings per share (diluted) in euros relating to the
consolidated results and the number of shares
3rd Quarter 2008
81,184
-34,401
46,783
-20,748
-3,370
-3,985
2,641
-1,467
19,854
-71
19,783
-5,153
14,630
65,875
80,505
3rd Quarter 2007
81,705
-33,679
48,026
-18,689
-3,024
-4,021
1,517
-1,944
21,865
76
21,941
-7,513
14,428
49,227
63,655
3rd Quarter 2008
11,370,000
1.29
11,370,000
1.29
3rd Quarter 2007
11,370,000
1.27
11,370,000
1.27
9 Months 2008
249,743
-101,141
148,602
-65,242
-9,534
-12,024
6,211
-5,506
62,507
369
62,876
-16,637
46,239
34,266
80,505
9 Months 2007
235,626
-96,445
139,181
-57,505
-8,660
-11,740
3,113
-3,874
60,515
434
60,949
-21,570
39,379
24,276
63,655
9 Months 2008
11,370,000
4.07
11,370,000
4.07
9 Months 2007
11,370,000
3.46
11,370,000
3.46

119-Month Report
I Balance Sheet RATIONAL Group Assets
I Balance Sheet RATIONAL Group Equity and liabilities
Dec. 31, 2007
40,268
1,732
36,097
218
248
1,973
147,154
18,638
61,393
4,828
17,000
45,295
187,422
Thousands of euros
Long-term assets
Intangible assets
Property, plant and equipment
Financial assets
Other long-term assets
Deferred tax assets
Short-term assets
Inventories
Trade receivables
Other short-term assets
Deposits with maturities of more than 3 months
Cash and cash equivalents
Balance sheet total
Dec. 31, 2007
123,988
11,370
26,673
514
85,431
19,813
617
17,144
2,052
43,621
3,646
19,424
856
-
9,292
10,403
63,434
187,422
Thousands of euros
Equity
Subscribed capital
Capital reserves
Revenue reserves
Retained earnings
Long-term liabilities
Provision for pensions
Non-current loans
Other long-term liabilities
Short-term liabilities
Liabilities for current tax
Short-term provisions
Current portion of non-current loans
Liabilities to banks
Trade accounts payable
Other short-term liabilities
Liabilities
Balance sheet total
Sep. 30, 2008
64,111
1,755
59,334
218
281
2,523
127,791
20,769
54,586
7,037
16,000
29,399
191,902
Sep. 30, 2007
37,340
1,607
32,097
218
257
3,161
108,616
18,916
55,354
2,154
4,000
28,192
145,956
Sep. 30, 2008
118,793
11,370
26,404
514
80,505
25,005
593
22,935
1,477
48,104
3,499
26,150
1,660
2,653
7,849
6,293
73,109
191,902
Sep. 30, 2007
102,895
11,370
27,356
514
63,655
3,920
682
1,000
2,238
39,141
1,486
22,053
-
2,445
9,759
3,398
43,061
145,956
Thousands of euros

9-Month Report12
Subscribed Capital thereof: Revenue Retained Total capital reserve non-realised reserves earnings
I Statement of Changes in Equity RATIONAL Group
I Cash Flow Statement RATIONAL Group
9 Months 2008
62,876
53,332
-25,847
-43,301
-80
-15,896
45,295
29,399
Thousands of euros
Earnings from ordinary activities
Cash flow from operating activities
Cash flow from investing activities
Cash flow from financing activities
Changes in cash from exchange rate changes
Change in cash funds
Cash and cash equivalents on January 1
Cash and cash equivalents on September 30
9 Months 2007
60,949
39,487
-11,679
-40,149
-50
-12,391
40,583
28,192
Balance at Jan. 1, 2007
Differences from currency conversion
Other changes
Income statement for the period taken directly to equity
Group earnings
Total of profit and expense items recorded in the period under review
Dividends
Balance at Sep. 30, 2007
Balance at Jan. 1, 2008
Differences from currency conversion
Other changes
Income statement for the period taken directly to equity
Group earnings
Total of profit and expense items recorded in the period under review
Dividends
Balance at Sep. 30, 2008
11,370
-
-
-
-
-
-
11,370
11,370
-
-
-
-
-
-
11,370
27,018
338
-
338
-
338
-
27,356
26,673
-269
-
-269
-
-269
-
26,404
-3,792
338
-
338
-
338
-
-3,454
-4,137
-269
-
-269
-
-269
-
-4,406
514
-
-
-
-
-
-
514
514
-
-
-
-
-
-
514
66,914
-
-
-
39,379
39,379
-42,638
63,655
85,431
-
-
-
46,239
46,239
-51,165
80,505
105,816
338
-
338
39,379
39,717
-42,638
102,895
123,988
-269
-
-269
46,239
45,970
-51,165
118,793
Thousands of euros

139-Month Report
Segmentrechnung 9 Monate 2006
Germany
34,977
15%
-
34,977
956
Europe excl.
Germany
151,175
64%
1,953
153,128
13,632
Americas
26,792
11%
-
26,792
821
Asia
6,627
3%
-
6,627
-246
of the parent
company
16,055
7%
157,748
173,803
45,793
for segments
235,626
100%
159,701
395,327
60,956
-
-
-159,701
-159,701
-441
235,626
100%
-
235,626
60,515
Thousands of euros
External sales
share
Intercompany sales
Segment sales
Segment result
Activities of the subsidiaries in:Segment reporting 9 Months 2007
Activities Total GroupReconcil.
Germany
36,713
+5%
15%
-
36,713
+5%
-508
-1,464
Europe excl.
Germany
161,933
+7%
65%
3,210
165,143
+8%
+12,365
-1,267
Americas
26,600
-1%
10%
-
26,600
-1%
-501
-1,322
Asia
7,541
+14%
3%
-
7,541
+14%
-234
+12
of the parent
company
16,956
+6%
7%
163,640
180,596
+4%
+51,560
+5,767
Segment reporting 9 Months 2008 Thousands of euros
External sales
vs. previous year
share
Intercompany sales
Segment sales
vs. previous year
Segment result
vs. previous year
for segments
249,743
+6%
100%
166,850
416,593
+5%
+62,682
+1,726
249,743
+6%
100%
-
249,743
+6%
+62,507
+1,992
Activities of the subsidiaries in: Activities Total GroupReconcil.
-
-
-
-166,850
-166,850
-
-175
+266
15%
54%
14%
12%
5%
100%
9 Months 2008
37,781
135,690
34,709
28,641
12,922
249,743
Thousands of euros
Germany
Europe (excluding Germany)
Americas
Asia
Rest of the world
Total
9 Months 2007
35,338
132,946
32,061
22,866
12,415
235,626
15%
56%
14%
10%
5%
100%
I Sales
The sales per region are shown according to customer location.

Notes14
I Accounting principles
I Consolidated companies
I DVFA result
I Associated companies and persons
RATIONAL's activities are focused on one business segment: the development, production and sale of appliances for the thermal preparation of food in mass-catering kitchens. It does not currently carry any other significant independent product lines that would be reported as segments internally. For this reason, the primary and only segment reporting format is geographical. RATIONAL brings the subsidiaries based in the various regions together in the segments. This complies with the definition of segments by the location of the company's assets under IAS 14.13.
Besides Germany, Europe excluding Germany, Americas and Asia segments, the fifth segment covers the work of the parent company (including LechMetall Landsberg GmbH, RATIONAL Technical Services GmbH and RATIONAL Komponenten GmbH). This segment represents the development, manufacture and supply of products to subsidiaries as well as supplies of goods and services to OEM customers. The newly founded company “RATIONAL RUS OOO” has been added to the Europe segment, and the new “RATIONAL Brasil Comércio E Distribuição De Sistemas De Cocção LTDA.” to the Americas segment. The effects arising from the consolidation operations are reflected in the reconciliation column.
The group quarterly report was prepared in line with the principles of the International Financial Reporting Standards (IFRS). The same valuation and balance sheet methods have therefore been applied as in the group’s last financial statements. The rules in IAS 34 on condensed financial statements were applied in this case.
On September 30, 2008, RATIONAL AG’s consolidated group includes, beyond the parent company RATIONAL AG, five German and eighteen foreign subsidiaries. On September 30, 2008, for the first time, the newly founded sales companies “RATIONAL RUS OOO”, based in Moscow, with an equity capital of 5,750,000 Russian roubles, and “RATIONAL Brasil Comércio E Distribuição De Sistemas De Cocção LTDA.”, based in São Paulo, with an equity capital of 380,000 Brazilian reals, have been included in the consolidated group. Both companies are wholly-owned holdings of RATIONAL International AG and as of September 30, 2008 had not yet started operations. There have been no further changes to the composition of the consolidated group compared to September 30, 2007 and the balance sheet date of December 31, 2007.
In the first 9 months of 2008 no significant transactions occurred with companies or individuals in any way associated with RATIONAL AG.
The DVFA result on September 30, 2008 corresponds to the profit per share as per IAS or IFRS in the profit and loss account.
I Segment reporting

15Private Notes

The only SelfCooking Center®
Anything. Any size. Any batch.
Just as I want it.Every time.
pan-fried
light
juicy
dark
well done
RATIONAL AG, Iglinger Straße 62, 86899 Landsberg am Lech, Tel. 08191 3270, Fax 08191 327272, www.rational-ag.com
Time for the essentials.
Now everything turns out perfect.
2-yearRATIONALwarranty
Always
limescale free