9. flood control and management - california … project...system capacities and flood flow routing....
TRANSCRIPT

PRELIMINARY – SUBJECT TO CHANGEPRELIMINARY ADMINISTRATIVE DRAFT DECEMBER 2013 9-1 NORTH-OF-THE-DELTA OFFSTREAM STORAGE PROJECT EIR/EISWBG020812033556SAC/433094 (09-FLOOD_CONTROL_PRELIM_ADMIN_DRAFT_DEC2013.DOCX)
9. Flood Control and Management
9.1 Introduction
This chapter describes the flood hydrology, control, and management system in the Primary, Secondary,
and Extended study areas, with particular focus on the Primary Study Area and Sacramento River Basin.
Descriptions and maps of these three study areas are provided in Chapter 1 Introduction.
The regulatory setting for flood hydrology, control, and management is discussed briefly in this chapter,
and is presented in greater detail in Chapter 4 Environmental Compliance and Permit Summary.
This chapter focuses primarily on the Primary Study Area. Potential impacts in the Secondary Study
Area, particularly related to the Sacramento River Flood Management System, were evaluated and
discussed qualitatively. The portions of the Extended Study Area that are located outside of the Project
flood control and management impacted areas were not evaluated or discussed. Potential local and
regional impacts from constructing, operating, and maintaining the alternatives were described and
compared to applicable significance thresholds. Mitigation measures are provided for identified
significant or potentially significant impacts, where appropriate.
9.2 Affected Environment
This section describes flood control and management facilities in the three study areas, with particular
focus on the Primary Study Area (including local flood management facilities) and the Secondary Study
Area (including the Sacramento River flood management system).
9.2.1 Extended Study Area
The Extended Study Area includes the entire statewide CVP and SWP service areas. This study area is
extensive and includes hundreds, if not thousands, of federal, State, regional and local flood control and
management facilities. This study area encompasses the CVP and SWP service areas outside of the
greater Sacramento River Basin and south of the Sacramento-San Joaquin Delta. The only Extended
Study Area reservoir included in Project operations modeling is San Luis Reservoir. However, San Luis
Reservoir is operated entirely as a joint CVP and SWP supply storage reservoir and is not operated for
flood control purposes. The portions of the Extended Study Area that are outside of the greater
Sacramento River Basin, and south of the Sacramento-San Joaquin Delta, would also be outside of the
affected environment for Project flood impacts, and are, therefore, not discussed.
9.2.2 Secondary Study Area
9.2.2.1 Sacramento River Flood Control and Management
The Sacramento River flood control and management system is a complex network of dams and
reservoirs, levees, weirs, bypasses and other flood control features. A portion of this complex flood
protection system includes State- and federally-authorized projects for which the Central Valley Flood
Protection Board (CVFPB) or DWR has provided assurances of cooperation to the federal government.
This portion of the flood protection system is known as the State Plan of Flood Control (SPFC). A
summary of features of the SPFC is provided in Figure 9-1.
This document is not released as a draft EIR pursuant to CEQA Guidelines § 15087. As such, DWR is not soliciting and will not respond to commentssubmitted on this document, although any comments received will be retained and may be considered during preparation of a future draft EIR.

Chapter 9: Flood Control and Management
PRELIMINARY – SUBJECT TO CHANGENORTH-OF-THE-DELTA OFFSTREAM STORAGE PROJECT EIR/EIS 9-2 PRELIMINARY ADMINISTRATIVE DRAFT DECEMBER 2013
WBG020812033556SAC/433094 (09-FLOOD_CONTROL_PRELIM_ADMIN_DRAFT_DEC2013.DOCX)
The CVFPB or DWR has not provided assurances of cooperation for all parts of the flood protection
system. Projects without CVFPB or DWR assurances are not part of the SPFC (i.e., they are non-SPFC
facilities). Although these facilities are not part of the SPFC, their operation may influence operation of
the SPFC, especially in reducing peak flood flows through the SPFC levee system. Non-SPFC facilities
include multipurpose reservoir projects (with the exception of Lake Oroville, which is the only major
multipurpose project discussed in this chapter that is part of the SPFC), local and regional projects,
non-project levees, local pumping plants, and State-designated floodways (DWR, 2010).
Multipurpose flood management reservoirs in the greater Sacramento River Basin are listed in Table 9-1
in chronological order of construction.
Table 9-1Sacramento River Basin Multi-Purpose Flood Management Reservoirs
Reservoir
Total ReservoirCapacity
(acre-feet)
Maximum FloodStorage Capacity
(acre-feet) Operator
Shasta 4,550,000 1,300,000 Reclamation
Black Butte 160,000 137,000 USACE
Folsom 1,010,000 650,000 Reclamation
Oroville 3,540,000 750,000 DWR
New Bullards Bar 960,000 170,000 Yuba County Water Agency
Indian Valley 300,000 40,000 Yolo County Flood Control and Water Conservation District
Notes:
USACE = U.S. Army Corps of EngineersDWR = California Department of Water ResourcesReclamation = U.S. Bureau of Reclamation
Other major SPFC facilities in the Sacramento River flood control and management system include
project levees and flood control weirs, as shown on Figures 9-2A and 9-2B. These figures also indicate
system capacities and flood flow routing.
The 100-year floodplain delineations for the Sacramento River Valley north of the Sacramento-San Joaquin
Delta are illustrated on Figure 9-3. Major federal, State and local non-SPFC projects impacting flood
hydrology or providing flood management for the Sacramento Valley are located on the Trinity River,
Sacramento River, Feather River, American River and within the Delta. These areas are discussed below.
9.2.2.2 Trinity River (Including Trinity Lake, Lewiston Lake, Whiskeytown Lake, Clear
Creek and Spring Creek)
The Trinity River is the largest tributary to the Klamath River. The Trinity River Diversion includes
Trinity Dam, Lewiston Dam, and facilities to transfer water from the Trinity River Basin to the
Sacramento River Basin. Trinity Dam was completed in 1962. The dam forms Trinity Lake, which has a
capacity of approximately 2.4 MAF. Releases from Trinity Dam are regulated downstream at Lewiston
Lake for downstream flow requirements and diversions through the Clear Creek Tunnel to Whiskeytown
Lake on Clear Creek. From Whiskeytown Lake, water is delivered through the Spring Creek tunnel to
Keswick Reservoir. The outflow from Trinity and Lewiston reservoirs provides water to meet temperature
objectives for special-status fish species in the Trinity and upper Sacramento rivers (Reclamation, 2009).
Flood control was not an original project purpose of the two dams. However, because of its large storage and
spillway surcharge capacities, Trinity Lake has the potential to provide flood control storage, and
Reclamation’s Safety of Dams criteria stipulate flood control releases November through March if the overall
This document is not released as a draft EIR pursuant to CEQA Guidelines § 15087. As such, DWR is not soliciting and will not respond to commentssubmitted on this document, although any comments received will be retained and may be considered during preparation of a future draft EIR.

Chapter 9: Flood Control and Management
PRELIMINARY – SUBJECT TO CHANGEPRELIMINARY ADMINISTRATIVE DRAFT DECEMBER 2013 9-3 NORTH-OF-THE-DELTA OFFSTREAM STORAGE PROJECT EIR/EISWBG020812033556SAC/433094 (09-FLOOD_CONTROL_PRELIM_ADMIN_DRAFT_DEC2013.DOCX)
storage is forecasted to exceed 2.0 MAF (Reclamation, 2004). In addition, Trinity Lake is operated in
conjunction with Shasta Lake, when necessary, as part of Shasta’s Sacramento River flood control operations.
9.2.2.3 Sacramento River (Including Shasta Lake and Keswick Reservoir)
A complex system of dams and associated reservoirs, levees, weirs, bypasses and other features have been
constructed over the last 150 years to help manage flooding along the Sacramento River. The primary
flood control features on the Sacramento River system are Shasta Lake and the federally authorized
Sacramento River Flood Control Project.
Regulating inflows from the Sacramento, McCloud, and Pit rivers, Shasta Lake provides flood control to
the upper Sacramento River through Shasta Lake’s 1.3-MAF of flood control storage. The reservoir is
managed for flood control from October 1 through March 30. In non-emergency flood conditions, Shasta
Dam releases are restricted to 79,000 cfs at the tailwater of Keswick Dam (79,000 cfs is the estimated safe
channel carrying capacity of the Sacramento River downstream of Keswick through Redding) and by a
flood stage of 27.0 feet at the Sacramento River at Bend Bridge gage (flood stage of 27.0 ft equates to
approximately 100,000 cfs). The Sacramento River at Bend Bridge is a key Sacramento River flood
forecasting point. The Sacramento River Flood Control Project area spans from Red Bluff to Verona
(north of Sacramento on the Sacramento River) and includes levees, cleared channels, bypasses, and
overflow flood control facilities (Figures 9-2A and 9-2B).
The Chico Landing to Red Bluff reach of the Sacramento River (RM 194 to RM 244) is relatively
unaffected by flood control facilities. The river naturally meanders through alluvial deposits, and
tributaries contribute unregulated flood inflows. This reach of the Sacramento River Flood Control
Project was authorized in 1958 for bank protection and incidental channel modification. Floodway
designation and floodplain planning and zoning are used to prevent encroachment into the natural
floodplain. Most of the floodplain along this reach is used primarily for either agricultural production or
riparian habitat. The 100-year floodplain can range up to four miles wide. Some rural residential
development has occurred along the river, with concentrated urban development around the City of
Tehama and Hamilton City. The design flow of the river upstream of Chico Landing is 260,000 cfs.
The Colusa to Chico Landing reach of the Sacramento River (RM 143 to RM 194) consists of levees and
overflow areas. Black Butte Reservoir regulates Stony Creek flood flows, which enter the Sacramento
River downstream of Hamilton City. Right bank levees extend south from Ord Ferry through Colusa to
prevent Sacramento River flood water from entering the Colusa Basin, except when flows exceed
300,000 cfs near Ord Ferry (USACE, 1999). Three flood relief weirs, downstream of Chico Landing, spill
flood flows to the Butte Basin Overflow Area, which consists of lands that have historically flooded prior
to flood control development. The left bank levee begins midway between Ord Ferry and Butte City and
extends south through Verona. The leveed capacity of the Sacramento River near Butte City is
160,000 cfs. Moulton and Colusa weirs divert flood flows to the Butte Basin Overflow Area at
RM 158 and 146, respectively. The capacity of Moulton and Colusa weirs is 25,000 and 70,000 cfs,
respectively. These weirs provide relief to meet the downstream river capacity of 65,000 cfs at Colusa.
The natural Sutter Basin overflow to the east of the Sacramento River and downstream of the Sutter
Buttes was included in the Sacramento River Flood Control Project by confining the extent of overflow
through a leveed bypass. The Sutter Bypass conveys floodwaters from the Butte Basin Overflow Area,
Butte Creek, Wadsworth Canal, Reclamation Districts 1660 and 1500 drainage plants, State drainage
plants 1, 2 and 3, and Tisdale Weir to the juncture of the Sacramento and Feather rivers. The capacity of
This document is not released as a draft EIR pursuant to CEQA Guidelines § 15087. As such, DWR is not soliciting and will not respond to commentssubmitted on this document, although any comments received will be retained and may be considered during preparation of a future draft EIR.

Chapter 9: Flood Control and Management
PRELIMINARY – SUBJECT TO CHANGENORTH-OF-THE-DELTA OFFSTREAM STORAGE PROJECT EIR/EIS 9-4 PRELIMINARY ADMINISTRATIVE DRAFT DECEMBER 2013
WBG020812033556SAC/433094 (09-FLOOD_CONTROL_PRELIM_ADMIN_DRAFT_DEC2013.DOCX)
the Sutter Bypass is 216,000 cfs upstream of its juncture with the Feather River, where the combined
capacity of the Feather River and Sutter Bypass is 416,500 cfs upstream of its confluence with the
Sacramento River at Fremont Weir and the Yolo Bypass.
The natural Yolo Basin overflow to the west of the Sacramento River was included in the Sacramento
River Flood Control Project by confining the extent of overflow through a leveed bypass. The Yolo
Bypass conveys floodwaters around the Sacramento metropolitan area and reconnects to the Sacramento
River at Rio Vista (RM 14), near Suisun Bay (USACE, 1999). Overflow into the Bypass occurs at
Fremont Weir to the north and at Sacramento Weir near Sacramento. Fremont Weir flow begins when
flows in the Sacramento River reach 62,000 cfs. Capacity of the Bypass increases from 343,000 cfs at
Fremont Weir to 500,000 cfs near the bypass’ mouth at Rio Vista.
The Verona to Colusa reach (RM 98 to RM 143) consists of a leveed river channel. Downstream of
Colusa, Tisdale Bypass routes a portion of the river flow in excess of 23,000 cfs at Tisdale Weir
(RM 119) to the Sutter Bypass (USACE, 1999). Reclamation Districts 70, 108, and 787 pump flood
waters from adjacent closed basin lands into the river. The Knights Landing Outfall is a gravity flow
structure and prevents the Sacramento River from flowing into the Colusa Basin. The Knights Landing
Ridge Cut conveys Colusa Basin drainage and flood flows into the Yolo Bypass several miles
downstream of Fremont Weir. Flood flows passing through the Knights Landing Ridge Cut are somewhat
restricted at times by backwater conditions when the Yolo Bypass is at full capacity. Sources of bypass
inflow downstream of the Knights Landing Ridge Cut include the Cache Creek Detention Basin, Willow
Slough, Putah Creek, and Sacramento Weir (combination of Sacramento and American river flood flows).
Near Verona, the Sacramento River, Feather River, Sutter Bypass, and Natomas Cross Canal join
together, and flows in excess of 62,000 cfs spill into the Yolo Bypass at Fremont Weir.
Downstream of Verona, the leveed Sacramento River winds its way past the City of Sacramento to the
Sacramento-San Joaquin Delta. The Yolo Bypass is located to the west of the river. The Sacramento
Bypass routes excess flows at Sacramento Weir (RM 63) to the Yolo Bypass (USACE, 1999). The
American River flows into the Sacramento River at RM 60. Flows from the Yolo Bypass re-enter the
river near Rio Vista (RM 14). Between the American River and Yolo Bypass junction, portions of the
Sacramento River water are divided among several sloughs.
The capacity of the leveed Sacramento River at various locations is listed in Table 9-2.
Table 9-2Sacramento River Leveed Capacity
Location Flow (cfs)
Upstream of Moulton Weir 160,000 cfs
Moulton Weir to Colusa Weir 135,000 cfs
Colusa Weir to Butte Slough Outfall Gates 65,000 cfs
Butte Slough Outfall Gates to Tisdale Weir 66,000 cfs
Tisdale Weir to Freemont Weir 30,000 cfs
Freemont Weir to Sacramento Weir 107,000 cfs
Sacramento Weir to Sutter Slough 110,000 cfs
Sutter Slough to Steamboat Slough 85,000 cfs
Steamboat Slough to Georgiana Slough 56,500 cfs
Georgiana Slough to Yolo Bypass Junction 35,900 cfs
Yolo Bypass Junction to Threemile Slough 579,000 cfs
Threemile Slough to Collinsville 514,000 cfs
Source: DWR, 2009.
This document is not released as a draft EIR pursuant to CEQA Guidelines § 15087. As such, DWR is not soliciting and will not respond to commentssubmitted on this document, although any comments received will be retained and may be considered during preparation of a future draft EIR.
Chapter 9: Flood Control and Management
PRELIMINARY – SUBJECT TO CHANGEPRELIMINARY ADMINISTRATIVE DRAFT DECEMBER 2013 9-5 NORTH-OF-THE-DELTA OFFSTREAM STORAGE PROJECT EIR/EISWBG020812033556SAC/433094 (09-FLOOD_CONTROL_PRELIM_ADMIN_DRAFT_DEC2013.DOCX)
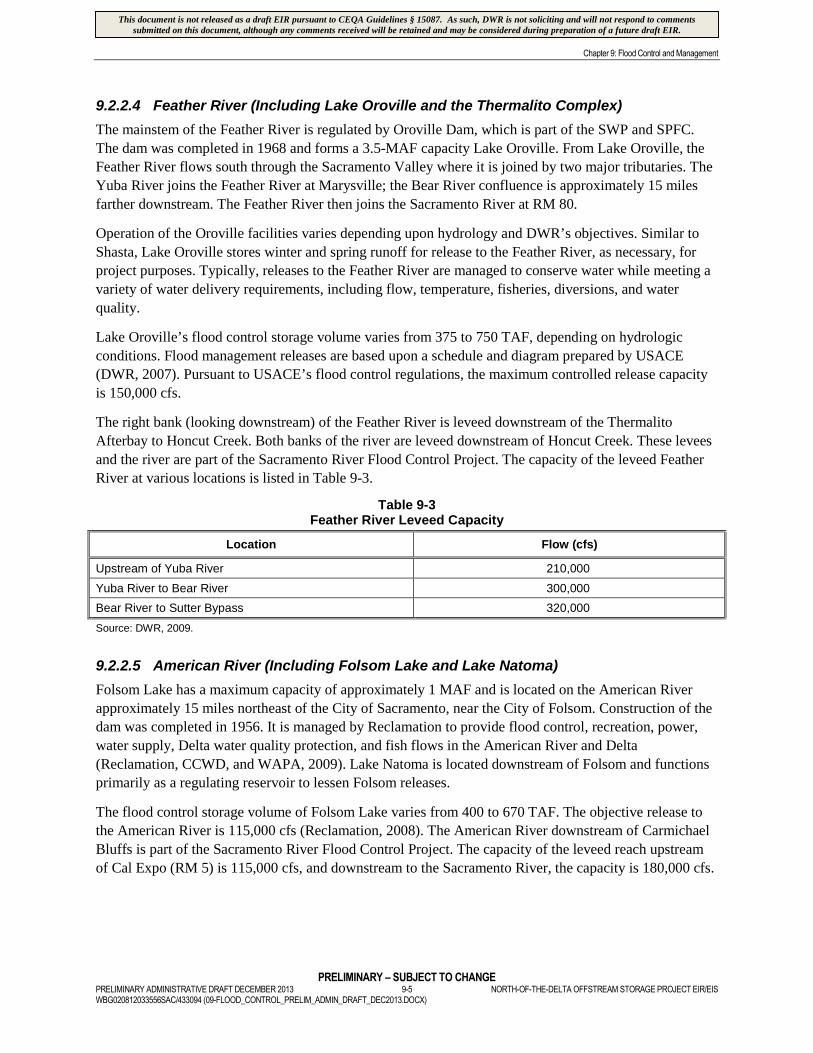
9.2.2.4 Feather River (Including Lake Oroville and the Thermalito Complex)
The mainstem of the Feather River is regulated by Oroville Dam, which is part of the SWP and SPFC.
The dam was completed in 1968 and forms a 3.5-MAF capacity Lake Oroville. From Lake Oroville, the
Feather River flows south through the Sacramento Valley where it is joined by two major tributaries. The
Yuba River joins the Feather River at Marysville; the Bear River confluence is approximately 15 miles
farther downstream. The Feather River then joins the Sacramento River at RM 80.
Operation of the Oroville facilities varies depending upon hydrology and DWR’s objectives. Similar to
Shasta, Lake Oroville stores winter and spring runoff for release to the Feather River, as necessary, for
project purposes. Typically, releases to the Feather River are managed to conserve water while meeting a
variety of water delivery requirements, including flow, temperature, fisheries, diversions, and water
quality.
Lake Oroville’s flood control storage volume varies from 375 to 750 TAF, depending on hydrologic
conditions. Flood management releases are based upon a schedule and diagram prepared by USACE
(DWR, 2007). Pursuant to USACE’s flood control regulations, the maximum controlled release capacity
is 150,000 cfs.
The right bank (looking downstream) of the Feather River is leveed downstream of the Thermalito
Afterbay to Honcut Creek. Both banks of the river are leveed downstream of Honcut Creek. These levees
and the river are part of the Sacramento River Flood Control Project. The capacity of the leveed Feather
River at various locations is listed in Table 9-3.
Table 9-3Feather River Leveed Capacity
Location Flow (cfs)
Upstream of Yuba River 210,000
Yuba River to Bear River 300,000
Bear River to Sutter Bypass 320,000
Source: DWR, 2009.
9.2.2.5 American River (Including Folsom Lake and Lake Natoma)
Folsom Lake has a maximum capacity of approximately 1 MAF and is located on the American River
approximately 15 miles northeast of the City of Sacramento, near the City of Folsom. Construction of the
dam was completed in 1956. It is managed by Reclamation to provide flood control, recreation, power,
water supply, Delta water quality protection, and fish flows in the American River and Delta
(Reclamation, CCWD, and WAPA, 2009). Lake Natoma is located downstream of Folsom and functions
primarily as a regulating reservoir to lessen Folsom releases.
The flood control storage volume of Folsom Lake varies from 400 to 670 TAF. The objective release to
the American River is 115,000 cfs (Reclamation, 2008). The American River downstream of Carmichael
Bluffs is part of the Sacramento River Flood Control Project. The capacity of the leveed reach upstream
of Cal Expo (RM 5) is 115,000 cfs, and downstream to the Sacramento River, the capacity is 180,000 cfs.
This document is not released as a draft EIR pursuant to CEQA Guidelines § 15087. As such, DWR is not soliciting and will not respond to commentssubmitted on this document, although any comments received will be retained and may be considered during preparation of a future draft EIR.

Chapter 9: Flood Control and Management
PRELIMINARY – SUBJECT TO CHANGENORTH-OF-THE-DELTA OFFSTREAM STORAGE PROJECT EIR/EIS 9-6 PRELIMINARY ADMINISTRATIVE DRAFT DECEMBER 2013
WBG020812033556SAC/433094 (09-FLOOD_CONTROL_PRELIM_ADMIN_DRAFT_DEC2013.DOCX)
9.2.2.6 Sacramento-San Joaquin Delta (Including Suisun, San Pablo, and San
Francisco Bays)
The Sacramento-San Joaquin Delta, located to the east of San Francisco Bay, represents the point of
discharge for the Sacramento-San Joaquin River system. Water flows out of the Delta, through Suisun
and San Pablo bays, into San Francisco Bay, and to the Pacific Ocean, creating an extensive estuary
where salty ocean water and fresh river water mix. In sum, water from over 40 percent of the State’s land
area is discharged into the Delta (Reclamation, CCWD, and WAPA, 2009).
The Delta is a complex system of levees, constructed waterways, and control facilities. The levee system
is composed entirely of local levees maintained by local interests (DWR, 2009). These levees were
initially constructed to control island flooding during high flow, but because of island subsidence, they
now have to prevent inundation during normal runoff and tidal cycles (Reclamation and DWR, 2005).
There are approximately 1,100 miles of levees providing protection to 76 islands and tracts. Construction
and operation of the CVP and SWP has decreased the frequency of levee failure due to overtopping
during flood events (Reclamation and DWR, 2005).
9.2.3 Primary Study Area
The larger streams in the Primary Study Area are Funks Creek, Stone Corral Creek, and the Colusa Basin
Drain, which are discussed below. The Colusa Basin Drain is a designated floodway according to the
Central Valley Flood Protection Board (CVFPB). The 100-year floodplain delineations for the Primary
Study Area, depicting areas subjected to flooding and areas with undetermined flood hazards1, are shown
on Figure 9-4. Areas with undetermined flood hazards include the national wildlife refuges, which are not
subject to the FEMA’s National Flood Insurance Program regulations.
9.2.3.1 Funks and Stone Corral Creeks
Funks and Stone Corral creeks are ephemeral streams that originate on the westside foothills and are
tributary to the Colusa Basin Drain. Snow pack is non-existent due to the low elevation of the watershed.
Flood runoff is generated directly from large precipitation events. This area is primarily agricultural with
rural farmsteads and small communities. The gentle sloping lands are ideal for rice production and
managed wetlands, which also contribute to large areas of inundation during flood events. Road, bridge,
railroad, and canal alignments can affect the movement of flood water in this area.
The drainage area of Funks Creek at Funks Dam is 43 square miles. Funks Reservoir is not operated for
flood control purposes. There are no stream gages on Funks Creek downstream of Funks Dam because a
historical stream gage was washed out and not replaced due to the constantly degrading channel. Peak
winter flows of approximately 2,000 cfs are common (TCCA, 2005). Because the topography and soil
composition of the watershed are similar to those of Stone Corral Creek, where stream flow records are
available, and given the comparable drainage areas of the two watersheds, it is reasonable to assume that
the 100-year discharge on Funks Creek is similar to that of Stone Corral Creek.
During a 100-year flood event, Funks Creek overflows its bank downstream of the T-C Canal and Funks
Reservoir. Flood waters flow to the north along the creek and to the south where they join with Stone Corral
Creek. Stone Corral Creek overflows its bank downstream of the town of Sites. The floodplains of both
Funks and Stone Corral creeks are intersected by the GCID Canal, which has levees along each bank.
1 Neither peak flow nor base flood elevations are available from the FEMA Flood Insurance Study. Instead, areas subject to floodingare depicted.
This document is not released as a draft EIR pursuant to CEQA Guidelines § 15087. As such, DWR is not soliciting and will not respond to commentssubmitted on this document, although any comments received will be retained and may be considered during preparation of a future draft EIR.

Chapter 9: Flood Control and Management
PRELIMINARY – SUBJECT TO CHANGEPRELIMINARY ADMINISTRATIVE DRAFT DECEMBER 2013 9-7 NORTH-OF-THE-DELTA OFFSTREAM STORAGE PROJECT EIR/EISWBG020812033556SAC/433094 (09-FLOOD_CONTROL_PRELIM_ADMIN_DRAFT_DEC2013.DOCX)
The drainage area of the Stone Corral Creek watershed is 38.2 square miles at a former gaging station
near the town of Sites. Twenty-five years of discharge measurements were collected, with interruption
from 1958 through 1985 by the U.S. Geological Survey. During that time, there were three years of zero
flow: 1972, 1976, and 1977. A maximum mean daily flow of 2,230 cfs occurred on December 24, 1983.
An instantaneous peak flow of 5,700 cfs was recorded on January 26, 1983. The 100-year peak discharge
upstream of Sutton Road (aka Cemetery Road), west of Maxwell, is 3,650 cfs, and the 100-year peak
discharge downstream of the California Northern Railroad is 3,330 cfs (FEMA, 2003).Flooding in the
town of Maxwell occurs directly from Stone Corral Creek and overland flow from Funks Creek. Both I-5
and the Union Pacific Railroad significantly impede the movement of flood flows through Maxwell.
Downstream of I-5, Funks and Stone Corral creeks combine and create a single floodplain that moves in a
southeasterly direction toward the Colusa Basin Drain.
9.2.3.2 Colusa Basin Drain
Runoff from 11 stream systems draining the foothill and valley floor watersheds contribute flow to the
Colusa Basin Drain. This natural historic drainage system for the Colusa Basin has been almost entirely
cut off from receiving floodwaters of the Sacramento River by an extensive levee system (except when
flood flows on the Sacramento River exceed 300,000 cfs near Ord Ferry). In general, the Colusa Basin
Drain conveys flood flows from November through March and agricultural irrigation and drainage flows
from April through October. Its northern half is unleveed. Beginning south of Colusa, left bank levees
extend southward to its confluence with the Sacramento River. Both Reclamation District 787 and
Reclamation District 108 pump drainage from interior lands surrounded by levees to either the
Sacramento River or the Colusa Basin Drain.
Both flood and drainage flows are regulated by the Knights Landing Outfall Gates. These gates prevent
Sacramento River water from entering the basin. The magnitude of gravity flow from the Colusa Basin
Drain is controlled by the water surface elevation in the Sacramento River and the gate openings.
The Knights Landing Ridge Cut provides flood relief to the Colusa Basin Drain by conveying flood and
drainage water to the Yolo Bypass if discharge to the river cannot occur. The Knights Landing Ridge Cut
design capacity is 20,000 cfs (DWR, 2010). The combined capacity of the Ridge Cut and the Outfall gates
are insufficient at times to carry flood flows out of the basin, resulting in backwater conditions and
inundation along the drain, especially in its lower reaches. Areas of 100-year flood inundation
(Figure 9-4) reflect the limited capacity of the Knights Landing Ridge Cut and the Colusa Basin Drain’s
100-year flood flow at SR 20 of 34,500 cfs (FEMA, 2003). These problems have been the focus of
ongoing studies by the Colusa Basin Drainage District to reduce damages to agricultural production.
9.3 Environmental Impacts/Environmental Consequences
9.3.1 Regulatory Setting
Flood hydrology and flood control are regulated at the federal, State, and local levels. Provided below is a
list of the applicable regulations. These regulations are discussed in detail in Chapter 4 Environmental
Compliance and Permit Summary of this EIR/EIS.
9.3.1.1 Federal Plans, Policies, and Regulations
Executive Order 11988 (Floodplain Management)
Clean Water Act, Section 408
This document is not released as a draft EIR pursuant to CEQA Guidelines § 15087. As such, DWR is not soliciting and will not respond to commentssubmitted on this document, although any comments received will be retained and may be considered during preparation of a future draft EIR.

Chapter 9: Flood Control and Management
PRELIMINARY – SUBJECT TO CHANGENORTH-OF-THE-DELTA OFFSTREAM STORAGE PROJECT EIR/EIS 9-8 PRELIMINARY ADMINISTRATIVE DRAFT DECEMBER 2013
WBG020812033556SAC/433094 (09-FLOOD_CONTROL_PRELIM_ADMIN_DRAFT_DEC2013.DOCX)
Federal Emergency Management Agency’s National Flood Insurance Program
Federal Emergency Management Agency Flood Zones and Flood Zone Regulations
Federal Emergency Management Agency Levee Design and Maintenance Regulations
Federal Emergency Management Agency 100-year Protection Standard
Flood Control Act of 1936
USACE Rehabilitation and Inspection Program
Operations and Maintenance Controls, Flood Control Projects
Rivers and Harbors Act of 1899
9.3.1.2 State Plans, Policies, and Regulations
Central Valley Flood Protection Board Approval
Assembly Bill 1200
FloodSAFE California Initiative
The State Plan of Flood Control Descriptive Document
Senate Bill 5
Assembly Bill 162
California Water Code Section 8609
California Water Code Division 3: Dams and Reservoirs
Sacramento-San Joaquin River Basin Comprehensive Study
Sacramento River Flood Control Project
Sacramento River Bank Protection Project
9.3.1.3 Regional and Local Plans, Policies, and Regulations
Colusa County General Plan
Glenn County General Plan
Colusa County Code, Chapter 33: Flood Damage Prevention
Colusa County Flood Control and Conservation District
Colusa County Floodplain Administrator
9.3.2 Evaluation Criteria and Significance Thresholds
Significance criteria represent the thresholds that were used to identify whether an impact would be
significant. Appendix G of the CEQA Guidelines suggests the following evaluation criteria for flood
control and management:
Would the Project:
Substantially alter the existing drainage pattern of the site or area, including through the alteration of
the course of a stream or river, in a manner which would result in substantial erosion or siltation on-
or off-site?
Place within a 100-year flood hazard area structures which would impede or redirect flood flows?
Expose people or structures to a significant risk of loss, injury or death involving flooding, including
flooding as a result of the failure of a levee or dam?
Create or contribute runoff water which would exceed the capacity of existing or planned stormwater
drainage systems or provide substantial additional sources of polluted runoff?
This document is not released as a draft EIR pursuant to CEQA Guidelines § 15087. As such, DWR is not soliciting and will not respond to commentssubmitted on this document, although any comments received will be retained and may be considered during preparation of a future draft EIR.

Chapter 9: Flood Control and Management
PRELIMINARY – SUBJECT TO CHANGEPRELIMINARY ADMINISTRATIVE DRAFT DECEMBER 2013 9-9 NORTH-OF-THE-DELTA OFFSTREAM STORAGE PROJECT EIR/EISWBG020812033556SAC/433094 (09-FLOOD_CONTROL_PRELIM_ADMIN_DRAFT_DEC2013.DOCX)
Place housing within a 100-year flood hazard area as mapped on a federal Flood Hazard Boundary or
Flood Insurance Rate Map or other flood hazard delineation map?
The evaluation criteria used for this impact analysis represent a combination of the Appendix G criteria
and professional judgment that considers current regulations, standards, and/or consultation with
agencies, knowledge of the area, and the context and intensity of the environmental effects, as required
pursuant to NEPA. For the purposes of this analysis, an alternative would result in a significant impact if
it would result in any of the following:
Substantially alter the existing drainage pattern of the site or area, including through the alteration of
the course of a stream or river, in a manner which would result in substantial erosion or siltation on-
or off-site?
Place within a 100-year flood hazard area structures which would impede or redirect flood flows?
Expose people or structures to a significant risk of loss, injury or death involving flooding, including
flooding as a result of the failure of a levee or dam?
9.3.3 Impact Assessment Assumptions and Methodology
9.3.3.1 Assumptions
The following assumptions were made regarding Project-related construction, operation, and maintenance
impacts to flood control and management:
Direct Project-related construction, operation, and maintenance activities would occur in the Primary
Study Area.
Direct Project-related operational effects would occur in the Secondary Study Area.
The only direct Project-related construction activity that would occur in the Secondary Study Area is
the installation of an additional pump into an existing bay at the Red Bluff Pumping Plant.
The only direct Project-related maintenance activity that would occur in the Secondary Study Area is
the sediment removal and disposal at the two intake locations (i.e., GCID Canal Intake and Red Bluff
Pumping Plant).
No direct Project-related construction or maintenance activities would occur in the Extended Study Area.
Direct Project-related operational effects that would occur in the Extended Study Area are related to
San Luis Reservoir operation; increased reliability of water supply to agricultural, municipal, and
industrial water users; and the provision of an alternate Level 4 wildlife refuge water supply. Indirect
effects to the operation of certain facilities that are located in the Extended Study Area, and indirect
effects to the consequent water deliveries made by those facilities, would occur as a result of
implementing the alternatives.
The existing bank protection located upstream of the proposed Delevan Pipeline Intake/Discharge
facilities would continue to be maintained and remain functional.
No additional channel stabilization, grade control measures, or dredging in the Sacramento River at or
upstream of the Delevan Pipeline Intake or Discharge Facilities would be required.
This document is not released as a draft EIR pursuant to CEQA Guidelines § 15087. As such, DWR is not soliciting and will not respond to commentssubmitted on this document, although any comments received will be retained and may be considered during preparation of a future draft EIR.

Chapter 9: Flood Control and Management
PRELIMINARY – SUBJECT TO CHANGENORTH-OF-THE-DELTA OFFSTREAM STORAGE PROJECT EIR/EIS 9-10 PRELIMINARY ADMINISTRATIVE DRAFT DECEMBER 2013
WBG020812033556SAC/433094 (09-FLOOD_CONTROL_PRELIM_ADMIN_DRAFT_DEC2013.DOCX)
All dams would be designed to be resistant to various failure modes. Dam safety at both Golden Gate
and Sites dams would be monitored by instrumentation, measuring such parameters as seepage,
settlement and earthquake-induced accelerations.
Sites Reservoir would be designed to safely store the Probable Maximum Flood (PMF) without
overtopping the dam. For both reservoir size options (i.e., 1.27-MAF and 1.81-MAF) included in the
alternatives, the design includes a storage buffer more than 2.5 times larger than required to hold the
PMF estimated inflow.
All three proposed reservoirs (Sites, Holthouse, and TRR) would be designed with emergency
spillways to prevent overtopping the dams.
Sites Reservoir, given its proposed storage capacity, would be designed for a required maximum
emergency drawdown release of 23,000 cfs, which would be released through the inlet/outlet works
to quickly drain the reservoir, if needed. In addition, the Holthouse Reservoir design would require a
spillway sufficient to pass the required Sites Reservoir maximum emergency drawdown release flow
of 23,000 cfs.
9.3.3.2 Methodology
The SWP and CVP operations model (water resources simulation model known as CALSIM II) was used to
simulate CVP and SWP operations to determine the surface water flows, storages, and deliveries associated
with the baseline (i.e., Existing Conditions), No Project/No Action Alternative, and the three action
alternatives (Alternatives A, B, and C). A detailed description of the assumptions used for modeling the
baselines and the alternatives is included in Appendix 6A. The water resources system models used are
described in Appendix 6B. The CALSIM II model was used to simulate system operations for an 82-year
period using a monthly time-step. The model included assumptions regarding facilities, land use, water supply
contracts, and regulatory requirements for Existing Conditions and the No Project/No Action Alternative. The
historical 82-year flow record (1922 to 2003), adjusted for the influences of land use changes and upstream
flow regulation, was used to represent the possible range of water supply conditions. Major Central Valley
rivers, reservoirs, and CVP/SWP facilities were represented by a network of arcs and nodes. CALSIM II used
a mass balance approach to route water through this network. Simulated flows represented mean flows for the
month; reservoir storage volumes corresponded to end-of-month storage.
CALSIM II modeled a complex and extensive set of regulatory standards and operations criteria.
Descriptions of the modeling assumptions are contained in Appendix 6A. The analysis conducted used
the best available tools to approximate systemwide changes in storage, flow, salinity, and reservoir
system reoperation associated with the alternatives.
CALSIM II modeling followed all flood control operations rules for existing reservoirs and flood
management facilities (i.e., encroachments into the flood control space of existing reservoirs was not
allowed). However, CALSIM II’s predictive capability is limited and cannot readily be applied to
analyzing flood flows and hourly, daily, or weekly time steps for hydrologic conditions. Changes to the
extents of the Sacramento River 100-year floodplain cannot be determined fully without operation criteria
and model output for hourly, daily, or weekly time steps for hydrologic conditions. CALSIM II uses a
monthly time step, which is inappropriate for flood control analysis. Thus, CALSIM II was not used to
evaluate changes to the Sacramento River 100-year floodplain.
This document is not released as a draft EIR pursuant to CEQA Guidelines § 15087. As such, DWR is not soliciting and will not respond to commentssubmitted on this document, although any comments received will be retained and may be considered during preparation of a future draft EIR.
Chapter 9: Flood Control and Management
PRELIMINARY – SUBJECT TO CHANGEPRELIMINARY ADMINISTRATIVE DRAFT DECEMBER 2013 9-11 NORTH-OF-THE-DELTA OFFSTREAM STORAGE PROJECT EIR/EISWBG020812033556SAC/433094 (09-FLOOD_CONTROL_PRELIM_ADMIN_DRAFT_DEC2013.DOCX)
Of the five large reservoirs in the Secondary Study Area included in the CALSIM II operations modeling,
only Shasta, Oroville, and Folsom reservoirs are operated officially with flood control as a primary objective.
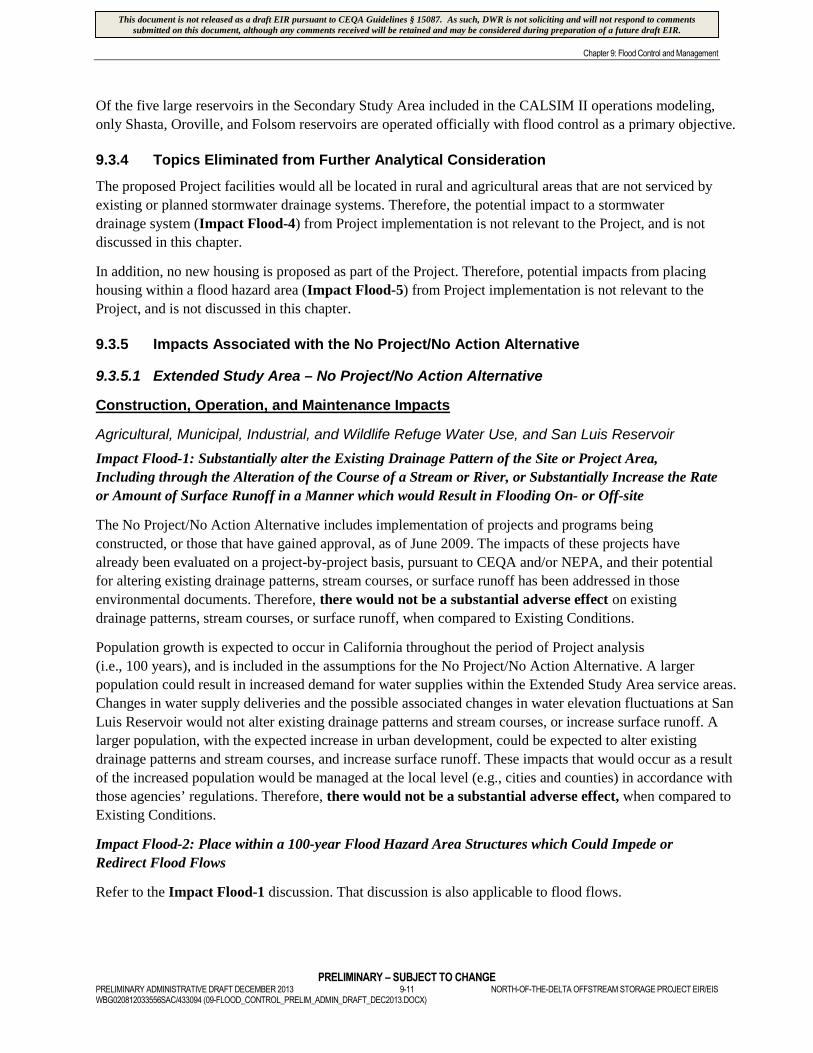
9.3.4 Topics Eliminated from Further Analytical Consideration
The proposed Project facilities would all be located in rural and agricultural areas that are not serviced by
existing or planned stormwater drainage systems. Therefore, the potential impact to a stormwater
drainage system (Impact Flood-4) from Project implementation is not relevant to the Project, and is not
discussed in this chapter.
In addition, no new housing is proposed as part of the Project. Therefore, potential impacts from placing
housing within a flood hazard area (Impact Flood-5) from Project implementation is not relevant to the
Project, and is not discussed in this chapter.
9.3.5 Impacts Associated with the No Project/No Action Alternative
9.3.5.1 Extended Study Area – No Project/No Action Alternative
Construction, Operation, and Maintenance Impacts
Agricultural, Municipal, Industrial, and Wildlife Refuge Water Use, and San Luis Reservoir
Impact Flood-1: Substantially alter the Existing Drainage Pattern of the Site or Project Area,
Including through the Alteration of the Course of a Stream or River, or Substantially Increase the Rate
or Amount of Surface Runoff in a Manner which would Result in Flooding On- or Off-site
The No Project/No Action Alternative includes implementation of projects and programs being
constructed, or those that have gained approval, as of June 2009. The impacts of these projects have
already been evaluated on a project-by-project basis, pursuant to CEQA and/or NEPA, and their potential
for altering existing drainage patterns, stream courses, or surface runoff has been addressed in those
environmental documents. Therefore, there would not be a substantial adverse effect on existing
drainage patterns, stream courses, or surface runoff, when compared to Existing Conditions.
Population growth is expected to occur in California throughout the period of Project analysis
(i.e., 100 years), and is included in the assumptions for the No Project/No Action Alternative. A larger
population could result in increased demand for water supplies within the Extended Study Area service areas.
Changes in water supply deliveries and the possible associated changes in water elevation fluctuations at San
Luis Reservoir would not alter existing drainage patterns and stream courses, or increase surface runoff. A
larger population, with the expected increase in urban development, could be expected to alter existing
drainage patterns and stream courses, and increase surface runoff. These impacts that would occur as a result
of the increased population would be managed at the local level (e.g., cities and counties) in accordance with
those agencies’ regulations. Therefore, there would not be a substantial adverse effect, when compared to
Existing Conditions.
Impact Flood-2: Place within a 100-year Flood Hazard Area Structures which Could Impede or
Redirect Flood Flows
Refer to the Impact Flood-1 discussion. That discussion is also applicable to flood flows.
This document is not released as a draft EIR pursuant to CEQA Guidelines § 15087. As such, DWR is not soliciting and will not respond to commentssubmitted on this document, although any comments received will be retained and may be considered during preparation of a future draft EIR.
Chapter 9: Flood Control and Management
PRELIMINARY – SUBJECT TO CHANGENORTH-OF-THE-DELTA OFFSTREAM STORAGE PROJECT EIR/EIS 9-12 PRELIMINARY ADMINISTRATIVE DRAFT DECEMBER 2013
WBG020812033556SAC/433094 (09-FLOOD_CONTROL_PRELIM_ADMIN_DRAFT_DEC2013.DOCX)
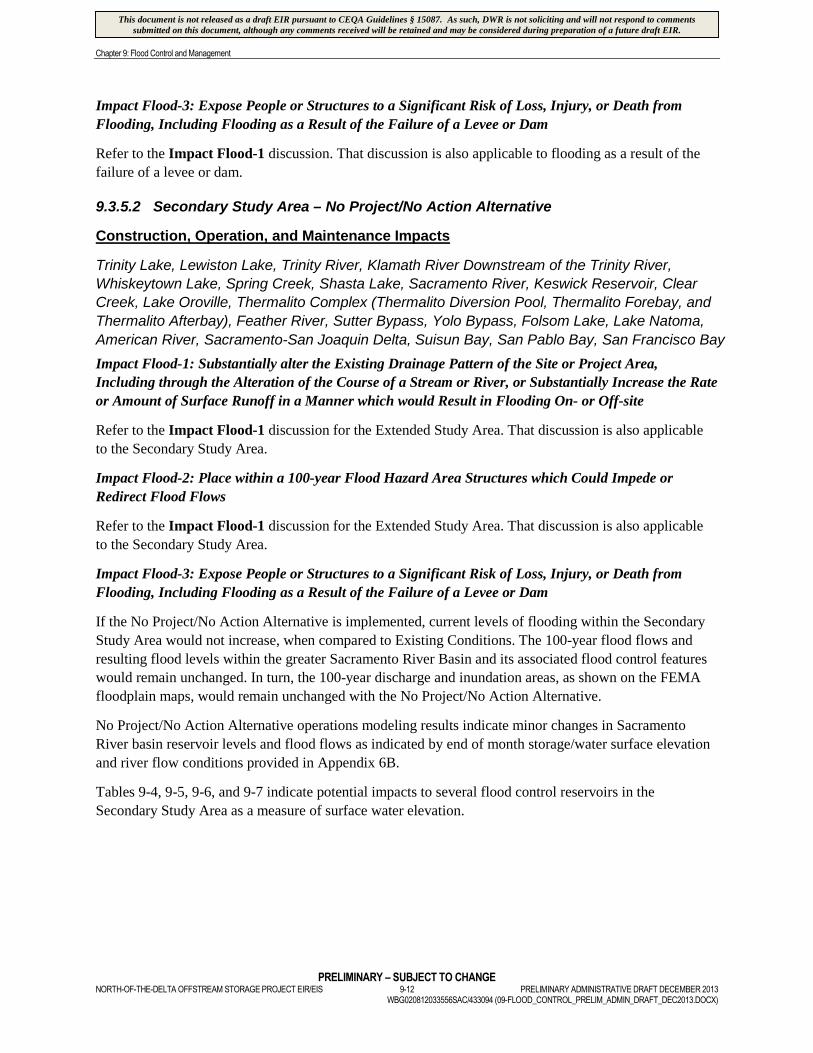
Impact Flood-3: Expose People or Structures to a Significant Risk of Loss, Injury, or Death from
Flooding, Including Flooding as a Result of the Failure of a Levee or Dam
Refer to the Impact Flood-1 discussion. That discussion is also applicable to flooding as a result of the
failure of a levee or dam.
9.3.5.2 Secondary Study Area – No Project/No Action Alternative
Construction, Operation, and Maintenance Impacts
Trinity Lake, Lewiston Lake, Trinity River, Klamath River Downstream of the Trinity River,
Whiskeytown Lake, Spring Creek, Shasta Lake, Sacramento River, Keswick Reservoir, Clear
Creek, Lake Oroville, Thermalito Complex (Thermalito Diversion Pool, Thermalito Forebay, and
Thermalito Afterbay), Feather River, Sutter Bypass, Yolo Bypass, Folsom Lake, Lake Natoma,
American River, Sacramento-San Joaquin Delta, Suisun Bay, San Pablo Bay, San Francisco Bay
Impact Flood-1: Substantially alter the Existing Drainage Pattern of the Site or Project Area,
Including through the Alteration of the Course of a Stream or River, or Substantially Increase the Rate
or Amount of Surface Runoff in a Manner which would Result in Flooding On- or Off-site
Refer to the Impact Flood-1 discussion for the Extended Study Area. That discussion is also applicable
to the Secondary Study Area.
Impact Flood-2: Place within a 100-year Flood Hazard Area Structures which Could Impede or
Redirect Flood Flows
Refer to the Impact Flood-1 discussion for the Extended Study Area. That discussion is also applicable
to the Secondary Study Area.
Impact Flood-3: Expose People or Structures to a Significant Risk of Loss, Injury, or Death from
Flooding, Including Flooding as a Result of the Failure of a Levee or Dam
If the No Project/No Action Alternative is implemented, current levels of flooding within the Secondary
Study Area would not increase, when compared to Existing Conditions. The 100-year flood flows and
resulting flood levels within the greater Sacramento River Basin and its associated flood control features
would remain unchanged. In turn, the 100-year discharge and inundation areas, as shown on the FEMA
floodplain maps, would remain unchanged with the No Project/No Action Alternative.
No Project/No Action Alternative operations modeling results indicate minor changes in Sacramento
River basin reservoir levels and flood flows as indicated by end of month storage/water surface elevation
and river flow conditions provided in Appendix 6B.
Tables 9-4, 9-5, 9-6, and 9-7 indicate potential impacts to several flood control reservoirs in the
Secondary Study Area as a measure of surface water elevation.
This document is not released as a draft EIR pursuant to CEQA Guidelines § 15087. As such, DWR is not soliciting and will not respond to commentssubmitted on this document, although any comments received will be retained and may be considered during preparation of a future draft EIR.

Chapter 9: Flood Control and Management
PRELIMINARY – SUBJECT TO CHANGEPRELIMINARY ADMINISTRATIVE DRAFT DECEMBER 2013 9-13 NORTH-OF-THE-DELTA OFFSTREAM STORAGE PROJECT EIR/EISWBG020812033556SAC/433094 (09-FLOOD_CONTROL_PRELIM_ADMIN_DRAFT_DEC2013.DOCX)
Table 9-4Shasta Lake End of Month Elevation Long-Term Average and Average by Water Year Type for the
No Project/No Action Alternative when Compared to Existing Conditions
Analysis Period
End of Month Elevation (Feet)
Oct Nov Dec Jan Feb Mar Apr May Jun Jul Aug Sep
Long-Term
Full Simulation Perioda
Existing Condition 980 979 987 1,001 1,015 1,030 1,041 1,042 1,030 1,008 993 984
No Project/No ActionAlternative
980 980 988 1,002 1,015 1,030 1,042 1,042 1,029 1,008 992 984
Difference 0 0 1 0 0 0 0 0 0 0 0 -1
PercentDifference(%)b
0.0 0.0 0.1 0.0 0.0 0.0 0.0 0.0 0.0 0.0 0.0 -0.1
Water Year Typesc
Wet (32%)
Existing Condition 1,009 1,004 1,010 1,024 1,033 1,042 1,059 1,064 1,057 1,042 1,029 1,013
No Project/No ActionAlternative
1,008 1,003 1,010 1,024 1,033 1,042 1,059 1,064 1,057 1,042 1,029 1,012
Difference -1 -1 0 0 0 0 0 0 0 -1 0 -2
Percent Difference(%)
-0.1 -0.1 0.0 0.0 0.0 0.0 0.0 0.0 0.0 -0.1 0.0 -0.2
Above Normal (15%)
Existing Condition 1,006 1,002 1,010 1,011 1,024 1,046 1,062 1,064 1,052 1,030 1,016 1,010
No Project/No ActionAlternative
1,004 1,001 1,009 1,010 1,023 1,045 1,062 1,064 1,051 1,030 1,015 1,008
Difference -2 -1 -1 -1 -1 0 0 0 0 -1 -1 -2
Percent Difference(%)
-0.2 -0.1 -0.1 -0.1 -0.1 0.0 0.0 0.0 0.0 -0.1 -0.1 -0.2
aBased on the 82-year simulation period.bRelative difference of the monthly average.cAs defined by the Sacramento Valley 40-30-30 Index Water Year Hydrologic Classification (SWRCB, 1999).
Table 9-5Trinity Lake End of Month Elevation, Long-Term Average and Average by Water Year Type for the
No Project/No Action Alternative when Compared to Existing Conditions
Analysis Period
End of Month Elevation (Feet)
Oct Nov Dec Jan Feb Mar Apr May Jun Jul Aug Sep
Long-Term
Full Simulation Perioda
Percent Difference (%)b 0.0 0.0 0.0 0.0 0.0 0.0 0.0 0.0 0.0 0.0 0.0 0.0
Water Year Typesc
Wet (32%)
Percent Difference (%) 0.0 0.0 0.0 0.0 0.0 0.0 0.0 0.0 0.0 0.0 0.0 0.0
Above Normal (15%)
Percent Difference (%) 0.0 0.0 0.0 0.0 0.0 0.0 0.0 0.0 0.0 0.0 0.0 -0.1
aBased on the 82-year simulation period.bRelative difference of the monthly average.cAs defined by the Sacramento Valley 40-30-30 Index Water Year Hydrologic Classification (SWRCB, 1999).
This document is not released as a draft EIR pursuant to CEQA Guidelines § 15087. As such, DWR is not soliciting and will not respond to commentssubmitted on this document, although any comments received will be retained and may be considered during preparation of a future draft EIR.
Chapter 9: Flood Control and Management
PRELIMINARY – SUBJECT TO CHANGENORTH-OF-THE-DELTA OFFSTREAM STORAGE PROJECT EIR/EIS 9-14 PRELIMINARY ADMINISTRATIVE DRAFT DECEMBER 2013
WBG020812033556SAC/433094 (09-FLOOD_CONTROL_PRELIM_ADMIN_DRAFT_DEC2013.DOCX)
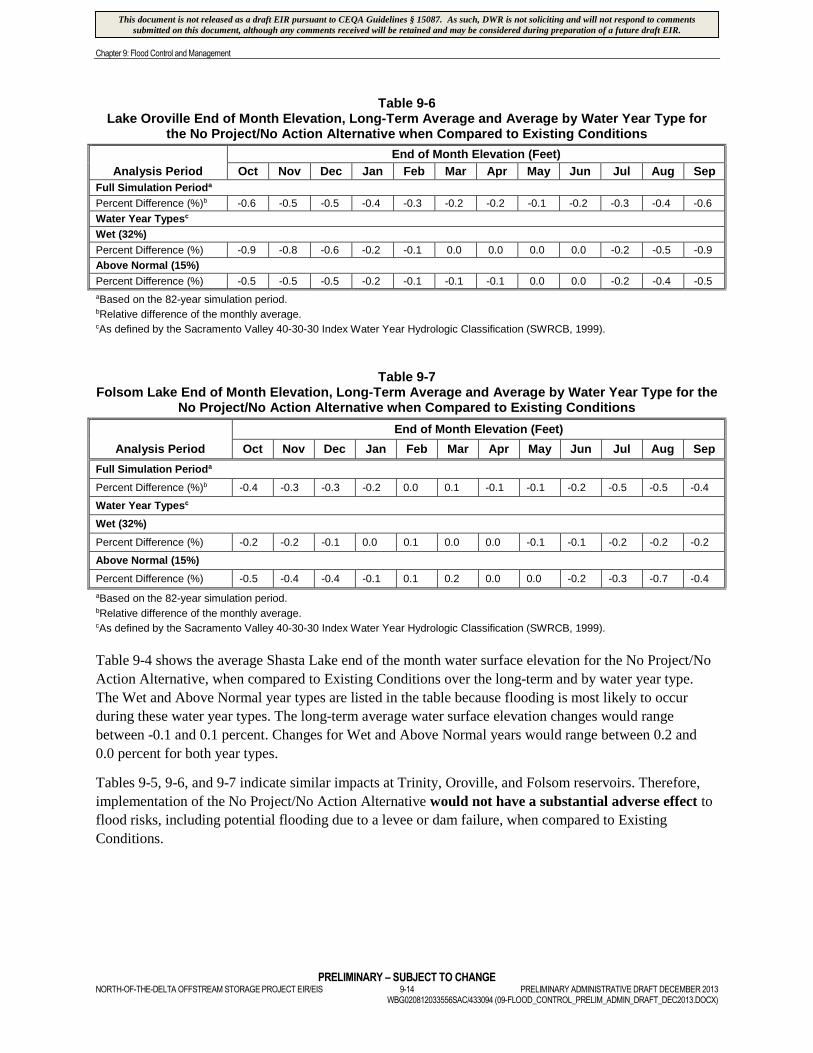
Table 9-6Lake Oroville End of Month Elevation, Long-Term Average and Average by Water Year Type for
the No Project/No Action Alternative when Compared to Existing Conditions
Analysis Period
End of Month Elevation (Feet)
Oct Nov Dec Jan Feb Mar Apr May Jun Jul Aug Sep
Full Simulation Perioda
Percent Difference (%)b -0.6 -0.5 -0.5 -0.4 -0.3 -0.2 -0.2 -0.1 -0.2 -0.3 -0.4 -0.6
Water Year Typesc
Wet (32%)
Percent Difference (%) -0.9 -0.8 -0.6 -0.2 -0.1 0.0 0.0 0.0 0.0 -0.2 -0.5 -0.9
Above Normal (15%)
Percent Difference (%) -0.5 -0.5 -0.5 -0.2 -0.1 -0.1 -0.1 0.0 0.0 -0.2 -0.4 -0.5
aBased on the 82-year simulation period.bRelative difference of the monthly average.cAs defined by the Sacramento Valley 40-30-30 Index Water Year Hydrologic Classification (SWRCB, 1999).
Table 9-7Folsom Lake End of Month Elevation, Long-Term Average and Average by Water Year Type for the
No Project/No Action Alternative when Compared to Existing Conditions
Analysis Period
End of Month Elevation (Feet)
Oct Nov Dec Jan Feb Mar Apr May Jun Jul Aug Sep
Full Simulation Perioda
Percent Difference (%)b -0.4 -0.3 -0.3 -0.2 0.0 0.1 -0.1 -0.1 -0.2 -0.5 -0.5 -0.4
Water Year Typesc
Wet (32%)
Percent Difference (%) -0.2 -0.2 -0.1 0.0 0.1 0.0 0.0 -0.1 -0.1 -0.2 -0.2 -0.2
Above Normal (15%)
Percent Difference (%) -0.5 -0.4 -0.4 -0.1 0.1 0.2 0.0 0.0 -0.2 -0.3 -0.7 -0.4
aBased on the 82-year simulation period.bRelative difference of the monthly average.cAs defined by the Sacramento Valley 40-30-30 Index Water Year Hydrologic Classification (SWRCB, 1999).
Table 9-4 shows the average Shasta Lake end of the month water surface elevation for the No Project/No
Action Alternative, when compared to Existing Conditions over the long-term and by water year type.
The Wet and Above Normal year types are listed in the table because flooding is most likely to occur
during these water year types. The long-term average water surface elevation changes would range
between -0.1 and 0.1 percent. Changes for Wet and Above Normal years would range between 0.2 and
0.0 percent for both year types.
Tables 9-5, 9-6, and 9-7 indicate similar impacts at Trinity, Oroville, and Folsom reservoirs. Therefore,
implementation of the No Project/No Action Alternative would not have a substantial adverse effect to
flood risks, including potential flooding due to a levee or dam failure, when compared to Existing
Conditions.
This document is not released as a draft EIR pursuant to CEQA Guidelines § 15087. As such, DWR is not soliciting and will not respond to commentssubmitted on this document, although any comments received will be retained and may be considered during preparation of a future draft EIR.
Chapter 9: Flood Control and Management
PRELIMINARY – SUBJECT TO CHANGEPRELIMINARY ADMINISTRATIVE DRAFT DECEMBER 2013 9-15 NORTH-OF-THE-DELTA OFFSTREAM STORAGE PROJECT EIR/EISWBG020812033556SAC/433094 (09-FLOOD_CONTROL_PRELIM_ADMIN_DRAFT_DEC2013.DOCX)
9.3.5.3 Primary Study Area – No Project/No Action Alternative
Construction, Operation, and Maintenance Impacts
Impact Flood-1: Substantially alter the Existing Drainage Pattern of the Site or Project Area,
Including through the Alteration of the Course of a Stream or River, or Substantially Increase the Rate
or Amount of Surface Runoff in a Manner which would Result in Flooding On- or Off-site
Projects considered within the No Project/No Action Alternative are not located within the Primary Study
Area. In addition, none of the proposed Project facilities would be constructed if this alternative is
implemented. Local hydrology and drainage within the Primary Study Area would, therefore, be expected
to remain substantially the same. Implementation of the No Project/No Action Alternative would not
have a substantial adverse effect on existing drainage patterns, stream courses, or surface runoff, when
compared to Existing Conditions.
Impact Flood-2: Place within a 100-year Flood Hazard Area Structures which Could Impede or
Redirect Flood Flows
Refer to the Impact Flood-1 discussion. That discussion is also applicable to the Primary Study Area.
Impact Flood-3: Expose People or Structures to a Significant Risk of Loss, Injury, or Death from
Flooding, Including Flooding as a Result of the Failure of a Levee or Dam
Refer to the Flood-1 discussion. All existing facilities would be subject to current levels of flooding. The
100-year flood flows and resulting levels for Funks and Stone Corral creeks and the Colusa Basin Drain
would remain unchanged. The 100-year discharge and inundation as shown on the FEMA floodplain
maps would also likely remain unchanged with the No Project/No Action Alternative. Therefore,
implementation of the No Project/No Action Alternative would not have a substantial adverse effect on
flood risks, including potential flooding due to a levee or dam failure, when compared to Existing
Conditions.
9.3.6 Impacts Associated with Alternative A
9.3.6.1 Extended Study Area – Alternative A
Construction, Operation, and Maintenance Impacts
Agricultural, Municipal, Industrial, and Wildlife Refuge Water Use, and San Luis Reservoir
Impact Flood-1: Substantially alter the Existing Drainage Pattern of the Site or Project Area,
Including through the Alteration of the Course of a Stream or River, or Substantially Increase the Rate
or Amount of Surface Runoff in a Manner which would Result in Flooding On- or Off-site
There would be no direct Project-related construction or maintenance occurring within the CVP and SWP
service areas of the Extended Study Area; therefore, no Project-related flooding would occur, resulting in
no impact in the Extended Study Area, when compared to Existing Conditions and the No Project/No
Action Alternative.
If Alternative A is implemented, changes in SWP and CVP service area water supply deliveries and
surface water elevation fluctuations at San Luis Reservoir would not alter existing drainage patterns,
stream courses, or surface runoff within the Extended Study Area. Therefore, operation of Alternative A
This document is not released as a draft EIR pursuant to CEQA Guidelines § 15087. As such, DWR is not soliciting and will not respond to commentssubmitted on this document, although any comments received will be retained and may be considered during preparation of a future draft EIR.

Chapter 9: Flood Control and Management
PRELIMINARY – SUBJECT TO CHANGENORTH-OF-THE-DELTA OFFSTREAM STORAGE PROJECT EIR/EIS 9-16 PRELIMINARY ADMINISTRATIVE DRAFT DECEMBER 2013
WBG020812033556SAC/433094 (09-FLOOD_CONTROL_PRELIM_ADMIN_DRAFT_DEC2013.DOCX)
would result in no impact on existing drainage patterns, stream courses, or surface runoff within the
Extended Study Area, when compared to Existing Conditions and the No Project/No Action Alternative.
Impact Flood-2: Place within a 100-year Flood Hazard Area Structures which Could Impede or
Redirect Flood Flows
If Alternative A is implemented, no new Project-related structures would be constructed within the
Extended Study Area, thus no 100-year flood flows would be impeded or redirected by their placement.
Therefore, operation of Alternative A would result in no impact on 100-year flood flows within the
Extended Study Area, when compared to Existing Conditions and the No Project/No Action Alternative.
Impact Flood-3: Expose People or Structures to a Significant Risk of Loss, Injury, or Death from
Flooding, Including Flooding as a Result of the Failure of a Levee or Dam
San Luis Reservoir is operated entirely as a joint CVP and SWP supply storage reservoir and is not
operated for flood control purposes. If Alternative A is implemented, water level fluctuations that would
occur at San Luis Reservoir would fall within the historic range of operation and would not expose people
or structures to any additional flooding risks related to dam failure. Thus, operation of Alternative A
would result in no impact due to increased flooding risks, including potential flooding due a levee or dam
failure, within the Extended Study Area, when compared to Existing Conditions and the No Project/No
Action Alternative.
9.3.6.2 Secondary Study Area - Alternative A
Construction, Operation, and Maintenance Impacts
Trinity Lake, Lewiston Lake, Trinity River, Klamath River Downstream of the Trinity River,
Whiskeytown Lake, Spring Creek, Shasta Lake, Sacramento River, Keswick Reservoir, Clear
Creek, Lake Oroville, Thermalito Complex (Thermalito Diversion Pool, Thermalito Forebay, and
Thermalito Afterbay), Feather River, Sutter Bypass, Yolo Bypass, Folsom Lake, Lake Natoma,
American River, Sacramento-San Joaquin Delta, Suisun Bay, San Pablo Bay, San Francisco Bay
Impact Flood-1: Substantially alter the Existing Drainage Pattern of the Site or Project Area,
Including through the Alteration of the Course of a Stream or River, or Substantially Increase the Rate
or Amount of Surface Runoff in a Manner which would Result in Flooding On- or Off-site
If Alternative A is implemented, no direct Project-related construction would occur at any of the
above-listed facilities or areas within the Secondary Study Area other than the installation of one
additional pump into an existing bay at the Red Bluff Pumping Plant. The additional pump would not
alter the existing drainage pattern of the site, alter a stream course, or increase the amount of surface
runoff. Therefore, the installation of a pump at the existing Red Bluff Pumping Plant would result in no
impact on existing drainage patterns, stream courses, or surface runoff within the Secondary Study Area,
when compared to Existing Conditions and the No Project/No Action Alternative.
Impact Flood-2: Place within a 100-year Flood Hazard Area Structures which Could Impede or
Redirect Flood Flows
If Alternative A is implemented, a new pump at the Red Bluff Pumping Plant would be installed in an
existing pump bay. It would not impede or redirect 100-year flood flows. Therefore, construction,
operation, and maintenance of Alternative A would result in no impact on 100-year flood flows within the
Secondary Study Area, when compared to Existing Conditions and the No Project/No Action Alternative.
This document is not released as a draft EIR pursuant to CEQA Guidelines § 15087. As such, DWR is not soliciting and will not respond to commentssubmitted on this document, although any comments received will be retained and may be considered during preparation of a future draft EIR.

Chapter 9: Flood Control and Management
PRELIMINARY – SUBJECT TO CHANGEPRELIMINARY ADMINISTRATIVE DRAFT DECEMBER 2013 9-17 NORTH-OF-THE-DELTA OFFSTREAM STORAGE PROJECT EIR/EISWBG020812033556SAC/433094 (09-FLOOD_CONTROL_PRELIM_ADMIN_DRAFT_DEC2013.DOCX)
Impact Flood-3: Expose People or Structures to a Significant Risk of Loss, Injury, or Death from
Flooding, Including Flooding as a Result of the Failure of a Levee or Dam
If Alternative A is implemented, the additional pump at the Red Bluff Pumping Plant would be installed
in an existing bay and would not modify any existing levees. Therefore, installation of the additional
pump would have no effect on existing dams or levees within the Secondary Study Area. When compared
to Existing Conditions and the No Project/No Action Alternative, construction, operation and
maintenance of Alternative A would result in no impact due to increased flooding risks, including
potential flooding due a levee or dam failure.
Tables 9-8 through 9-15 indicate potential minor operational impacts to several flood control reservoirs in the
Secondary Study Area if Alternative A is implemented as a measure of average surface water elevation.
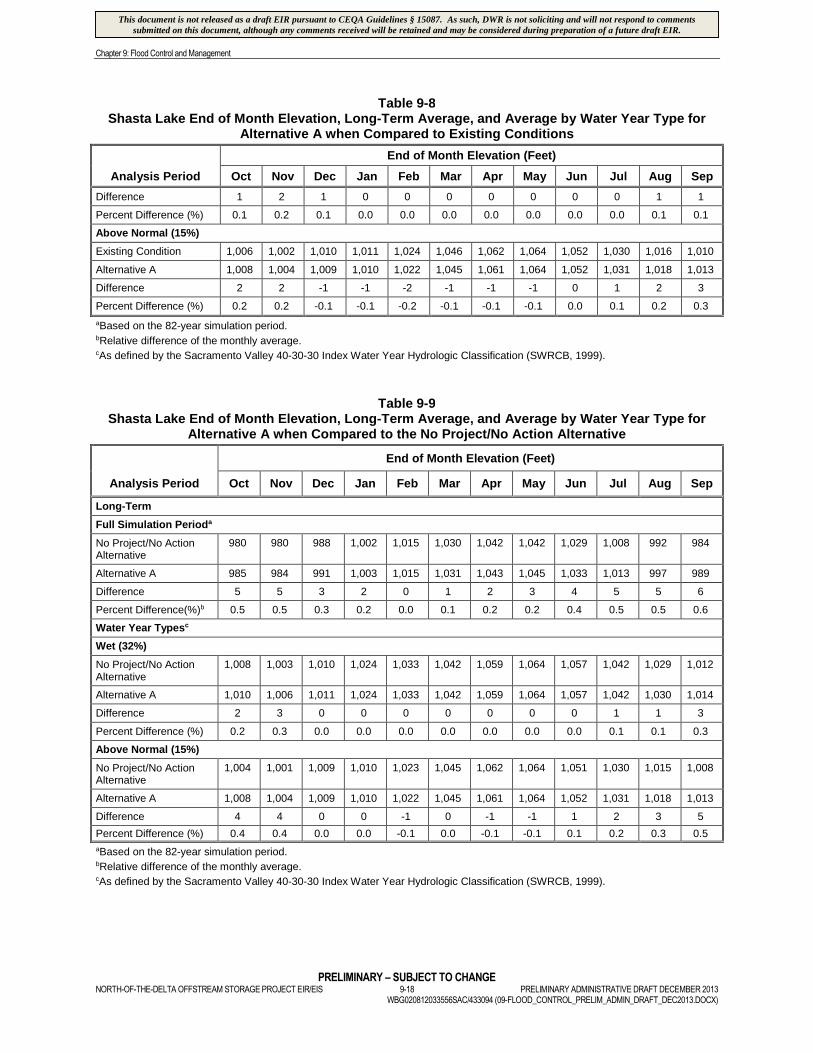
Table 9-8 shows the average Shasta Lake end of the month water surface elevation for Alternative A,
when compared to Existing Conditions over the long-term and by water year type. The Wet and Above
Normal year types are shown because flooding is most likely to occur during these water year types.
Long-term average water surface elevation changes would range between 0.1 and 0.6 percent. Changes
during Wet years would range between 0.0 and 0.2 percent, and changes during Above Normal years
would range between -0.2 and 0.3 percent.
Table 9-9 shows the same information for Shasta Lake, when compared to the No Project/No Action
Alternative. Long-term average water surface elevation changes would range between 0.0 and
0.6 percent. Wet year changes would range between 0.0 and 0.3 percent, and Above Normal year changes
would range between -0.1 and 0.5 percent.
Tables 9-10 through 9-15 indicate similar impacts at Trinity, Oroville, and Folsom reservoirs.
As indicated by the water surface elevation data, coordinated operation with Sites Reservoir would not
increase flood risks due to significantly higher water surface elevations in flood control reservoirs in the
Secondary Study Area during Wet and Above Normal water year types. Therefore, compared to both
Existing Conditions and the No Project/No Action Alternative, construction, operation and maintenance
of Alternative A would result in a less-than-significant impact due to increased flooding risks, including
potential flooding due a levee or dam failure, within the Secondary Study Area.
Table 9-8Shasta Lake End of Month Elevation, Long-Term Average, and Average by Water Year Type for
Alternative A when Compared to Existing Conditions
Analysis Period
End of Month Elevation (Feet)
Oct Nov Dec Jan Feb Mar Apr May Jun Jul Aug Sep
Long-Term
Full Simulation Perioda
Existing Condition 980 979 987 1,001 1,015 1,030 1,041 1,042 1,030 1,008 993 984
Alternative A 985 984 991 1,003 1,015 1,031 1,043 1,045 1,033 1,013 997 989
Difference 5 5 3 2 1 1 2 3 4 4 5 5
Percent Difference (%)b 0.5 0.5 0.3 0.2 0.1 0.1 0.2 0.3 0.4 0.4 0.5 0.5
Water Year Typesc
Wet (32%)
Existing Condition 1,009 1,004 1,010 1,024 1,033 1,042 1,059 1,064 1,057 1,042 1,029 1,013
Alternative A 1,010 1,006 1,011 1,024 1,033 1,042 1,059 1,064 1,057 1,042 1,030 1,014
This document is not released as a draft EIR pursuant to CEQA Guidelines § 15087. As such, DWR is not soliciting and will not respond to commentssubmitted on this document, although any comments received will be retained and may be considered during preparation of a future draft EIR.
Chapter 9: Flood Control and Management
PRELIMINARY – SUBJECT TO CHANGENORTH-OF-THE-DELTA OFFSTREAM STORAGE PROJECT EIR/EIS 9-18 PRELIMINARY ADMINISTRATIVE DRAFT DECEMBER 2013
WBG020812033556SAC/433094 (09-FLOOD_CONTROL_PRELIM_ADMIN_DRAFT_DEC2013.DOCX)
Table 9-8Shasta Lake End of Month Elevation, Long-Term Average, and Average by Water Year Type for
Alternative A when Compared to Existing Conditions
Analysis Period
End of Month Elevation (Feet)
Oct Nov Dec Jan Feb Mar Apr May Jun Jul Aug Sep
Difference 1 2 1 0 0 0 0 0 0 0 1 1
Percent Difference (%) 0.1 0.2 0.1 0.0 0.0 0.0 0.0 0.0 0.0 0.0 0.1 0.1
Above Normal (15%)
Existing Condition 1,006 1,002 1,010 1,011 1,024 1,046 1,062 1,064 1,052 1,030 1,016 1,010
Alternative A 1,008 1,004 1,009 1,010 1,022 1,045 1,061 1,064 1,052 1,031 1,018 1,013
Difference 2 2 -1 -1 -2 -1 -1 -1 0 1 2 3
Percent Difference (%) 0.2 0.2 -0.1 -0.1 -0.2 -0.1 -0.1 -0.1 0.0 0.1 0.2 0.3
aBased on the 82-year simulation period.bRelative difference of the monthly average.cAs defined by the Sacramento Valley 40-30-30 Index Water Year Hydrologic Classification (SWRCB, 1999).
Table 9-9Shasta Lake End of Month Elevation, Long-Term Average, and Average by Water Year Type for
Alternative A when Compared to the No Project/No Action Alternative
Analysis Period
End of Month Elevation (Feet)
Oct Nov Dec Jan Feb Mar Apr May Jun Jul Aug Sep
Long-Term
Full Simulation Perioda
No Project/No ActionAlternative
980 980 988 1,002 1,015 1,030 1,042 1,042 1,029 1,008 992 984
Alternative A 985 984 991 1,003 1,015 1,031 1,043 1,045 1,033 1,013 997 989
Difference 5 5 3 2 0 1 2 3 4 5 5 6
Percent Difference(%)b 0.5 0.5 0.3 0.2 0.0 0.1 0.2 0.2 0.4 0.5 0.5 0.6
Water Year Typesc
Wet (32%)
No Project/No ActionAlternative
1,008 1,003 1,010 1,024 1,033 1,042 1,059 1,064 1,057 1,042 1,029 1,012
Alternative A 1,010 1,006 1,011 1,024 1,033 1,042 1,059 1,064 1,057 1,042 1,030 1,014
Difference 2 3 0 0 0 0 0 0 0 1 1 3
Percent Difference (%) 0.2 0.3 0.0 0.0 0.0 0.0 0.0 0.0 0.0 0.1 0.1 0.3
Above Normal (15%)
No Project/No ActionAlternative
1,004 1,001 1,009 1,010 1,023 1,045 1,062 1,064 1,051 1,030 1,015 1,008
Alternative A 1,008 1,004 1,009 1,010 1,022 1,045 1,061 1,064 1,052 1,031 1,018 1,013
Difference 4 4 0 0 -1 0 -1 -1 1 2 3 5
Percent Difference (%) 0.4 0.4 0.0 0.0 -0.1 0.0 -0.1 -0.1 0.1 0.2 0.3 0.5
aBased on the 82-year simulation period.bRelative difference of the monthly average.cAs defined by the Sacramento Valley 40-30-30 Index Water Year Hydrologic Classification (SWRCB, 1999).
This document is not released as a draft EIR pursuant to CEQA Guidelines § 15087. As such, DWR is not soliciting and will not respond to commentssubmitted on this document, although any comments received will be retained and may be considered during preparation of a future draft EIR.

Chapter 9: Flood Control and Management
PRELIMINARY – SUBJECT TO CHANGEPRELIMINARY ADMINISTRATIVE DRAFT DECEMBER 2013 9-19 NORTH-OF-THE-DELTA OFFSTREAM STORAGE PROJECT EIR/EISWBG020812033556SAC/433094 (09-FLOOD_CONTROL_PRELIM_ADMIN_DRAFT_DEC2013.DOCX)
Table 9-10Trinity Lake End of Month Elevation, Long-Term Average, and Average by Water Year Type for
Alternative A when Compared to Existing Conditions
Analysis Period
End of Month Elevation (Feet)
Oct Nov Dec Jan Feb Mar Apr May Jun Jul Aug Sep
Long-Term
Full Simulation Perioda
Percent Difference (%)b 0.3 0.3 0.3 0.2 0.2 0.2 0.2 0.2 0.2 0.2 0.2 0.2
Water Year Typesc
Wet (32%)
Percent Difference (%) 0.0 0.1 0.0 0.1 0.1 0.0 0.0 0.0 0.0 0.0 0.0 0.0
Above Normal (15%)
Percent Difference (%) 0.2 0.2 0.2 0.3 0.3 0.2 0.2 0.2 0.2 0.2 0.1 0.2
aBased on the 82-year simulation period.bRelative difference of the monthly average.cAs defined by the Sacramento Valley 40-30-30 Index Water Year Hydrologic Classification (SWRCB, 1999).
Table 9-11Trinity Lake End of Month Elevation, Long-Term Average, and Average by Water Year Type for
Alternative A when Compared to the No Project/No Action Alternative
Analysis Period
End of Month Elevation (Feet)
Oct Nov Dec Jan Feb Mar Apr May Jun Jul Aug Sep
Long-Term
Full Simulation Perioda
Percent Difference (%)b 0.3 0.3 0.2 0.2 0.2 0.1 0.1 0.1 0.1 0.2 0.2 0.2
Water Year Typesc
Wet (32%)
Percent Difference (%) 0.1 0.1 0.1 0.1 0.1 0.0 0.0 0.0 0.0 0.0 0.0 0.0
Above Normal (15%)
Percent Difference (%) 0.2 0.2 0.2 0.3 0.3 0.2 0.2 0.2 0.2 0.2 0.2 0.2
aBased on the 82-year simulation period.bRelative difference of the monthly average.cAs defined by the Sacramento Valley 40-30-30 Index Water Year Hydrologic Classification (SWRCB, 1999).
Table 9-12Lake Oroville End of Month Elevation, Long-term Average, and Average by Water Year Type for
Alternative A when Compared to Existing Conditions
Average Type
End of Month Elevation (Feet)
Oct Nov Dec Jan Feb Mar Apr May Jun Jul Aug Sep
Long-Term
Full Simulation Perioda
Percent Difference (%)b 0.0 0.0 0.2 0.2 0.2 0.2 0.2 0.2 0.1 0.2 0.0 -0.3
Water Year Typesc
Wet (32%)
Percent Difference (%) -0.9 -0.7 -0.3 -0.1 0.0 0.0 0.0 0.0 -0.1 -0.3 -0.6 -1.0
Above Normal (15%)
Percent Difference (%) -0.4 -0.5 0.0 0.2 0.2 0.0 0.0 0.0 -0.2 -0.4 -0.4 -0.6
aBased on the 82-year simulation period.bRelative difference of the monthly average.cAs defined by the Sacramento Valley 40-30-30 Index Water Year Hydrologic Classification (SWRCB, 1999).
This document is not released as a draft EIR pursuant to CEQA Guidelines § 15087. As such, DWR is not soliciting and will not respond to commentssubmitted on this document, although any comments received will be retained and may be considered during preparation of a future draft EIR.

Chapter 9: Flood Control and Management
PRELIMINARY – SUBJECT TO CHANGENORTH-OF-THE-DELTA OFFSTREAM STORAGE PROJECT EIR/EIS 9-20 PRELIMINARY ADMINISTRATIVE DRAFT DECEMBER 2013
WBG020812033556SAC/433094 (09-FLOOD_CONTROL_PRELIM_ADMIN_DRAFT_DEC2013.DOCX)
Table 9-13Lake Oroville End of Month Elevation, Long-term Average, and Average by Water Year Type for
Alternative A when Compared to the No Project/No Action Alternative
Average Type
End of Month Elevation (Feet)
Oct Nov Dec Jan Feb Mar Apr May Jun Jul Aug Sep
Long-Term
Full Simulation Perioda
Percent Difference (%)b 0.5 0.5 0.7 0.6 0.5 0.4 0.4 0.4 0.4 0.4 0.4 0.3
Water Year Typesc
Wet (32%)
Percent Difference (%) 0.1 0.1 0.3 0.1 0.0 0.0 0.0 0.0 -0.1 -0.1 -0.1 -0.1
Above Normal (15%)
Percent Difference (%) 0.1 0.0 0.5 0.4 0.3 0.0 0.0 0.0 -0.2 -0.2 0.0 -0.1
aBased on the 82-year simulation period.bRelative difference of the monthly average.cAs defined by the Sacramento Valley 40-30-30 Index Water Year Hydrologic Classification (SWRCB, 1999).
Table 9-14Folsom Lake End of Month Elevation, Long-Term Average, and Average by Water Year Type for
Alternative A when Compared to Existing Conditions
Average Type
End of Month Elevation (Feet)
Oct Nov Dec Jan Feb Mar Apr May Jun Jul Aug Sep
Long-Term
Full Simulation Perioda
Percent Difference (%)b 0.2 0.4 0.2 0.2 0.3 0.3 0.1 0.0 0.0 0.4 0.2 0.3
Water Year Typesc
Wet (32%)
Percent Difference (%) 0.1 0.3 0.2 0.0 0.1 0.0 0.0 -0.1 -0.1 0.1 0.0 0.5
Above Normal (15%)
Percent Difference (%) 0.2 0.4 0.1 0.1 0.2 0.2 0.0 0.0 -0.1 0.5 -0.1 0.4
aBased on the 82-year simulation period.bRelative difference of the monthly average.cAs defined by the Sacramento Valley 40-30-30 Index Water Year Hydrologic Classification (SWRCB, 1999).
Table 9-15Folsom Lake End of Month Elevation, Long-Term Average, and Average by Water Year Type for
Alternative A when Compared to the No Project/No Action Alternative
Average Type
End of Month Elevation (Feet)
Oct Nov Dec Jan Feb Mar Apr May Jun Jul Aug Sep
Long-Term
Full Simulation Perioda
Percent Difference (%)b 0.7 0.7 0.5 0.4 0.3 0.2 0.2 0.1 0.2 0.9 0.7 0.7
Water Year Typesc
Wet (32%)
Percent Difference (%) 0.4 0.4 0.3 0.0 0.0 0.0 0.0 0.0 0.0 0.4 0.2 0.7
Above Normal (15%)
Percent Difference (%) 0.7 0.8 0.5 0.2 0.1 0.0 0.0 0.0 0.1 0.8 0.6 0.8
aBased on the 82-year simulation period.bRelative difference of the monthly average.cAs defined by the Sacramento Valley 40-30-30 Index Water Year Hydrologic Classification (SWRCB, 1999).
This document is not released as a draft EIR pursuant to CEQA Guidelines § 15087. As such, DWR is not soliciting and will not respond to commentssubmitted on this document, although any comments received will be retained and may be considered during preparation of a future draft EIR.

Chapter 9: Flood Control and Management
PRELIMINARY – SUBJECT TO CHANGEPRELIMINARY ADMINISTRATIVE DRAFT DECEMBER 2013 9-21 NORTH-OF-THE-DELTA OFFSTREAM STORAGE PROJECT EIR/EISWBG020812033556SAC/433094 (09-FLOOD_CONTROL_PRELIM_ADMIN_DRAFT_DEC2013.DOCX)
9.3.6.3 Primary Study Area – Alternative A
Construction, Operation, and Maintenance Impacts
Sites Reservoir Inundation Area and Sites Reservoir Dams
Most reservoirs are designed as “on-stream” reservoirs. On-stream reservoirs are sited to directly dam up
an active river channel or in a location where they would receive most of their inflow by capturing natural
runoff. By comparison, off-stream reservoirs are not designed to dam up a natural river course and are not
sited in a location where they receive the majority of their inflow naturally. Instead, off-stream reservoirs
receive their inflow primarily via human-made diversions and are sited in ideal locations where they can
store much-needed water for flexible distribution. Examples of California off-stream reservoirs are the
SWP-CVP jointly-used San Luis Reservoir, Contra Costa Water District’s Los Vaqueros Reservoir, and
Metropolitan Water District’s Eastside Reservoir (Diamond Valley Lake).
Sites Reservoir is also designed as an off-stream storage facility. Sites Reservoir would receive very little
natural runoff from its 83-square mile watershed. Average annual natural inflow into the reservoir would
be approximately 15,000 acre-feet which is little more than 1 percent of the Alternative A designed
1.27-MAF reservoir storage capacity. By comparison, the average annual inflow for Lake Oroville is
approximately 4.2 MAF, or approximately 120 percent of Lake Oroville’s approximately 3.5-MAF
storage capacity. Sites Reservoir would be filled predominantly by diversions directly or indirectly from
the Sacramento River using existing or new conveyances. Construction of the 1.27-MAF reservoir
includes building two main dams and seven saddle dams. The crest elevation of all dams would be
500 feet, providing 20 feet of freeboard above the maximum operating level of 480 feet. The designed
emergency spillway elevation would be at 486.5 feet.
Impact Flood-1: Substantially alter the Existing Drainage Pattern of the Site or Project Area,
Including through the Alteration of the Course of a Stream or River, or Substantially Increase the Rate
or Amount of Surface Runoff in a Manner which would Result in Flooding On- or Off-site
Flows from Funks and Stone Corral creeks would be impounded and diverted during the construction of
Golden Gate and Sites dams. Diversion of Funks and Stone Corral creeks would likely be accomplished
by passing storm flows through buried corrugated metal pipe or concrete pipe around the construction
areas.
During Project construction, a cofferdam would be installed upstream of the Sites and Golden Gate dams
around the dams’ construction work areas to retain storm flows entering the reservoir basin from Funks
Creek and Stone Corral Creek and thereby keep the dam construction work area dry. These cofferdams
would be designed to retain anticipated creek runoff in the reservoir basin during the construction period.
During the construction period, storm flows would collect within the proposed reservoir basin behind the
cofferdam and be released incrementally through a bypass around the Sites Dam area and discharged
downstream. Storm flows would be managed during dam construction so as not to increase the
downstream flood potential, resulting in a less-than-significant impact when compared to Existing
Conditions and the No Project/No Action Alternative. Post-construction, Sites and Golden Gate dams
would continue to alter existing flows on Funks and Stone Corral creeks; most water would be released
through the reservoir inlet/outlet works. Thus, operation of Sites and Golden Gate dams would result in a
significant impact due to alteration of a river or stream course, when compared to Existing Conditions
and the No Project/No Action Alternative.
This document is not released as a draft EIR pursuant to CEQA Guidelines § 15087. As such, DWR is not soliciting and will not respond to commentssubmitted on this document, although any comments received will be retained and may be considered during preparation of a future draft EIR.
Chapter 9: Flood Control and Management
PRELIMINARY – SUBJECT TO CHANGENORTH-OF-THE-DELTA OFFSTREAM STORAGE PROJECT EIR/EIS 9-22 PRELIMINARY ADMINISTRATIVE DRAFT DECEMBER 2013
WBG020812033556SAC/433094 (09-FLOOD_CONTROL_PRELIM_ADMIN_DRAFT_DEC2013.DOCX)
Operation of Sites Reservoir would decrease the magnitude of the 100-year peak flow event on Funks and
Stone Corral creeks downstream of the dams by having the capacity to contain flood flows and control the
release of water downstream. With implementation of Alternative A, of the 22,200 acres of land prone to
flooding downstream of the proposed Sites and Golden Gate dam locations, approximately 21 percent
(4,660 acres) would experience a reduction in flood-related damages. In addition to increasing the level of
protection in the Funks Creek and Stone Corral Creek watersheds, a 100-year level of protection would be
achieved for approximately 4,025 acres in the Colusa Basin. Based on a 100-year flood event, the flood
risk would be reduced for a total of 8,685 acres (Reclamation, 2012). Therefore, operation of Sites
Reservoir would result in a potentially beneficial effect by reducing the amount and rate of surface water
runoff that has historically flooded areas downstream of the dams, when compared to Existing Conditions
and the No Project/No Action Alternative.
Maintenance activities associated with the reservoir (e.g., law enforcement and garbage removal) and
dams (equipment, foundation, and embankment inspections and repairs; debris and vegetation removal)
would not alter existing drainage patterns or the course of a stream and would, therefore, have no impact,
when compared to Existing Conditions and the No Project/No Action Alternative.
Impact Flood-2: Place within a 100-year Flood Hazard Area Structures which Could Impede or
Redirect Flood Flows
Both Golden Gate and Sites dams would be located within 100-year flood hazard areas associated with
Funks and Stone Corral creeks. Neither dam would impede or redirect flood flows in a manner that would
increase potential downstream flood impacts. In contrast, both creeks would be impounded and diverted
in a controlled manner during the construction of the dams, and operation of the dams would help to
alleviate potential downstream flood flows on these creeks by capturing watershed runoff. Therefore,
construction and operation of both dams would result in a potentially beneficial effect on 100-year flood
flows downstream of the dam, when compared to Existing Conditions and the No Project/No Action
Alternative.
Maintenance activities associated with the dams, including equipment, foundation, and embankment
inspections and repairs would not impede or redirect flood flows and would, therefore, have no impact,
when compared to Existing Conditions and the No Project/No Action Alternative.
Impact Flood-3: Expose People or Structures to a Significant Risk of Loss, Injury, or Death from
Flooding, Including Flooding as a Result of the Failure of a Levee or Dam
DWR has prepared a potential dam break inundation map that reflects the inundation scenario associated
with the future facility (Figure 9-5). The flood wave that would result from a hypothetical breach of
Golden Gate Dam or Sites Dam has a small probability of occurring, but would present a significant
hazard to both occupied and non-occupied structures downstream of Sites Reservoir. The peak outflow
from a breach of Sites Reservoir is estimated at 2,078,000 cfs. The flood wave would flow east following
the natural streambeds and would fan out to the relatively flat terrain of the Sacramento Valley before
reaching the City of Maxwell and I-5. The estimated flow velocity at Maxwell and I-5 would be 4.5 feet
per second and the maximum depth would be 10 feet. The flood wave would then continue approximately
13 miles east to the City of Colusa and the Sacramento River. The flood wave would then be impeded by
the west levee of the Sacramento River. The flood would reach a depth of 22 feet (upslope of the
Sacramento River levee) (DWR, 2005).
This document is not released as a draft EIR pursuant to CEQA Guidelines § 15087. As such, DWR is not soliciting and will not respond to commentssubmitted on this document, although any comments received will be retained and may be considered during preparation of a future draft EIR.

Chapter 9: Flood Control and Management
PRELIMINARY – SUBJECT TO CHANGEPRELIMINARY ADMINISTRATIVE DRAFT DECEMBER 2013 9-23 NORTH-OF-THE-DELTA OFFSTREAM STORAGE PROJECT EIR/EISWBG020812033556SAC/433094 (09-FLOOD_CONTROL_PRELIM_ADMIN_DRAFT_DEC2013.DOCX)
However, the Sites Reservoir dams would be designed and constructed pursuant to conservative guidelines
and criteria designed to prevent failure. The designs would incorporate multiple lines of defense or design
redundancy as required to meet both DWR’s Division of Safety of Dams (DSOD) and Reclamation design
standards. For example, the dam would be designed to withstand the largest and strongest earthquake
(Maximum Credible Earthquake) as well as the largest possible flood (Probable Maximum Flood). These
design standards would protect the dam from seismic or other catastrophic failure.
In addition, operation of Golden Gate and Sites dams would be monitored by instrumentation measuring
such parameters as seepage, settlement, and earthquake-induced accelerations, which could provide early
warning signs of potential dam failure. With modern design criteria, construction practices, and
post-construction monitoring, the probability of dam failure and subsequent impacts is extremely small.
Therefore, Sites Reservoir and Dams would result in a less-than-significant impact on the risk of loss,
injury, or death due to flooding caused by dam failure, when compared to Existing Conditions and the No
Project/No Action Alternative.
Both DSOD and Reclamation dam safety guidelines establish criteria for handling the emergency
evacuation of a reservoir and the design of related facilities, such as the Sites Dam emergency spillway
and outlet structure, required to handle the evacuation flows. Although the NODOS Feasibility Study
follows DSOD design standards, DSOD’s emergency evacuation criteria are actually more conservative
than Reclamation’s evacuation criteria. Thus, Sites Dam and the associated facilities required to handle
the emergency evacuation flows would meet both DSOD and Reclamation standards (Reclamation, 2012;
Reclamation, 1990).
Based on DSOD guidelines, Sites Reservoir would include an emergency spillway to release flows with
an elevation set to the potential PMF water surface elevation. The proposed emergency spillway design is
a simple “morning glory” intake and outflow pipe structure located in Saddle Dam 6, which would allow
for overflow spill if the water surface reaches the PMF elevation. However, as an offstream reservoir,
Sites Reservoir would be filled by Project-controlled diversions and would receive little inflow from the
local creeks. Generally, Sites Reservoir would fill to its highest operating levels by spring to early
summer, and then the levels would be drawn down during summer for water supply uses. By the time of
the rainy season, when a 100-year flood is generally anticipated, the reservoir would have more than
enough capacity to handle large storm events from the local creeks, even at full operating capacity.
In addition, both DSOD and Reclamation require that large reservoirs, such as Sites Reservoir, have facilities
capable of allowing rapid emergency drawdown of the water in the reservoir in the event of an unsafe
condition at the dam. DSOD emergency drawdown (or “evacuation”) guidelines for a large reservoir require
that the dam facilities have the capability to lower the reservoir level by an amount equal to 10 percent of the
hydraulic head2 behind the dam in 10 days, and to evacuate the entire reservoir in 120 days. Sites Reservoir
would accomplish this drawdown via the outlet tunnel in the inlet/outlet structure, which could discharge
emergency release flows directly into Funks Creek; some of this drawdown could be attenuated by Holthouse
Reservoir or released via the Delevan Pipeline, the T-C Canal, or the GCID Canal. The currently designed
maximum discharge rate is 23,000 cfs, which exceeds the required 10-day average discharge rate. However,
the risk of an event requiring such an emergency release remains very small. Because the probability of the
emergency release event occurring is so remote, Sites Reservoir and Dams would have a
2The hydraulic head is the difference between the normal maximum water surface elevation and the dead pool (i.e., the water levelbelow which water can no longer be discharged) elevation
This document is not released as a draft EIR pursuant to CEQA Guidelines § 15087. As such, DWR is not soliciting and will not respond to commentssubmitted on this document, although any comments received will be retained and may be considered during preparation of a future draft EIR.

Chapter 9: Flood Control and Management
PRELIMINARY – SUBJECT TO CHANGENORTH-OF-THE-DELTA OFFSTREAM STORAGE PROJECT EIR/EIS 9-24 PRELIMINARY ADMINISTRATIVE DRAFT DECEMBER 2013
WBG020812033556SAC/433094 (09-FLOOD_CONTROL_PRELIM_ADMIN_DRAFT_DEC2013.DOCX)
less-than-significant impact on the risk of loss, injury, or death due to flooding caused by emergency
reservoir releases, when compared to Existing Conditions and the No Project/No Action Alternative.
Sites Pumping/Generating Plant, Tunnel, Sites Reservoir Inlet/Outlet Structure, Sites Electrical
Switchyard, and Field Office Maintenance Yard
Impact Flood-1: Substantially alter the Existing Drainage Pattern of the Site or Project Area,
Including through the Alteration of the Course of a Stream or River, or Substantially Increase the Rate
or Amount of Surface Runoff in a Manner which would Result in Flooding On- or Off-site
The Sites Pumping/Generating Plant, Tunnel, Electrical Switchyard, and Field Office Maintenance Yard
would not be located directly on the Funks Creek channel alignment. Therefore, construction activities
associated with these facilities would not alter existing drainage patterns or alter the course of Funks
Creek. Post-construction, the footprint for these proposed facilities is not expected to substantially alter
the existing drainage patterns in that area. In addition, the new impervious areas associated with these
facilities would not be large enough to cause a significant increase in surface runoff. Maintenance
activities, including washing and cleaning of equipment, inspections, and fence maintenance, would not
alter drainage patterns or stream courses. Therefore, construction, operation, and maintenance of these
facilities would result in a less-than-significant impact on existing drainage patterns, stream courses, or
surface runoff, when compared to Existing Conditions and the No Project/No Action Alternative.
Most of the footprint of the Sites Reservoir Inlet/Outlet Structure would not be located directly on the
Funks Creek channel alignment. However, the footprint of the outlet approach channel to Holthouse
Reservoir would cross the Funks Creek channel and would permanently remove approximately 0.5 mile
of Funks Creek immediately upstream of the existing Funks Reservoir. During construction, Funks Creek
would be diverted. During operation, Funks Creek would flow into the approach channel upstream of the
existing Funks Reservoir. Although slight alteration of the course of the creek would occur, it would not
result in flooding because diverted flows would be controlled during construction, and upstream flows
would be controlled by releases from Sites Reservoir during operation. Maintenance activities, such as
inspections, would not alter drainage patterns or stream courses. Therefore, construction, operation, and
maintenance of the inlet/outlet structure would result in a less-than-significant impact on existing
drainage patterns, stream courses, or surface runoff, when compared to Existing Conditions and the No
Project/No Action Alternative.
Impact Flood-2: Place within a 100-year Flood Hazard Area Structures which Could Impede or
Redirect Flood Flows
The proposed Sites Pumping/Generating Plant, Tunnel, Reservoir Inlet/Outlet Structure, Electrical
Switchyard, and Field Office Maintenance Yard would be constructed within the 100-year flood hazard
area associated with Funks Creek. However, during construction, the flows from Funks Creek would be
controlled with a diversion system. During operation, Sites Reservoir would substantially reduce flood
flows associated with Funks Creek by capturing runoff from a large portion of the upstream watershed.
The maintenance activities would not place structures within a flood hazard area. Therefore, these
facilities are not expected to significantly impede or redirect 100-year flood flows. Construction,
operation, and maintenance of these facilities would result in a less-than-significant impact on 100-year
flood flows, when compared to Existing Conditions and the No Project/No Action Alternative.
This document is not released as a draft EIR pursuant to CEQA Guidelines § 15087. As such, DWR is not soliciting and will not respond to commentssubmitted on this document, although any comments received will be retained and may be considered during preparation of a future draft EIR.
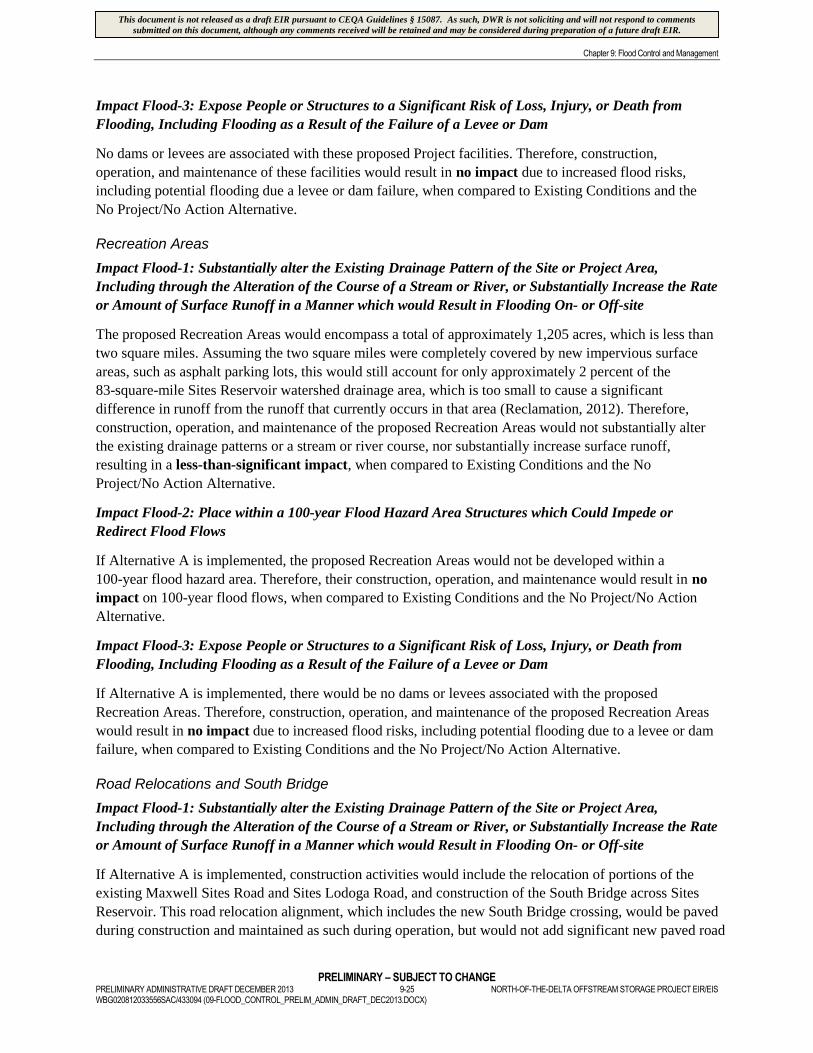
Chapter 9: Flood Control and Management
PRELIMINARY – SUBJECT TO CHANGEPRELIMINARY ADMINISTRATIVE DRAFT DECEMBER 2013 9-25 NORTH-OF-THE-DELTA OFFSTREAM STORAGE PROJECT EIR/EISWBG020812033556SAC/433094 (09-FLOOD_CONTROL_PRELIM_ADMIN_DRAFT_DEC2013.DOCX)
Impact Flood-3: Expose People or Structures to a Significant Risk of Loss, Injury, or Death from
Flooding, Including Flooding as a Result of the Failure of a Levee or Dam
No dams or levees are associated with these proposed Project facilities. Therefore, construction,
operation, and maintenance of these facilities would result in no impact due to increased flood risks,
including potential flooding due a levee or dam failure, when compared to Existing Conditions and the
No Project/No Action Alternative.
Recreation Areas
Impact Flood-1: Substantially alter the Existing Drainage Pattern of the Site or Project Area,
Including through the Alteration of the Course of a Stream or River, or Substantially Increase the Rate
or Amount of Surface Runoff in a Manner which would Result in Flooding On- or Off-site
The proposed Recreation Areas would encompass a total of approximately 1,205 acres, which is less than
two square miles. Assuming the two square miles were completely covered by new impervious surface
areas, such as asphalt parking lots, this would still account for only approximately 2 percent of the
83-square-mile Sites Reservoir watershed drainage area, which is too small to cause a significant
difference in runoff from the runoff that currently occurs in that area (Reclamation, 2012). Therefore,
construction, operation, and maintenance of the proposed Recreation Areas would not substantially alter
the existing drainage patterns or a stream or river course, nor substantially increase surface runoff,
resulting in a less-than-significant impact, when compared to Existing Conditions and the No
Project/No Action Alternative.
Impact Flood-2: Place within a 100-year Flood Hazard Area Structures which Could Impede or
Redirect Flood Flows
If Alternative A is implemented, the proposed Recreation Areas would not be developed within a
100-year flood hazard area. Therefore, their construction, operation, and maintenance would result in no
impact on 100-year flood flows, when compared to Existing Conditions and the No Project/No Action
Alternative.
Impact Flood-3: Expose People or Structures to a Significant Risk of Loss, Injury, or Death from
Flooding, Including Flooding as a Result of the Failure of a Levee or Dam
If Alternative A is implemented, there would be no dams or levees associated with the proposed
Recreation Areas. Therefore, construction, operation, and maintenance of the proposed Recreation Areas
would result in no impact due to increased flood risks, including potential flooding due to a levee or dam
failure, when compared to Existing Conditions and the No Project/No Action Alternative.
Road Relocations and South Bridge
Impact Flood-1: Substantially alter the Existing Drainage Pattern of the Site or Project Area,
Including through the Alteration of the Course of a Stream or River, or Substantially Increase the Rate
or Amount of Surface Runoff in a Manner which would Result in Flooding On- or Off-site
If Alternative A is implemented, construction activities would include the relocation of portions of the
existing Maxwell Sites Road and Sites Lodoga Road, and construction of the South Bridge across Sites
Reservoir. This road relocation alignment, which includes the new South Bridge crossing, would be paved
during construction and maintained as such during operation, but would not add significant new paved road
This document is not released as a draft EIR pursuant to CEQA Guidelines § 15087. As such, DWR is not soliciting and will not respond to commentssubmitted on this document, although any comments received will be retained and may be considered during preparation of a future draft EIR.

Chapter 9: Flood Control and Management
PRELIMINARY – SUBJECT TO CHANGENORTH-OF-THE-DELTA OFFSTREAM STORAGE PROJECT EIR/EIS 9-26 PRELIMINARY ADMINISTRATIVE DRAFT DECEMBER 2013
WBG020812033556SAC/433094 (09-FLOOD_CONTROL_PRELIM_ADMIN_DRAFT_DEC2013.DOCX)
area relative to the existing roadway alignment. In addition, this road relocation alignment would not cross
any streams, and therefore, would not alter the course of a stream during construction or operation.
The temporary construction roads and additional permanent access roads, such as those to the proposed
recreation areas and Project facilities, would be constructed and operated as unpaved (gravel) roads, and in
turn, would not significantly contribute to surface runoff. In addition, these roads would not cross any
streams, and therefore, would not alter the course of a stream during construction or operation. The only
exception would be the proposed Eastside Road, which would be paved for approximately four miles at its
southern end, and would cross Funks Creek approximately 0.4 mile downstream of the proposed Golden Gate
Dam. The portion of the road that would be paved during construction and maintained as such during
operation would not add significant new paved road area. The Funks Creek crossing would require the
installation of a culvert; this activity would occur during the period that the creek is diverted. Although slight
alteration of the course of the creek would occur during diversion, it would not result in flooding because
bypass flows would be controlled during construction, and the course of the stream would be restored prior to
operation. During operation, upstream flows would be controlled by releases from Sites Reservoir.
Road maintenance activities, such as chip sealing, patching, grading, vegetation control, and repair of
damaged guardrails or fencing, and minor bridge or culvert maintenance, would consist of debris removal,
and would not alter existing drainage patterns or alter the course of a stream. Therefore, construction,
operation, and maintenance of the road relocations, new South Bridge, and new access roads combined
would not substantially alter existing drainage patterns or stream courses and would not increase surface
runoff, resulting in a less-than-significant impact on existing drainage patterns, stream courses, or surface
runoff, when compared to Existing Conditions and the No Project/No Action Alternative.
Impact Flood-2: Place within a 100-year Flood Hazard Area Structures which Could Impede or
Redirect Flood Flows
If Alternative A is implemented, the northeast end of the proposed Sulphur Gap Road, where it would
connect with the existing Maxwell Sites Road, would be constructed within a portion of Stone Corral
Creek’s 100-year flood hazard area. However, only a small portion of flood hazard area would be affected
by the proposed roadway during construction, and during operation, Sites Reservoir would substantially
reduce flood flows associated with Stone Corral Creek by capturing runoff from a large portion of the
upstream watershed. Road maintenance activities would not place additional structures within the flood
hazard area. Therefore, construction, operation, and maintenance of the proposed road would result in a
less-than-significant impact on 100-year flood flows, when compared to Existing Conditions and the No
Project/No Action Alternative.
Impact Flood-3: Expose People or Structures to a Significant Risk of Loss, Injury, or Death from
Flooding, Including Flooding as a Result of the Failure of a Levee or Dam
If Alternative A is implemented, there would be no dams or levees associated with the proposed Road
Relocations and South Bridge. Therefore, the construction, operation, and maintenance of the Road
Relocations and the South Bridge would result in no impact due to increased flood risks including
potential flooding due a levee or dam failure, when compared to Existing Conditions and the No
Project/No Action Alternative.
This document is not released as a draft EIR pursuant to CEQA Guidelines § 15087. As such, DWR is not soliciting and will not respond to commentssubmitted on this document, although any comments received will be retained and may be considered during preparation of a future draft EIR.

Chapter 9: Flood Control and Management
PRELIMINARY – SUBJECT TO CHANGEPRELIMINARY ADMINISTRATIVE DRAFT DECEMBER 2013 9-27 NORTH-OF-THE-DELTA OFFSTREAM STORAGE PROJECT EIR/EISWBG020812033556SAC/433094 (09-FLOOD_CONTROL_PRELIM_ADMIN_DRAFT_DEC2013.DOCX)
Glenn-Colusa Irrigation District Canal Facilities Modifications
Impact Flood-1: Substantially alter the Existing Drainage Pattern of the Site or Project Area,
Including through the Alteration of the Course of a Stream or River, or Substantially Increase the Rate
or Amount of Surface Runoff in a Manner which would Result in Flooding On- or Off-site
The proposed GCID Canal Facilities modifications (including the new headgate structure, 200 feet of canal
lining, and railroad siphon replacement) would not drastically alter the existing canal structure. In addition,
operation and maintenance activities are expected to be similar to those of the existing canal. Construction,
operation, and maintenance activities associated with the GCID Canal Facilities modifications would not alter
the course of a natural stream or river and would not substantially alter existing drainage patterns or increase
runoff. Therefore, construction, operation, and maintenance of the proposed GCID Canal Facilities
modifications would result in a less-than-significant impact on existing drainage patterns, stream courses, or
surface runoff, when compared to Existing Conditions and the No Project/No Action Alternative.
Impact Flood-2: Place within a 100-year Flood Hazard Area Structures which Could Impede or
Redirect Flood Flows
Most of the existing GCID Canal does not pass through a 100-year flood hazard area except for the north
end, which passes through a 100-year flood hazard area associated with primarily Colusa Basin Drain
flows. However, the proposed GCID Canal Facilities modifications that would occur during Project
construction would be made to the existing canal and thus would not further impede or redirect 100-year
flood flows more than the existing canal. In addition, operation and maintenance activities would be
similar to those performed at the existing canal. Therefore, construction, operation, and maintenance of
the proposed GCID Canal Facilities modifications would result in a less-than-significant impact on
100-year flood flows, when compared to Existing Conditions and the No Project/No Action Alternative.
Impact Flood-3: Expose People or Structures to a Significant Risk of Loss, Injury, or Death from
Flooding, Including Flooding as a Result of the Failure of a Levee or Dam
The existing GCID Canal Facilities are located on a non-leveed bypass channel that diverts Sacramento
River flows. Because no levees or dams are associated with the GCID Canal Facilities, construction,
operation, and maintenance the proposed modifications would have no impact on levees or dams, and
therefore, no associated potential flood risk impacts due to levee or dam failure. Therefore, construction,
operation, and maintenance of the proposed GCID Canal Facilities modifications would result in no
impact due to increased flood risks, including potential flooding due a levee or dam failure, when
compared to Existing Conditions and the No Project/No Action Alternative.
Holthouse Reservoir Complex and Holthouse Reservoir Electrical Switchyard
Preliminary feasibility studies indicate that Holthouse Reservoir would need an active storage of
approximately 6,500 acre-feet (approximately three times larger than the existing Funks Reservoir storage),
covering a surface area of 530 acres (approximately 2.3 times larger than the existing Funks Reservoir surface
area) and with maximum dam embankment heights of 45 feet above existing grade (Reclamation, 2012).
This document is not released as a draft EIR pursuant to CEQA Guidelines § 15087. As such, DWR is not soliciting and will not respond to commentssubmitted on this document, although any comments received will be retained and may be considered during preparation of a future draft EIR.

Chapter 9: Flood Control and Management
PRELIMINARY – SUBJECT TO CHANGENORTH-OF-THE-DELTA OFFSTREAM STORAGE PROJECT EIR/EIS 9-28 PRELIMINARY ADMINISTRATIVE DRAFT DECEMBER 2013
WBG020812033556SAC/433094 (09-FLOOD_CONTROL_PRELIM_ADMIN_DRAFT_DEC2013.DOCX)
Impact Flood-1: Substantially alter the Existing Drainage Pattern of the Site or Project Area,
Including through the Alteration of the Course of a Stream or River, or Substantially Increase the Rate
or Amount of Surface Runoff in a Manner which would Result in Flooding On- or Off-site
Dredging of the existing Funks Reservoir, as well as the construction of the Holthouse Reservoir
Complex and Holthouse Reservoir Electrical Switchyard, would require the diversion of Funks Creek.
Although alteration of the course of the creek would occur, it would not result in flooding because bypass
flows would be controlled during construction.
The proposed Funks Reservoir enlargement that would result from construction of the adjacent Holthouse
Reservoir would not be a large enough increase to substantially alter drainage patterns around the existing
Funks Reservoir. In addition, during operation, the upstream Sites Reservoir would substantially reduce
flood flows associated with Funks Creek by capturing runoff from a large portion of the upstream
watershed. Operation and maintenance activities associated with the enlarged Holthouse Reservoir
Complex are expected to be similar to those of the existing Funks Reservoir and would not increase the
risk of flooding from existing conditions in the area. Maintenance of the existing Funks Reservoir would
include road, vegetation, and fence maintenance, and debris removal. Funks Reservoir is also drained
annually. These maintenance activities are expected to be the same for Holthouse Reservoir. Maintenance
of the electrical switchyard may include annual washing and cleaning of insulating equipment, and
landscape maintenance; these activities would not affect drainage patterns. Therefore, construction,
operation, and maintenance of the Holthouse Reservoir Complex and Holthouse Reservoir Electrical
Switchyard, and dredging of the existing Funks Reservoir, would result in a less-than-significant impact
on existing drainage patterns, stream courses, or surface runoff, when compared to Existing Conditions
and the No Project/No Action Alternative.
Impact Flood-2: Place within a 100-year Flood Hazard Area Structures which Could Impede or
Redirect Flood Flows
Funks Reservoir is an existing structure; an evaluation of Impact Flood-2 is therefore not applicable to
that Project feature. The Holthouse Reservoir Complex and Holthouse Reservoir Electrical Switchyard
would be constructed within a Special Flood Hazard Area associated with Funks Creek 100-year flood
flows. However, during construction, the flows from Funks Creek would be controlled with a diversion
system. During operation, the larger Holthouse Reservoir would likely not impede 100-year flood flows
more so than the existing Funks Reservoir, which is located within the same Special Flood Hazard Area.
The four-acre Holthouse Reservoir Electrical Switchyard would have a gravel base, and would not be
expected to significantly impede 100-year flood flows. In addition, operation of Sites Reservoir would
substantially reduce flood flows associated with Funks Creek by capturing runoff from a large portion of
the upstream watershed. Maintenance activities are expected to be similar to those of the existing Funks
Reservoir for Holthouse Reservoir, and would involve washing and vegetation control for the electrical
switchyard; these activities would not place additional structures within the Special Flood Hazard Area.
Therefore, construction, operation, and maintenance of the Holthouse Reservoir Complex and Holthouse
Reservoir Electrical Switchyard would result in a less-than-significant impact on 100-year flood flows,
when compared to Existing Conditions and the No Project/No Action Alternative.
This document is not released as a draft EIR pursuant to CEQA Guidelines § 15087. As such, DWR is not soliciting and will not respond to commentssubmitted on this document, although any comments received will be retained and may be considered during preparation of a future draft EIR.

Chapter 9: Flood Control and Management
PRELIMINARY – SUBJECT TO CHANGEPRELIMINARY ADMINISTRATIVE DRAFT DECEMBER 2013 9-29 NORTH-OF-THE-DELTA OFFSTREAM STORAGE PROJECT EIR/EISWBG020812033556SAC/433094 (09-FLOOD_CONTROL_PRELIM_ADMIN_DRAFT_DEC2013.DOCX)
Impact Flood-3: Expose People or Structures to a Significant Risk of Loss, Injury, or Death from
Flooding, Including Flooding as a Result of the Failure of a Levee or Dam
As designed, the 6,500-acre-foot Holthouse Reservoir, which is an expansion of the existing Funks
Reservoir, would be a jurisdictional reservoir3. For jurisdictional reservoirs, DSOD oversees the dam
design and permitting processes and usually requires a dam break analysis as part of the design and
permitting process. The reservoir design is not detailed enough at this stage for a quantitative analysis.
However, Holthouse Dam would be designed and constructed pursuant to the same conservative
guidelines and criteria designed to prevent failure as described for Sites Reservoir. These design standards
would protect the dam from seismic or other failure, and would, therefore, result in a
less-than-significant impact on the risk of loss, injury, or death due to flooding caused by dam failure,
when compared to Existing Conditions and the No Project/No Action Alternative. Holthouse Reservoir
would also be constructed with a maximum emergency spillway discharge capacity of 23,000 cfs to pass
the equivalent Sites Reservoir emergency drawdown flows required by DSOD, which would be
discharged directly into Funks Creek via the inlet/outlet works (Reclamation, 2012). Some of this
emergency drawdown could also be attenuated by the TRR, or could be released via the Delevan Pipeline,
the T-C Canal, or the GCID Canal. However, the risk of an event requiring such an emergency release
remains very small. Because the probability of the emergency release event occurring is so remote, the
Holthouse Reservoir Complex would have a less-than-significant impact on the risk of loss, injury, or
death due to flooding caused by emergency reservoir releases, when compared to Existing Conditions and
the No Project/No Action Alternative.
Maintenance activities associated with Holthouse Reservoir are expected to be similar to those of the
existing Funks Reservoir and would not be expected to exposed people to increased flood risks.
Therefore, maintenance of the Holthouse Reservoir Complex would result in a less-than-significant
impact on the exposure of people to increased flood risks, including potential flooding due to a levee or
dam failure, when compared to Existing Conditions and the No Project/No Action Alternative.
Terminal Regulating Reservoir, Terminal Regulating Reservoir Pumping/Generating Plant,
Terminal Regulating Reservoir Electrical Switchyard, Glenn-Colusa Irrigation District Canal
Connection to the Terminal Regulating Reservoir, Terminal Regulating Reservoir Pipeline, and
Terminal Regulating Reservoir Pipeline Road
Impact Flood-1: Substantially alter the Existing Drainage Pattern of the Site or Project Area,
Including through the Alteration of the Course of a Stream or River, or Substantially Increase the Rate
or Amount of Surface Runoff in a Manner which would Result in Flooding On- or Off-site
The portion of these TRR facilities that would be constructed and operated above ground would not be
located near a stream and do not have a large enough footprint to substantially alter existing drainage
patterns. In addition, operation of the upstream Sites Reservoir would substantially reduce flood flows in
this area associated with Funks Creek by capturing runoff from a large portion of the upstream watershed,
as well as by limiting post-construction flows to Funks Creek downstream of Golden Gate Dam.
Maintenance activities, such as vegetation clearing and necessary repairs to the TRR Pipeline Road,
would not substantially affect runoff in the area. However, the draining and dredging of the reservoir,
3 A Jurisdictional Reservoir is a reservoir for which DSOD has design and construction permitting jurisdiction. A main threshold forDSOD jurisdiction is a minimum six foot height requirement.
This document is not released as a draft EIR pursuant to CEQA Guidelines § 15087. As such, DWR is not soliciting and will not respond to commentssubmitted on this document, although any comments received will be retained and may be considered during preparation of a future draft EIR.

Chapter 9: Flood Control and Management
PRELIMINARY – SUBJECT TO CHANGENORTH-OF-THE-DELTA OFFSTREAM STORAGE PROJECT EIR/EIS 9-30 PRELIMINARY ADMINISTRATIVE DRAFT DECEMBER 2013
WBG020812033556SAC/433094 (09-FLOOD_CONTROL_PRELIM_ADMIN_DRAFT_DEC2013.DOCX)
which would occur every seven to 10 years depending on sediment accumulation, would require releases
from the reservoir to Funks Creek via the TRR to Funks Creek Pipeline. Although these releases would
increase creek flows, releases would be controlled with an energy dissipater and small concrete structure
at the terminal end of the pipeline to avoid exceeding the capacity of the creek channel. Therefore,
construction, operation, and maintenance of these TRR facilities would result in a less-than-significant
impact on existing drainage patterns, stream courses, or surface runoff, when compared to Existing
Conditions and the No Project/No Action Alternative.
Impact Flood-2: Place within a 100-year Flood Hazard Area Structures which Could Impede or
Redirect Flood Flows
The TRR, TRR Pumping/Generating Plant, TRR Electrical Switchyard, GCID Canal Connection to the
TRR, and TRR Pipeline Road would be constructed and operated within a 100-year flood hazard area
associated with Funks Creek. These above-ground structures may impede 100-year flood flows; however,
Sites Reservoir would substantially reduce these 100-year flood flows associated with Funks Creek by
capturing runoff from a large portion of the upstream watershed. Maintenance activities associated with
these facilities would not place additional structures within the flood hazard area. Therefore, construction,
operation and maintenance of these TRR facilities would result in a less-than-significant impact on
100-year flood flows, when compared to Existing Conditions and the No Project/No Action Alternative.
The TRR Pipeline and TRR to Funks Creek Pipeline would both be constructed within a 100-year flood
hazard area associated with Funks Creek. Both pipelines would be buried a minimum of 10 feet (to top of
pipe) below the ground surface. The only above-ground features associated with both pipelines would be
blow off and air valves, each of which would occupy a small area of land. Once installed, surface grading
would be restored above the pipelines such that operation of these pipelines would not significantly
impede or redirect flood flows or increase flooding hazards in other areas. The pipelines would thus not
impede 100-year flood flows. Therefore, construction, operation and maintenance of the TRR Pipeline
and the TRR to Funks Creek Pipeline would result in a less-than-significant impact on 100-year flood
flows, when compared to Existing Conditions and the No Project/No Action Alternative.
Impact Flood-3: Expose People or Structures to a Significant Risk of Loss, Injury, or Death from
Flooding, Including Flooding as a Result of the Failure of a Levee or Dam
Because of safety factors that are built into current engineering design practices, the probability of dam
failure, in general, is extremely small. The TRR is expected to be considered jurisdictional by DSOD
because the preliminary designed embankment height would be greater than six feet. A dam break
analysis has not yet been performed, but the TRR would be designed and constructed pursuant to the
same conservative guidelines and criteria designed to prevent failure as described for Sites Reservoir.
These design standards would protect the dam from seismic or other failure, and would, therefore, result
in a less-than-significant impact on the risk of loss, injury, or death due to flooding caused by dam
failure, when compared to Existing Conditions and the No Project/No Action Alternative.
Reservoir design would allow emergency releases during operation first to the GCID Canal, and then to
Funks Creek via the TRR to Funks Creek Pipeline. Although these releases would increase creek flows,
releases would be controlled with an energy dissipater and small concrete structure at the terminal end of
the pipeline to avoid exceeding the capacity of the creek channel. In addition, the risk of an event
requiring such an emergency release remains very small. Therefore, the TRR facilities would result in a
This document is not released as a draft EIR pursuant to CEQA Guidelines § 15087. As such, DWR is not soliciting and will not respond to commentssubmitted on this document, although any comments received will be retained and may be considered during preparation of a future draft EIR.

Chapter 9: Flood Control and Management
PRELIMINARY – SUBJECT TO CHANGEPRELIMINARY ADMINISTRATIVE DRAFT DECEMBER 2013 9-31 NORTH-OF-THE-DELTA OFFSTREAM STORAGE PROJECT EIR/EISWBG020812033556SAC/433094 (09-FLOOD_CONTROL_PRELIM_ADMIN_DRAFT_DEC2013.DOCX)
less-than-significant impact on existing drainage patterns, stream courses, or surface runoff, when
compared to Existing Conditions and the No Project/No Action Alternative.
Delevan Transmission Line
Impact Flood-1: Substantially alter the Existing Drainage Pattern of the Site or Project Area,
Including through the Alteration of the Course of a Stream or River, or Substantially Increase the Rate
or Amount of Surface Runoff in a Manner which would Result in Flooding On- or Off-site
The Delevan Transmission Line would be operated as an entirely above-ground Project facility, except
for its tower footings. Construction of the required footings for the 13-mile-long transmission line would
create a total permanent ground disturbance of approximately 2.5 acres. However, given that the footings
would not be a continuous strip of concrete (i.e., they would be spaced apart), this land area disturbance
would not significantly alter the existing drainage area or runoff patterns of the transmission alignment
area. In addition, tower footings would be sited to avoid stream crossings, and therefore, would not alter
the course of a stream. Maintenance activities, including equipment inspections and vegetation
maintenance, would not alter drainage patterns or alter the course of a stream. Therefore, construction,
operation, and maintenance of the Delevan Transmission Line would result in a less-than-significant
impact on existing drainage patterns, stream courses, or surface runoff, when compared to Existing
Conditions and the No Project/No Action Alternative.
Impact Flood-2: Place within a 100-year Flood Hazard Area Structures which Could Impede or
Redirect Flood Flows
Approximately half of the length of the above-ground Delevan Transmission Line would be located within
the northern portion of a designated 100-year flood hazard area associated with primarily Colusa Basin
Drain flows. Although the transmission line would be operated as an entirely above-ground facility, the
construction of the required transmission line footings for the entire 13-mile length of the transmission line
would create a total ground disturbance of approximately 2.5 acres. Approximately half of these footings
would be located within a flood hazard area. However, the footings would be spaced apart, and their
individual small footprint would not significantly impede 100-year flood flows. Maintenance activities
would not place additional structures within the flood hazard area. Therefore, construction, operation, and
maintenance of the Delevan Transmission Line would result in a less-than-significant impact on 100-year
flood flows, when compared to Existing Conditions and the No Project/No Action Alternative.
Impact Flood-3: Expose People or Structures to a Significant Risk of Loss, Injury, or Death from
Flooding, Including Flooding as a Result of the Failure of a Levee or Dam
No dams or levees are associated with the Delevan Transmission Line. Therefore, construction, operation,
and maintenance of the Delevan Transmission Line would result in no impact due to increased flooding
risks, including potential flooding due a levee or dam failure, when compared to Existing Conditions and
the No Project/No Action Alternative.
This document is not released as a draft EIR pursuant to CEQA Guidelines § 15087. As such, DWR is not soliciting and will not respond to commentssubmitted on this document, although any comments received will be retained and may be considered during preparation of a future draft EIR.
Chapter 9: Flood Control and Management
PRELIMINARY – SUBJECT TO CHANGENORTH-OF-THE-DELTA OFFSTREAM STORAGE PROJECT EIR/EIS 9-32 PRELIMINARY ADMINISTRATIVE DRAFT DECEMBER 2013
WBG020812033556SAC/433094 (09-FLOOD_CONTROL_PRELIM_ADMIN_DRAFT_DEC2013.DOCX)
Delevan Pipeline Electrical Switchyard
Impact Flood-1: Substantially alter the Existing Drainage Pattern of the Site or Project Area,
Including through the Alteration of the Course of a Stream or River, or Substantially Increase the Rate
or Amount of Surface Runoff in a Manner which would Result in Flooding On- or Off-site
The Delevan Pipeline Electrical Switchyard would not be located directly on the Funks Creek channel
alignment. Therefore, construction activities would not alter existing drainage patterns or alter the course
of Funks Creek. During operation, the four-acre ground surface of the switchyard would have a gravel
base and would not be expected to significantly alter the existing drainage area or runoff patterns of that
area. Maintenance activities, including equipment washing and vegetation maintenance, would not alter
drainage patterns or alter the course of a stream. Therefore, construction, operation, and maintenance of
the Delevan Pipeline Electrical Switchyard would result in a less-than-significant impact on existing
drainage patterns, stream courses, or surface runoff, when compared to Existing Conditions and the No
Project/No Action Alternative.
Impact Flood-2: Place within a 100-year Flood Hazard Area Structures which Could Impede or
Redirect Flood Flows
The Delevan Pipeline Electrical Switchyard would be constructed within a designated 100-year flood
hazard area associated with Funks Creek. However, during construction, the flows from Funks Creek
would be controlled with a diversion system. During operation, the four-acre switchyard would have a
gravel base, and would not be expected to significantly impede 100-year flood flows. In addition,
operation of Sites Reservoir would substantially reduce flood flows associated with Funks Creek by
capturing runoff from a large portion of the upstream watershed. Maintenance activities would not place
additional structures within the flood hazard area. Therefore, construction, operation, and maintenance of
the Delevan Pipeline Electrical Switchyard would result in a less-than-significant impact on 100-year
flood flows, when compared to Existing Conditions and the No Project/No Action Alternative.
Impact Flood-3: Expose People or Structures to a Significant Risk of Loss, Injury, or Death from
Flooding, Including Flooding as a Result of the Failure of a Levee or Dam
No dams or levees are associated with the Delevan Pipeline Electrical Switchyard. Therefore,construction, operation, and maintenance of the Delevan Pipeline Electrical Switchyard wouldresult in no impact due to increased flooding risks, including potential flooding due a levee ordam failure, when compared to Existing Conditions and the No Project/No Action Alternative.
Delevan Pipeline
Impact Flood-1: Substantially alter the Existing Drainage Pattern of the Site or Project Area,
Including through the Alteration of the Course of a Stream or River, or Substantially Increase the Rate
or Amount of Surface Runoff in a Manner which would Result in Flooding On- or Off-site
The Delevan Pipeline would be constructed as an underground facility, generally buried 10 feet below the
ground surface. The pipeline would cross the Colusa Basin Drain at the northern end of the drain.
Construction at this crossing would likely occur during late fall after the irrigation season ends and before
winter rains begin. Despite the timing, a portion of the CBD would likely need to be dewatered, with any
existing flows bypassed around the construction site. This construction at the crossing would be
accomplished by installing the pipeline in stages and bypassing flows on one side of the channel following
the construction of a cofferdam. The slight alteration of the course of this waterway would not substantially
This document is not released as a draft EIR pursuant to CEQA Guidelines § 15087. As such, DWR is not soliciting and will not respond to commentssubmitted on this document, although any comments received will be retained and may be considered during preparation of a future draft EIR.
Chapter 9: Flood Control and Management
PRELIMINARY – SUBJECT TO CHANGEPRELIMINARY ADMINISTRATIVE DRAFT DECEMBER 2013 9-33 NORTH-OF-THE-DELTA OFFSTREAM STORAGE PROJECT EIR/EISWBG020812033556SAC/433094 (09-FLOOD_CONTROL_PRELIM_ADMIN_DRAFT_DEC2013.DOCX)
alter drainage patterns. After installation of the pipeline, the CBD would be returned to a full channel and
would be reconstructed to pre-project conditions. Once installed, surface grading would be restored above
the pipeline such that it would not significantly alter the existing area drainage pattern. The only
above-ground components associated with the operation of the Delevan Pipeline would be manholes and
blow off and air valves, each of which would occupy a small area of land, and would, therefore, not impede
or redirect flood flows. Maintenance activities, including periodic inspections, would not affect drainage
patterns or runoff. Therefore, construction, operation, and maintenance of the Delevan Pipeline would result
in a less-than-significant impact on existing drainage patterns, stream courses, or surface runoff, when
compared to Existing Conditions and the No Project/No Action Alternative.
Impact Flood-2: Place within a 100-year Flood Hazard Area Structures which Could Impede or
Redirect Flood Flows
The Delevan Pipeline would cross the northern portion of a designated 100-year flood hazard area
associated with Funks Creek and Colusa Basin Drain flows. However, the Delevan Pipeline would be
constructed as an underground facility, and therefore, would not impede or redirect flows.
Once the pipeline is installed, surface grading would be restored above the pipeline such that it would not
significantly impede or redirect flood flows or increase flooding hazards in other areas. The only
above-ground components associated with operation of the Delevan Pipeline would be manholes and blow off
and air valves, each of which would occupy a small area of land. These above-ground components would not
impede 100-year flood flows. In addition, Sites Reservoir would substantially reduce flood flows associated
with Funks Creek by capturing runoff from a large portion of the upstream watershed. Maintenance activities
would not place additional structures within the flood hazard area. Therefore, construction, operation, and
maintenance of the Delevan Pipeline would result in a less-than-significant impact on 100-year flood flows,
when compared to Existing Conditions and the No Project/No Action Alternative.
Impact Flood-3: Expose People or Structures to a Significant Risk of Loss, Injury, or Death from
Flooding, Including Flooding as a Result of the Failure of a Levee or Dam
No dams or levees are associated with the Delevan Pipeline. Therefore, construction, operation, and
maintenance of the Delevan Pipeline would result in no impact due to increased flooding risks, including
potential flooding due a levee or dam failure, when compared to Existing Conditions and the No
Project/No Action Alternative.
Delevan Pipeline Intake Facilities
Impact Flood-1: Substantially alter the Existing Drainage Pattern of the Site or Project Area,
Including through the Alteration of the Course of a Stream or River, or Substantially Increase the Rate
or Amount of Surface Runoff in a Manner which would Result in Flooding On- or Off-site
The proposed Delevan Pipeline Intake Facilities would be constructed adjacent to the Sacramento River,
where an existing flood protection levee separates the river from upland areas. The proposed footprint
would not cover an area large enough to substantially alter existing drainage patterns or increase surface
runoff. During construction and operation, the facility would be surrounded by a wide berm or ring levee
that would have impacts on drainage patterns and surface runoff similar to those of the existing levee, and
therefore, would not increase the risk of flooding. The proposed intake would require the construction of a
large fish screen, which would be located on the west side of the river channel immediately downstream of
the Maxwell ID Pumping Plant. During construction, a sheet-pile cofferdam that would extend
This document is not released as a draft EIR pursuant to CEQA Guidelines § 15087. As such, DWR is not soliciting and will not respond to commentssubmitted on this document, although any comments received will be retained and may be considered during preparation of a future draft EIR.

Chapter 9: Flood Control and Management
PRELIMINARY – SUBJECT TO CHANGENORTH-OF-THE-DELTA OFFSTREAM STORAGE PROJECT EIR/EIS 9-34 PRELIMINARY ADMINISTRATIVE DRAFT DECEMBER 2013
WBG020812033556SAC/433094 (09-FLOOD_CONTROL_PRELIM_ADMIN_DRAFT_DEC2013.DOCX)
approximately 40 feet into the river channel would be required to allow dewatering of the construction area.
The cofferdam would be removed when construction is complete, but the operating fish screen would
continue to extend into the river channel. In-channel structures have the potential to alter the course of the
river. However, the preliminary fish screen was designed so as to not protrude into the river channel in a
manner that would substantially alter the river channel. In addition, the upstream Maxwell ID Pumping
Plant is located in a narrow section of the river and consequently acts as a local flow control point
(Reclamation, 2012). Maintenance of the facilities would not alter drainage patterns or affect surface runoff.
Therefore, construction, operation, and maintenance of the Delevan Pipeline Intake Facilities would result
in a less-than-significant impact on existing drainage patterns, stream courses, or surface runoff, when
compared to Existing Conditions and the No Project/No Action Alternative.
Impact Flood-2: Place within a 100-year Flood Hazard Area Structures which Could Impede or
Redirect Flood Flows
The Delevan Pipeline Intake Facilities would be located adjacent to the Sacramento River within an area
protected from the 100-year flood by existing levees along the Sacramento River. The Project includes
improvements to the levee in the area of the intake to enhance the flood protection for this facility. An earthen
setback levee (or ring levee around the site) would be installed for protection during construction and would
remain a permanent structure to provide secondary containment of the Sacramento River in the event of a
flood in the area. These above-ground structures would not impede 100-year flood flows during operation.
In addition, preliminary analysis shows that the proposed fish screen would not substantially impact the
water surface elevation at high flows. Water surface elevations with the proposed fish screen are not
expected to be significantly different than without the fish screen. The existing Maxwell ID Pumping
Plant upstream from the proposed intake location would be the controlling structure, causing greater
changes on Sacramento River water surface elevations at high flows than the proposed Delevan Pipeline
Intake Facilities (Reclamation, 2012). Maintenance activities would not place additional structures within
a flood hazard area. Therefore, construction, operation, and maintenance of the Delevan Pipeline Intake
Facilities would result in a less-than-significant impact on 100-year flood flows, when compared to
Existing Conditions and the No Project/No Action Alternative.
Impact Flood-3: Expose People or Structures to a Significant Risk of Loss, Injury, or Death from
Flooding, Including Flooding as a Result of the Failure of a Levee or Dam
Construction of the Delevan Pipeline Intake Facilities would require modification of the existing flood
protection levee along the Sacramento River. Construction work along the existing levee has the potential
to destabilize adjacent levee segments and, under worst-case conditions, cause their failure. DWR’s and
Reclamation’s construction contractor would use standard geotechnical engineering practices related to
the stabilization and compaction of soils during and after work around the levee for the Delevan Pipeline
Intake Facilities to ensure that the integrity of the levee is not compromised. Such practices include soil
densification of foundation soils to improve their stabilization and reduce potential liquefaction.
Construction plans, specifications, and inspections would be coordinated with the CVFPB, as appropriate.
It is unlikely that these facilities would significantly change the degree of protection of people and
property behind the levee or result in an increased risk of levee failure.
Operation of the intake facilities would require the construction and operation of a forebay and afterbay.
The forebay would be located on the river side of the existing Sacramento River levee, and would pass
water to the concrete-lined afterbay through levee tubes that would pass under the existing levee. A new
This document is not released as a draft EIR pursuant to CEQA Guidelines § 15087. As such, DWR is not soliciting and will not respond to commentssubmitted on this document, although any comments received will be retained and may be considered during preparation of a future draft EIR.

Chapter 9: Flood Control and Management
PRELIMINARY – SUBJECT TO CHANGEPRELIMINARY ADMINISTRATIVE DRAFT DECEMBER 2013 9-35 NORTH-OF-THE-DELTA OFFSTREAM STORAGE PROJECT EIR/EISWBG020812033556SAC/433094 (09-FLOOD_CONTROL_PRELIM_ADMIN_DRAFT_DEC2013.DOCX)
berm or ring levee would be constructed to enclose the afterbay. The remaining facilities would be
constructed and operated on top of the berm. During extreme flood events on the river, the forebay and
afterbay would be inundated, but these facilities and the levees would be designed to withstand these
conditions. Maintenance activities would include the removal of sediment from the afterbay sediment
spoil area. Sediment would be removed using a long arm excavator and suction dredge from within the
afterbay and would not affect the levees. Therefore, construction, operation, and maintenance of the
Delevan Pipeline Intake Facilities would result in a less-than-significant impact due to increased
flooding risks, including potential flooding due a levee or dam failure, when compared to Existing
Conditions and the No Project/No Action Alternative.
Project Buffer
Impact Flood-1: Substantially alter the Existing Drainage Pattern of the Site or Project Area,
Including through the Alteration of the Course of a Stream or River, or Substantially Increase the Rate
or Amount of Surface Runoff in a Manner which would Result in Flooding On- or Off-site
If Alternative A is implemented, construction-related activities within the Project Buffer would include
fence construction, demolition of several existing structures, and the creation of a fuelbreak. Ground
disturbance associated with fence construction would consist of digging post holes. The existing
structures to be demolished within the Project Buffer would include residences, sheds, shops, and barns.
A fuelbreak would be created around the perimeter of the buffer. Fence construction, structure
demolition, and the creation of a fuelbreak would not alter the course of a stream, and would not increase
the rate of runoff in a manner that would result in flooding because the footprint of the fence posts and
structures, as well as the area of the fuelbreak, represent a fraction of the acreage included in the Project
Buffer. Therefore, construction activities within the Project Buffer would result in a less-than-significant
impact on existing drainage patterns, stream courses, or surface runoff within the Primary Study Area,
when compared to Existing Conditions and the No Project/No Action Alternative.
Post-construction, Project operations and maintenance activities for the new fence and the fuelbreak
within the Project Buffer would result in a less-than-significant impact on existing drainage patterns,
stream courses, or surface runoff, when compared to Existing Conditions and the No Project/No Action
Alternative, because the land would be managed as undeveloped open space that would buffer Project
facilities from surrounding land uses.
Impact Flood-2: Place within a 100-year Flood Hazard Area Structures which Could Impede or
Redirect Flood Flows
If Alternative A is implemented, the only new structures that would be installed within the Project Buffer
would be fence posts. Fence construction, or the presence of the fence posts during operation, would not
impede or redirect flood flows because the footprint of the fence posts represents a fraction of the acreage
included in the Project Buffer. Maintenance activities would not place additional structures within the
Project Buffer. Therefore, construction, operation, and maintenance of the Proposed Take Line would
result in no impact to 100-year flood flows, when compared to Existing Conditions and the No
Project/No Action Alternative.
This document is not released as a draft EIR pursuant to CEQA Guidelines § 15087. As such, DWR is not soliciting and will not respond to commentssubmitted on this document, although any comments received will be retained and may be considered during preparation of a future draft EIR.

Chapter 9: Flood Control and Management
PRELIMINARY – SUBJECT TO CHANGENORTH-OF-THE-DELTA OFFSTREAM STORAGE PROJECT EIR/EIS 9-36 PRELIMINARY ADMINISTRATIVE DRAFT DECEMBER 2013
WBG020812033556SAC/433094 (09-FLOOD_CONTROL_PRELIM_ADMIN_DRAFT_DEC2013.DOCX)
Impact Flood-3: Expose People or Structures to a Significant Risk of Loss, Injury, or Death from
Flooding, Including Flooding as a Result of the Failure of a Levee or Dam
If Alternative A is implemented, no dams or levees would be needed for the land acquisition or
demarcation of the Project Buffer, and the Project Buffer would have no effect on an existing levee or
dam. Therefore, construction, operation, and maintenance of the Project Buffer would result in no impact
due to increased flooding risks, including potential flooding due a levee or dam failure, when compared to
Existing Conditions and the No Project/No Action Alternative.
9.3.7 Impacts Associated with Alternative B
9.3.7.1 Extended Study Area – Alternative B
Construction, Operation, and Maintenance Impacts
The impacts associated with Alternative B, as they relate to drainage patterns, stream courses, or surface
runoff (Impact Flood-1), 100-year flood flows (Impact Flood-2), and flooding risks (Impact Flood-3),
would be the same as described for Alternative A for the Extended Study Area.
9.3.7.2 Secondary Study Area – Alternative B
Construction, Operation, and Maintenance Impacts
Impacts due to the construction, operation, and maintenance of Alternative B, as they relate to drainage
patterns, stream courses, or surface runoff (Impact Flood-1) and 100-year flood flows (Impact Flood-2)
within the Secondary Study Area, would be the same as described for Alternative A. However, operational
changes resulting from coordination with a 1.81-MAF Sites Reservoir with two conveyances for Alternative
B, as opposed to the 1.27-MAF Sites Reservoir with three conveyances for Alternative A, have the potential
to impact flood control reservoirs in the Secondary Study Area. The difference in average end of month
elevation at the Secondary Study Area flood control reservoirs is described below.
Trinity Lake, Lewiston Lake, Trinity River, Klamath River Downstream of the Trinity River,
Whiskeytown Lake, Spring Creek, Shasta Lake, Sacramento River, Keswick Reservoir, Clear
Creek, Lake Oroville, Thermalito Complex (Thermalito Diversion Pool, Thermalito Forebay, and
Thermalito Afterbay), Feather River, Sutter Bypass, Yolo Bypass, Folsom Lake, Lake Natoma,
American River, Sacramento-San Joaquin Delta, Suisun Bay, San Pablo Bay, San Francisco Bay
Impact Flood-3: Expose People or Structures to a Significant Risk of Loss, Injury, or Death from
Flooding, Including Flooding as a Result of the Failure of a Levee or Dam
Impacts due to the construction and maintenance of Alternative B due to increased flooding risks within
the Secondary Study Area would be similar to those described for Alternative A.
Tables 9-16 through 9-23 indicate potential minor operational impacts to several flood control reservoirs
in the Secondary Study Area. Table 9-16 provides the average Shasta Lake end of the month water
surface elevation for Alternative B when compared to Existing Conditions over the long-term and by
water year type. The Above Normal and Wet year types are shown because flooding is most likely to
occur during these water year types. Long-term average changes to the water surface elevation would
range from a 0.0 to 0.5 percent increase. Changes expected for Above Normal and Wet years would be
less, at -0.1 to 0.1 percent and -0.2 to 0.1 percent, respectively.
This document is not released as a draft EIR pursuant to CEQA Guidelines § 15087. As such, DWR is not soliciting and will not respond to commentssubmitted on this document, although any comments received will be retained and may be considered during preparation of a future draft EIR.
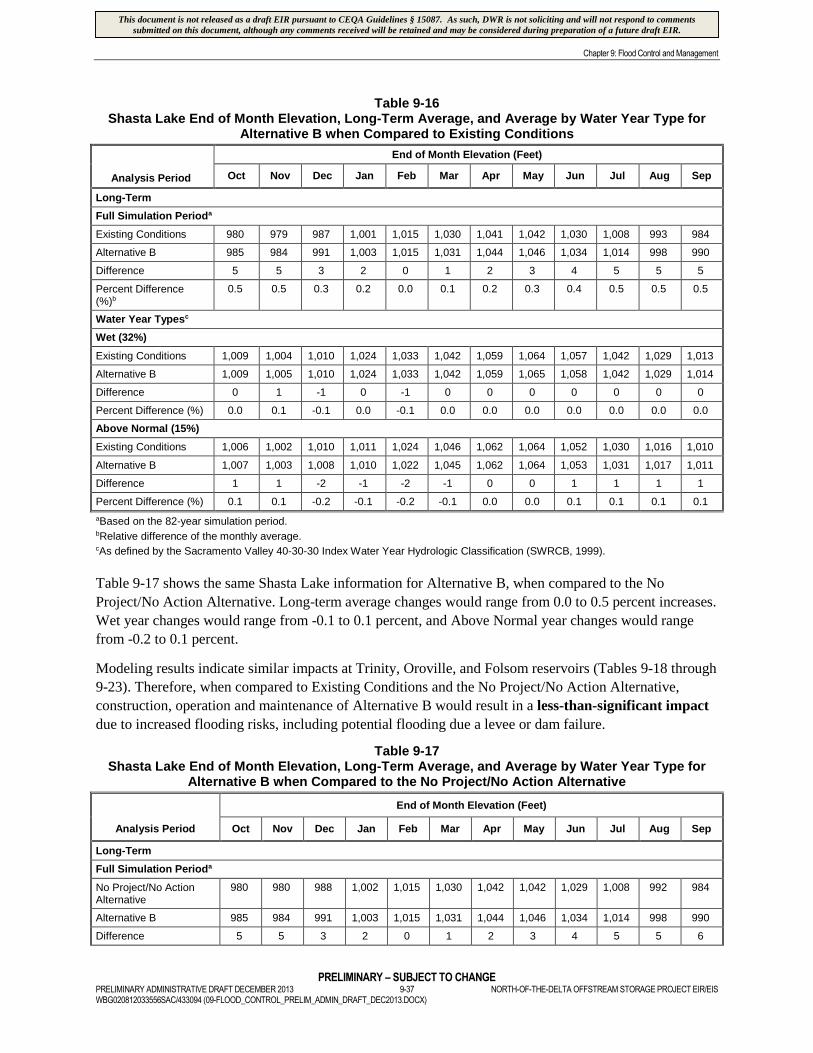
Chapter 9: Flood Control and Management
PRELIMINARY – SUBJECT TO CHANGEPRELIMINARY ADMINISTRATIVE DRAFT DECEMBER 2013 9-37 NORTH-OF-THE-DELTA OFFSTREAM STORAGE PROJECT EIR/EISWBG020812033556SAC/433094 (09-FLOOD_CONTROL_PRELIM_ADMIN_DRAFT_DEC2013.DOCX)
Table 9-16Shasta Lake End of Month Elevation, Long-Term Average, and Average by Water Year Type for
Alternative B when Compared to Existing Conditions
Analysis Period
End of Month Elevation (Feet)
Oct Nov Dec Jan Feb Mar Apr May Jun Jul Aug Sep
Long-Term
Full Simulation Perioda
Existing Conditions 980 979 987 1,001 1,015 1,030 1,041 1,042 1,030 1,008 993 984
Alternative B 985 984 991 1,003 1,015 1,031 1,044 1,046 1,034 1,014 998 990
Difference 5 5 3 2 0 1 2 3 4 5 5 5
Percent Difference(%)b
0.5 0.5 0.3 0.2 0.0 0.1 0.2 0.3 0.4 0.5 0.5 0.5
Water Year Typesc
Wet (32%)
Existing Conditions 1,009 1,004 1,010 1,024 1,033 1,042 1,059 1,064 1,057 1,042 1,029 1,013
Alternative B 1,009 1,005 1,010 1,024 1,033 1,042 1,059 1,065 1,058 1,042 1,029 1,014
Difference 0 1 -1 0 -1 0 0 0 0 0 0 0
Percent Difference (%) 0.0 0.1 -0.1 0.0 -0.1 0.0 0.0 0.0 0.0 0.0 0.0 0.0
Above Normal (15%)
Existing Conditions 1,006 1,002 1,010 1,011 1,024 1,046 1,062 1,064 1,052 1,030 1,016 1,010
Alternative B 1,007 1,003 1,008 1,010 1,022 1,045 1,062 1,064 1,053 1,031 1,017 1,011
Difference 1 1 -2 -1 -2 -1 0 0 1 1 1 1
Percent Difference (%) 0.1 0.1 -0.2 -0.1 -0.2 -0.1 0.0 0.0 0.1 0.1 0.1 0.1
aBased on the 82-year simulation period.bRelative difference of the monthly average.cAs defined by the Sacramento Valley 40-30-30 Index Water Year Hydrologic Classification (SWRCB, 1999).
Table 9-17 shows the same Shasta Lake information for Alternative B, when compared to the No
Project/No Action Alternative. Long-term average changes would range from 0.0 to 0.5 percent increases.
Wet year changes would range from -0.1 to 0.1 percent, and Above Normal year changes would range
from -0.2 to 0.1 percent.
Modeling results indicate similar impacts at Trinity, Oroville, and Folsom reservoirs (Tables 9-18 through
9-23). Therefore, when compared to Existing Conditions and the No Project/No Action Alternative,
construction, operation and maintenance of Alternative B would result in a less-than-significant impact
due to increased flooding risks, including potential flooding due a levee or dam failure.
Table 9-17Shasta Lake End of Month Elevation, Long-Term Average, and Average by Water Year Type for
Alternative B when Compared to the No Project/No Action Alternative
Analysis Period
End of Month Elevation (Feet)
Oct Nov Dec Jan Feb Mar Apr May Jun Jul Aug Sep
Long-Term
Full Simulation Perioda
No Project/No ActionAlternative
980 980 988 1,002 1,015 1,030 1,042 1,042 1,029 1,008 992 984
Alternative B 985 984 991 1,003 1,015 1,031 1,044 1,046 1,034 1,014 998 990
Difference 5 5 3 2 0 1 2 3 4 5 5 6
This document is not released as a draft EIR pursuant to CEQA Guidelines § 15087. As such, DWR is not soliciting and will not respond to commentssubmitted on this document, although any comments received will be retained and may be considered during preparation of a future draft EIR.

Chapter 9: Flood Control and Management
PRELIMINARY – SUBJECT TO CHANGENORTH-OF-THE-DELTA OFFSTREAM STORAGE PROJECT EIR/EIS 9-38 PRELIMINARY ADMINISTRATIVE DRAFT DECEMBER 2013
WBG020812033556SAC/433094 (09-FLOOD_CONTROL_PRELIM_ADMIN_DRAFT_DEC2013.DOCX)
Table 9-17Shasta Lake End of Month Elevation, Long-Term Average, and Average by Water Year Type for
Alternative B when Compared to the No Project/No Action Alternative
Analysis Period
End of Month Elevation (Feet)
Oct Nov Dec Jan Feb Mar Apr May Jun Jul Aug Sep
Percent Difference (%)b 0.6 0.5 0.3 0.2 0.0 0.1 0.2 0.3 0.4 0.5 0.6 0.6
Water Year Typesc
Wet (32%)
No Project/No ActionAlternative
1,008 1,003 1,010 1,024 1,033 1,042 1,059 1,064 1,057 1,042 1,029 1,012
Alternative B 1,009 1,005 1,010 1,024 1,033 1,042 1,059 1,065 1,058 1,042 1,029 1,014
Difference 1 1 -1 0 -1 0 0 0 0 0 1 2
Percent Difference (%) 0.1 0.1 -0.1 0.0 -0.1 0.0 0.0 0.0 0.0 0.0 0.1 0.2
Above Normal (15%)
No Project/No ActionAlternative
1,004 1,001 1,009 1,010 1,023 1,045 1,062 1,064 1,051 1,030 1,015 1,008
Alternative B 1,007 1,003 1,008 1,010 1,022 1,045 1,062 1,064 1,053 1,031 1,017 1,011
Difference 3 2 -1 0 -2 0 0 0 1 2 2 3
Percent Difference (%) 0.3 0.2 -0.1 0.0 -0.2 0.0 0.0 0.0 0.1 0.1 0.2 0.3
aBased on the 82-year simulation period.bRelative difference of the monthly average.cAs defined by the Sacramento Valley 40-30-30 Index Water Year Hydrologic Classification (SWRCB, 1999).
Table 9-18Trinity Lake End of Month Elevation, Long-Term Average, and Average by Water Year Type for
Alternative B when Compared to Existing Conditions
Average Type
End of Month Elevation (Feet)
Oct Nov Dec Jan Feb Mar Apr May Jun Jul Aug Sep
Long-Term
Full Simulation Perioda
Percent Difference (%)b 0.2 0.3 0.3 0.2 0.2 0.2 0.2 0.2 0.2 0.2 0.2 0.2
Water Year Typesc
Wet (32%)
Percent Difference (%) 0.0 0.0 0.0 0.1 0.1 0.1 0.0 0.0 0.0 0.0 0.0 0.0
Above Normal (15%)
Percent Difference (%) 0.2 0.2 0.2 0.3 0.3 0.2 0.2 0.2 0.2 0.2 0.2 0.2
aBased on the 82-year simulation period.bRelative difference of the monthly average.cAs defined by the Sacramento Valley 40-30-30 Index Water Year Hydrologic Classification (SWRCB, 1999).
This document is not released as a draft EIR pursuant to CEQA Guidelines § 15087. As such, DWR is not soliciting and will not respond to commentssubmitted on this document, although any comments received will be retained and may be considered during preparation of a future draft EIR.
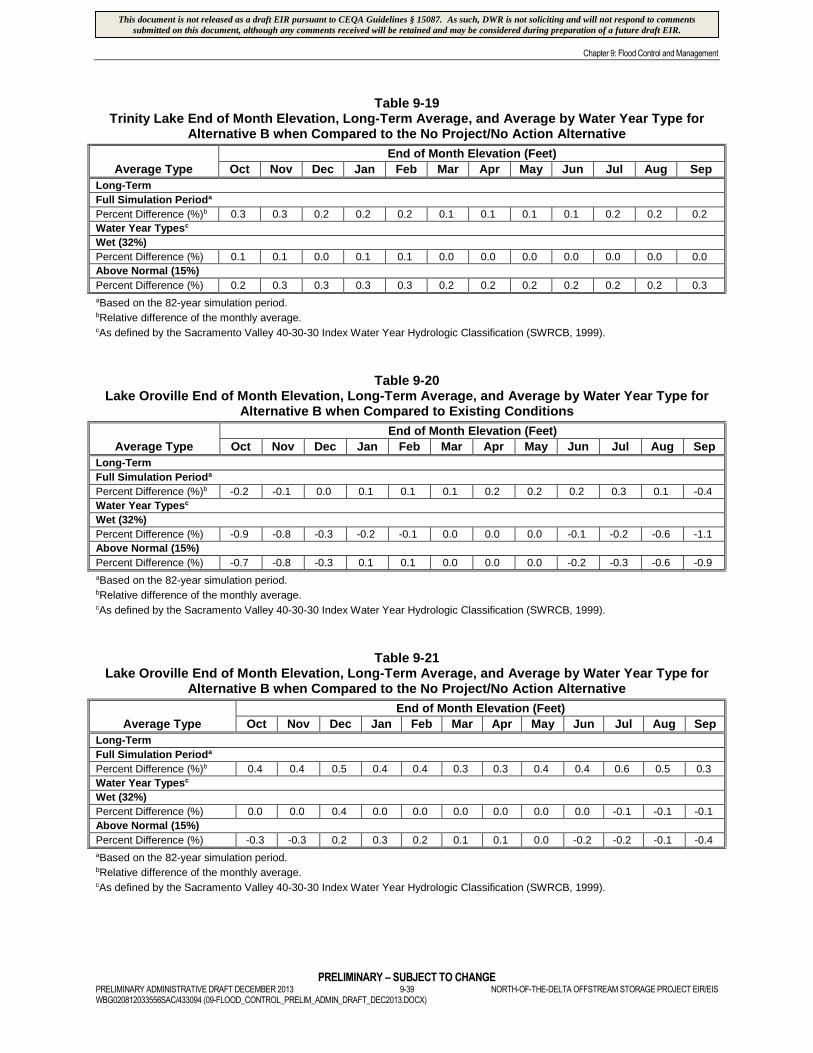
Chapter 9: Flood Control and Management
PRELIMINARY – SUBJECT TO CHANGEPRELIMINARY ADMINISTRATIVE DRAFT DECEMBER 2013 9-39 NORTH-OF-THE-DELTA OFFSTREAM STORAGE PROJECT EIR/EISWBG020812033556SAC/433094 (09-FLOOD_CONTROL_PRELIM_ADMIN_DRAFT_DEC2013.DOCX)
Table 9-19Trinity Lake End of Month Elevation, Long-Term Average, and Average by Water Year Type for
Alternative B when Compared to the No Project/No Action Alternative
Average Type
End of Month Elevation (Feet)
Oct Nov Dec Jan Feb Mar Apr May Jun Jul Aug Sep
Long-Term
Full Simulation Perioda
Percent Difference (%)b 0.3 0.3 0.2 0.2 0.2 0.1 0.1 0.1 0.1 0.2 0.2 0.2
Water Year Typesc
Wet (32%)
Percent Difference (%) 0.1 0.1 0.0 0.1 0.1 0.0 0.0 0.0 0.0 0.0 0.0 0.0
Above Normal (15%)
Percent Difference (%) 0.2 0.3 0.3 0.3 0.3 0.2 0.2 0.2 0.2 0.2 0.2 0.3
aBased on the 82-year simulation period.bRelative difference of the monthly average.cAs defined by the Sacramento Valley 40-30-30 Index Water Year Hydrologic Classification (SWRCB, 1999).
Table 9-20Lake Oroville End of Month Elevation, Long-Term Average, and Average by Water Year Type for
Alternative B when Compared to Existing Conditions
Average Type
End of Month Elevation (Feet)
Oct Nov Dec Jan Feb Mar Apr May Jun Jul Aug Sep
Long-Term
Full Simulation Perioda
Percent Difference (%)b -0.2 -0.1 0.0 0.1 0.1 0.1 0.2 0.2 0.2 0.3 0.1 -0.4
Water Year Typesc
Wet (32%)
Percent Difference (%) -0.9 -0.8 -0.3 -0.2 -0.1 0.0 0.0 0.0 -0.1 -0.2 -0.6 -1.1
Above Normal (15%)
Percent Difference (%) -0.7 -0.8 -0.3 0.1 0.1 0.0 0.0 0.0 -0.2 -0.3 -0.6 -0.9
aBased on the 82-year simulation period.bRelative difference of the monthly average.cAs defined by the Sacramento Valley 40-30-30 Index Water Year Hydrologic Classification (SWRCB, 1999).
Table 9-21Lake Oroville End of Month Elevation, Long-Term Average, and Average by Water Year Type for
Alternative B when Compared to the No Project/No Action Alternative
Average Type
End of Month Elevation (Feet)
Oct Nov Dec Jan Feb Mar Apr May Jun Jul Aug Sep
Long-Term
Full Simulation Perioda
Percent Difference (%)b 0.4 0.4 0.5 0.4 0.4 0.3 0.3 0.4 0.4 0.6 0.5 0.3
Water Year Typesc
Wet (32%)
Percent Difference (%) 0.0 0.0 0.4 0.0 0.0 0.0 0.0 0.0 0.0 -0.1 -0.1 -0.1
Above Normal (15%)
Percent Difference (%) -0.3 -0.3 0.2 0.3 0.2 0.1 0.1 0.0 -0.2 -0.2 -0.1 -0.4
aBased on the 82-year simulation period.bRelative difference of the monthly average.cAs defined by the Sacramento Valley 40-30-30 Index Water Year Hydrologic Classification (SWRCB, 1999).
This document is not released as a draft EIR pursuant to CEQA Guidelines § 15087. As such, DWR is not soliciting and will not respond to commentssubmitted on this document, although any comments received will be retained and may be considered during preparation of a future draft EIR.
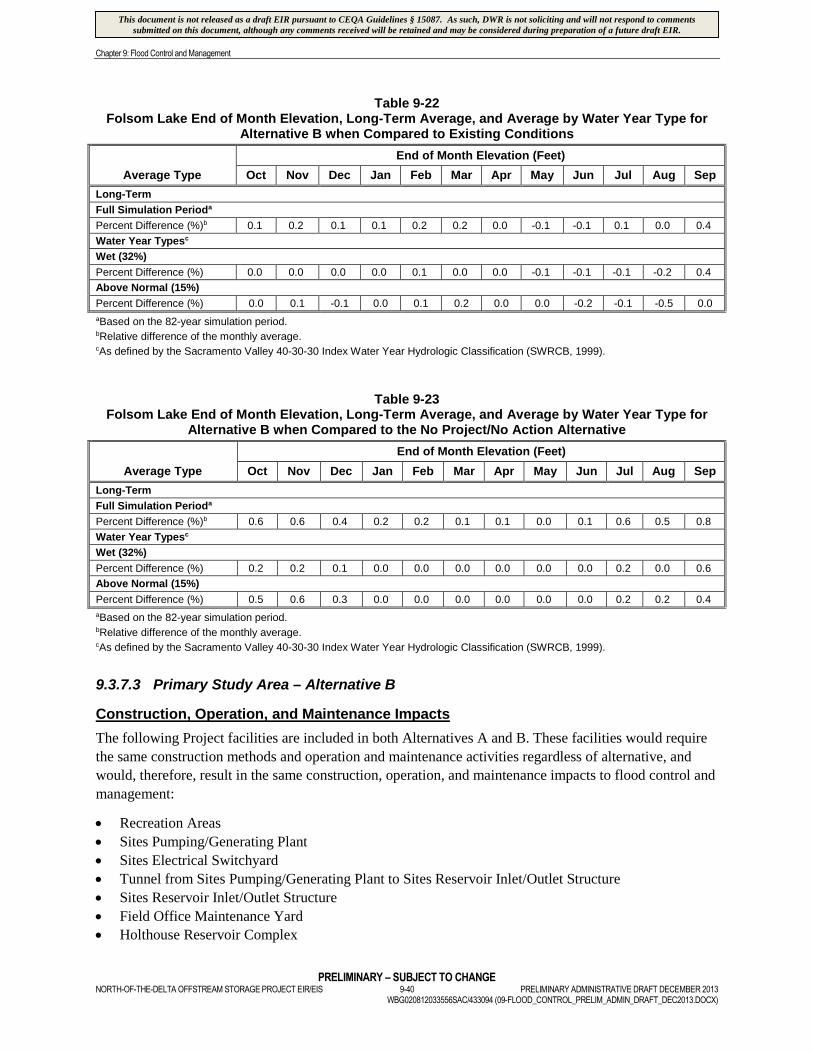
Chapter 9: Flood Control and Management
PRELIMINARY – SUBJECT TO CHANGENORTH-OF-THE-DELTA OFFSTREAM STORAGE PROJECT EIR/EIS 9-40 PRELIMINARY ADMINISTRATIVE DRAFT DECEMBER 2013
WBG020812033556SAC/433094 (09-FLOOD_CONTROL_PRELIM_ADMIN_DRAFT_DEC2013.DOCX)
Table 9-22Folsom Lake End of Month Elevation, Long-Term Average, and Average by Water Year Type for
Alternative B when Compared to Existing Conditions
Average Type
End of Month Elevation (Feet)
Oct Nov Dec Jan Feb Mar Apr May Jun Jul Aug Sep
Long-Term
Full Simulation Perioda
Percent Difference (%)b 0.1 0.2 0.1 0.1 0.2 0.2 0.0 -0.1 -0.1 0.1 0.0 0.4
Water Year Typesc
Wet (32%)
Percent Difference (%) 0.0 0.0 0.0 0.0 0.1 0.0 0.0 -0.1 -0.1 -0.1 -0.2 0.4
Above Normal (15%)
Percent Difference (%) 0.0 0.1 -0.1 0.0 0.1 0.2 0.0 0.0 -0.2 -0.1 -0.5 0.0
aBased on the 82-year simulation period.bRelative difference of the monthly average.cAs defined by the Sacramento Valley 40-30-30 Index Water Year Hydrologic Classification (SWRCB, 1999).
Table 9-23Folsom Lake End of Month Elevation, Long-Term Average, and Average by Water Year Type for
Alternative B when Compared to the No Project/No Action Alternative
Average Type
End of Month Elevation (Feet)
Oct Nov Dec Jan Feb Mar Apr May Jun Jul Aug Sep
Long-Term
Full Simulation Perioda
Percent Difference (%)b 0.6 0.6 0.4 0.2 0.2 0.1 0.1 0.0 0.1 0.6 0.5 0.8
Water Year Typesc
Wet (32%)
Percent Difference (%) 0.2 0.2 0.1 0.0 0.0 0.0 0.0 0.0 0.0 0.2 0.0 0.6
Above Normal (15%)
Percent Difference (%) 0.5 0.6 0.3 0.0 0.0 0.0 0.0 0.0 0.0 0.2 0.2 0.4
aBased on the 82-year simulation period.bRelative difference of the monthly average.cAs defined by the Sacramento Valley 40-30-30 Index Water Year Hydrologic Classification (SWRCB, 1999).
9.3.7.3 Primary Study Area – Alternative B
Construction, Operation, and Maintenance Impacts
The following Project facilities are included in both Alternatives A and B. These facilities would require
the same construction methods and operation and maintenance activities regardless of alternative, and
would, therefore, result in the same construction, operation, and maintenance impacts to flood control and
management:
Recreation Areas
Sites Pumping/Generating Plant
Sites Electrical Switchyard
Tunnel from Sites Pumping/Generating Plant to Sites Reservoir Inlet/Outlet Structure
Sites Reservoir Inlet/Outlet Structure
Field Office Maintenance Yard
Holthouse Reservoir Complex
This document is not released as a draft EIR pursuant to CEQA Guidelines § 15087. As such, DWR is not soliciting and will not respond to commentssubmitted on this document, although any comments received will be retained and may be considered during preparation of a future draft EIR.

Chapter 9: Flood Control and Management
PRELIMINARY – SUBJECT TO CHANGEPRELIMINARY ADMINISTRATIVE DRAFT DECEMBER 2013 9-41 NORTH-OF-THE-DELTA OFFSTREAM STORAGE PROJECT EIR/EISWBG020812033556SAC/433094 (09-FLOOD_CONTROL_PRELIM_ADMIN_DRAFT_DEC2013.DOCX)
Holthouse Reservoir Electrical Switchyard
GCID Canal Facilities Modifications
GCID Canal Connection to the TRR
TRR
TRR Pumping/Generating Plant
TRR Electrical Switchyard
TRR Pipeline
TRR Pipeline Road
Delevan Pipeline
Delevan Pipeline Electrical Switchyard
The proposed 1.81-MAF Sites Reservoir associated with implementation of Alternative B would require the
construction of two main dams and nine saddle dams. The crest elevation of all dams would be 540 feet,
providing 20 feet of freeboard above the maximum operating elevation of 520 feet. The emergency spillway
elevation would be at 525.5 feet. The larger reservoir would be constructed pursuant to the same
conservative guidelines and criteria designed to prevent failure as described for Alternative A. The larger
Alternative B reservoir and associated dams would capture flood flows on Funks and Stone Corral creeks
and control downstream releases to these creeks as described for Alternative A, and therefore, would have
the same impacts on drainage patterns, stream courses, or surface runoff (Impact Flood-1), 100-year flood
flows (Impact Flood-2), and flooding risks (Impact Flood-3) as described for Alternative A.
The additional saddle dams associated with implementation of Alternative B would require additional
saddle dam access roads. However, the slight extension of the saddle dam access roads would result in the
same impacts on drainage patterns, stream courses, or surface runoff (Impact Flood-1), 100-year flood
flows (Impact Flood-2), and flooding risks (Impact Flood-3) as described for Alternative A.
If Alternative B is implemented, the proposed Delevan Transmission Line would extend from only the
Inlet/Outlet Structure to the existing PG&E or WAPA transmission line and consequently would not cross
the Special Flood Hazard Area. The shorter transmission line would require fewer concrete footings, thus
creating a smaller land disturbance footprint than the Alternative A transmission line configuration. These
reduced effects would result in the same level of significance of impacts to drainage patterns, stream
courses, or surface runoff (Impact Flood-1), 100-year flood flows (Impact Flood-2), and flooding risks
(Impact Flood-3) as was described for Alternative A.
The Delevan Pipeline Intake Facilities would be replaced with the smaller Delevan Pipeline Discharge
Facility, which would not extend into the river channel, and therefore, would not alter the course of a
stream. The Discharge Facility would require similar levee modifications as the Intake Facilities. The
smaller footprint would have similar impacts on drainage patterns, stream courses, or surface runoff
(Impact Flood-1), 100-year flood flows (Impact Flood-2), and flooding risks (Impact Flood-3) as was
described for Alternative A.
The boundary of the Project Buffer would be the same for Alternatives A and B, but because the
footprints of some of the Project facilities that are surrounded by the Project Buffer would differ between
the alternatives, the acreage of land within the Project Buffer would also differ. However, this difference
in the size of the buffer would not change the type of construction, operation, and maintenance activities
that were described for Alternative A. It would, therefore, have the same impact on drainage patterns,
stream courses, or surface runoff (Impact Flood-1), 100-year flood flows (Impact Flood-2), and
flooding risks (Impact Flood-3) as was described for Alternative A.
This document is not released as a draft EIR pursuant to CEQA Guidelines § 15087. As such, DWR is not soliciting and will not respond to commentssubmitted on this document, although any comments received will be retained and may be considered during preparation of a future draft EIR.

Chapter 9: Flood Control and Management
PRELIMINARY – SUBJECT TO CHANGENORTH-OF-THE-DELTA OFFSTREAM STORAGE PROJECT EIR/EIS 9-42 PRELIMINARY ADMINISTRATIVE DRAFT DECEMBER 2013
WBG020812033556SAC/433094 (09-FLOOD_CONTROL_PRELIM_ADMIN_DRAFT_DEC2013.DOCX)
9.3.8 Impacts Associated with Alternative C
9.3.8.1 Extended Study Area – Alternative C
Construction, Operation, and Maintenance Impacts
The impact of Alternative C on drainage patterns, stream courses, or surface runoff (Impact Flood-1),
100-year flood flows (Impact Flood-2), and flooding risks (Impact Flood-3) would be the same as
described for Alternative A for the Extended Study Area.
9.3.8.2 Secondary Study Area – Alternative C
Construction, Operation, and Maintenance Impacts
The impact of Alternative C on drainage patterns, stream courses, or surface runoff (Impact Flood-1) and
100-year flood flows (Impact Flood-2) within the Secondary Study Area would be the same as described
for Alternative A. However, operational changes resulting from coordination with a 1.81-MAF Sites
Reservoir with three conveyances for Alternative C, as opposed to the 1.27-MAF Sites Reservoir with
three conveyances for Alternative A, have the potential to impact flood control reservoirs in the Secondary
Study Area. The difference in average end of month elevation at the Secondary Study Area flood control
reservoirs is described below.
Trinity Lake, Lewiston Lake, Trinity River, Klamath River Downstream of the Trinity River,
Whiskeytown Lake, Spring Creek, Shasta Lake, Sacramento River, Keswick Reservoir, Clear
Creek, Lake Oroville, Thermalito Complex (Thermalito Diversion Pool, Thermalito Forebay, and
Thermalito Afterbay), Feather River, Sutter Bypass, Yolo Bypass, Folsom Lake, Lake Natoma,
American River, Sacramento-San Joaquin Delta, Suisun Bay, San Pablo Bay, San Francisco Bay
Impact Flood-3: Expose People or Structures to a Significant Risk of Loss, Injury, or Death from
Flooding, Including Flooding as a Result of the Failure of a Levee or Dam
The impacts due to construction and maintenance of Alternative C within the Secondary Study Area
would be similar to those described for Alternative B.
Tables 9-24 through 9-31 indicate potential minor operational impacts to several flood control reservoirs
in the Secondary Study Area. Table 9-24 provides the average Shasta Lake end of the month water
surface elevation for Alternative C, when compared to Existing Conditions over the long-term and by
water year type. The Above Normal and Wet year types are shown because flooding is most likely to
occur during these water year types. Long-term average changes to the water surface elevation in Shasta
Lake would range from a 0.1 to 0.6 percent increase. Changes in Above Normal and Wet years would be
even less, at -0.1 to 0.1 percent and -0.1 to 0.3 percent, respectively.
Table 9-24Shasta Lake End of Month Elevation, Long-Term Average, and Average by Water Year Type for
Alternative C when Compared to Existing Conditions
Analysis Period
End of Month Elevation (Feet)
Oct Nov Dec Jan Feb Mar Apr May Jun Jul Aug Sep
Long-Term
Full Simulation Perioda
Existing Conditions 980 979 987 1,001 1,015 1,030 1,041 1,042 1,030 1,008 993 984
Alternative C 986 985 992 1,004 1,016 1,032 1,044 1,046 1,034 1,014 998 990
This document is not released as a draft EIR pursuant to CEQA Guidelines § 15087. As such, DWR is not soliciting and will not respond to commentssubmitted on this document, although any comments received will be retained and may be considered during preparation of a future draft EIR.

Chapter 9: Flood Control and Management
PRELIMINARY – SUBJECT TO CHANGEPRELIMINARY ADMINISTRATIVE DRAFT DECEMBER 2013 9-43 NORTH-OF-THE-DELTA OFFSTREAM STORAGE PROJECT EIR/EISWBG020812033556SAC/433094 (09-FLOOD_CONTROL_PRELIM_ADMIN_DRAFT_DEC2013.DOCX)
Table 9-24Shasta Lake End of Month Elevation, Long-Term Average, and Average by Water Year Type for
Alternative C when Compared to Existing Conditions
Analysis Period
End of Month Elevation (Feet)
Oct Nov Dec Jan Feb Mar Apr May Jun Jul Aug Sep
Difference 6 6 4 3 1 2 3 3 5 5 5 6
Percent Difference (%)b 0.6 0.6 0.4 0.3 0.1 0.2 0.2 0.3 0.5 0.5 0.5 0.6
Water Year Typesc
Wet (32%)
Existing Conditions 1,009
1,004 1,010 1,024 1,033 1,042 1,059 1,064 1,057 1,042 1,029 1,013
Alternative C 1,010
1,005 1,009 1,024 1,033 1,042 1,059 1,064 1,057 1,043 1,030 1,014
Difference 1 1 -1 0 0 0 0 0 0 0 1 1
Percent Difference (%) 0.1 0.1 -0.1 0.0 0.0 0.0 0.0 0.0 0.0 0.0 0.1 0.1
Above Normal (15%)
Existing Conditions 1,006
1,002 1,010 1,011 1,024 1,046 1,062 1,064 1,052 1,030 1,016 1,010
Alternative C 1,008
1,004 1,008 1,012 1,023 1,046 1,062 1,064 1,053 1,031 1,018 1,013
Difference 3 1 -1 1 -1 0 0 0 1 1 2 3
Percent Difference (%) 0.2 0.1 -0.1 0.1 -0.1 0.0 0.0 0.0 0.1 0.1 0.2 0.3
aBased on the 82-year simulation period.bRelative difference of the monthly average.cAs defined by the Sacramento Valley 40-30-30 Index Water Year Hydrologic Classification (SWRCB, 1999).
Table 9-25 shows the same Shasta Lake information for Alternative C, when compared to the No
Project/No Action Alternative. Long-term average changes would range from 0.1 to 0.6 percent. Wet year
changes would range from -0.1 to 0.1 percent, and Above Normal year changes would range from -0.1 to
0.3 percent.
Modeling results indicate similar impacts at Trinity, Oroville, and Folsom reservoirs (Tables 9-26
through 9-31).
Therefore, when compared to Existing Conditions and the No Project/No Action Alternative,
construction, operation and maintenance of Alternative C would result in a less–than-significant impact
due to increased flooding risks, including potential flooding due a levee or dam failure.
Table 9-25Shasta Lake End of Month Elevation, Long-Term Average, and Average by Water Year Type for
Alternative C when Compared to the No Project/No Action Alternative
Analysis Period
End of Month Elevation (Feet)
Oct Nov Dec Jan Feb Mar Apr May Jun Jul Aug Sep
Long-Term
Full Simulation Perioda
No Project/No ActionAlternative
980 980 988 1,002 1,015 1,030 1,042 1,042 1,029 1,008 992 984
Alternative C 986 985 992 1,004 1,016 1,032 1,044 1,046 1,034 1,014 998 990
Difference 6 6 4 3 1 2 2 3 5 6 6 6
This document is not released as a draft EIR pursuant to CEQA Guidelines § 15087. As such, DWR is not soliciting and will not respond to commentssubmitted on this document, although any comments received will be retained and may be considered during preparation of a future draft EIR.

Chapter 9: Flood Control and Management
PRELIMINARY – SUBJECT TO CHANGENORTH-OF-THE-DELTA OFFSTREAM STORAGE PROJECT EIR/EIS 9-44 PRELIMINARY ADMINISTRATIVE DRAFT DECEMBER 2013
WBG020812033556SAC/433094 (09-FLOOD_CONTROL_PRELIM_ADMIN_DRAFT_DEC2013.DOCX)
Table 9-25Shasta Lake End of Month Elevation, Long-Term Average, and Average by Water Year Type for
Alternative C when Compared to the No Project/No Action Alternative
Analysis Period
End of Month Elevation (Feet)
Oct Nov Dec Jan Feb Mar Apr May Jun Jul Aug Sep
Percent Difference (%)b 0.6 0.6 0.4 0.3 0.1 0.2 0.2 0.3 0.5 0.6 0.6 0.7
Water Year Typesc
Wet (32%)
No Project/No ActionAlternative
1,008 1,003 1,010 1,024 1,033 1,042 1,059 1,064 1,057 1,042 1,029 1,012
Alternative C 1,010 1,005 1,009 1,024 1,033 1,042 1,059 1,064 1,057 1,043 1,030 1,014
Difference 2 1 -1 0 -1 0 0 0 0 1 1 3
Percent Difference (%) 0.2 0.1 -0.1 0.0 -0.1 0.0 0.0 0.0 0.0 0.1 0.1 0.2
Above Normal (15%)
No Project/No ActionAlternative
1,004 1,001 1,009 1,010 1,023 1,045 1,062 1,064 1,051 1,030 1,015 1,008
Alternative C 1,008 1,004 1,008 1,012 1,023 1,046 1,062 1,064 1,053 1,031 1,018 1,013
Difference 4 3 0 2 0 0 0 0 1 2 3 5
Percent Difference (%) 0.4 0.3 0.0 0.2 0.0 0.0 0.0 0.0 0.1 0.2 0.3 0.5
Below Normal (17%)
No Project/No ActionAlternative
999 1,002 1,006 1,000 1,017 1,034 1,049 1,050 1,038 1,017 1,002 999
Alternative C 1,000 1,003 1,005 1,001 1,016 1,034 1,049 1,051 1,040 1,018 1,005 1,002
Difference 2 1 -1 0 -1 0 0 0 2 1 3 2
Percent Difference (%) 0.2 0.1 -0.1 0.0 -0.1 0.0 0.0 0.0 0.2 0.1 0.3 0.2
aBased on the 82-year simulation period.bRelative difference of the monthly average.cAs defined by the Sacramento Valley 40-30-30 Index Water Year Hydrologic Classification (SWRCB, 1999).
Table 9-26Trinity Lake End of Month Elevation, Long-Term Average, and Average by Water Year Type for
Alternative C when Compared to Existing Conditions
Analysis Period and WaterYear Types Oct Nov Dec Jan Feb Mar Apr May Jun Jul Aug Sep
Long-Term
Full Simulation Perioda
Percent Difference (%)b 0.3 0.4 0.3 0.3 0.2 0.2 0.2 0.2 0.2 0.2 0.3 0.3
Water Year Typesc
Wet (32%)
Percent Difference (%) 0.1 0.1 0.0 0.1 0.1 0.1 0.0 0.0 0.0 0.0 0.0 0.0
Above Normal (15%)
Percent Difference (%) 0.2 0.3 0.3 0.5 0.4 0.3 0.3 0.3 0.3 0.3 0.3 0.3
aBased on the 82-year simulation period.bRelative difference of the monthly average.cAs defined by the Sacramento Valley 40-30-30 Index Water Year Hydrologic Classification (SWRCB, 1999).
This document is not released as a draft EIR pursuant to CEQA Guidelines § 15087. As such, DWR is not soliciting and will not respond to commentssubmitted on this document, although any comments received will be retained and may be considered during preparation of a future draft EIR.

Chapter 9: Flood Control and Management
PRELIMINARY – SUBJECT TO CHANGEPRELIMINARY ADMINISTRATIVE DRAFT DECEMBER 2013 9-45 NORTH-OF-THE-DELTA OFFSTREAM STORAGE PROJECT EIR/EISWBG020812033556SAC/433094 (09-FLOOD_CONTROL_PRELIM_ADMIN_DRAFT_DEC2013.DOCX)
Table 9-27Trinity Lake End of Month Elevation, Long-Term Average, and Average by Water Year Type for
Alternative C when Compared to the No Project/No Action Alternative
Average Type
End of Month Elevation (Feet)
Oct Nov Dec Jan Feb Mar Apr May Jun Jul Aug Sep
Long-Term
Full Simulation Perioda
Percent Difference (%)b 0.3 0.3 0.3 0.2 0.2 0.2 0.2 0.2 0.2 0.2 0.2 0.3
Water Year Typesc
Wet (32%)
Percent Difference (%) 0.1 0.1 0.1 0.1 0.1 0.0 0.0 0.0 0.0 0.0 0.0 0.0
Above Normal (15%)
Percent Difference (%) 0.3 0.3 0.3 0.5 0.5 0.4 0.3 0.3 0.3 0.3 0.3 0.3
aBased on the 82-year simulation period.bRelative difference of the monthly average.cAs defined by the Sacramento Valley 40-30-30 Index Water Year Hydrologic Classification (SWRCB, 1999).
Table 9-28Lake Oroville End of Month Elevation, Long-Term Average, and Average by Water Year Type for
Alternative C when Compared to Existing Conditions
Analysis Period and WaterYear Type Oct Nov Dec Jan Feb Mar Apr May Jun Jul Aug Sep
Full Simulation Perioda
Percent Difference (%)b -0.2 -0.1 0.2 0.2 0.1 0.1 0.2 0.2 0.0 0.1 0.0 -0.4
Water Year Typesc
Wet (32%)
Percent Difference (%) -0.8 -0.7 -0.1 0.0 -0.1 0.0 0.0 0.0 -0.1 -0.3 -0.6 -1.0
Above Normal (15%)
Percent Difference (%) -0.5 -0.5 0.0 0.2 0.1 0.0 0.0 0.0 -0.3 -0.4 -0.4 -0.7
aBased on the 82-year simulation period.bRelative difference of the monthly average.cAs defined by the Sacramento Valley 40-30-30 Index Water Year Hydrologic Classification (SWRCB, 1999).
Table 9-29Lake Oroville End of Month Elevation, Long-Term Average, and Average by Water Year Type for
Alternative C when Compared to the No Project/No Action Alternative
Average Type
End of Month Elevation (Feet)
Oct Nov Dec Jan Feb Mar Apr May Jun Jul Aug Sep
Long-Term
Full Simulation Perioda
Percent Difference (%)b 0.4 0.4 0.6 0.5 0.4 0.3 0.3 0.3 0.3 0.4 0.4 0.2
Water Year Typesc
Wet (32%)
Percent Difference (%) 0.1 0.2 0.5 0.2 0.0 0.0 0.0 0.0 -0.1 -0.1 -0.1 -0.1
Above Normal (15%)
Percent Difference (%) 0.0 -0.1 0.5 0.4 0.2 0.0 0.0 0.0 -0.2 -0.2 0.0 -0.2
aBased on the 82-year simulation period.bRelative difference of the monthly average.cAs defined by the Sacramento Valley 40-30-30 Index Water Year Hydrologic Classification (SWRCB, 1999).
This document is not released as a draft EIR pursuant to CEQA Guidelines § 15087. As such, DWR is not soliciting and will not respond to commentssubmitted on this document, although any comments received will be retained and may be considered during preparation of a future draft EIR.
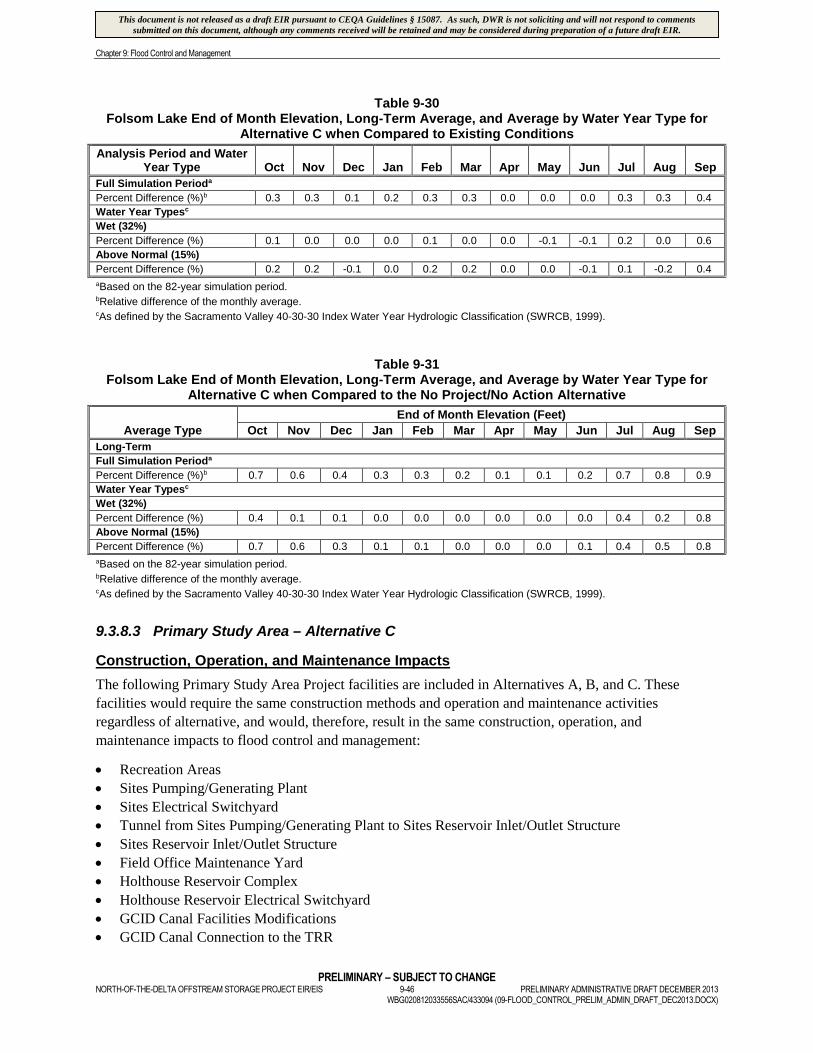
Chapter 9: Flood Control and Management
PRELIMINARY – SUBJECT TO CHANGENORTH-OF-THE-DELTA OFFSTREAM STORAGE PROJECT EIR/EIS 9-46 PRELIMINARY ADMINISTRATIVE DRAFT DECEMBER 2013
WBG020812033556SAC/433094 (09-FLOOD_CONTROL_PRELIM_ADMIN_DRAFT_DEC2013.DOCX)
Table 9-30Folsom Lake End of Month Elevation, Long-Term Average, and Average by Water Year Type for
Alternative C when Compared to Existing Conditions
Analysis Period and WaterYear Type Oct Nov Dec Jan Feb Mar Apr May Jun Jul Aug Sep
Full Simulation Perioda
Percent Difference (%)b 0.3 0.3 0.1 0.2 0.3 0.3 0.0 0.0 0.0 0.3 0.3 0.4
Water Year Typesc
Wet (32%)
Percent Difference (%) 0.1 0.0 0.0 0.0 0.1 0.0 0.0 -0.1 -0.1 0.2 0.0 0.6
Above Normal (15%)
Percent Difference (%) 0.2 0.2 -0.1 0.0 0.2 0.2 0.0 0.0 -0.1 0.1 -0.2 0.4
aBased on the 82-year simulation period.bRelative difference of the monthly average.cAs defined by the Sacramento Valley 40-30-30 Index Water Year Hydrologic Classification (SWRCB, 1999).
Table 9-31Folsom Lake End of Month Elevation, Long-Term Average, and Average by Water Year Type for
Alternative C when Compared to the No Project/No Action Alternative
Average Type
End of Month Elevation (Feet)
Oct Nov Dec Jan Feb Mar Apr May Jun Jul Aug Sep
Long-Term
Full Simulation Perioda
Percent Difference (%)b 0.7 0.6 0.4 0.3 0.3 0.2 0.1 0.1 0.2 0.7 0.8 0.9
Water Year Typesc
Wet (32%)
Percent Difference (%) 0.4 0.1 0.1 0.0 0.0 0.0 0.0 0.0 0.0 0.4 0.2 0.8
Above Normal (15%)
Percent Difference (%) 0.7 0.6 0.3 0.1 0.1 0.0 0.0 0.0 0.1 0.4 0.5 0.8
aBased on the 82-year simulation period.bRelative difference of the monthly average.cAs defined by the Sacramento Valley 40-30-30 Index Water Year Hydrologic Classification (SWRCB, 1999).
9.3.8.3 Primary Study Area – Alternative C
Construction, Operation, and Maintenance Impacts
The following Primary Study Area Project facilities are included in Alternatives A, B, and C. These
facilities would require the same construction methods and operation and maintenance activities
regardless of alternative, and would, therefore, result in the same construction, operation, and
maintenance impacts to flood control and management:
Recreation Areas
Sites Pumping/Generating Plant
Sites Electrical Switchyard
Tunnel from Sites Pumping/Generating Plant to Sites Reservoir Inlet/Outlet Structure
Sites Reservoir Inlet/Outlet Structure
Field Office Maintenance Yard
Holthouse Reservoir Complex
Holthouse Reservoir Electrical Switchyard
GCID Canal Facilities Modifications
GCID Canal Connection to the TRR
This document is not released as a draft EIR pursuant to CEQA Guidelines § 15087. As such, DWR is not soliciting and will not respond to commentssubmitted on this document, although any comments received will be retained and may be considered during preparation of a future draft EIR.

Chapter 9: Flood Control and Management
PRELIMINARY – SUBJECT TO CHANGEPRELIMINARY ADMINISTRATIVE DRAFT DECEMBER 2013 9-47 NORTH-OF-THE-DELTA OFFSTREAM STORAGE PROJECT EIR/EISWBG020812033556SAC/433094 (09-FLOOD_CONTROL_PRELIM_ADMIN_DRAFT_DEC2013.DOCX)
TRR
TRR Pumping/Generating Plant
TRR Electrical Switchyard
TRR Pipeline
TRR Pipeline Road
Delevan Pipeline
Delevan Pipeline Electrical Switchyard
The Alternative C design of the Delevan Transmission Line and Delevan Pipeline Intake Facilities is the
same as described for Alternative A. These facilities would require the same construction methods and
operation and maintenance activities regardless of alternative, and would, therefore, result in the same
construction, operation, and maintenance impacts to drainage patterns, stream courses, or surface runoff
(Impact Flood-1), 100-year flood flows (Impact Flood-2), and flooding risks (Impact Flood-3) as
described for Alternative A.
The Alternative C design of the Sites Reservoir Inundation Area and Dams, Recreation Areas, and Road
Relocations and South Bridge is the same as described for Alternative B. These facilities would require
the same construction methods and operation and maintenance activities regardless of alternative, and
would, therefore, result in the same construction, operation, and maintenance impacts to drainage
patterns, stream courses, or surface runoff (Impact Flood-1), 100-year flood flows (Impact Flood-2),
and flooding risks (Impact Flood-3) as described for Alternative B.
The boundary of the Project Buffer would be the same for all alternatives, but because the footprints of
some of the Project facilities that are included in the Project Buffer would differ between the alternatives,
the acreage of land within the Project Buffer would also differ. However, these differences in the size of
the area included within the buffer would not change the type of construction, operation, and maintenance
activities that were described for Alternative A. They would, therefore, have the same impact on drainage
patterns, stream courses, or surface runoff (Impact Flood-1), 100-year flood flows (Impact Flood-2),
and flooding risks (Impact Flood-3) as described for Alternative A.
9.4 Mitigation Measures
Mitigation measures are provided below and summarized in Table 9-32 for the impacts that have been
identified as significant or potentially significant.
Table 9-32Summary of Mitigation Measures for
NODOS Project Impacts to Flood Control and Management
Impact
AssociatedProjectFacility
LOS BeforeMitigation Mitigation Measure
LOS AfterMitigation
Impact Flood-1: Substantially Alter the ExistingDrainage Pattern of the Site or Project Area,Including Through the Alteration of the Courseof a Stream or River, or Substantially Increasethe Rate or Amount of Surface Runoff in aManner Which Would Result in Flooding On-or Off-site
SitesReservoir,Sites Dams
Significant Mitigation MeasureFlood-1: MaintainPermanent Low FlowReleases into Stone Corraland Funks CreeksDownstream of Sites andGolden Gate Dams
Less thanSignificant
Note:
LOS = Level of Significance
This document is not released as a draft EIR pursuant to CEQA Guidelines § 15087. As such, DWR is not soliciting and will not respond to commentssubmitted on this document, although any comments received will be retained and may be considered during preparation of a future draft EIR.

Chapter 9: Flood Control and Management
PRELIMINARY – SUBJECT TO CHANGENORTH-OF-THE-DELTA OFFSTREAM STORAGE PROJECT EIR/EIS 9-48 PRELIMINARY ADMINISTRATIVE DRAFT DECEMBER 2013
WBG020812033556SAC/433094 (09-FLOOD_CONTROL_PRELIM_ADMIN_DRAFT_DEC2013.DOCX)
Mitigation Measure Flood-1: Maintain Permanent Low Flow Releases into Stone Corral and Funks
Creeks Downstream of Sites and Golden Gate Dams
To mitigate for Impact Flood-1 and pursuant to DFG Code 5937 related to maintaining flows
downstream of dams, post-construction fish flows into Funks and Stone Corral creeks shall be maintained
by DWR and Reclamation by means of low-flow release valves at Golden Gate and Sites dams. Flows
shall be maintained at 10 cfs from October through May in both creeks to mimic the seasonal nature of
the creeks while avoiding historic flooding.
Implementation of Mitigation Measure Flood-1 would reduce the level of significance of Project
impacts to flood control and management to less than significant.
9.5 References
California Department of Water Resources (DWR). 2010. State Plan of Flood Control Descriptive Document.
California Department of Water Resources (DWR). 2009. State Plan of Flood Control DescriptiveDocument. Administrative Draft. November.
California Department of Water Resources (DWR). 2007. Oroville Facilities Relicensing DEIR. May.
California Department of Water Resources (DWR). 2005. North of Delta Offstream StorageInvestigations, Sites Reservoir Inundation Analysis.
California State Water Resources Control Board (SWRCB). 1999. Water Right Decision 1641. December.
Federal Emergency Management Agency (FEMA). 2003. Flood Insurance Study: Colusa County,California and Unincorporated Areas. pp. 4-6.
Tehama Colusa Canal Authority (TCCA). 2005. Personal communication with Jim Weathers on April 27.
U. S. Army Corps of Engineers (USACE). 1999. Sacramento and San Joaquin River Basins California:Post-Flood Assessment. pp. 3-8 to 3-22.
U.S. Bureau of Reclamation (Reclamation). 2012. North of Delta Off stream Storage InvestigationFeasibility Report. Administrative Draft. June.
U.S. Bureau of Reclamation (Reclamation). 2009. Trinity River Restoration Program Draft MasterEIR-EA/Draft EIR.
U.S. Bureau of Reclamation (Reclamation). 2008. Shasta Lake Water Resources Investigation. EIS/EIR.September.
U. S. Bureau of Reclamation (Reclamation). 2004. Long-Term Central Valley Project Operations Criteriaand Plan.
U. S. Bureau of Reclamation (Reclamation). 1990. ACER Technical Memorandum No. 3, Criteria andGuidelines for Evacuating Storage Reservoirs and Sizing Low-Level Outlet Works, AssistantCommissioner.
U.S. Bureau of Reclamation, Contra Costa Water District, and Western Area Power Administration(Reclamation, CCWD, and WAPA). 2009. Los Vaqueros Reservoir Expansion Project. EnvironmentalImpact Statement/Environmental Impact Report. State Clearinghouse No. 2006012037.
U.S. Bureau of Reclamation and California Department of Water Resources (Reclamation and DWR).2005. South Delta Improvement Program.
This document is not released as a draft EIR pursuant to CEQA Guidelines § 15087. As such, DWR is not soliciting and will not respond to commentssubmitted on this document, although any comments received will be retained and may be considered during preparation of a future draft EIR.

F igures
This document is not released as a draft EIR pursuant to CEQA Guidelines § 15087. As such, DWR is not soliciting and will not respond to commentssubmitted on this document, although any comments received will be retained and may be considered during preparation of a future draft EIR.

Conditions (terms)• Assurances• Flood Control Regulations, Part 208.10 of 33, Code of
Federal Regulations• Requirements of standard and unit-specific O&M manuals• Design profiles (1955 and 1957)• Project Cooperation Agreements
Programs and Plans• Historical documents and processes• As-constructed drawings• Oversight and management
Facilities
• Approximately 1,600 miles of levees
• Five major weirs spilling floodwaters from the Sacramento River to bypass channels
• Five control structures directing flow in bypass channels along the San Joaquin River
• Six major pumping plants
• Channel improvements
• Bank protection
• Associated facilities, such as stream gages and drainage facilities
Lands• Fee title, easements, and agreements for project works
and mitigation areas• Approximately 18,000 parcels
Operations and Maintenance• Two standard O&M manuals• 118 unit-specific manuals• Maintenance by State and local maintaining agencies
FIGURE 9-1Overview of SPFC Project WorksNorth-of-the Delta Offstream Storage Project
WBG020812033556SAC
This document is not released as a draft EIR pursuant to CEQA Guidelines § 15087. As such, DWR is not soliciting and will not respond to commentssubmitted on this document, although any comments received will be retained and may be considered during preparation of a future draft EIR.

FIGURE 9-2ASacramento Valley Flood Control SystemEstimated Channel Capacity (North)North-of-the Delta Offstream Storage Project
WBG020812033556SAC
N
Source: Modified from Department of Water Resources, Division of Flood Management, November 2003 Sacramento Valley Flood Control System Map.
LEGEND
Project Levees Maintained by Department of Water Resources
Project Levees Maintained by Reclamation, Levee, and Drainage Districts and Municipalities
Non-project Levees
This document is not released as a draft EIR pursuant to CEQA Guidelines § 15087. As such, DWR is not soliciting and will not respond to commentssubmitted on this document, although any comments received will be retained and may be considered during preparation of a future draft EIR.
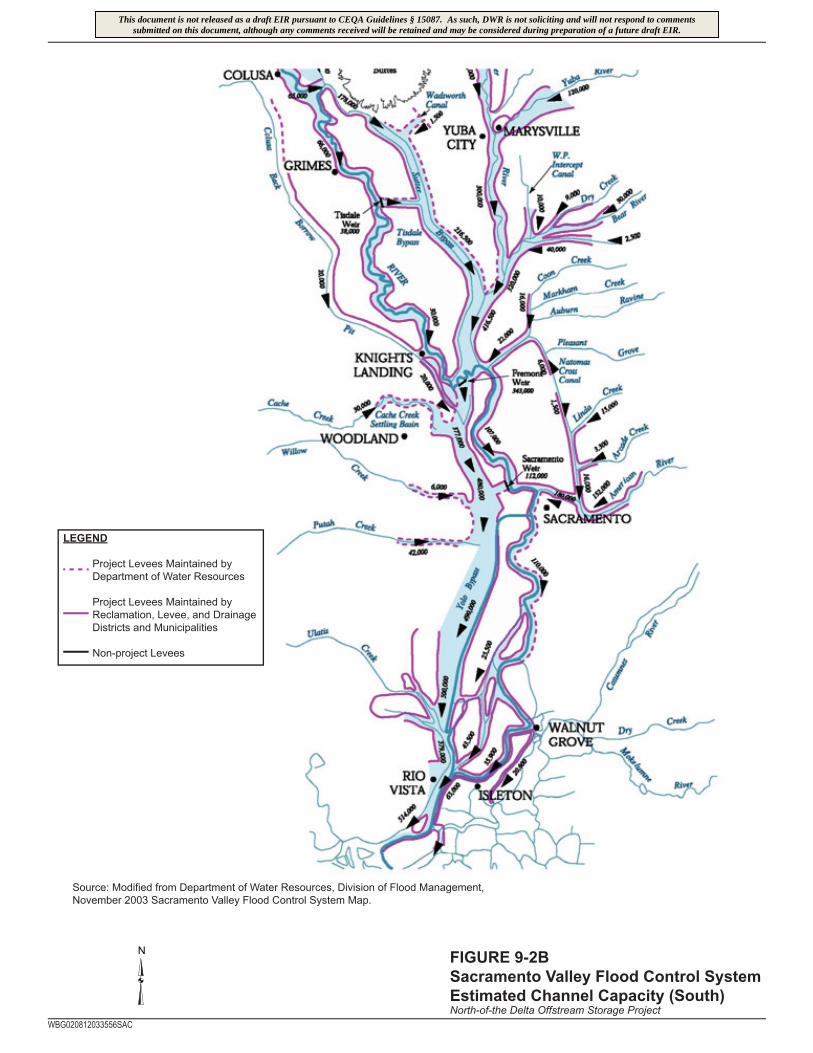
FIGURE 9-2BSacramento Valley Flood Control SystemEstimated Channel Capacity (South)North-of-the Delta Offstream Storage Project
WBG020812033556SAC
N
Source: Modified from Department of Water Resources, Division of Flood Management, November 2003 Sacramento Valley Flood Control System Map.
LEGEND
Project Levees Maintained by Department of Water Resources
Project Levees Maintained by Reclamation, Levee, and Drainage Districts and Municipalities
Non-project Levees
This document is not released as a draft EIR pursuant to CEQA Guidelines § 15087. As such, DWR is not soliciting and will not respond to commentssubmitted on this document, although any comments received will be retained and may be considered during preparation of a future draft EIR.

FIGURE 9-3100-Year Floodplain Delineation Relative to the Project FacilitiesNorth-of-the Delta Offstream Storage Project
WBG020812033556SAC
0 20Miles
5 10 15
N
Source: Federal Emergency Management Agency (FEMA), Q3 Flood Data.
LEGEND
FEMA 100-Year Floodplain
Sites Project Features
Reservoir
Sites Reservoir(New)
Funks/Holthouse Reservoir (Dredged/New)
Terminal Regulating Reservoir (New)
Conveyance
T-C Canal (Existing)
GCID Canal (Existing)
Delevan Pipeline (New)
A
B
C
1
2
3
A
B
C
1
2
3
This document is not released as a draft EIR pursuant to CEQA Guidelines § 15087. As such, DWR is not soliciting and will not respond to commentssubmitted on this document, although any comments received will be retained and may be considered during preparation of a future draft EIR.

§̈¦5
0 1 2 30.5Miles
FIGURE 9-4100-Year InundationAreas Relative tothe Project FacilitiesNorth-of-the-Delta Offstream Storage Project
Path: W:\NODOS\MapFiles\Chapters\Flood\Figure9-5_Flood.mxd³
DELEVAN ANDTRR PIPELINES
TERMINAL REGULATING
RESERVOIR (TRR)
FUNKS/HOLTHOUSERESERVOIR
(DREDGED/NEW)
DELEVAN TRANSMISSION LINE
Teha
ma-C
olusa
Can
al
Glen
n-Colu
sa Irr
igatio
n Di
strict
Can
al
DELEVAN PIPELINE INTAKE/ DISCHARGE
FACILITIES
G L E N NC O L U S A
LegendSacramento River Flood Control Project LeveesAccess Roads
Project FacilitiesNODOS Project Features
Delevan Transmission Line
Delevan Pipeline
TRR Pipeline
Sacramento River
Reservoir
Canal
Proposed Take LineFlood Hazard Areas
100-Year Inundation
Undetermined Flood Hazard
DELEVAN PIPELINE
SITES RESERVOIR
Moulton Weir(25,000 cfs Capacity)
Colusa Weir(70,000 cfs Capacity)100-Year Flood Flow
= 34,500 cfs
3,650 cfs
Delevan National Wildlife Refuge
Sacramento NationalWildlife Refuge
Note: Special flood hazard areas were not delineated for the National Wildlife Refuge Areas.Source: Federal Emergency Management Agency, National Flood Insurance Program, Digital Flood Insurance Rate Maps (2012).
Colusa NationalWildlife Refuge
This document is not released as a draft EIR pursuant to CEQA Guidelines § 15087. As such, DWR is not soliciting and will not respond to commentssubmitted on this document, although any comments received will be retained and may be considered during preparation of a future draft EIR.

FIGURE 9-5Dam Break Inundation Area for the Project FacilitiesNorth-of-the Delta Offstream Storage Project
WBG020812033556SAC
0 20Miles
5 10 15
N
Source: Federal Emergency Management Agency (FEMA), Q3 Flood Data.
LEGEND
Dam Break Inundation
Sites Project Features
Reservoir
Sites Reservoir(New)
Funks/Holthouse Reservoir (Dredged/New)
Terminal Regulating Reservoir (New)
Conveyance
T-C Canal (Existing)
GCID Canal (Existing)
Delevan Pipeline (New)
A
B
C
1
2
3
A
B
C
1
2
3
This document is not released as a draft EIR pursuant to CEQA Guidelines § 15087. As such, DWR is not soliciting and will not respond to commentssubmitted on this document, although any comments received will be retained and may be considered during preparation of a future draft EIR.