8th grade math - academy for urban leadership charter high ... grade... · students apply their...
TRANSCRIPT

Unit -1 Rational Numbers and Properties of Exponents
Grade Level 8th Grade Common Core Level 2
Curriculum Area Mathematics Time Frame 2-3 weeks
Developed By Munira Jamali
Identify Desired Results (Stage 1)
Content Standards

● 8.NS.1 Know that numbers that are not rational are called irrational. Understand informally that every number has a decimal expansion; for rational numbers show that the decimal expansion that terminates in the 0s or eventually reapeat
● 8.NS.2 Use rational approximation of irrational numbers to compare the size of irrational numbers. Locate them approximately on a number line diagram, and estimate the value of expressions(eg, π2)
● 8.EE.1 Know and apply the properties of integer exponents to generate equivalent numerical expressions For example 32x 3-5 = 3-3 = 1/32 = 1/27
● 8.EE.3 Use numbers expressed in the form of a single digit items a whole number power of 10 to estimate very large or very small quantities and to express how many times as much as one is than the other
● 8.EE.4 Perform operations with numbers expressed in scientific notation, including problems where both decimal and scientific notation are used. Use scientific notation and choose units of appropriate size for measurements of very large or very small quantities.
Understandings Essential Questions
Overarching Understanding Overarching Topical

● Students approximate irrational numbers using their understanding of square and cube roots.
● Students extend their understanding of the number system by investigating the relationship between the sides
of a right triangle. ● Students create equivalent expressions using integer
exponents. ● Students apply their understanding of exponents to
express and compare numbers. ● Students understand irrational numbers and when to use
them in solving problems.
● How are numbers rational and irrational numbers related?
● How do we determine whether two expressions involving exponents are equivalent?
● How can we express very small or very large numbers using
exponential (scientific) notation? ● How can you investigate the
relationships between rational and irrational numbers?
• How do I determine the best
numerical representation (pictorial, symbolic, objects)
for a given situation? • How does finding the common
characteristics among similar problems
help me to be a more efficient problem solver?
• What kinds of experiences help develop number sense?
Differentiaiton
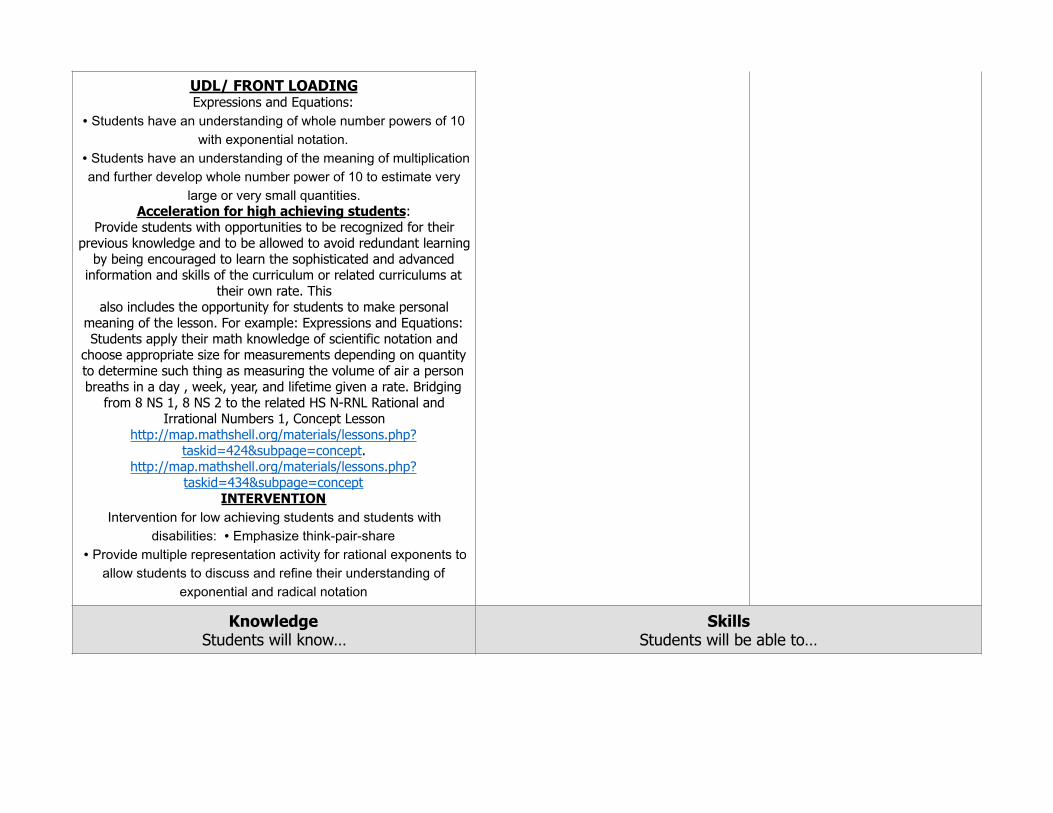
UDL/ FRONT LOADING Expressions and Equations:
∙ Students have an understanding of whole number powers of 10 with exponential notation.
∙ Students have an understanding of the meaning of multiplication and further develop whole number power of 10 to estimate very
large or very small quantities. Acceleration for high achieving students:
Provide students with opportunities to be recognized for their previous knowledge and to be allowed to avoid redundant learning
by being encouraged to learn the sophisticated and advanced information and skills of the curriculum or related curriculums at
their own rate. This also includes the opportunity for students to make personal
meaning of the lesson. For example: Expressions and Equations: Students apply their math knowledge of scientific notation and
choose appropriate size for measurements depending on quantity to determine such thing as measuring the volume of air a person breaths in a day , week, year, and lifetime given a rate. Bridging
from 8 NS 1, 8 NS 2 to the related HS N-RNL Rational and Irrational Numbers 1, Concept Lesson
http://map.mathshell.org/materials/lessons.php?taskid=424&subpage=concept.
http://map.mathshell.org/materials/lessons.php?taskid=434&subpage=concept
INTERVENTION Intervention for low achieving students and students with
disabilities: ∙ Emphasize think-pair-share ∙ Provide multiple representation activity for rational exponents to
allow students to discuss and refine their understanding of exponential and radical notation
Knowledge Students will know…
Skills Students will be able to…

● That there are numbers that are not rational, and approximate them by rational numbers
● Work with radical and integer exponents ● To perform with numbers expressed in scientific
notation including problems where both decimal and scientific notation are used.
● Approximate irrational numbers using their understanding of square and cube roots
● Create equivalent expressions using integer exponents ● Apply understanding of exponents to express and compare
numbers ● Understand irrational numbers and when to use them in solving
problems
Assessment Evidence (Stage 2)
Performance Task Description

● Goal ● Role ● Audience ● Situation ● Product/Performance ● Standards
● Translating Between Repeating Decimals and Fractions http://map.mathshell.org/lessons.php?collection=8&unit=8105
● Common Core Standards 8.NS: Know that there are numbers that are not rational, and approximate them by
Rational Numbers Goals:
1. Translate between decimal and fraction notation, particularly when the decimals are repeating . 2. Create and solve simple linear equations to find the fractional equivalent of a repeating decimal . 3. Understand the effect of multiplying a decimal by a power of 10.
Task Activities Included
● Collaborative activity: Matching Decimals, Equations, and Fractions ● Whole-class discussion: comparing posters ● Fraction Conversion Challenge ● Matching Card Set
Extending the Definitions of Exponents , Variation 1 http://s3.amazonaws.com/illustrativemathematics/illustration_pdfs/000/000/395/original/
illustrative_mathematics_395.pdf?1343857080
Goal: To study positive and negative exponents Standards and Criteria for Success:
8. EE Extending the Definition of Exponents, Variation 1 Your assessment will include the following:
● Complete the both tables ● Generate exponential expression based on table
Other Evidence
Illustrative Mathematics 8EE.1: Extending the Definition of Exponents,
http://s3.amazonaws.com/illustrativemathematics/illustration_pdfs/000/000/395/original/illustrative_mathematics_395.pdf?1343857080

Learning Plan (Stage 3)

● Where are your students headed? Where have they been? How will you make sure the students know where they are going?
● How will you hook students at the beginning of the unit?
● What events will help students experience and explore the big idea and questions in the unit? How will you equip them with
needed skills and knowledge? ● How will you cause students to reflect and
rethink? How will you guide them in rehearsing, revising, and refining their
work? ● How will you help students to exhibit and
self-evaluate their growing skills, knowledge, and understanding throughout
the unit? ● How will you tailor and otherwise
personalize the learning plan to optimize the engagement and effectiveness of ALL students, without compromising the goals
of the unit? ● How will you organize and sequence the
learning activities to optimize the engagement and achievement of ALL
students?
● Students can use graphic organizers to show the relationship between the subsets of the real number systems.
● Students can approximate square roots by iterative processes. Have
students to recognize that √5 falls between 22 = 4 and -32 = 9 . The value will be closer to 2 and 3.
● For 8.EE.1 and 2 , have students experience different examples such as
● Have students match cards with a given fractional exponents
and their solutions.
"

Unit -2 Congruence and Similarity and Problem Solving
Grade Level 8th Grade Common Core Level 2
Curriculum Area Mathematics Time Frame 3-4 Weeks
Developed By Munira Jamali
Identify Desired Results (Stage 1)
Content Standards

● 8.G.1 Verify experimentally the properties of rotations, reflections and translations: a. Angles are taken to angles of the same measure. b. Lines are taken to lines, and line segments to line segments of the same length c. Parallel lines are taken to parallel lines.
● 8.G.2 Understand that a two-dimensional figure is congruent to another if the second can be obtained from the first by a sequence of rotations, reflections, and translations; given two congruent figures, describe a sequence that exhibits the congruence between them.
● 8. G. 3 Describe the effect of dilations, translations, rotations, and reflections on two-dimensional figures using coordinates. ● 8.G .4 Understand that a two-dimensional figure is similar to another if the second can be obtained from the first by a sequence of rotations,
reflections, translations, and dilations; given two similar two-dimensional figures, describe a sequence that exhibits the similarity between them.
● 8. G. 5 Use informal arguments to establish facts about the angle sum and exterior angle of triangles, about the angles created when parallel lines are cut by a transversal, and the angle-angle criterion for similarity of triangles. For example, arrange three copies of the same triangle
so that the sum of the three angles appears to form a line, and give an argument in terms of transversals why this is so.
Understandings Essential QuestionsOverarching Understanding Overarching Topical

● Students apply their understanding of the effect of geometric transformation(s) on a figure or shape. ∙ Students describe how two figures or shapes are congruent or similar. ∙ Students create or identify a sequence of transformations that lead to congruent or similar figures.
● Students analyze the relationship between angles measures (triangle sum; parallel lines cut by a transversal; impact of a geometric transformation).
● How are the (angles), (lengths), or (figures) changing? How are they staying the same?
● How is ______ related to ____? What happens when an object is dilated?
● How could an object be transformed to enlarge or reduce its size?
● How can you determine the distance between two points in a coordinate plane?
● How does what we measure affect how we measure?
● How can space be
defined through numbers/ measurement?
Differentiation

UDL/ FRONT LOADING ● Students build on their understanding of what it means for two objects to
be similar and/or congruent ● Students expand their knowledge of finding distances between two points
in a coordinate system. (8.G.8: Unit 1) ● Students are able to draw, construct and describe geometrical figures and
describe the relationships between them. (7.G.2) ● Students use facts about supplementary, complementary, vertical and
adjacent angles in a multi-step problem to write and solve simple equations for an unknown angle in a figure. (7.G.5)
● Students build on knowledge of radicals, integer exponents, square roots, and cube roots. (8.EE.2: Unit 1)
ACCELERATION ● Students can compare the volume of different objects and can describe
optimization ● Given a complex polygon in a coordinate plane, students can describe the
boundaries of the figure INTERVENTION Intervention for low achieving students and students with disabilities:
● Students use “nets” and other hands on manipulatives to visualize 3 dimensions
● Teacher uses “transparency” sheets or computer applets to show transformations
● Provide sentence starters for students to be able to describe the effects of transformations.
● Provide sentence frames to support students using informal arguments to establish facts.
● Choral response especially for two parallel lines cut by a transversal theorems.
Knowledge Students will know…
Skills Students will be able to…

● Congruence and similarity using physical models, transparencies or geometry software
● Dilations , Translations , rotations and reflections on two dimensional figures using coordinates
● Describe the effect of dilations, translations, rotations and reflections on two-dimensional figures using coordinates
● Relationship between angle measures ● Identify sequence of transformations
Assessment Evidence (Stage 2)
Performance Task Description
● Goal ● Role ● Audience ● Situation ● Product/Performance ● Standards
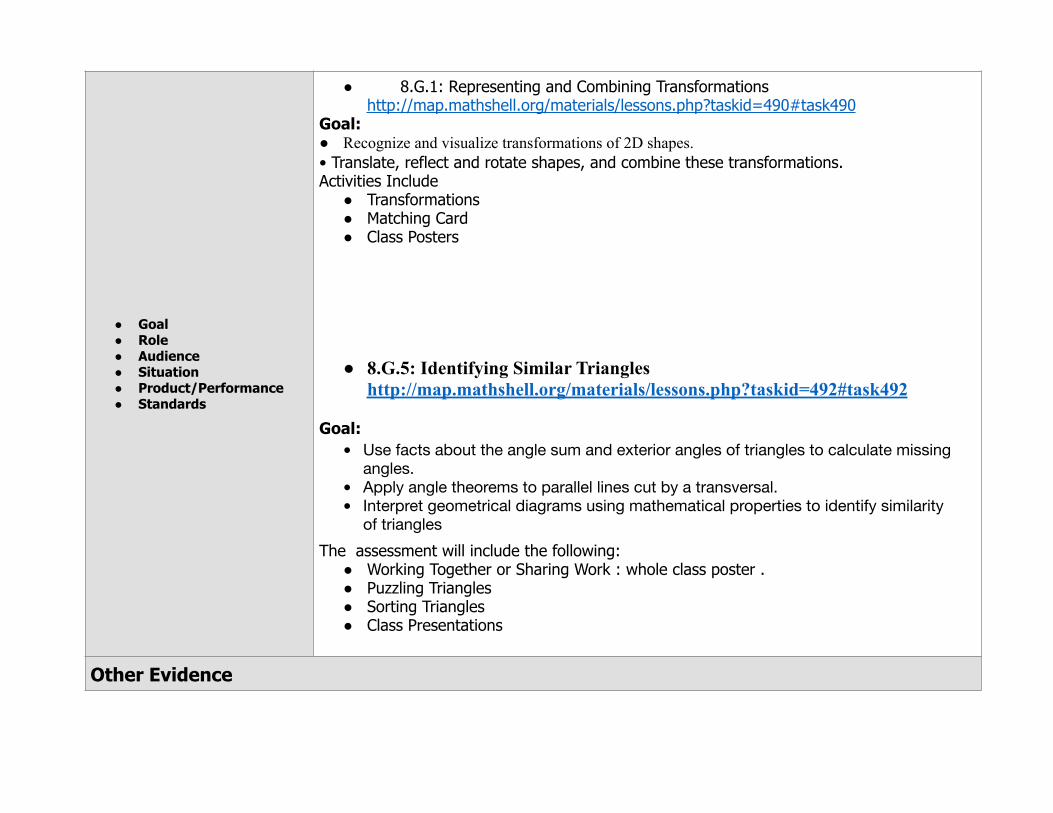
● 8.G.1: Representing and Combining Transformations http://map.mathshell.org/materials/lessons.php?taskid=490#task490
Goal: ● Recognize and visualize transformations of 2D shapes. • Translate, reflect and rotate shapes, and combine these transformations. Activities Include ● Transformations ● Matching Card ● Class Posters
● 8.G.5: Identifying Similar Triangles http://map.mathshell.org/materials/lessons.php?taskid=492#task492
Goal: ● Use facts about the angle sum and exterior angles of triangles to calculate missing
angles. ● Apply angle theorems to parallel lines cut by a transversal. ● Interpret geometrical diagrams using mathematical properties to identify similarity
of triangles
The assessment will include the following: ● Working Together or Sharing Work : whole class poster . ● Puzzling Triangles ● Sorting Triangles ● Class Presentations
Other Evidence
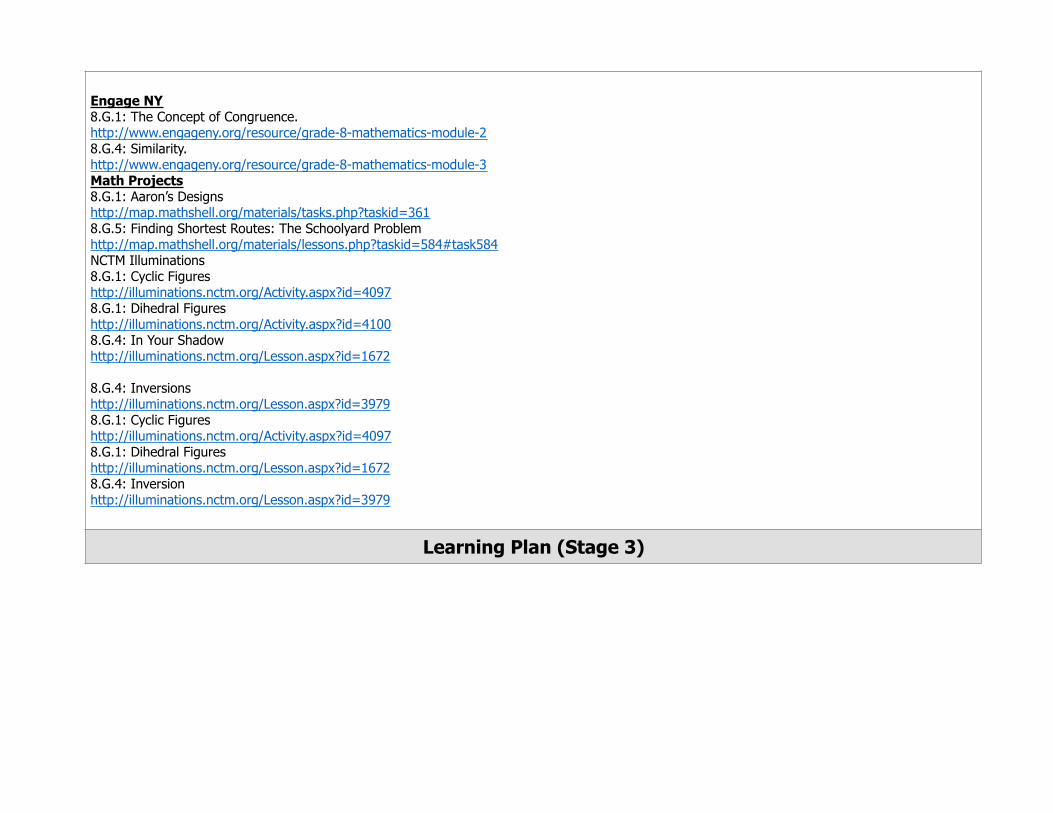
Engage NY 8.G.1: The Concept of Congruence. http://www.engageny.org/resource/grade-8-mathematics-module-2 8.G.4: Similarity. http://www.engageny.org/resource/grade-8-mathematics-module-3 Math Projects 8.G.1: Aaron’s Designs http://map.mathshell.org/materials/tasks.php?taskid=361 8.G.5: Finding Shortest Routes: The Schoolyard Problem http://map.mathshell.org/materials/lessons.php?taskid=584#task584 NCTM Illuminations 8.G.1: Cyclic Figures http://illuminations.nctm.org/Activity.aspx?id=4097 8.G.1: Dihedral Figures http://illuminations.nctm.org/Activity.aspx?id=4100 8.G.4: In Your Shadow http://illuminations.nctm.org/Lesson.aspx?id=1672
8.G.4: Inversions http://illuminations.nctm.org/Lesson.aspx?id=3979 8.G.1: Cyclic Figures http://illuminations.nctm.org/Activity.aspx?id=4097 8.G.1: Dihedral Figures http://illuminations.nctm.org/Lesson.aspx?id=1672 8.G.4: Inversion http://illuminations.nctm.org/Lesson.aspx?id=3979
Learning Plan (Stage 3)

● Where are your students headed? Where have they been? How will you make sure the students know where they are going?
● How will you hook students at the beginning of the unit?
● What events will help students experience and explore the big idea and questions in the unit? How will you equip them with needed skills and knowledge?
● How will you cause students to reflect and rethink? How will you guide them in rehearsing, revising, and refining their work?
● How will you help students to exhibit and self-evaluate their growing skills, knowledge, and understanding throughout the unit?
● How will you tailor and otherwise personalize the learning plan to optimize the engagement and effectiveness of ALL students, without compromising the goals of the unit?
● How will you organize and sequence the learning activities to optimize the engagement and achievement of ALL students?
● Provide explanations with examples of Reflection, Rotation, Translation, and Dilation.
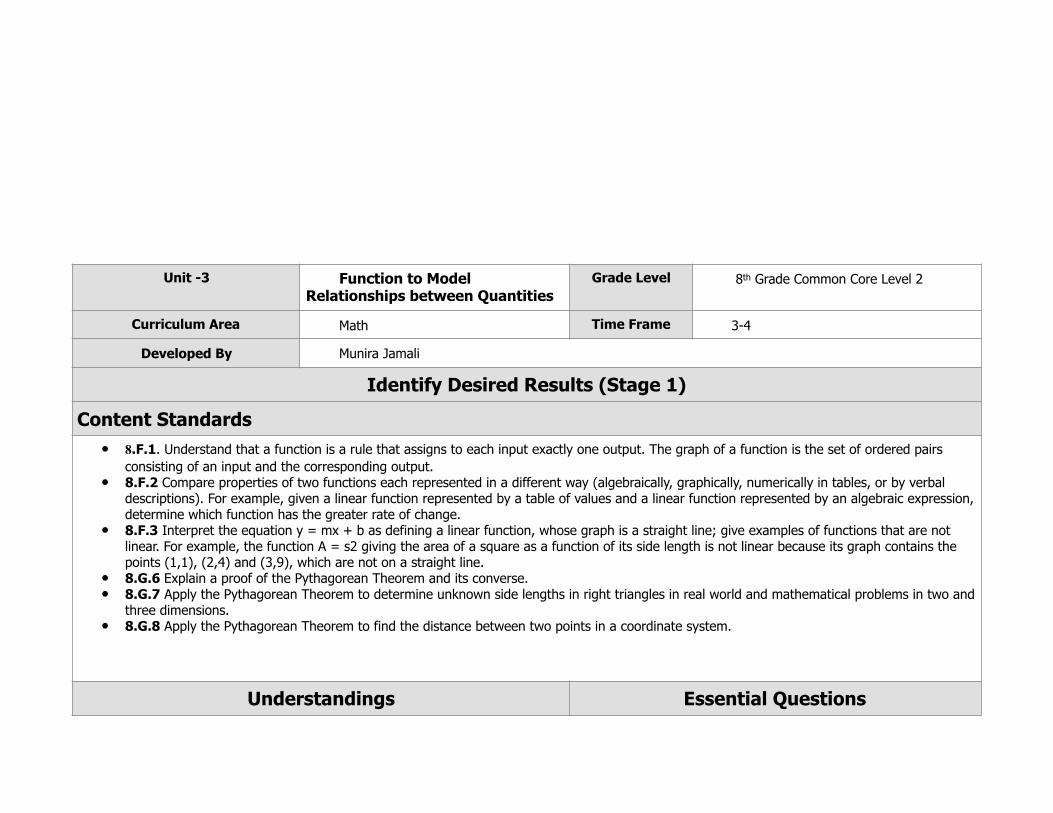
Unit -3 Function to Model Relationships between Quantities
Grade Level 8th Grade Common Core Level 2
Curriculum Area Math Time Frame 3-4
Developed By Munira Jamali
Identify Desired Results (Stage 1)
Content Standards● 8.F.1. Understand that a function is a rule that assigns to each input exactly one output. The graph of a function is the set of ordered pairs
consisting of an input and the corresponding output. ● 8.F.2 Compare properties of two functions each represented in a different way (algebraically, graphically, numerically in tables, or by verbal
descriptions). For example, given a linear function represented by a table of values and a linear function represented by an algebraic expression, determine which function has the greater rate of change.
● 8.F.3 Interpret the equation y = mx + b as defining a linear function, whose graph is a straight line; give examples of functions that are not linear. For example, the function A = s2 giving the area of a square as a function of its side length is not linear because its graph contains the points (1,1), (2,4) and (3,9), which are not on a straight line.
● 8.G.6 Explain a proof of the Pythagorean Theorem and its converse. ● 8.G.7 Apply the Pythagorean Theorem to determine unknown side lengths in right triangles in real world and mathematical problems in two and
three dimensions. ● 8.G.8 Apply the Pythagorean Theorem to find the distance between two points in a coordinate system.
Understandings Essential Questions

Overarching Understanding Overarching Topical
● Students understand that a function is a relationship with a unique output for each input.
● Students develop their ability to make connections between multiple representations of functions and interpret the features of functions in terms of real world contexts.
● Understand and apply the Pythagorean Theorem . ● Students extend their understanding of the number system by
investigating the relationship between the sides of a right triangle
● How would you determine that a relationship is a function?
● What are some characteristics of a (linear) (nonlinear) function?
● How would you interpret the features (e.g. rate of change, initial value, increasing/decreasing)of a function, in a real world context?
●
How is thinking algebraically different from thinking arithmetically? • How do I use algebraic expressions to analyze or solve problems? • How do the properties contribute to algebraic understanding? •What is meant by equality?
Differentiation

UDL/ FRONT LOADING Functions: ∙ Students extend and apply their understanding of expressions, equations and graphing, tabular representations and how these relate to each other to semi-formally describe a function: a rule that assigns to each input exactly one output.
∙ Students use function machine to introduce to idea of function. Acceleration for high achieving students: ∙ Have students design a plan for collection and production of data relevant to questions of interest. Working collaboratively students apply their experience with the coordinate plane and linear functions in the study of association between two variables related to a question of interest. ∙ As in the univariate case, analysis of bivariate measurement data graphed on a scatterplot proceeds by describing shape, center, and spread. Students determine the correlation of the graph – whether the association of the bivariate data is positive, negative, or a cloud of points on a plane, “center” based on the line of best fit. ∙ 8.F.5, Inside Mathematics Problem of the Month, “Growing Staircases,” http://insidemathematics.org/problems-of-the-month/pom-growingstaircases.pdf
Intervention for low achieving students and students with disabilities:
∙ The teacher explains dependent and independent variable based on the plot. Also the association between shoe size and height if any can be discussed. ∙ Have students use a manipulative, such as tiles, paper clips, or toothpick to construct patterns that are growing at constant rate. Have them write the data on a table of values as well as graph the points. Engage them in a discussion of dependent and independent variables, etc.
●
Knowledge Students will know…
Skills Students will be able to…

● To define, evaluate and compare functions.
● To use functions to model relationships between quantities.
● Investigate patterns of association in bivariate data.
● Understand and apply Pythagorean Theorem
● Students grasp the concept of a function as a rule that assigns to each input exactly one output.
● They understand that functions describe situations where one quantity determines another.
● Students will apply real world problem using Pythagorean Theorem
● Students approximate irrational numbers using their understanding of square and cube roots.
● Students extend their understanding of the number system by investigating the relationship between the sides of a right triangle.
Assessment Evidence (Stage 2)
Performance Task Description

● Goal ● Role ● Audience ● Situation ● Product/Performance ● Standards
The Pythagorean Theorem: Square Areas https://opencurriculum.org/resources/download/9673/ The students are able to ● Use the area of right triangles to deduce the areas of other shapes. ● Use dissection methods for finding areas. ● Organize an investigation systematically and collect data. ● Deduce a generalizable method for finding lengths and areas (The Pythagorean Theorem.)
Standards 8.G: Understand and apply the Pythagorean Theorem Activities included in assessment
● Square Areas Students will try to find the areas of various figures
● Tilted Squares Students will find areas various squares
● Whole-class discussion: Organizing and generalizing class results Students will complete the table as a whole class.
● Whole class discussion: Proving the Pythagorean theorem ● Follow-up lesson: Reviewing the assessment task
Battery Charging 1 and 2 www.illustrativemathematics.org/content-standards/tasks/641
The students are able to ● To study and interpret real life problem ● Generate equation to model the problem ● Able to make predictions based on model.
Standards Compare properties of two functions each represented in a different way (algebraically, graphically, numerically in tables, or by verbal descriptions). For example, given a linear function represented by a table of values and a linear function represented by an algebraic expression, determine which function has the greater rate of change. Activities Include
● Completion of Table ● Class discussion of Models generated by students
Other Evidence

Math Assessments ● 8 F 4, 8 F 5: Lines and Linear Equations
http://map.mathshell.org/materials/lessons.php?taskid=440&subpage=concept
● 8.F.4: Interpreting Distance-Time Graphs http://map.mathshell.org/materials/download.php?fileid=667
8.EE, 8.F: Generalizing Patterns: The Difference of Two Squares http://map.mathshell.org/materials/download.php?fileid=1374
8.F.2, 8.F.4: Modeling Situations with Linear Equations D http://map.mathshell.org/materials/lessons.php?taskid=211&subpage=concept 8.F.1: Foxes and Rabbits http://s3.amazonaws.com/illustrativemathematics/illustration_pdfs/000/000/713/original/illustrative_mathematics_713.pdf?1343857103

Learning Plan (Stage 3)

● Where are your students headed? Where have they been? How will you make sure the students know where they are going?
● How will you hook students at the beginning of the unit?
● What events will help students experience and explore the big idea and questions in the unit? How will you equip them with needed skills and knowledge?
● How will you cause students to reflect and rethink? How will you guide them in rehearsing, revising, and refining their work?
● How will you help students to exhibit and self-evaluate their growing skills, knowledge, and understanding throughout the unit?
● How will you tailor and otherwise personalize the learning plan to optimize the engagement and effectiveness of ALL students, without compromising the goals of the unit?
● How will you organize and sequence the learning activities to optimize the engagement and achievement of ALL students?
Use the function machine to introduce the basic idea and understanding of function.
∙ Have student complete the “Surround the Pool” concept task to generate sets of bivariate data in a table to compare properties of functions algebraically, graphically, and verbally.
∙ Use a different task to show students how to write linear equation of the form y=mx+b.
∙ Have students collect real-world data such as students test scores and the number of hours they watch television each week. Using the bivariate data, they would investigate and describe patterns of association.
∙ Involve students in conducting an experiment where they would generate linear model to solve problems in the context of bivariate measurement data.
∙ Engage students to describe qualitatively the functional relationship between two quantities by analyzing a graph (e.g., where the function is increasing or decreasing. Introduce the proof of the Pythagorean Theorem using a concrete model such as manipulative or have students draw a right triangle with sides 3, 4, and 5 units. Then have them draw a square of the above dimensions at each side of the right triangle.
∙ Have students verify using a model, that the sum of the squares of the legs is equal to the square of the hypotenuse in a right triangle.
∙ Students should also understand that if the sum of the squares of the 2 smaller legs of a triangle is equal to the square of the third leg, then the triangle is a right triangle.

Unit 4 Proportional Relationships and Linear Equations Involving Bivariate Data and Solution of Simultaneous Equations
Grade Level : 8 th Grade Level 2
Curriculum Area Mathematics Time Frame 4-5 Weeks
Developed By Munira Jamali
Identify Desired Results (Stage 1)
Content Standards

● 8.F.4 Construct a function to model a linear relationship between two quantities. Determine the rate of change and initial value of the function from a description of a relationship or from two (x, y) values, including reading these from a table or from a graph. Interpret the rate of change and initial value of a linear function in terms of the situation it models, and in terms of its graph or a table of values.
● 8.F.5 Describe qualitatively the functional relationship between two quantities by analyzing a graph (e.g., where the function is increasing or decreasing, linear or nonlinear). Sketch a graph that exhibits the qualitative features of a function that has been described verbally
● 8.EE.5 Graph proportional relationships, interpreting the unit rate as the slope of the graph. Compare two different proportional relationships represented in different ways. For example, compare a distance-time graph to a distance-time equation to determine which of two moving objects has greater speed. 8.EE.6 Use similar triangles to explain why the slope m is the same between any two distinct points on a non-vertical line in the coordinate plane; derive the equation y = mx for a line through the origin and the equation y = mx + b for a line intercepting the vertical axis at b.
● 8.EE.7 Solve linear equations in one variable. a. Give examples of linear equations in one variable with one solution, infinitely many solutions, or no solutions. Show which of these possibilities is the case by successively transforming the given equation into simpler forms, until an equivalent equation of the form x = a, a = a, or a = b results (where a and b are different numbers). b. Solve linear equations with rational number coefficients, including equations whose solutions require expanding expressions using the distributive property and collecting like terms.
● 8.EE.8 Analyze and solve pairs of simultaneous linear equations. a. Understand that solutions to a system of two linear equations in two variables correspond to points of intersection of their graphs, because points of intersection satisfy both equations simultaneously. b. Solve systems of two linear equations in two variables algebraically, and estimate solutions by graphing the equations. Solve simple cases by inspection. For example, 3x + 2y = 5 and 3x + 2y = 6 have no solution because 3x + 2y cannot simultaneously be 5 and 6. Solve real-world and estimate solutions by graphing the equations. Solve simple cases by inspection. For example, 3x + 2y = 5 and 3x + 2y = 6 have no solution because 3x + 2y cannot simultaneously be 5 and 6. c. Solve real-world And mathematical problems leading to two linear equations in two variables. For example, given coordinates for two pairs Of points, determine whether the line through the first pair of points intersects the line through the second pair

Understandings Essential QuestionsOverarching Understanding Overarching Topical
● Students compare proportional relationships using a variety of representations of these relationships (graph, table, symbols).
● Students understand and represent slope as a unit rate, and apply their knowledge of right triangles to represent slope.
● Students relate the slope with its concept as a rate and its visual representation as a set of right triangle that are similar for each line.
● Students interpret slope and intercept using real world applications (e.g. bivariate data).
● Students create equivalent equations to solve for an unknown.
● Students employ graphical, tabular and symbolic representations to express linearity and determine the number of solutions.
● Students interpret a linear equation in a real world application by deriving the equation.
● How can I determine, when analyzing the motion of two objects, which object has the greater speed?
● What is the meaning of the slope and intercept of a line, in the context of the situation?
● How may I use similar triangles to show that the slope is the same, given two distinct sets of points on a graph?
● How will I explain how I know that a pair of linear equations has one solution, no solutions, or infinitely many solutions?
● Is the slope between any two points on the same line the same? Explain your reasoning.
● How can I create an equation with given information from a table, graph, or problem situation?
● How can mathematics be used to provide models
• How is thinking algebraically different from thinking arithmetically? • How do I use algebraic expressions to analyze or solve problems? • How do the properties contribute to algebraic understanding? • What is meant by equality?

Differentiationto provide models that helps us interpret data and
UDL/ FRONT LOADING ● Have students analyze the relationship
between the dependent and independent variables using graphs and tables, and relate these to the equation. Use square tiles to construct different patterns that are growing with constant amount to introduce proportional relationship.
● Explain that the connection between the unit rate in a proportional relationships and the slope of its graph depends on a connection with the geometry of similar triangles. Explain to the students that the fact that a line has a well-defined slope—that the ratio between the rise and run for any two points on the line is always the same—depends on similar triangles.
Acceleration for High Achieving Student ● Explain that the connection between
the unit rate in a proportional relationships and the slope of its graph depends on a connection with the geometry of similar triangles. Explain to the students that the fact that a line has a well-defined slope—that the ratio between the rise and run for any two points on the line is always the same—depends on similar triangles.
● Have students use equations in two variables to express relationships between two quantities that vary together. When they construct an expression like 10 - p to represent a quantity, students can choose a variable such as C to represent the calculated quantity and write C=10 - p to represent the relationship. This
that helps us interpret data and make predictions?

Knowledge Students will know…
Skills Students will be able to…
● The connections between proportional relationships, lines and linear equations.
● To investigate patterns of association in bivariate data.
● To analyze and solve linear equations and pairs of simultaneous linear equations.
● Define, evaluate and compare functions. ● Use functions to model relationships
between quantities
● To construct a function to model a linear relationship. ● Identify (from a graph, table, y= mx+b, etc.) and interpret the rate of change and
initial value of a linear function in terms of the situation. ● Solve linear equations in one variable with rational number coefficients.
● Categorize linear equations in one variable as having one, none, or infinitely many solutions.
Assessment Evidence (Stage 2)
Performance Task Description

● Goal ● Role ● Audience ● Situation ● Product/
Performance ● Standards
8.EE.7: Squares and Circles http://insidemathematics.org/common-core-math-tasks/8th-grade/8-2006%20Squares%20and%20Circles.pdf Goal Students will be able to
● Demonstrate understanding of the concepts of linear equations. ● Understand relations and functions, analyze mathematical situations, and use models to
solve problems involving quantity and change Standards On Balance http://insidemathematics.org/problems-of-the-month/pom-onbalance.pdf Goal This task presents a student with a puzzle involving the weight of three apples and a balance scale. A student is challenged to find which apple is the lighter after only one weighing. A student will need to use logic and their knowledge of equality and inequality to help them. Standards 1 Describe measurable attributes of objects, such as length or weight. Describe several measurable attributes of a single object. 2. Directly compare two objects with a measurable attribute in common, to see which object has “more of”/“less of” the attribute, and describe the difference. For example, directly compare the heights of two children and describe one child as taller/shorter. Overview: In the Problem of the Month On Balance, students are engaged in tasks and puzzles that involve equality, inequalities, equations, and simultaneous constraints. The mathematical topics that underlie this POM are measurement, number sentences, equality, inequality, variables, inverse operations, and simultaneous systems.
Other Evidence

Mathematics Assessment Project 8.EE.7: Solving Linear Equations in One Variable http://map.mathshell.org/materials/lessons.php?taskid=442&subpage=concept 8.EE.8: Classify Solutions to Systems of Equations http://map.mathshell.org/lessons.php?collection=8&unit=8220 8.EE.8c: Problem Solving Lesson, Solving Real Life Problems: Baseball Jerseys http://map.mathshell.org/lessons.php?collection=8&unit=8200
Concept Lesson 8.SP.3: Tying the Knot http://www.lausd.net/lausd/offices/iss/Math/HS/AlgebraConcept/Tying%20the%20Knot%20Concept%20Lesson.pdf 8.SP.3: Cal’s Dinner Card Deal http://www.lausd.net/lausd/offices/iss/Math/HS/AlgebraConcept/CALS_DINNER_CARD_PLAN.pdf
Learning Plan (Stage 3)

● Where are your students headed? Where have they been? How will you make sure thstudents know where they are going?
● How will you hook students at the beginning of the unit?
● What events will help students experience and explore the big idea and questions in the unit? How will you equip them with needed skills and knowledge?
● How will you cause students to reflect and rethink? How will you guide them in rehearsing, revising, and refining their work?
● How will you help students to exhibit and self-evaluate their growing skills, knowledge, and understanding throughout the unit?
● How will you tailor and otherwise personalize the learning plan to optimize the engagement and effectiveness of ALL students, without compromising the goals of the unit?
● How will you organize and sequence the learning activities to optimize the engagement and achievement of ALL students?
● Identify cases in which a system of two equations in two unknowns has no solution, an infinite number of solutions.
● Solve a system of two equations (linear) in two unknowns algebraically. ● Estimate the point(s) of intersection for a system of two equations in two unknowns by
graphing the equations. ● Use graphs of experiences that are familiar to students to increase accessibility and supports
understanding and interpretation of proportional relationship. Students are expected to both sketch and interpret graphs.
● For 8.EE.6 use this example to introduce it: Explain why is similar to " , and deduce " that has the same slope as BE . Explain each line as a equation.
"
Unit 5 Statistics and Geometry Grade Level 8th Grade Level 2

Curriculum Area Mathematics Time Frame 2-3 Weeks
Developed By Munira Jamali
Identify Desired Results (Stage 1)
Content Standards● 8.SP.1 Construct and interpret scatter plots for bivariate measurement data to investigate patterns of association between two
quantities. Describe patterns such as clustering, outliers, positive or negative association, linear association, and nonlinear association.
● 8.SP.2 Know that straight lines are widely used to model relationships between two quantitative variables. For scatter plots that suggest a linear association, informally fit a straight line, and informally assess the model fit by judging the closeness of the data points to the line.
● 8.SP.4 Understand that patterns of association can also be seen in bivariate categorical data by displaying frequencies and relative frequencies in a two-way table. Construct and interpret a two-way table summarizing data on two categorical variables collected from the same subjects. Use relative frequencies calculated for rows or columns to describe possible association between the two variables. For example, collect data from students in your class on whether or not they have a curfew on school nights and whether or not they have assigned chores at home. Is there evidence that those who have a curfew also tend to have chores?
● 8.G.9 Know the formulas for the volumes of cones, cylinders, and spheres and use them to solve real-world and mathematical problems
Understandings Essential Questions
Overarching Understanding Overarching Topical
Students understand that a function is a relationship with a unique output for each input. ∙ Students develop their ability to make connections between multiple representations of functions and interpret the features of functions in terms of real world contexts. ∙ Students are able to construct a function to model a linear relationship. ∙ Students identify (from a graph, table, y= mx+b, etc.) and interpret the rate of change and initial value of a linear function in terms of the situation.
● How would you determine that a relationship is a function?
● What are some characteristics of a (linear) (nonlinear) function? How would you interpret the features (e.g. rate of change, initial value, increasing/decreasing) of a function, in a real world context?
● How would you determine, depict, and describe “patterns of association” between two quantities, in bivariate data?
• Geometry and spatial sense offer ways to interpret and reflect on our physical environment. • Analyzing geometric relationships develops reasoning and justification skills
Differentiation
UDL/ FRONT LOADING Statistics and Probability: Students have enough experience with coordinate geometry and linear functions to plot bivariate data as points on a plane and to make use of the equation of a line in analyzing the relationship between two points. Acceleration for high achieving students: Have students design a plan for collection and production of data relevant to questions of interest. Working collaboratively students apply their experience with the coordinate plane and linear functions in the study of association between two variables related to a question of interest.

Knowledge Students will know…
Skills Students will be able to…
● Define, evaluate and compare functions. ● Investigate patterns of association in bivariate data. MP 1, 4, 5, 6, and 7 ● Solve real-world and mathematical problems involving volume of cylinders
● Determine the Volume ● Analyze data ● Solve real life problem
Assessment Evidence (Stage 2)
Performance Task Description

● Goal ● Role ● Audience ● Situation ● Product/Performance ● Standards
Popcorn Anyone ht illuminations.nctm.org/Lesson.aspx?id=2927tp:// Standard
● 8.G.9 Know the formulas for the volumes of cones, cylinders, and spheres and use them to solve real-world and mathematical problems
The goal of this lesson is to have students construct objects and determine the resulting volume. This lesson moves the student from a familiar environment where they substitute values into formulas, into an experiment based on their own conjectures. This activity is based on two shapes, rectangles and cylinders. If time is limited, either part of the activity can be done independently. However, completing all parts of the activity strengthens the connections among shape, dimension, volume, and formula. Consider the following when choosing which parts of the lesson to complete.
Students will:
● Perform an experiment based on a conjecture. ● Create objects with varying volumes from sheets of paper. ● Compare the volume of similar shaped objects. ● Compare the volume of different shaped objects. ● Discover which dimensions have the largest impact on volume
8.SP.4: Music and Sports
http://www.illustrativemathematics.org/illustrations/1098
Standards
Understand that patterns of association can also be seen in bivariate categorical data by displaying frequencies and relative frequencies in a two-way table. Construct and interpret a two-way table summarizing data on two categorical variables collected from the same subjects. Use relative frequencies calculated for rows or columns to describe possible association between the two variables. For example, collect data from students in your class on whether or not they have a curfew on school nights and whether or not they have assigned chores at home. Is there evidence that those who have a curfew also tend to have chores?
Goals
To display bivariate data using bar graph

Other Evidence8.G.9: The Chocolate Factory http://www.lausd.net/lausd/offices/iss/Math/HS/27_The%20Chocolate%20Factory_2008%20-%202009.pdf 8.G.9: Cubed Cans. http://illuminations.nctm.org/uploadedFiles/Content/Lessons/Resources/6-8/CubedCans-AS.pdf 8.SP: The Power of Diversity http://www.lausd.net/lausd/offices/iss/Math/HS/AlgebraConcept/The_Power_of_Diversity_Standing_Tall_Algebra1.pdf ∙ 8.SP.1, 8.SP.2: Through the Grapevine http://insidemathematics.org/problems-of-the-month/pom-throughthegrapevine.pdf
Learning Plan (Stage 3)

● Where are your students headed? Where have they been? How will you make sure the students know where they are going?
● How will you hook students at the beginning of the unit?
● What events will help students experience and explore the big idea and questions in the unit? How will you equip them with needed skills and knowledge?
● How will you cause students to reflect and rethink? How will you guide them in rehearsing, revising, and refining their work?
● How will you help students to exhibit and self-evaluate their growing skills, knowledge, and understanding throughout the unit?
● How will you tailor and otherwise personalize the learning plan to optimize the engagement and effectiveness of ALL students, without compromising the goals of the unit?
● How will you organize and sequence the learning activities to optimize the engagement and achievement of ALL students?
Use the function machine to introduce the basic idea and understanding of function. ∙ Have student complete the “Surround the Pool” concept task to generate sets of bivariate data in a table to compare properties of functions algebraically, graphically, and verbally. ∙ Use a different task to show students how to write linear equation of the form y=mx+b. ∙ Have students collect real-world data such as students test scores and the number of hours they watch television each week. Using the bivariate data, they would investigate and describe patterns of association. ∙ Involve students in conducting an experiment where they would generate linear model to solve problems in the context of bivariate measurement data. ∙ Engage students to describe qualitatively the functional relationship between two quantities by analyzing a graph (e.g., where the function is increasing or decreasing