8c – watershed example - university of...
TRANSCRIPT
8c – Watershed Example
Page 1 of 17
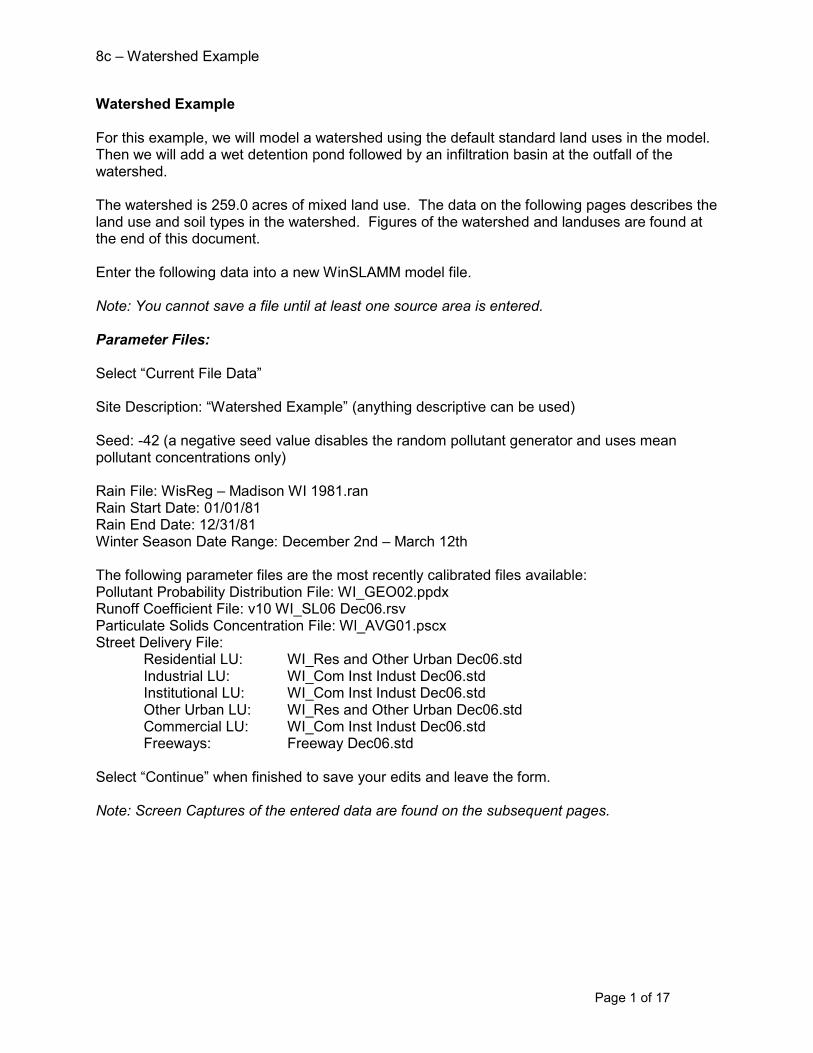
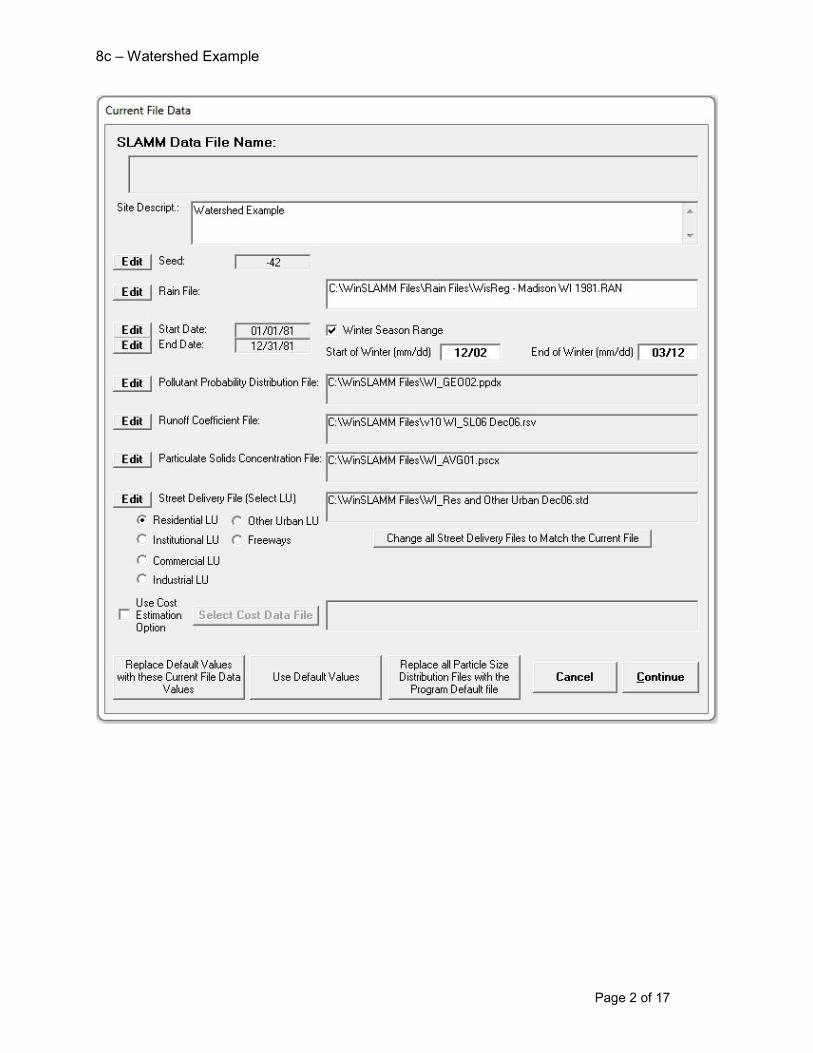
Watershed Example For this example, we will model a watershed using the default standard land uses in the model. Then we will add a wet detention pond followed by an infiltration basin at the outfall of the watershed. The watershed is 259.0 acres of mixed land use. The data on the following pages describes the land use and soil types in the watershed. Figures of the watershed and landuses are found at the end of this document. Enter the following data into a new WinSLAMM model file. Note: You cannot save a file until at least one source area is entered. Parameter Files: Select “Current File Data” Site Description: “Watershed Example” (anything descriptive can be used) Seed: -42 (a negative seed value disables the random pollutant generator and uses mean pollutant concentrations only) Rain File: WisReg – Madison WI 1981.ran Rain Start Date: 01/01/81 Rain End Date: 12/31/81 Winter Season Date Range: December 2nd – March 12th The following parameter files are the most recently calibrated files available: Pollutant Probability Distribution File: WI_GEO02.ppdx Runoff Coefficient File: v10 WI_SL06 Dec06.rsv Particulate Solids Concentration File: Wl_AVG01.pscx Street Delivery File: Residential LU: WI_Res and Other Urban Dec06.std Industrial LU: WI_Com Inst Indust Dec06.std Institutional LU: WI_Com Inst Indust Dec06.std Other Urban LU: WI_Res and Other Urban Dec06.std Commercial LU: WI_Com Inst Indust Dec06.std Freeways: Freeway Dec06.std Select “Continue” when finished to save your edits and leave the form. Note: Screen Captures of the entered data are found on the subsequent pages.
8c – Watershed Example
Page 2 of 17

8c – Watershed Example
Page 3 of 17
Pollutants: Select “Pollutants”. Check the box next to Total Lead (Particulate Solids (or TSS) will always be checked). Select “Continue” to exit the form.
Watershed Data Build the model network and add the data describing the watershed.
Table 1 – Watershed Data
Land Use Code
Land Use Area (ac)
Sandy (ac)
Silty (ac)
Clayey (ac)
LDR Low Density Residential 23.8 4.2 6.1 13.5
MDRNA Medium Density Residential No Alleys 113.5 56.8 21.2 35.5
OSUD Open Space Undeveloped 65.6 7.3 3.9 54.4
PARK Park 32.4 2.0 0 30.4
SCH School 18.2 15.6 0.8 1.8
WTR Water 5.5
Total
259.0
8c – Watershed Example
Page 4 of 17
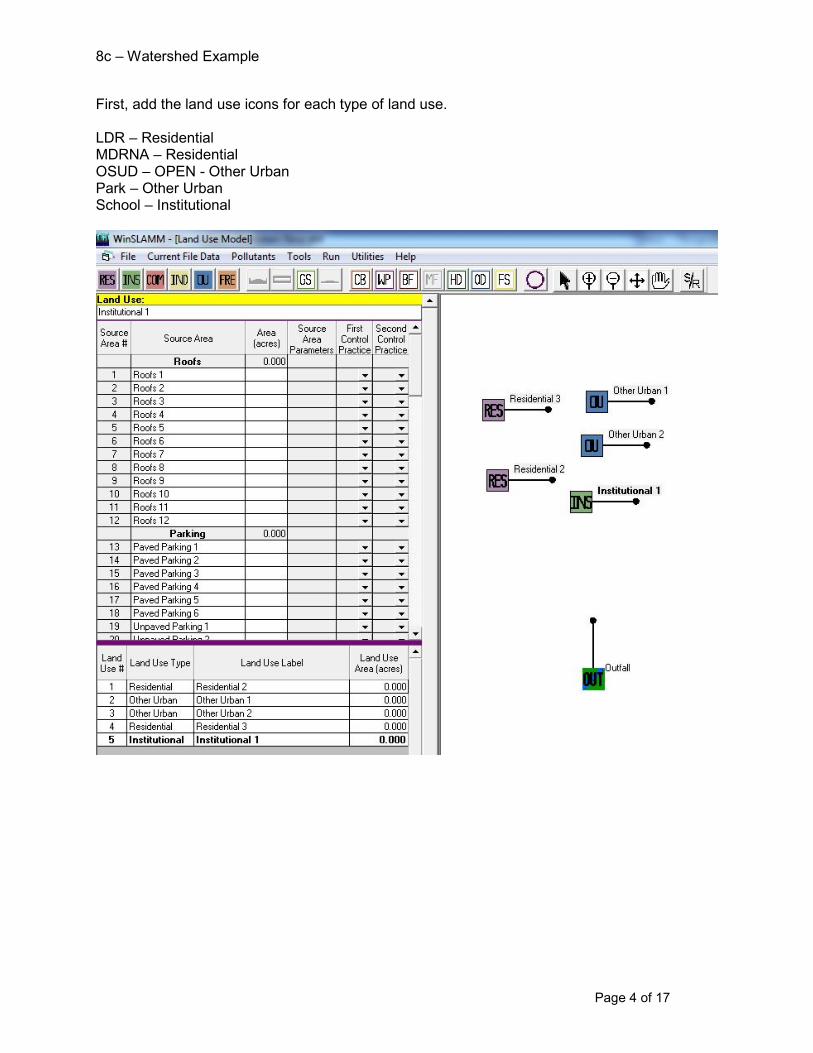
First, add the land use icons for each type of land use. LDR – Residential MDRNA – Residential OSUD – OPEN - Other Urban Park – Other Urban School – Institutional

8c – Watershed Example
Page 5 of 17
Right click on one of the Residential Icons to enter the Low Density Residential data. Then select “Apply Standard Land Use”
Next, double click on “Low Density Residential – LDR” in the left window. The source areas in the land use will appear in the right window. In the boxes below the left window, enter the acres of each soil type within the land use.
Next, select “Create Land Use and Exit”. The program will create the data for the Low Density Residential Land Use and rename the Icon Name to “Low Density Residential”.

8c – Watershed Example
Page 6 of 17
Select the Low Density Residential label to view the source areas in the source area grid.
Complete these same steps for the next four land uses (MDRNA, OSUD, PARK, SCH)

8c – Watershed Example
Page 7 of 17
MDRNA
OSUD

8c – Watershed Example
Page 8 of 17
PARK
SCH

8c – Watershed Example
Page 9 of 17
A default SLU is not available for Water. Therefore, this area will be added into a land use that was just created as a Water Body Areas source area. Highlight the Open Space land use that was just created. Scroll down to the “Water Body Areas” source area. Enter 5.5 acres.
8c – Watershed Example
Page 10 of 17
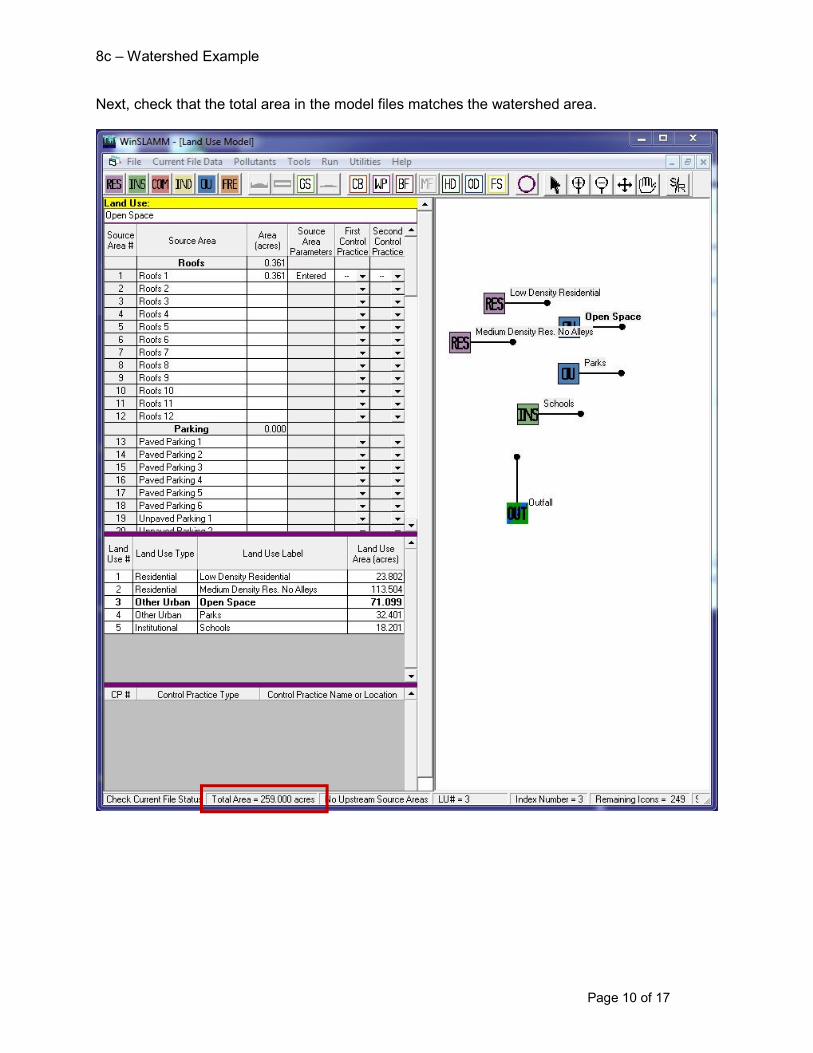
Next, check that the total area in the model files matches the watershed area.
8c – Watershed Example
Page 11 of 17
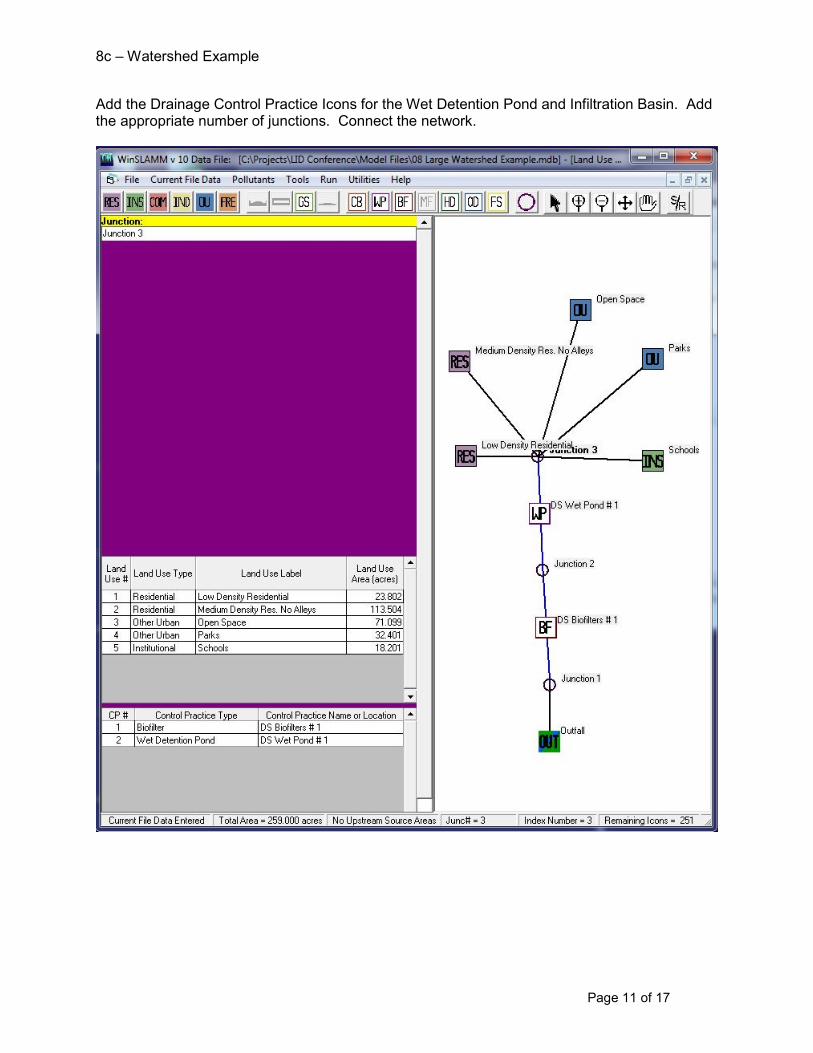
Add the Drainage Control Practice Icons for the Wet Detention Pond and Infiltration Basin. Add the appropriate number of junctions. Connect the network.

8c – Watershed Example
Page 12 of 17
Add the following data into the Wet Detention Pond Form.

8c – Watershed Example
Page 13 of 17
Enter the data for the Infitlration Basin
8c – Watershed Example
Page 14 of 17
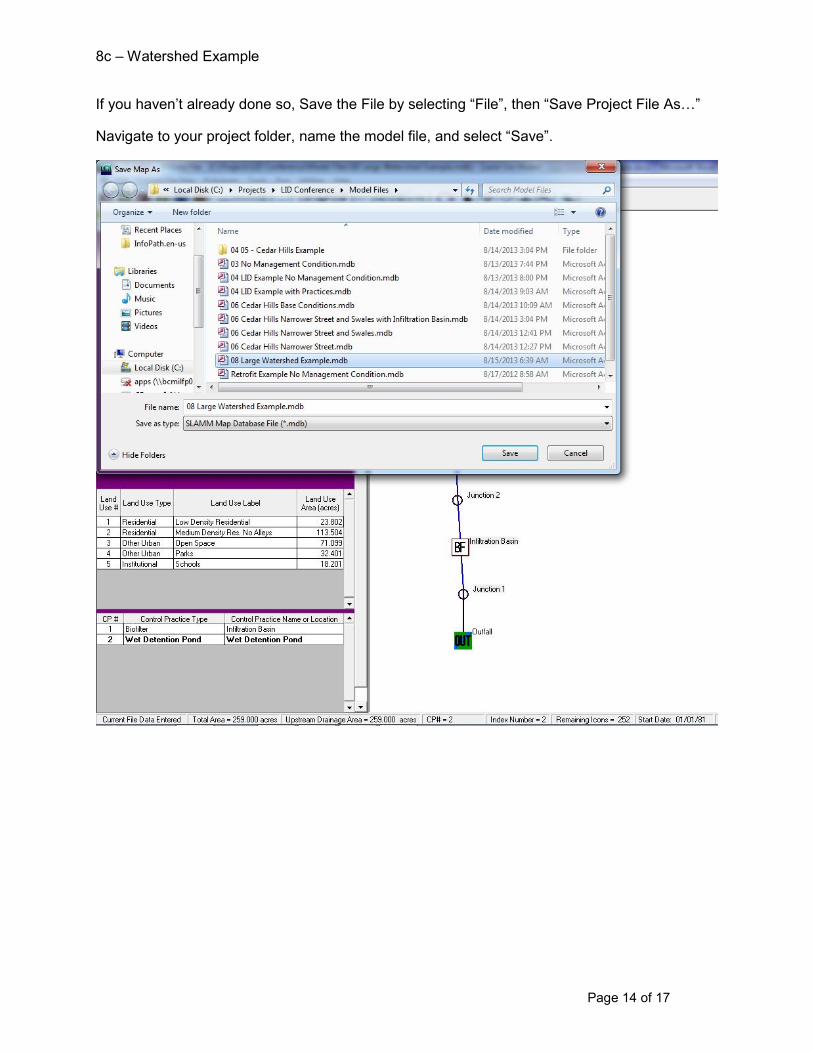
If you haven’t already done so, Save the File by selecting “File”, then “Save Project File AsE”
Navigate to your project folder, name the model file, and select “Save”.

8c – Watershed Example
Page 15 of 17
Running the File: To run the file either select “Run”, then “Current Project File”. Then, select “Save File and Execute”. Or, select the “S/R” Icon in the Main Tool Bar
It will resave the file with the same name originally chosen in the project directory it was created.
8c – Watershed Example
Page 16 of 17
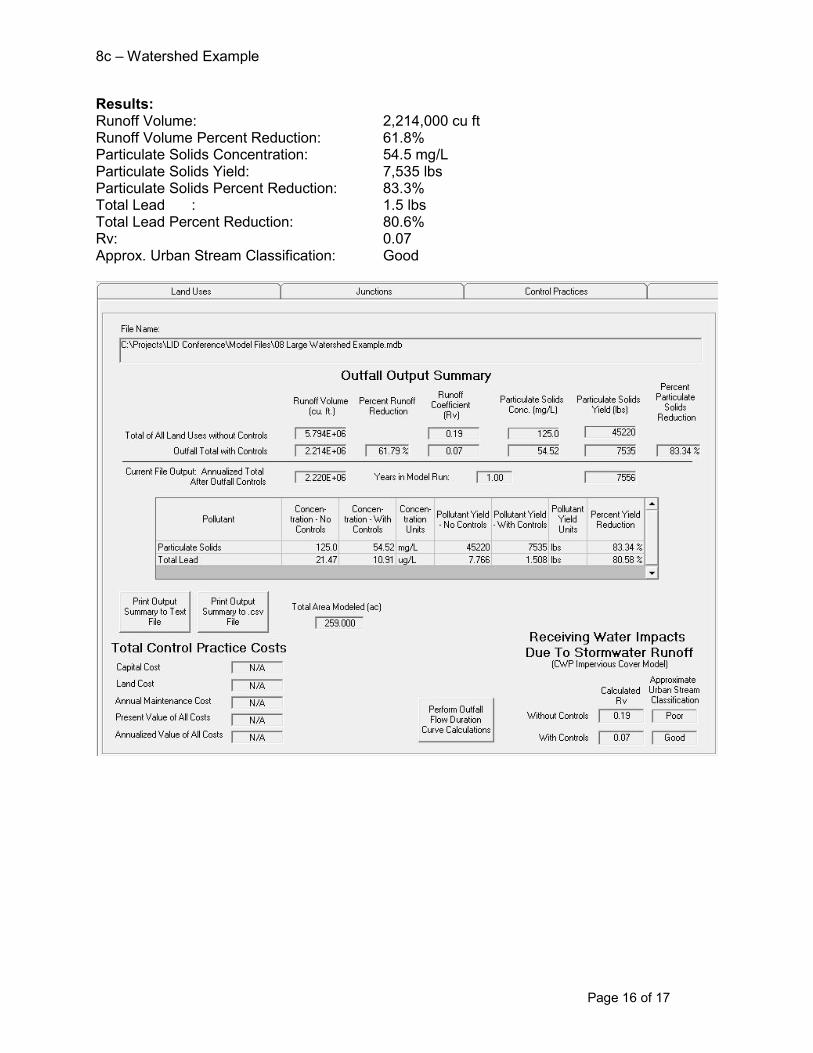
Results: Runoff Volume: 2,214,000 cu ft Runoff Volume Percent Reduction: 61.8% Particulate Solids Concentration: 54.5 mg/L Particulate Solids Yield: 7,535 lbs Particulate Solids Percent Reduction: 83.3% Total Lead : 1.5 lbs Total Lead Percent Reduction: 80.6% Rv: 0.07 Approx. Urban Stream Classification: Good
8c – Watershed Example
Page 17 of 17
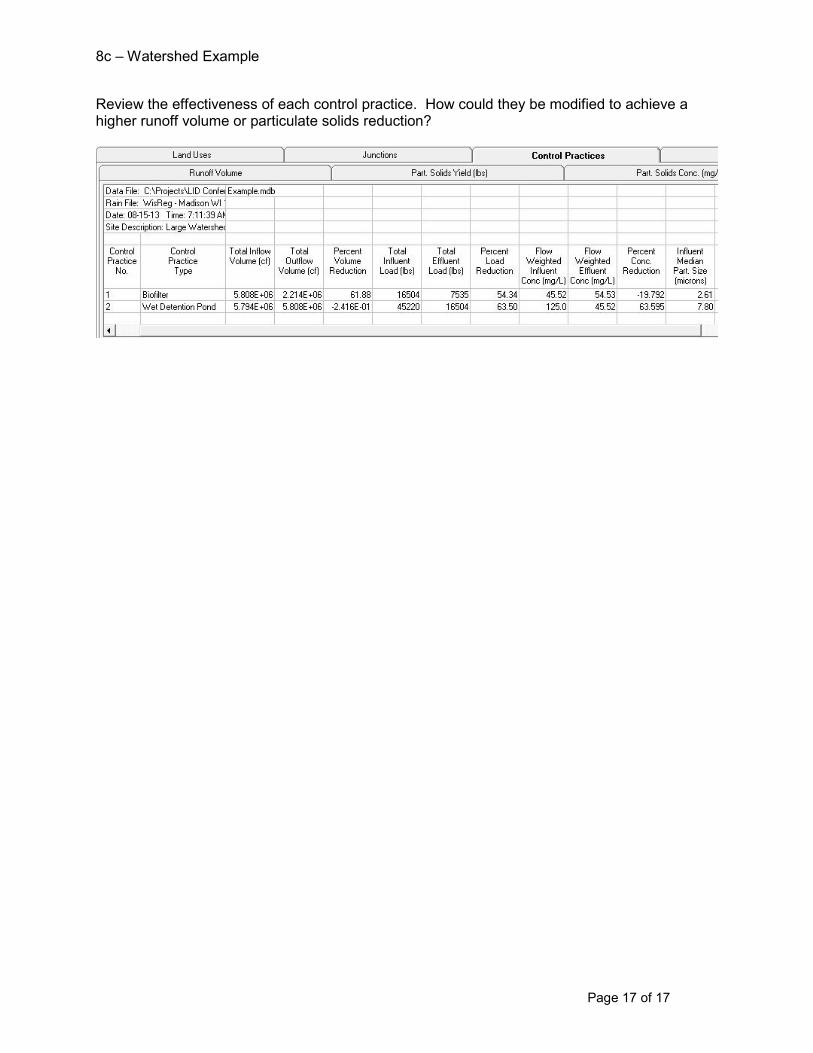
Review the effectiveness of each control practice. How could they be modified to achieve a higher runoff volume or particulate solids reduction?

LegendWatershed Boundary
0 1,200600Feet
±Watershed Outfall
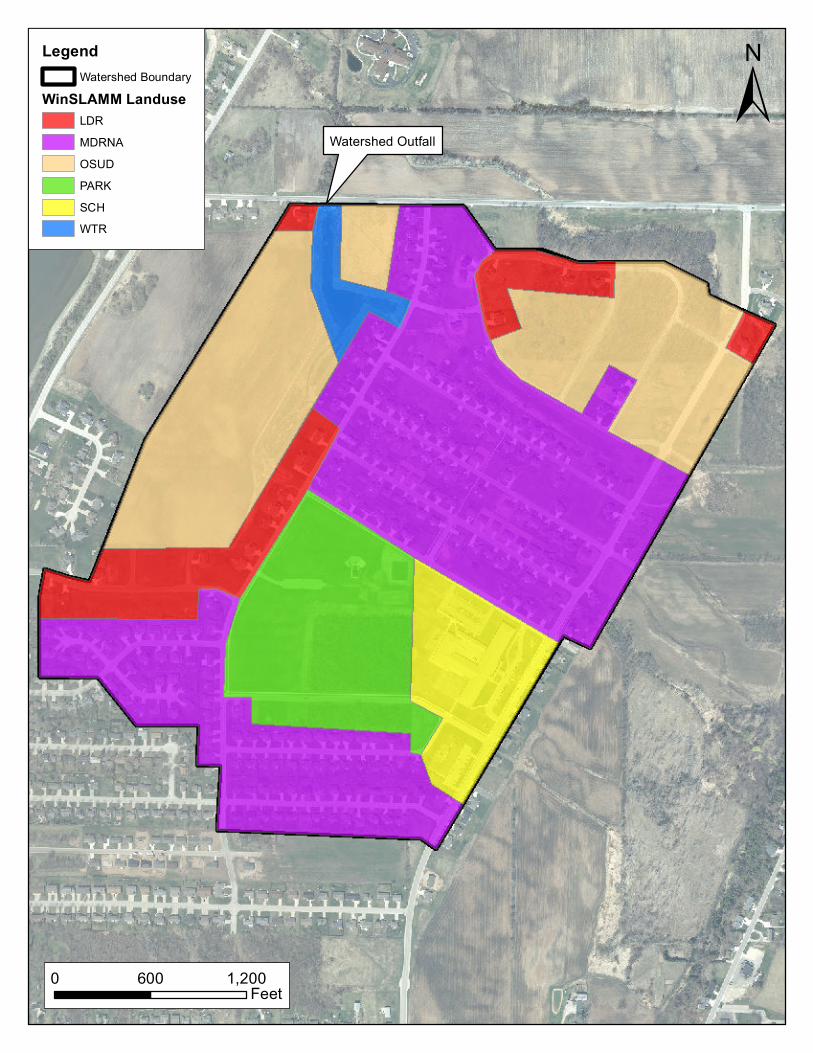
LegendWatershed Boundary
WinSLAMM LanduseLDRMDRNAOSUDPARKSCHWTR
0 1,200600Feet
±Watershed Outfall