8908 wessanenar uk 01 contents-msgceo - jaarverslag · favory convenience food group voltstraat 2...
TRANSCRIPT

Annual Report 2008
Delivering authenticity
Royal Wessanen nv
Beneluxlaan 9P. O. Box 26353500 GP Utrechtthe NetherlandsPhone: +31 (0)30 298 8888Fax: +31 (0)30 298 8816E-mail: [email protected]
www.wessanen.com
Royal Wessanen nv | Annual Report 2008
Please adjust spine and centre text to accommodate
Designed and produced by Addison, London (UK), www.addison.co.uk.
Printed by Thieme Amsterdam, the Netherlands. This Annual Report is printed on FSC-certified paper.
The Annual Report is available in English and Dutch at www.wessanen.com.
8908_Wessanen_Eng_Coverv3.indd 1 17/3/09 15:43:42

Key business highlights 2
Wessanen – all you need to know 4
Message from the CEO 6
Delivering authenticity 8
Report of the Executive Board 14North America Branded 18North America Distribution 20Europe Branded 22Europe Distribution 24Sustainability 26
Financing 30Risk Management and Internal Control 31Corporate Governance 35 Message from the Supervisory Board 37 Financial Statements 43
Additional information 91Financial summary 1999 – 2008 92Shareholders’ information 94Glossary 96Addresses 97
Contents
Key business highlights
• July – Wessanen acquires So Good European business, the second-largest brand in the UK dairy-alternatives market.
• July – Tree of Life North America acquires Apple A Day business, a small privately owned distributor of specialty organic wine and beer, located in Florida.
• September – Wessanen France reaches agreement with Laboratoires Lehning to acquire all of their shares in Distriborg Groupe.
• October – Shares of Distriborg Groupe are suspended from trading on Euronext Paris in anticipation of a public offer for the remaining 0.4% of Distriborg’s share capital.
Addresses Royal Wessanen nv/Annual Report 2008 97
Addresses
The NetherlandsCorporate head officeRoyal Wessanen nvBeneluxlaan 93527 HS UtrechtP.O. Box 26353500 GP UtrechtPhone: +31 (0)30 2988888Fax: +31 (0)30 2988816E-mail: [email protected]: www.wessanen.com
Wessanen Nederland bvBeneluxlaan 93527 HS UtrechtPhone: +31 (0)30 2988600Fax: +31 (0)30 2988703E-mail: [email protected]: www.wessanen.nl
Natudis BVDaltonstraat 383846 BX HarderwijkPhone: +31 (0)341 464211Fax: +31 (0)341 425704E-mail: [email protected]: www.natudis.nl
Favory Convenience Food GroupVoltstraat 25753 RL DeurneP.O. Box 605750 AB DeurnePhone: +31 (0)493 316901Fax: +31 (0)493 314839E-mail: [email protected]
BelgiumWessanen Belgium nvRemylaan 4c – 2nd floor3018 WijgmaalPhone: +32 (0)16 499500Fax: +32 (0)16 499501Internet: www.wessanen.be
FranceDistriborg Groupe SA217, Chemin du Grand Revoyet69561 Saint Genis Laval CedexPhone: +33 (0)4 72 67 10 20Fax: +33 (0)4 72 67 10 57E-mail: [email protected]: www.distriborg.com
GermanyAllos Walter Lang GmbHZum Streek 549457 MariendrebberPhone: +49 (0)5445 9899 0Fax: +49 (0)5445 9899 114Internet: www.allos.de
Beckers GmbHSiemensstrasse 11-1346325 BorkenPhone: +49 (0)2861 947 0Fax: +49 (0)2861 947 222E-mail: [email protected]: www.beckers-gmbh.de
Tartex + Dr. Ritter GmbHHans-Bunte-Strasse 8a79108 FreiburgPhone: +49 (0)761 5157 0Fax: +49 (0)761 5157 157E-mail: [email protected]: www.tartex.de
CoSa Naturprodukte GmbHZinkmattenstr.18b79108 Freiburg Phone: +49 (0)761 515875 10 Fax: +49 (0)761 515875 25 E-mail: [email protected]
Karl Kemper GmbHSiemensstrasse 1346325 BorkenPhone: +49 (0)286 1947 0Fax: +49 (0) 286 1947 224E-mail: [email protected]: www.karlkemper.de
ItalyRighi S.r.L.Via Monti Urali, 32Reggio EmiliaPhone: +39 (0)522 552616Fax: +39 (0)522 558707E-mail: [email protected]: www.righisrl.com
Bio Slym S.r.L.Via Dei Tigli, localita’ Fenilrosso46019 ViadanaPhone: +39 (0)375 782256Fax: +39 (0)375 821276E-mail: [email protected] : www.bioslym.com
United KingdomKallo Foods Ltd.Coopers PlaceCombe Lane, WormleyGodalming, Surrey GU8 5SZPhone: +44 (0)1428 685100Fax: +44 (0)1428 685800E-mail: [email protected]: www.kallofoods.com
Tree of Life UK Ltd.Coaldale RoadLymedale Business ParkNewcastle under LymeStaffordshire ST5 9QHPhone: +44 (0)1782 567100Fax: +44 (0)1782 567199E-mail: [email protected]: www.treeoflifeuk.com
United StatesTree of Life, Inc.405 Golfway West DriveSt. Augustine, FL 32095Phone: +1 904 940 2100Fax: +1 904 940 2553E-mail: [email protected]: www.treeoflife.com
American Beverage Corporation1 Daily WayVerona, PA 15147Phone: +1 412 828 9020Fax: +1 412 828 8876E-mail: [email protected]: www.ambev.com
PANOS Brands400 Lyster AvenueSaddle Brook, NJ 07663Phone: +1 201 843 8900Fax: +1 201 368 9150E-mail: [email protected]: www.panosbrands.com
Liberty Richter300 Broadacres DriveBloomfield, NJ 07003Phone: +1 973 338 0300Fax: +1 973 338 0382E-mail: [email protected]: www.libertyrichter.com
Cautionary statement regarding forward-looking statements This Annual Report may contain forward-looking statements. These are defined as statements not being historical facts. Forward-looking statements include (but are not limited to) statements expressing or implying Royal Wessanen nv’s beliefs, expectations, intentions, forecasts, estimates or predictions (and the underlying assumptions). Forward-looking statements necessarily involve uncertainties and risks. The actual results or situations may therefore differ materially from those expressed or implied in any forward-looking statements. Those differences may be caused by various factors, including but not limited to, market developments, currency developments and unexpected changes in the operational environment. Any forward-looking statements in this Annual Report are based on information available to the management on February 24, 2009. Royal Wessanen nv assumes no obligations to make public announcements in each case of change in that information or if there are otherwise changes or developments in respect of the forward-looking statements in this Annual Report.
8908_Wessanen_Eng_Coverv3.indd 2 17/3/09 15:43:42

1 Royal Wessanen nv/Annual Report 2008
Royal Wessanen nv is a multinational food corporation based in the Netherlands. We earn our revenues by producing, marketing and distributing high-quality organic, natural and specialty food products in North America and Europe.
Our mission is to be the leading transatlantic Company for branded authentic Health and Premium Taste foods. Our actions are intended to achieve a balance between the interests of all our stakeholders, by focusing on authenticity, transparency and sustainability.
8908_WessanenAR_UK_01_Contents-msgCEO.indd 1 13/3/09 16:38:37

2 Royal Wessanen nv/Annual Report 2008 Key business highlights
Key business highlights
In EUR millions, unless stated otherwise 2008 2007Income statement1
Revenue 1,602.8 1,579.8Operating profit (EBIT) 58.8 63.1Profit after income tax 34.5 42.8Profit for the period attributable to equity holders of Wessanen 34.4 42.8
Cash flow1
Cash flow from operating activities 34.5 11.3Cash flow from investing activities (41.9) (21.6)Cash flow from financing activities (17.2) (35.9)
Balance sheetTotal assets 911.5 912.8Shareholders’ equity 363.8 409.7Net debt 214.6 143.0Average capital employed 541.0 505.0
RatiosOperating profit (EBIT) as % of revenue 3.7% 4.0%Net debt / EBITDAE 2.9 1.9Solvency ratio (shareholders’ equity divided by total assets) 39.9% 44.9%Return on average capital employed (ROACE) 10.9% 12.5%Interest coverage ratio (EBITDAE divided by net interest expense) 6.9 9.9
Financial information per share (in EUR)Equity attributable to equity holders of Wessanen 5.38 6.06Profit for the period attributable to equity holders of Wessanen1 0.51 0.61Dividend for the year 0.20 0.65Highest share price 10.97 12.68Lowest share price 4.30 9.97Share price at year end 4.65 10.88
Other key dataAverage number of outstanding shares (in thousands) 67,585 69,698Number of shares outstanding at year end (in thousands) 67,601 67,584Average number of employees for continuing operations (in FTE) 5,796 5,603Number of employees for continuing operations at year end (in FTE) 5,761 5,762
1 Continuing operations only
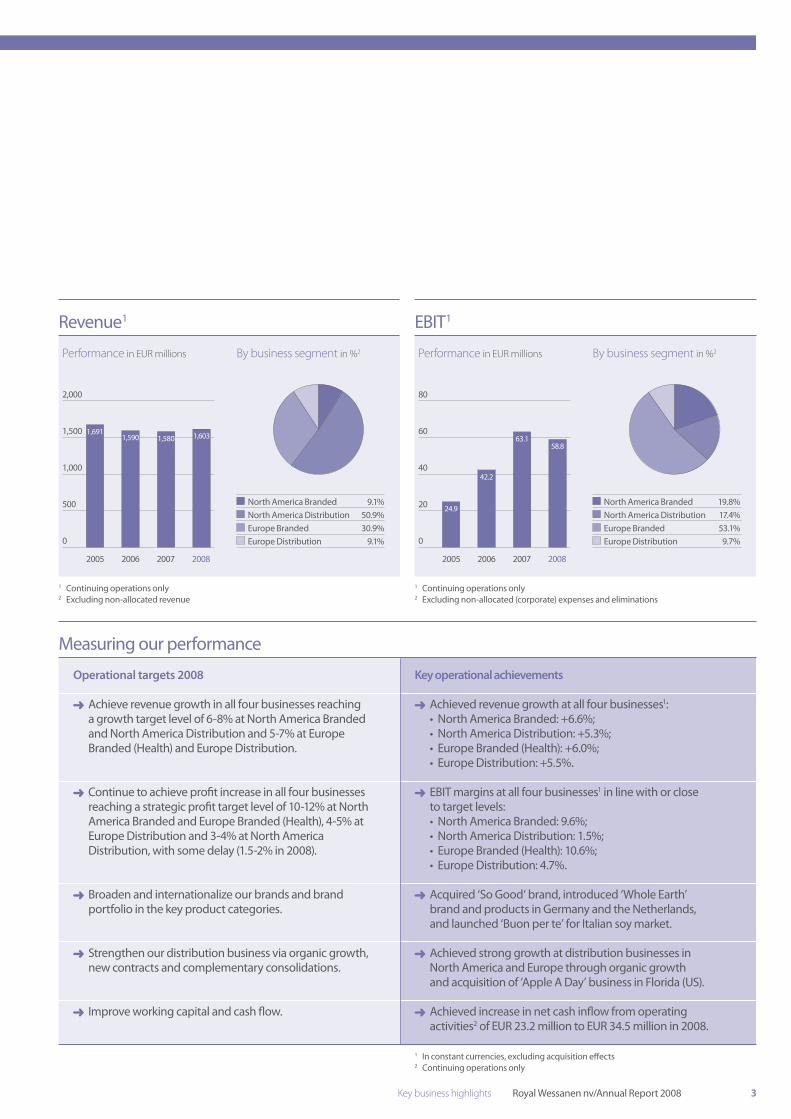
Revenue
€1,602.8m (2007: € 1,579.8m)
Operating profit (EBIT)
€58.8m (2007: € 63.1m)
Financial highlights
8908_WessanenAR_UK_01_Contents-msgCEO.indd 2 16/3/09 14:50:46
2,000
1,500
1,000
500
0
80
60
40
20
0
2005 2006 2007 2008 2005 2006 2007 2008
1,691
24.9
1,590
42.2
1,580 63.11,60358.8
3 Key business highlights Royal Wessanen nv/Annual Report 2008
Performance in EUR millions By business segment in % 2
Key operational achievementsOperational targets 2008
Achieve revenue growth in all four businesses reaching a growth target level of 6-8% at North America Branded and North America Distribution and 5-7% at Europe Branded (Health) and Europe Distribution.
Achieved revenue growth at all four businesses1: •NorthAmericaBranded:+6.6%; •NorthAmericaDistribution:+5.3%; •EuropeBranded(Health):+6.0%; •EuropeDistribution:+5.5%.
Continue to achieve profit increase in all four businesses reaching a strategic profit target level of 10-12% at North America Branded and Europe Branded (Health), 4-5% at Europe Distribution and 3-4% at North America Distribution, with some delay (1.5-2% in 2008).
EBIT margins at all four businesses1 in line with or close to target levels:
•NorthAmericaBranded:9.6%; •NorthAmericaDistribution:1.5%; •EuropeBranded(Health):10.6%; •EuropeDistribution:4.7%.
Broaden and internationalize our brands and brand portfolio in the key product categories.
Acquired ‘So Good‘ brand, introduced ‘Whole Earth’ brand and products in Germany and the Netherlands, and launched ‘Buon per te’ for Italian soy market.
Strengthen our distribution business via organic growth, new contracts and complementary consolidations.
Achieved strong growth at distribution businesses in North America and Europe through organic growth and acquisition of ‘Apple A Day’ business in Florida (US).
Improve working capital and cash flow. Achieved increase in net cash inflow from operating activities2 of EUR 23.2 million to EUR 34.5 million in 2008.
Revenue 1
Performance in EUR millions By business segment in % 2
EBIT 1
Measuring our performance
North America Branded 9.1% North America Distribution 50.9% Europe Branded 30.9% Europe Distribution 9.1%
North America Branded 19.8% North America Distribution 17.4% Europe Branded 53.1% Europe Distribution 9.7%
1 Continuing operations only2 Excluding non-allocated revenue
1 Continuing operations only2 Excluding non-allocated (corporate) expenses and eliminations
1 In constant currencies, excluding acquisition effects2 Continuing operations only
8908_WessanenAR_UK_01_Contents-msgCEO.indd 3 13/3/09 16:38:39

4 Royal Wessanen nv/Annual Report 2008 Wessanen – all you need to know
Wessanen – all you need to know
Royal Wessanen nv is a multinational food corporation based in the Netherlands that believes in delivering authenticity and superior taste to its customers.
In both Europe and North America, we are a large-scale supplier of branded authentic food and beverage products. We have developed a reputation for products that appeal to consumers who consciously choose Health and Premium Taste foods.
North America
Our North American branded business comprises three subsidiaries. American Beverage Corporation is a leading beverage manufacturer, offering a variety of products from kids’ drinks to cocktail mixes. PANOS Brands manages a portfolio of Wessanen-owned natural and specialty foods and beverage brands. Liberty Richter, outsourced as a division of World Finer Foods, manages brands for third-party clients. The customer base of these three companies includes supermarket chains, mass merchandisers, independent grocers, natural/health food stores, specialty/ethnic stores, bars and restaurants.
Brands
Europe
Our European branded business includes the operations of Wessanen Nederland, Favory Convenience Food Group, Wessanen Belgium, Distriborg, Allos, Tartex/Dr.Ritter, Kallo Foods, Righi and Bio Slym. These companies manufacture and/or market a wide range of Health foods and Premium Taste brands, marketed via health food stores, independent grocers, supermarkets and other food and catering outlets.
Brands
Branded
8908_WessanenAR_UK_01_Contents-msgCEO.indd 4 13/3/09 16:38:54

5 Wessanen – all you need to know Royal Wessanen nv/Annual Report 2008
We operate a modern, efficient, distribution system in Europe and North America. As well as our own products, we distribute other leading Health and Premium Taste brands under contract. Using our marketing skills, we help professionalize retailing techniques at the neighborhood stores who stock our products.
North America
Tree of Life North America distributes Health and Premium Taste food products throughout the US and Canada. As well as its own range of natural and health foods, it distributes a large number of proprietary brands to supermarket chains, independent grocers, natural/health food stores and specialty/ethnic stores. Its nationwide network operates through ten distribution centers across the US, with three additional centers in Canada.
Brands distributed on behalf of others
Europe
In Europe, our distribution companies provide a route to market for our own Health and Premium Taste brands as well as other proprietary brands which need to reach either the mass market or specialist health food stores. Natudis serves retailers in the Netherlands, Belgium and Luxembourg. Tree of Life UK undertakes the same role in the UK and Irish markets.
Brands distributed on behalf of others
Celestial Tea/Terra Chips
Reese/Da Vinci
Knorr
Amy’s
Annie’s
Ole Mexican
Badia
Organic Valley
Twin Lab
Avalon
Krisprolls
Pataks
Rice Dream
Blue Dragon
Tabasco
Mezzetta
McCormick
Nestlé
Distribution
8908_WessanenAR_UK_01_Contents-msgCEO.indd 5 13/3/09 16:38:59

6 Royal Wessanen nv/Annual Report 2008 Message from the CEO
Message from the CEO
During 2008, all four of our divisions continued to trade profitably for the second year in succession. This performance demonstrates that our strategy is sound and that the Company is moving steadily forward.
The restructuring process has created a solid platform on which to build a successful business in the Health and Premium Taste sectors. However, the overall results have stayed behind, and it is important that we find ways to rectify this shortcoming.
Branded business Three years ago, we made a deliberate decision to strengthen the profile of our brands in the marketplace. Since then, we have been systematically reviewing the brands and, where necessary, investing to increase consumer appeal while maintaining our commitment to deliver excellent flavors from pure natural ingredients.
In 2008, we continued to enter new categories, and to look for ways to enhance our portfolio through innovation. We also extended our brand internationalization initiative, as evidenced by the launch of the Whole Earth brand in Germany and the Netherlands.
We have used our knowledge of specialist markets to develop new products and marketing techniques, and introduce new categories such as meal components, Japanese cuisine and rice-based food and drinks.
These factors have combined to deliver growth in our branded businesses on both sides of the Atlantic.
Distribution business The distribution businesses also improved their performance, hitting their targets for growth. Tree of Life North America (TOL NA) is responsible for generating approximately half of Wessanen’s annual revenues and, as such, has a crucial role to play in the Company’s overall business performance. Having returned to profit in 2007, it continued to generate improved returns in 2008.
The key drivers behind TOL NA’s performance are its expertise in category management, its successful adoption of new technology and its ability to find new efficiencies in its processes.
Most importantly, TOL NA has re-established its reputation in the marketplace as a good company to work with. This has enabled it to win over new partners at both ends of its pipeline: brand owners looking for a way to get their product onto store shelves in the US and Canada, and store owners looking for products that will give strong turnover with good margins.
Macro-economic considerationsThese positive trends come at a time when the global macro-economic situation is deteriorating. The sudden downturn has affected businesses in all sectors, and the full impacts are not yet clear.
Our view is that we should adopt a cautious approach to business, and try to build a buffer that will protect us against the worst impacts. Against a backdrop of deteriorating economic conditions, we have therefore taken precautionary cost-saving measures across the Company in order to support our operational plans for 2009. In view of the current economic uncertainty, we believe it is inappropriate at this stage to provide a specific financial outlook for 2009.
8908_WessanenAR_UK_01_Contents-msgCEO.indd 6 17/3/09 16:13:54

7 Message from the CEO Royal Wessanen nv/Annual Report 2008
Strategic continuityWe remain committed to our strategy of authenticity, transparency and sustainability. On both sides of the Atlantic, consumer enthusiasm for health and organic food products continued to rise during 2008, despite the economic slowdown. Our customers buy our products because of our reputation for combining pure ingredients to make authentic products with good flavors. We will continue to adhere to our policy of transparency through dialogue with customers, suppliers, employees and investors.
We will also continue to pursue the goal of sustainability, because it brings our economic, social and environmental ambitions into alignment – and none of these elements conflict with our ability to maintain our business in difficult economic circumstances.
Phase I Restructuring of all businesses
– Restoring credibility for shareholders and financial community
– Restructuring and tightening financial control
In 2003, we initiated a series of cost-saving and improvement measures across the whole organization, with the goal of achieving annual savings of EUR 100-115 million.
Phase II Building platforms for growth
– Stabilizing the financial base to fuel growth
– Building growth platforms– Implementing strong MD
programs– Pursuing process excellence
With a new lean infrastructure, we upgraded our management approach and launched new initiatives to raise the standard of the Company’s processes.
Phase III Autonomous growth
– Focusing on autonomous growth
– Re-establishing Tree of Life NA position
– First add-on acquisitions– Divesting Private Label business
Building on our expertise in the Health and Premium Taste sector, we developed new products and sharpened the marketing focus for our existing brands. In distribution, we focused on excellence in the fundamentals of food distribution, combined with first-class product, market and consumer knowledge, which lead to an increased credibility with customers and vendors.
Phase IV Portfolio alignment
– Continuing focus on autonomous growth
– Reviewing long-term business portfolio
We will maintain our drive to internationalize key brands, to find new and profitable categories and to strengthen our product portfolio through innovation. During 2009, we will review the business case to divest our US drinks company American Beverage Corporation.
Our peopleI would particularly like to thank the people who work for Wessanen for their hard work and commitment during the year. After a challenging journey, we have achieved the goal of profitable growth in almost all of our activities. This would not have been possible without the tenacity, drive and initiative that has been shown by our employees, and the Board appreciates this fact.
Frans KoffrieInterim CEO
8908_WessanenAR_UK_01_Contents-msgCEO.indd 7 17/3/09 16:13:55

8 Royal Wessanen nv/Annual Report 2008 Delivering authenticity
Delivering authenticity
By choosing food from our Health brands, they are respecting their own bodies. When they choose exotic Premium Taste food, they want to be sure that it is the real thing, because it gives them a sense of unity with the people and the place where the recipe originates. In both cases, the common denominator is authenticity – honest well-flavored food made with authentic ingredients.
Our commitment to authenticity is supported by two related corporate values – transparency and sustainability.
We believe that true authenticity cannot exist without transparency. By being open with our customers, our suppliers, our employees and our other stakeholders, we create an atmosphere of mutual trust in which all issues can be discussed and resolved.
From the information presented through our corporate communications to the lists of ingredients on the packaging of our products, we are committed to explaining our actions, our practices and our values.
We measure our business in terms of our economic, social and environmental impact, with the objective of improving our overall sustainability. Every decision we make is guided by this factor. We examine our supply chain to ensure that our ingredients are produced by fair and ethical methods. We look for new ways to reduce the CO2 footprint as a result of our commercial activities. We recognize that Wessanen sits at the heart of a matrix of stakeholders, and that we have an obligation to balance each stakeholder group’s interests.
Our consumers are special. To them food is more than just human fuel. It is intimately connected to their sense of self-worth.
Authenticity
Everything we eat comes from nature. Our goal is to ensure that our products deliver delicious original natural nourishment to our customers in the purest possible state.
Transparency
We are open, ethical and honest in all our activities, and are keen to maintain a constructive dialogue with our stakeholders.
Sustainability
We constantly seek to balance the interests of our stakeholders and judge our performance by economic, social and environmental criteria.
8908_WessanenAR_UK_02_Delivering_Auth.indd 8 13/3/09 17:05:13
9 Delivering authenticity Royal Wessanen nv/Annual Report 2008
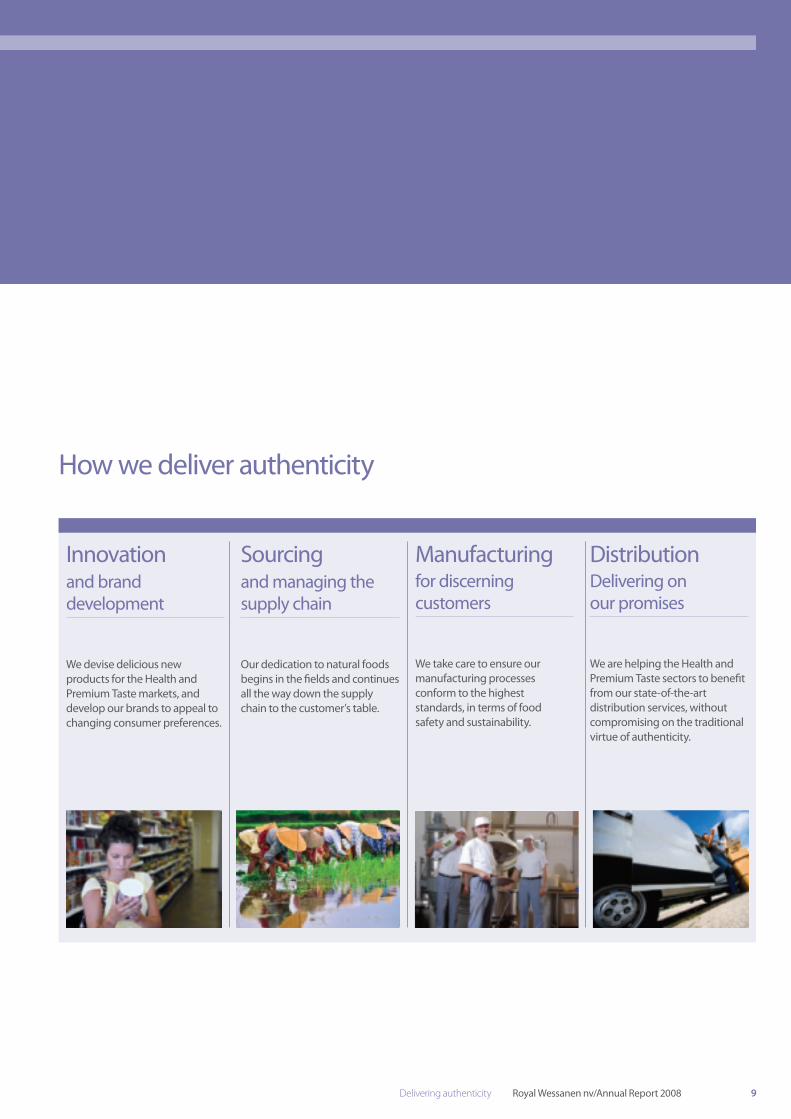
Innovation and brand development
We devise delicious new products for the Health and Premium Taste markets, and develop our brands to appeal to changing consumer preferences.
Sourcingand managing the supply chain
Our dedication to natural foods begins in the fields and continues all the way down the supply chain to the customer’s table.
Manufacturingfor discerning customers
We take care to ensure our manufacturing processes conform to the highest standards, in terms of food safety and sustainability.
DistributionDelivering on our promises
We are helping the Health and Premium Taste sectors to benefit from our state-of-the-art distribution services, without compromising on the traditional virtue of authenticity.
How we deliver authenticity
8908_WessanenAR_UK_02_Delivering_Auth.indd 9 13/3/09 17:05:20

10 Royal Wessanen nv/Annual Report 2008 Delivering authenticity
In highly competitive markets, it is difficult to find ways to achieve significant growth. But one method stands out: innovation.
We operate in very specific parts of the marketplace, namely Health and Premium Taste. Our knowledge of these sectors is second to none. We are therefore in a position to closely monitor the changing nature of consumer taste.
In recent years, demand for health and organic foods has accelerated strongly. This trend plays to our strengths, as acknowledged by experts in this sector. Our position is reinforced through our brand portfolio. Many of our brands have been mainstays of the health food trade for decades. Consumers trust them to deliver high-quality authentic products that meet their criteria for honest additive-free food that tastes good.
In Europe and North America, we have established product development teams whose task is to study the Health and Premium Taste markets and develop new products which might open up new revenue streams.
Speed to market is essential. Once a decision has been made, the corporate innovation team helps the local teams to fast-track the product into the stores, and to set up the necessary promotional activities to boost consumer and retailer interest.
New product development is relatively expensive, but experience has taught us that the additional costs are less onerous if the product can be launched on a multi-national basis. The larger volumes help to offset the start-up costs.
The new product development process enables us to build synergies, with a single initial budget enabling us to grow sales in a number of markets.
Beyond the purely commercial logic, we are also very keen to help our customers find new, exciting products that are full of flavor and goodness, in both the Health and Premium Taste sectors.
French organic brand Bjorg introduced a new range of non-dairy drinks.
During 2008, Whole Earth was introduced in supermarkets in Germany and the Netherlands.
Innovation and Brand Development
New strategies, new brands, new products
As consumers look to reduce meat and dairy intake, our French organic brand Bjorg has developed a new range of cereal and nut-based drinks, in addition to its soy-based range. The new drinks are 100% vegetal, with no cholesterol or lactose but rich in vitamins, calcium, magnesium and fiber. Sales have now reached EUR 6 million, and are still rising rapidly.
Non-dairy drinks are a key category for Wessanen, particularly now that we have our own soy producer, Bio Slym. In the UK, So Good is an established brand specializing in soy milk and rice-based beverages. In 2009, we aim to introduce the So Good brand into other core European markets. During 2009, we also intend to add new products to the So Good range, and hence attract new health-conscious consumers to the non-dairy category.
The organic food product sector in the Netherlands is small by comparison with other western European countries. Consumer research has shown that this is mainly due to the fact that the products are not visually appealing to consumers, who also think they are less tasty.
At the end of 2008, we launched the international brand Whole Earth in the Dutch supermarkets. This is a contemporary brand with good design values and with a key focus on delivering maximum flavor with a range that includes fruit spreads, peanut butter, chocolate spreads, cereals and cookies.
Our knowledge of the Health and Premium Taste sectors is second to none.
8908_WessanenAR_UK_02_Delivering_Auth.indd 10 13/3/09 17:05:24

The Netherlands 15.0% Belgium 3.0% France 34.8% UK 10.0% Germany 9.0% Italy 0.3% US 25.9% Canada 2.0%
11 Delivering authenticity Royal Wessanen nv/Annual Report 2008
As a manufacturer and distributor of food products, Wessanen is responsible for operating various elements in the supply chain. It starts with raw ingredients growing in fields and ends with the product on the consumer’s table.
While we directly control our manufacturing, marketing and distribution activities, we rely on outside suppliers for our raw ingredients. At this upstream end of the supply chain, the key challenge is to ensure our ingredients conform to our business principles of authenticity, transparency and sustainability.
Authenticity refers to the purity and genuineness of a product’s origin, its ingredients and the methods used in growing and manufacturing these ingredients. If we can be sure that our suppliers are providing us with authentic ingredients, then we can disclose our products’ origins to our consumers, and achieve the goal of transparency. The same process enables us to analyze the level of sustainability that applies to individual ingredients on their journey from field to manufacturing plant, and to motivate suppliers to improve their performance against sustainability criteria. In 2005, we started measuring the percentage of branded SKUs whose key ingredients can be accurately traced back to country level, thus ensuring transparency of origin.
In 2007, we used a self-assessment questionnaire for our suppliers, covering topics such as environment, product responsibility, occupational health and safety, child/forced labor, collective bargaining and the right to organize, discrimination and fair wages. This approach provided valuable lessons and we have now made adjustments to improve our supply chain approach for the coming years.
In 2008, we launched a pilot project called the Supply Chain Audit Protocol. The crucial difference between the self-assessment supplier questionnaire and this approach is that the latter is more transparent, because it will be conducted by a certified third-party auditor.
The key aim of this protocol is to monitor the level of quality and sustainability in our procurement system at the sourcing and purchasing stage. Initially, it will examine our performance in the branded Health sector, where we have direct influence on the production process.
Sourcing
Managing the organic supply chain
Representing almost two-thirds of our total European output, organic food plays a vital role in our product mix. The key challenge is to maintain the integrity and purity of the ingredients throughout the supply chain.
We define ‘organic products’ as those which originate from a production system that sustains the health of soils, ecosystems and people, relying on ecological processes, biodiversity and cycles adapted to local conditions, rather than using inputs with adverse effects. In practice, this means ensuring that our organic ingredients comply with the definition.
To achieve this, we apply certain criteria to our suppliers. Firstly, we insist that the supplier is registered as an organic producer by the certifying body in the country of origin. We cooperate with other buyers to ensure that, where possible, our orders are large enough and regular enough to ensure the commercial viability of these local suppliers.
We undertake random laboratory analysis of ingredients to ensure that the ingredients comply with our orders in terms of purity.
Recently, we have taken steps to create a framework of standards that brings our entire supply chain into alignment with our overall business principles. By translating our business principles into concrete criteria, and adding them to international food standards, we defined the Wessanen Supply Chain Protocol. The objective is to ensure that our suppliers conform with these common criteria and with our commitment to authenticity, transparency and sustainability.
The majority of soy used in Wessanen-owned branded soy products is sourced from Italy.
% of organic salesdivided by country
8908_WessanenAR_UK_02_Delivering_Auth.indd 11 13/3/09 17:05:25

12 Royal Wessanen nv/Annual Report 2008 Delivering authenticity
Manufacturing
We operate production sites in the Netherlands, Belgium, Germany, Italy and the US. These plants manufacture 61% of our own branded production volume, with the remainder being outsourced to specialist food and beverage suppliers.
Food safety is a crucial factor in all our production plants. Each production site is externally certified to one or more relevant food safety standards.
In addition, we developed the Wessanen Food Safety Plus standard which goes beyond the legal requirements. We are now refining our processes even further in order to ensure that risks relating to contamination, transport, training, purchasing, traceability, recalls and new product development are properly identified.
By net sales volume, more than a third of our branded products are organic, while 21% are natural. To meet the stringent standards required by the national and international organic food accreditation bodies, we take great care to ensure that our production operations exclude any contamination from non-organic materials.
A modern approach to organic production
For 35 years, Allos has been making high value products for the German organic and health food market. Its ‘factory’ looks more like a traditional North German farmhouse, but its approach to manufacturing is state-of-the-art for organic production.
The company has five production lines (honey, fruit spreads, cereals, biscuits and bars). With virtually 100% organic ingredients, the recipes are balanced, wholesome and natural. The staff take a craftsman-like attitude to their work,
While cost control will always be an important factor in our manufacturing operations, it is balanced against the need to achieve high standards of sustainability. Each local management team is responsible for monitoring CO2 emissions, water usage, waste volumes, energy consumption and health and safety performance. These statistics are reported regularly to the Sustainability Board, and new targets are set for the following year.
As a producer of authentic food products for the Health and Premium Taste markets, Wessanen is keenly aware of its responsibility to maintain high standards. Our commitment to this objective is reflected in the high priority that we assign to ISO 9001 and ISO 14001 accreditation.
441,000Total production volume,in metric tons in 2008. As a producer of authentic foods,
Wessanen is keenly aware of itsresponsibility to maintain highproduction standards.
carefully processing ingredients to achieve higher quality in short production runs. Care is also taken to make the packaging as environmentally friendly as possible.
To improve sustainability, Allos has implemented an energy-saving campaign focusing on heating, lighting and insulation. It has also reduced its water consumption by using a treatment with effective microorganisms to recycle waste water. Its power is derived from green sources, and the plant now has a low carbon footprint.
61%of total production volume manufactured by Wessanen (39% outsourced to third parties).
8908_WessanenAR_UK_02_Delivering_Auth.indd 12 13/3/09 17:05:30

13 Delivering authenticity Royal Wessanen nv/Annual Report 2008
Distribution
We generate more than half our revenue from distribution activities in Europe and North America. This involves receiving and storing our own products and those which we distribute for other companies, generating and fulfilling orders from retailers, and transporting the orders to retail customers.
The distribution function is centered on 20 warehousing sites, which act as operational hubs. The warehouses and the processes that take place within them are subject to constant review as we seek to improve our service to customers, and optimize the efficiency of our operations.
In North America, technology is the catalyst driving excellence in logistics execution. In 2008, we implemented a field sales hand-held ordering system and on-board computers on the company truck fleet, and launched the Online Analysis Kit (OAK) supplier portal. Moreover, our Smart Assortmentsm marketing service is a highly effective system that aligns product assortments with the demographics of individual stores. In 2008 alone, over 7,500 retail stores benefited from the use of this system.
In Europe, we provide value-added marketing and retailing services to help stores build sales. At Tree of Life UK, we are rolling out Slim4, a sales forecasting and inventory management system which helps us to maintain high service levels and improve stock rotation. In 2008, Natudis continued to support the Natuurwinkel concept, bringing a more professional approach to the health food trade.
Our quest for sustainability has focused management attention on CO2 emissions from our vehicles, which travel approximately 31 million kilometers every year – and inevitably make a major contribution to our overall corporate carbon footprint. Our objective is to reduce our CO2 emissions by 20% by 2012, a target which is in line with the European Union’s commitment on emissions.
We constantly seek to improve our service to our customers and optimize the efficiency of our operations.
The Natuurwinkel formula: local stores with strong, clean branding and a bright, modern look selling the best health food products.
Sharing knowledge with vendor partners
Tree of Life NA, our North American distribution company, employs sophisticated inventory software to keep track of the thousands of stock lines that are stored in its warehouses.
It has now extended its IT capability to provide an additional service to companies for whom it offers distribution services. The Online Analysis Kit (OAK Basic) enables these vendor partners to view vital commercial data such as movement reports, inventory tracking, and sales trends. The service has been so well received by vendor partners that it has been enhanced to form OAK HD, which provides even more data, as well as web-based seminars which vendor partners can use to train their own staff in sales optimization.
31 million kmTotal transport distance 2008with own fleet.
8908_WessanenAR_UK_02_Delivering_Auth.indd 13 13/3/09 17:05:33
14 Royal Wessanen nv/Annual Report 2008 Report of the Executive Board
Report of the Executive Board
Moving into 2008, we have a portfolio of strong local brands, backed by a reputation for authenticity. Our distribution systems are efficient and cost-effective. Demand for both healthy foods and exotic ethnic cuisine continues to rise on both sides of the Atlantic.
During 2008, management attention was specifically focused on generating organic growth by continuing to develop key brands, refining our innovation pipeline and creating opportunities for multi-country product launches. In our distribution businesses, we strived to enrich the quality of our retail relationships by achieving a high level of product, market and consumer expertise. We looked for opportunities to exploit buying synergies in Europe and build partnerships with our suppliers.
Innovation and brand developmentIn 2008, we grew the majority of our key brands both in Europe and North America. A stream of new products, packaging innovations and targeted marketing efforts resulted in higher sales and an increased credibility as the expert in healthy, natural, organic foods.
One of the key developments was the introduction of our organic brand Whole Earth in supermarkets in Germany and the Netherlands. In both countries, the Whole Earth product offering was positively received by the trade.
Distribution and distribution servicesWe continued to grow our North American and European distribution businesses during 2008. Being a specialist in the distribution of Health and multicultural foods, our focus is on providing our customers with excellence in logistics and sales execution, combined with a best-in-class knowledge of the products and consumer trends. By implementing new technologies and increasing our services on the one hand, and by reducing operating expenses on the other hand, we managed to build new customer relationships and grow our revenues.
Mergers, acquisitions and divestmentsIn July 2008, Wessanen acquired the So Good European business, the second-largest brand in the UK market for dairy alternatives. The brand offers a range of ambient and chilled soy-based beverages and is a fine addition to Wessanen’s non-dairy portfolio, which is one of the key strategic food categories for its European Health brands.
During that same month, Tree of Life North America bought Apple A Day. With the acquisition of the business of this small privately owned distributor of organic, kosher and other specialty and organic wine and beer, Tree of Life can provide its retail customers with a complete selection of organic, natural and specialty food products.
In September 2008, Wessanen France started the process of acquiring all remaining shares in Distriborg Groupe. In 2000, Wessanen initially acquired 89.7% of the shares in Distriborg Groupe. Since then, Distriborg had successfully strengthened its key market positions and has played a major role in building a strong platform for the marketing and distribution of Health and Premium Taste foods. Obtaining full ownership of the company will increase the flexibility in enhancing the execution of Wessanen Europe’s growth strategy. In that respect, an agreement was reached with Laboratoires Lehning to acquire all of their shares, representing 9.92% of Distriborg’s share capital. In early 2009, the remaining 0.4% of the shares were acquired by means of a mandatory buy-out offer. As a result, Distriborg Groupe’s shares were delisted from Euronext Paris and Wessanen now holds 100% of the shares of Distriborg Groupe.
During 2009, we will continue to monitor the market for appropriate acquisition opportunities, but such opportunities will only be acted upon if the target company falls within our strict criteria.
8908_WessanenAR_UK_03_ReportExecBoard.indd 14 13/3/09 17:07:32

Frans Koffrie (1952)Chief Executive Officer and President European activitiesDutch nationality. Interim CEO since February 24, 2009; proposed to be appointed Chairman of the Executive Board at Wessanen’s Annual General Meeting of Shareholders on April 22, 2009. Former member of the Supervisory Board. Prior positions include Chairman and CEO of the Executive Board of Corporate Express NV. Additional positions include Chairman of the Supervisory Board of Nyenrode Business University.
Frans Eelkman Rooda (1952)Chief Financial OfficerDutch nationality. Appointed CFO in June 2008; proposed to be appointed member of the Executive Board at Wessanen’s Annual General Meeting of Shareholders on April 22, 2009. Prior positions include CFO at OPG Groep N.V. (1997-2008) and partner at McKinsey & Company. Additional positions include member of the Supervisory Boards of De Lage Landen International B.V. and OctoPlus N.V.
Richard Lane (1947)Member Executive Board and CEO North American activitiesUS nationality. Appointed CEO North American activities in April 2006, appointed member of the Executive Board in April 2007, eligible for reappointment in 2010. Prior positions include President of Supervalu’s Eastern Region, and appointments with PepsiCo, Ameriserve and Frito-Lay. Additional positions include member of the Board of Directors, World Finer Foods, Inc.
15 Report of the Executive Board Royal Wessanen nv/Annual Report 2008
SustainabilityWe continuously balance the interests of our stakeholders in economic, social and environmental issues to minimize the impact on the environment. In May 2008, we published our third Sustainability Report, making our efforts transparent for all our stakeholders. The document, which is available in PDF format from our website, was prepared in accordance with the 2006 Global Initiative Guidelines (G3) and represents a measure of our environmental, social and economic performance. Two leading benchmarks of leading companies in the Netherlands, conducted in 2008 by PricewaterhouseCoopers and VBDO respectively, again underscored the progress made in the field of sustainability and transparency.
Wessanen’s Sustainability Report 2008 is scheduled to be published on our website in May 2009.
Financial achievements 2008Revenue for the year was EUR 1,602.8 million, 1.5% above last year’s revenue of EUR 1,579.8 million. Excluding negative foreign exchange effects of EUR 82.1 million, revenue for the year increased by 6.7%, partly driven by acquisitions. The autonomous growth excluding foreign exchange effects amounted to 4.7%.
All four businesses demonstrated solid growth in revenue in local currencies. In North America, our branded operations achieved revenue growth of 12.6%, including the acquired juice drink business by American Beverage Corporation (excluding this acquisition: 6.6%). Our distribution operations achieved constant currency revenue growth of 5.5%, adjusted for a weaker Canadian dollar and including the acquisition of the Apple A Day business and last year’s acquisition of Organica USA, Inc (excluding these acquisitions: 5.3%).
Europe Branded achieved constant currency revenue growth of 7.0%, including the consolidation of the joint venture with Rabo Capital in frozen foods, which company acquired Habek Snacks mid-year 2007, and the acquisition of the So Good business in the UK (excluding these acquisitions: 2.7%). The European Health portfolio realized autonomous constant currency revenue growth of 6.0%. Europe Distribution achieved constant currency revenue growth of 5.5%. These revenue growth figures of both Europe Branded and Europe Distribution have been adjusted for a weaker British Pound.
8908_WessanenAR_UK_03_ReportExecBoard.indd 15 13/3/09 17:07:52

16 Royal Wessanen nv/Annual Report 2008 Report of the Executive Board
Report of the Executive Boardcontinued
Operating result (EBIT) decreased by EUR 4.3 million from EUR 63.1 million in 2007 to EUR 58.8 million in 2008. Excluding non-recurring transactions as reported in ‘other income’, operating profit increased by EUR 7.8 million from EUR 45.3 million in 2007 to EUR 53.1 million in 2008.
North America Branded realized an EBIT margin (operating result as a % of revenue) of 9.6% (excluding acquisition effects), lower than last year’s 10.2%, mainly due to gross margin pressure as a result of higher cost of materials, not fully compensated by pricing. North America Distribution realized an improvement in EBIT margin from 0.7% in 2007 to 1.5% in 2008, mainly as a result of decreased selling, general and administrative expenses due to efficiency improvements and strict cost control (1.0%, excluding one-off gains on the sale of premises and the sale of a label).
Europe Branded realized an EBIT margin of 7.3%, lower than last year’s of 8.6 % (excluding net gains on the sale of the premises in Tilburg (the Netherlands) and Essen (Belgium)), despite strict cost control, mainly caused by disappointing results at Favory Convenience Food Group. However, the ‘Health’ business realized a return on sales of 10.6%, excluding acquisition and foreign exchange effects. Europe Distribution achieved an EBIT margin of 4.7%, excluding foreign exchange effects (2007: 4.7%, excluding one-off gain on the sale of the premises in Harderwijk (the Netherlands)).
Net financing costs increased by EUR 3.4 million to EUR 13.3 million in 2008 from EUR 9.9 million in 2007, mainly as a result of increased interest expenses of EUR 2.7 million due to an increase in debt financing, and expenses of EUR 3.2 million related to a diesel fuel price hedge contract entered into by our North America Distribution operations by the end of the third quarter of 2008.
Income tax expense increased by EUR 0.5 million to EUR 11.0 million in 2008. The effective income tax rate for 2008 is 24.3% (2007: 19.8%). The difference between the effective income tax rate for 2008 and the weighted average statutory income tax rate of 33% is mainly to be explained by the reassessment of income tax positions.
As a result, net income from continuing operations decreased from EUR 42.8 million in 2007 to EUR 34.5 million in 2008. With a 3% decrease in the average number of outstanding shares, earnings per share from continuing operations decreased from EUR 0.61 in 2007 to EUR 0.51 in 2008.
Working capital at the end of the year amounted to EUR 198.3 million – 12.4% of revenue (2007: EUR 209.1 million – 13.2% of revenue). The positive working capital development, excluding acquisition and foreign exchange effects, is mainly caused by a decrease in trade receivables of EUR 13.2 million.
Net cash from operating activities increased by EUR 23.2 million to EUR 34.5 million in 2008, from EUR 11.3 million in 2007 (continuing operations only), mainly as a result of the positive working capital development compared to 2007 (EUR 19.1 million), and lower payments from provisions (EUR 8.1 million).
8908_WessanenAR_UK_03_ReportExecBoard.indd 16 16/3/09 12:01:37

17 Report of the Executive Board Royal Wessanen nv/Annual Report 2008
Financial overview per segmentIn EUR millions, unless stated otherwise North American business European business Branded Distribution Branded Distribution Non-allocated 1 Eliminations Total2008Revenue third parties 142.6 802.0 486.7 143.9 27.6 – 1,602.8EBIT 13.3 11.7 35.7 6.5 (7.6) (0.8) 58.8EBIT margin (EBIT as a % of revenue) 9.3% 1.5% 7.3% 4.5% – – 3.7%Average capital employed 94.1 166.5 203.5 46.9 30.0 – 541.0ROACE 14.3% 7.0% 17.5% 13.9% – – 10.9%
2007Revenue third parties 135.4 813.0 462.2 144.1 25.1 – 1,579.8EBIT 13.8 5.6 42.1 10.2 (8.6) – 63.1EBIT margin (EBIT as a % of revenue) 10.2% 0.7% 9.1% 7.1% – – 4.0%Average capital employed 2 67.7 155.7 203.3 57.7 20.6 – 505.0ROACE 20.2% 3.6% 20.7% 17.6% – – 12.5%
1 Karl Kemper Germany and corporate entities2 2007 restated due to revision of definition average capital employed (2007 excluding intangible assets); see Glossary (page 96)
unless significant investments opportunities should arise. Likewise, the size of our organization will not change significantly except as a result of major divestments or acquisitions.
Against a backdrop of deteriorating economic conditions, we have taken precautionary cost-saving measures across the Company to support our operational plans for 2009. In view of the current economic uncertainty, we believe it is inappropriate at this stage to provide a specific outlook for 2009.
On both sides of the Atlantic, consumer enthusiasm for health and organic food products continued to rise during 2008, despite the deteriorating economic climate. We believe that our customers would rather economize in other areas of their lifestyle than give up their commitment to pure natural authentic foods. We are confident that our products, systems and processes will continue to fulfil that demand efficiently and effectively.
Objectives and outlook 2009
Looking ahead, we will continue to focus on growing our top line and protecting our margins. In order to create value for our shareholders, we aim to achieve growth at a return on capital employed in excess of our cost of capital.
Our overall objective is to continue to build our European Branded and Distribution operations and to further improve our North American distribution business, using our expertise in Health and Premium Taste foods. We will maintain our drive to internationalize key brands, to find new and profitable categories and to strengthen our product portfolio through innovation. During 2009, we will move into the fourth phase of our strategy which involves the realignment of our business portfolio. In this context, we will review the business case to divest our US drinks company American Beverage Corporation.
In general, we aim to strengthen our balance sheet. We do not foresee the need for additional or new financing arrangements in the course of 2009,
Net debt increased by EUR 71.6 million in 2008 from EUR 143.0 million to EUR 214.6 million at year end 2008, mainly as a result of a net cash inflow from operating activities of EUR 34.5 million, offset by net investments in property, plant and equipment of EUR 13.8 million, business acquisitions of EUR 29.9 million, dividend payments of EUR 40.6 million and negative currency effects of EUR 21.0 million.
The return on average capital employed declined from 12.5% over 2007 to 10.9% over 2008. This decline stems from an increase in average capital employed as a result of acquisitions and the decrease in operating result as explained above.
DividendIn order to create financial flexibility, Wessanen aims to strengthen its balance sheet. In this context, it has been decided to propose to shareholders on April 22, 2009, to declare a dividend of EUR 0.20 per share, equal to the interim dividend paid out in August 2008. This represents a pay-out of close to 40%. Going forward, Wessanen aims to pay out a dividend of between 35-45% of its net result, excluding major non-recurring effects. The Company will no longer pay interim dividends.
8908_WessanenAR_UK_03_ReportExecBoard.indd 17 13/3/09 17:07:52
0
100
200
300
400
500
600
700
800
20082007
561615
18 Royal Wessanen nv/Annual Report 2008 North America Branded
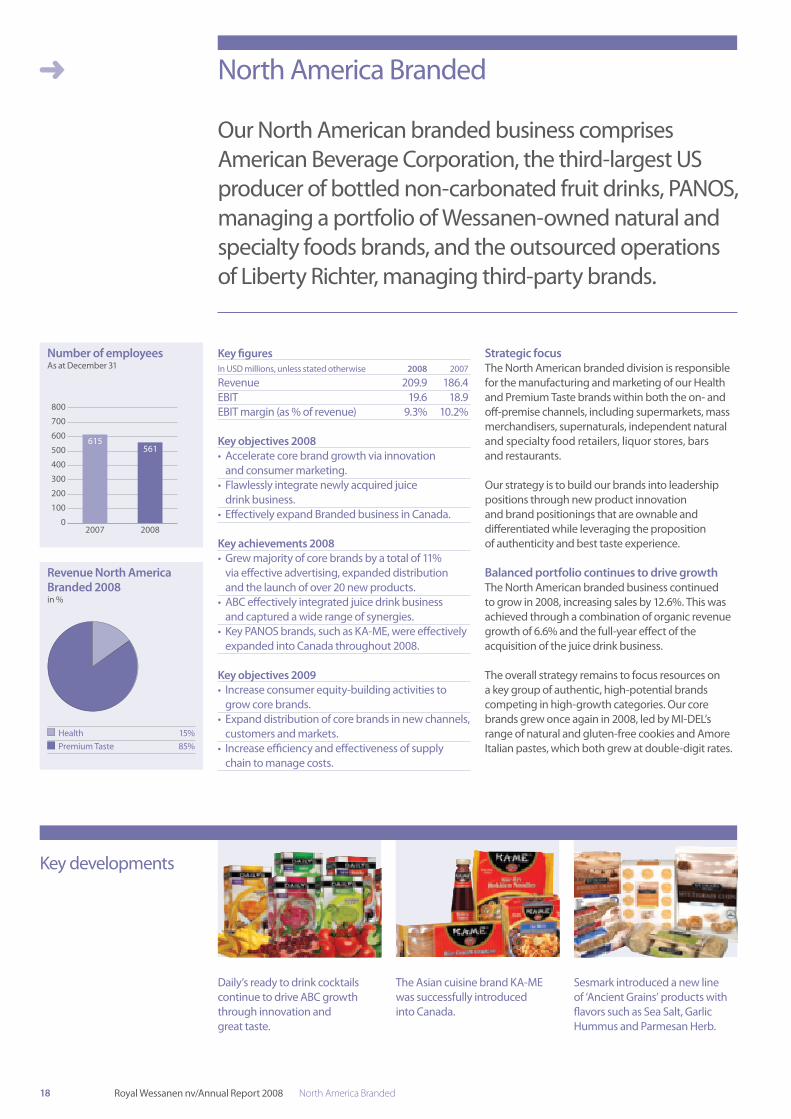
Daily’s ready to drink cocktails continue to drive ABC growth through innovation and great taste.
The Asian cuisine brand KA-ME was successfully introduced into Canada.
Sesmark introduced a new line of ‘Ancient Grains’ products with flavors such as Sea Salt, Garlic Hummus and Parmesan Herb.
Key developments
North America Branded
Our North American branded business comprises American Beverage Corporation, the third-largest US producer of bottled non-carbonated fruit drinks, PANOS, managing a portfolio of Wessanen-owned natural and specialty foods brands, and the outsourced operations of Liberty Richter, managing third-party brands.
Key figuresIn USD millions, unless stated otherwise 2008 2007
Revenue 209.9 186.4EBIT 19.6 18.9EBIT margin (as % of revenue) 9.3% 10.2%
Key objectives 2008• Acceleratecorebrandgrowthviainnovation
and consumer marketing.• Flawlesslyintegratenewlyacquiredjuice
drink business.• EffectivelyexpandBrandedbusinessinCanada.
Key achievements 2008• Grewmajorityofcorebrandsbyatotalof11% viaeffectiveadvertising,expandeddistribution and the launch of over 20 new products.
• ABCeffectivelyintegratedjuicedrinkbusiness and captured a wide range of synergies.
• KeyPANOSbrands,suchasKA-ME,wereeffectivelyexpandedintoCanadathroughout2008.
Key objectives 2009• Increaseconsumerequity-buildingactivitiesto
grow core brands.• Expanddistributionofcorebrandsinnewchannels,
customers and markets.• Increaseefficiencyandeffectivenessofsupply
chain to manage costs.
Strategic focusThe North American branded division is responsible for the manufacturing and marketing of our Health and Premium Taste brands within both the on- and off-premisechannels,includingsupermarkets,massmerchandisers, supernaturals, independent natural andspecialtyfoodretailers,liquorstores,barsand restaurants.
Our strategy is to build our brands into leadership positions through new product innovation and brand positionings that are ownable and differentiatedwhileleveragingthepropositionofauthenticityandbesttasteexperience.
Balanced portfolio continues to drive growthThe North American branded business continued to grow in 2008, increasing sales by 12.6%. This was achieved through a combination of organic revenue growthof6.6%andthefull-yeareffectoftheacquisitionofthejuicedrinkbusiness.
The overall strategy remains to focus resources on a key group of authentic, high-potential brands competing in high-growth categories. Our core brands grew once again in 2008, led by MI-DEL’s range of natural and gluten-free cookies and Amore Italian pastes, which both grew at double-digit rates.
Number of employeesAs at December 31
Revenue North America Branded 2008in %
Health 15% Premium Taste 85%
8908_WessanenAR_UK_04_NA_EUR-Branding.indd 18 13/3/09 17:09:14

19 North America Branded Royal Wessanen nv/Annual Report 2008
There was broad-based strength across the portfolio astheAmericanBeverageCorporation’sjuicedrinkandcocktailmixbusinesses,thePANOSbrandsspecialty foods business, and the Liberty Richter third-partyclientbusinessallexhibitedgrowth.
Although rapidly rising costs created many challenges, 2008 operating profit still grew 3.5% versus prior year, benefiting from top-line growth, partlyasaresultofthejuicedrinkbusinessacquiredin2007.Somemarginpressurewasexperiencedashigher raw material costs were not fully compensated by pricing.
2008 brand highlightsDaily’s brand cocktails continued to grow in 2008, driven by a steady stream of new product developments and packaging innovations. The star performer was the ‘ready-to-drink’ (RTD) line. The brandledofftheyearbyintroducinganewRTDFrozenPinaColadainapouch,whichimmediatelybecameatopseller.Next,Daily’slaunchedanewlineofall-naturalMartinimixers,featuringsuchflavorsasPear,Blueberry,Apple,andLemon.Finally,alineofRTD margarita-flavored cocktails in single-serve bottles was introduced.
Daily’sbrandwasalsonamedastheexclusivesupplierofcocktailmixerstooneofthelargesthotel chains in the US and was also appointed as a key supplier to the country’s largest chain of seafood restaurants. During2008,thejuicedrinkbusiness,acquiredinthe middle of 2007, was fully integrated into the operations of American Beverage Corporation. As part of this integration, ABC installed state-of-the-art high-speed bottle blowing “wheel” technology to increaseefficiencyofitsnewlyexpandedproductioncapacity.ABCalsosuccessfullyexpandedthelicenserights to the Tampico and Hawaiian Punch single-serve bottle businesses obtained as part of the acquisition,openingupfurthergrowthopportunitiesforthesetwohighlyrecognizabletrademarks.
In the specialty foods business managed by PANOS Brands, MI-DEL upgraded the graphics for its natural cookiesandaddedanewsub-lineof‘bite-sized’offerings,featuringsuchflavorsasOatmealChocolate Chip and gluten-free Chocolate Caramel.
The Sesmark brand of crackers introduced a new line of ‘Ancient Grains’ products featuring flavors such as Sea Salt, Garlic Hummus, and Parmesan Herb. These nutritious whole grain crackers are all made with healthy ingredients such as amaranth, millet, sorghumandquinoagrains.Additionally,theSesmark and all-natural Mr. Sprinkles brands both ran their first-ever print advertising in targeted publications, and the Balanced brand protein drink was relaunched in a new environmentally and consumer-friendly package with updated graphics.
Goingforward,weexpectthebrandedbusinessto continue its growth trend in 2009 and beyond through continued new product innovation combinedwithexpansionoftargetedconsumermarketing.
Traditional brand wins new friends
In the US, sales of MI-DEL natural cookies rose by double digits in 2008 as a result of targeted marketingefforts.
In 2007, PANOS Brands launched an initiative to buildbrandawarenessandequity.Theyhadtobecareful. MI-DEL has a loyal consumer base who are quicktocommunicatetheirviewsifthereisanychange to their favorite cookies.
The brand team developed a profile of the MI-DEL consumer: a health-conscious mother who buys food with natural ingredients for her family; she is environmentally conscious, and cares more about substance than style.
Using these consumer insights, the brand team identifiedappropriatemagazinesforaprintadvertising campaign and developed two consumer promotions. The first, an on-pack offeringfreeorganicsunflowerseedstoanyonebuying two packs of MI-DEL cookies, generated anexcellentresponse.Thesecondcoincidedwiththe late summer return to school, a peak time for cookie buying. It was a tie-in with the nationally famousGOTMILKcampaign,offeringfreemilk.Both promotions leveraged natural linkages with the brand’s target market.
Given loyal consumers’ familiarity with the MI-DEL package, the issue of packaging design was challenging. The brand’s graphics were carefully updated to maintain core elements such as the brandlogowhilecontemporizingtheoveralllook.This evolutionary approach was vindicated when quantitativeresearchshowedthatthenewgraphics appealed to 83% of consumers.
The final element in the team’s brand-building effortswasproductinnovation.New‘bitesize’cookies in old-fashioned flavors were introduced to provide an easy, wholesome snacking option.
“I think of our MI-DEL consumers as a board of directors,” says Lisa Coker, Vice President of Marketing at PANOS Brands. “They watch what we do with the brand and they let us know what they think by letters, emails and phone calls.”
Examining the issues
8908_WessanenAR_UK_04_NA_EUR-Branding.indd 19 13/3/09 17:09:18

20 Royal Wessanen nv/Annual Report 2008 North America Distribution
New ASPEN technology provides field sales associates with real-time store-specific information onauthorizations,productmovementand inventory data available at the shelf.
WiththeacquisitionofAppleADay,TreeofLife NorthAmericacannowofferFloridaretailersnotonly the best specialty, natural and organic foods, but also organic wines and beers, through a single distribution system.
Key developments
North America Distribution
Tree of Life North America (TOL NA) has been a leading distributor of natural and organic products for over 35 years and of specialty/gourmet and multicultural foods for over 20 years. No other distributor in North America can match ourtrackrecordandexpertiseinthesespecialistmarkets.
Key figuresIn USD millions, unless stated otherwise 2008 2007
Revenue 1,180.4 1,119.0Revenueatconstantexchangerates 1,181.1 –EBIT 17.3 7.7EBIT margin (as % of revenue) 1.5% 0.7%
Key objectives 2008• Achieveautonomoussalesgrowthinthe
supermarket and natural food store channels.• Utilizetechnologytodriveproductivity.• Optimizedistributioncenterinfrastructure.• Enhancesalesgrowththroughnew
business development.• Reduceoperatingexpensesasa%ofsales.
Key achievements 2008• Salestosupermarketcustomersgrewby5.7%; Top Ten grew by 7.5%.• Salestonaturalfoodstorecustomersgrew
by 4.3%.• Enhancedsalesgrowththroughnew/expanded
vendor partnerships by USD 25 million.• Implementedfieldsaleshand-heldordering
system and on-board computers on company truck fleet, and launched OAK HD supplier information portal.
• IntegratednewtechnologyinDallas distribution center.
• Acquiredregionalorganicwineandbeerdistribution business Apple A Day.
Key objectives 2009• Achievesalesgrowthinbothsupermarket
and natural food store channels.• Utilizetechnologytosupportretailer,
supplier and broker relationships and to drive productivity improvements.
• OptimizedistributioncenterinfrastructureviaDallas/Cleburne consolidation and North Bergen/Allentown relocation.
• Enhancesalesgrowththroughnewbusinessdevelopment and new channels.
• Reduceoperatingexpensesasa%ofsales.
Strategic focusOur North American distribution division supplies supermarkets, mass merchandisers and independent retail operators across the US and Canada with a complete selection of natural, organic, specialty/gourmet and multicultural food products.
The company focuses on providing customers with excellenceinsupplychainlogistics,procurementandsalesexecution,combinedwithabest-in-classknowledge of the products and consumer trends that will contribute to our customers’ current and future sales growth.
Category and product knowledge are key competitivedifferentiatorsforourNorthAmericandistributiondivision.WeusetheexpertiseofourCategory Management personnel combined with our proprietary Smart Assortmentsm neighborhood marketing service to provide optimal product
Revenue North America Distribution 2008 in %
Top 10 supermarket customers 60.1%
All other supermarket customers 23.2%
Natural food store customers 16.7%
Number of employeesAs at December 31
0
500
1000
1500
2000
2500
3000
3500
20082007
3,2043,171
8908_WessanenAR_UK_04_NA_EUR-Branding.indd 20 13/3/09 17:09:22

21 North America Distribution Royal Wessanen nv/Annual Report 2008
assortmentplanscustomizedtotheneedsofindividual retailers and retail locations. In 2008 alone, over 7,500 retail stores benefited from the use of Smart Assortmentsm.
Solid performance in 2008In constant currencies, full-year revenue from the North American distribution division increased by 5.5%. This solid performance was achieved through a combination of organic revenue growth, the on-boardingofnewbusiness,andtheacquisitionofAppleADay.Full-yearEBITincreasedby125%,asaresultofrevenuegrowthandefficiencygains.
Improved technology reinforces excellence in executionDuring 2008, we replaced our supermarket field sales associate hand-held ordering system with new technology called ASPEN (automated sales processing enterprise network). This new state-of-the-art system immediately began producing positive results. Sales associate productivity and companyoperatingefficiencybothimprovedby
using this technology. ASPEN helps grow sales andreduceexpensesbyprovidingourfieldsalesassociates with real-time store-specific information onauthorizations,productmovementandinventorylevels. Ordering decisions can now be based on live dataavailableattheshelf–theclosestpointtoour customers and the consumer. While this new technology was a dramatic improvement when compared to the system it replaced, its integration into the field sales team was rapid and smooth. The system was also very well received by our customers.
Technologyisalsothecatalystdrivingexcellenceinlogisticsexecution.2008wasapivotalyear,asthecompanybegantoimplementhorizontalcarouseltechnology as well as ‘pick to light’ and in-line weight scales.ThehorizontalcarouselsysteminstalledinournewDallas,Texasfacilityyieldeda40%productivityenhancement to our ‘less than case’ pick operations andprovidestheflexibilitynecessarytoadaptourinfrastructure to meet future growth. In-line weight scales and ‘pick to light’ technologies were deployed in two of our facilities, with plans for two more in 2009. This technology is designed to yield a better than 99.95% order accuracy rating.
Additionally, the Operations Dashboard and Operations 360 reporting platforms were developed and deployed. The Dashboard provides our operations team with real-time key performance data, enabling managementtorespondquicklytooperationalchallenges. Operations 360 provides our customers with trending data relating to our performance.
In June, we launched a premium version of our Online Analysis Kit (OAK). Branded ‘OAK HD’, this proprietary service provides the company’s supplierswithexceptionalvisibilityoftheirproductperformance, including item movement, inventory status, sales trend data and vendor void information in a variety of user-friendly formats.
Strategically, TOL NA’s vision is to leverage technologytoenhanceefficiencies,buildqualityinto all of our processes, make information readily available to decision-makers and supply chain partners, and provide visibility of the entire supply chain.Bydoingso,weexpecttoimprovecostcontrol, enhance our financial performance, and continue to delight our customers.
Apple A Day acquisition opens doors to new opportunitiesDuring2008,TOLNAacquiredtheAppleADaybusiness, a privately owned distributor of organic wineandbeertoretailersthroughoutFlorida.By adding these rapidly growing categories to our productselection,wecannowofferFloridaretailersnot only the best specialty, natural and organic foods, but also organic wines and beers, through a single, highlyefficientdistributionsystem.ThisinitiativewasinitiallylimitedtoFlorida,butourobjectiveistouseour supply chain relationships, product assortment andcategoryexpertisetoexpandthedistributionofpremiumqualityorganicwineandbeerintothose states where market conditions, regulatory requirementsandretailrelationshipsallowforaprofitable distribution model to be established.
Examining the issues
Managing complexity in US distribution
Distributor Tree of Life North America (TOL NA) operates a branded product ‘pipeline’ that carries natural and specialty foods to the consumer marketplace.
Atoneendofthepipelineareagroupof‘vendors’.Themajorityofvendorsarebrandedconsumer packaged goods companies that use distributors to reach retailers and ultimatelyconsumers.Attheotherendofthepipelineare‘customers’–thestoresthatsell to consumers. The customers range from giant national supermarket firms down to local neighborhood stores.
The TOL NA team are constantly seeking to build additional volume at either end of the pipeline, by signing up new customers and new vendors. Over the past two years, TOL NA has won around $125 million worth of new customer business, adding around 1,600 new stores to its destination list. At the other end of the pipeline, the company has also securedapproximately$45millionworthofnewbusinessfromvendors.
ThekeytowinningnewbusinessistoshowthecounterpartythatTOLNAcanoffercompetitiveadvantage.TroyBenscoter,SVPCategoryManagementatTOLNA,explains:“We have to show vendors that we can get their products into the right stores, at the righttime,fortherightprice,inordertomaximizetheirsales.Andwehavetoshowcustomers that we can deliver product assortments that will sell rapidly and profitably.”
With44,000uniqueSKUsbeingsoldtothousandsofstoresallovertheUS,itisnotasimpletask.ButthatisexactlywhereTOLNAcanshowcompetitiveadvantage.“Wemanagecomplexityonbehalfofourpartners,”saysTroy.“Forexample,withSmartAssortmentsm, we can put together product assortments that are tailored precisely to the demographics of a particular neighborhood. The retailer can get on with running the store, knowing that the products we’ve put on the shelves are those most likely to appeal to local buyers.”
Attheotherendofthescale,majorsupermarketchainsmaystartoffbyjustorderingstockfromTOLNA.ButTOLNA’scategorymanagementexpertisemeansthattheycandevisecomplexassortmentsthatcangeneratebetterrevenuesforthestore.So TOL NA’s field sales people, armed with the new ASPEN automated sales processing technology,arefrequentlyaskedtomanagethein-storeordering,stockreplenishmentandmerchandizingfunctions,effectivelytakingovertheentireprocess.Atpresent,TOLNAiscontractedtocarryoutfullserviceatapproximately70%ofitscustomerstores, with additional stores converting to this model.
8908_WessanenAR_UK_04_NA_EUR-Branding.indd 21 13/3/09 17:09:23

22 Royal Wessanen nv/Annual Report 2008 Europe Branded
Europe Branded
Wessanen’s European branded business manages Wessanen-ownedHealthbrands,Frozenoperations andsoleagencyactivities.Thebusinesscomprisessixnational units focused on the local Health and Premium TastemarketsinFrance,theNetherlands,Belgium,theUK, Germany, and Italy.
Key figuresIn EUR millions, unless stated otherwise 2008 2007
Revenue 486.7 462.2Revenueatconstantexchangerates 494.5 –EBIT 35.7 42.1EBIT margin (as % of revenue) 7.3% 9.1%
Key objectives 2008• Furtheraccelerategrowthofkeybrandsthrough
a combination of European and local innovations, supportedbyeffectivebrandsupport.
• EnhanceFrozenbusinessperformance.• PositionWessaneninEuropeastheexpertin
healthy, natural, organic foods.• Furtheralignlocaloperationsbycountry.• Furtherimprovealignmentinproductinnovation,
combined purchasing and strategic supplier selection.
Key achievements 2008• Grewkeybrandsby4.4%1, through innovations andeffectivebrandsupport.
• ImprovedoperationalperformanceofbrandedFrozenbusiness;completedtransitionofTilburgfacilityintotheFavoryConvenienceFoodGroupDeurne plant.
• Improvedpositioningandcustomerbaseofkeybrandstoincreaseourcredibilityastheexpertinhealthy, natural, organic foods.
• IntegratedHealthfoodoperationsinFranceandmerged sales and marketing teams in the UK.
• EuropeanPurchasingTeamestablishedsynergies,materializedsavingsbycombinedpurchasing and continued its strategic supplier selection.
Key objectives 2009• FurthergrowkeybrandsthroughbrandinternationalizationaswellasEuropeanand local innovations.
• FurtherimproveperformanceoftheEuropeanFrozenbusiness.
• ContinuetopositionWessaneninEuropeastheexpertinhealthy,natural,organicfoods.
• Continuetoalignlocaloperationsbycountry.• RolloutSupplyChainAuditProtocoltoinclude
our strategic suppliers.
1 Excludingcurrencyimpact2 Excludingcurrencyimpactandacquisitions
Strategic focusOur primary focus is marketing, distribution and promotion of our mainstream Health and Premium Taste brands via larger retailers and supermarkets and out-of-home. This also includes managing several third-party brands on behalf of companies without a presence in certain countries. The strategy is to drive product innovations through our European network,internationalizesomebrands,butkeeptheotherbrandslocal.Whereappropriate,wewillexportattractive product concepts to other Wessanen companies to be marketed under local brands. In 2008,weundertookanumberofprojectswithaviewtoexpandingbrandsfromonecountrytoanother.Wewillextendthisprocessduring2009.
Strong first three quarters of the year, with a more modest growth in the final quarter of 2008Full-yearrevenuefortheEuropeanBrandedoperations increased by 7.0%1. This was achieved through a combination of organic revenue growth of 2.7%1,thefull-yeareffectoftheconsolidationofthejointventurewithRaboCapitalinfrozenfoods,andtheacquisitionoftheSoGoodbusinessin the UK. The main driver was the good organic performance of our Health brands, with growth of 6.0%2.Ourfrozenbusinesswasstableandsoleagency sales declined by 10.8%, mainly due to the full-yeareffectofcontractsterminatedin2007and2008. To focus and properly align the sole agency contracts with our branded portfolio, EUR 5.6 million top-line revenue was terminated in 2008.
EBIT margin was 7.3%. The negative impact of the euro/Poundsterlingexchangerateinthefirsthalfyear was mitigated in the second half through better cost control, sourcing improvements and price increases. EBIT margin of the Health portfolio was 10.6%2, in line with the strategic target bandwith of 10-12%.IntheFrozenbusinesstheperformancewasdisappointing,mainlyduetothetransitionatFavoryConvenienceFoodGroup(FCFG),whichwasconsolidatedasofthethirdquarterof2007.
Number of employeesAs at December 31
0
300
600
900
1200
1500
20082007
1,4451,413
During 2008, Whole Earth was successfully introduced in Germany and the Netherlands.
In 2008, Distriborg launched the new Tanoshi brand, carrying a range of authentic Japanese food products.
8908_WessanenAR_UK_04_NA_EUR-Branding.indd 22 13/3/09 17:09:26

23 Europe Branded Royal Wessanen nv/Annual Report 2008
Brand growth in key segmentsAsaresultofimprovedproductofferingandmarketing support, most of our top brands in the Health segment showed single-digit and sometimes even double-digit growth over 2008.
Our branded business in the UK showed significant overall growth, largely thanks to improved weighted distribution and tactical marketing. The strategy ofincreasingweighteddistributioninthemajorsupermarkets, new business channels and the specialist health food trade was successful. Challenges during the yearincludedexchangeratefluctuations.Theseweresuccessfully countered through stringent cost control, sourcing improvements and price increases passed on to customers.
InJuly2008,theacquisitionofSoGoodenabledour UK operation to enter the non-dairy category (chilled and ambient). Loss-making at the point of acquisition,SoGoodexitedtheyeartradinginprofit.
InFrance,Bjorgperformedwellonthebackofa strong innovation pipeline of non-dairy drinks and meal components. In the health food channel, Bonneterre benefited from innovation as well as successfulpartnershipswithspecializedhealthfoodstores. Premium Taste brands continued to score double-digit growth, helped by the launch of Japanese food brand Tanoshi.
In Belgium, dedicated Zonnatura shelves were installed in many mass-market retail outlets. Gayelord Hauser’snew‘Nutricosmétiques’dietrangewasverywell received and will lead to broader distribution and higher sales in the near future. The Belgian out-of-homechannelforfrozensnacksperformedwell thanks to trade marketing initiatives and a new end-user loyalty program.
In the German mass retail business, Bionor achieved double-digit growth by launching new organic product lines. In this same channel, we successfully introduced the premium organic brand Whole Earth. Tartexsustaineditsmarketleadershippositionin
Examining the issues
Croquette,atypeoffriedfoodrollcontainingmeatragout,isapopularDutchsnackfood,frequentlysoldat street stalls and markets. Today, one of the largest manufacturersofcroquettesforhomeconsumptionis Wessanen subsidiary Beckers.
Modern Dutch consumers, like their counterparts elsewhere in Europe and North America, are increasingly health-conscious. Beckers has responded to this trend by producing a new croquetteproductthatcontains30%lesssaltandfatbut still maintains the flavor that consumers love.
Thenewcroquette,tobesoldintheout-of-homechannel from April 2009, carries the ‘Healthy Choice’
label. This shows that it complies with the criteria ofthe‘HealthyChoice’Foundation,aDutchorganizationthatisdedicatedtohelpingconsumers to find healthy options when they are shopping for food. The ‘Healthy Choice’ label is an independent guarantee that the product complies with international nutrition guidelines and that, compared with similar products, it will have less saturated fat, sugar and salt.
Aswellasthecroquette,Beckersalsosellsthreeseparate types of spring roll that meet the ‘Healthy Choice’criteria.Thecompanyplanstoexpanditsrange of healthy options in the near future.
vegetarian spreads in the Reform channel, helped by a substantial promotional program. At the same time, it continued to build up its business in organic stores, mainly through innovation and stronger consumer communication. Allos also maintained market leadership in all relevant segments by successful innovations such as a new cross-category range of products, a new line of premium fruit spreads and new cereal specialties.
In the Netherlands, all our brands in the natural/organic segment have shown a positive trend. Our Biorganic business is growing by more than 10% a year,drivenbyincreasedpenetrationandexpandeddistribution.Zonnatura,ourmajorDutchHealthbrand, achieved further growth driven, amongst others,byexpandingthepositionoftheKikkerrangeof healthy snacks for children. Late in the fourth quarter,theWholeEarthorganicbrandwaslaunchedin several Dutch retail channels, receiving positive reactions from the trade.
In the Premium Taste segment, we enhanced our position by building our category management capabilities.Thefull-yeareffectofthesole-agencycontractsterminatedin2007begantoexertapositive influence.
IntheFrozenfoodsegment,theBeckersbrandwasre-positioned, but sales development in the retail channel was slower due to severe competition. The fullintegrationoftheWessanenfrozenprivatelabelactivitiesinFCFGwascompletedin2008afterthesuccessful transition from Tilburg to Deurne.
In Italy, Bio Slym further established itself as the production and development center for Wessanen’s soy-based drinks. During 2008, Bio Slym launched a newbrand–Buonperte–fortheItalianmarket.Righi,theItalianfrozenbusiness,increaseditsdistributioninthe supermarket channel, increased its presence in the restaurantchannel,consolidateditsfish-basedappetizerrange, and successfully launched a new range of gluten-freefrozenproducts.
Healthy snack options from Beckers
In 2008, Gayelord Hauser introduced a “nutricosmétiques” line, a range of food supplements aimed at enhancing the physical aspects of the body.
In July 2008, Wessanen acquired the So Good European business, the second-largest brand in the UK dairy-alternatives market.
In the course of 2008, Whole Earth was successfully introduced in Germany and the Netherlands.
8908_WessanenAR_UK_04_NA_EUR-Branding.indd 23 13/3/09 17:09:34

24 Royal Wessanen nv/Annual Report 2008 Europe Distribution
TOL UK’s Slim4 sales forecasting and inventory system enables us to find ways to counteract rising transportation costs.
The Natuurwinkel formula: local stores with strong, clean branding and a bright, modern look selling the best health food products.
Key developments
Europe Distribution
Europe Distribution covers growing activities in three European countries. Value-added distribution services combinedwithmarketingof(exclusive)distributorbrandsandWessanen-ownedbrands,areofferedtospecializedhealth food stores in the UK, Belgium and the Netherlands.
Key figuresIn EUR millions, unless stated otherwise 2008 2007
Revenue 143.9 144.1Revenueatconstantexchangerates 152.1 –EBIT 6.5 10.2EBIT margin (as % of revenue) 4.5% 7.1%
Key objectives 2008• AccelerategrowthinTreeofLifeUKbygenerating
significant volume through new customers and gainingexclusivedistributionfornewbrands.
• Intensifycooperationwithhealthfoodtradethroughpartnerships to increase consumer spending and furtherprofessionalizestoreconcepts.
• FurtherimprovebuyingsynergiesacrossEurope,supplier partnerships and a cost-conscious approach.
• ImprovewarehousefunctioninTreeofLifeUKthrough the use of sophisticated IT systems.
Key achievements 2008• Achievedfourexclusivebrands/partnerships.• Partnershipandperformanceincreasedmainly
via the renovated ‘Natuurwinkel’ formula stores supported by Natudis.
• Improvedoperationalperformancethroughbettersourcingandcostefficiencies.
• BuiltWessanenbrandsinhealthfoodchannelandfurther leveraged Wessanen brands across Europe.
• ImprovedwarehouseefficiencyatTreeofLifeUKwiththeKardexsystem.
1 Excludingcurrencyimpact
Key objectives 2009• Encouragecustomerstomoveentirebusiness
to Tree of Life UK as a defense against recessionary pressure.
• Maintain/developexclusivebrandsand/orpartnerships.
• Improvewarehouseefficiencythroughvariousinnovations, including ‘Very Narrow Aisles’ concept.
• Managementofcostsandoverheads,specificallyreducing transport costs.
• Furtherroll-outofthe‘renovatedstores’conceptat Natudis.
Strategic focusThe European Distribution business is responsible for serving the needs of local specialist health food stores in the UK (via Tree of Life UK), Belgium and theNetherlands(viaNatudis).Itdistributesexclusivethird-party brands and Wessanen’s own portfolio of brands, and provides value-added marketing and retailing services to help stores build sales. Our credibility in this channel stems from the stores themselves, which are trusted by consumers whose purchasing decisions are mainly driven by principle.
Strong first half year, more modest growth in the second halfFull-yearrevenuefortheEuropeanDistributionoperations increased by 5.5%1. This solid performance was achieved through a combination of organic revenuegrowth,andthefulleffectofexclusivelinesandstoreremodelingefforts.EBITmarginwas4.7%1. Some gross margin gain could be recorded, while costs were tightly controlled.
Number of employeesAs of December 31
0
50
100
150
200
250
300
350
400
20082007
358363
8908_WessanenAR_UK_04_NA_EUR-Branding.indd 24 13/3/09 17:09:39

25 Europe Distribution Royal Wessanen nv/Annual Report 2008
Distribution business: continuing progress on all frontsForourEuropeandistributionoperations,2008wasanother good year, in which we maintained revenue increases despite a slowdown in the market.
Key growth factors were improved category managementandtheeffectofstoreremodelinginitiatives,inconjunctionwithautonomousgrowthandbusinessgeneratedasaresultofacquisition.Theeuro/Poundsterlingexchangeratemovementnegatively impacted the result, but less so than in the European branded business.
Natudis accelerated its growth in 2008 compared to 2007. It continued to support the Natuurwinkel store concept which aims to bring a more contemporary, professional approach to the health store trade. More than 40 Natuurwinkel stores were brought up to the newstandard,attractingnewconsumersandofferinga wide assortment of authentic organic products in amodernretailcontext.Natudisiswellpositionedto benefit from increased consumer interest in sustainable foods that also provide health benefits.
Tree of Life UK (TOL UK) achieved solid revenue growth and profitability during a year in which the British health food marketplace showed a 5% decline.
Thecompany’sexclusivecontractstrategyenhancedits position as the leading wholesaler to the UK health food trade and it continues to develop its status as thekeyUKsuppliertoWholeFoodsMarkets,theUSretailer which opened a 7,500m2 natural/organic superstore in London in 2007.
With the implementation of new systems and an even broader product range, TOL UK has maintained itspositionasthemostefficientoperatorofnatural/organic warehousing in the UK. Going forward, the company will continue to focus on reducing overhead costs, particularly in the area of transportation.
As in previous years, we have focused on improving customer service levels while keeping the inventory and logistics costs under control.
Key areas of attention were the continuing roll-out of the Slim4 sales forecasting and inventory system, enhancing our supply chain management capability and finding ways to counteract rising transportation costs.
In2008,wecontinuedtofocusonmajorefficiencyimprovementandcapacityexpansionprojectswithinour warehouse in the UK. The steps taken will enable us to support anticipated business growth in a sustainable way.
The European Purchasing team, created to support our European Strategic Development and Category Innovation teams, developed a specific audit protocol to monitor our business principles over and above the standardrequiredaccreditations.Theteamcontinuedto leverage potential synergies by intensifying our
centralizedsourcinginitiatives,buildingsupplierpartnerships to drive cost reduction, and delivering expertiseinproductinnovation.
Wecontinuedoureffortstokeepourtransportationcosts under control. The use of standard ‘transportation scans’ enables us to identify potentialefficiencyimprovements.Goingforward,we will continue to closely monitor transport cost developments, particularly in relation to the accuracy and timeliness of our delivery services.
Examining the issues
Healthy growth at Natuurwinkel
Natuurwinkel, the Dutch health food franchise ownedbyNatudis,enjoyedoutstandinggrowthin 2008. At the start of the year, the chain had 40 storeswhichhadallbeen‘refreshed’–convertedto the new Natuurwinkel signage, graphics and layout; by the end of the year, a further 12 stores hadbeenaddedtothechainand‘refreshed’–bringing the total to 52.
The Natuurwinkel formula is simple but highly effective:thebestnaturalandorganicfoodproducts sold in local stores with strong, clean branding and a bright, modern look.
Natuurwinkel is winning new friends every time another store opens. Analysis shows that existingcustomersarespendingmore,andnewcustomersarevisitingthestoresmorefrequently.The overall result is double-digit growth for the whole chain over the year.
The secret of its success is achieving a balance between an attractive, friendly sales environment and a professional approach to retailing. The visual design is warm and welcoming, and the staffarehelpfulandfriendly.Graphicspromotethebenefitsofgoodqualitynaturalwholefoodsand the principles of sustainability. The concept is underpinned by good professional retailing, with carefully planned assortments, well thought-out displays and good stock control.
“We’re trying to create a business based on mutualbenefit,”explainsNatudisCEOXanderMeijer.“Wesupportthefranchiseeswithourprofessional skills, so that they can build good relationships with their customers. In the final analysis, we’re all dedicated to the same thing: authentichigh-qualitynaturalfood.It’sawin-winsituation, and we’re aiming to keep up the good work in 2009.”
8908_WessanenAR_UK_04_NA_EUR-Branding.indd 25 13/3/09 17:09:39

26 Royal Wessanen nv/Annual Report 2008 Sustainability
Our various sustainability challenges basically cover four themes: product and process, planet, people and profit.
At ABC, the Little Hugs bottles have become much more environmentally friendly since a new technology greatly reduced the use of electricity, fuel and plastics.
Key developments
SustainabilityCaring for our products and the environment
To reach our business objectives without compromising our commitment to good corporate citizenship, we must achieve a fair balance between the interests of all our stakeholders.
We have set sustainability as one of our core business principles, alongside authenticity and transparency. Our objective is to integrate sustainability into every aspect of the business, from developing and manufacturing our products to the distribution to our customers.
Managing sustainabilityEvery year, Wessanen’s Sustainability Board, consisting of seven expert members, reviews, sets and communicates Wessanen’s key sustainability targets. Deployment of these objectives is dependent on their scope: local targets are set by the local Management Teams and global targets are addressed through both the Balanced Scorecard and the functional teams (Quality, HRM or Supply Chain). At a local level, trend analysis and benchmark-setting is undertaken by individual subsidiaries, thereby enabling the development of action plans per location.
Please refer for our sustainability policy and our sustainability strategy to www.wessanen.com/sustainability. For full details see our 2008 Sustainability Report, which will be published in May 2009.
Product and processKey objectives set in 2008• Integratecriteriaforsustainabilityintothelead
buyers’ and New Product Development processes by the end of 2008.
• Processexcellence:90%oftheoperatingcompanies whose operations are included in the Sustainability Report will receive a managerial audit in 2008.
• Authenticity:measurein2008thepercentage of branded SKUs whose key ingredients can be accurately traced back to country level.
Integrating sustainability criteria into our processesIn2008,weredesignedtheleadbuyer’sprocessand translated our business principles, authenticity, transparency and sustainability, into concrete criteria for suppliers and purchasers. This resulted in a new Supply Chain Audit Protocol. By the end of 2011 we aimtohave80%ofournaturalandorganicproductportfolio audited by a third party. As a next step, we need to focus on integrating sustainability criteria and targets into our New Product Development processes.
Whole Earth is offering more natural, healthier and organic food, and is now also available for Dutch and German consumers.
Product and process
Planet
Profit People
8908_WessanenAR_UK_05_Sustainability.indd 26 13/3/09 17:10:56

27 Sustainability Royal Wessanen nv/Annual Report 2008
ProfitKey objectives set in 2008• In2008,weaimtobeincludedinmoresustainable
investment funds, by meeting the criteria of European investors who look to invest in companies with a commitment to achieve high sustainability performances.
Our sustainability data enables investors with a specific interest in sustainability to rank our performance against our competitors, industry normsandourownpreviousperformance.In2008,we met the criteria of several European investors who look to invest in companies with a commitment to achieve high sustainability performances.
Reducing the CO2 footprint
At Wessanen, we are dedicated to taking care of our planet. Our objective is to make our supply chain as sustainable as possible, from field to table.
One of our key responsibilities is to minimize our CO2 footprint. Within our supply chain we consume energy to manufacture our products and deliver these to our customers. Naturally, we continuously seek ways to limit our impact on the environment.
Recently, our North American distribution business Tree of Life implemented a fuel efficiency program to decrease its CO2 consumption.
Since mid-2007, all trucks have on-board computers that track and trace driving behavior, such as long periods of idling.
Chris Sieburg, VP Transportation Tree of Life, is very satisfied with the results: “We now have a system that ensures that our fleet is as fuel efficient as possible. Over the past year, fuel efficiencyhasincreasedby3%andidlingtimedecreasedby13%.”
Examining the issuesProcess excellence99%ofouremployeesnowworkinanISO9001certifiedorganization,and98%workinanISO14001certified environment. All our senior managers are trained in executing managerial audits. Audit teams, composed of senior managers of different nationalities and disciplines, visit each other’s organizations and carry out audits, focusing on target-setting and deployment, sustainability, continuousimprovement,etc.In2008,70%oftheplanned managerial audits were carried out, the other audits have been postponed to 2009.
Measuring product authenticityWe have started measuring the percentage of our branded SKUs of which the top three ingredients can be traced back to country level, thus ensuring transparency of origin. Depending on the type of subsidiary,60-100%ofourbrandedSKUscouldbe traced back accurately.
PlanetKey objectives set in 2008• Reducecoolingagentconsumptionby50%by
the end of 2008 (index 2007).• ReduceOzoneDepletingPotentialby10%from
2006 to 2012 (index 2006).• ReduceGlobalWarmingEmissionsby20%from2005to2012(index2005).
• ReviewthefeasibilityofreportingtheCO2 footprint quarterly by operating company in 2009.
• Investigatein2008thefeasibilityofdefiningameasurable objective for waste and ratio between packaging and product.
Reducing our impact on the environmentOur CO2 footprint is an important indicator for our environmental performance, since it is relevant to each of our business activities. Cooling agents, fuel andelectricityarethemaincontributors.In2008, we booked excellent results on the reduction of cooling agents; both the consumption and the ozone-depleting potential were significantly reduced (by60%and20%,respectively).Throughvariousinitiatives we have also decreased global warming emissions at a number of locations, but since we broadened our scope to include new locations in 2008, the absolute figure remained at the same level. Wearecontinuouslyworkingtomeetthe20%reduction target by 2012.
To gain a better insight into the trends during the year, we have decided to report on Wessanen’s global CO2 footprint twice a year as of 2009.
Defining an objective for waste ratio between packaging and productDue to the current trend towards smaller portions and safety packaging, waste ratio between packaging and product is a major challenge. Given the diverse range of our product portfolio, we did not yet succeed in defining a Company-wide objective during 2008.
8908_WessanenAR_UK_05_Sustainability.indd 27 13/3/09 17:10:58

Executives
Board of directors
Managers
Associates
0% 20% 40% 60% 80% 100%
64% 36%
69% 31%
81% 19%
88% 12%
28 Royal Wessanen nv/Annual Report 2008 Sustainability
SustainabilityCaring for our people
Human resource management at Wessanen is shaped both centrally and locally. We are active in many countries, each with their own laws and culture. Within the parameters and general principles set by the Group, individual operating companies pursue their own human resources policy, tailored to the local situation.
The overall focus of our human resources strategy is to develop and maintain a highly motivated and skilled executive management team, underpinned by a competitive performance-based remuneration policy, in which individual managers can fulfill their career potential.
Furthermore, the retention of experienced and talented staff is both a priority and a strategic issue.
The centrally-driven general principles are focused on quality and continuity. This is reflected in the dedicated management development policy that offers employees scope for personal development. There is also a uniform remuneration policy for the management of all operating companies. Moreover, bonus systems for senior executives are drawn up centrally and are based not only on the financial targets of the operating company, but also on personal performance and the results of Wessanen as a whole.
Morethan50%ofouremployeeshave participated in the Employee Engagement Survey, a strong increase compared to 2007.
In2008,aWessanen-wideTeamworkIncentiveProgramwasintroduced, aimed at stimulating and rewarding good project management and teamwork.
Tree of Life North America introduced the Safety Cup Challenge, a new safety incentive program for the US-based warehouse associates.
Key developments
PeopleKey objectives set in 2008Increasetheparticipationofemployeesinthe2008EngagementSurveyby5%comparedto2007.IncreasethepercentageofemployeesthatsignedtheCompanyCodeto100%attheendof2008.Raise average number of training hours to 18 per FTE in 2008.Reduce lost time injury frequency and severity rate by10%bytheendof2008,comparedto2007.Improveourperformanceforemployeeturnoverbydecreasing the number of people that left on their owninitiativeto10%byendof2008.
Employee Engagement SurveyWessanen attaches great importance to being a good employer. To quantify our performance, we hold employee engagement surveys which provide clear upward feedback. The survey outcome helps us identify opportunities for improving our organization, culture and people management. All managers are asked to present the outcome to all employees and to set improvement objectives. Corporate HR assesses the improvement plans and reports on progress made to the Executive Board. Efforts from local HR departments resulted in a strong increase of the participation rate for the EmployeeEngagementSurvey(from42%in2007to52%in2008),assuchexceedingourtargetfor2008.
Diversity of employees%ofmen/women,perlevel
Men Women
8908_WessanenAR_UK_05_Sustainability.indd 28 13/3/09 17:11:05

29 Sustainability Royal Wessanen nv/Annual Report 2008
Business ethicsWe are a responsible employer. We adhere to a Code of Conduct and operate a ‘Whistleblower’ scheme, details of which are published on the Company website.
Inallcountrieswherethisisalegalrequirement,works councils are active in our operating companies. Trade unions are consulted on important issues such as reorganizations, working conditions and health and safety. Wessanen has a European Works Council, which discusses not only the developments and outlook for the Company, but also strategic choices and specific plans.
Employee developmentWessanen’s competency model defines behavior expectations for all associates. The model starts from our ambitions and values, and translates them into behavior conventions and skill sets. These competencies and functional skills also serve as the basis for selecting and developing potential candidates for promotion, although experience and track record are equally important criteria.
We operate a variety of training initiatives to support the development of our staff. These include enhancing employee engagement and development, functional training for operations and sales, leadership training, new hire orientation training etc. We increased the average number of training hours to 17 per FTE in 2008 (2007: 16 per FTE), thereby nearly meeting our target. Furthermore, as a result of training in respect of a safer and healthier workplace, we have reduced the lost time injury frequency and severity rate by respectively 14%and8%ascomparedto2007.
Leadership developmentEvery year our top 100 senior managers conduct an ‘upward appraisal’ study to receive feedback from their direct reports on their performance against the leadership competencies. The feedback is translated into individual and team improvement targets which
are implemented via personal and team development objectives and Balanced Scorecard performance measurement schemes.
Management Development ReviewOur annual Management Development Review is a key management process, personally led by our Executive Board members, that links individual achievement and development to short-term and long-term business challenges. The insights we gain into the strengths and weaknesses of our senior management, our talent pool, and the organization as a whole prompts the development of action plans to ensure sufficient talent for our future needs, and establish succession plans up to the most senior levels in the organization.
On an individual level, each senior manager receives feedback from the process and the outcome. A summary of the Management Development Review is also discussed with the Selection, Appointment and Remuneration Committee of the Supervisory Board.
Performance managementThe Wessanen Performance Commitment Cycle is nowbeingdeployedbynearly95%ofallemployees.
The Employee Performance Commitment (EPC) is an important element in achieving the goals the Executive Board has set for Wessanen, by equipping managers and employees with a methodology for managing and delivering outstanding individual performance.
The EPC process is a continuous cycle which brings together the following key elements:
• PerformanceObjectiveSettingandReview.• Competency&FunctionalSkillsAssessment.• PersonalDevelopmentPlanning.• OverallYearEndPerformanceRating.
The EPC supports other key processes within Wessanen, including career planning in the Management Development Reviews, identification of high potential managers, and determination of variable pay, such as the Wessanen Short Term IncentivePlan(STIP)payouts.
Our workforceAs a responsible employer, we prefer to maintain a stable, contented and committed workforce. Therefore, employee turnover is a key focus area. Our 2008 objective was to improve the employee turnover rate by decreasing the number of people wholeaveontheirowninitiativeby10%bytheendof 2008. Although we decreased this percentage from21%in2007to16%in2008,wefailedtomeetthis challenging target.
For more detailed information on HR objectives and key developments within Wessanen, please refer to the 2008 Sustainability Report, which will be published in May 2009.
Employees per countryin%
TheNetherlands 11.0%Belgium 3.0%France 9.5%UK 3.6%Germany 6.6%Italy 1.0%USandCanada 65.3%
Number of employees of which in the North InFTE,asatDecember31 Europe Netherlands America Total2008*Total Group 1,996 628 3,765 5,761North America Branded – – 561 561North America Distribution – – 3,204 3,204Europe Branded 1,445 412 – 1,445Europe Distribution 358 166 – 358Non-allocated 193 50 – 193
2007*Total Group 1,976 626 3,786 5,762North America Branded – – 615 615North America Distribution – – 3,171 3,171EuropeBranded 1,413 399 – 1,413Europe Distribution 363 174 – 363Non-allocated 200 53 – 200
* Alsoincludingcorporatestaff(December31,2008:50;December31,2007:53)
8908_WessanenAR_UK_05_Sustainability.indd 29 13/3/09 17:11:06

30 Royal Wessanen nv/Annual Report 2008 Financing
Financing
Wessanen’s financial strategy is aimed at securing long-term financing of the Group, on an investment grade basis, in order to achieve our strategic targets in respect of the acceleration of our growth and alignment of our international portfolio.
Wessanen’s financing strategy is built around the following objectives:
• appropriateaccesstodebtandequitymarkets;• sufficientcapacitytofundadd-onacquisitions;• optimalweightedaveragecostofcapital;and• mitigatingfinancialrisks.
The capital structure of the Company balances these objectives in order to meet the Company’s strategic and day-to-day needs.
Liquidity and fundingTheGroup’sapproachtomanagingliquidityistoensure, as far as possible, that it will always have sufficientliquiditytomeetitsfinancialobligationswhen due, without incurring unacceptable losses or riskingdamagetotheGroup’sreputation.Wessanenmanagesitsliquiditybymonitoringandforecastingcash flows of its operating companies, debt servicing requirements,dividendstoshareholders,andother obligations.
The Group maintains ongoing access to the debt marketsthroughitscommittedEUR250million,multi-currency credit facility which matures in February 2012. At year end 2008, it had drawn approximatelyUSD136millionandEUR128millionfromthisfacility(2007:USD136millionand EUR85millionrespectively).TheGroupcanincreasethefacilityuptoEUR400millionsubjecttoconsentof the lenders. The Group can also extend the final maturity date for a further period of one or two years, subject to agreement of the lenders.
The facility has various general and financial covenants in place which are customary for its type, amountandtenor.Underthefinancialcovenantsofthefacility,atanyfinancialquarter,theconsolidatedtotalnetdebtmaynotexceed3.5timesconsolidatedEBITDAE1.Inaddition,consolidatedEBITDAEisnotallowedtobelessthan4timesconsolidatednetinterest payable. Consolidated net debt may exceed 3.0timesconsolidatedEBITDAEaslongas(1)thisratiodoesnotexceed3.0formorethantwo
consecutivequarters,and(2)therehavenotbeenmorethantwoperiodsoftwoconsecutivequarterseachwheretotalnetdebtexceeded3.0timesconsolidatedEBITDAE.During2008,theGroupdid not breach these covenants.
TheGrouphasinexcessofEUR50millionofuncommittedcreditfacilitieswithvariousbanksthroughout the Group. At year end 2008, we did notdrawfromthesefacilities.Inaddition,FavoryConvenienceFoodGrouphasaEUR9.5millioncreditfacility,ofwhichEUR8.9millionwasdrawnatyearend(2007:7.7million).ThetermsoftheEUR9.5millioncredit facility are currently being renegotiated, as Favory Convenience Food Group did not meet the redemption provision under the financing arrangement.
USdollardenominatednetdebtconsistsofUSdollarloans drawn under the syndicated credit facility and euroloansswappedtoUSdollarthroughforeignexchangederivatives.Duringtheyear,wedecidedtoreducetheexposuretoUSdollardenominatednet debt, in order to align the currency mix of our net debt with that of our operating earnings (as measuredinEBITDAE).Basedonthecurrencymixatyear end 2008, a strengthening of the euro of 10% to theUSdollarandothercurrencieswilldecreaseournetdebtbyEUR7.7million(2007:EUR17.7million).
Forfurtherinformationonourfinancialrisksseepage33intheRiskManagementandInternalControl section.
Net debtDuring2008,netdebtincreasedbyEUR71.6millionandwasEUR214.6millionatyearend2008.NetcashinflowsfromoperatingactivitiesofEUR34.5millionwereoffsetbynetpaymentsofEUR41.9millionarising from investments in property, plant and equipmentandtheacquisitionsofbusinesses.DividendpaymentsamountedtoEUR40.6million.ThestrengtheningoftheUSdollartotheeuro,andthe impact of other currencies to the euro, resulted intoanetdebtincreaseofEUR21.0millionduringthe year.
1 EarningsBeforeInterest,Tax,Depreciation,AmortizationandExceptionalitemsduringa12-monthperiodendingonthe lastdayofeachquarter
8908_WessanenAR_UK_06_Financing.indd 30 13/3/09 17:12:07

31 Risk Management and Internal Control Royal Wessanen nv/Annual Report 2008
RiskManagementandInternalControl
Wessanen’sRiskManagementandInternalControl frameworkisanintegratedpartofourbusinessmanagement and is designed to protect the Company as much as possible against any undesirable effects resulting from our pursuance of the achievement of overall corporate objectives.
Risk management and control systemWessanen’smanagementacknowledgesthatmanagingrisksisanessentialelementofdoingbusiness.AcceptingacertainlevelofriskisevenaprerequisiteofachievingtheCompany’soperationalandfinancialobjectives.TheWessanenRiskManagementandInternalControlsystembasedontheCOSOERM1framework,aimstoensure,withareasonablelevelofassurance,thattheriskstowhichour business is exposed are identified and effectively managed. The system is designed to enable the ExecutiveBoardtoachievethestrategicobjectiveswithinamanagedriskprofile.
RiskprofileandriskresponsibilitiesWessanen’sriskprofileisdeterminedbythelinesofbusiness(DistributionandBranded)andtheregions(EuropeandNorthAmerica)inwhichtheCompanyoperates. Wessanen’s activities are exposed to varyingtypesanddegreesofrisk,someofwhichmight have a material impact on the results of a specific operating company if not managed effectively.Theimpactofsuchrisksmaynothavea material impact on Wessanen as a whole.
TheExecutiveBoardisresponsibleforsettingriskmanagementpoliciesandstrategies.Seniormanagementofsubsidiariesconductsriskassessments on which to base action plans designed to ensure that they remain within the riskmanagementpoliciesandstrategies.DuringQuarterlyBusinessReviews,seniormanagementofsubsidiariesreporttotheExecutiveBoardonrecentriskdevelopmentsandonprogressoftheactionplans.ThisprocessenablestheExecutiveBoardtomonitorandmanagetheriskprofileandriskappetite.
TheExecutiveBoardreportsonriskmanagementandcontrol activities and provides the Audit Committee andtheSupervisoryBoardwithanoverviewoftheentireriskmanagementandinternalcontrolprocess,including significant changes and improvements.
InternalgovernancestructureToenabletheExecutiveBoardandseniormanagementtodirectandcontroltheorganization,Wessanen’s internal governance structure is based onaperformanceframeworkthatconsistsofstrategic and annual business plans. The business plansapprovedbytheExecutiveBoardincludeclearobjectives for operational and financial performance. The actual performance of the Company is set off against these objectives and discussed by local managementwiththeExecutiveBoardduringMonthlyBusinessReviewmeetings(mainlyfinancialperformance)andQuarterlyBusinessReviewmeetings(operationalandfinancialperformance).
TheCompany-wideFrameworkofInternalControl(FIC)andDelegationofAuthorities(including,forexample,authorizationsforcapitalexpenditureandcommitments,aswellasforkeymanagementappointments)areothercomponentsofourinternalgovernancestructure.TheFICprovidesaclearoverview of the control activities that are used to monitorthemostimportantprocesslevelrisksofthe main business functions. The purpose of these controlactivitiesistoensureeffectiveandefficientoperations, reliable financial reporting and compliancewithlawsandregulations.In2008,wefurtherspecifiedtheFICbyaddingcontrolattributestofacilitatethesubsidiariesintheirControlSelf-Assessments.Foridentifiedcontrolweaknesses,anactionplanisputinplacebymanagement.Eachyear,compliancewiththeframeworkisreviewedbytheInternalAuditDepartment.
Another pillar of our internal governance structure is theCorporateManual.Itprovidesforprocedurestoexecute and control primary business processes such as ‘procure-to-pay’, production, warehousing and distribution,and‘order-to-cash’processes.Supportand management processes are also incorporated in ourCorporateManual.Tomonitordeploymentoftheprocesses,managerialauditsareperformed.Intheseaudits, peer management teams audit operating companiesonarotatingbasis.Moreover,ISOauditsare executed on these processes.
1 CommitteeofSponsoringOrganizationsoftheTreadwayCommissionEnterpriseRiskManagement–IntegratedFramework.Seewww.coso.org/guidance.htm
8908_WessanenAR_UK_06_Financing.indd 31 13/3/09 17:12:07
32 Royal Wessanen nv/Annual Report 2008 Risk Management and Internal Control
These internal and external audits are aimed to provide additional assurance to management and to create a common ground for sharing and improving our processes and results.
For the issuance of their report, the external auditors performs audit activities focusing on a true and fair view of the financial reporting and whether these are inaccordancewithInternationalFinancialReportingStandards(IFRS)asadoptedbytheEuropeanUnion.Where possible, the external auditors rely on the activitiesoftheInternalAuditDepartment.Suchactivities have been planned in close cooperation and address the effectiveness of the internal control andriskmanagementsystem.
Wessanenhasrequestedthemanagementofeachoperating company to sign an internal Letter of Representation(LOR)totheExecutiveBoard,assigning responsibility for the design and execution of financial procedures and for identification of financialreportingriskstotheManagingDirectorandFinancialDirectorofeachoperatingcompany.This control procedure, amongst others, specifically addressestheresponsibilitieswithintheriskmanagement process.
TheExecutiveBoardbelievesthatwiththesubstantiationprovidedabove,ithastakenadequatestepstoimplementanappropriateriskmanagementand control system.
Main risksOn the explicit understanding that this is not anexhaustiveoverview,Wessanen’smainrisksare described below. The overview includes the mitigating actions planned and implemented by managementandwherepossiblethequantificationofthepotentialimpact.Themainriskshavebeendiscussed with the Audit Committee and the SupervisoryBoard.
StrategicrisksRisksarisingfromtheuncertaincurrenteconomicsituationinourNorthAmericanandEuropeanmarketscouldputpressureontherealizationofourobjectives.Suchrisksrelatetoacquisition,
capital expenditure and divestment activities and the availability, on economically sound grounds, ofattractiveopportunities.StrategicprocessesarecloselymonitoredbytheExecutiveBoardsupportedbycorporatedepartments.Decisionsare made based on a set of defined financial and strategic criteria that have been agreed with the SupervisoryBoard.
MarketandoperationalrisksOtherrisksthatemergefromtheeconomicsituation,such as changes in competition based on pricing, declining customer demand for organic products, volatility of cost prices (fuel, raw materials, and packagingmaterials)andinsolvencyofmajorcustomers or major suppliers are identified.
To mitigate the potential impact, stricter credit and cost control, sourcing improvements and price increases should enable the Company to achieve its objectives.Moreover,aconsistentfocusonproductinnovation, alternative raw materials and process efficiencyalsosoftensthepotentialimpact.
InnovationisavitalelementinWessanen’sbusinessplan.InlinewiththeNewProductDevelopment(NPD)process,manyinnovationinitiativesareundertaken,bothatlocalandatcorporatelevel.ThevolumeofNPDinitiativescouldleadtoalackoffocus and therefore ineffective allocation of resources. TomanagetheNPDprocess,clearguidelines,responsibilities and objectives have been set.
Wessanen has defined a set of information and communicationtechnology(ICT)policiesthatmustbe rigorously followed by all subsidiaries. These policies are designed to ensure the confidentiality, integrity and availability of electronic information. As Wessanen’s operations rely heavily on information systems, audits are performed to ensure adherence to these policies. With the gradual implementation ofanewcentralEnterpriseResourcePlanningsystemforourEuropeanentities,thevulnerabilityoftheICTsystems will be reduced in the medium term, and the efficiencyofcontrollingtheICTenvironmentandthereby supported business processes is increased.
RiskManagementandInternalControlcontinued
8908_WessanenAR_UK_06_Financing.indd 32 13/3/09 17:12:07

33 Risk Management and Internal Control Royal Wessanen nv/Annual Report 2008
Financial risksCurrencyriskWessanen conducts business in foreign currencies but publishes its financial statements, and measures its performance, in euros. These foreign currencies mainlyincludetheUSdollar,theCanadiandollarandthePoundsterling.BecauseoftheGroup’sinternationalpresence,itissubjecttorisksfromchanges in foreign currency values that could affect earnings and capital.
The Group has a foreign exchange policy that mitigates the impact of foreign currencies to functional currencies, and is based on the following principles:
• Transactionsarisingfromoperationalandfinancing activities, in currencies other than the functional currency, are hedged in order to mitigate income statement volatility. All operating companies conduct their hedging transactions internallythroughthecentralizedcorporatetreasury department.
• Transactionresultsoncapitalinvestedinforeignsubsidiaries are recorded directly in retained earnings. Capital invested in, and net income from foreign subsidiaries are not hedged to the euro.
InterestrateriskThe Group aims to contain income statement volatilityand,atthesametime,minimizeitsfinancingcosts. This is primarily achieved through borrowing from its multi-currency syndicated credit facility and modifying the interest rate exposure of debt and cash positions through the use of interest rate swaps. TomitigateourUSdollar-relatedinterestraterisk,theGroupenteredintoaten-yearInterestRateSwap(IRS)agreementwhichfixedtherateofUSD100millionfundinguntil2015.Allotherfinancingiscurrently at floating rates.
A change of 100 basis points in euro money marketinterestratesatthereportingdatewouldhaveincreased(decreased)equityandprofitbyEUR1.5million(beforeincometax),assumingallothervariables(mainlyforeigncurrencyrates)remain constant.
CommodityriskTheGroupactivelymonitorscommodityrisk,andtakesstepstoreducecommodityriskparticularlyduring periods when underlying commodity prices are volatile and may lead to undesired volatility in netincome.Duringthethirdquarterof2008,theGroup entered into a swap agreement to hedge theestimateddieselfuelcostofTreeofLifeNorthAmerica for the period commencing October 1, 2008, toJune30,2009,effectivelyfixinginputcostsatthethen prevailing fuel price.
LiquidityriskLiquidityriskistheriskthatWessanenwillnotbeable to meet its financial obligations as they fall due. A material and sustained shortfall in our cash flow could undermine overall investor confidence and could restrict the Group’s ability to raise funds. Operational cash flow provides the funds to service our financing obligations. For further information onliquiditymanagement,pleaseseepage30intheFinancing section.
CreditriskCreditriskistheriskoffinanciallosstoWessanenifacustomer or any other counterparty to a transaction fails to meet its contractual obligations, and arises principallyfromWessanen’scashatbanks,receivables from customers, investment securities and foreign exchange derivatives. The Group’s activities involve developing, sourcing, producing,marketinganddistributionoffoodproducts primarily in partnership with retail customers.Asaconsequence,ourcreditriskisconcentratedinthesupermarketchannel.Astheexposuretocreditriskisinfluencedmainlybytheindividual characteristics of each customer, the spread in Wessanen’s customer base reduces the impactofthecreditrisk.
The Group’s operating companies apply a credit policyunderwhicheachnewcustomerisanalyzedindividually for creditworthiness before the operating company’s standard payment and delivery terms and conditions are offered. Customers that fail tomeetcreditriskrequirements,maytransactonlyon a prepayment basis. The credit position of each customerisfrequentlymeasuredusingbenchmarksand external rating information.
TheGroupmanagescreditriskonfinancialinstitutions by applying limits. The creditworthiness of a financial institution is assessed by their credit rating,whichshouldbeaminimumofA(Standard&Poor’s).
TaxriskPossiblecorporateincometaxrateadjustmentsin the countries where Wessanen has recorded a DeferredTaxAsset(DTA)mayhaveanimpactontherecordedDTA.Basedonthepositionsatyearend 2008, a decrease by five percentage points of the corporate income tax rate in the countries whereWessanenrecordeditsmainDTAs(US,theNetherlandsandFrance)wouldresultinanegativeimpactonourequityandprofitofEUR10millionintheUS,ofEUR4millionintheNetherlandsandofEUR1millioninFrance.Taxrisksaremonitoredandmanagedbycentralizedoversightovertaxstrategies and tax reporting by our tax department, supported by external tax specialists.
8908_WessanenAR_UK_06_Financing.indd 33 13/3/09 17:12:07

34 Royal Wessanen nv/Annual Report 2008 Risk Management and Internal Control
Financial reporting risks and Compliance risksAsinanyothercompany,thereisariskforerrorsinourfinancialreporting.Topreventthisriskfromoccurring, Wessanen has implemented various controls, parts of which were described in the internal governance structure. Other controls, such as reporting and accounting guidelines and procedures, result and trend analysis, and internal and external audits, provide additional assurance on the fair representation of financial reporting.
Our Corporate Governance Code stipulates that staff should comply with all applicable laws and regulations, and with the Company Code. Complementary to other reporting lines, a whistle-blowing procedure and system enables staff to report, anonymously if desired, alleged irregularities of a general, operational and financial nature without jeopardizingtheirlegalstatus.During2008,wereceived a limited number of reported alleged irregularities, all of which have been responded to appropriately.
Basedonmanagementreviewsandaudits,wehaveconcludedthatenhancementsintheriskandcontrolsystemsarerequiredatthejointventureFavoryConvenience Food Group to comply with Wessanen’s riskandcontrolrequirements.Furtherprogresshasto be made in the effectiveness of controls over movement of inventory in particular. Following the appointment of new management in 2008, these enhancements should be implemented in the course of2009.Also,atasmallerassociatemanagingpartofourNorthAmericanbrandedbusiness(LibertyRichter),controlsoverworkingcapitalprocessesneed to be strengthened to meet Wessanen’s standards.OurNorthAmericanmanagementincombination with internal and external auditors will continue to monitor whether World Finer Foods makesprogresstocomplywithaccountingandcontrolstandards.Theseimprovementsintheriskmanagement and control system have been discussed with the Audit Committee and the SupervisoryBoard.
RiskManagementandInternalControlcontinued
Statement of Internal Control
Basedontheassessmentofrisksaswellasofthedesignandeffectivenessofriskmanagementactivities,discussedabove,theExecutiveBoardconcludesthattheinternalriskmanagementandcontrol systems provide reasonable assurance that our financial reporting does not contain any errors ofmaterialimportanceandthattheriskmanagementandcontrolsystemsworkedproperly in the year under review.
8908_WessanenAR_UK_06_Financing.indd 34 13/3/09 17:12:08

35 Corporate Governance Royal Wessanen nv/Annual Report 2008
Corporate GovernanceWessanen: compliant with the Code
Wessanen has been in the forefront of corporate governance initiatives.
EarlierCorporateGovernance-drivendecisionsbyshareholders include ending the administration of certificates and having our voting shares listed on NYSEEuronextAmsterdam,bothofwhichbecameeffectiveinmid-2006.Meanwhile,theTrusthandlingthe administration of certificates was discontinued.
Wessanen Corporate Governance structureThe governance structure of Wessanen is in compliance with all principles and best practices of theDutchGovernanceCode(‘theCode’).Principlesand best practice provisions are published, either internally or externally, in respect of:
• GeneralMeetingofShareholders• SupervisoryBoard• ExecutiveBoard• ExternalandInternalAudit
All relevant documentation to meet the Code and to explain Wessanen’s Corporate governance structure isavailableatourwebsite(www.wessanen.com).
Role and responsibilities of the Executive BoardTheExecutiveBoard,withstatutoryresponsibilityforthe overall conduct of the business, has currently one memberwhoisappointedbytheGeneralMeetingofShareholdersforaperiodoffouryears.IntheReportoftheExecutiveBoardonpages14to17,theExecutiveBoardexplainstheCompany’sstrategyandobjectivesassubmittedtotheSupervisoryBoardforapproval.Theproperworkingoftheinternalriskmanagementand control system is under constant review by the ExecutiveBoard.ThissystemincludestheWessanenCompany Code, a whistleblowers’ policy, a disclosure policyandafraudpolicy;allexamplesofstrengtheningthe Company’s ongoing commitment to improve transparency within Wessanen.
The Wessanen Company Code includes our mission statement, core values, business principles and guidelinesforconduct.ImplementationoftheCompany Code is reinforced through a management system which ensures that new employees are trained and well informed about its principles and itsroleinworkingpractices.
TheCompanyCodeactsasaframeworkfortakingbusiness decisions:
• MonitorsadherencetotheCompanyCode;• ProvidesemployeeswithguidanceonwhattodointheeventofCodeviolations;
• CollectsevidencethattheCompanyCodeisproperly implemented and functioning correctly.
Remuneration policyTheremunerationpackageformembersoftheExecutiveBoardisestablishedbytheSelection,Appointment and Remuneration Committee of the SupervisoryBoardandconsistsoffixedpay,withshort- and long-term incentive components. The compensationpackagesfullycomplywiththerequirementsoftheCode,withtheexceptionofsome severance arrangements. The details of the remunerationaregivenintheNotestotheannualfinancialstatementsonpage48andarealsoavailable at www.wessanen.com.
TheExecutiveBoardseekstoavoidanyconflictsofinterest.InlinewiththeCode,apersonalinvestmentpolicyisapplicabletotheCompany’sExecutiveandnon-ExecutiveDirectors.In2008,alldirectorswerefully compliant with the personal investment code.
Role and responsibilities of the Supervisory BoardTheSupervisoryBoardoverseesCompanypolicyasconductedbytheExecutiveBoardandactsasitsadvisorybody.ThemembersoftheSupervisoryBoardareappointedbytheGeneralMeetingofShareholdersforatermoffouryears.
ThemembersoftheSupervisoryBoardpossessall the expertise necessary to perform their duties properly and to operate independently of and critically towards each other, as well as the Company’s management, and all other decision-makingrelatedtotheirresponsibilities.Theremunerationofitsmembersisnotlinkedtothe Company’s financial performance.
Wessanen’sSupervisoryBoardcurrentlyhasfourmembers.AsstatedintheDutchCorporateGovernance Code, Wessanen has an Audit CommitteeandaSelection,AppointmentandRemuneration Committee.
8908_WessanenAR_UK_06_Financing.indd 35 13/3/09 17:12:08

36 Royal Wessanen nv/Annual Report 2008 Corporate Governance
Corporate Governancecontinued
Shareholders’ MeetingTheAnnualGeneralMeetingofShareholders(AGM)isheldonceayear.ShareholdersareentitledtorequesttheExecutiveBoardortheSupervisoryBoardtoadditemstotheagendaofaGeneralMeetingofShareholders.Suchrequestshavetomeetthe conditions as defined in the Company’s Articles of Association. Wessanen facilitates voting by proxy.
MembersoftheSupervisoryandExecutiveBoardareappointedbytheGeneralMeetingofShareholders.Amending the Articles of Association is subject to approvalbytheGeneralMeetingofShareholders.TheauthorityofthemembersoftheExecutiveBoardtoissuesharesortobuybacksharesissubjecttoyearlyrenewaltobegrantedbytheAGM.
Communications with the financial worldWessanen attaches great value to open and transparent communication with its investors and with the financial world in general. We are in regular contact with analysts and investors (through analysts’ meetings,roadshowsandone-on-onediscussions),as well as with the financial media, which form the main source of information for private investors. Our fair disclosure policy is designed to ensure the careful and simultaneous provision of information to all shareholderswithintheguidelinesoftheDutchAuthorityFinancialMarkets(AFM).Thedisclosurepolicy and further information on upcoming events can be found at www.wessanen.com.
Directors’ statementThe financial statements in this Annual Report give a true and fair view of our assets, liabilities and financial positionatDecember31,2008,andoftheresultofourconsolidated operations for the financial year 2008.
The management report in this Annual Report includes a fair review of the development and the performance of the businesses and the position of RoyalWessanennvandtheundertakingsincludedintheconsolidationtakenasawhole,anddescribestheprincipalrisksanduncertaintiesthatweface.
Utrecht,March4,2009
Executive BoardFransKoffrie,InterimCEO*FransEelkmanRooda,CFO*Richard Lane
* ItwillbeproposedtotheAnnualGeneralMeetingofShareholders,tobeheldonApril22,2009,toappointMr.KoffrieasChairmanoftheExecutiveBoardandtoappointMr.EelkmanRoodaasmemberoftheExecutiveBoard.
8908_WessanenAR_UK_06_Financing.indd 36 13/3/09 17:12:08

37 Message from the Supervisory Board Royal Wessanen nv/Annual Report 2008
MessagefromtheSupervisoryBoard
IntroductionItisthedutyoftheSupervisoryBoardtooverseethestrategicandorganizationalpolicy-makingoftheExecutiveBoardandthewayitmanagestheCompanyanditssubsidiaries.TheSupervisoryBoardsupportstheExecutiveBoardbyprovidingitwithadvice.Theresponsibility for performing these duties rests with theSupervisoryBoardcollectively.TheSupervisoryBoardhadsixmeetingsduring2008.Betweenthemeetings,theExecutiveBoardkepttheSupervisoryBoardinformedofresultsandbusinessdevelopmentsby way of written and telephonic updates.
TheattendanceoftheSupervisoryBoardmeetingsheldin2008was96%,onlyonemembercouldnotattendonemeetingduetoaflightcancellation.Duringthe meeting in February 2008, ahead of the publication ofthefull-year2007results,theSupervisoryBoardconvened with the external auditors. All scheduled meetingstookplaceinthepresenceoftheExecutiveBoard.Thesecombinedmeetingsare,bywayofstandard practice, followed by meetings of the SupervisoryBoardinclosedsession.
Duringtheclosedsessions,theSupervisoryBoarddiscussed the performance of the members of the ExecutiveBoard,itsownperformanceasaBoardand the performance of its individual members as well as the relationship with the individual members oftheExecutiveBoard.Whendiscussingitsownfunction,theSupervisoryBoardrevieweditsprofile,compositionandrequiredcompetencies.Theoverallconclusion of these discussions was that the current profileandcompositionoftheBoardcontinuestoprovide a well-balanced platform for supervising and supporting the Company.
TheSupervisoryBoarddiscussedawiderangeof subjects during its meetings in 2008, including financial results, share price, business developments, budgets, long-term planning, remuneration and strategy.TheSupervisoryBoardalsodeliberatedonvariousacquisitionopportunities,thedividendpolicy,riskandriskmanagementaswellassustainability.Inparticular,theBoardwasconcernedabout the deterioration of the share price over the lasttwoyears.Thecrisisinthefinancialmarketswasreviewed in the October meeting, as well as the potentialconsequencesfortheCompanyintheshortand the longer term.
TheSupervisoryBoardvaluesthehighstandardsof Corporate Governance which the Company has maintained over the last five years. Wessanen is requiredtostateinitsAnnualReportwhetheritcomplies with the principles and the best practice provisionsoftheDutchCorporateGovernanceCodeand, in case of non-compliance, state the reasons for this.TheSupervisoryBoardattachesgreatvaluetoCorporate Governance and will ensure that the Companywillcontinuetocomply.Incaseofanydeviations from the Code a full explanation will be provided.
Shareholders’ meetingsAllSupervisoryBoardmembersattendedtheAnnualGeneralMeetingofShareholdersonApril16,2008,during which the following agenda items were discussed:theExecutiveBoard’sReporton2007performance, the 2007 financial statements, the dividend to shareholders, the appointment of the externalauditors,theauthorizationgrantedtotheExecutiveBoardtoissuesharesandtheauthorizationtotheExecutiveBoardtobuybackshares.
AttheAnnualGeneralMeetingofShareholders(AGM),fullaccountofthedevelopmentofthebusinessisgivenbytheChiefExecutiveOfficer.ShareholdersareencouragedtoattendtheAGMandtoaskquestions.Thequestion-and-answersession forms an important part of the meeting. Inordertosafeguardanefficientandorderlycourseofthemeeting,therestrictiononspeakingtimeasrecommended by the Frijns Committee has been adopted and is put into practice. The external auditors of the Company are invited to attend the shareholder’s meeting at which they are entitled toanswerquestionsfromshareholders.
Independent governanceTheSupervisoryBoardisgovernedbyasetofformal standing rules and a profile. Full details are available at www.wessanen.com. One member of theSupervisoryBoardhasholdingsintheCompanyof30,000shares.ThispositionwasdulyreportedtotheDutchAuthorityforFinancialMarkets(AFM).Apartfromthis,membersoftheSupervisoryBoarddo not own any options or shares in the Company, and they shall not be granted performance shares. TheremunerationisnotlinkedinanywaytotheCompany’sresults.NoneofthemembersoftheSupervisoryBoardhasbeenemployedbythe
Members of the Supervisory Board
D.I. Jager (male,Americannationality,1943)FormerChairmanandCEOofProcter&GambleandSupervisoryDirectorofChiquitaBrandsInternational,Inc.,KoninklijkeKPNN.V.andPolycomInc.;appointedtotheSupervisoryBoardin2005;termendingin2009(eligibleforreappointment).
L.M. de Kool (male,Dutchnationality,1952)ExecutiveVicePresidentandChiefFinancial&AdministrativeOfficerofSaraLeeCorporation;appointedtotheSupervisoryBoardin2005;termendingin2009(eligibleforreappointment).
J.G.A.J. Hautvast (male,Dutchnationality,1938)FormerVicePresidentHealthCounciloftheNetherlands,formerGeneral-DirectorWageningenCentreforFoodServices.ChairmanAdvisoryBoardRiskAssessmentNetherlandsFoodSciencesAuthority,memberofFrieslandFood’sInternationalNutritionAdvisoryBoard;appointedtotheSupervisoryBoardin2004;termendingin2012(eligibleforreappointment).
M.C. Lombard (female,Frenchnationality,1958)MemberoftheExecutiveBoardofTNTB.V.andGroupManagingDirectorofTNTExpress;appointedtotheSupervisoryBoardin2006;willstepdownatAGMonApril22,2009.
8908_WessanenAR_UK_06_Financing.indd 37 13/3/09 17:12:08

38 Royal Wessanen nv/Annual Report 2008 Message from the Supervisory Board
MessagefromtheSupervisoryBoardcontinued
Company during the past five years. And none of its members supplies any form of consultancy services to the Company, holds any form of so-called ‘interlockingdirectorship’,orisinthepositionofbeinga‘dominantshareholder’.Notransactionswitha conflict of interest occurred in 2008. All members of theSupervisoryBoardareincompliancewiththeinvestment policy. With these regulations in place, the Company complies with the ‘best practice’ policy regardingtheindependenceoftheSupervisoryBoard.
CommitteesAsstatedintheDutchCorporateGovernanceCode,WessanenhasanAuditCommitteeandaSelection,Appointments and Remuneration Committee. The charters of both committees can be found on www.wessanen.com.
Audit CommitteeTheAuditCommitteeconsistedin2008ofMr.TheodeKool(Chairman)andMr.FransKoffrie.Themeetings of the Audit Committee are attended by invitationbytheChiefExecutiveOfficer,theChiefFinancialOfficer,theVicePresidentofInternalAuditand the external auditors. All members of the SupervisoryBoardhaveaccesstothemeetingsoftheAudit Committee. The minutes of the meetings are madeavailabletothefullBoard.TheVicePresidentInternalAuditaswellastheexternalauditorshaveadirect access to the Audit Committee.
TheAuditCommitteesupportstheSupervisoryBoardinitsresponsibilitiesasregardstheintegrityofWessanen’sfinancialstatements,riskmanagement,internal control issues and compliance with legal and regulatoryrequirements.
The Audit Committee had five meetings in 2008, ofwhichfourmeetingstookplaceaheadofthepublicationofthequarterlyresults.
After all combined meetings, closed meetings of the AuditCommitteetookplace,onewiththeexternalauditorsandoneseparatelywiththeInternalAuditDepartment.
Nexttoquarterlyresults,subjectsaddressedatAudit Committee meetings included the annual financialstatements,acquisitions,thefinancingposition of the Company, the external auditor’s report, proposals for the appointment and remuneration of
the external auditors, the tax position of the Company, riskmanagement,creditnotes,complianceandfraud,and the internal audit plan.
Selection,AppointmentsandRemuneration CommitteeThemembersoftheSelection,AppointmentsandRemunerationCommittee(SARC)in2008wereMr.JoHautvast(Chairman),Mrs.Marie-ChristineLombardandMr.DurkJager.Forefficiencyreasons,theRemunerationCommitteeandtheSelectionandAppointmentsCommitteehavebeencombined.In2008, the Committee convened three times and had regularcontactsbytelephone.Initsmeetings,the Committee assessed the performance and the remunerationofindividualmembersoftheExecutiveBoardanddiscussedthenecessaryskillsandcompositionoftheExecutiveBoardinrelationtotherequirementsoftheCompanygoingforward.
ThemeetingsoftheSARCareattendedbytheCEO,unlesshisownpositionisdiscussed,andtheCorporateHumanRelationsDirector.
Asinpreviousyears,theCommitteeusedmarket-related information and advice on commonly applied reward elements, best practice and expected developments. The remuneration policy of the Company’s top management was discussed and a proposal concerning the adjustment of the ExecutiveBoard’sremunerationinlinewiththeCompany’s approved policy of remunerating at the median level was adopted for approval by the SupervisoryBoard.TheseproposalswereapprovedbytheSupervisoryBoard.
The matters related to remuneration that were discussedbytheSARCduring2008includedtheannual salary review as well as the evaluation of theshort-termbonusachievements.Inlinewiththe remuneration policy as approved by the shareholders,theLongTermIncentivePlanfor2008was discussed and agreed while the performance targets for 2008 were set. Furthermore, a scenario analysis of the remuneration policy was conducted aimed at a review of the outcome of the remuneration policy for senior management over the preceding three years, especially in view of the long- and short-term incentives. Also, the remunerationoftheSupervisoryBoardwasevaluated during 2008.
8908_WessanenAR_UK_06_Financing.indd 38 13/3/09 17:12:09

39 Message from the Supervisory Board Royal Wessanen nv/Annual Report 2008
TheSARCadoptedaproposaltochangetheLongTermIncentivePlanforseniormanagement,excludingthemembersoftheExecutiveBoard,from a share-based plan into a cash-based plan.
InordertofillthevacancythatoccurredastheresultofthedepartureofHanWagterasmemberoftheExecutiveBoardandCFO,theSARCinitiatedtheprofile setting, recruitment and the evaluation of candidates.Inthesecondhalfof2008,FransEelkmanRoodawasappointedasChiefFinancialOfficerofRoyalWessanen.HisappointmenttotheExecutiveBoardwillbeproposedtotheAGMonApril22,2009.However,intheinterestsofgoodgovernanceandtransparency, a summary of his remuneration packageisincludedinthisAnnualReport.
OthersubjectsaddressedatSARCmeetingsincluded:
• ManagementDevelopmentReviewofthetop40seniormanagersoftheCompany,andManagementchanges.
• Pensionschemedevelopments.
TheChairmanoftheSARCreportedontheaforementionedmatterstothefullBoardaftereachmeetingandadvisedtheBoardondecision-makingwhenrequired.
Remuneration processTheSupervisoryBoard,throughtheRemunerationCommittee,implementstheRemunerationPolicyand determines, based on this policy, the remuneration of the individual members of the ExecutiveBoard.
TheSupervisoryBoardmay,ifnecessary,deviatefromthepolicy.Thismaybeduetomarketcircumstances or if the application of the policy were tobeunreasonable.Everyyear,theRemunerationCommittee assesses whether the remuneration policy is still consistent with the objectives of the Company and whether an adjustment of the terms ofemploymentwouldbeappropriate.Preparinganyproposal with regard to the policy, the Remuneration Committeemayseekadvicefromanoutsideindependent remuneration expert. Changes to the RemunerationPolicywillbesubmittedforapprovaltotheGeneralMeetingofShareholders.
Objectives of the Remuneration PolicyTheobjectiveoftheRemunerationPolicyistoattract,motivate and retain experienced directors with an internationaloutlookandrewardthemfortheirability to achieve stretched targets for short- and long-term performance, including out-performance relative to a challenging peer group, and motivate them towards the achievement of performance that enhances the value of the Group.
CompensationplansattheExecutiveBoardleveland senior management reflect Royal Wessanen’s commitment to value creation and reflect a clear alignmentwithstakeholderinterest.
Inthelightoftheremunerationpolicy,thestructureoftheremunerationpackagefortheExecutiveBoardis designed to balance short-term operational
performance with the long-term objective of creating sustainable value within the Company, while takingaccountoftheinterestsofallstakeholders.
The remuneration policy for the members of the ExecutiveBoardisalignedwiththephilosophyunderlying the remuneration of other senior executivesofWessanen.IndesigningandsettingthelevelsofremunerationfortheExecutiveBoard,theRemunerationCommitteealsotakesaccountoftherelevantprovisionsofstatutoryrequirements,corporate governance guidelines and other best practicesintheNetherlandsandotherrelevantjurisdictions.
Labor market peer groupWessanentakesexternalreferencedataintoaccountindeterminingadequatebasesalarylevels.ForthatpurposealabormarketpeergrouphasbeendefinedwhichconsistsofDutchcompaniesthatareheadquarteredintheNetherlandsandaremoreorlesscomparabletoWessanenintermsofsize,international scope and complexity of operations.
Thelabormarketpeergroupconsistsofthefollowing companies:
• Vion • Campina• Nutreco • CSM• SaraLee/DE • FrieslandFoods
Peergroupdataaresubjecttoannualreviewandmay be updated on an annual basis. The peer group is influenced by factors such as the type of organizationandtheorganizationalstructureofthese companies. Therefore in assessing Wessanen remuneration levels, the peer data are used with caution as they do not reflect the specific organizationalstructureofWessanen.Wessanenwillalso closely monitor the developments of practices ofotherAEXandAMX-listedcompanieswhicharesimilartoWessaneninsizeandcomplexity.IfamemberoftheExecutiveBoardisnotDutchandresidesoutsidetheNetherlandsandthelocalmarketexceedstheDutchmarketthenthebasesalaryissetagainstthereferencemarketofthatcountry.
Remuneration elementsTheremunerationformembersoftheExecutiveBoardcomprisesthefollowingelements:
• Basesalary,whichisfixedandwillbereviewedonce a year.
• ShortTermIncentive,rangingfrom0%-100% of base salary depending on the achievement of performance targets.
• LongTermIncentive,rangingfrom0%-50% of base salary depending on the achievement of performance hurdles.
• Pension.
The base salary and the related pension arrangementsarefixed;allothercomponentsare(directlyorindirectly)performance-linked.
Inadditiontotheseelementsoftheremuneration,a number of additional arrangements apply to the membersoftheExecutiveBoard,inlinewithmarket
8908_WessanenAR_UK_06_Financing.indd 39 13/3/09 17:12:09

40 Royal Wessanen nv/Annual Report 2008 Message from the Supervisory Board
practiceintheNetherlandsandtheUS,andsimilartothoseofotherWessanenExecutives.Thesearrangements are:
• theuseofcompanycars;• contributiontotelephonecosts;and• fixedexpenseallowancesforbusinessexpenses.
Base salaryThebasesalaryformembersoftheExecutiveBoardissetatmedianlevelrelativetothelabormarketpeer group.
IndeterminingtheindividualremunerationofamemberoftheExecutiveBoard,theRemunerationCommittee will, apart from the role and responsibilitiesoftherole,alsotakeintoaccountelementssuchasrequiredcompetencies,skillsandperformance of the individual. Adjustment of the basesalaryisatthediscretionoftheSupervisoryBoard,whichtakesintoaccountexternalandinternal developments. The annual review for the base salary is April 1. The individual salary levels are shown in the Annual Report.
Variable compensationThevariablecompensationislinkedtopreviouslydetermined, measurable and influenceable targets. VariablecompensationisanimportantpartoftheremunerationpackageformembersoftheExecutiveBoard.Incentivetargetsandperformanceconditionsreflectthekeydriversforvaluecreationandmediumto long-term growth in shareholder value. Therefore a considerable part of the total compensation consists of variable compensation depending on performance. Consistent with the above principles, whenperformanceisontargetupto60%ofthebasesalarycanbeearnedundertheShortTermIncentivePlan,andatargetawardofupto50%ofbasesalary(atthedateofgrant)canbeearnedundertheLongTermIncentivePlan.
TheShortandLongTermIncentivePlanscontaintheprovision that a decision to grant incentives and/or performance shares may be corrected should it emerge at a later date that they have been wrongly granted(inpart)onthebasisofincorrect(financial)
information.Intheeventofsuchcorrection,theCompany shall either provide additional incentives or performance shares or, alternatively, shall be entitled to reclaim the incentives and performance shares to theextenttheseweregrantedincorrectly(clawbackprovision),asthecasemaybe.
TheSupervisoryBoardhasatalltimesthediscretionary power to adjust the level of the variable remuneration components to be granted. Any use of this discretionary power is stated in the Remuneration Report with sound reasons why this was done.
Short Term IncentiveThemembersoftheExecutiveBoardareeligibleto participate in the cash incentive program which iscalledWessanenShortTermIncentivePlan(STIP)which provides an annual variable cash incentive based on the achievement of specific performance targets.
Thesetargetsaresetatachallenginglevel,takingintoaccountgeneraltrendsintherelevantmarkets,andarelinkedtothefinancialresultsoftheCompany.ForthememberoftheExecutiveBoardresponsiblefortheUSthefinancialtargetswillrelatetothefinancial results for his area of responsibility. The targets are determined annually at the beginning of the year by the Remuneration Committee on behalfoftheSupervisoryBoard.
Foron-targetperformanceMembersoftheExecutiveBoardcanearnanincentiveamountingto60%oftheirannualbasesalary.Amaximumpay-out relative to performance will not exceed a 100% of base salary.
The incentive pay-out in any year relates to the achievements of the preceding financial year versus agreed targets.
Performance targetsThe performance targets are related to operational performance,beingEBIT,reflectingshort-termfinancial results, in addition to annual sales growth andcashflow.ForthememberoftheExecutiveBoardresponsiblefortheUSthesameperformancetargets are set, related to his area of responsibility.
MessagefromtheSupervisoryBoardcontinued
8908_WessanenAR_UK_06_Financing.indd 40 13/3/09 17:12:10

41 Message from the Supervisory Board Royal Wessanen nv/Annual Report 2008
Position Short Term Performance Targets Incentive Plan and Relative WeightingCEO Attarget:50%ofbasesalary –EBIT(35%) Maximum:100%ofbasesalary –Salesgrowth(35%) –Cashflow(30%)CFO Attarget:40%ofbasesalary –EBIT(35%) Maximum:80%ofbasesalary –Salesgrowth(35%) –Cashflow(30%)Member Attarget:60%ofbasesalary NorthAmericaNorthAmerica Maximum:100%ofbasesalary –EBIT(35%) –Salesgrowth(35%) –Cashflow(30%)
The Company is of the opinion that the combination ofEBIT,annualsalesgrowthandcashflowadequatelyreflects the Company’s financial performance. Targets willbedeterminedeachyearbytheSupervisoryBoard,basedonhistoricalperformance,theoperationalandstrategicoutlookoftheCompanyin the short term and expectations of the Company’s managementandstakeholders,amongotherthings.Thetargetscontributetotherealizationoftheobjective of long-term value creation. The Company willnotdisclosetheactualtargets,astheyqualifyas commercially sensitive information.
Long Term Incentive PlanTheLongTermIncentivePlan(LTIP)focusesthemembersoftheExecutiveBoardonthegrowthoflong-term sustainable value for shareholders. This plan serves to align the interests of the participating employees with the shareholders’ interests and to attract, motivate and retain participating employees.
UndertheLTIPtheExecutiveBoardmembersareawardedwithperformanceshares.TheLTIPhasathree-yearhorizonwithareviewdateattheendof the third year. The review date has two specific performance targets. The number of shares that become unconditional after three years is determined on the basis of Wessanen’s performance against the preset performance hurdles.
Grants can also be used for one-off situations, for example, in the event of initial grants to new employees and additional grants in the event of promotion. The actual number of performance shares thatwillbegrantedtothemembersoftheExecutiveBoardwillbedeterminedbytheSupervisoryBoard.Thetargetvalueatgrantissetat50%ofbasesalary.
The awarded performance shares shall be retained bythemembersoftheExecutiveBoardforaperiodof at least five years (including the three-year vesting period, or at least until termination of employment if thisperiodisshorter).
Duringthethree-yearvestingperiod,thecostsofthesesharesdeterminedaccordingtoIFRSwillberecognizedintheprofitandlossaccountaspersonnel expenses.
TheSupervisoryBoardhasthe‘ultimateremedy’power to adjust the value of the variable remuneration components awarded, either downwards or upwards, if this remuneration produces an unfair result.
Relative Total Shareholder Return (TSR) as performance measureThe actual number of performance shares received bytheExecutiveBoard(‘vesting’)dependsontheTSRperformanceoverathree-yearperiodcomparedtotheTSRperformanceofaselectedpeergroup.TSRmeasuresthereturnsreceivedbyshareholdersand includes both the change in a company’s share price and the value of dividend income. This measure is used as it assesses long-term value creation by the Company.
TheTSRperformancehurdleinvolvesacomparisonbetweenTSRofthesharesintheCompanyoverthetestperiodofthreeyearsandtheTSRofapeergroupof leading multinational food companies over the same test period, measured at the end of the test period.
Vestingoftheperformancesharesshalloccurafterthree years as set out below:
Maximum number of vested performance shares as percentage Ranking of granted performance sharesPlace1 150%Place2and3 125%Place4 100%Place5and6 75%Place7and8 50%Place9 25%Place10 0%
The peer group consists of the following companies:
• SunOptaInc. • Kraft• Nestlé • Heinz• Unilever • Danone• CSM • UnitedNaturalFoodsInc.• HainCelestialGroup • Wessanen
The peer group is not the same as the one used for determining remuneration levels. The latter is chosen toreflecttherelevantlabormarket.
ThepeergroupusedforbenchmarkingTSRperformancereflectstherelevantmarketinwhichthe Company competes for shareholder preference. Itincludessector-specificcompetitorswhichtheSupervisoryBoardandtheExecutiveBoardconsidertobesuitablebenchmarksforWessanen.ThepeergroupisverifiedbytheSupervisoryBoardeachyearbasedonmarketcircumstances(mergers,acquisitions)whichdeterminetheappropriatenessof the composition of the performance peer group.
8908_WessanenAR_UK_06_Financing.indd 41 13/3/09 17:12:10

42 Royal Wessanen nv/Annual Report 2008 Message from the Supervisory Board
MessagefromtheSupervisoryBoardcontinued
The composition of the peer group will only be changediftheSupervisoryBoardisconvincedthatthis will not result in targets becoming easier or more difficulttomeet.
Overall performance hurdleThe development of the share price over the total testperiodofthreeyearshastobepositive.Incasethe condition with regard to the development of the share price, as described above, has not been met, all conditionally granted performance shares, during the lifetime of this plan, will lapse.
PensionTheDutchMembersoftheExecutiveBoardareeligibletoparticipateintheWessanenPensionPlan1998whichoffersdefinedbenefitsoralternativelymay opt for the defined contribution. The pension policyforthemembersoftheExecutiveBoardaimsataretirementageof65.ThepensionarrangementfortheDutchmembersoftheExecutiveBoardincludes an entitlement to a pension in the event of ill health or disability and a spouse/dependants’ pension on death. The current plan is based on a combinationofdefinedbenefits(careeraverage)and defined contribution and replaces the previous final pay plan.
FormembersoftheExecutiveBoardwithUSnationalityandresidingintheUS,thepensionprovisionisbasedon401-Kdefinedcontribution.
Additional arrangementsInadditiontothemainconditionsofemployment,a number of additional arrangements apply to membersoftheExecutiveBoard.Theseadditionalarrangements, such as expense and relocation allowances, medical insurance, accident insurance and company car arrangements are broadly in line with those for Wessanen senior management in the NetherlandsortheUS.Intheeventofdisablement,membersoftheExecutiveBoardareentitledtobenefits in line with those for other Wessanen executivesintheNetherlandsortheUS.
LoansItisthepolicyoftheCompanynottograntthemembersoftheExecutiveBoardanyloans.Inthepast, certain loans were provided in conjunction withthegrantingofstockoptions.Noloansareoutstanding to the present members of the ExecutiveBoard.
Management changesOnFebruary24,2009,Mr.A.H.A.VeenhofsteppeddownasChiefExecutiveOfficerandwasreplacedadinterimbyMr.F.H.J.Koffrie.TheSupervisoryBoardwishestothankMr.Veenhofforthesixyearshehasled
Wessanen.Mr.KoffrieresignedfromhispositionasmemberoftheSupervisoryBoard.ItwillbeproposedtotheAnnualGeneralMeetingofShareholderstobeheldinUtrecht,theNetherlands,onApril22.2009,toappointMr.KoffrieasmemberoftheExecutiveBoardandCEOofRoyalWessanennvfortheperiodofoneyear.ItwillalsobeproposedtoappointMr.F.E.EelkmanRoodaasmemberoftheExecutiveBoardandCFOfortheperiodoffouryears.Mr.EelkmanRoodahassucceededMr.WagterasCFOoftheCompanyasofJune1,2008.WewouldliketothankMr.Wagterforthe contributions he made to the Company.
(Re)appointments Supervisory BoardItwillbeproposedtoappointMr.FrankVanOersasmemberoftheSupervisoryBoard.Mr.VanOersisCEOofSaraLeeInternationalCoffee&TeadivisionandExecutiveVicePresidentofSaraLeeCorporation.Mr.VanOerswillbeproposedbasedonhisextensiveknowledgeandexpertiseingeneralmanagementand financial management. At the end of their four-yearterm,bothMr.D.I.JagerandMr.L.M.deKoolwillstandforre-election.Mrs.LombardwillresignfromtheBoardinviewofprofessionaldemandsof her principle employer. Wessanen is indebted toMarie-ChristineLombardforhervaluablecontributions from an international perspective.
StatementInaccordancewiththeArticlesofAssociation,the financial statements for 2008, which have been preparedbytheExecutiveBoardandauditedbyKPMGAccountantsN.V.,Utrecht,theNetherlands,andtheReportoftheExecutiveBoardhavebeensubmitted to us. We concur with these financial statements and the dividend proposal. We recommendthattheAnnualGeneralMeetingofShareholdersapprovethesefinancialstatementsandthatthemembersoftheExecutiveBoardbegranted discharge from their management duties andthemembersoftheSupervisoryBoardfromtheir supervision thereof insofar as said management is reflected in the financial statements.
TheSupervisoryBoardisverygratefultoalltheCompany’s staff for the results achieved and expresses its gratitude for their great efforts and dedication during the year 2008.
Utrecht,March4,2009
Supervisory BoardMr.DurkJager,ChairmanMr.JoHautvastMr.TheodeKoolMrs.Marie-ChristineLombard
8908_WessanenAR_UK_06_Financing.indd 42 13/3/09 17:12:10

43 Financial Statements Royal Wessanen nv/Annual Report 2008
Financial Statements
Consolidated financial statementsConsolidated income statement 44Consolidated balance sheet 45Consolidated statement of changes in equity 46Consolidated statement of cash flows 47Notes to the consolidated financial statements 48
Company financial statementsIncome statement of the Company 86Balance sheet of the Company 86Notes to the financial statements of the Company 87
Other information 89
Auditor’s report 90
8908_WessanenAR_UK_07_Financial_State.indd 43 13/3/09 17:13:03

44 Royal Wessanen nv/Annual Report 2008 Financial Statements
Consolidated income statement
In EUR millions, unless stated otherwise Notes 2008 2007Revenue 1,602.8 1,579.8Other income 7 5.7 17.8Raw materials and supplies (1,061.5) (1,049.7)Personnel expenses 8, 9 (226.9) (227.8)Depreciation, amortization and impairments (19.4) (18.3)Other operating expenses (241.9) (238.7)Operating expenses (1,549.7) (1,534.5)Operating profit 58.8 63.1Financial income 3.6 0.5Financial expense (16.9) (10.4)Net financing costs 10 (13.3) (9.9)Share in results of associates 16 – 0.1Profit before income tax 45.5 53.3Income tax expense 11 (11.0) (10.5)Profit after income tax from continuing operations 34.5 42.8Profit from discontinued operations, net of income tax 12 – (0.7)Profit from divestment discontinued operations, net of income tax 12 – 15.4Profit for the period 34.5 57.5
Attributable to:Equity holders of Wessanen 34.4 57.5Minority interests 0.1 –Profit for the period 34.5 57.5
Earnings per share from continuing operations (in EUR) 13 Basic 0.51 0.61Diluted 0.50 0.60
Earnings per share attributable to equity holders of Wessanen (in EUR) 13 Basic 0.51 0.82Diluted 0.50 0.81
Average number of shares outstanding (in thousands) 13 Basic 67,585 69,698Diluted 68,210 70,844
8908_WessanenAR_UK_07_Financial_State.indd 44 13/3/09 17:13:03

45 Financial Statements Royal Wessanen nv/Annual Report 2008
Consolidated balance sheet
December 31, December 31, In EUR millions Notes 2008 2007AssetsProperty, plant and equipment 14 126.3 126.5Intangible assets 15 187.7 175.5Investments in associates 16 0.6 0.5Other investments 17 3.3 6.2Deferred tax assets 18 105.4 88.5Total non-current assets 423.3 397.2Inventories 19 216.4 211.0Income tax receivables 0.4 1.3Trade receivables 20 177.4 191.5Other receivables and prepayments 20 49.2 42.5Cash and cash equivalents 21 44.8 69.3Total current assets 488.2 515.6Total assets 911.5 912.8
EquityShare capital 68.4 72.6Share premium 93.9 99.7Reserves (61.9) (72.5)Retained earnings 263.4 309.9Total equity attributable to equity holders of Wessanen 22 363.8 409.7Minority interests 7.8 20.0Total equity 371.6 429.7
LiabilitiesInterest-bearing loans and borrowings 23 227.1 188.7Employee benefits 24 21.6 22.1Provisions 25 3.7 3.5Deferred tax liabilities 18 5.3 1.6Total non-current liabilities 257.7 215.9Bank overdrafts 21 18.8 19.2Interest-bearing loans and borrowings 23 13.5 4.4Provisions 25 5.1 6.4Income tax payables 5.4 7.8Trade payables 26 141.8 145.7Non-trade payables and accrued expenses 26 97.6 83.7Total current liabilities 282.2 267.2Total liabilities 539.9 483.1Total equity and liabilities 911.5 912.8
8908_WessanenAR_UK_07_Financial_State.indd 45 13/3/09 17:13:03

46 Royal Wessanen nv/Annual Report 2008 Financial Statements
Consolidated statement of changes in equity
Issued and Total equity paid-up attributable to share Share Reserve for Translation Hedging Other legal Retained equity holders Minority Total In EUR millions capital premium own shares reserve reserve reserves earnings of Wessanen interests equity2007Balance at beginning of year 72.6 99.7 (8.4) (2.1) 3.3 0.6 304.0 469.7 10.3 480.0Foreign exchange translation differences – – – (16.1) – – – (16.1) – (16.1)Effective portion of changes in fair value of cash flow hedges – – – – (3.8) – – (3.8) – (3.8)Total income and expense recognized directly in equity – – – (16.1) (3.8) – – (19.9) – (19.9)Profit for the period – – – – – – 57.5 57.5 – 57.5Total recognized income and expense – – – (16.1) (3.8) – 57.5 37.6 – 37.6Change in minority interests – – – – – – – – 9.7 9.7Share options exercised/ shares delivered – – 1.8 – – – (0.9) 0.9 – 0.9Repurchase of own shares – – (50.0) – – – – (50.0) – (50.0)Share-based payments – – – – – – 1.0 1.0 – 1.0Dividends to shareholders – – – – – – (49.5) (49.5) – (49.5)Transfer to other legal reserves – – – – – 2.2 (2.2) – – –Balance at year end 72.6 99.7 (56.6) (18.2) (0.5) 2.8 309.9 409.7 20.0 429.7
2008Balance at beginning of year 72.6 99.7 (56.6) (18.2) (0.5) 2.8 309.9 409.7 20.0 429.7Foreign exchange translation differences – – – (32.3) – – – (32.3) – (32.3)Effective portion of changes in fair value of cash flow hedges – – – – (7.2) – – (7.2) – (7.2)Total income and expense recognized directly in equity – – – (32.3) (7.2) – – (39.5) – (39.5)Profit for the period – – – – – – 34.4 34.4 0.1 34.5Total recognized income and expense – – – (32.3) (7.2) – 34.4 (5.1) 0.1 (5.0)Change in minority interests – – – – – – – – (12.3) (12.3)Share options exercised/ shares delivered – – 1.0 – – – (1.0) – – –Repurchase of own shares – – (0.6) – – – – (0.6) – (0.6)Cancellation of own shares (4.2) (5.8) 50.0 – – – (40.0) – – –Share-based payments – – – – – – 0.7 0.7 – 0.7Dividends to shareholders – – – – – – (40.6) (40.6) – (40.6)Transfer to provisions – – – – – – (0.3) (0.3) – (0.3)Transfer to other legal reserves – – – – – (0.3) 0.3 – – –Balance at year end 68.4 93.9 (6.2) (50.5) (7.7) 2.5 263.4 363.8 7.8 371.6
8908_WessanenAR_UK_07_Financial_State.indd 46 13/3/09 17:13:03

47 Financial Statements Royal Wessanen nv/Annual Report 2008
Consolidated statement of cash flows
In EUR millions Notes 2008 2007Cash flows from operating activitiesOperating profit 58.8 63.1
Adjustments for:Depreciation, amortization and impairments 19.4 18.3 Provisions created 13.9 21.3 Other non-cash and non-operating items 0.8 (11.3)Gain from disposals (4.7) (6.1)Cash generated from operations before changes in working capital and provisions 88.2 85.3
Changes in working capital 32 (11.9) (31.0)Payments from provisions (14.4) (22.5)Changes in employee benefits (2.4) (1.7)Cash generated from operations 59.5 30.1
Income tax paid (14.7) (9.5)Interest paid (10.3) (9.3)Operating cash flow from continuing operations 34.5 11.3 Operating cash flow from discontinued operations – (0.6)Net cash from operating activities 34.5 10.7
Cash flows from investing activitiesAcquisition of property, plant and equipment (24.3) (25.2)Proceeds from sale of property, plant and equipment 10.5 14.3 Acquisition of intangible assets, excluding goodwill (1.9) (3.7)Proceeds from sale intangible assets 1.3 –(Investments in)/proceeds from investments 2.4 (2.3)Acquisition of subsidiaries and businesses, net of cash acquired (29.9) (20.9)Disposal of subsidiaries, net of cash disposed of – 16.2 Investing cash flow from continuing operations (41.9) (21.6)Investing cash flow from discontinued operations – 83.6 Net cash from/(used in) investing activities (41.9) 62.0
Cash flows from financing activitiesProceeds from borrowings 43.5 56.2 Net payments of finance lease liabilities (1.4) (2.9)Cash receipts/(payments) derivatives (18.1) 9.4 Proceeds from exercise of share options – 0.9 Repurchase of own shares (0.6) (50.0)Dividends paid (40.6) (49.5)Financing cash flow from continuing operations (17.2) (35.9)Financing cash flow from discontinued operations – (0.2)Net cash from/(used in) financing activities (17.2) (36.1)
Net cash flow 32 (24.6) 36.6
8908_WessanenAR_UK_07_Financial_State.indd 47 13/3/09 17:13:03

48 Royal Wessanen nv/Annual Report 2008 Financial Statements
Notes to the consolidated financial statements
Notes to the consolidated financial statements are in EUR millions, except for per share data, ratios, percentages and where indicated otherwise.
1. The Company and its operationsThe principal activities of Royal Wessanen nv (‘Wessanen’ or ‘the Company’), a public limited company domiciled in the Netherlands, are developing, sourcing, producing, marketing and distributing high-quality natural and specialty food products in North America and Europe. The consolidated financial statements of Royal Wessanen nv for the year ended December 31, 2008, comprise Wessanen and its subsidiaries (together referred to as ‘the Group’) and Wessanen’s interest in associated companies. Wessanen’s subsidiaries and associated companies are listed in Note 33. The address of the Company’s registered office is Beneluxlaan 9, Utrecht, the Netherlands.
2. Basis of preparationStatement of complianceThe consolidated financial statements for the year ended December 31, 2008 have been prepared in accordance with International Financial Reporting Standards (IFRS) as adopted by the European Union (EU) and also comply with the financial reporting requirements included in Part 9 of Book 2 of the Netherlands Civil Code.
The financial statements were signed and authorized for issuance by the Supervisory Board and the Executive Board on March 4, 2009, and will be submitted for adoption to the Annual General Meeting of Shareholders on April 22, 2009.
Basis of measurementThe consolidated financial statements have been prepared on the historical cost basis except for the following assets and liabilities that are stated at their fair value: derivative financial instruments, financial instruments at fair value through profit or loss, financial assets classified as available for sale and liabilities for cash-settled share-based payment arrangements. The methods used to measure fair value are disclosed in Note 4.
Functional and presentation currencyThe functional currency of Wessanen is the euro. These consolidated financial statements are presented in millions of euro.
Use of estimates and judgementsThe preparation of Wessanen’s consolidated financial statements requires management to make estimates and assumptions that affect the application of accounting policies and the reported amounts of assets and liabilities, of revenues and expenses and the disclosure of contingent assets and liabilities. Although these estimates and associated assumptions are based on management’s best knowledge of current events and actions, actual results may ultimately differ from these estimates and assumptions.
The estimates and underlying assumptions are reviewed on an ongoing basis. Revisions to accounting estimates are recognized in the period in which the estimate is revised if the revision affects only that period, or in the period of the revision and future periods if the revision affects both current and future periods.
3. Significant accounting policiesThe accounting policies set out below have been consistently applied to all periods presented in these consolidated financial statements, and have been applied consistently by all Group entities.
Certain comparative amounts have been reclassified to conform with the currents year’s presentation.
Basis of consolidationSubsidiariesThe consolidated financial statements incorporate the financial statements of Wessanen and all entities that are controlled by Wessanen (‘subsidiaries’). Control is presumed to exist when Wessanen has the power, directly or indirectly, to govern the financial and operating policies of an entity so as to obtain benefits from its activities (generally accompanying a shareholding of more than one half of the voting rights). In assessing control, potential voting rights that presently are exercisable or convertible are taken into account. The financial statements of subsidiaries are included in the consolidated financial statements from the date that control commences until the date that control ceases.
AssociatesAssociates are those entities in which Wessanen has significant influence, but not control, over the financial and operating policies (generally accompanying a shareholding of between 20% and 50% of the voting rights). The consolidated financial statements include the Group’s share of the total recognized gains and losses of associates on an equity accounted basis, from the date that significant influence commences until the date that significant influence ceases. When the Group’s share of losses of the associate exceeds the carrying amount of the associate, the carrying amount is reduced to nil and recognition of further losses is discontinued, except to the extent that Wessanen has incurred obligations or made payments on behalf of the associate.
Transactions eliminated on consolidationIntra-group balances and transactions and any unrealized gains and losses arising from intra-group transactions are eliminated in preparing the consolidated financial statements. Unrealized gains arising from transactions with equity accounted associates are eliminated against the investment in the associate to the extent of the Group’s interest in the associate. Unrealized losses are eliminated in the same way as unrealized gains, but only to the extent that there is no evidence of impairment.
8908_WessanenAR_UK_08_Notesconsolidatedfinstate3.indd 48 17/3/09 15:52:55

49 Financial Statements Royal Wessanen nv/Annual Report 2008
Notes to the consolidated financial statements
3. Significant accounting policies continuedForeign currencyForeign currency transactionsTransactions in foreign currencies (not being the functional currency) are translated to the functional currency using the exchange rate ruling at the date of the transaction. Monetary assets and liabilities denominated in foreign currencies are translated to euro at the exchange rates ruling at the balance sheet date. Foreign exchange differences arising on translation are recognized in the income statement. Non-monetary assets and liabilities denominated in foreign currencies that are stated at historical cost are translated to euro at foreign exchange rates ruling at the date of the transaction. Non-monetary assets and liabilities denominated in foreign currencies that are stated at fair value are translated to euro at foreign exchange rates ruling at the dates the fair value was determined.
Financial statements of foreign operationsThe assets and liabilities of foreign operations, including goodwill and fair value adjustments arising on acquisition, are translated to euro at foreign exchange rates ruling at the balance sheet date. The revenues and expenses of foreign operations are translated to euro at annual average exchange rates. The resulting foreign exchange differences arising on translation are recognized directly in a separate component of equity, the translation reserve.
Net investment in foreign operationsForeign exchange differences arising from the translation of the net investment in foreign operations, and of related hedges, are taken to the translation reserve. Such differences are recognized in the income statement upon disposal of the foreign operation or settlement of the net investment.
The principal exchange rates against the euro used in the balance sheet and income statement are:
Balance sheet Income statement December 31, December 31, Currency per EUR 2008 2007 2008 2007USD 1.4104 1.4709 1.4720 1.3764CAD 1.7158 1.4388 1.5733 1.4641GBP 0.9751 0.7369 0.8050 0.6872
Derivative financial instrumentsWessanen uses derivative financial instruments to hedge its exposure to foreign exchange, interest rate and commodity risks arising from operating, investing and financing activities. These instruments are initially recognized in the balance sheet at fair value on a settlement date basis and are subsequently remeasured at their fair value. Gains and losses resulting from the fair value remeasurement are recognized directly in the income statement, unless the derivative qualifies and is effective as a hedging instrument in a designated hedging relationship. Derivatives that are designated as hedges are accounted for as either cash flow hedges or fair value hedges.
Gains and losses on derivative financial instruments are (ultimately) recognized in the income statement under financial income and expenses, except for the effective portion of those derivative financial instruments that are designated as hedges and entered into to mitigate operational risks. This portion is recognized in operating result.
HedgingCash flow hedgesIf a derivative financial instrument is designated as a hedge of the variability in cash flows of a recognized liability, a firm commitment or a highly probable forecasted transaction, the effective part of any gain or loss on the derivative financial instrument is recognized directly in equity. When the firm commitment or forecasted transaction results in the recognition of an asset or liability, the cumulative gain or loss is removed from equity and included in the initial measurement of the asset or liability. Otherwise, the cumulative gain or loss is removed from equity and recognized in the income statement at the same time as the hedged transaction. The ineffective part of any gain or loss is immediately recognized in the income statement.
When a hedging instrument or hedge relationship is terminated, but the hedged transaction still is expected to occur, the cumulative gain or loss at that point remains in equity and is recognized in the income statement in accordance with the above policy when the transaction occurs. If the hedged transaction is no longer expected to take place, the cumulative unrealized gain or loss recognized in equity is recognized immediately in the income statement.
Fair value hedgesFair value changes of derivative instruments that qualify for fair value hedge accounting treatment are recognized for the hedged risk in the income statement in the periods in which they arise, together with any changes in fair value of the hedged asset or liability.
8908_WessanenAR_UK_08_Notesconsolidatedfinstate1.indd 49 13/3/09 17:24:19

50 Royal Wessanen nv/Annual Report 2008 Financial Statements
Notes to the consolidated financial statements
3. Significant accounting policies continuedHedge of monetary assets and liabilitiesIf a derivative financial instrument is used to economically hedge the foreign exchange exposure of a recognized monetary asset or liability, the gain or loss on the hedging instrument is recognized in the income statement, except for those financial instruments that are designated as hedges.
Hedge of net investment in foreign operationThe portion of the gain or loss on an instrument used to hedge a net investment in foreign operation that is determined to be an effective hedge is recognized directly in equity. The ineffective portion is recognized in the income statement.
Segment reportingWessanen has determined its reportable segments based on its internal reporting practices and on how the Company’s management evaluates the performance of operations and allocates resources. Performance of the segments is evaluated against several measures, of which revenue and operating profit are the most important.
A business segment is a group of assets and operations engaged in providing products or services that are subject to risks and rewards that is different from those of other business segments. A geographical segment is a group of assets and operations engaged in providing products or services within a particular economic environment that are subject to risks and rewards that are different from segments operating in other economic circumstances.
Segment results, assets and liabilities include items directly attributable to a segment as well as those that can be allocated on a reasonable basis. Non-allocated results, assets and liabilities to segments mainly refer to corporate items and non-operating results, assets and liabilities such as financing and income tax related items.
The geographical analysis of revenue is based upon the location of the customers. The geographical analysis of operating assets and capital expenditures is based upon the location of the assets.
Inter-segment sales are executed under normal commercial terms and conditions that would be available to unrelated third parties.
Property, plant and equipmentProperty, plant and equipment are stated at cost less accumulated depreciation and impairment losses. Cost includes expenditures that are directly attributable to the acquisition or construction of the asset and may include borrowing costs incurred during construction.
Expenditure incurred to replace a component of an item of property, plant and equipment that is accounted for separately, including major inspection and overhaul expenditure, is capitalized. Other subsequent expenditure is capitalized only when it increases the future economic benefits embodied in the item of property, plant and equipment. All other expenditure is recognized in the income statement as an expense as incurred.
Depreciation is charged to the income statement on a straight-line basis over the estimated useful lives. Land is not depreciated. Where an item of property, plant or equipment comprises major components having different useful lives, they are accounted for as separate items of property, plant and equipment. Depreciation methods, useful lives, as well as residual values are tested annually.
Assets not in use are recorded at the lower of their book value and recoverable amount.
The estimated useful lives of property, plant and equipment for the current and comparative period are as follows:
Buildings and offices 30 yearsMachinery and equipment 10-15 yearsComputers 3-5 yearsOther 3-5 years
Assets not in use and assets classified as held for sale are not depreciated.
Finance leaseLeases under which Wessanen assumes substantially all the risks and rewards of ownership are classified as finance leases. Plant and equipment acquired by way of finance lease is stated at an amount equal to the lower of its fair value and the present value of the minimum lease payments at inception of the lease, less accumulated depreciation and impairment losses. Leased assets are depreciated over the shorter of the lease term and their useful lives. Lease payments are accounted for as described in the accounting policy on Expenses.
8908_WessanenAR_UK_08_Notesconsolidatedfinstate1.indd 50 13/3/09 17:24:20

51 Financial Statements Royal Wessanen nv/Annual Report 2008
Notes to the consolidated financial statements
3. Significant accounting policies continuedGovernment grantsGovernment grants received in respect of property, plant and equipment are deducted from the carrying values of the related assets. The grants are thus recognized as income over the life of the assets by way of reduced depreciation charges.
Intangible assetsGoodwillAll business combinations are accounted for by applying the purchase method. Goodwill represents amounts arising on acquisition of subsidiaries, associates and joint ventures.
In respect of acquisitions that have occurred since January 1, 2004, goodwill represents the excess of the cost of the acquisition over the Group’s interest in the net fair value of the identifiable assets and liabilities and contingent liabilities at the date of acquisition (measured based on methods as described in Note 4). Negative goodwill arising on an acquisition is recognized directly in the income statement, classified as ‘other income’.
In respect of acquisitions prior to January 1, 2004, goodwill is included on the basis of its deemed cost, which represents the amount recorded under previous Dutch GAAP. In respect of acquisitions prior to January 1, 2001, goodwill was deducted directly from equity under previous Dutch GAAP.
Goodwill is stated at cost less any accumulated impairment losses. Goodwill is allocated to cash-generating units and is no longer amortized but tested annually for impairment. In respect of associates, the carrying amount of goodwill is included in the carrying amount of the investment in the associate.
Brands and customer relationshipsCapitalized brands and customer relationships are measured at cost less accumulated amortization and impairment losses. Brands and customer relationships acquired in business acquisitions are initially measured at fair value.
The useful lives of brand names have been determined on the basis of certain factors such as the economic environment, the expected use of the asset and related assets or groups of assets and legal or other provisions that might limit the useful life. Based on this assessment, the useful life is determined to be indefinite, since there is no foreseeable limit to the period of time over which the brand names are expected to contribute to the cash flows of the Group. Capitalized brands with an indefinite life are not amortized.
Customer relationships are amortized over their estimated useful lives of maximum 20 years.
Business acquisition feesBusiness acquisition fees represent fees paid by Wessanen to its customers for the ability to sell and service customer stores. Such fees paid in accordance with signed agreements are capitalized and amortized over the life of the agreement.
Research and developmentExpenditure on research activities, undertaken with the prospect of gaining new scientific or technological knowledge and understanding, is recognized in the income statement as an expense when incurred.
Expenditure on development activities, of which research findings are applied to a plan or design for the production of new or substantially improved products and processes, is capitalized if development costs can be measured reliably, the product or process is technically and commercially feasible, future economic benefits are probable, and the Group intends to and has sufficient resources to complete development and to use or sell the asset. The expenditure capitalized includes the cost of materials, direct labor and overhead costs that are directly attributable to preparing the assets for its intended use. Other development expenditure is recognized in the income statement as an expense when incurred.
Capitalized development expenditure is stated at cost less accumulated amortization and accumulated impairment losses.
Other intangible assetsOther intangible assets that are acquired by Wessanen, which have finite useful lives, are stated at cost less accumulated amortization and impairment losses.
Expenditure on internally generated goodwill and brands is recognized in the income statement as an expense as incurred.
Subsequent expenditureSubsequent expenditure on capitalized intangible assets is capitalized only when it increases the future economic benefits embodied in the specific asset to which it relates. All other expenditure is expensed as incurred.
AmortizationAmortization is charged to the income statement on a straight-line basis over the estimated useful lives of intangible assets unless such lives are indefinite. Intangible assets are amortized from the date they are available for use. Residual useful life is re-assessed annually.
8908_WessanenAR_UK_08_Notesconsolidatedfinstate1.indd 51 13/3/09 17:24:20

52 Royal Wessanen nv/Annual Report 2008 Financial Statements
Notes to the consolidated financial statements
3. Significant accounting policies continuedInvestments in associatesThe results, assets and liabilities of associates are accounted for by the equity method. The consolidated financial statements include the Group’s share of the total recognized gains and losses of associates from the date that significant influence commences until the date that significant influence ceases. When the Group’s share of losses of the associate exceeds the carrying amount of the associate, the carrying amount is reduced to nil and recognition of further losses is discontinued except to the extent that Wessanen has incurred obligations or made payments on behalf of the associate.
Transactions between the Group and associates are at an arm’s length basis.
Investments in equity and debt securitiesFinancial instruments held for trading are classified as current assets and are stated at fair value, with any resultant gain or loss recognized in the income statement. Held-to-maturity assets are stated at amortized cost less impairment losses. Other investments held by Wessanen are classified as being available for sale and are stated at fair value, with any resultant gain or loss recognized directly in equity, except for impairment losses and, in the case of monetary items, foreign exchange rate gains and losses. When these investments are derecognized, the cumulative gain or loss previously recognized directly in equity is recognized in the income statement. Where these investments are interest-bearing, interest calculated using the effective interest method is recognized in the income statement.
Dividends received are recognized upon declaration.
InventoriesInventories are stated at the lower of cost and net realizable value. The cost of inventories is based on the first-in first-out principle, and includes expenditure incurred in acquiring the inventories and bringing them to their existing location and condition. In the case of manufactured inventories and work in progress, cost includes an appropriate share of production overheads based on normal operating capacity. Inventory is valued net of vendor allowances if applicable.
Net realizable value is the estimated selling price in the ordinary course of business, less the estimated costs of completion and selling expenses.
Trade and other receivablesTrade and other receivables are stated at their amortized cost less impairment losses. Amortized cost is determined using the effective interest rate.
Cash and cash equivalentsCash and cash equivalents comprise cash and bank balances and call deposits. Cash equivalents are only recognized when control over the possibility to convert to cash is transferred to or from Wessanen.
Bank overdrafts that are repayable on demand and form an integral part of Wessanen’s cash management are included as a component of cash and cash equivalents for the purpose of the statement of cash flows.
Bank accounts are netted if the Company has a legal enforceable right to offset and offsetting takes place on a regular basis.
Impairment of assetsThe carrying amounts of Wessanen’s assets, other than inventories and deferred tax assets, are reviewed at each balance sheet date to determine whether there is any indication of impairment. If any such indication exists, the asset’s recoverable amount is estimated. For intangible assets that are not yet available for use, the recoverable amount is estimated at each balance sheet date. An impairment loss is recognized whenever the carrying amount of an asset or its cash-generating unit exceeds its recoverable amount. A cash-generating unit is the smallest identifiable asset group that generates cash flows that largely are independent from other assets and groups. Impairment losses are recognized in the income statement.
Goodwill, brands and other intangible assets with indefinite useful lives are subject to annual impairment testing, irrespective of whether indications of impairment exist or not.
Calculation of recoverable amountThe recoverable amount of Wessanen’s investments in held-to-maturity securities and receivables is calculated as the present value of expected future cash flows, discounted at the original effective interest rate inherent in the asset. Receivables with a short duration are not discounted.
The recoverable amount of other assets is the greater of their fair value less costs to sell and value in use. In assessing value in use, the estimated future cash flows are discounted to their present value using a pre-tax discount rate that reflects current market assessments of the time value of money and the risks specific to the asset. For an asset that does not generate largely independent cash inflows, the recoverable amount is determined for the cash-generating unit to which the asset belongs.
Reversal of impairmentAn impairment loss in respect of a held-to-maturity security or receivable carried at amortized cost is reversed if the subsequent increase in recoverable amount can be related objectively to an event occurring after the impairment loss was recognized.
An impairment loss in respect of goodwill is not reversed.
8908_WessanenAR_UK_08_Notesconsolidatedfinstate1.indd 52 13/3/09 17:24:20

53 Financial Statements Royal Wessanen nv/Annual Report 2008
Notes to the consolidated financial statements
3. Significant accounting policies continuedIn respect of other assets, an impairment loss is reversed when there is an indication that the impairment may no longer exist and when there has been a change in the estimates used to determine the recoverable amount.
An impairment loss is reversed only to the extent that the asset’s carrying amount does not exceed the carrying amount that would have been determined, net of depreciation or amortization, if no impairment loss had been recognized.
Non-current assets held for sale and discontinued operationsNon-current assets and disposal groups (a group of assets to be disposed of in a single transaction and liabilities directly associated with those assets) are classified as held for sale if their carrying amount will be recovered through a sale transaction rather than through continuing use. This condition is regarded as met only when the sale is highly probable and the asset (or disposal group) is available for sale in its immediate condition. Management must be committed to the sale, which should be expected within one year from the date of classification as held for sale.
Immediately before classification as held for sale, the assets (or components of a disposal group) are remeasured in accordance with the Group’s accounting policies. Thereafter, the assets (or disposal group) are recognized at the lower of their carrying amount and fair value less cost to sell. Assets classified as held for sale, or included within a disposal group that is classified as held for sale, are not depreciated. Impairment losses on initial classification as held for sale and subsequent gains or losses on remeasurement are included in the income statement. Gains are not recognized in excess of any cumulative impairment loss.
A discontinued operation is a component of Wessanen’s business that represents a separate major line of business or geographical area of operations or is a subsidiary acquired exclusively with a view to resale. Classification as a discontinued operation occurs upon disposal or when the operation meets the criteria to be classified as held for sale, if earlier. A disposal group that is to be abandoned may also qualify.
Results from operations qualifying as discontinued operations are presented separately as a single amount on the income statement. Results from operations qualifying as discontinued operations as of the balance sheet date for the latest period presented, that have previously been presented as results from continuing operations, are represented as results from discontinued operations for all periods presented.
In case conditions for classification of non-current assets and disposal groups as held for sale are no longer met, classification as held for sale ceases. Accordingly, results of operations, previously presented in discontinued operations, are reclassified and included in result from continuing operations for all periods presented. Non-current assets that ceases to be classified as held for sale are remeasured at the lower of their carrying amount before classification as held for sale, adjusted for any depreciation, amortization or revaluations that would have been recognized had the asset or disposal group not been classified as held for sale, and its recoverable amount at the date of the subsequent decision to sell.
EquityIssued and paid-up capitalWessanen’s issued capital comprises of EUR 1.00 par value common shares and is stated at nominal value.
Repurchase of sharesWhen shares are repurchased, the amount of the consideration paid, including directly attributable costs, is recognized as a change in equity. Repurchased shares are classified as treasury shares and presented as a deduction from total equity. Considerations received when own shares are reissued are presented as a change in equity. Any gains arising on the reissuance of shares are recognized in retained earnings.
DividendsDividends are recognized as a liability in the period in which they are declared.
Interest-bearing borrowingsInterest-bearing borrowings are recognized initially at fair value less attributable transaction costs. Subsequent to initial recognition, interest-bearing borrowings are stated at amortized cost with any difference between cost and redemption value being recognized in the income statement over the period of the borrowings on an effective interest basis.
Employee benefitsDefined contribution plansObligations for contributions to defined contribution pension plans are recognized as an expense in the income statement as incurred.
Defined benefit plansWessanen’s net obligation in respect of defined benefit pension plans is calculated separately for each plan by estimating the amount of future benefit that employees have earned in return for their service in the current and prior periods; that benefit is discounted to determine the present value, and any unrecognized past service costs and the fair value of any plan assets are deducted. The discount rate is the yield at balance sheet date on high-quality corporate bonds that have maturity dates approximating the terms of Wessanen’s obligations. The calculation is performed by a qualified actuary using the projected unit credit method.
8908_WessanenAR_UK_08_Notesconsolidatedfinstate1.indd 53 13/3/09 17:24:21

54 Royal Wessanen nv/Annual Report 2008 Financial Statements
Notes to the consolidated financial statements
3. Significant accounting policies continuedWhen the benefits of a plan are improved, the portion of the increased benefit relating to past service by employees is recognized as an expense in the income statement on a straight-line basis over the average period until the benefits will vest. To the extent that the benefits vest immediately, the expense is recognized immediately in the income statement.
Actuarial gains and losses that arise are recognized in the income statement over the expected average remaining working lives of the employees participating in the plan, to the extent that any cumulative unrecognized actuarial gain or loss exceeds 10% of the greater of the present value of the defined benefit obligation and the fair value of plan assets. Otherwise, the actuarial gain or loss is not recognized.
Where the calculation results in a benefit to Wessanen, the recognized asset is limited to the net total of any unrecognized actuarial losses and past service costs and the present value of any future refunds from the plan or reductions in future contributions to the plan.
Long-term service benefitsWessanen’s net obligation in respect of long-term service benefits, other than pension plans, is the amount of the future benefit that employees have earned in return for their service in the current and prior periods. The obligation is calculated using the projected unit credit method and is discounted to its present value while the fair value of any related assets is deducted. The discount rate is the yield at balance sheet date on high-quality corporate bonds that have maturity dates approximating the terms of Wessanen’s obligations.
Share-based payment transactionsThe stock option program allows Wessanen employees to acquire shares of Wessanen. The share rights program grants conditional rights to receive shares to eligible employees of Wessanen.
For equity-settled share-based payment transactions, the grant date fair value of share-based compensation plans is expensed, with a corresponding increase in equity, on a straight-line basis over thevesting periods of the grants. The cumulative expense recognized at each balance sheet date reflects the extent to which the vesting period has expired and the Company’s best estimate of the number of shares that will eventually vest. No expense is recognized for awards that do not ultimately vest, except for awards where vesting is conditional upon a market condition (e.g. total shareholder return), which are treated as vested irrespective of whether or not the market condition is satisfied, provided that all non-market conditions (e.g. continued employment) are satisfied.
For cash-settled share-based payment transactions, the grant date fair value is recognized in the income statement over the vesting periods of the grants, with a corresponding increase in provisions. At each balance sheet date, and ultimately at settlement date, the fair value of the liability is remeasured with any changes in fair value recognized in the income statement.
ProvisionsA provision is recognized in the balance sheet if, as a result of a past event, the Group has a present legal or constructive obligation that can be estimated reliably, and it is probable that an outflow of economic benefits will be required to settle the obligation.
If the effect is material, provisions are determined by discounting the expected future cash flows at a pre-tax rate that reflects current market assessments of the time value of money and, where appropriate, the risks specific to the liability.
A restructuring provision is recognized when certain criteria are met. Such criteria include the existence of a detailed formal plan that identifies at least the business or part of the business concerned, the principal location(s) affected, the approximate number of employees whose employment contracts will be terminated, the estimated costs and the timing of when the plan will be implemented. Furthermore, the Company must have raised a valid expectation with those affected that it will carry out the restructuring, by starting to implement that plan or announcing its main features to those affected by it. Future operating costs are not provided for.
The workers’ compensations provision consists mainly of workers’ compensations to employees for injuries incurred during working hours. The workers’ compensation provision is recorded on a discounted basis, utilizing an actuarial method, which is based upon various assumptions that include, but are not limited to historical loss experience, projected loss development factors and actual payroll costs.
Trade and other payablesTrade and other payables are stated at amortized cost. Amortized cost is determined using the effective interest rate.
RevenueRevenue represents the value of goods delivered to third parties, less any value-added taxes or other sales taxes. Revenue is recognized in the income statement when the significant risks and rewards of ownership have been transferred to the buyer. Customer deductions, coupons, rebates, and sales returns and discounts are recorded as reductions to sales and are included in revenue in the consolidated income statement. No revenue is recognized if there are significant uncertainties regarding recovery of the consideration due, associated costs or the possible return of goods.
Revenue related to government grants is recognized in the balance sheet initially as deferred income when there is reasonable assurance that it will be received and that Wessanen will comply with the conditions associated with the grant. Grants that compensate Wessanen for expenses incurred are recognized in the income statement on a systematic basis in the same periods in which the expenses are recognized. Grants that compensate Wessanen for the cost of an asset are recognized in the income statement on a systematic basis over the useful life of the asset.
8908_WessanenAR_UK_08_Notesconsolidatedfinstate1.indd 54 13/3/09 17:24:21

55 Financial Statements Royal Wessanen nv/Annual Report 2008
Notes to the consolidated financial statements
3. Significant accounting policies continuedExpensesOperating lease paymentsPayments made under operating leases are recognized in the income statement on a straight-line basis over the term of the lease.
Finance lease paymentsMinimum lease payments made under finance leases are apportioned between the finance expense and the reduction of the outstanding liability. The finance expense is allocated to each period during the lease term so as to produce a constant periodic rate of interest on the remaining balance of the liability.
Net financing costsNet financing costs comprise interest payable on borrowings calculated using the effective interest rate method, interest receivable on funds invested, losses on unwinding the discount on provisions, foreign exchange gains and losses, and gains and losses on hedging instruments that are recognized in the income statement.
Interest income is recognized in the income statement as it accrues, using the effective interest method.
The interest expense component of finance lease payments is recognized in the income statement using the effective interest rate method.
Income taxIncome tax expense comprises current and deferred tax. Income tax expense is recognized in the income statement except to the extent that it relates to items recognized directly in equity, in which case it is recognized in equity.
Current tax is the expected tax payable on the taxable income for the year, using tax rates enacted or substantially enacted at the balance sheet date, and any adjustments to current tax payable in respect of previous years.
Deferred tax is recognized using the balance sheet liability method, providing for temporary differences between the carrying amounts of assets and liabilities for financial reporting purposes and the amounts used for taxation purposes. Deferred tax liabilities are generally recognized for all taxable temporary differences. Deferred tax assets and liabilities are not recognized for temporary differences arising from the initial recognition of goodwill, the initial recognition of other assets and liabilities in a transaction that is not a business combination and that affects neither accounting nor taxable profit, and differences relating to investments in subsidiaries to the extent that they will probably not reverse in the foreseeable future. Deferred tax is measured at tax rates that are expected to be applied to the temporary differences when they reverse, based on the laws that have been enacted or substantively enacted at the balance sheet date.
Deferred tax assets, including deferred tax assets for tax loss carry forwards, are recognized to the extent that the company has sufficient taxable temporary differences or it is probable that future taxable profits will be available against which deductible temporary differences can be utilized and deferred tax assets realized. The recoverable amount of deferred tax assets is reviewed at each balance sheet date and reduced to the extent that it is no longer probable that sufficient taxable income will be available to allow all or part of the asset to be recovered.
Deferred tax assets and liabilities are not discounted.
Additional income taxes that arise from the distribution of dividends are recognized at the same time as the liability to pay the related dividend is recognized.
Deferred tax assets and liabilities are offset in the balance sheet when there is a legally enforceable right to offset current tax assets against current tax liabilities and when the deferred income taxes are levied by the same fiscal authority.
Cash flow statementThe consolidated cash flow statement is presented using the indirect method. Cash flows in foreign currencies are translated into euro at foreign exchange rates ruling at the date of the transaction. Assets and liabilities of subsidiaries and associates with functional currencies other than the euro are translated into euro at foreign exchange rates ruling at the balance sheet date.
New standards and interpretations not yet effectiveThe following new standards, amendments to standards and interpretations are not yet effective for the year ended December 31, 2008, and have not been applied in preparing these consolidated financial statements:
• IFRS3BusinessCombinations(revised)• IFRS8Operatingsegments• IAS1PresentationofFinancialStatements(revised)• IAS23Borrowingcosts(revised)• IAS32Financialinstruments(revised)• IAS39Financialinstruments:RecognitionandMeasurement(revised)• IFRIC13CustomerLoyaltyPrograms• IFRIC15AgreementsfortheconstructionofRealEstate• IFRIC16HedgesofaNetInvestmentinaForeignOperation• IFRIC17DistributionofNon-cashAssetstoOwners• IFRIC18TransfersofAssetsfromCustomers
Wessanen will introduce the new standards, amendments to standards and interpretations on or after January 1, 2009. Adoption of these standards and interpretations is expected to have a limited impact on the consolidated financial statements of Wessanen.
8908_WessanenAR_UK_08_Notesconsolidatedfinstate1.indd 55 13/3/09 17:24:21

56 Royal Wessanen nv/Annual Report 2008 Financial Statements
Notes to the consolidated financial statements
4. Determination of fair valueA number of the Group’s accounting policies and disclosures require the determination of fair value, for both financial and non-financial assets and liabilities. Fair values have been determined for measurement and/or disclosure purposes based on the following methods. When applicable, further information about the assumptions made in determining fair values is disclosed in the notes specific to that asset or liability.
Property, plant and equipmentThe fair value of property, plant and equipment recognized as a result of a business combination is based on market values. The market value of property is the estimated amount for which a property could be exchanged on the date of valuation between a willing buyer and a willing seller in an arm’s length transaction after proper marketing wherein the parties had each acted knowledgeably, prudently and without compulsion. The market value of items of plant, equipment, fixtures and fittings is based on the quoted market prices for similar items.
Intangible assetsThe fair value of brands acquired in a business combination is based on the discounted estimated royalty payments that have been avoided as a result of the brand being owned. The fair value of other intangible assets is based on the discounted cash flows expected to be derived from the use and eventual sale of the assets.
InventoriesThe fair value of inventories acquired in a business combination is determined based on its estimated selling price in the ordinary course of business less the estimated costs of completion and sale, and a reasonable profit margin based on the effort required to complete and sell the inventories.
Investments in equity and debt securitiesThe fair value of financial assets at fair value through profit or loss, held-to-maturity investments and available-for-sale financial assets is determined by reference to their quoted bid price or another reliable fair value estimate at the balance sheet date. The fair value of held-to-maturity investments is determined for disclosure purposes only. If not quoted, and another reliable fair value estimation is not available, those investments are stated at (deemed) cost.
Trade and other receivablesThe fair value of trade and other receivables is estimated as the present value of future cash flows, discounted at the market rate of interest at the reporting date.
DerivativesThe fair value of forward exchange contracts is based on their listed market price, if available. If a listed market price is not available, then fair value is estimated by discounting the difference between the contractual forward price and the current forward price for the residual maturity of the contract using a risk-free interest rate (based on government bonds).
The fair value of interest rate swaps is based on broker quotes. Those quotes are tested for reasonableness by discounting estimated future cash flows based on the terms and maturity of each contract and using market interest rates for a similar instrument at the measurement date.
Non-derivative financial liabilitiesFair value, which is determined for disclosure purposes, is calculated based on the present value of future principal and interest cash flows, discounted at the market rate of interest at the reporting date. For finance leases the market rate of interest is determined by reference to similar lease agreements.
Share-based payment transactionsThe fair value of stock options and share rights granted is recognized as personnel expense over the vesting period of the stock options and share rights with a corresponding increase in equity for equity-settled plans respectively provisions for cash-settled plans. For equity-settled plans, the fair value of stock options and share rights is measured at grant date and spread over the period during which the employees become unconditionally entitled to the stock options and share rights. For cash-settled plans the fair value of share rights is remeasured at each balance sheet date. The fair value of the stock options and share rights granted is measured using a Monte Carlo simulation model, taking into account the terms and conditions upon which the instruments were granted.
8908_WessanenAR_UK_08_Notesconsolidatedfinstate1.indd 56 13/3/09 17:24:22

57 Financial Statements Royal Wessanen nv/Annual Report 2008
Notes to the consolidated financial statements
5. Segment informationThe Group’s continuing operations, operate in four separate business segments: North America Branded, North America Distribution, Europe Branded and Europe Distribution, which is the primary format for segment reporting. The most important financial data regarding these segments are given below.
Primary segments Discontinued Total Continuing operations operations Eliminations Group North North America America Europe Europe Non- Private Branded Distribution Branded Distribution allocated 1 Eliminations Total label 2007Income statement informationRevenue third parties 135.4 813.0 462.2 144.1 25.1 – 1,579.8 40.0 – 1,619.8Inter-segment revenue 9.9 – – – 1.3 (11.2) – 5.6 (5.6) –Total segment revenue 145.3 813.0 462.2 144.1 26.4 (11.2) 1,579.8 45.6 (5.6) 1,619.8Operating profit 13.8 5.6 42.1 10.2 (8.6) – 63.1 0.9 – 64.0Net financing costs (9.9) (0.6) – (10.5)Share in results of associates 0.1 – – 0.1Income tax expense (10.5) (1.0) – (11.5)Profit from divestment, net of income tax – 15.4 – 15.4Profit for the period 42.8 14.7 – 57.5Balance sheet informationOperating assets 101.0 304.1 314.1 45.0 148.6 – 912.8 – – 912.8Investments in associates – 0.5 – – – – 0.5 – – 0.5Operating liabilities 16.8 75.2 172.8 23.6 194.7 – 483.1 – – 483.1Other informationInvestments in PP&E and IA2 7.9 9.8 10.3 1.3 0.7 – 30.0 – – 30.0Depreciation, amortization and impairments 1.8 5.5 9.0 1.3 0.7 – 18.3 – – 18.3Total other non-cash items3 (5.3) 17.8 (0.2) (10.3) 1.9 – 3.9 – – 3.9Average number of employees 536 3,106 1,394 370 197 – 5,603 – – 5,603
2008Income statement informationRevenue third parties 142.6 802.0 486.7 143.9 27.6 – 1,602.8 – – 1,602.8Inter-segment revenue 11.9 – – – 0.7 (12.6) – – – –Total segment revenue 154.5 802.0 486.7 143.9 28.3 (12.6) 1,602.8 – – 1,602.8Operating profit 13.3 11.7 35.7 6.5 (7.6) (0.8) 58.8 – – 58.8Net financing costs (13.3) – – (13.3)Share in results of associates – – – –Income tax expense (11.0) – – (11.0)Profit for the period 34.5 – – 34.5Balance sheet informationOperating assets 125.0 281.6 294.5 36.4 174.8 (0.8) 911.5 – – 911.5Investments in associates – 0.6 – – – – 0.6 – – 0.6Operating liabilities 20.0 67.4 171.1 20.4 261.0 – 539.9 – – 539.9Other informationInvestments in PP&E and IA2 12.0 5.1 8.6 0.9 1.7 (0.8) 27.5 – – 27.5Depreciation, amortization and impairments 1.9 5.7 10.0 0.9 0.9 – 19.4 – – 19.4Total other non-cash items3 (2.1) 9.1 0.6 0.2 2.2 – 10.0 – – 10.0Average number of employees 602 3,197 1,435 368 194 – 5,796 – – 5,796
1 Non-allocated includes Karl Kemper Germany and corporate entities.2 Investments in property, plant and equipment (‘PP&E’), including financial leases and intangible assets (‘IA’).3 Total of provisions created, gain from disposals, and other non-cash and non-operating items as reflected in the consolidated statement of cash flows.
8908_WessanenAR_UK_08_Notesconsolidatedfinstate1.indd 57 13/3/09 17:24:22

58 Royal Wessanen nv/Annual Report 2008 Financial Statements
Notes to the consolidated financial statements
5. Segment information continuedIn December 2008, a label was sold by the North America Branded business to the North America Distribution business. The unrealized intercompany gain of EUR 0.8 has been eliminated.
Secondary segmentsThe Group’s continuing operations, operate in four main geographical regions, identified on the basis of the location of the customers, which is the secondary format for segment reporting. The geographic analyses of operating assets and investments in property, plant and equipment and intangible assets are based upon the location of the assets.
2008 2007Revenue third partiesThe Netherlands 169.2 146.3Other European countries 488.6 484.2US and Canada 944.6 948.6Other countries 0.4 0.7Total continuing operations 1,602.8 1,579.8Total discontinued operations – 40.0Total Group 1,602.8 1,619.8
December 31, December 31, 2008 2007Operating assetsThe Netherlands 182.0 204.6Other European countries 297.1 308.8US and Canada 432.4 399.4Total continuing operations 911.5 912.8Total discontinued operations – –Total Group 911.5 912.8
2008 2007Investments in property, plant and equipment and intangible assets1
The Netherlands 6.1 6.2Other European countries 5.1 6.1US and Canada 16.3 17.7Total continuing operations 27.5 30.0Total discontinued operations – –Total Group 27.5 30.0
1 Including financial leases.
8908_WessanenAR_UK_08_Notesconsolidatedfinstate1.indd 58 13/3/09 17:24:22

59 Financial Statements Royal Wessanen nv/Annual Report 2008
Notes to the consolidated financial statements
6. AcquisitionsIn 2008, Wessanen acquired the following businesses:
Date of Purchase Acquired Company Segment acquisition price Goodwill percentageMinority shareholding Distriborg Groupe Europe Branded September 2008 22.7 9.9 9.9%So Good business Europe Branded July 2008 6.3 1.6 n/aApple A Day business North America Distribution July 2008 0.9 0.2 n/aTotal 29.9 11.7
Minority shareholding Distriborg GroupeOn September 1, 2008, the Group acquired 9.92% of Distriborg Groupe’s (a Wessanen subsidiary) share capital from minority shareholders for EUR 22.7 in cash, including acquisitions costs, with the objective to delist Distriborg Groupe from Euronext Paris in order to increase flexibility in executing the growth strategy. Early January 2009, a buy out process was started in order to acquire the remaining 0.4% of Distriborg Groupe’s shares. As Distriborg Groupe is already fully consolidated, the increase in the shareholding did not have any effect on consolidated revenue and consolidated operating profit for the year.
So GoodOn July 1, 2008, the Group acquired the So Good brand and business in Europe for EUR 6.3 in cash, including acquisition costs. So Good is the second largest brand in the UK dairy-alternatives market, offering a range of ambient and chilled soy based beverages. In the six months to December 31, 2008, the So Good business contributed EUR 3.5 to the consolidated revenue and EUR 0.3 to the consolidated operating profit for the year.
Apple A DayMid July 2008, the Group acquired the Apple A Day business for EUR 0.9 in cash, including acquisition costs. Apple A Day is a distributor of niche alcoholic beverages throughout the state of Florida (US). In the period to December 31, 2008, the Apple A Day business contributed EUR 0.8 to the consolidated revenue and EUR – to the consolidated operating profit for the year.
If the acquisitions had occurred on January 1, 2008, the acquired businesses would have contributed EUR 8.7 to the consolidated revenue and EUR 0.7 to the consolidated profit for the year.
The acquisitions had the following total effect on the Group’s assets and liabilities:
Acquired Fair value Carrying values adjustments amountsIntangible assets – 5.8 5.8Inventories 0.3 – 0.3Trade and other receivables 1.3 – 1.3Minority interests 12.8 – 12.8Accounts payable, income tax payable and other liabilities (1.7) (0.3) (2.0)Net identifiable assets and liabilities 12.7 5.5 18.2Goodwill on acquisition 11.7Considerations paid 29.9Cash and cash equivalents acquired –Net cash outflow 29.9
The total considerations paid of EUR 29.9 (including acquisition costs of EUR 1.3 ) were almost fully satisfied in cash (EUR 29.4), and partly deferred (EUR 0.5 in total, payable in two biannual installments in 2009) in respect of the acquired Apple A Day business.
The goodwill recognized on the acquisition of the So Good and Apple A Day businesses is mainly attributable to the expected synergies to be achieved from integrating these businesses into the Group’s existing European Branded Business and North America Distribution Business respectively.
8908_WessanenAR_UK_08_Notesconsolidatedfinstate1.indd 59 13/3/09 17:24:22

60 Royal Wessanen nv/Annual Report 2008 Financial Statements
Notes to the consolidated financial statements
7. Other income
2008 2007Net gain on sale property, plant and equipment and intangible assets 4.7 6.1Gain on sale minority share – 6.4Negative goodwill – 5.3Other 1.0 –Other income 5.7 17.8
The net gain on sale of property, plant and equipment and intangible assets of EUR 4.7 in total mainly comprises the net gains on the sale of the premises in Elkton (US), following a sale and lease back transaction, and in Cleburne (US) and the net gain on the sale of a label by the North America Distribution business.
8. Personnel expenses and remuneration Executive and Supervisory BoardPersonnel expensesPersonnel expenses can be specified as follows:
2008 2007Salaries & wages 158.7 159.0Social security 39.7 39.9Pension expenses:– Defined contribution plans 6.3 6.2– Defined benefit plans 1.4 2.3Share-based compensation expenses 0.7 1.0Other personnel expenses 20.1 19.4Total personnel expenses 226.9 227.8
The average number of full-time employees in 2008 for continuing operations amounted to 5,796 (2007: 5,603). In the Netherlands, Wessanen employed on average 646 full-time employees, including Favory Convenience Food Group/Habek Snacks (excluding Favory Convenience Food Group/Habek Snacks 484) in 2008 (2007: 544).
8908_WessanenAR_UK_08_Notesconsolidatedfinstate1.indd 60 13/3/09 17:24:23

61 Financial Statements Royal Wessanen nv/Annual Report 2008
Notes to the consolidated financial statements
8. Personnel expenses and remuneration Executive and Supervisory Board continuedExecutive Board remuneration Post- Share- Short-term employment based In EUR thousands Salary bonuses benefits compensation 1 Other Total2007A.H.A. Veenhof 538 – 107 184 45 874K.R. Lane 374 227 – 405 29 1,035H. Wagter 2 358 – 150 121 45 674N.R. Onkenhout3 334 – 76 365 58 833Total 1,604 227 333 1,075 177 3,416
2008A.H.A. Veenhof 4 558 – 110 214 30 912F.E. Eelkman Rooda5 210 36 63 6 23 338K.R. Lane 361 149 – 80 28 618H. Wagter 2 244 – 146 – 21 411Total 1,373 185 319 300 102 2,279
1 The share-based compensation represents the share-based compensation expense calculated under IFRS 2 related to the Executive Board. The fair value of the share-based compensation grants is expensed on a straight-line basis over the vesting period of the grants.
2 H. Wagter was employed till August 31, 2008.3 N.R. Onkenhout was employed till November 30, 2007.4 Pension premium amount is paid directly together with the salary payment into the personal account as of July 2008.5 F.E. Eelkman Rooda is employed as of June 1, 2008, for a period of four years. It will be proposed to the Annual General Meeting of April 22, 2009, to appoint him as a member
of the Executive Board.
Changes Executive Board F.E. Eelkman Rooda started his employment as a CFO with the Company in June 2008 and it will be proposed to the Annual General Meeting of April 22, 2009 to appoint him as a member of the Executive Board.
H. Wagter resigned and stepped down as member of the Executive Board as at August 31, 2008.
8908_WessanenAR_UK_08_Notesconsolidatedfinstate1.indd 61 13/3/09 17:24:23

62 Royal Wessanen nv/Annual Report 2008 Financial Statements
Notes to the consolidated financial statements
8. Personnel expenses and remuneration Executive and Supervisory Board continuedRemuneration policyThe remuneration for the members of the Executive Board comprises of a base salary and related pension benefits and, subject to meeting performance criteria, short-term bonus and performance shares. The composition of the remuneration package is subject to annual review by the Selection, Appointment and Remuneration Committee (‘SARC’), which is a committee of the Supervisory Board, in close cooperation with the Chairman of the Executive Board and the Executive Vice President Human Resources. The full remuneration policy is available at www.wessanen.com.
The Dutch members of the Executive Board are eligible to participate in the Wessanen Pension Plan. As of January 2007, the Wessanen Pension Plan has been changed (for all participants born after January 1, 1950) from an end pay system in an average pay system with a maximum of EUR 80,000. Above the amount of EUR 80,000 an available premium system is applicable. The pension policy for members of the Executive Board is based on retirement at the age of 65.
Short-term bonuses to members of the Executive Board are granted according to performance criteria which were in 2008 based on earnings before interest and taxation (‘EBIT’), sales growth and cash flow. The financial targets 2008 set for A.H.A. Veenhof were not met. The financial targets 2008 for K.R. Lane were partially met (EBIT and sales growth). F.E. Eelkman Rooda obtained a fixed short-term bonus for 2008.
Share rights were granted in 2008 under vesting conditions based on a three-year service period and performance hurdles for the total test period of three years, as described in Note 9. Based on this plan, Wessanen granted 69,000 share rights to members of the Executive Board in 2008 of which 11,500 share rights were granted unconditionally with a vesting period of three years to A.H.A. Veenhof. In accordance with the Corporate Governance Code, the members of the Executive Board are not allowed to sell any delivered shares within five years after the date of grant.
Supervisory Board remuneration
Fixed Other TotalIn EUR thousands 2008 2007 2008 2007 2008 2007D.I. Jager 65 60 4 4 69 64J.G.A.J. Hautvast 50 40 3 3 53 43F.H.J. Koffrie 45 40 3 3 48 43L.M. de Kool 55 50 3 3 58 53M.C. Lombard 45 40 3 3 48 43Total 260 230 16 16 276 246
Members of the Supervisory Board receive annual remunerations amounting to, excluding expenses, EUR 45,000 each. The chairman of the Supervisory Board receives EUR 65,000, the chairman of the Audit Committee receives EUR 55,000 and the chairman of the SARC EUR 50,000. The proportionate amounts are included above, if applicable.
One member of the Supervisory Board owns 30,000 shares in the Company. No loans, advances or related guarantees were provided to the present or former members of the Executive Board or the Supervisory Board.
8908_WessanenAR_UK_08_Notesconsolidatedfinstate1.indd 62 13/3/09 17:24:23

63 Financial Statements Royal Wessanen nv/Annual Report 2008
Notes to the consolidated financial statements
9. Share-based paymentsStock option and share right plans are long-term incentives that aim to reward eligible employees for their contribution, loyalty and commitment to Wessanen. As of 2005, the Long Term Incentive Plan no longer comprises a stock option plan. All Wessanen stock options and share rights granted to the Executive Board are equity-settled share-based payments. As at December 31, 2008, the share rights granted to Other employees were changed retrospectively from equity-settled to cash-settled in respect of the share plans 2006, 2007 and 2008, as a result of which EUR 0.3 was transferred from retained earnings to provisions (see consolidated statement of changes in equity on page 46). The change in settlement type was approved by the SARC in October 2008. The structure and value of this element of pay for each individual did not change as a result of this change in settlement type.
The fair value of services received in return for stock options and share rights granted are measured by reference to the fair value of the rights. The 2008 estimate of the fair value of the services received is measured based on a Monte Carlo simulation model (2007: binomial lattice model). The model inputs for the valuation of the share rights granted to the members of the Executive Board and Other employees can be specified as follows:
Executive Board Other employees 2008 2007 2008 2007Share price at grant date 8.45 11.62 8.45 11.62Expected volatility 24.9% 25.6% 24.9% 25.6%Term (in years) 1 5 5 3 3Expected dividend 0.65 0.65 0.65 0.65Risk free interest rate 4.1% 4.6% 4.1% 4.6%Fair value at measurement date 2.94 3.81 3.54 4.26
1 In accordance with the Corporate Governance Code, the members of the Executive Board are not allowed to sell any delivered shares within five years after the date of the grant. The test period is three years similar to the shares granted to Other employees.
The expected volatility has been determined based on the historic volatility, adjusted for any expected changes to future volatility due to publicly available information. Share rights are granted under service conditions, market conditions and non-market conditions. Only market conditions are taken into account in the fair value measurement of the share rights at grant date of the services received.
Based on the Long Term Incentive Plan 2008, applicable as of June 2008, Wessanen granted share rights. Delivery of the performance shares depends on achievement of the performance hurdles. As the performance hurdles for the Long Term Incentive Plan 2006 were not met, the conditional share rights granted did not vest and accordingly forfeited.
If a participant ceases to be employed by the Group for any other reason than death, disability or retirement, during the test period, all granted stock options and share rights lapse automatically unless otherwise decided by the Supervisory Board respectively Executive Board.
All costs of the plans are borne by the Company; any and all taxes which arise are for the sole risk and account of the eligible employee.
The main conditions of the stock option and share right plans issued can be summarized as follows:
Number of Stock option plans instruments Vesting conditions Contractual life2002 623,755 Three years of service 8 years2003 970,039 Three years of service 8 years2004 595,530 Three years of service, profitability target 2004 greater than 0%, performance rating versus peer group at 2nd anniversary of grant 8 years
Number of Share right plans instruments Vesting conditions Contractual life2005 159,595 Three years of service, EBITAE in 2005 greater than EUR 50, relative TSR over 2005-2007 and development of share price over the total test period of three years has to be positive 3 years2006 223,725 Three years of service, relative TSR over three years and development of share price over total test period of three years has to be positive 3 years2007 215,305 Three years of service, relative TSR over three years and development of share price over total test period of three years has to be positive 3 years2008 185,870 Three years of service, relative TSR over three years and development of share price over total test period of three years has to be positive 3 years
8908_WessanenAR_UK_08_Notesconsolidatedfinstate1.indd 63 13/3/09 17:24:23

64 Royal Wessanen nv/Annual Report 2008 Financial Statements
Notes to the consolidated financial statements
9. Share-based payments continuedThe total shareholder return (‘TSR’) performance involves a comparison between the TSR of a peer group of leading multinational food companies over the same period. The peer group consists the following companies: CSM, Danone, Hain Celestial Group, Heinz, Kraft, Nestlé, SunOpta, Unilever and United Natural Foods.
In 2008, total expenses arising from transactions accounted for as equity-settled and cash-settled share-based compensation transactions amounted to EUR 0.7 (2007: EUR 1.0).
Stock optionsThe movement in the number of outstanding options is as follows:
Balance Granted Exercised Forfeited Balance Exercise To be end of and other end of price exercised 2007 changes 2008 (in EUR) 1 beforeMembers of the Executive BoardA.H.A. Veenhof2003 250,000 – – – 250,000 5.15 April 20112004 28,125 – – – 28,125 10.70 April 2012
Former members of the Executive Board2002 40,000 – – – 40,000 9.25 April 20102003 102,689 – – – 102,689 9.70 December 20112004 16,875 – – 16,875 – 10.70 May 2008Total (former) members of the Executive Board 437,689 – – 16,875 420,814
Other (former) employees2002 51,645 – – 2,250 49,395 9.25 April 20102003 134,075 – 6,125 – 127,950 7.68 December 20112004 164,425 – – 4,547 159,878 10.93 November 2012Total other (former) employees 350,145 – 6,125 6,797 337,223 Total 787,834 – 6,125 23,672 758,037
1 Weighted average exercise price.
8908_WessanenAR_UK_08_Notesconsolidatedfinstate1.indd 64 13/3/09 17:24:24

65
Financial Statements
Royal Wessanen nv/Annual Report 2008
Notes to the consolidated financial statements
9. Share-based payments continuedShare rightsThe movement in the number of outstanding share rights is as follows:
Balance Granted Delivered Forfeited Balance To be end of and other end of delivered in 1 2007 changes 2008Members of the Executive BoardA.H.A. Veenhof2005 14,007 – 14,007 – – 2006 2 10,000 – – – 10,000 May 20092006 20,000 – – 20,000 – 2007 2 11,500 – – – 11,500 June 20102007 23,500 – – – 23,500 June 20102008 – 25,000 – – 25,000 June 20112008 2 – 11,500 – – 11,500 June 2011
F.E. Eelkman Rooda2008 – 10,000 – – 10,000 June 2011
K.R. Lane 2006 2 15,000 – – – 15,000 May 20092007 19,000 – – – 19,000 June 20102008 – 22,500 – – 22,500 June 2011
Former members of the Executive Board H. Wagter 2006 2 12,500 – – 12,500 – 2006 11,500 – – 11,500 – 2007 16,000 – – 16,000 – Total (former) members of the Executive Board 153,007 69,000 14,007 60,000 148,000
Other (former) employees2005 45,284 860 44,303 1,841 – 2006 3 96,175 – – 73,175 23,000 May 20092007 4 124,185 – 15,000 9,590 99,595 June 20102008 – 116,870 – 8,225 108,645 June 2011Total other (former) employees 265,644 117,730 59,303 92,831 231,240 Total 418,651 186,730 73,310 152,831 379,240
1 In accordance with the Corporate Governance Code, the members of the Executive Board are not allowed to sell any delivered shares within five years after the date of the grant. The test period is three years similar to the shares granted to Other employees.
2 No performance hurdles.3 Including 23,000 (sign on) shares, without performance hurdles.4 Including 15,000 (sign on) shares, without performance hurdles, which have been delivered in 2008.
At the end of 2008, the members of the (former) Executive Board possessed 420,814 stock options (2007: 437,689) with a weighted average exercise price of EUR 7.02 (2007: EUR 7.16). The members of the Supervisory Board do not possess stock options or share rights, except for one member, which member owns 30,000 shares.
8908_WessanenAR_UK_08_Notesconsolidatedfinstate1.indd 65 13/3/09 17:24:24

66 Royal Wessanen nv/Annual Report 2008 Financial Statements
Notes to the consolidated financial statements
10. Net financing costs
2008 2007Interest income 0.1 0.5Net foreign exchange gain 1.1 –Reversal of impairment loss on debt securities 2.4 –Financial income 3.6 0.5Interest expense (10.6) (7.9)Interest expense on defined benefit obligations (0.6) (0.6)Unwind discount provisions (0.2) (0.4)Commitment fees (0.2) (0.2)Net foreign exchange loss – (1.3)Impairment loss on equity investments (1.9) –Other financial expense (3.4) –Financial expense (16.9) (10.4)Net financing costs (13.3) (9.9)
Interest income and expense mainly relate to expenses born by Wessanen’s net debt position. Other financial expense mainly consists of costs incurred related to the ineffective portion of a diesel fuel price swap entered into in 2008, including the change in fair value.
11. Income tax expenseThe income tax expense for the year 2008 amounted to EUR 11.0 (2007: EUR 10.5) and can be specified in current and deferred tax components as follows:
2008 2007Current income tax expenseCurrent income tax expense (14.9) (16.3)Adjustment for prior years – (3.4)Total current income tax expense (14.9) (19.7)
Deferred income tax expenseChange in income tax rate (1.6) –Deferred taxation relating to temporary differences 2.3 2.9Recognition of income tax loss 3.1 5.2Utilization of income tax loss (3.7) (4.0)Benefit from previously unrecognized income tax loss 1.3 0.8Reversal of write-down of deferred income tax asset 0.8 1.1Over-provided in prior years and other 1.7 3.2Total deferred income tax expense 3.9 9.2Total income tax expense (11.0) (10.5)
8908_WessanenAR_UK_08_Notesconsolidatedfinstate1.indd 66 13/3/09 17:24:24

67 Financial Statements Royal Wessanen nv/Annual Report 2008
Notes to the consolidated financial statements
11. Income tax expense continuedEffective income tax rateThe Group’s operating activities are subject to income taxes in various countries with statutory income tax rates between 25% and 41%.
The following table reconciles the domestic income tax rate as a percentage of profit before income tax with the effective income tax rate as shown in the consolidated income statement.
2008 2007Reconciliation of effective income tax rate EUR % EUR %Profit before income tax 45.5 53.3 Income tax using the domestic income tax rate (11.6) (26) (13.6) (26)Effect of income tax rates in foreign jurisdictions (3.3) (7) (3.9) (7)Change in income tax rate (1.6) (4) – –Non-deductible expenses and tax exempt income 1.9 4 3.2 6Recognition of unrecognized income tax loss 1.3 3 0.8 2Reversal of write-down of deferred income tax loss 0.8 2 1.8 3Unrecognized income tax loss for the year (0.2) – (0.1) –Income tax incentives – – 2.2 4Over-/(under) provided in prior years and other 1.7 4 (0.9) (2)Income tax expense in income statement (11.0) (24) (10.5) (20)
12. Discontinued operations and non-current assets held for sale In February 2006, Wessanen decided to divest its Private Label activities of Dailycer and Delicia in the UK, France and the Netherlands to focus on brands and distribution services. The transaction was closed on March 30, 2007 and finally settled in the third quarter of 2007, resulting in a gain of EUR 15,4 million. The result for the period 2007, net of income tax, amounted to EUR (0.7).
13. Earnings per shareBasic earnings per shareBasic earnings per share is calculated by dividing the profit attributable to shareholders by the weighted average number of outstanding shares, which can be specified as follows:
Profit attributable to equity holders of parent 2008 2007Profit after income tax from continuing operations 34.5 42.8Profit from discontinued operations, net of income tax – (0.7)Profit from divestment discontinued operations, net of income tax – 15.4Minority interests (0.1) –Profit for the period 34.4 57.5
Number of ordinary shares (in thousands) 2008 2007Issued ordinary shares 72,589 72,589Withdrawal of shares (4,230) –Own shares, held by the Company (758) (5,005)Number of ordinary shares at year end 67,601 67,584
Weighted average number of shares 67,585 69,698
Earnings per share from continuing operations 0.51 0.61Earnings per share from discontinued operations – 0.21Total earnings per share 0.51 0.82
8908_WessanenAR_UK_08_Notesconsolidatedfinstate1.indd 67 13/3/09 17:24:24

68 Royal Wessanen nv/Annual Report 2008 Financial Statements
Notes to the consolidated financial statements
13. Earnings per share continuedDiluted earnings per shareIn the calculation of diluted earnings per share, the applicable profit and the weighted average number of outstanding shares are adjusted for the effect of the potential exercise of employee stock options and share rights delivered.
Weighted average number of ordinary shares (diluted) (in thousands) 2008 2007Weighted average number of ordinary shares 67,585 69,698Effect of stock options 299 716Effect of share rights 326 430Weighted average number of ordinary shares (diluted) 68,210 70,844
Diluted earnings per share from continuing operations 0.50 0.60Diluted earnings per share from discontinued operations – 0.21Total diluted earnings per share 0.50 0.81
14. Property, plant and equipment
Machinery Under Land and and construction and buildings equipment Other prepayments Total2007Carrying value at beginning of year 55.4 53.4 10.3 5.6 124.7Effect of movements in foreign exchange rates (2.4) (3.4) (0.3) (0.9) (7.0)Capital expenditure 2.5 3.5 2.7 16.5 25.2Financial leases 1.1 – – – 1.1Acquisitions through business combinations 4.2 3.6 0.6 1.7 10.1Completed construction 1.6 9.4 0.1 (11.1) –Reclasses 2.1 (0.8) (3.3) 2.0 –Disposal (10.2) (1.0) – – (11.2)Depreciation (5.0) (8.2) (2.1) – (15.3)Impairment – (1.1) – – (1.1)Carrying value at year end 49.3 55.4 8.0 13.8 126.5Accumulated depreciation and impairment losses 58.1 95.2 17.1 – 170.4Cost at year end 107.4 150.6 25.1 13.8 296.9
2008Carrying value at beginning of year 49.3 55.4 8.0 13.8 126.5Effect of movements in foreign exchange rates (0.4) 1.5 (0.2) 0.3 1.2Capital expenditure 1.4 6.5 1.6 14.8 24.3Financial leases – 1.3 – – 1.3Acquisitions through business combinations – (0.7) – – (0.7)Completed construction 3.9 12.1 3.8 (19.8) –Reclasses 0.9 (1.3) (2.9) 0.4 (2.9)Disposal (6.5) (0.4) (0.1) (0.1) (7.1)Depreciation (4.2) (9.4) (2.1) – (15.7)Impairment – (0.6) – – (0.6)Carrying value at year end 44.4 64.4 8.1 9.4 126.3Accumulated depreciation and impairment losses 55.7 106.1 20.7 – 182.5Cost at year end 100.1 170.5 28.8 9.4 308.8
Finance leasesThe carrying value of land and buildings and machinery and equipment includes an amount of EUR 4.7 (2007: EUR 4.6) in respect of assets held under finance leases. Wessanen does not have legal title of these assets.
SecurityExcept for the leased assets, no other restrictions on title exist and no property, plant and equipment is pledged as security for liabilities.
8908_WessanenAR_UK_08_Notesconsolidatedfinstate1.indd 68 13/3/09 17:24:25

69 Financial Statements Royal Wessanen nv/Annual Report 2008
Notes to the consolidated financial statements
15. Intangible assets
Customer Business Development Goodwill Brands relationships acquisitions Software expenses Total2007Carrying value at beginning of year 129.2 21.0 – 0.8 1.1 0.6 152.7Effect of movements in foreign exchange rates (3.6) (1.2) (0.6) (0.2) (0.1) – (5.7)Capital expenditure – 0.1 – 1.0 0.4 2.2 3.7Acquisitions through business combinations 7.2 6.4 13.1 – – – 26.7Amortization – – (0.5) (0.6) (0.8) – (1.9)Carrying value at year end 132.8 26.3 12.0 1.0 0.6 2.8 175.5Accumulated amortization and impairment losses 26.3 – 0.5 17.6 7.7 – 52.1Cost at year end 159.1 26.3 12.5 18.6 8.3 2.8 227.6
2008Carrying value at beginning of year 132.8 26.3 12.0 1.0 0.6 2.8 175.5Effect of movements in foreign exchange rates (7.4) (1.8) 0.3 0.1 (0.1) 0.1 (8.8)Capital expenditure – – – 0.3 0.6 1.0 1.9Acquisitions through business combinations 13.5 5.2 0.6 – – – 19.3Reclasses – – – – 2.9 – 2.9Amortization – – (0.9) (0.5) (0.3) (0.7) (2.4)Impairment – – – – – (0.7) (0.7)Carrying value at year end 138.9 29.7 12.0 0.9 3.7 2.5 187.7Accumulated amortization and impairment losses 26.3 – 1.4 18.1 8.0 1.4 55.2Cost at year end 165.2 29.7 13.4 19.0 11.7 3.9 242.9
Acquisitions through business combinationsIntangible assets from acquisitions through business combinations of EUR 19.3 consists of intangible assets from current year’s acquisitions of EUR 17.5 (see Note 6) and additional goodwill from prior year’s acquisitions of EUR 1.8 caused by additional fair value adjustments made.
Impairment testing for cash-generating units containing goodwill and brandsGoodwill and brands with an indefinite life are tested for impairment annually, or more frequently if there are indications that a particular cash-generating unit might be impaired.
The following segments have significant carrying values of goodwill and brands:
December 31, 2008 December 31, 2007 Goodwill Brands Total Goodwill Brands TotalNorth America Branded – 4.7 4.7 – 4.5 4.5North America Distribution 7.2 2.3 9.5 6.7 2.2 8.9Europe Branded 104.6 22.7 127.3 97.1 19.6 116.7Europe Distribution 27.1 – 27.1 29.0 – 29.0Carrying value at year end 138.9 29.7 168.6 132.8 26.3 159.1
The recoverable amount for all cash-generating units (level below segment level) is based on value-in-use calculations. The calculations use cash flow projections based on forecasted cash flows. The key assumptions on which management have based its determination of the cash flows are the strategic plans as presented in 2008 and a stable growth rate of 2-3% per type of business after year five. A specific Weighted Average Cost of Capital (‘WACC’) has been used for our North American (10.9%), UK (10.9%) and other European businesses (10.4%), respectively, in discounting the projected cash flows. The pre-tax WACC reflects the current market assessments of the time value of money and the specific risks of the cash-generating unit.
The 2008 impairment test did not reveal any impairments. An increase of 100 basis points in the discount rate assumption would not change the conclusion on the impairment test. An assumption of 1% less growth after five years, also would not change the conclusion on the impairment test.
SecurityNo restrictions on title exist and no intangible assets are pledged as security for liabilities.
8908_WessanenAR_UK_08_Notesconsolidatedfinstate1.indd 69 13/3/09 17:24:25

70 Royal Wessanen nv/Annual Report 2008 Financial Statements
Notes to the consolidated financial statements
16. Investments in associatesThe breakdown of the investments in associates is as follows:
December 31, 2008 December 31, 2007 Ownership Amount Ownership AmountWorld Finer Foods 45.2% 0.3 45.2% 0.3Fifty-Fifty 22.6% 0.3 22.6% 0.2Carrying value at year end 0.6 0.5
Summary of most recent financial information (annual report 2007) of investments in associates:
Assets Liabilities Equity Revenue ProfitWorld Finer Foods 32.7 31.8 0.9 93.0 0.1Fifty-Fifty 0.9 0.2 0.7 2.2 0.2
17. Other investmentsOther investments relate to other equity investments of EUR – (2007: EUR 2.0) and debt securities of EUR 3.3 (2007: EUR 4.2).
The equity investment in Mautner Markhof was fully impaired in 2008 due to bankruptcy. The impairment loss of EUR 1.9 was more than offset by the reversal of an impairment loss on a debt security of EUR 2.4 (see Note 10).
The Group’s exposure to credit, currency and interest rate risks related to other investments is disclosed in Note 27.
18. Deferred tax assets and liabilitiesRecognized deferred tax assets and liabilitiesThe significant components of deferred tax assets and liabilities can be specified as follows:
December 31, December 31, Deferred tax assets 2008 2007Intangible assets 10.4 13.6Inventories 0.6 1.1Trade and other receivables 2.2 0.9Interest-bearing loans and borrowings 16.6 1.5Provisions 7.6 9.1Trade and other payables and accrued expenses 4.1 3.8Tax of loss carry-forward 72.3 70.2Total deferred tax assets 113.8 100.2
Deferred tax liabilitiesProperty, plant and equipment (9.3) (7.8)Other items (4.4) (5.5)Total deferred tax liabilities (13.7) (13.3)
Net deferred tax assets 100.1 86.9
Net deferred tax assets are presented as follows:Deferred tax assets presented under non-current assets 105.4 88.5Deferred tax liabilities presented under non-current liabilities (5.3) (1.6)Net deferred tax assets 100.1 86.9
8908_WessanenAR_UK_08_Notesconsolidatedfinstate1.indd 70 13/3/09 17:24:25

71 Financial Statements Royal Wessanen nv/Annual Report 2008
Notes to the consolidated financial statements
18. Deferred tax assets and liabilities continuedUnrecognized deferred tax assetsDeferred tax assets have not been recognized in respect of the following items: December 31, December 31, 2008 2007Tax value of loss carry-forward not recognized 7.1 7.7
The main portion of loss carry-forwards not recognized refer to state tax in the US. Deferred tax assets have not been recognized in respect of these items, because it is not probable that future taxable profit will be available against which Wessanen can utilize the benefits therefrom.
Movements in net deferred tax assets 2008 2007Balance at beginning of year 86.9 90.6Effects of movement in foreign exchange rates 2.2 (7.8)Acquisitions through business acquisitions 0.3 (4.6)Recognized in income 3.9 9.2Recognized in equity 6.7 –Other (including disposals and reclassifications) 0.1 (0.5)Balance at year end 100.1 86.9
Deferred tax assets in respect of US federal and state taxes, amounting to EUR 69.7 (2007: EUR 67.8), include EUR 47.0 (2007: EUR 48.7) tax loss carry-forward and EUR 9.0 (2007: EUR 14.8) tax deductible goodwill. The tax loss carry-forward mainly refers to federal taxes, which losses expire after a period of 20 years.
The deferred tax asset on loss carry-forward arose since 2004 due to the fact that cumulative tax losses in the US exceeded the amounts available for carry-back to prior years. Utilization of these deferred tax assets is dependent on future taxable profits in excess of the profits arising from the reversal of existing taxable temporary differences. Based on a projection of estimated US taxable income and available tax planning opportunities, management believes it is probable that sufficient future taxable profits will be available to allow full recovery of these deferred tax assets.
19. Inventories December 31, December 31, 2008 2007Finished products 198.8 194.1Semi-finished products 1.3 1.7Raw materials and supplies 15.3 14.3Prepayments on inventories 1.0 0.9Total inventories 216.4 211.0
20. Trade and other receivables and prepaymentsTrade receivables are shown net of impairment losses amounting to EUR 3.6 (2007: EUR 3.4) arising from identified doubtful receivables from customers.
Other receivables and prepayments include derivatives in the amount of EUR 7.2 (2007: EUR -). Furthermore, other receivables and prepayments include receivables from associates of EUR 0.4 (2007: EUR 0.5).
The Group’s exposure to credit and currency risks and impairments losses related to trade and other receivables and prepayments are disclosed in Note 27.
8908_WessanenAR_UK_08_Notesconsolidatedfinstate1.indd 71 13/3/09 17:24:26

72 Royal Wessanen nv/Annual Report 2008 Financial Statements
Notes to the consolidated financial statements
21. Cash and cash equivalents
December 31, December 31, 2008 2007Cash 0.1 0.2Bank balances 44.7 69.1Cash and cash equivalents 44.8 69.3Bank overdrafts (18.8) (19.2)Cash and cash equivalents in the statement of cash flows 26.0 50.1
Cash and cash equivalents are at Wessanen’s free disposal as at December 31, 2008. The Group’s exposure to interest rate risk and a sensitivity analysis for financial assets and liabilities are disclosed in Note 27.
22. Equity attributable to equity holders of Wessanen Issued and paid-up share capitalThe authorized share capital of the Company as at December 31, 2008, consists of 300 million ordinary shares (2007: 300 million) with a nominal value of EUR 1.00, of which 68.4 million shares were issued and paid-up (2007: 72.6 million shares). At the Annual General Meeting of Shareholders on April 16, 2008, the decision was taken to reduce the share capital by 4.2 million shares, following the share buyback program in 2007. The shares were cancelled on July 17, 2008.
The holders of ordinary shares are entitled to receive dividends as declared and are entitled to one vote per share at the shareholders’ meetings of Wessanen. The Company’s shares that are held by Wessanen are entitled to dividend.
Reserve for own sharesThe reserve for the Company’s own shares comprises the cost of the Company’s shares, held by Wessanen. As at December 31, 2008 Wessanen held 758,037 shares (2007: 5,005,341).
The movements in the reserve for own shares can be summarized as follows:
2008 2007 Number Number of shares Amount of shares AmountBalance at beginning of the year 5,005 (56.6) 966 (8.4)Repurchase of own shares 62 (0.6) 4,229 (50.0)Cancellation of own shares (4,230) 50.0 – –Share options exercised/shares delivered (79) 1.0 (190) 1.8Balance at year end 758 (6.2) 5,005 (56.6)
Translation reserveThe translation reserve comprises all foreign exchange differences arising from the translation of the financial statements of foreign operations as well as from the translation of intercompany loans with a permanent nature and liabilities that hedge Wessanen’s net investment in foreign subsidiaries.
Hedging reserveThe hedging reserve comprises the effective portion of the cumulative net change in the fair value of cash flow hedging instruments (interest rate swaps, foreign currency forward contracts and diesel fuel price swap) related to hedged transactions that have not yet occurred.
Other legal reservesIn accordance with the Netherlands Civil Code, a legal reserve is established in 2008 of EUR 2.5 as at December 31, 2008 (2007: EUR 2.8) related to the capitalization of development expenses.
DividendsThe proposed dividend per ordinary share amounts to EUR 0.20 over 2008 (2007: EUR 0.65).
2008 2007Dividends declared and paid in the year1 40,552 49,459
1 Excluding dividends own shares.
8908_WessanenAR_UK_08_Notesconsolidatedfinstate2.indd 72 16/3/09 12:00:21

73 Financial Statements Royal Wessanen nv/Annual Report 2008
Notes to the consolidated financial statements
23. Interest-bearing loans and borrowingsInterest-bearing loans and borrowings can be specified as follows:
December 31, 2008 December 31, 2007 Current Non-current Current Non-current portion portion Total portion portion TotalSyndicated loans – 224.3 224.3 – 177.2 177.2Finance leases 0.9 2.8 3.7 1.7 2.1 3.8Other long-term loans 12.6 – 12.6 2.7 9.4 12.1Total 13.5 227.1 240.6 4.4 188.7 193.1
The current portion of the interest-bearing loans and borrowings, due to be paid in 2009, is included in current liabilities.
Syndicated loansSyndicated loans consists of USD 136 and EUR 128 floating rate borrowings as at December 31, 2008 (2007: USD 136 and EUR 85 respectively) under a EUR 250, multi-currency credit facility. The Group has the ability to draw loans from the syndicated credit facility with short-term and long-term maturities. When a loan expires, this is ordinarily refinanced with a new loan drawn from the facility. The non-current portion of the syndicated loans reflects the maturity of the facility in February 2012. However, the Group has two options to extend the tenor of one year each and the option to increase the facility up to EUR 400, both subject to consent of the lenders. The credit facility is unsecured and has no restrictions for use.
The facility has various general and financial covenants in place which are customary for its type, amount and tenor. Under the financial covenants of the facility, at any financial quarter, the consolidated total net debt may not exceed 3.5 times consolidated EBITDAE (earnings before interest, taxation, depreciation, amortization and exceptional items) during a 12-month period ending on the last day of each quarter. In addition, consolidated EBITDAE is not allowed to be less than 4.0 times consolidated net interest payable. Consolidated net debt may exceed 3.0 times consolidated EBITDAE as long as (1) this ratio does not exceed 3.0 for more than two consecutive quarters, and (2) there have not been more than two periods of two consecutive quarters where total net debt exceeded 3.0 times consolidated EBITDAE. During 2008, the Group did not breach any of these covenants.
Interest is based on the relevant floating rate (EURIBOR or LIBOR) plus a margin. The margin will be increased for the period that consolidated total net borrowings exceed 3.0 times consolidated EBITDAE. The average interest rate for 2008 is 4.1% (2007: 5.3%).
Finance leasesNon-cancelable finance leases are payable as follows:
December 31, 2008 December 31, 2007 Total lease Carrying Total lease Carrying payments Interest value payments Interest valueLess than 1 year 1.1 0.2 0.9 1.8 0.1 1.7Between 1 and 5 years 3.2 0.6 2.6 2.4 0.4 2.0More than 5 years 0.2 – 0.2 0.2 0.1 0.1Total 4.5 0.8 3.7 4.4 0.6 3.8
Other long-term loansOther long-term loans as at December 31, 2008, mainly consists of EUR 8.9 floating rate borrowings (2007: EUR 7.7) under a EUR 9.5 credit facility (2007: EUR 10.5) and other floating rate bank loans of EUR 2.2 (2007: EUR 2.8), both to Favory Convenience Food Group. As Favory Convenience Food Group did not meet the redemption requirement under the EUR 9.5 credit facility, which required redemption of EUR 3.4 as at December 31, 2008, all financing drawn is classified as short-term debt. The terms of the credit facility are currently being renegotiated. The average interest rate for 2008 related to these borrowings is 6.9% and 5.6% respectively (2007: 4.9% and 5.4% respectively).
24. Employee benefitsDefined benefit plansRoyal Wessanen nv and its subsidiaries make contributions to defined benefit plans in the Netherlands, Germany, Italy and France, that provide pension benefits for employees upon retirement. These are final-pay and average-pay plans, based on the employees’ years of service and compensation near retirement.
The schemes are administered by industry pension funds and life insurance companies. During 2008, the defined benefit plan for corporate staff in the Netherlands as well as the accompanying net defined benefit obligation was transferred from the independent Company pension fund to an insurance company. The wind up of the company pension fund started as per December 31, 2008.
8908_WessanenAR_UK_08_Notesconsolidatedfinstate1.indd 73 13/3/09 17:24:26

74 Royal Wessanen nv/Annual Report 2008 Financial Statements
Notes to the consolidated financial statements
24. Employee benefits continuedThe net obligation for defined benefit plans is calculated separately for each plan by calculating the present value of future benefits that employees have earned in return for their service in the current and prior periods; that benefit is discounted to determine the present value while the fair value of any plan asset is deducted. The discount rate used is the yield on high-quality corporate bonds of a currency and maturity consistent with the currency and maturity of the post-employment defined benefit obligations. The calculations are performed by qualified actuaries using the projected unit credit method. Multi-employer plansThe Dutch companies are engaged in multi-employer plans with ‘Stichting bedrijfspensioenfonds voor de Groothandel in Levensmiddelen’ and ‘Stichting Bedrijfspensioenfonds voor de vlees-, vleeswaren- en de gemaksvoedingindustrie’. These multi-employer plans are defined benefit plans, though accounted for as if they were defined contribution plans because it is not possible to identify the companies’ shares of the underlying financial position and performance of the plan with sufficient reliability for accounting purposes. This is due to the fact that the plans expose the participating entities to actuarial risks associated with the current and former employees of other entities.
Surpluses or deficits for the mentioned plans are determined on the basis of ‘Actuariële principes pensioenfondsen’ and ‘Richtlijnen van De Nederlandsche Bank 30 september 2002’. The ‘Stichting Bedrijfspensioenfonds voor de Groothandel in Levensmiddelen’ and the ‘Stichting Bedrijfspensioenfonds voor de vlees-, vleeswaren- en de gemaksvoedingindustrie’ both show a deficit for which recovery plans are being made comprising of adjustments in contributions and restriction of indexations.
Defined contribution plansIn the North American companies the pension arrangements consist of defined contribution plans (401-K).
The components of the employee benefits for the years ending December 31, 2008 and 2007 respectively are shown in the following tables.
December 31, December 31, Defined Benefit plans 2008 2007Present value of unfunded obligations 3.1 3.0Present value of funded obligations 68.1 65.8Total present value of obligations 71.2 68.8Fair value of plan assets (58.5) (60.5)Deficit 12.7 8.3Unrecognized actuarial gains and losses 10.1 15.0Unrecognized past service costs (1.3) (1.3)Net liability for defined benefit obligations 21.5 22.0Other employee benefits 0.1 0.1Total liability employee benefits 21.6 22.1
Movement in liability for defined benefit obligations 2008 2007Liability for defined benefit obligations at beginning of year 68.8 124.6Effect of movements in foreign exchange rates – –Benefits paid (2.3) (2.4)Employee contributions 0.2 0.2Current service costs 1.2 2.3Interest costs 3.7 4.1Curtailments and settlements 1 – (40.6)Past service costs 0.6 –Actuarial gains (1.0) (19.4)Liability for defined benefit obligations at year end 71.2 68.8
Movement in fair value of plan assets 2008 2007Fair value of plan assets at beginning of year 60.5 94.5Effect of movements in foreign exchange rates – –Employer contributions 2.4 1.9Employee contributions 0.2 0.2Benefits paid (2.4) (2.4)Expected return on plan assets 3.1 3.5Actuarial losses (5.3) (5.9)Curtailments and settlements 1 – (31.3)Fair value of plan assets at year end 58.5 60.5
1 The curtailments in 2007 relate to the divestment of the Private Label activities.
8908_WessanenAR_UK_08_Notesconsolidatedfinstate1.indd 74 13/3/09 17:24:27

75 Financial Statements Royal Wessanen nv/Annual Report 2008
Notes to the consolidated financial statements
24. Employee benefits continuedPlan assetsThe pension plan asset allocation can differ per plan, and can be specified as follows (on a weighted average basis):
December 31, December 31, 2008 2007Equity securities 6.2% 18.8%Bonds 75.4% 47.2%Property – 2.8%Other 18.4% 31.2%Total 100.0% 100.0%
Expense recognized in the income statement 2008 2007Current service costs 1.2 2.3Past service costs 0.6 –Interest costs 3.7 4.1Expected return on plan assets (3.1) (3.5)Amortization unrecognized net (gain)/loss (0.5) –Amortization unrecognized past service costs 0.1 0.1Total expense 2.0 3.0
The expense is recognized in the following line items in the income statement:
2008 2007Personnel expenses 1.4 2.3Net financing costs 0.6 0.6Loss of discontinued operations – 0.1Total expense 2.0 3.0
Actual return on plan assets 2.2 2.4
The expected contributions for defined benefit plans in 2009 amount to EUR 1.8.
Actuarial assumptionsPrincipal actuarial assumptions at balance sheet date:
2008 2007 Euro-zone Euro-zoneDiscount rate at year end 5.5% 5.3-5.5%Expected return on plan assets at year end 4.3-5.6% 4.3-5.6%Future general salary increases 2.0-3.0% 2.0-3.0%Price inflation 2.0% 2.0%Future pension increases 2.0% 1.0-2.0%
Assumptions regarding future mortality are based on published statistics and mortality tables.
Present value of the defined benefit obligation, fair value of plan assets and deficit at balance sheet date
2008 2007 2006 2005 2004Defined benefit obligation 71.2 68.8 80.3 124.3 119.6Fair value of plan assets (58.5) (60.5) (63.8) (88.7) (79.5)Deficit in the plan 12.7 8.3 16.5 35.6 40.1
Experience adjustments arising on plan liabilities and plan assets at balance sheet date
2008 2007 2006 2005Plan liabilities 0.4 4.6 6.2 6.4Plan assets (5.3) (5.8) 1.0 4.7
Experience adjustments are defined as all gains/(losses) due to changes other than changes in the discount rate.
8908_WessanenAR_UK_08_Notesconsolidatedfinstate1.indd 75 13/3/09 17:24:27

76 Royal Wessanen nv/Annual Report 2008 Financial Statements
Notes to the consolidated financial statements
25. ProvisionsMovements in provisions in 2008 can be specified as follows:
Workers’ Other Restructuring compensation provisions TotalBalance at beginning of year 1.0 5.5 3.4 9.9Effects of movements in foreign exchange rates – 0.2 – 0.2Additions charged against results 0.2 11.7 1.4 13.3Used during the year (0.7) (11.9) (1.8) (14.4)Reclasses – – 0.3 0.3Released to result – – (0.7) (0.7)Unwind discount – 0.2 – 0.2Balance at year end 0.5 5.7 2.6 8.8
Non-current 0.2 2.9 0.6 3.7Current 0.3 2.8 2.0 5.1Balance at year end 0.5 5.7 2.6 8.8
RestructuringThe provision for restructuring relates to restructurings at various sites.
Workers’ compensation Wessanen is self-insured for potential losses related to workers’ compensation that may arise at its subsidiaries in the US.
Other provisionsOther provisions mainly relate to customer incentives and litigation.
Releases of prior year provisions are accounted for in operating result.
26. Trade and other payables and accrued expenses
December 31, December 31, 2008 2007Trade creditors – third party 136.7 142.0Trade creditors – associates 5.1 3.7Total trade creditors 141.8 145.7
Customer incentives 23.2 33.9Personnel expenses 18.1 18.0Pensions 0.2 0.4Social securities and other taxes 5.4 6.2Interest payables 3.7 1.9Derivatives 27.7 0.6Other liabilities 19.3 22.7Total other payables and accrued expenses 97.6 83.7
Total trade and other payables and accrued expenses 239.4 229.4
The Group’s exposure to currency and liquidity risk related to trade and other payables is disclosed in Note 27.
8908_WessanenAR_UK_08_Notesconsolidatedfinstate1.indd 76 13/3/09 17:24:27

77 Financial Statements Royal Wessanen nv/Annual Report 2008
Notes to the consolidated financial statements
27. Financial instruments and risk managementOverviewRoyal Wessanen nv has exposure to the following risks from its use of financial instruments:
• liquidityrisk• marketrisk• creditrisk
This note presents information about Wessanen’s exposure to each of the above risks, Wessanen’s objectives, policies and processes for measuring and managing risk, and Wessanen’s management of capital, as well as quantitative disclosures (before income tax) in addition to those included throughout these consolidated financial statements.
The Executive Board has overall responsibility for the establishment and oversight of Wessanen’s Risk Management and Internal Control system. The system is designed to enable the Executive Board to achieve its strategic objectives within a managed risk profile. The Executive Board is responsible for setting risk management policies and strategies. Senior management and operating companies conduct a risk assessment to create action plans and execute internal control procedures. As a Committee of the Supervisory Board, the Audit Committee monitors risk management and control activities and provides the Supervisory Board with a clear overview of the entire risk management and internal control process. Any significant changes and improvements to the Risk Management and Internal Control system are discussed with the Audit Committee and the Supervisory Board.
Liquidity riskLiquidity risk is the risk that Wessanen will not be able to meet its financial obligations as they fall due. A material and sustained shortfall in Wessanen’s cash flow could undermine overall investor confidence and could restrict the Group’s ability to raise funds. Operational cash flow provides the funds to service the financing of financial liabilities and enhance shareholder return. The Group’s approach to managing liquidity is to ensure, as far as possible, that it will always have sufficient liquidity to meet its liabilities when due, without incurring unacceptable losses or risking damage to the Group’s reputation. Wessanen manages its liquidity by monitoring and forecasting cash flows of its operating companies, debt servicing requirements, dividends to shareholders and other transactions.
Wessanen maintains ongoing access to the debt markets through its committed EUR 250 multi-currency credit facility which matures in February 2012. In addition, Wessanen has EUR 50 of uncommitted credit facilities with various banks throughout the Group. Favory Convenience Food Group has a EUR 9.5 credit facility, which terms are currently being renegotiated as Favory Convenience Food Group did not meet the redemption provision under the financing arrangement as disclosed in Note 23.
Market riskMarket risk is the risk that changes in market prices, such as foreign exchange rates, interest rates and commodity prices will affect the Group’s income or the value of (e.g. in foreign currency denominated) balance sheet items. The objective of market risk management is to manage and control market risk exposures within acceptable parameters, while optimizing return.
Currency riskWessanen conducts business in foreign currencies but publishes its financial statements, and measures its performance, in euros. These foreign currencies mainly include the US dollar, the Canadian dollar and the Pound sterling. Because of the Group’s international presence, it is subject to risks from changes in foreign currency values that could affect earnings and capital.
The Group has a foreign exchange policy that mitigates the impact of foreign currencies to functional currencies. Transactions arising from operational and financing activities, in currencies other than the functional currency, are hedged in order to mitigate income statement volatility. All operating companies conduct their hedging transactions internally through the centralized corporate treasury department. Wessanen provides operational funding to its operating companies in their functional currency. Wessanen aims to minimize its foreign exchange exposure by borrowing in the local currency. Further, hedging foreign exchange risk is achieved through the use of forward foreign exchange contracts and forward foreign exchange swaps. Hedge accounting is applied for transactions that exceed certain thresholds.
Translation results on capital invested in foreign subsidiaries are recorded as a movement in the translation reserve in equity. Capital invested in, and net income from foreign subsidiaries is not hedged to the euro. Accordingly, from time to time, currency revaluations on investments will trigger translation results in equity. In 2008, currency translation effects were EUR 21.1 (2007: EUR 16.1).
8908_WessanenAR_UK_08_Notesconsolidatedfinstate1.indd 77 13/3/09 17:24:28

78 Royal Wessanen nv/Annual Report 2008 Financial Statements
Notes to the consolidated financial statements
27. Financial instruments and risk management continuedThe Group’s exposure to foreign currency risk was as follows based on notional amounts:
December 31, 2008 December 31, 2007 EUR USD GBP Other 1 EUR USD GBP Other 1
Trade receivables – – 0.2 – – 0.4 – –Trade payables (4.1) 0.1 (0.6) (0.5) (2.7) – (0.2) (0.5)Interest-bearing loans and borrowings – (352.1) 25.4 0.6 – (317.6) 26.3 0.6Balance sheet exposure (4.1) (352.0) 25.0 0.1 (2.7) (317.2) 26.1 0.1
1 In EUR.
The USD exposure related to the financing of the North American businesses is partly hedged by a USD 136 loan drawn under the credit facility (see Note 23). In December 2008, the Group designated USD 200 of intercompany funding as part of its net investment in its US operations and discontinued hedging the related foreign exchange exposure. Accordingly, the foreign currency results on the USD 200 intercompany financing as from December 2008 of EUR 11.2 negative (net of income tax) are recorded in the translation reserve in equity.
A 10% strengthening of the euro against the following currencies at December 31 would have decreased equity and profit by the amounts shown below. This analysis assumes that all other variables, in particular interest rates, remain constant. The analysis is performed on the same basis for 2007.
USD GBP USD GBP 10% strengthening of the euro 2008 2008 2007 2007Equity (20.7) (5.8) (14.9) (9.8)Profit/(loss) (0.5) (0.5) (1.0) (2.5)
Interest rate riskThe Group has an interest rate risk policy in place that allows it to minimize income statement volatility and, at the same time, minimize its interest expense in order to manage its interest expense in relation to its operating earnings. This is primarily achieved through borrowing from its multi-currency syndicated credit facility and modifying the interest rate exposure of debt and cash positions through the use of interest rate swaps. To mitigate the US dollar related interest rate risk, the Group entered into a USD 100 ten-year Interest Rate Swap (IRS) agreement before income tax which fixed the rate of borrowing of USD 100 at a price of 4.5% for the period 2005–2015. The hedge is accounted for as a cash flow hedge. On December 31, 2008, we recorded a EUR 10.4 liability (2007: EUR 0.5) representing gross unrealized losses on this derivative, in hedging reserve within total equity.
A change of 100 basis points (bp) in interest rates at the reporting date would have increased (decreased) equity and profit by the amounts shown below. The analysis assumes that all other variables, in particular foreign currency rates, remain constant. The analysis is performed on the same basis for 2007.
Cash flow sensitivity analysis for variable rate instruments
Profit or loss Equity 100 bp 100 bp 100 bp 100 bp 2007 increase decrease increase decreaseVariable rate instruments (1.4) 1.4 (1.4) 1.4Interest rate swap 0.7 (0.7) 0.7 (0.7)Cash flow sensitivity (net) (0.7) 0.7 (0.7) 0.7
2008Variable rate instruments (2.1) 2.1 (2.1) 2.1Interest rate swap 0.6 (0.6) 0.6 (0.6)Cash flow sensitivity (net) (1.5) 1.5 (1.5) 1.5
8908_WessanenAR_UK_08_Notesconsolidatedfinstate1.indd 78 13/3/09 17:24:28

79 Financial Statements Royal Wessanen nv/Annual Report 2008
Notes to the consolidated financial statements
27. Financial instruments and risk management continuedIn respect of income-earning financial assets and interest-bearing liabilities, the following table indicates their effective interest rates as at the balance sheet date and the periods in which they reprice.
2007 Effective Carrying Contractual 6 months More than Floating interest bearing Note interest rate amount cash flows or less 6-12 months 1-2 years 2-5 years 5 yearsSyndicated loans 23 5.3% (177.2) (177.2) (177.2) – – – – Effect of Interest Rate Swap (0.8%) – – 68.0 – – – (68.0)Net amounts owed to credit institutions (177.2) (177.2) (109.2) – – – (68.0)Cash and cash equivalents 21 2.9% 69.3 69.3 69.3 – – – –Financial lease liabilities 23 4.0% (0.3) (0.3) (0.3) – – – –Other long-term loans 23 6.1% (12.1) (14.8) (2.9) (2.1) (1.0) (2.3) (6.5)Bank overdrafts 21 4.9% (19.2) (19.2) (19.2) – – – –Total (139.5) (142.2) (62.3) (2.1) (1.0) (2.3) (74.5)Fixed interest bearingAmounts owed to credit institutions 23 4.5% – – – – – (68.0) 68.0Finance leases liabilities 23 7.3% (3.5) (4.1) (0.7) (0.8) (0.8) (1.6) (0.2)Total (3.5) (4.1) (0.7) (0.8) (0.8) (69.6) 67.8Non-interest bearingOther investments 17 6.2 6.2 – – 2.0 2.2 2.0Trade and other receivables 20 234.0 234.0 234.0 – – – –Trade and other payables1 26 (230.9) (230.9) (230.9) – – – –Total 9.3 9.3 3.1 – 2.0 2.2 2.0
2008 Effective Carrying Contractual 6 months More than Floating interest bearing Note interest rate amount cash flows or less 6-12 months 1-2 years 2-5 years 5 yearsSyndicated loans 23 4.1% (224.3) (224.3) (224.3) – – – –Effect of Interest Rate Swap 0.4% – – 71.0 – – – (71.0)Net amounts owed to credit institutions (224.3) (224.3) (153.3) – – – (71.0)Cash and cash equivalents 21 1.4% 44.8 44.8 44.8 – – – –Other long-term loans 23 6.6% (12.6) (12.6) (11.9) (0.7) – – –Bank overdrafts 21 3.4% (18.8) (18.8) (18.8) – – – –Total (210.9) (210.9) (139.2) (0.7) – – (71.0)Fixed interest bearingAmounts owed to credit institutions 23 4.5% – – – – – (71.0) 71.0Finance leases liabilities 23 6.5% (3.7) (4.5) (0.6) (0.6) (1.0) (2.2) (0.1)Total (3.7) (4.5) (0.6) (0.6) (1.0) (73.2) 70.9Non-interest bearingOther investments 17 3.3 3.3 0.9 0.8 0.7 0.6 0.3Trade and other receivables 20 226.6 226.6 226.6 – – – –Trade and other payables 1 26 (212.0) (212.0) (212.0) – – – –Total 17.9 17.9 15.5 0.8 0.7 0.6 0.3
1 Excluding derivatives.
Commodity riskThe Group actively monitors commodity risk, and takes steps to reduce commodity risk particularly during periods when underlying commodity prices are volatile and may lead to undesired volatility in net income. During the third quarter of 2008, the Group entered into a swap agreement to hedge the estimated monthly diesel fuel cost for the period commencing October 1, 2008 to June 30, 2009. Under the swap agreement, the Group receives each month floating DOE Diesel prices and pays a fixed price per gallon. The DOE Diesel price is based on the arithmetic average of the Weekly Retail On-Highway US Diesel Price for the US. On December 31, 2008 the swap agreement was recorded as a EUR 4.1 liability. The Group applies hedge accounting for approximately 40% of the swap agreement. Accordingly, of the balance as at December 31, 2008, EUR 2.4 has been recognized in net financing costs, while EUR 1.7 has been deferred and recognized in retained earnings.
Credit riskCredit risk is the risk of financial loss to Wessanen if a customer or counterparty to a financial instrument fails to meet its contractual obligations, and arises principally from Wessanen’s receivables from customers, investment securities and foreign exchange derivatives.
8908_WessanenAR_UK_08_Notesconsolidatedfinstate1.indd 79 13/3/09 17:24:28

80 Royal Wessanen nv/Annual Report 2008 Financial Statements
Notes to the consolidated financial statements
27. Financial instruments and risk management continuedTrade and other receivablesThe Group’s activities involve the developing, sourcing, producing, marketing and distribution of food products primarily in partnership with retail customers. As a consequence, a concentration of credit risk exists from major parties in the supermarket channel. The exposure to credit risk is influenced mainly by the individual characteristics of each customer. The demographics of Wessanen’s customer base, including the default risk of the industries and countries in which customers operate, have less of an influence on credit risk.
The Group’s operating companies apply a credit policy under which each new customer is analyzed individually for creditworthiness before the operating company’s standard payment and delivery terms and conditions are offered. Customers that fail to meet the benchmark, may transact only on a prepayment basis. The credit position of each customer is frequently measured using internal benchmarks and external rating information.
Wessanen establishes an allowance for impairment that represents its estimate of incurred losses in respect of trade and other receivables. The main components of this allowance are a specific loss component that relates to individually significant exposures, and a collective loss component established for groups of similar assets in respect of losses that have been incurred but not yet identified. The collective loss allowance is determined based on historical data of payment statistics for similar financial assets.
The maximum exposure to credit risk for trade receivables by type of customer at balance sheet date can be specified as follows:
2008 2007Supermarkets 100.6 118.6Natural / Health food stores 55.2 48.1Other customers 21.6 24.8Total 177.4 191.5
The aging of trade receivables at balance sheet date can be specified as follows:
2008 2007 Gross Impairments Net Gross Impairments NetNot past due 145.2 – 145.2 156.4 – 156.4Past due 0-30 days 20.5 – 20.5 22.1 – 22.1Past due 31-180 days 12.1 (0.9) 11.2 12.1 (0.8) 11.3Past due 181-360 days 2.0 (1.5) 0.5 2.2 (0.5) 1.7More than 360 days 1.2 (1.2) – 2.1 (2.1) –Total 181.0 (3.6) 177.4 194.9 (3.4) 191.5
The movement in the allowance for impairments in respect of trade receivables during the year was as follows:
2008 2007Balance at beginning of year 3.4 5.9Effects of movements in foreign exchange – (0.3)Acquisitions through business combinations – 0.2Addition charged against result 0.7 0.3Write offs (0.5) (2.7)Balance at year end 3.6 3.4
Based on historic rates, the Group believes that no impairment allowance is necessary in respect of trade receivables not past due or past due by up to 30 days. The write offs in 2008 and 2007 mainly relates to customers of the North America Distribution activities.
The allowance amounts relating to trade receivables are used to record impairment losses until the Group is satisfied that no recovery of the amount owing is possible; at that point the amounts are considered irrecoverable and are written off against the financial asset directly.
The Group manages credit risk on financial institutions by imposing limits. The creditworthiness of a financial institution is assessed by their credit rating, which should be a minimum of A (Standard & Poor’s).
Investments A number of debt securities have been issued by group companies to customers. These debt securities are secured by the counterparty involved.
Capital managementWessanen’s financial strategy is aimed at securing long-term financing of the Group, on an investment grade basis, in order to achieve the strategic targets in respect of the acceleration of the growth and alignment of the international portfolio.
8908_WessanenAR_UK_08_Notesconsolidatedfinstate1.indd 80 13/3/09 17:24:29

81 Financial Statements Royal Wessanen nv/Annual Report 2008
Notes to the consolidated financial statements
27. Financial instruments and risk management continuedCarrying amounts, amounts recognized and fair values by categoryThe carrying amounts and amounts recognized of financial assets can be specified as follows:
Amounts recognized in balance sheet according to IAS 39 Amounts Carrying Fair value recognized in Category in amount Fair value recognized balance sheet accordance December 31, Amortized recognized in income according 2007 with IAS 39 2007 cost Cost in equity1 statement 1 to IAS 17AssetsOther investments Equity investments AFS 2.0 – 2.0 – – – Debt securities LaR/HtM 4.2 4.2 – – – –Trade receivables LaR 191.5 191.5 – – – –Other receivables and prepayments LaR 42.5 42.5 – – – –Cash and cash equivalents LaR 69.3 69.3 – – – – LiabilitiesBank overdrafts FLAC 19.2 19.2 – – – –Interest-bearing loans and borrowings Syndicated loans FLAC 177.2 177.2 – – – – Other long-term loans FLAC/HtM 12.1 12.1 – – – – Finance leases n/a 3.8 – – – – 3.8Trade payables FLAC 145.7 145.7 – – – –Non-trade payables and accrued expenses 2 FLAC 83.1 83.1 – – – –Derivative financial liabilities used for hedging FLFVPL 0.6 – – (0.5) (0.1) –
Amounts recognized in balance sheet according to IAS 39 Amounts Carrying Fair value recognized in Category in amount Fair value recognized balance sheet accordance December 31, Amortized recognized in income according 2008 with IAS 39 2008 cost Cost in equity 1 statement 1 to IAS 17AssetsOther investments Equity investments AFS – – – – – – Debt securities LaR/HtM 3.3 3.3 – – – –Trade receivables LaR 177.4 177.4 – – – –Other receivables and prepayments 2 LaR 42.0 42.0 – – – –Cash and cash equivalents LaR 44.8 44.8 – – – –Derivative financial assets used for hedging FAFVPL 7.2 7.2 – 1.5 5.7 –
LiabilitiesBank overdrafts FLAC 18.8 18.8 – – – –Interest-bearing loans and borrowings Syndicated loans FLAC 224.3 224.3 – – – – Other long-term loans FLAC/HtM 12.6 12.6 – – – – Finance leases n/a 3.7 – – – – 3.7Trade payables FLAC 141.8 141.8 – – – –Non-trade payables and accrued expenses 2 FLAC 69.9 69.9 – – – –Derivative financial liabilities used for hedging FLFVPL 27.7 – – (12.1) (15.6) –
1 Before income tax.2 Excluding derivatives.
AFS Available-for-sale FAFVPL Financial assets at fair value through profit and lossFLAC Financial liability at amortised cost FLFVPL Financial liabilities at fair value through profit and lossLaR Loans and receivables HtM Held-to-Maturity
8908_WessanenAR_UK_08_Notesconsolidatedfinstate1.indd 81 13/3/09 17:24:29

82 Royal Wessanen nv/Annual Report 2008 Financial Statements
Notes to the consolidated financial statements
27. Financial instruments and risk management continuedFair value of financial assets and liabilitiesThe carrying amounts of cash and cash equivalents, trade and other receivables, accounts payables and bank overdrafts approximate their fair values because of the short-term nature of these instruments. The fair value of lease liabilities is estimated as the present value of future cash flows, discounted at market interest rates for homogeneous lease agreements. The carrying amount of the amounts owed to credit institutions approximate their fair values, the amounts are floating interest bearing. The fair value of financial instruments, including Interest Rate Swaps, has been determined by Wessanen using available market information and appropriate valuation methods.
28. Commitments and contingenciesOperating lease commitmentsNon-cancelable operating leases are payable as follows:
December 31, December 31, 2008 2007Less than 1 year 21.0 12.4Between 1 and 5 years 50.5 25.8More than 5 years 8.8 1.5Total non-cancelable operating lease commitments 80.3 39.7
Wessanen leases a number of warehouse and factory facilities, cars and computer hardware under operating leases. The leases typically run between 3 and 15 years, with an option to renew after that date. Lease payments are increased annually to reflect market rentals. None of the leases include contingent rentals. Wessanen does, in principle, not act as a lessor.
During the year ended December 31, 2008, EUR 22.1 was recognized as an expense in the income statement in respect of operating leases (2007: EUR 19.0).
Capital commitmentsCommitments to purchase property, plant and equipment as at December 31, 2008, amounted to EUR 2.3 (2007: EUR 8.7). As at December 31, 2008 there are no commitments to acquire intangible assets (2007: EUR –).
Purchase commitmentsWessanen has purchase commitments with vendors in the ordinary course of business at market-related terms.
GuaranteesWessanen has outstanding letters of credit to third parties amounting to EUR 21.5 (2007: EUR 13.2). Bank guarantees have been issued for amaximum of EUR 0.4 (2007: EUR 0.5).
ContingenciesWessanen is subject to certain other loss contingencies arising from claims by various parties. While it is not feasible to predict the outcome of such claims and possible litigation, management believes that any reasonable possible loss related to such matters, in excess of the provisions made, would have no material adverse effect on the financial statements as at December 31, 2008.
29. Related partiesWessanen has a related party relationship with its subsidiaries and its associates (see Note 33) and key management. Furthermore, the Company pension fund (in liquidation) and other pension funds in the Netherlands are related parties. Transactions with key management are described in Notes 8 and 9.
During the year ended December 31, 2008, Wessanen purchased goods from associates for the amount of EUR 10.6 (2007: EUR 11.1) and had a payable balance to associates of EUR 5.1 as at December 31, 2008 (2007: EUR 0.5). Wessanen sold a label through its North America Distribution business to an associate resulting in a net gain of EUR 1.3 and had a receivable balance from associates of EUR 0.4 as at December 31, 2008 (2007: EUR 0.5). Wessanen received dividends from associates in the amount of EUR 11 thousand in 2008 (2007: EUR 21 thousand).
8908_WessanenAR_UK_08_Notesconsolidatedfinstate1.indd 82 13/3/09 17:24:29

83 Financial Statements Royal Wessanen nv/Annual Report 2008
Notes to the consolidated financial statements
30. Accounting estimates and judgementsThe preparation of Wessanen’s consolidated financial statements requires management to make a number of estimates and assumptions. These estimates and assumptions affect the reported amounts of assets and liabilities, and the disclosure of contingent assets and liabilities, at the date of the consolidated financial statements and the reported revenues and expenses during the period. Although these estimates and associated assumptions are based on management’s best knowledge of current events and actions, actual results may ultimately differ from these estimates and assumptions.
The estimates and assumptions that management considers most critical and that have a significant inherent risk of causing a material adjustment to the carrying amounts of assets and liabilities within the next financial year are disclosed hereinafter.
Impairment of non-current assetsDetermining whether non-current assets are impaired requires an estimation of the recoverable amount of the asset (or cash-generating unit), which is the greater of fair value less costs to sell and value in use. The value in use calculation requires management to estimate the future cash flows expected to arise from the asset (or cash-generating unit) and an appropriate discount rate, in order to calculate the present value of the expected future economic benefits of an asset (or cash-generating unit). See Note 15 for specific information on the carrying amounts of goodwill and brands, the cash-generating units affected and the estimates and assumptions applied.
PensionsThe calculation of the defined benefit obligations and, in relation to that, the net periodic benefit costs for the periods presented, requires management to estimate, amongst others, future benefit levels and appropriate discount rates. Due to the long-term nature of these plans such estimates are subject to considerable uncertainties and may require adjustments in future periods, impacting future liabilities and expenses. See Note 24 for specific information on the estimates and assumptions applied in respect of the calculation of the defined benefit obligations.
Income taxesWessanen is subject to income taxes in several jurisdictions. The Group has material tax loss carry-forward positions, mainly in the US and the Netherlands, whereby the realization of deferred tax assets will be largely dependent upon the availability of future taxable income, as estimated from time to time by management and the availability of tax strategies. Significant judgement is required in determining the consolidated provision for income taxes and the recoverable amounts of deferred tax assets related to tax loss carry forward positions.
ProvisionsWessanen recognized restructuring, workers’ compensation and other provisions in the financial statements, of which the amount of each is based on specific estimates and assumptions.
31. Principal auditor’s remunerationPrincipal auditor’s remuneration for audit and other services can be specified as follows:
2008 2007 KPMG Other KPMG KPMG Other KPMG Accountants N.V.1 Network Total Accountants N.V.1 Network TotalAudit services 0.5 1.0 1.5 0.5 1.0 1.5Audit-related services – 0.1 0.1 – 0.2 0.2Tax services – 0.1 0.1 – 0.1 0.1Total auditor’s remuneration 0.5 1.2 1.7 0.5 1.3 1.8
1 KPMG Accountants N.V., the Netherlands.
8908_WessanenAR_UK_08_Notesconsolidatedfinstate1.indd 83 13/3/09 17:24:30

84 Royal Wessanen nv/Annual Report 2008 Financial Statements
Notes to the consolidated financial statements
32. Cash flowThe following table presents a specification of changes in working capital:
2008 2007Inventories (4.3) (33.4)Trade receivables 13.2 (14.5)Trade payables (0.7) 12.9Changes in primary working capital 8.2 (35.0)Other receivables (15.8) (8.0)Non-trade payables and accrued expenses (4.3) 12.0Changes in secondary working capital (20.1) 4.0Total changes in working capital (11.9) (31.0)
The following table presents a reconciliation between the cash flow statements and the cash and cash equivalents balances presented in the balance sheets:
2008 2007Cash and cash equivalents of continuing operations at beginning of year 50.1 12.4Cash and cash equivalents related to discontinued operations at beginning of year – 1.0Cash and cash equivalents at beginning of year, including discontinued operations 50.1 13.4
Net cash from operating, investing and financing activities (24.6) 36.6Effect of exchange rate differences on cash and cash equivalents 0.5 0.1Cash and cash equivalents of continuing operations at year end 26.0 50.1
8908_WessanenAR_UK_08_Notesconsolidatedfinstate1.indd 84 13/3/09 17:24:30

85 Financial Statements Royal Wessanen nv/Annual Report 2008
Notes to the consolidated financial statements
33. List of subsidiaries and associatesThe following are Wessanen’s significant subsidiaries and associates as at December 31, 2008:
Country of Ownership Ownership incorporation interest (%) interest (%) 2008 2007SubsidiariesTree of Life Inc. US 100.0 100.0American Beverage Corporation US 100.0 100.0Liberty Richter LLC US 100.0 100.0PANOS Brands LLC US 100.0 100.0Boas BV the Netherlands 100.0 100.0Beckers BV the Netherlands 100.0 100.0Natudis BV the Netherlands 100.0 100.0Favory Convenience Food Group CV the Netherlands 60.6 60.6Allos Walter Lang GmbH Germany 100.0 100.0Tartex + Dr. Ritter GmbH Germany 100.0 100.0Karl Kemper GmbH Germany 100.0 100.0Distriborg Groupe SA France 99.6 89.0Kallo Foods Ltd. UK 100.0 100.0Tree of Life UK Ltd. UK 100.0 100.0Righi S.r.l. Italy 100.0 100.0Bio Slym S.r.l. Italy 100.0 100.0AssociatesWorld Finer Foods US 45.2 45.2Fifty-Fifty US 22.6 22.6
8908_WessanenAR_UK_08_Notesconsolidatedfinstate1.indd 85 13/3/09 17:24:30

86 Royal Wessanen nv/Annual Report 2008 Financial Statements
Income statement of the Company
In EUR millions 2008 2007Income from subsidiaries and associates, net of income tax 45.4 64.6Other income and expenses, net of income tax (11.0) (7.1)Profit for the period 34.4 57.5
Balance sheet of the Company(before appropriation of current year’s result)
Notes December 31, December 31, In EUR millions 2008 2007AssetsFinancial assets 2 633.9 628.0Current assets 3 3.6 2.6Total assets 637.5 630.6
Shareholders’ equityShare capital 68.4 72.6Share premium 93.9 99.7Reserves (61.9) (72.5)Retained earnings 229.0 252.4Profit for the period 34.4 57.5Total shareholders’ equity 4 363.8 409.7Current liabilities 5 273.7 220.9Total shareholders’ equity and liabilities 637.5 630.6
8908_WessanenAR_UK_08_Notesconsolidatedfinstate1.indd 86 13/3/09 17:24:30

87 Financial Statements Royal Wessanen nv/Annual Report 2008
Notes to the financial statements of the Company
1. Principles of valuation and income determination1.1 GeneralThe Company financial statements are part of the 2008 financial statements of Wessanen.
With reference to the Company income statement of Wessanen, use has been made of the exemption pursuant to section 402, Title 9, Book 2 of the Netherlands Civil Code.
In accordance with Section 379 and 414, Title 9, Book 2 of the Netherlands Civil Code, a list of consolidated group companies and non-consolidated associates will be deposited at the Trade Register of the Amsterdam Chamber of Commerce, together with the financial statements.
1.2 Principles for the measurement of assets and liabilities and the determination of the resultFor establishing the principles for the recognition and measurement of assets and liabilities and determination of the result for its Company financial statements, Wessanen makes use of the option provided in section 362, Title 9, Book 2 of the Netherlands Civil Code. This means that the principles for the recognition and measurement of assets and liabilities and determination of the result (hereinafter referred to as principles for recognition and measurement) of the Company financial statements of Wessanen are the same as those applied for the consolidated financial statements (see Note 3 of the consolidated financial statements). Participating interests (subsidiaries and associates), over which significant influence is exercised, are stated on the basis of the equity method. The share in the result of participating interests consists of the share of the Group in the result of these participating interests. The consolidated financial statements are prepared in accordance with International Financial Reporting Standards Board as adopted by the European Union.
Results on transactions, where the transfer of assets and liabilities between the Group and its participating interests and mutually between participating interests themselves, are not incorporated insofar as they can be deemed to be unrealized.
2. Financial assets
December 31, December 31, 2008 2007Balance at beginning of year 628.0 583.3Effect of movements in foreign exchange (32.3) (16.1)Cash flow hedges (7.2) (3.8)Income from subsidiaries and associates, net of income tax 45.4 64.6Balance at year end 633.9 628.0
Financial assets include investments in subsidiaries. The investments in subsidiaries are stated at net equity value, which is determined on the basis of the Company’s accounting principles as described in Note 3 of the consolidated financial statements.
3. Current assets
December 31, December 31, 2008 2007Income tax receivable 3.6 2.4Other receivables – 0.2Total current assets 3.6 2.6
4. Shareholders’ equityFor a specification of shareholders’ equity, see the consolidated statement of changes in equity (page 46) and Note 22 to the consolidated financial statements. Legal reserves (translation reserve, hedging reserve and other legal reserves) are not available for distribution to the Company’s equity holders. If the translation reserve or hedging reserve has a negative balance, distribution to the Company’s equity holders is restricted to the extent of the negative balance.
8908_WessanenAR_UK_08_Notesconsolidatedfinstate1.indd 87 13/3/09 17:24:31

88 Royal Wessanen nv/Annual Report 2008 Financial Statements
Notes to the financial statements of the Company
5. Current liabilities
December 31, December 31, 2008 2007Payables to subsidiaries 272.5 220.1Trade and other payables 1.2 0.8Total current liabilities 273.7 220.9
The current liabilities are liabilities that mature within one year.
6. Commitments and contingenciesThe Company has assumed liability for debts of participating interests, up to a total of EUR 259.5 (2007: EUR 212.3). The related guaranteed debts are included in the consolidated balance sheet for an amount of EUR 259.5 (2007: EUR 212.3).
The Company is part of the fiscal unity of Wessanen. Based on this, the Company is liable for the tax liability of the fiscal unity in the Netherlands as a whole.
The Company has also assumed liability for the Dutch Group companies of which the financial statements have been included in the consolidated financial statements, as provided for in Section 403, sub 1, Title 9, Book 2 of the Netherlands Civil Code, except for those companies that are part of the Favory Convenience Food Group. This implies that these Group companies are not required to prepare their financial statements in every respect in accordance with Title 9, Book 2 of the Netherlands Civil Code or to publish these.
7. EmployeesThe Company did not employ any person in 2008.
Utrecht, March 4, 2009
Supervisory Board Executive BoardD.I. Jager, Chairman F.H.J. Koffrie, interim CEO J.G.A.J. Hautvast F.E. Eelkman Rooda, CFOL.M. de Kool K.R. LaneM.C. Lombard
8908_WessanenAR_UK_08_Notesconsolidatedfinstate1.indd 88 13/3/09 17:24:31

89 Financial Statements Royal Wessanen nv/Annual Report 2008
Other information
Appropriation of dividend 2008The profit for the year 2008 attributable to the equity holders of Wessanen amounted to EUR 34.4 million against EUR 57.5 million in 2007.
The Articles of Association allow for the payment of a dividend charged to the distributable part of the shareholders’ equity. Article 31, Clause 3, reads as follows:
‘If a loss is sustained in any year, no dividend shall be distributed for that year. No dividend may be paid in subsequent years until the loss has been defrayed out of the profit. The general meeting may, however, resolve on a motion of the Executive Board which has received the approval of the Supervisory Board to defray any such loss out of the distributable part of the shareholders’ equity or also to distribute a dividend charged to the distributable part of the shareholders’ equity.’
On the basis of this article, it will be proposed to the General Meeting of Shareholders, to be held on April 22, 2009, to pay out an amount of EUR 0.20 per share (2007: EUR 0.65 per share) from the distributable parts of the shareholders’ equity to holders of shares. Taking into account the interim dividend of EUR 0.20 per share paid out on August 13, 2008, no additional dividend is to be paid out on May 6, 2009. Accordingly, the total 2008 dividend pay out amounts to EUR 13.5 million.
Subsequent eventsSubsequent to December 31, 2008, no material events occurred that require disclosure.
8908_WessanenAR_UK_08_Notesconsolidatedfinstate1.indd 89 13/3/09 17:24:31

90 Royal Wessanen nv/Annual Report 2008 Financial Statements
Auditor’s report
To: Annual General Meeting of Shareholders of Royal Wessanen nv
Report on the financial statementsWe have audited the accompanying financial statements for the year 2008 of Royal Wessanen nv (‘the Company’), Utrecht as set out on pages 43 to 88. The financial statements consist of the consolidated financial statements and the Company financial statements. The consolidated financial statements comprise the consolidated balance sheet as at December 31, 2008, the consolidated income statement, the consolidated statement of changes in equity and the consolidated cash flow statement for the year then ended, and a summary of significant accounting policies and other explanatory notes. The Company financial statements comprise the Company balance sheet as at December 31, 2008, the Company income statement for the year then ended and the notes.
Management’s responsibilityThe Executive Board is responsible for the preparation and fair presentation of the financial statements in accordance with International Financial Reporting Standards as adopted by the European Union and with Part 9 of Book 2 of the Netherlands Civil Code, and for the preparation of the report of the Executive Board in accordance with Part 9 of Book 2 of the Netherlands Civil Code. This responsibility includes: designing, implementing and maintaining internal control relevant to the preparation and fair presentation of the financial statements that are free from material misstatement, whether due to fraud or error; selecting and applying appropriate accounting policies; and making accounting estimates that are reasonable in the circumstances.
Auditor’s responsibilityOur responsibility is to express an opinion on the financial statements based on our audit. We conducted our audit in accordance with Dutch law. This law requires that we comply with ethical requirements and plan and perform the audit to obtain reasonable assurance whether the financial statements are free from material misstatement.
An audit involves performing procedures to obtain audit evidence about the amounts and disclosures in the financial statements. The procedures selected depend on the auditor’s judgment, including the assessment of the risks of material misstatement of the financial statements, whether due to fraud or error. In making those risk assessments, the auditor considers internal control relevant to the entity’s preparation and fair presentation of the financial statements in order to design audit procedures that are appropriate in the circumstances, but not for the purpose of expressing an opinion on the effectiveness of the entity’s internal control. An audit also includes evaluating the appropriateness of accounting policies used and the reasonableness of accounting estimates made by management, as well as evaluating the overall presentation of the financial statements.
We believe that the audit evidence we have obtained is sufficient and appropriate to provide a basis for our audit opinion.
Opinion with respect to the consolidated financial statementsIn our opinion, the consolidated financial statements give a true and fair view of the financial position of Royal Wessanen nv as at December 31, 2008, and of its result and its cash flows for the year then ended in accordance with International Financial Reporting Standards as adopted by the European Union and with Part 9 of Book 2 of the Netherlands Civil Code.
Opinion with respect to the Company financial statementsIn our opinion, the Company financial statements give a true and fair view of the financial position of Royal Wessanen nv as at December 31, 2008, and of its result for the year then ended in accordance with Part 9 of Book 2 of the Netherlands Civil Code.
Report on other legal and regulatory requirementsPursuant to the legal requirement under 2:393 sub 5 part f of the Netherlands Civil Code, we report, to the extent of our competence, that the report of the Executive board as set out on pages 14 to 36 is consistent with the financial statements as required by 2:391 sub 4 of the Netherlands Civil Code.
Utrecht, March 4, 2009
KPMG ACCOUNTANTS N.V.
J.C.M. van Rooijen RA
8908_WessanenAR_UK_08_Notesconsolidatedfinstate1.indd 90 13/3/09 17:24:31

Additional information Royal Wessanen nv/Annual Report 2008 91
Additional information
Financial summary 1999 – 2008 92Shareholders’ Information 94Glossary 96Addresses 97
8908_WessanenAR_UK_08_Notesconsolidatedfinstate1.indd 91 13/3/09 17:24:31

92 Royal Wessanen nv/Annual Report 2008 Financial summary 1999 – 2008
Financial summary 1999 – 2008Condensed consolidated income statementIn EUR millions, unless stated otherwise (adjusted for comparison purposes)
20081 2007 1 2006 1 2005 1 2004 1 2003 2002 2001 2000 1999Revenue 1,602.8 1,579.8 1,590.3 1,691.1 1,837.0 2,431.8 2,829.6 3,967.9 3,933.8 3,016.0Operating profit 58.8 63.1 42.2 24.9 1.6 (70.3) 125.0 311.9 153.8 120.5Net financing costs (13.3) (9.9) (10.9) (6.8) 0.4 (4.7) (16.0) (32.5) (38.5) (20.1)Share in results of associates – 0.1 – 1.4 2.5 1.2 1.5 12.9 24.4 20.5Profit before tax 45.5 53.3 31.3 19.5 4.5 (73.8) 110.5 292.3 139.7 120.9Income tax expense (11.0) (10.5) (3.1) (2.8) 4.9 41.8 (8.0) (52.5) (40.2) (39.0)Profit from discontinued operations, net of income tax – (0.7) 5.4 9.9 2.4 – – – – –Profit from divestment discontinued operations, net of income tax – 15.4 – – – – – – – –Minority interests (0.1) – 1.6 1.6 1.3 1.2 1.1 0.8 1.3 0.3Profit for the period – attributable to equity holders of Wessanen 34.4 57.5 32.0 25.0 10.5 (33.2) 101.4 239.0 98.2 81.6Profit for the period attributable to equity holders of Wessanen as a percentage of average equity attributable to equity holders of Wessanen 2 9.5% 14.0% 8.6% 8.6% 6.9% 1.7% 6.7% 11.2% 16.2% 11.9%
1 The figures of 2004, 2005, 2006, 2007 and 2008 are based on IFRS (adjusted for (dis)continued operations), the years before are based on Dutch GAAP. In the years before 2002 the change in accounting principles with respect to credit on sales is not included.
2 For 2007 and 2008 based on profit for the period; for 1999–2006 based on profit for the period before amortization of goodwill and before exceptional items.
8908_WessanenAR_UK_08_Notesconsolidatedfinstate1.indd 92 13/3/09 17:24:31

Financial summary 1999 – 2008 Royal Wessanen nv/Annual Report 2008
Financial summary 1999 – 2008Condensed consolidated balance sheetIn EUR millions, unless stated otherwise (adjusted for comparison purposes)
93
20081 2007 1 2006 1 2005 1 2004 1 2003 2002 2001 2000 1999Non-current assets 423.3 397.2 374.6 431.9 425.2 434.6 462.3 523.8 734.0 661.2Current assets 488.2 515.6 576.1 549.5 561.1 653.2 675.7 821.7 1,007.7 813.0Current liabilities2 (244.8) (237.2) (271.3) (282.6) (278.5) (303.5) (338.6) (417.9) (614.6) (396.9)Invested capital 666.7 675.6 679.4 698.8 707.8 784.3 799.4 927.6 1,127.1 1,077.3
Financed by:Total equity 371.6 429.7 480.0 492.8 487.9 502.3 634.4 620.6 514.2 600.1Provisions 8.8 9.9 13.0 17.8 34.9 67.5 61.0 55.2 37.8 39.3Employee benefits3 21.6 22.1 20.8 33.8 30.9 Deferred tax liabilities3 5.3 1.6 2.4 4.3 16.0 Non-current interest-bearing loans and borrowings 227.1 188.7 137.5 123.6 115.1 26.0 155.7 180.7 192.0 253.9Current interest-bearing loans and borrowings4 32.3 23.6 25.7 26.5 23.0 188.5 (51.7) 71.1 383.1 184.0Total 666.7 675.6 679.4 698.8 707.8 784.3 799.4 927.6 1,127.1 1,077.3Total equity attributable to equity holders of Wessanen as a percentage of total assets 39.9% 44.9% 49.4% 49.3% 48.6% 45.5% 52.8% 44.5% 29.2% 40.2%Profit for the period attributable to equity holders of Wessanen per share (in EUR) 5 0.51 0.82 0.57 0.59 0.48 0.14 0.51 0.94 1.16 0.95
1 The figures of 2004, 2005, 2006, 2007 and 2008 are based on IFRS (adjusted for (dis)continued operations), the years before are based on Dutch GAAP. In the years before 2002 the change in accounting principles with respect to credit on sales is not included.
2 Excluding short-term finance.3 Until 2003 included in provisions.4 2003 including private placement of EUR 108.1.5 For 2007 and 2008 based on profit for the period; for 1999–2006 based on profit for the period before amortization of goodwill and before exceptional items.
8908_WessanenAR_UK_08_Notesconsolidatedfinstate1.indd 93 13/3/09 17:24:32

Royal Wessanen nv/Annual Report 2008 Shareholders’ information94
Shareholders’ informationOur fair disclosure policy is designed to ensure the careful and simultaneous provision of information to all shareholders.
Listing informationThe capital structure of Royal Wessanen nv consists of only one class of stocks, i.e. voting shares with a nominal value of EUR 1.00 per share which are listed on the NYSE Euronext (Amsterdam) Stock Exchange and are included, amongst other indices, in the AMX and Next 150 indices.
All shares outstanding can be traded freely without any restriction. All shares have equal rights.
In addition to the NYSE Euronext listing, a sponsored, unlisted, American Depository Receipt (ADR) program is traded in the US. Furthermore, Wessanen share options are traded on the NYSE Euronext Amsterdam derivative exchange.
Key datesApril 22, 2009 Annual General Meeting of ShareholdersMay 13, 2009 Publication of the first quarter 2009 resultsJuly 29, 2009 Publication of the second quarter 2009 resultsOctober 28, 2009 Publication of the third quarter
2009 resultsFebruary 25, 2010 Publication of the fourth quarter
and annual 2009 resultsApril 14, 2010 Annual General Meeting of Shareholders
Investor relationsDuring 2008, members of the Executive Board of Wessanen attended several third party conferences and, following the announcement of our earnings, organized various individual or collective investor meetings in Utrecht, Amsterdam, Frankfurt, Brussels, London, New York, Boston and Paris. A substantial proportion of the shares are held by foreign investors, mainly in the UK and the US. In 2009, members of the Executive Board will, again, attend various investor conferences. For more information about our roadshow schedule or investor meetings, please contact our Investor Relations office or the Investor Center at www.wessanen.com.
DividendIn 2008, the 2007 final dividend of EUR 0.40 per share and the 2008 interim dividend of EUR 0.20 per share were paid out, resulting in a total dividend payment of EUR 40.6 million in 2008 (2007: EUR 49.5 million).
In order to create financial flexibility, Wessanen aims to strengthen its balance sheet. In this context, it has been decided to propose to shareholders on April 22, 2009, to declare a dividend of EUR 0.20 per share, equal to the interim dividend paid out in August 2008. This represents a pay-out of close to 40%. Going forward, Wessanen aims to pay out a dividend of between 35-45% of its net result, excluding major non-recurring effects. The Company will no longer pay interim dividends.
Profit per share and the development of the share priceProfit for the period attributable to equity holders of the parent company and the proposed dividend for the year developed as follows:
Net Year- Year profit 1 Dividend High 2 Low 2 end2008 0.51 0.20 10.97 4.30 4.6520073 0.61 0.65 12.68 9.97 10.882006 0.57 0.65 14.03 9.60 10.252005 0.59 0.65 14.38 9.59 12.812004 0.48 0.58 12.49 8.80 9.45
The average volume traded over all trading days in 2008 was 378,635 (2007: 395,478).
1 2004-2006: Net profit before amortization of goodwill and before exceptional items.2 High and low at close price.3 Net profit from continuing operations only.
8908_WessanenAR_UK_08_Notesconsolidatedfinstate1.indd 94 13/3/09 17:24:32

03.01.2008 02.06.2008 31.12.20080
300,000
600,000
900,000
1,200,000
1,500,000
01.01.07 01.07.07 01.01.08 01.07.08
AMX (01.01.07 = 100)WES (01.01.07 = 100)
31.12.080
20
40
60
80
100
120
140
Shareholders’ information Royal Wessanen nv/Annual Report 2008 95
Royal Wessanen vs AMX
Royal Wessanen trading volume 2008
Share ownership Royal Wessanen nv1
in %
Share ownership Royal Wessanen nv per country1
in %
Private investors the Netherlands 23.7%
Private investors outside of the Netherlands 1.4%
Institutional investors the Netherlands 20.0%
Institutional investors outside of the Netherlands 45.1%
Not identified 9.8%
1 source: depository banks, Royal Wessanen, August 2008.
Netherlands 43.7% Belgium 6.3% France 2.2% United States 3.3% Luxembourg 4.5% United Kingdom 14.1% Other 16.1% Not identified 9.8%
1 source: depository banks, Royal Wessanen, August 2008.
Distribution of sharesSince Wessanen’s ordinary shares are in bearer form, analyses of shareholdings are based on estimates from market sources. The table below illustrates the estimated distribution of ownership of Wessanen shares by type of investor and by country of origin as a percentage of total shares outstanding (excluding treasury shares) in 2008. This is based on data provided by depository banks as of August 15, 2008.
Act on the Disclosure of Influence over Listed CompaniesIn accordance with the Act on the Disclosure of Influence over Listed Companies (1991) the Company received the following notifications:
• OnMay23,2007,PrudentialPLCreportedacapitalinterestof5.1%.• OnJune6,2007,DeltaDeelnemingenFondsreportedacapital
interest of 5.1%.• OnJune19,2007,SparinvestHoldingreportedacapitalinterest
of 5.43%. • OnJuly18,2008,Avivaplcreportedacapitalinterestof5.3%.
Financial Service ActThe Company is not involved in agreements in the sense of the Financial Service Act. As reflected in the Remuneration Report, available at www. wessanen.com, a change in control clause is applicable to all members of the Executive Board.
Prevention of misuse of inside informationWessanen considers the prevention of misuse of insider information essential in the relationship to all stakeholders. The Company has had a ‘Code of conduct of securities transactions’ since 2002. The code is available at www.wessanen.com.
Investor Relations officeAdriaan Robertson, VP Investor RelationsPhone: +31 (0)30 298 88 03Fax: +31 (0)30 298 88 85E-mail: [email protected]
8908_WessanenAR_UK_08_Notesconsolidatedfinstate1.indd 95 13/3/09 17:24:34

Royal Wessanen nv/Annual Report 2008 Glossary96
Glossary
GeneralAudit Committee Committee of the Supervisory Board that assesses the financial reporting, the internal control system for financial risks, the auditing process and the corporate processes for monitoring adherence to the law and regulations.
Authenticity Product authenticity refers to the purity and genuineness of a product’s origins, its ingredients and the methods used in growing and manufacturing these ingredients.
Balanced Scorecard A method for corporate performance measurement. Key performance indicators (KPIs) are presented and split into four perspectives:• organization(developmentandvitalityoftheCompany);• internalprocesses(efficiencyandinnovation);• customers(progressanddevelopmentofsalesandcustomerrelations);• financial(theresultsoftheprocesses).
Corporate Governance The system by which business corporations are directed and controlled. This system is based on the principles and best practices that have been laid down in the Dutch Corporate Governance Code of the Tabaksblat Committee and the subsequent report of the Frijns Monitoring Committee.
Health food Umbrella term for authentic natural, organic or nutritionally enhanced food products.
Premium Taste food Umbrella term for superior quality, specialty, gourmet and ethnic food products.
SKU Stock-keeping unit; a number associated with a particular product, often represented by a barcode, used to track inventory.
Supernaturals National chains in the US consisting of large professional stores specializing in natural and organic food.
Supply chain The full cycle followed by a product from the base (raw material) to the consumer.
Synergies Partnerships between the various Wessanen companies that create added value for the organization.
Value Based Management A system which offers Wessanen’s management three strategic instruments so that it can respond swiftly to technological and social change, namely:• adetailedsystemforstrategicplanning,whichsupportstheformulation
of concrete action-driven plans;• aprogramthatguaranteesthatcapitalisallocatedtoprojectsthatdeliver
value to the equity holders; • theBalancedScorecard,whichmaintainstherightbalancebetween
short-term and long-term goals.
Financial (Average) capital employed The (annual average) sum of:• property,plantandequipment;• intangibleassets;• inventories;• tradepayables/receivables;• intercompanypayables/receivables;• otherpayables/receivables,excludingaccruedinterestandincometax.
Cash generating unitA cash generating unit is the smallest identifiable group of assets that generates cash inflows that are largely independent of the cash inflows from other assets or groups of assets.
Currency option A contract under which the buyer acquires the right to buy or sell the foreign currency at a fixed price before a specified date.
EBIT Operating result or earnings before interest and income tax.
EBIT marginEBIT divided by third party revenue.
EBITDA EBIT before depreciation and amortization.
EBITDAEEBITDA before exceptional items.
Exceptional items Items of income and expense within profit and loss from ordinary activities of such size, nature or incidence, that their disclosure is relevant to explain the performance of the Company for the period.
Forward currency contract Purchase or sale of foreign currency at an exchange rate established now but with payment and delivery (settlement) at a specified future date.
Goodwill Goodwill is the excess of the cost of the business combination over the acquirer’s interest in the net fair value of the identifiable assets, liabilities and contingent liabilities.
Hedging A strategy to offset financial risks to secure future financial risks.
Interest coverage ratioEBITDAE divided by net interest expense.
Invested capitalThe sum of non-current assets, current assets and current liabilities, excluding short-term finance.
Net debt The net balance of available cash, cash equivalents and all third party interest-bearing debt.
Non-allocated Includes the operations of Karl Kemper Germany and corporate entities.
RO(A)CEReturn on (average) capital employed (EBIT as a percentage of (average) capital employed).
Solvency ratio Equity attributable to equity holders of Wessanen divided by total assets.
Swap An exchange of one security for another to change the maturities of a bond portfolio. Interest rate swaps are used to reduce risk by synthetically matching the duration of assets and liabilities.
WACC Weighted Average Cost of Capital. The cost of debt and equity which indicates the minimum return that must be realized by all our operations.
8908_WessanenAR_UK_08_Notesconsolidatedfinstate1.indd 96 13/3/09 17:24:34

Key business highlights 2
Wessanen – all you need to know 4
Message from the CEO 6
Delivering authenticity 8
Report of the Executive Board 14North America Branded 18North America Distribution 20Europe Branded 22Europe Distribution 24Sustainability 26
Financing 30Risk Management and Internal Control 31Corporate Governance 35 Message from the Supervisory Board 37 Financial Statements 43
Additional information 91Financial summary 1999 – 2008 92Shareholders’ information 94Glossary 96Addresses 97
Contents
Key business highlights
• July – Wessanen acquires So Good European business, the second-largest brand in the UK dairy-alternatives market.
• July – Tree of Life North America acquires Apple A Day business, a small privately owned distributor of specialty organic wine and beer, located in Florida.
• September – Wessanen France reaches agreement with Laboratoires Lehning to acquire all of their shares in Distriborg Groupe.
• October – Shares of Distriborg Groupe are suspended from trading on Euronext Paris in anticipation of a public offer for the remaining 0.4% of Distriborg’s share capital.
Addresses Royal Wessanen nv/Annual Report 2008 97
Addresses
The NetherlandsCorporate head officeRoyal Wessanen nvBeneluxlaan 93527 HS UtrechtP.O. Box 26353500 GP UtrechtPhone: +31 (0)30 2988888Fax: +31 (0)30 2988816E-mail: [email protected]: www.wessanen.com
Wessanen Nederland bvBeneluxlaan 93527 HS UtrechtPhone: +31 (0)30 2988600Fax: +31 (0)30 2988703E-mail: [email protected]: www.wessanen.nl
Natudis BVDaltonstraat 383846 BX HarderwijkPhone: +31 (0)341 464211Fax: +31 (0)341 425704E-mail: [email protected]: www.natudis.nl
Favory Convenience Food GroupVoltstraat 25753 RL DeurneP.O. Box 605750 AB DeurnePhone: +31 (0)493 316901Fax: +31 (0)493 314839E-mail: [email protected]
BelgiumWessanen Belgium nvRemylaan 4c – 2nd floor3018 WijgmaalPhone: +32 (0)16 499500Fax: +32 (0)16 499501Internet: www.wessanen.be
FranceDistriborg Groupe SA217, Chemin du Grand Revoyet69561 Saint Genis Laval CedexPhone: +33 (0)4 72 67 10 20Fax: +33 (0)4 72 67 10 57E-mail: [email protected]: www.distriborg.com
GermanyAllos Walter Lang GmbHZum Streek 549457 MariendrebberPhone: +49 (0)5445 9899 0Fax: +49 (0)5445 9899 114Internet: www.allos.de
Beckers GmbHSiemensstrasse 11-1346325 BorkenPhone: +49 (0)2861 947 0Fax: +49 (0)2861 947 222E-mail: [email protected]: www.beckers-gmbh.de
Tartex + Dr. Ritter GmbHHans-Bunte-Strasse 8a79108 FreiburgPhone: +49 (0)761 5157 0Fax: +49 (0)761 5157 157E-mail: [email protected]: www.tartex.de
CoSa Naturprodukte GmbHZinkmattenstr.18b79108 Freiburg Phone: +49 (0)761 515875 10 Fax: +49 (0)761 515875 25 E-mail: [email protected]
Karl Kemper GmbHSiemensstrasse 1346325 BorkenPhone: +49 (0)286 1947 0Fax: +49 (0) 286 1947 224E-mail: [email protected]: www.karlkemper.de
ItalyRighi S.r.L.Via Monti Urali, 32Reggio EmiliaPhone: +39 (0)522 552616Fax: +39 (0)522 558707E-mail: [email protected]: www.righisrl.com
Bio Slym S.r.L.Via Dei Tigli, localita’ Fenilrosso46019 ViadanaPhone: +39 (0)375 782256Fax: +39 (0)375 821276E-mail: [email protected] : www.bioslym.com
United KingdomKallo Foods Ltd.Coopers PlaceCombe Lane, WormleyGodalming, Surrey GU8 5SZPhone: +44 (0)1428 685100Fax: +44 (0)1428 685800E-mail: [email protected]: www.kallofoods.com
Tree of Life UK Ltd.Coaldale RoadLymedale Business ParkNewcastle under LymeStaffordshire ST5 9QHPhone: +44 (0)1782 567100Fax: +44 (0)1782 567199E-mail: [email protected]: www.treeoflifeuk.com
United StatesTree of Life, Inc.405 Golfway West DriveSt. Augustine, FL 32095Phone: +1 904 940 2100Fax: +1 904 940 2553E-mail: [email protected]: www.treeoflife.com
American Beverage Corporation1 Daily WayVerona, PA 15147Phone: +1 412 828 9020Fax: +1 412 828 8876E-mail: [email protected]: www.ambev.com
PANOS Brands400 Lyster AvenueSaddle Brook, NJ 07663Phone: +1 201 843 8900Fax: +1 201 368 9150E-mail: [email protected]: www.panosbrands.com
Liberty Richter300 Broadacres DriveBloomfield, NJ 07003Phone: +1 973 338 0300Fax: +1 973 338 0382E-mail: [email protected]: www.libertyrichter.com
Cautionary statement regarding forward-looking statements This Annual Report may contain forward-looking statements. These are defined as statements not being historical facts. Forward-looking statements include (but are not limited to) statements expressing or implying Royal Wessanen nv’s beliefs, expectations, intentions, forecasts, estimates or predictions (and the underlying assumptions). Forward-looking statements necessarily involve uncertainties and risks. The actual results or situations may therefore differ materially from those expressed or implied in any forward-looking statements. Those differences may be caused by various factors, including but not limited to, market developments, currency developments and unexpected changes in the operational environment. Any forward-looking statements in this Annual Report are based on information available to the management on February 24, 2009. Royal Wessanen nv assumes no obligations to make public announcements in each case of change in that information or if there are otherwise changes or developments in respect of the forward-looking statements in this Annual Report.
8908_Wessanen_Eng_Coverv3.indd 2 17/3/09 15:43:42

Annual Report 2008
Delivering authenticity
Royal Wessanen nv
Beneluxlaan 9P. O. Box 26353500 GP Utrechtthe NetherlandsPhone: +31 (0)30 298 8888Fax: +31 (0)30 298 8816E-mail: [email protected]
www.wessanen.com
Royal Wessanen nv | Annual Report 2008
Please adjust spine and centre text to accommodate
Designed and produced by Addison, London (UK), www.addison.co.uk.
Printed by Thieme Amsterdam, the Netherlands. This Annual Report is printed on FSC-certified paper.
The Annual Report is available in English and Dutch at www.wessanen.com.
8908_Wessanen_Eng_Coverv3.indd 1 17/3/09 15:43:42